the Creative Commons Attribution 4.0 License.
the Creative Commons Attribution 4.0 License.
 | 30 Nov 2020
Sensitivity of aerosol optical properties to the aerosol size distribution over central Europe and the Mediterranean Basin using the WRF-Chem v.3.9.1.1 coupled model
Laura Palacios-Peña
Jerome D. Fast
Enrique Pravia-Sarabia
Pedro Jiménez-Guerrero
The size distribution of atmospheric aerosols plays a key role for understanding and quantifying the uncertainties related to aerosol–radiation and aerosol–cloud interactions. These interactions ultimately depend on the size distribution through optical properties (such as aerosol optical depth, AOD) or cloud microphysical properties. Hence, the main objective of this contribution is to disentangle the impact of the representation of aerosol size distribution on aerosol optical properties over central Europe, particularly over the Mediterranean Basin, during a summertime aerosol episode. To fulfill this objective, a sensitivity test has been conducted using the coupled chemistry–meteorology model WRF-Chem (Weather Research Forecast model coupled with Chemistry). The test modified the parameters defining a lognormal size distribution (geometric diameter and standard deviation) by 10 %, 20 %, and 50 %. Results reveal that the reduction in the standard deviation of the accumulation mode leads to the largest impacts on AOD due to a transfer of particles from the accumulation mode to the coarse mode. A reduction in the geometric diameter of the accumulation mode also has an influence on AOD representation since particles in this mode are assumed to be smaller. In addition, an increase in the geometric diameter of the coarse mode produces a redistribution through the total size distribution by relocating particles from the finer modes to the coarse.
- Article
(10525 KB) - Full-text XML
-
Supplement
(46237 KB) - BibTeX
- EndNote


Aerosol size distribution is, among others, a key property of atmospheric aerosols that largely determines how they interact with radiation and clouds. Aerosol optical properties, such as the scattering phase function, single-scattering albedo, and aerosol optical depth (AOD), strongly depend on the aerosol size distribution (Eck et al., 1999; Haywood and Boucher, 2000; Romakkaniemi et al., 2012; Obiso et al., 2017; Obiso and Jorba, 2018). In this sense, AOD importantly influences aerosol–radiation interactions (ARIs) and their associated radiative forcing (Boucher and Anderson, 1995; Boucher et al., 1998; Myhre and Stordal, 2001).
On the other hand, atmospheric aerosols influence climate forcing through aerosol–cloud interactions (ACIs). These interactions produce an impact on clouds and precipitation that is connected to the number concentration of particles, which can act as cloud condensation nuclei (CCN) and ice nuclei (IN). Ultimately, these condensation nuclei depend on the aerosol size distribution and composition (Andreae and Rosenfeld, 2008; Romakkaniemi et al., 2012).
In this sense, the representation of aerosol processes in meteorological or climate models presents a high uncertainty (Boucher et al., 2013). Modeling aerosol size distribution introduces a particularly noticeable uncertainty in chemistry transport models (Tegen and Lacis, 1996; Claquin et al., 1998). Three different approaches, thoroughly described in the Methodology section, are usually employed for aerosol models: (1) the bulk approach (only the aerosol mass concentration is computed), (2) the modal approach (multiple superposed modes), and (3) the sectional representation (aerosol size distribution discretized into classes or bins).
These three approaches for representing aerosols are included in the WRF-Chem (Weather Research Forecast model coupled with Chemistry) model, which is the coupled chemistry–meteorology model used in this work. The sectional approach is used by the Model for Simulating Aerosol Interactions and Chemistry (MOSAIC; Zaveri and Peters, 1999) and a simple scheme for volcanic ash (Stuefer et al., 2013). With respect to the modal approach, the schemes available within WRF-Chem are the Modal Aerosol Dynamics Model for Europe (MADE; Ackermann et al., 1998) and the Modal Aerosol Model from CAM5 (MAM; Liu et al., 2012). Finally, the Goddard Global Ozone Chemistry Aerosol Radiation and Transport model (GOCART; Ginoux et al., 2001; Chin et al., 2002) uses the bulk approach.
Some of these schemes have been widely applied for the study of aerosol optical properties and their uncertainty. In this sense, the evaluation of aerosol optical properties as represented by the MOSAIC approach has been conducted by Barnard et al. (2010) and Lennartson et al. (2018) to analyze the diurnal variation of AOD. Ghan et al. (2001) went a step beyond and evaluated the radiative impact of including coupled aerosol–cloud–radiation processes. In addition, some contributions had the objective of assessing the representation of aerosol optical properties and their uncertainties using MOSAIC together with other schemes, mainly MADE (Zhao et al., 2010, 2011, 2013; Balzarini et al., 2015; Yang et al., 2018; Saide et al., 2020). The GOCART scheme has also been used for this aim. For example, LeGrand et al. (2019) compared the Air Force Weather Agency (AFWA) dust emission scheme within GOCART to other dust emission schemes available in WRF-Chem and their skills for representing AOD. In this contribution, the need for tuning the model in order to get a reasonable simulation of AOD for each location and/or event was pointed out based on the results of Bian et al. (2011), Dipu et al. (2013), Kumar et al. (2014), Jish Prakash et al. (2015), Zhang et al. (2015), Kalenderski and Stenchikov (2016), and Hu et al. (2020), among others. All those works evaluated the representation of AOD depending on the approach followed by the aerosol scheme. However, this contribution evaluates the uncertainty associated with the representation of the aerosol size distribution when estimating aerosol optical properties.
In addition to the complexity of adequately characterizing the representation of aerosols, the complexity of the target area where the model is applied (e.g., orography, emissions, or chemical transport) hampers the correct representation of atmospheric aerosols. Europe (specifically the Mediterranean Basin) is particularly one of the most sensitive regions to aerosol forcing (Giorgi, 2006). Not only anthropogenic aerosols are present over the Mediterranean Basin, but also sea salt, desert dust, and biomass burning (mainly from summer wildfires). Particularly in summer, when the aerosol forcing is larger (e.g., Charlson et al., 1992), the role of ARIs and ACIs over this area is crucial (Papadimas et al., 2012) and much more important than over central Europe (Andreae et al., 2002). This is because of the complex terrain and the geographical location of the Mediterranean area, in addition to the processes undergone by aerosol particles (e.g., intense formation, accumulation, and recirculation; Millán et al., 1997; Pérez et al., 2004; Querol et al., 2009).
Due to the important effects of aerosol size distribution and because previous works have highlighted the misrepresentation of size distribution by models (e.g., Palacios-Peña et al., 2017, 2018 or Palacios-Peña et al., 2019a), this contribution analyzes the sensitivity of aerosol optical properties to the representation of aerosol size distribution over central Europe, particularly over the Mediterranean Basin. For that purpose, a modeling approach has been used for a typical case study during summertime in order to estimate the sensitivity of AOD to the lognormal distribution parameters (geometric diameter and standard deviation) that characterize the aerosol size distribution in the simulations conducted. These parameters will finally influence the representation of ARIs and ACIs in coupled chemistry–meteorology models. Section 2 describes the methodological aspects of this contribution and the model setup. Section 3 depicts the results found, and Sect. 4 discusses and summarizes the results.
The methodology relies on a sensitivity test carried out using the online WRF-Chem model, whose objective is the analysis of the response of AOD to modifications in the aerosol size distribution. The test modified the geometric diameter (DG) and the standard deviation (SG) of the lognormal function representing the aerosol size distribution. Each parameter has been modified by ±10 %, 20 %, and 50 % with respect to its initial value in each of the three modes represented (Aitken, accumulation, and coarse).
In order to elucidate how important the changes in AOD are in each experiment and to avoid the analysis of random changes, a Kolmogorov–Smirnov test (Stephens, 1974) has been applied. This is a nonparametric test that can be used to compare two samples by their probability distribution (Stephens, 1974). In this case, all the experiments are compared with the base case to rank the importance of the changes produced. The most important cases will be selected as reference cases for a further discussion leading to the disentanglement of the causes of the changes in AOD provoked by the modifications made to the size distribution parameters.
2.1 Case study: 4–9 July 2015
The case study selected here covers an extended episode between 4 and 9 July 2015. The synoptic overview of the meteorological conditions has been widely presented in Palacios-Peña et al. (2019b). Nonetheless, a brief summary of the meteorological episode selected is presented here.
During this episode, the development of an omega-blocking situation takes place, with low pressures located over western England. The episode presents a high stability over the Mediterranean Basin with a high aerosol load, fire emissions in the target area, and a strong dust outbreak induced by the penetration of warm air and dust from northwestern Africa towards the western Mediterranean Basin and northern Europe (Nabat et al., 2015). The weakening of this synoptic situation results in a cyclonic circulation of the air over the western Mediterranean (see Fig. S1 in the Supplement; Palacios-Peña et al., 2019b). The choice of this episode reveals the crucial role of aerosols from different sources over the Mediterranean Basin, whose forcing is even stronger during summertime.
2.2 Model setup
The Weather Research Forecast model coupled with Chemistry (WRF-Chem; Grell et al., 2005) version 3.9.1.1 was used in this work. This fully coupled online model represents ARIs and ACIs by allowing the simultaneous treatment of meteorology, gas and aerosol emissions, transport, mixing, and chemical transformation.
As previously mentioned, the case study selected here relies on an extended episode evaluated in Palacios-Peña et al. (2019b). The model setup for all the experiments is the same as for that contribution. However, a brief summary of the configuration and parameterizations is included in Table 1.
Morrison et al. (2009)Iacono et al. (2008)Hong et al. (2006)Grell and Freitas (2014)Tewari et al. (2004)Stockwell et al. (1997)Geiger et al. (2003)Ginoux et al. (2001)Chin et al. (2002)Ginoux et al. (2001)Chin et al. (2002)Wild et al. (2000)Wesely (1989)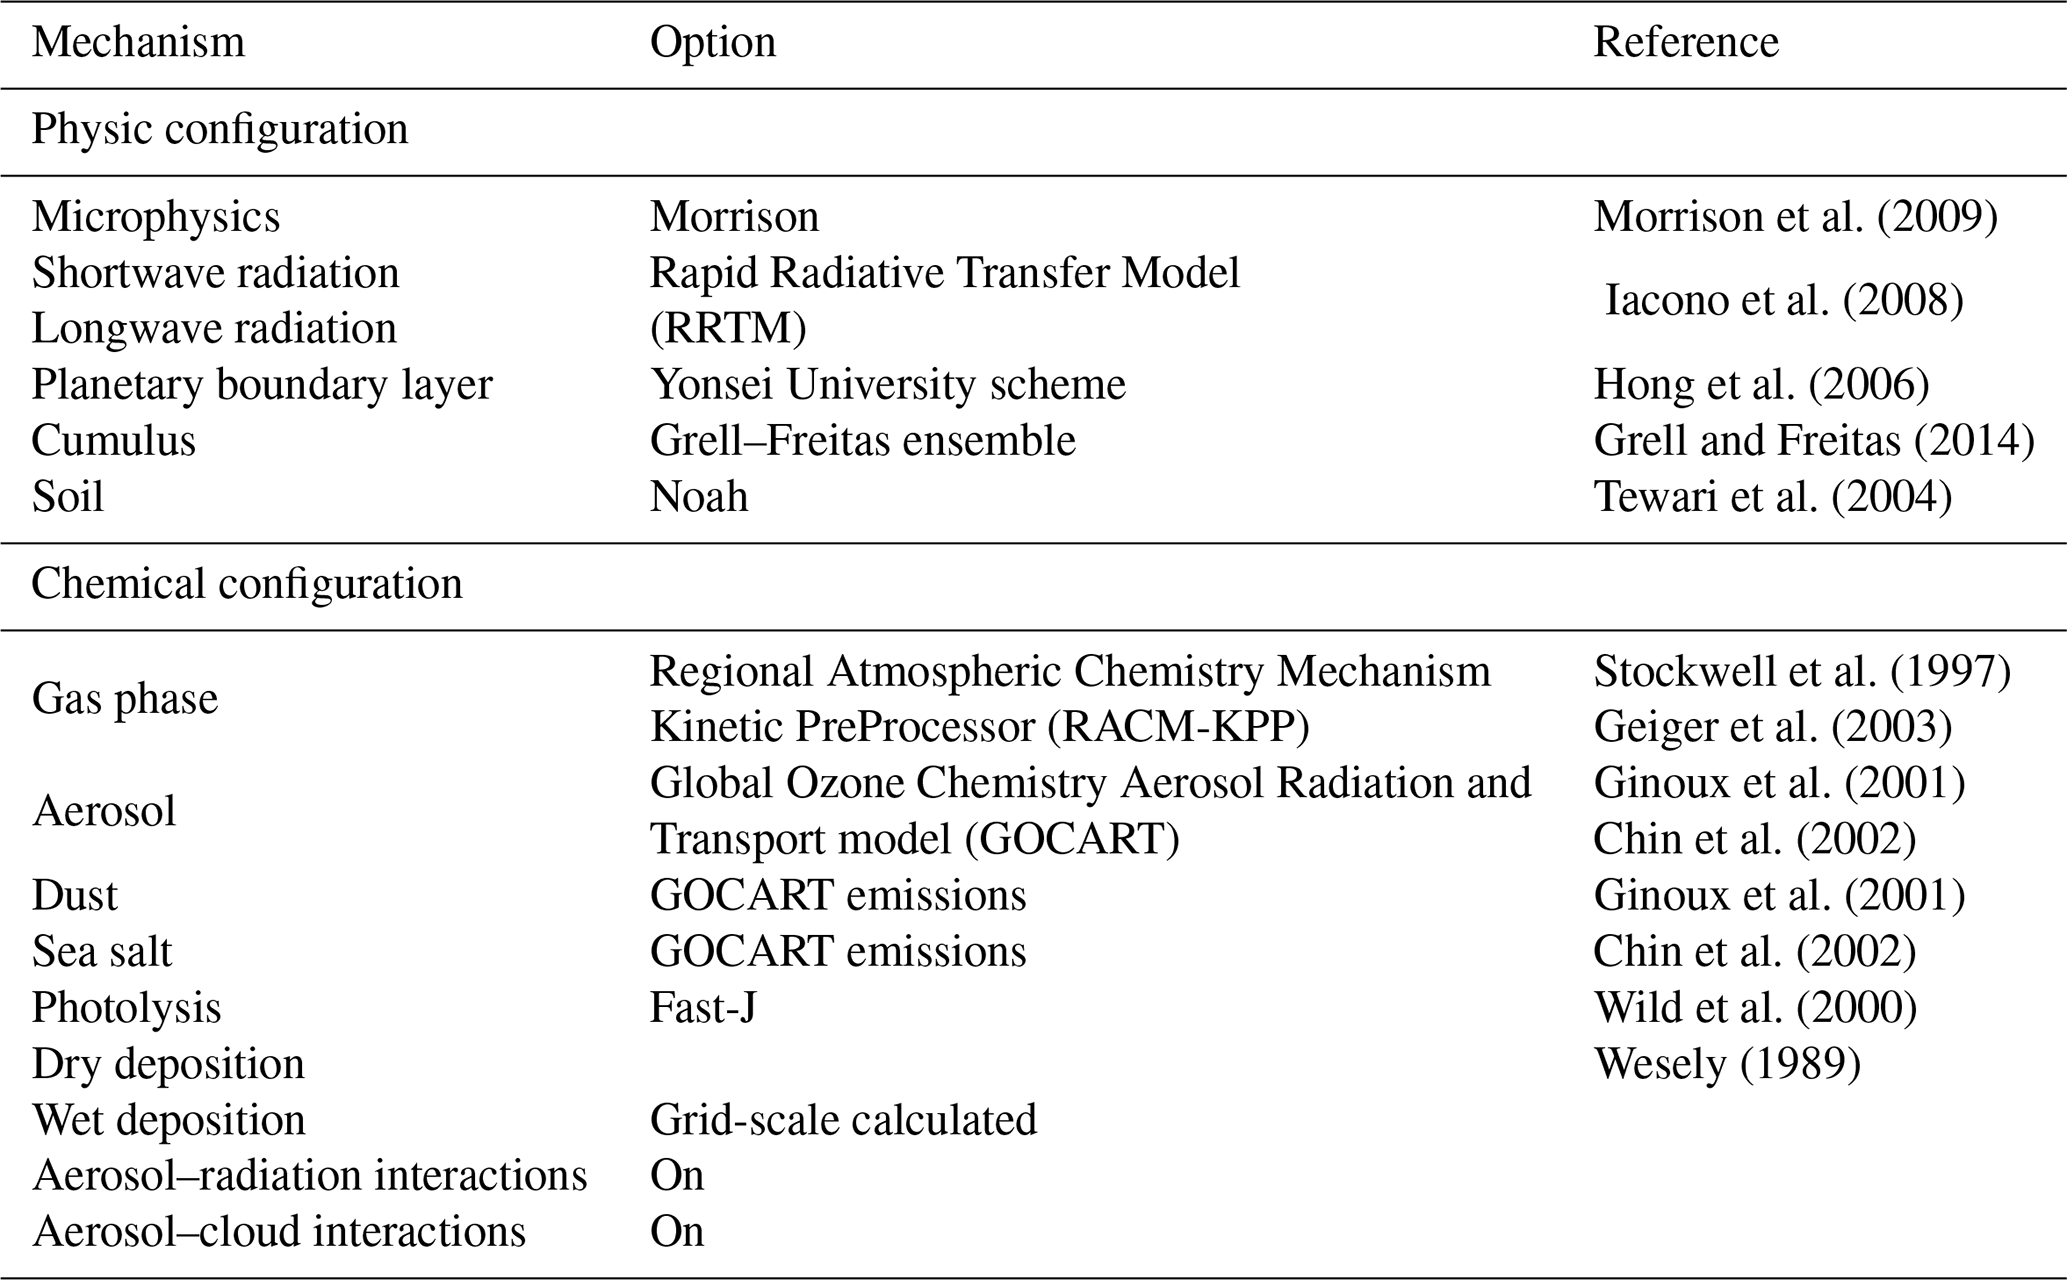
The target domain covers central Europe and the Mediterranean Basin with a resolution of ∼ 0.15∘ (∼ 16.7 km, Fig. 2), but this target domain is the inner domain (D3) of a nested run that allows us to capture the total desert dust contribution from the Sahara (Fig. 1). For that purpose, a parent domain covering the main areas of desert dust emissions (located around 15∘ N) was used. The other domains were built by one-way nesting with a nesting ratio of 1:3 with respect to the larger domain. Thus, the parent domain has a spatial resolution of 1.32∘ (150 km) and the second of 0.44∘ (∼ 50 km). Vertical resolution presents 48 uneven layers with the highest resolution at the bottom. The top of the atmosphere is set at 50 hPa.
Meteorological initial and boundary conditions for the outer domain were provided by the ERA-Interim reanalysis (Dee et al., 2011). The WRF-Chem option for idealized gases and the aerosol profile has been chosen for the chemical boundary conditions. Anthropogenic emissions were provided by the Emissions Database for Global Research–Task Force on Hemispheric Transport of Air Pollution (EDGAR-HTAP) project (http://edgar.jrc.ec.europa.eu/htap.php; last access: 13 May 2019; Janssens-Maenhout et al., 2012). Biomass burning emission data have been estimated from the Integrated Monitoring and Modeling System for Wildland Fires (IS4FIRES; Sofiev et al., 2009; Soares et al., 2015). Both have been adapted to chemical species in WRF-Chem following Andreae and Merlet (2001) and Wiedinmyer et al. (2011). The plume rise calculation was estimated online by WRF-Chem. Biogenic emissions are coupled online with WRF-Chem by using the Model of Emissions of Gases and Aerosol from Nature (MEGAN; Guenther et al., 2006). Finally, dust (Ginoux et al., 2001) and sea salt GOCART (Chin et al., 2002) emissions were estimated online by WRF-Chem.
The GOCART aerosol scheme in WRF-Chem does not allow a full coupling of aerosol–cloud interactions. For instance, convective wet scavenging (conv_tr_wetscav), in-cloud wet scavenging, and cloud chemistry are not available. However, in those simulations denoted as ACI, the Morrison microphysics (used in this contribution) acts as a double-moment scheme; meanwhile, in the rest of the simulations, it works as a single-moment microphysics scheme. This latter approach is unsuitable for assessing aerosol–cloud interactions because it does not include a prognostic treatment of droplet number. Hence, the ACI configuration allows a double-moment microphysics with greater flexibility when representing size distributions and hence microphysical process rates (Palacios-Peña et al., 2020a). When the double-moment scheme is activated, a prognostic droplet number concentration using gamma functions and mixing ratios of cloud ice, rain, snow, graupel and hail, cloud droplets, and water vapor is estimated (Morrison et al., 2009). Finally, the interaction of cloud and solar radiation with the Morrison microphysics scheme is implemented in WRF-Chem (Skamarock et al., 2008). Therefore, the droplet number will affect both the droplet mean radius and the cloud optical depth calculated by the model.
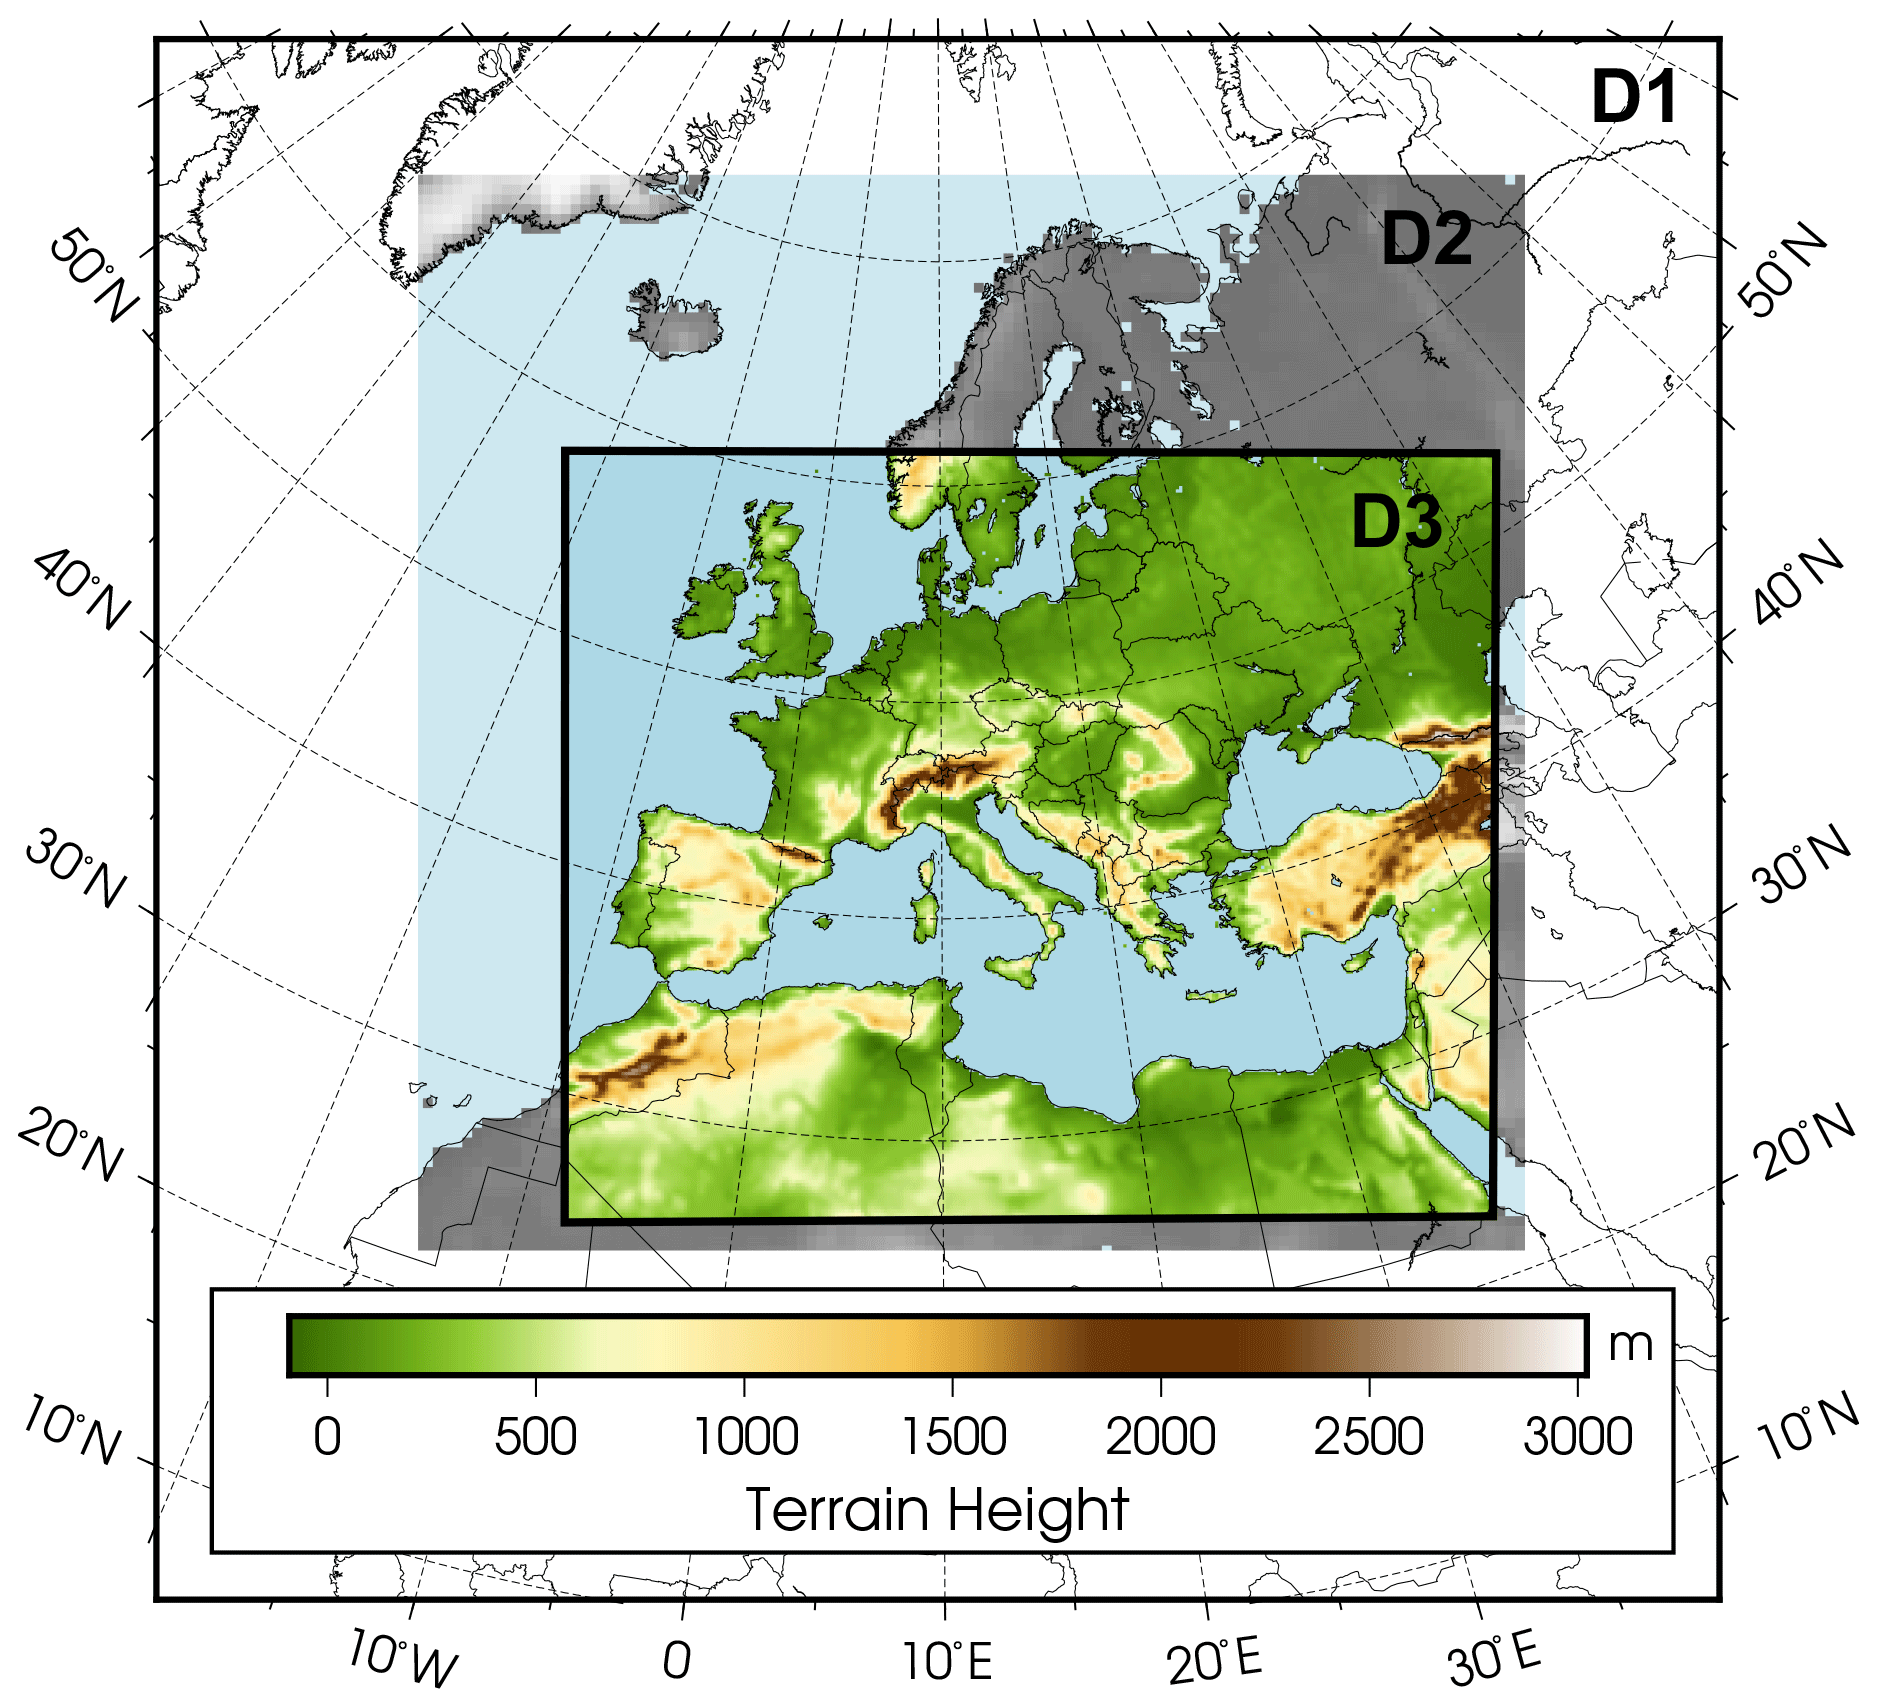
Figure 1Target (D3) and nested domains (D1 and D2). Adapted from Palacios-Peña et al. (2019b).
The aerosol size distribution represents the number (N), mass (M), or volume (V) of particles as a function of diameter (d; Seinfeld and Pandis, 2006). Commonly, the aerosol size distribution is represented as a function of the logarithm of the diameter. Thus, the total number, mass, or volume of aerosol particles is the integral of the diameter over the size distribution function (Buseck and Schwartz, 2003).
When the aerosol size distribution is modeled, three different approaches are commonly used (Boucher, 2015): (1) the first is a bulk approach in which only the aerosol mass concentration is computed. A constant size distribution is assumed and there is not a representation of a mixing state. That leads to a simple and computationally cheap approach. (2) A more complex approach uses multiple superposed modes, which are typically represented by a lognormal distribution described by a fixed mean and variance. The accuracy of this approach lies in the correct choice of these two parameters. (3) Last is the most computationally expensive approach of sectional representation, which consists of discretizing the aerosol size distribution into n classes or bins by diameter, with the concentration of aerosols in each bin following the conservation equation, and then the number, mass, or volume in each bin is predicted.
A lognormal approach is typically employed in chemistry transport models for aerosol size distribution, since this approach fits the observed aerosol size distribution reasonably well and its mathematical form is convenient for dealing with the moment distribution. In this approach, all of the moment distributions are lognormal and present the same geometric mean diameter and geometric standard deviation, parameters that determine the lognormal distribution (Hinds, 2012). One of the most common lognormal size distributions used is that described in Heintzenberg (1994, Eq. 1), which has also been employed in this contribution. Equation (1) represents the zeroth moment of the particle size distribution, where dp is the particle diameter, σg is the standard deviation of the distribution, and Fm0 is the number concentration as diameter dgN (number median diameter).
GOCART (Ginoux et al., 2001; Chin et al., 2002) includes a bulk approach for black carbon (BC), organic carbon (OC), and sulfate, as well as a sectional scheme for mineral dust and sea salt using Kok (2011) brittle fragmentation theory, a simple and cheap computational approach. The selection of this scheme is conditioned by the fact that WRF-Chem version 3.9.1.1 only allows the simulation of desert dust and sea salt with this GOCART scheme.
The module of aerosol optical properties in WRF-Chem calculates optical properties from species estimated by the GOCART scheme. These properties depend on size and number distribution, composition, and aerosol water. For a bulk approach such as GOCART, bulk mass and number are converted into an assumed lognormal modal distribution, followed by dividing the mass into sections or bins (“i”). The parameters that define this lognormal distribution are the modified variables for the sensitivity test. Then the aerosol optical calculation follows the process described in Barnard et al. (2010). For each bin and each chemical species (“j”), mass is converted to volume. Summing over all the species volume and assuming spherical particles, a diameter (D) is assigned to each bin. Therefore, the aerosol size distribution is defined by the number and the associated diameter for each bin. Aerosol water content depends on the relative humidity (RH) and the hygroscopicity factor of each species in the aerosol composition. Refractive indices are averaged by the Maxwell Garnett approximation (Bohren and Huffman, 2007) among the compositions for each section into which mass has been divided. All particles within a size range are assumed to have the same composition, although their relative fraction can differ among size ranges. Finally, an approximate version of the Mie solution (Ackerman and Toon, 1981) is used to estimate the absorption efficiency (Qa,i), the scattering efficiency (Qs,i), and the asymmetry parameter (gi). Optical properties are computed by summing over the size distribution. Equation (2) shows an example for the estimation of the scattering coefficient (σs).
First, the impacts of the sensitivity test on the representation of AOD are investigated. Then, the magnitude of these effects is analyzed by using the Kolmogorov–Smirnov test. Once the most relevant cases among all those run in the sensitivity test have been established, the causes of these changes are disentangled.
3.1 Effects on AOD representation
Figure 2 shows the AOD at 550 nm simulated by the base case (top row) and the differences between each of the experiments vs. the base case. This figure only exhibits the results for the modification of 50 %, but the rest of the experiments are shown in Fig. S3. The reason to show only the 50 % experiment is the qualitatively similar spatial pattern of changes found for each experiment when modifying the parameters by 10 %, 20 %, and 50 %. Overall, the difference lies in the quantitatively larger changes in the latter experiment.
As previously mentioned, the experiments consist of the modification of the geometric diameter (DG) and the standard deviation (SG) of the aerosol size distribution by 10 %, 20 % and 50%. Taking this consideration into account, the experiments have been named to indicate the sign of the modification (L for a reduction or low and H for an increase or high), the percentage (10, 20, or 50), the variable of the size distribution modified (SG for the standard deviation and DG for the geometric diameter), and the mode in which the modification has been implemented (“ai” for Aitken, “ac” for accumulation, and “co” for coarse). Thus, the acronym for an experiment follows the this pattern: (L|H)(10|20|50)_(SG|DG)(ai|ac|co). For example, L50_SGai indicates a 50 % reduction (L) of the standard deviation (SG) in the Aitken mode (ai).
The top row in Fig. 2 displays the hourly mean of AOD for the base case, averaged for the entire target period (from 4 to 9 July). As established by Palacios-Peña et al. (2019b), high AOD values over the western part of the Mediterranean Basin and central Europe were caused by a strong desert dust outbreak from the Sahara. The AOD at the eastern part of the Mediterranean has high values because the outbreak reached that area at the end of the period. Palacios-Peña et al. (2019b) evaluated this base case against observations from the Moderate Resolution Imaging Spectroradiometer (MODIS; and the instrument's onboard satellite) and the Aerosol Robotic Network (AERONET). The evaluation results (Fig. S2) evince negligible errors of the model over large areas but an underestimation of AOD over the north of Germany and the central and western Mediterranean (around −0.2 to −0.4). Despite this underestimation, the spatiotemporal mean bias error is −0.02 (when evaluated against both observational datasets, MODIS and AERONET), and the mean absolute errors are 0.16 (when assessed against MODIS) and 0.12 (when evaluated against AERONET). Palacios-Peña et al. (2019b) also pointed out that this underestimation over the central and western Mediterranean Basin turns into a larger overestimation when a coarser resolution is used due to a worsening of the representation of the dynamical patterns and thus the dust transport.
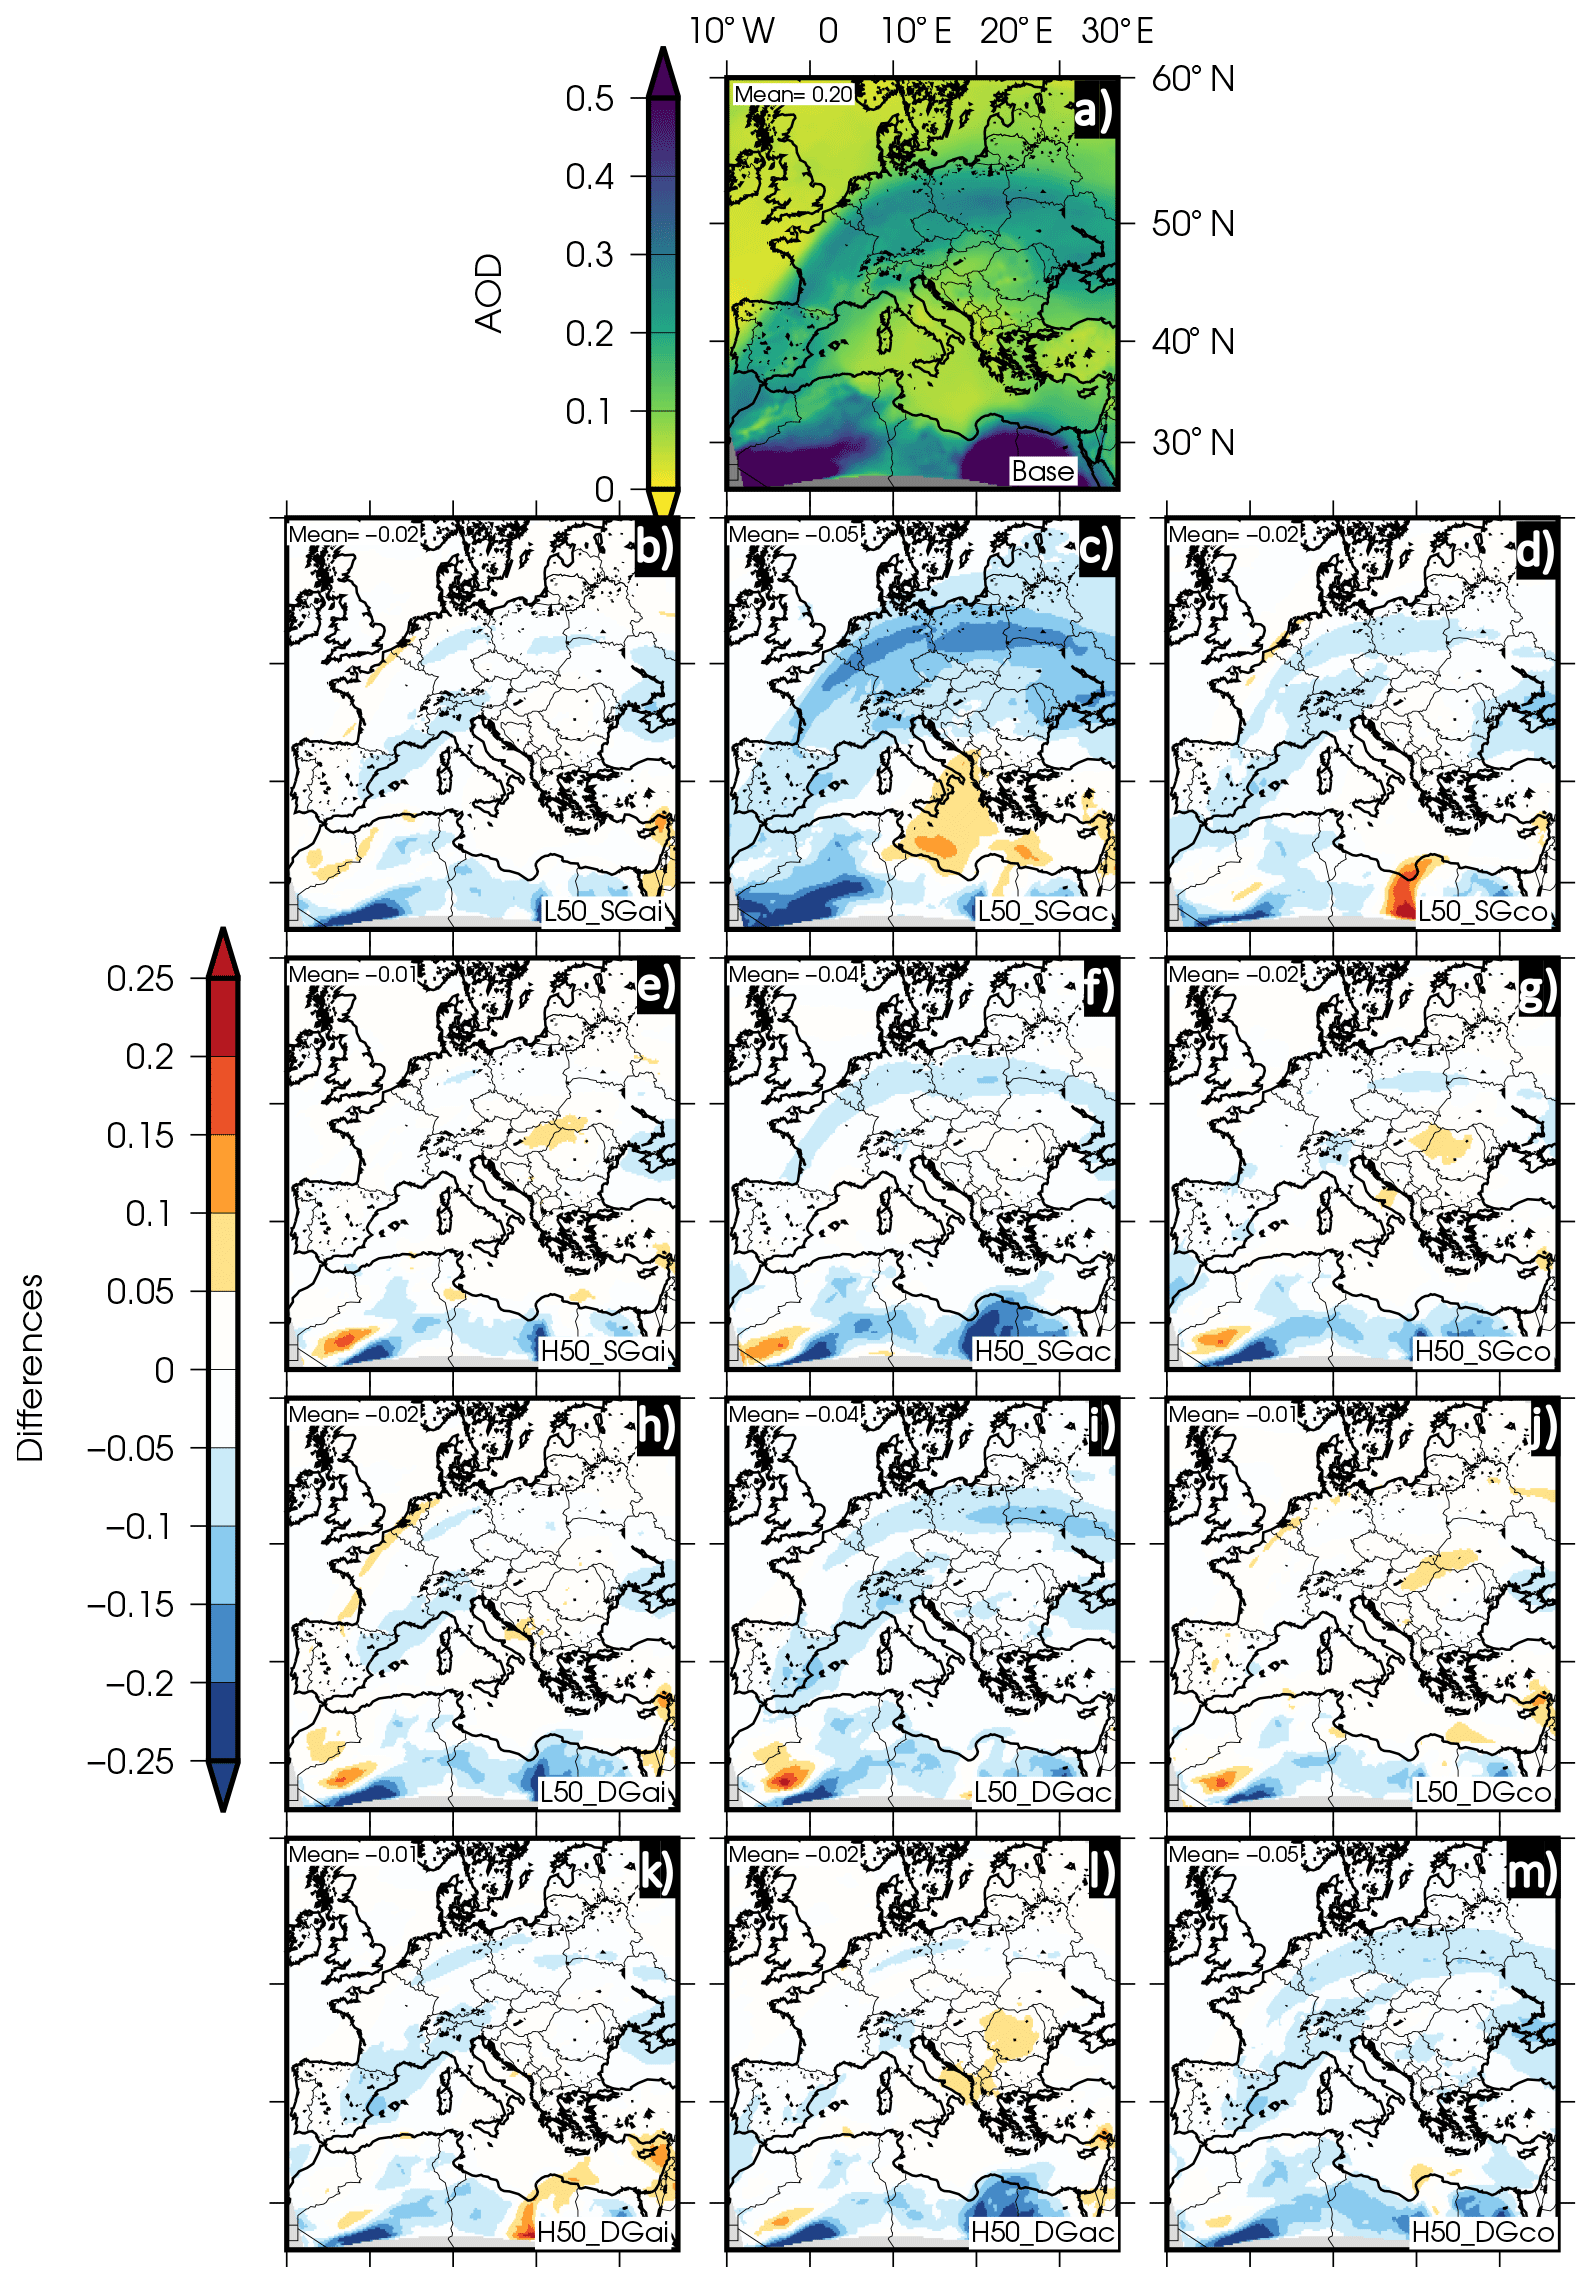
Figure 2AOD at 550 nm and differences for the sensitivity tests modifying the parameters by 50 %. (a) Base case; (b) Aitken-mode 50 % reduction in SG; (c) accumulation-mode 50 % reduction in SG; (d) coarse-mode 50 % reduction in SG; (e) Aitken-mode 50 % increase in SG; (f) accumulation-mode 50 % increase in SG; (g) coarse-mode 50 % increase in SG; (h) Aitken-mode 50 % reduction in DG; (i) accumulation-mode 50 % reduction in DG; (j) coarse-mode 50 % reduction in DG; (k) Aitken-mode 50 % increase in DG; (l) accumulation-mode 50 % increase in DG; (m) coarse-mode 50 % increase in DG.
The results of the sensitivity tests indicate that AOD is not very sensitive to the modification of the standard deviation of the Aitken mode (L50_SGai and H50_SGai). Identical results are found for the variation of the geometric diameter of the Aitken mode (L50_DGai and H50_DGai). In these experiments there is not a clear pattern in the response of AOD to the perturbations of the test; that is, low positive and negative changes (most of them above 0.05) alternate spatially. Higher differences (around and above > 0.1) are found over some small areas close to the boundaries. Temporal and spatial differences range between −0.03 and −0.01, indicating that there is not a clear impact of the modification of size distribution for the Aitken mode on AOD levels.
Sensitivity experiments including modifications of the accumulation mode lead to larger spatial changes with a greater spatial extent when compared to sensitivity tests modifying the representation of the Aitken mode. The experiment wherein the standard deviation of the accumulation mode decreases (L50_SGac) is the experiment with the highest impact on AOD. Over most of the domain the change is limited to > 0.1. These changes are negative over central Europe and the Iberian Peninsula (for which AOD in the base case is > 0.3) and are positive over the eastern Mediterranean Basin. No significant patterns of change are visualized when increasing the standard deviation of the accumulation mode (H50_SGac), with changes in AOD under ± 0.05. With respect to the experiments modifying the geometric diameter, negative changes with a temporal and spatial mean of −0.04 are found when the DG decreases by 50 % (in general, the model considers particles in the accumulation mode to be smaller than in the base case). On the other hand, when DG increases, positive changes are widely observed (larger particles than in the base case). Despite this overall signal, positive and negative signals alternate spatially in both simulations.
Finally, when considering changes in the size distribution of the coarse mode, H50_DGco (geometric diameter increases by 50 %) is the experiment with the strongest response. Negative variations are found over large parts of the domain, with values up to −0.15 over smaller areas. However, when the DG decreases, the response oscillates between negative and positive values lower than 0.05. Analogously, the response to the modification of the standard deviation for the coarse mode does not show a clear pattern.
As mentioned previously, for all of the experiments, higher changes (above 0.1) are found close to the south boundary. This could be caused by the fact that the main natural sources of emissions are located over this area.
3.2 Significance of AOD changes
This section focuses on elucidating and ranking the importance of AOD changes for the sensitivity experiments in order to select the experiments with the highest sensitivity. The physicochemical causes behind those changes for the selected experiments will be disentangled later in Sect. 3.3.
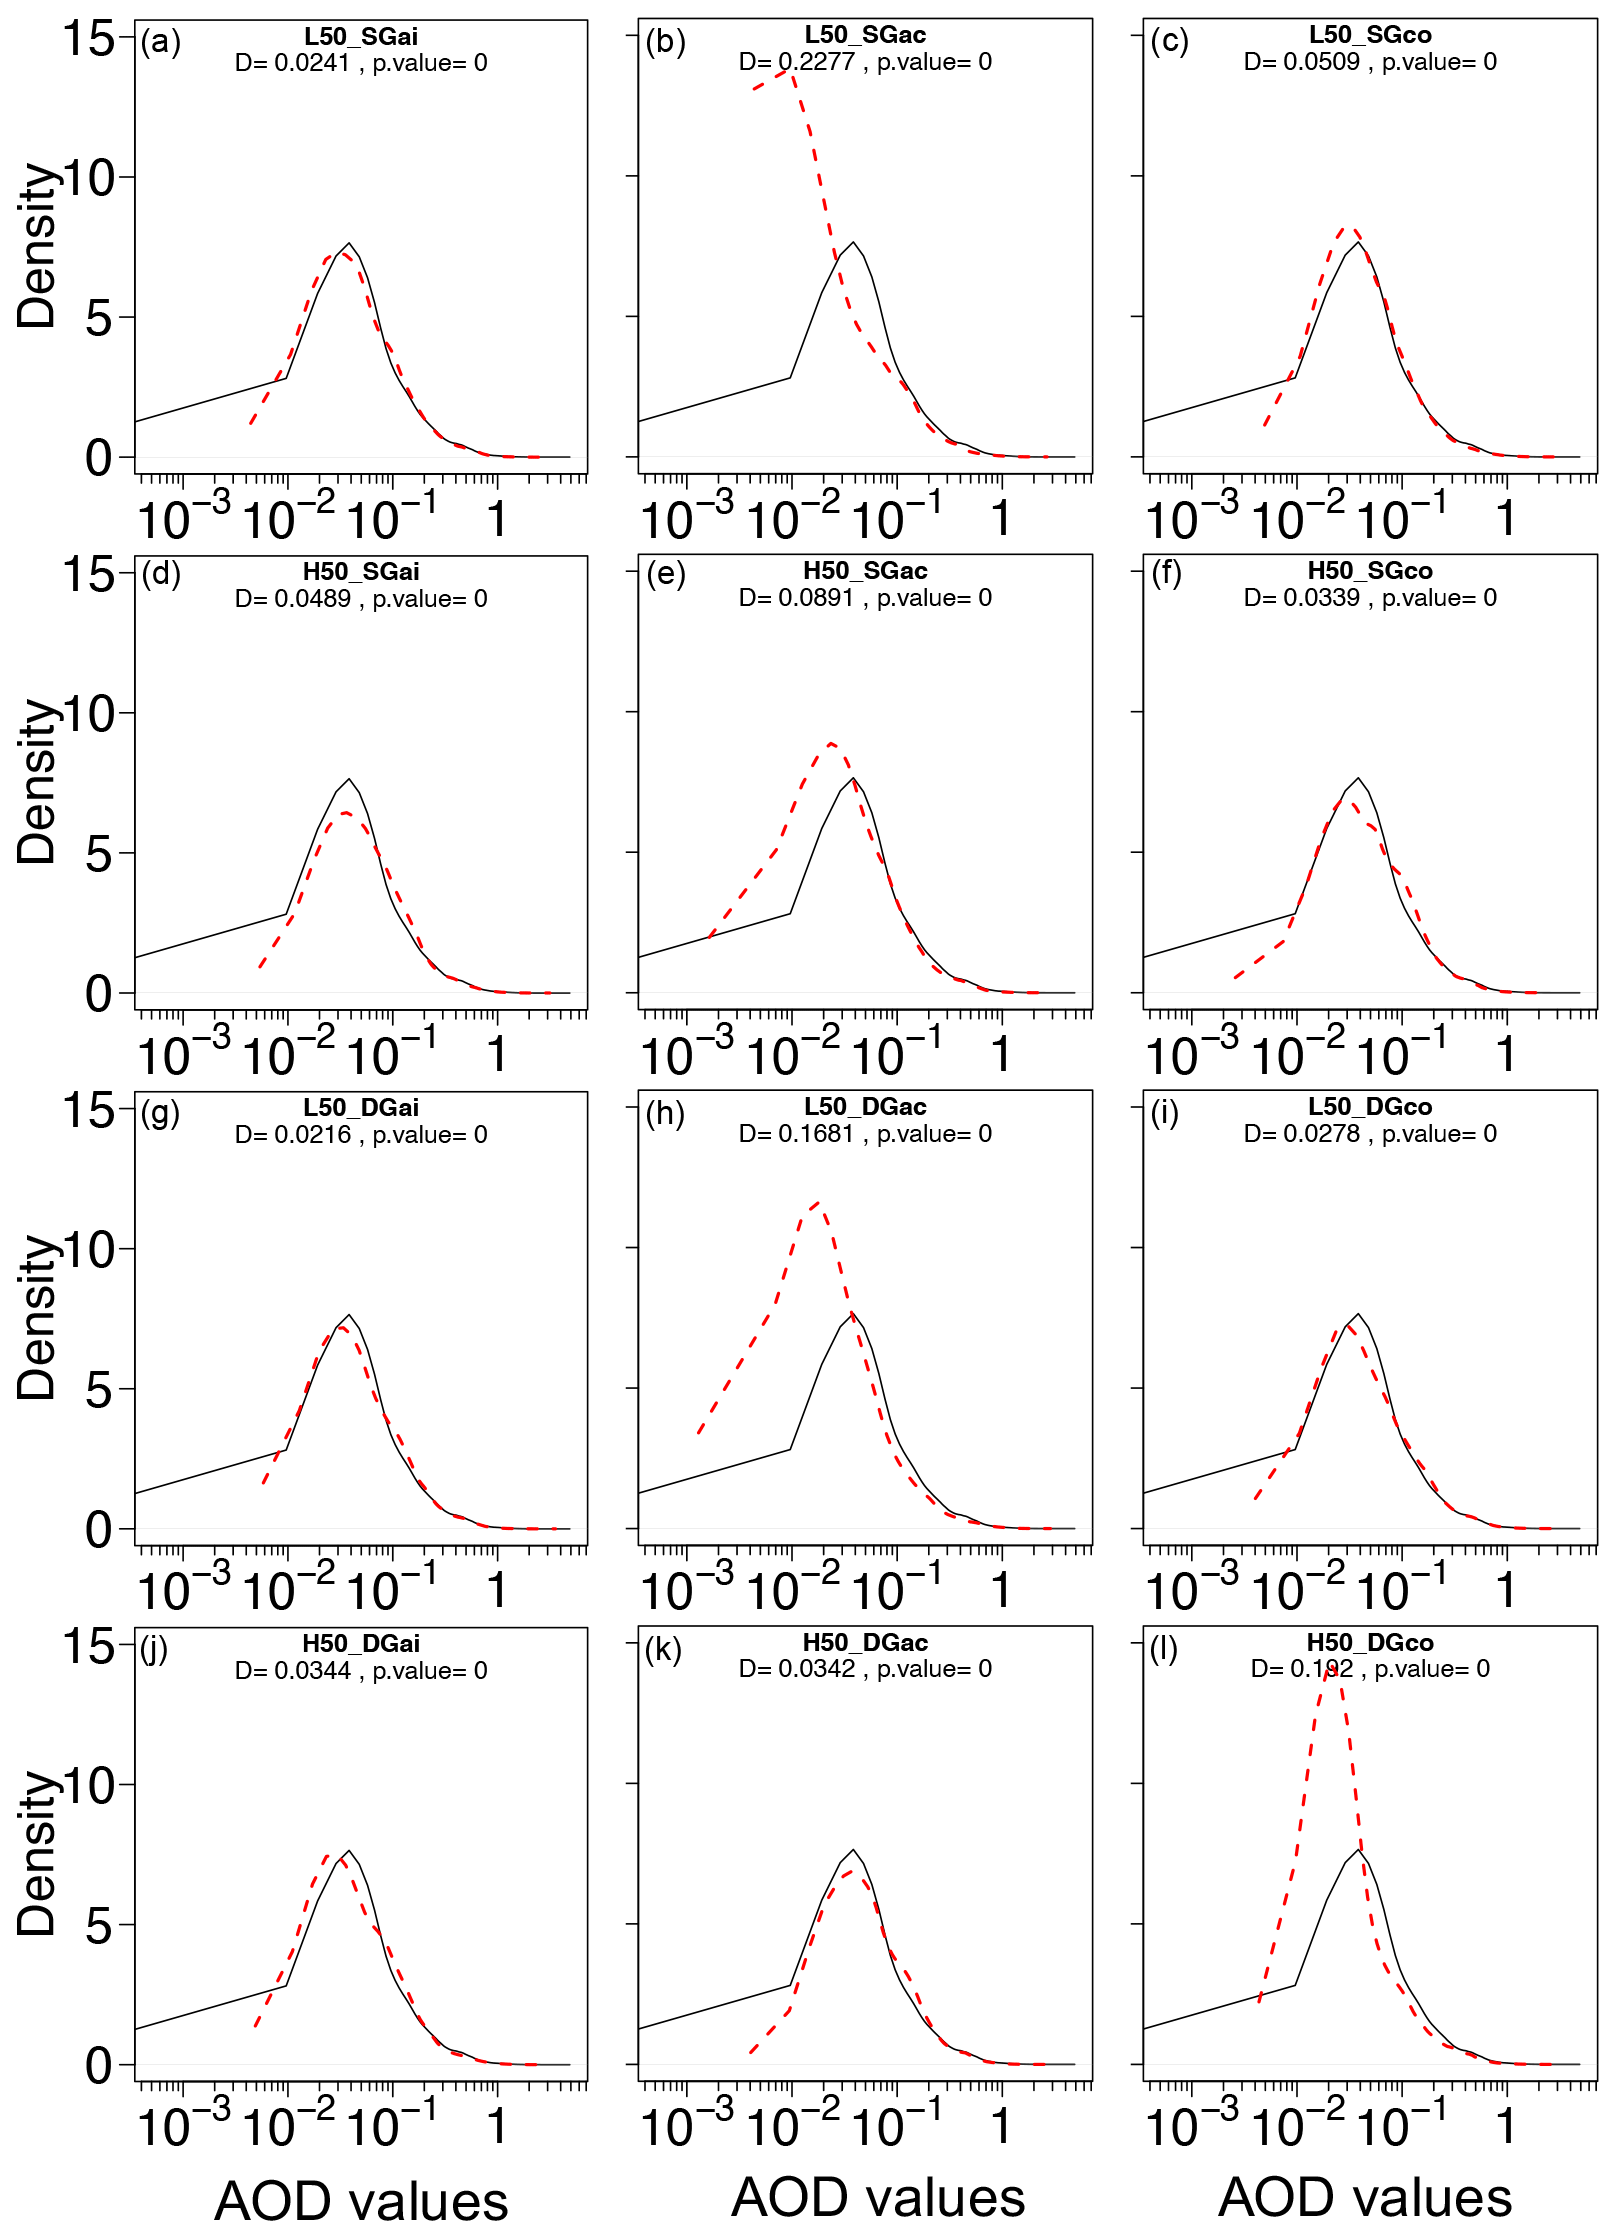
Figure 3PDF of AOD values for the base case (black line) and each of the sensitivity test simulations at 50 % (dashed red line). Values in figures represent the results of the statistics from the Kolmogorov–Smirnov test. (a) Aitken-mode 50 % reduction in SG; (b) accumulation-mode 50 % reduction in SG; (c) coarse-mode 50 % reduction in SG; (d) Aitken-mode 50 % increase in SG; (e) accumulation-mode 50 % increase in SG; (f) coarse-mode 50 % increase in SG; (g) Aitken-mode 50 % reduction in DG; (h) accumulation-mode 50 % reduction in DG; (i) coarse-mode 50 % reduction in DG; (j) Aitken-mode 50 % increase in DG; (k) accumulation-mode 50 % increase in DG; (l) coarse-mode 50 % increase in DG.
For that purpose, Fig. 3 displays the probability density function (PDF) of the values of AOD at 550 nm (for all cells and time steps in the model) simulated by the base case (solid black line) and each of the experiments (dashed red line). As in the previous section, this figure only exhibits the results for the modification of 50 %, but the results for the rest of the perturbations can be found in Fig. S4. The number in each panel represents the statistics obtained from the Kolmogorov–Smirnov test. Kolmogorov–Smirnov is a nonparametric test used for the evaluation of the statistical similarity of the distribution between two datasets. The test is based on the assumed similarity of the empirical cumulative distribution function (ECDF) between two random samples. The maximum distance between two ECDFs, normally named D, indicates how far the two distributions are. In this contribution, the distribution of each experiment (dashed red line) has been evaluated against the distribution of the base case (black line). The p values represent the probability of values as extreme as those obtained for samples coming from the same distribution. Low p values show a low probability of error when the null hypothesis is rejected and thus indicate that two samples do not come from the same distribution (Sprent and Smeeton, 2016).
For all of the experiments the distance between the samples is statistically significant (p value close to 0) because of the high number of samples (cells) in each experiment. As all the spatiotemporal values are taken for statistical purposes, the number of samples is over 1 000 000. However, the distance varies for each experiment.
L50_SGac is the experiment with the highest D (0.2277), meaning that this experiment presents the largest difference with respect to the base case. H50_DGco, with a distance of 0.1920, and L50_DGac, with 0.1648, are also experiments with a noticeable difference (D). H50_SGac, with a distance of 0.0891, also shows differences but not as important as for the former cases. The rest of the sensitivity cases present D values lower than 0.05; that is, differences are small with respect to the base case although statistically significant.
Similar results are found when the modifications of 10 % and 20 % are analyzed (Fig. S4). These cases exhibit D lower than for the modification of 50 % but higher than 0.05. The distance is lower as the magnitude of the modification decreases. For example, the L10_SGac distance is 0.0863, the L20_SGac is 0.1814, and the L50_SGac is 0.2270. This behavior is repeated in the rest of the experiments but with D<0.05.
These D values can be observed in the PDF shown in Fig. 3. The second panel in the first row portrays the PDF for L50_SGac, showing a much higher peak (peak density > 10) than for the base case (peak density < 8). Moreover, the upper tail reaches AOD values < 3 for the L50_SGac; meanwhile, the upper tail for the base case reaches AOD values < 5. The response for the modification of 20 % and 10 % is similar. However, the latter shows larger AOD values in the upper tail and a lower peak density (around 9).
A similar behavior is exhibited by the H50_DGco and the L50_DGac experiments, but in the latter the upper tail reaches AOD > 3. However, the PDF of this experiment does not respond analogously to other quantitative modifications (10 % and 20 %). H50_SGac is noticeable because its peak density reaches values up to 9 and its upper tail up to 3; however, its distance is much lower (> 0.1) than for the previously mentioned cases and decreases as the perturbation in the sensitivity experiment does.
In order to disentangle the causes for the results found in the sensitivity tests, the next section focuses on those cases in which the distance in the Kolmogorov–Smirnov test with respect to the base case is > 0.1. These are L50_SGac, L50_DGac, and H50_DGco. Regarding other modifications, only the L20_SGac (Fig. S4) shows a distance higher than 0.1. The L10_SGac difference is not higher than 0.1 (because of the limited modification of 10 %) but the distance is the highest for this range of modifications, with a value of 0.09.
3.3 Disentangling the causes of AOD variations due to perturbations in the size distribution
Figure 4 displays the PM ratio for the base case at 1000 hPa and the corresponding differences between the experiment at 50 % and the base case. This statistical figure is estimated as the ratio between PM2.5 and PM10 and is a proxy for the predominance of fine or coarse particles in the air mass. High values of the PM ratio imply a higher proportion of fine particles (usually with an anthropogenic origin), while low values of the ratio point to the presence of coarse particles (natural origin).
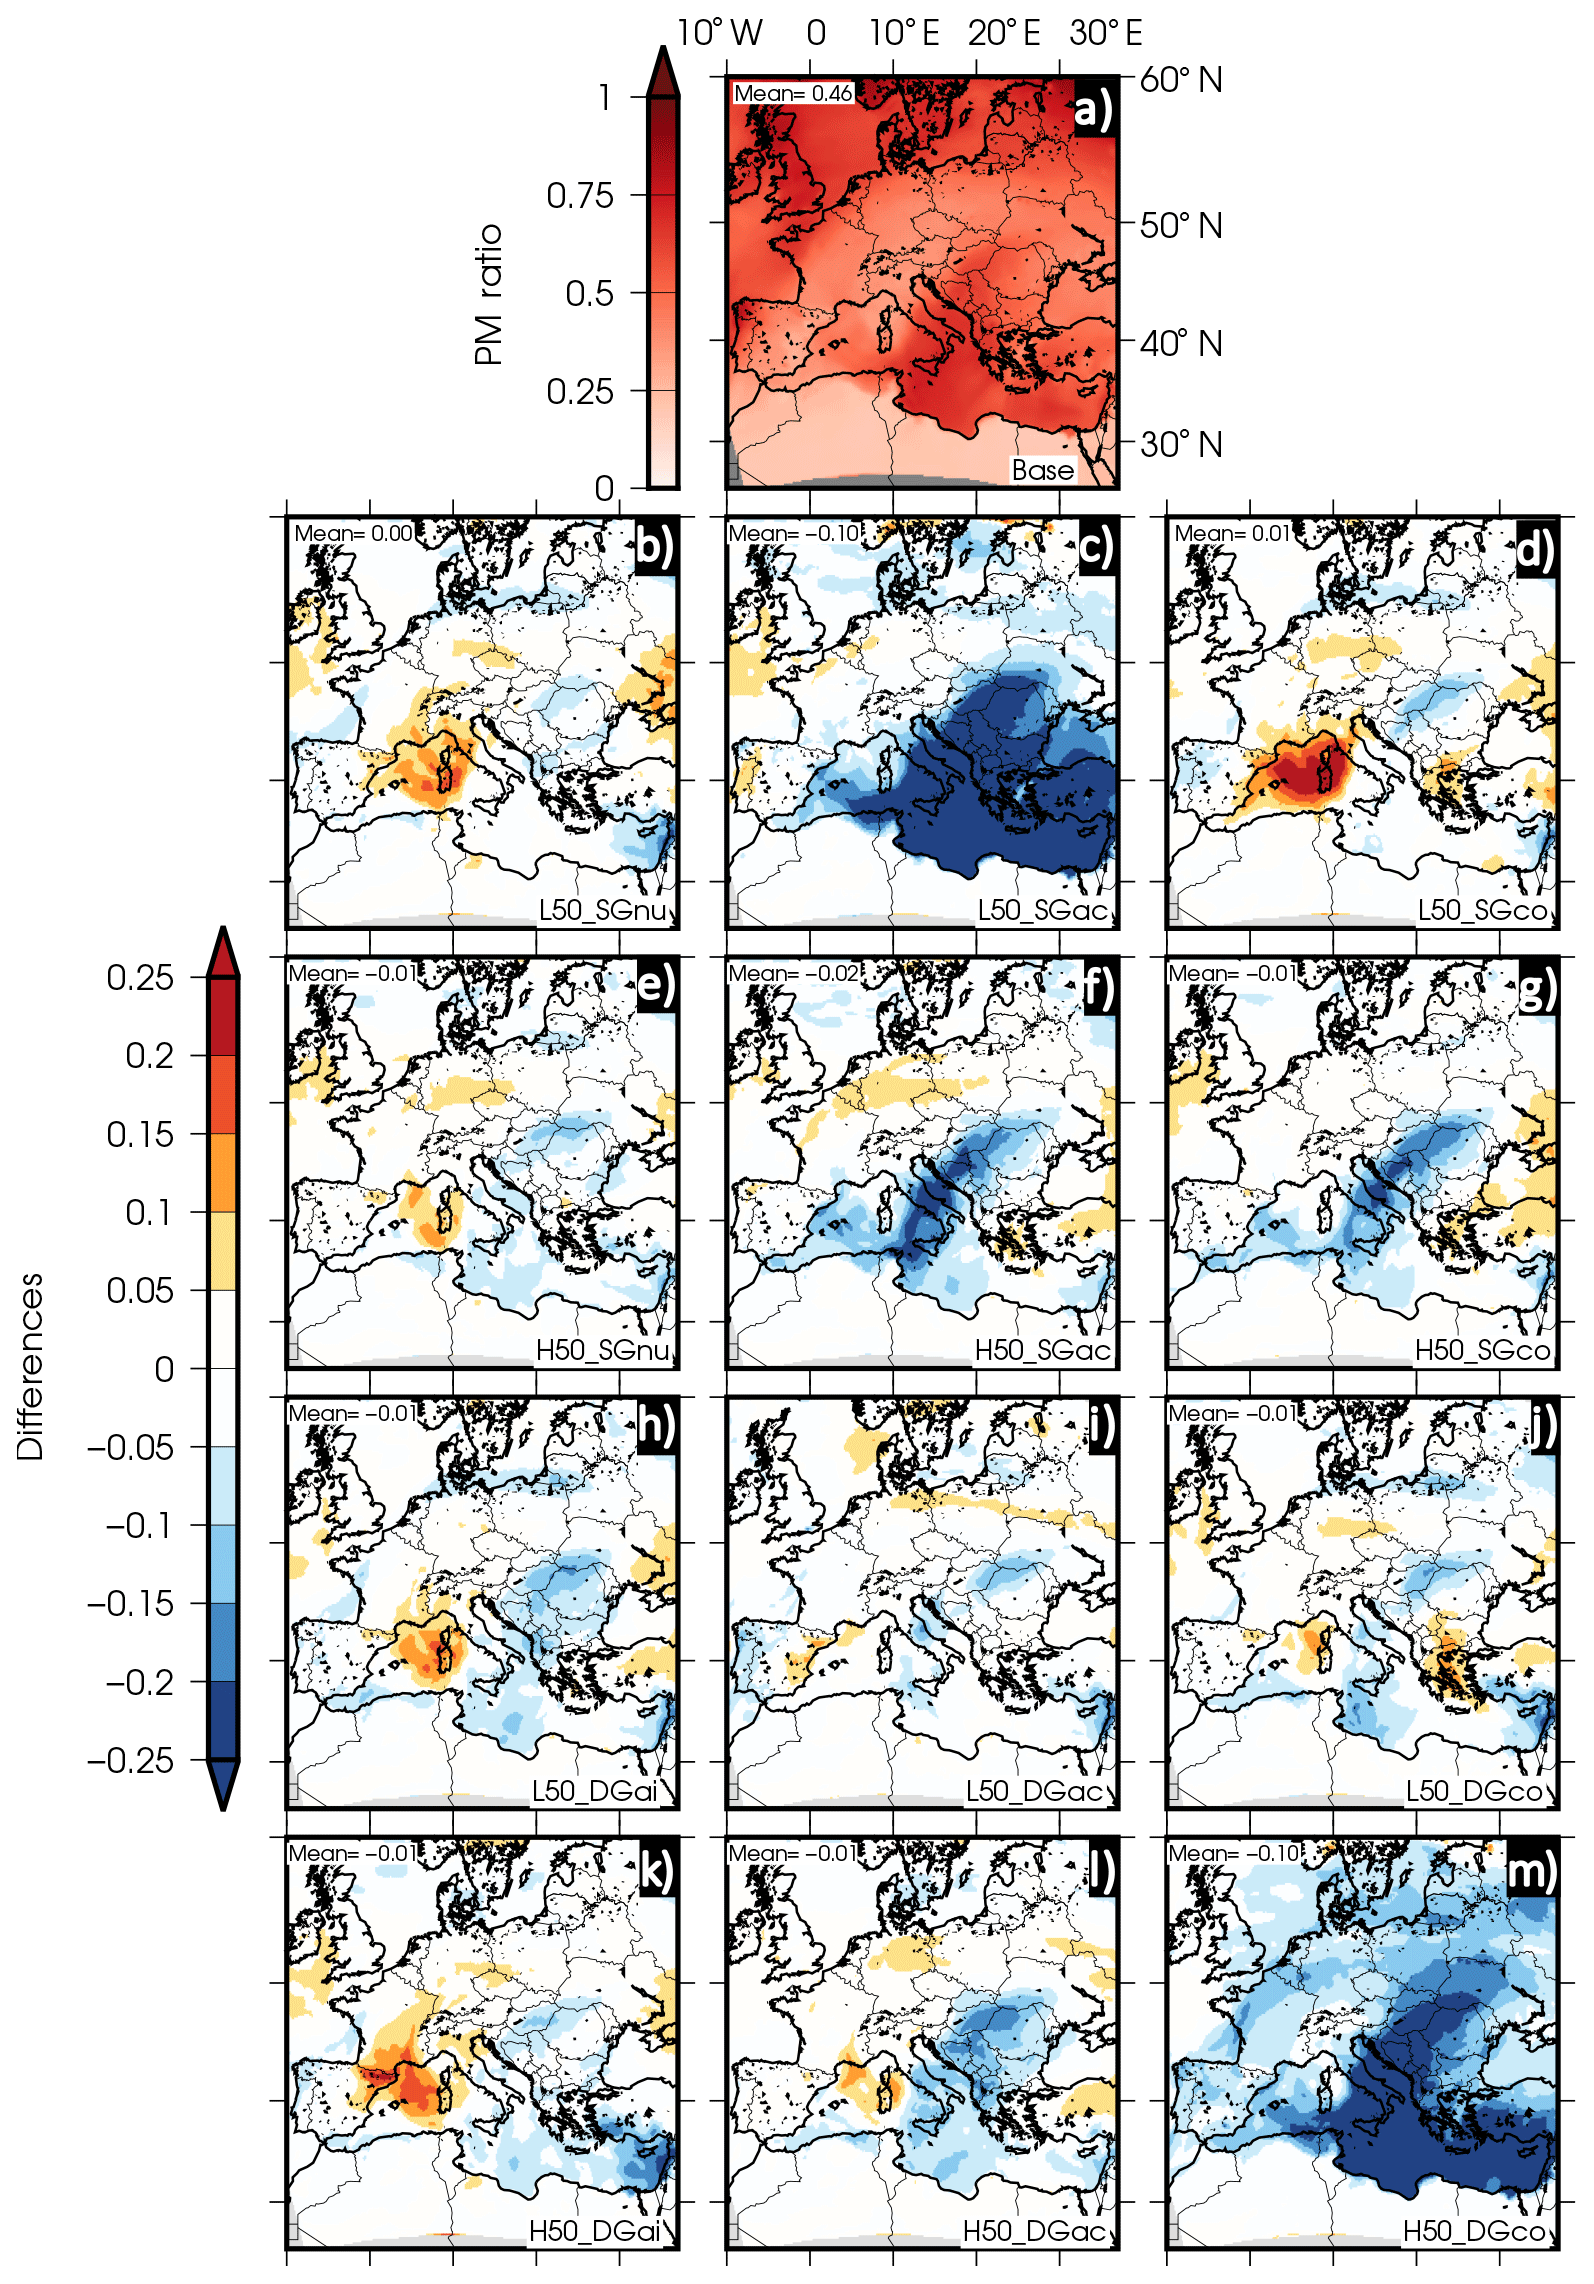
Figure 4PM ratio at 1000 hPa for the base case and differences for sensitivity simulations at 50 %. (a) Base case; (b) Aitken-mode 50 % reduction in SG; (c) accumulation-mode 50 % reduction in SG; (d) coarse-mode 50 % reduction in SG; (e) Aitken-mode 50 % increase in SG; (f) accumulation-mode 50% increase in SG; (g) coarse-mode 50 % increase in SG; (h) Aitken-mode 50 % reduction in DG; (i) accumulation-mode 50% reduction in DG; (j) coarse-mode 50 % reduction in DG; (k) Aitken-mode 50 % increase in DG; (l) accumulation-mode 50 % increase in DG; (m) coarse-mode 50 % increase in DG.
The PM ratio of the base case (Fig. 4a) is close to zero in Africa because during this Saharan desert dust episode coarse particles (PM10) predominate over this area. When comparing the top row in Figs. 4 and 2, areas with high AOD levels match those areas with a null PM ratio due to the influence of desert dust. The high values of the ratio over the central Mediterranean Sea could be ascribed to the transport of dust particles. At the beginning of the episode, the dust outbreak reached the central Mediterranean (coarse particles from dust were modeled here), but as the episode developed, dust – and hence PM10 particles – moved eastwards and northwards, with the PM2.5 concentrations being higher over the Mediterranean Sea and the African coastline at the end of the target period.
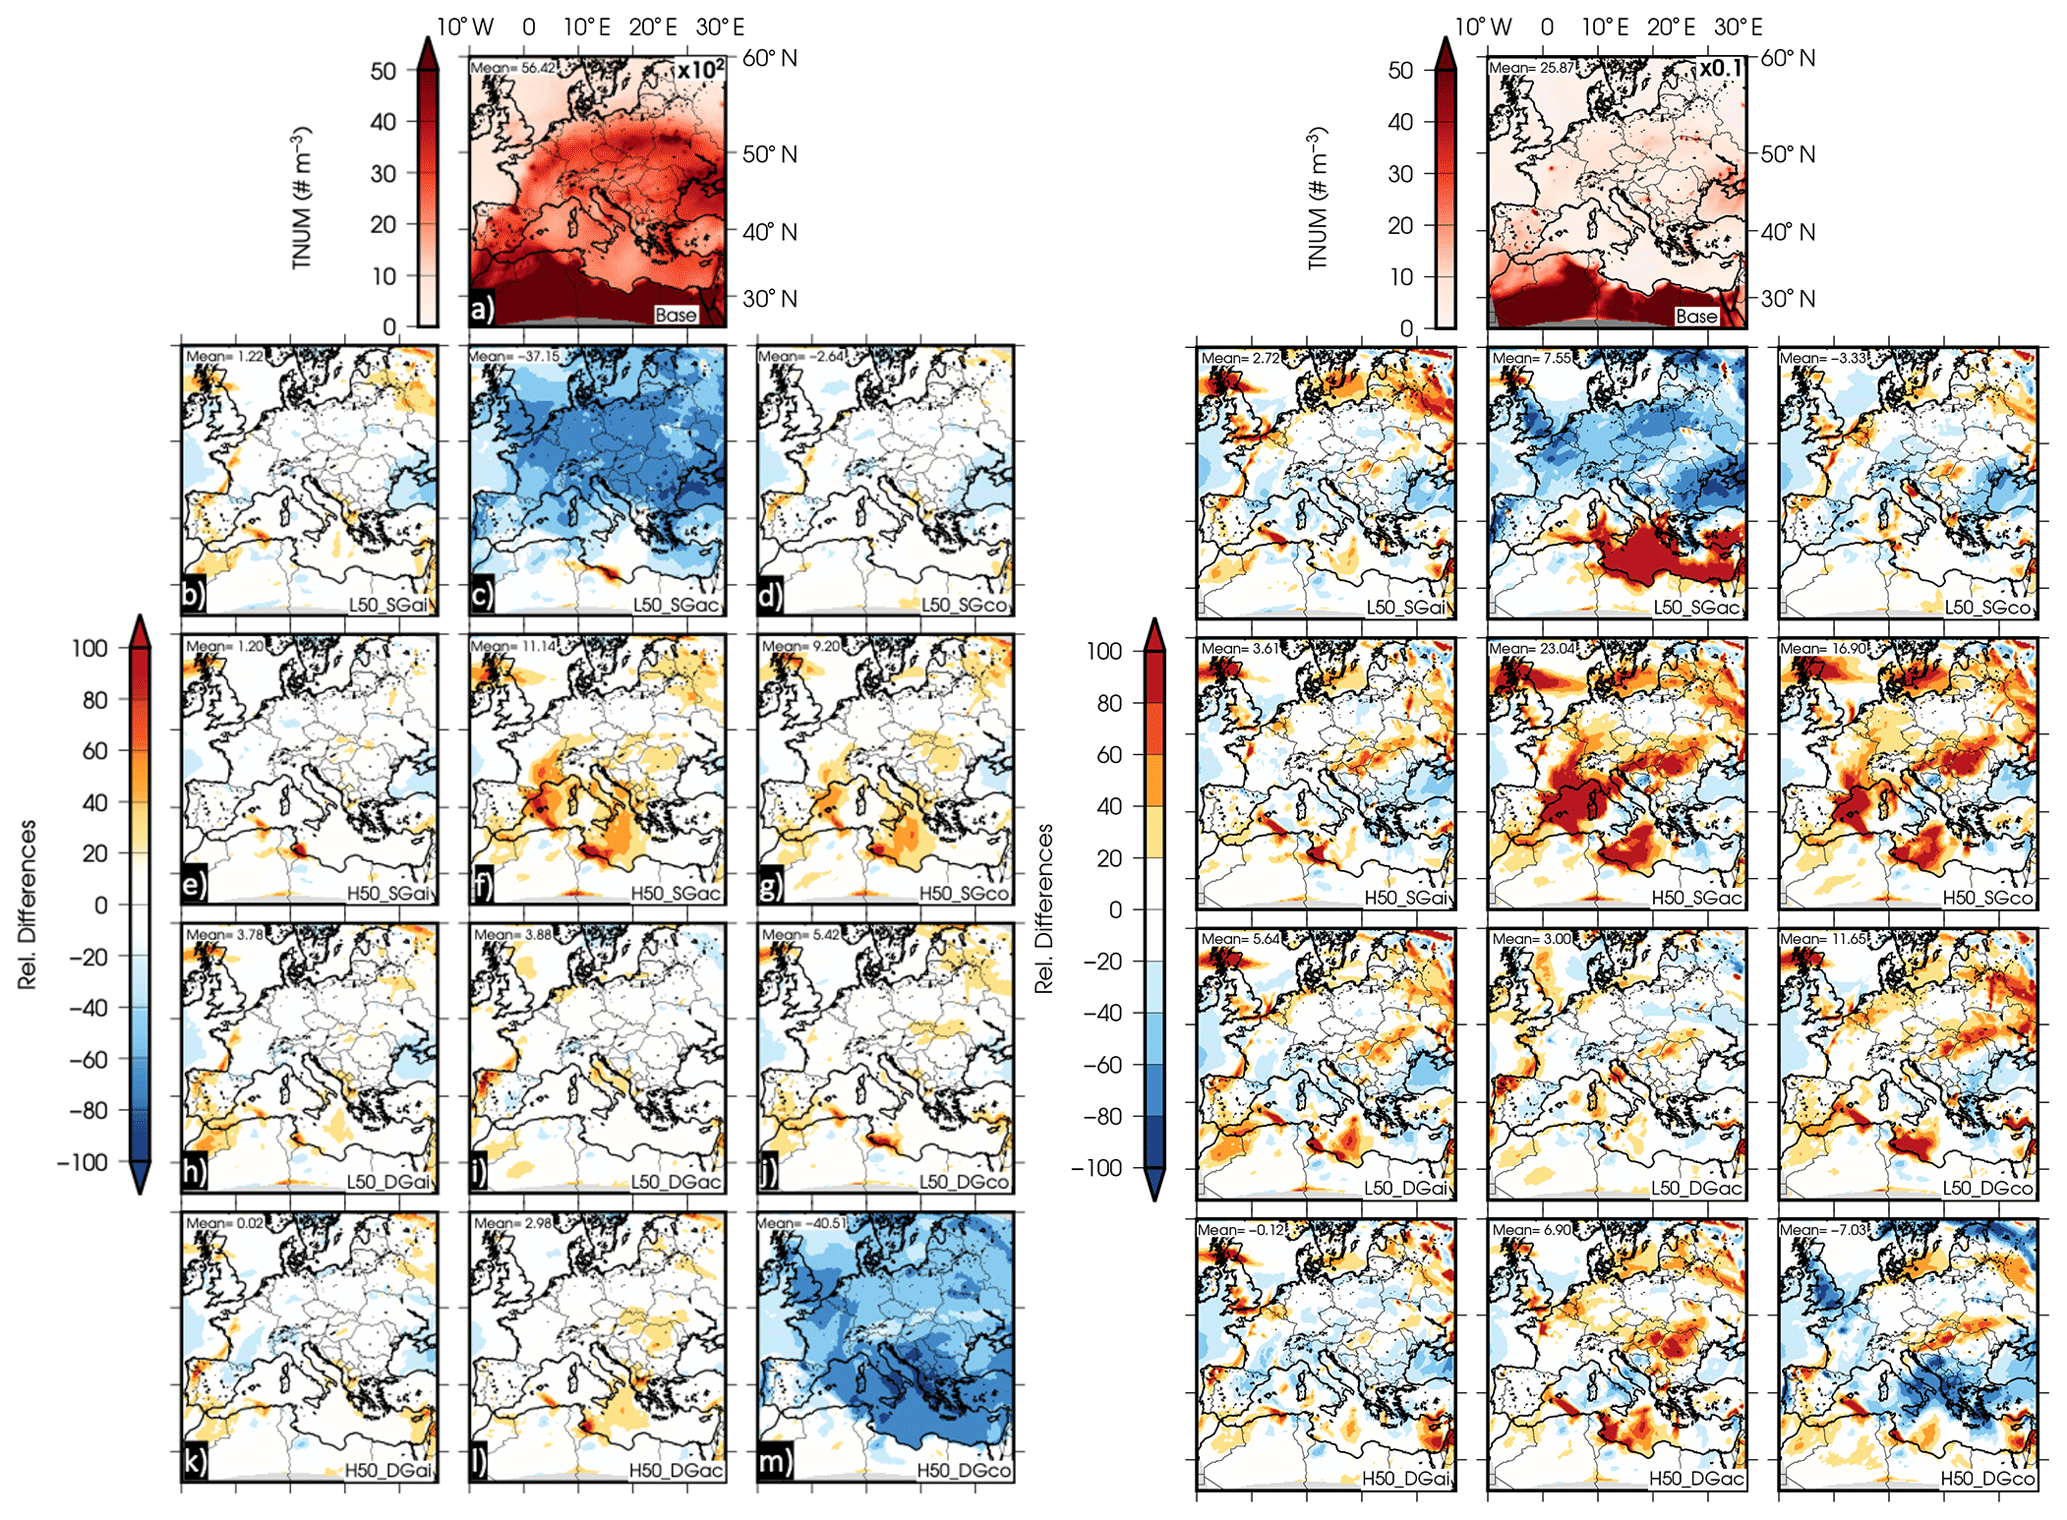
Figure 5Total number concentration of particles at 1000 hPa in the Aitken, accumulation (left), and coarse (right) modes for the base case and relative differences for sensitivity test simulations at 50 %. Accumulation mode: (a) base case; (b) Aitken-mode 50 % reduction in SG; (c) accumulation-mode 50 % reduction in SG; (d) coarse-mode 50 % reduction in SG; (e) Aitken-mode 50 % increase in SG; (f) accumulation-mode 50 % increase in SG; (g) coarse-mode 50 % increase in SG; (h) Aitken-mode 50 % reduction in DG; (i) accumulation-mode 50 % reduction in DG; (j) coarse-mode 50 % reduction in DG; (k) Aitken-mode 50 % increase in DG; (l) accumulation-mode 50 % increase in DG; (m) coarse-mode 50 % increase in DG. (n–z) The same for the coarse mode.
For the selected cases, Fig. 4 shows an inverse behavior of the PM ratio with respect to AOD. The experiment decreasing the standard deviation in the representation of the accumulation mode (L50_SGac) presents a reduction up to −0.45 in the PM ratio (that is, coarse particles become predominant) over the eastern Mediterranean Basin, which matches the increase modeled for AOD. This behavior is also reproduced aloft (at 750 hPa, Fig. S5) and is consistent with the sensitivities of 20 % and 10 % (Fig. S6). However, for the other experiments the response is weaker.
The experiment decreasing the geometric diameter of the accumulation mode (L50_DGac) does not lead to large differences. This experiment shows a slight increase in the PM ratio (around 0.05) over the western Mediterranean and central Europe, which points to a slight increase in fine particles, and a limited decrease (around −0.05) in the PM ratio over Italy, Hungary, and Romania.
Finally, the experiment increasing the geometric diameter of the coarse mode (H50_DGco) produces a different response. Although this experiment presents lower values (up to −0.25) for the PM ratio over most of the target domain, hence highlighting the increase in the predominance of coarse particles, AOD is also lower (in particular over central Europe).
In order to understand these changes, Fig. 5 exhibits the total number concentration of particles at 1000 hPa in the Aitken+accumulation (summed) and coarse modes as well as the relative differences between the different experiments and the base case for the sensitivity tests modifying the parameters by 50 %. Figure 6 is similar to Fig. 5 but for total mass concentration. Aloft particles (750 hPa, Fig. S7), sensitivities (20 % and 10 %), and nonrelative differences are available for both total number and mass concentration in Figs. S8 to S17.
The experiments reducing the standard deviation in the accumulation mode (L50_SGacc) and its analogous lower modifications, L20_SGac and L10_SGac, show a similar response that becomes stronger the larger the modification is. Because of that, only L50_SGacc is analyzed in this contribution as it is representative of changes in SGacc. This experiment leads to a reduction in the total number concentrations (up to −80 % for the Aitken and accumulation modes and −60 % of the base case for the coarse particles) and total mass (up to −60 % of the base case for the Aitken and the accumulation modes and −40 % for the coarse mode) over the European continent for all the modes. However, a reduction in the total number concentration is found over the Mediterranean and over eastern and western areas for the Aitken and accumulations modes. An increase is depicted over the central and western Mediterranean for the coarse mode (higher than 80 % with respect to the base case). This increase in the total number concentration of the coarse mode could explain the decrease estimated for the PM ratio and thus the increase in AOD as particles become larger. The reduction in both modes explains the observed decrease in AOD as the number and mass of particles decrease, which does not lead to modifications in the PM ratio because the total number concentration decreases in both modes.
These changes could be attributed to a narrowed distribution of the accumulation mode. This leads to an increase in the number (and mass) of particles in the coarse mode. This increase presents two different scenarios: (1) over the central Mediterranean Sea, where fine particles dominate, the number of particles in the coarse mode increases and this type of particle dominates, resulting in an increase in AOD since particles become larger. (2) Over the European continent, where coarse particles come predominantly from the Saharan desert dust outbreak, two aspects have to be highlighted: on the one hand, particles are removed from the accumulation mode due to a narrowed size distribution; on the other hand, an increase in the total number concentration is expected, but this increase favors deposition and finally also results in a reduction (smaller than for the accumulation mode) of the total number concentration in the coarse mode. This preferential removal during atmospheric transport of coarse particles was previously observed by Maring et al. (2003). This reduction does not result in a significantly different PM ratio because fine particles and coarse particles are removed, but it leads to a decrease in AOD due to a reduction in total mass concentration (see Fig. 6).
These changes could also be ascribed to modifications in atmospheric transport patterns caused by ARIs and ACIs (taken into account in the simulations), which could alter atmospheric dynamics. However, changes in the sea level pressure (SLP; see Fig. S18), a proxy for changes in the atmospheric transport patterns, are negligible when compared to other works that attribute changes in AOD to modifications in atmospheric dynamics (e.g., Palacios-Peña et al., 2019b).
For the experiment reducing the geometric diameter of the accumulation mode (L50_DGac), the PM ratio as well as the total number of particles (Fig. 5) and mass (Fig. 6) concentrations do not show remarkable differences with respect to the base case (< 20 %). Thus, the reduction observed in AOD can be attributed to the reduction in the diameter assumed by the lognormal distribution in the accumulation mode. Hence, although mass and number concentrations are similar, the model is assuming that particles in the accumulation mode are smaller than in the base case, leading to a lower AOD.
Finally, the sensitivity experiment increasing the geometric diameter of the coarse mode (H50_DGco) leads to a general reduction of AOD, which in this case is associated with a reduction in the PM ratio. The sum of Aitken and accumulation modes exhibits a reduction up to −60 % of the total number concentration with respect to the base case over most of the domain. However, for the coarse mode, the total number concentration remains roughly constant. Thus, the reduction in AOD comes from the decrease in the total number concentration in the Aitken and accumulation modes. It should be highlighted that while in the coarse mode the total number concentration remains constant, the total mass concentration increases (> 80 % with respect to the base case over certain areas), likely because particles with a higher diameter are considered. Similar results were found by Porter and Clarke (1997), whose data demonstrated that both accumulation- and coarse-mode particles gradually shifted to larger diameters as the aerosol mass increased. The reduction of mass and number in the Aitken and accumulation modes comes from a redistribution through the total size distribution caused by the increase in the coarse diameter, which produces a relocation of number and mass particles from the finer modes to the coarser.
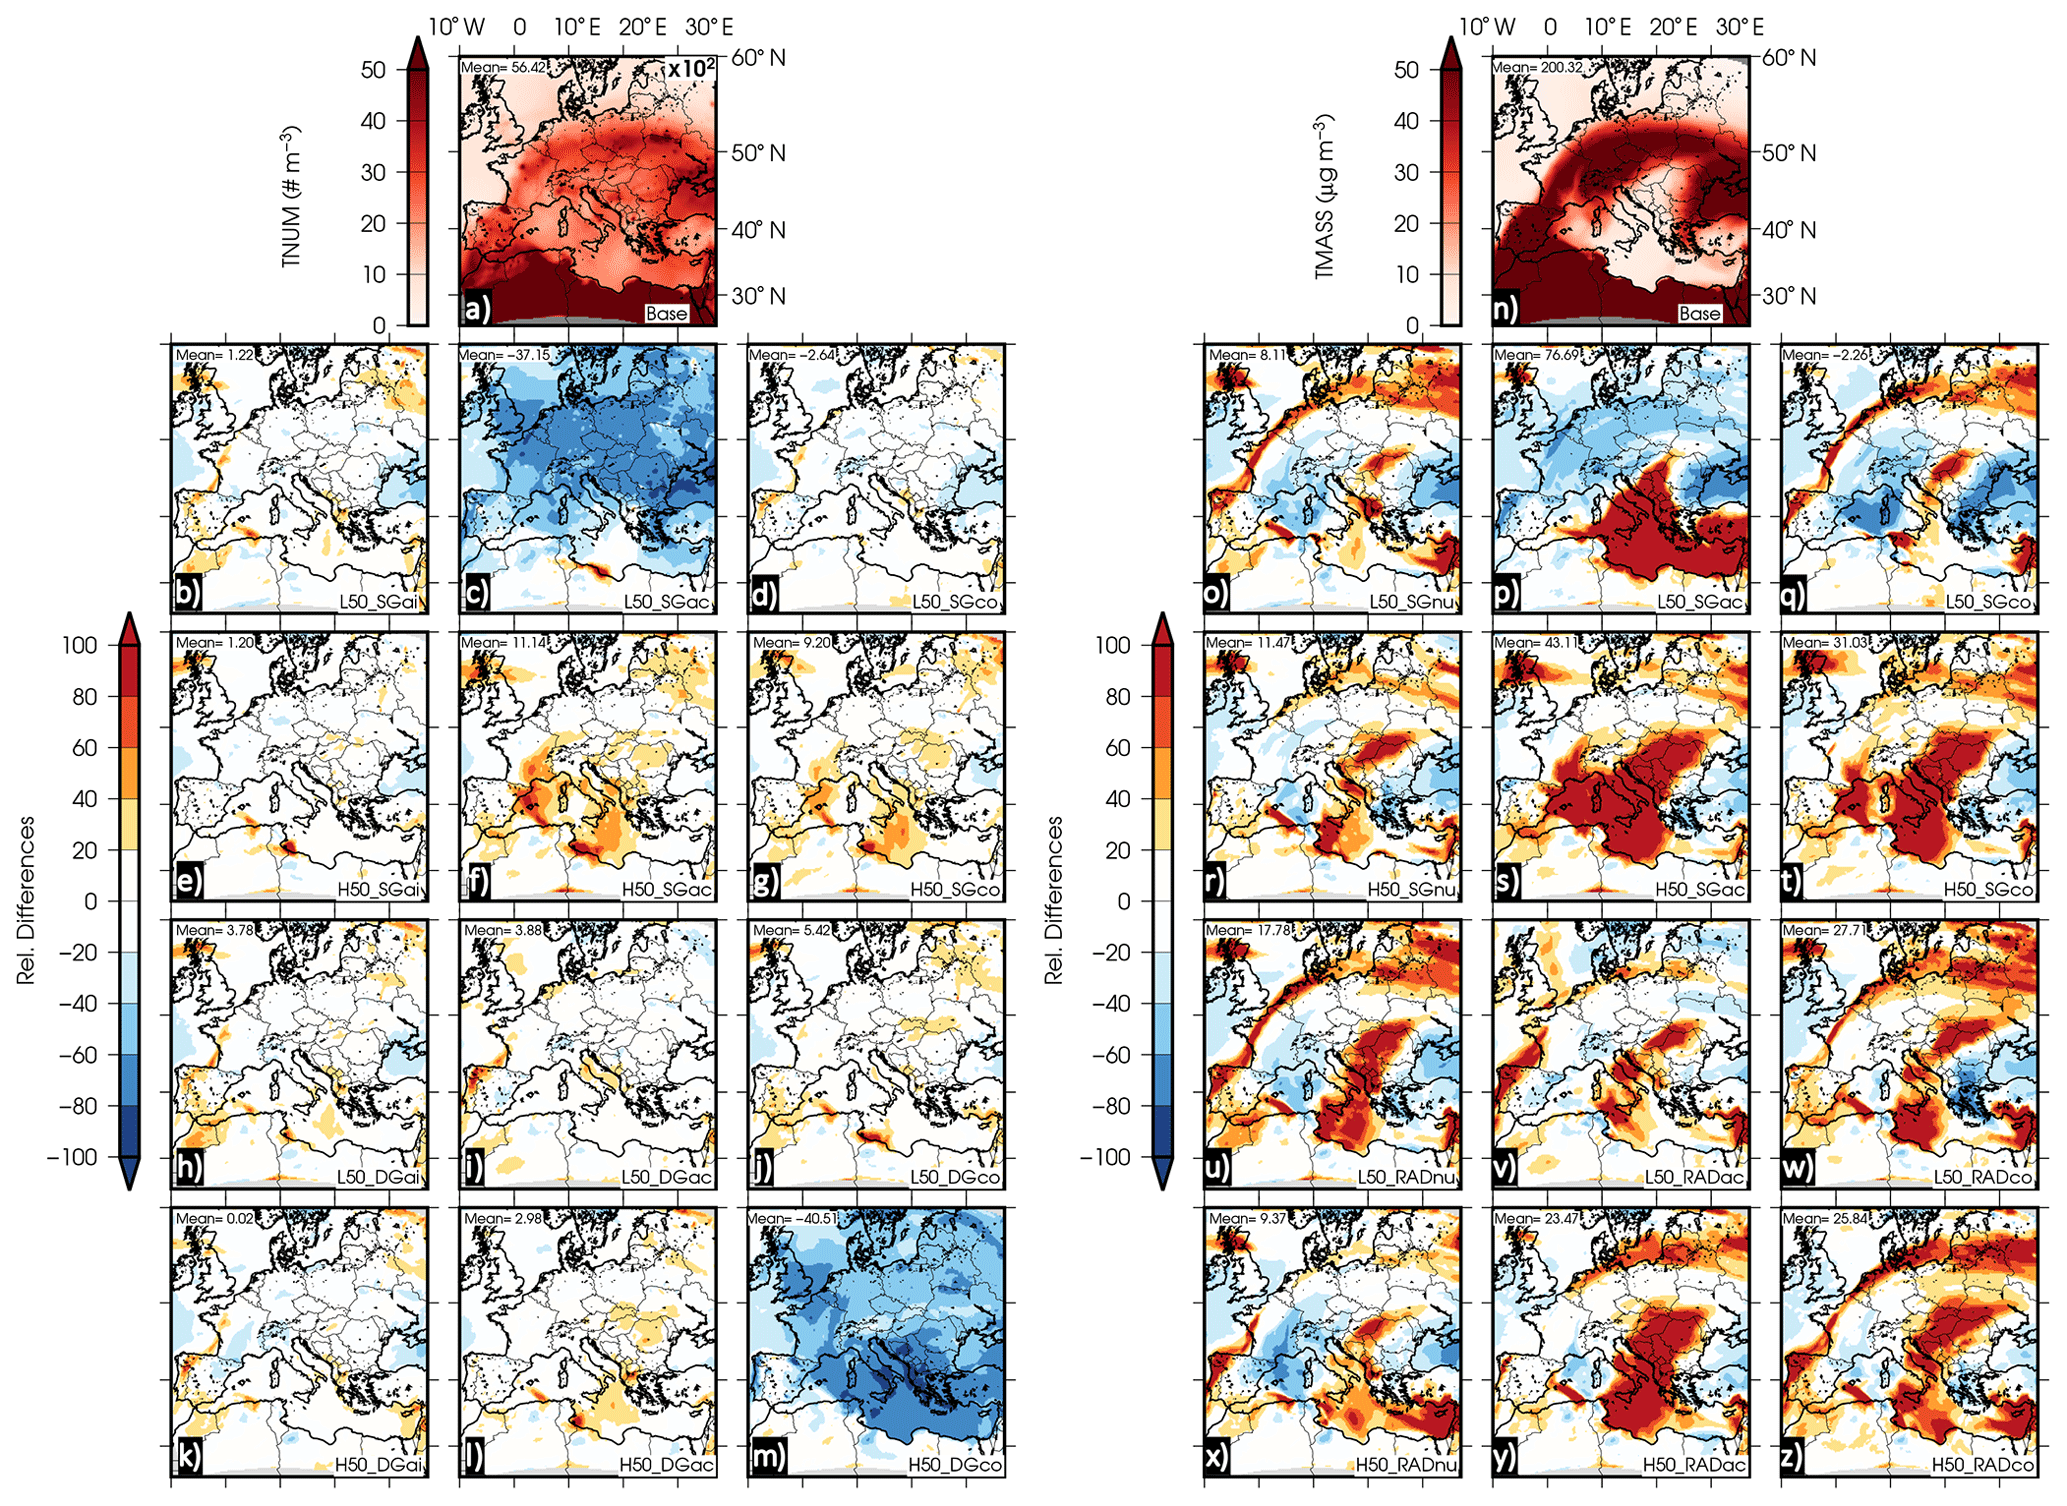
Figure 6Same as Fig. 5 but for total mass concentration. Accumulation mode: (a) base case; (b) Aitken-mode 50 % reduction in SG; (c) accumulation-mode 50 % reduction in SG; (d) coarse-mode 50 % reduction in SG; (e) Aitken-mode 50 % increase in SG; (f) accumulation-mode 50 % increase in SG; (g) coarse-mode 50 % increase in SG; (h) Aitken-mode 50 % reduction in DG; (i) accumulation-mode 50 % reduction in DG; (j) coarse-mode 50 % reduction in DG; (k) Aitken-mode 50 % increase in DG; (l) accumulation-mode 50 % increase in DG; (m) coarse-mode 50 % increase in DG. (n–z) The same for the coarse mode.
3.4 Discussion: uncertainties in DG and SG regarding observations of aerosol size distributions
A question arising from the results presented so far relies not only on which modification presents the highest sensitivity for modifying AOD, but also how the modifications implemented in the GOCART aerosol scheme (which assumes the fixed size distribution defined in Table 2 for each experiment) compare with observations. In this sense, this section tries to shed some light on the relationship between the findings presented here and observed aerosol size distributions available in the scientific literature. To cope with that, Table 3 summarizes the observed DG and SG found through a comprehensive literature review and selecting those works using the same definition of the lognormal function as that described in Eq. (1).
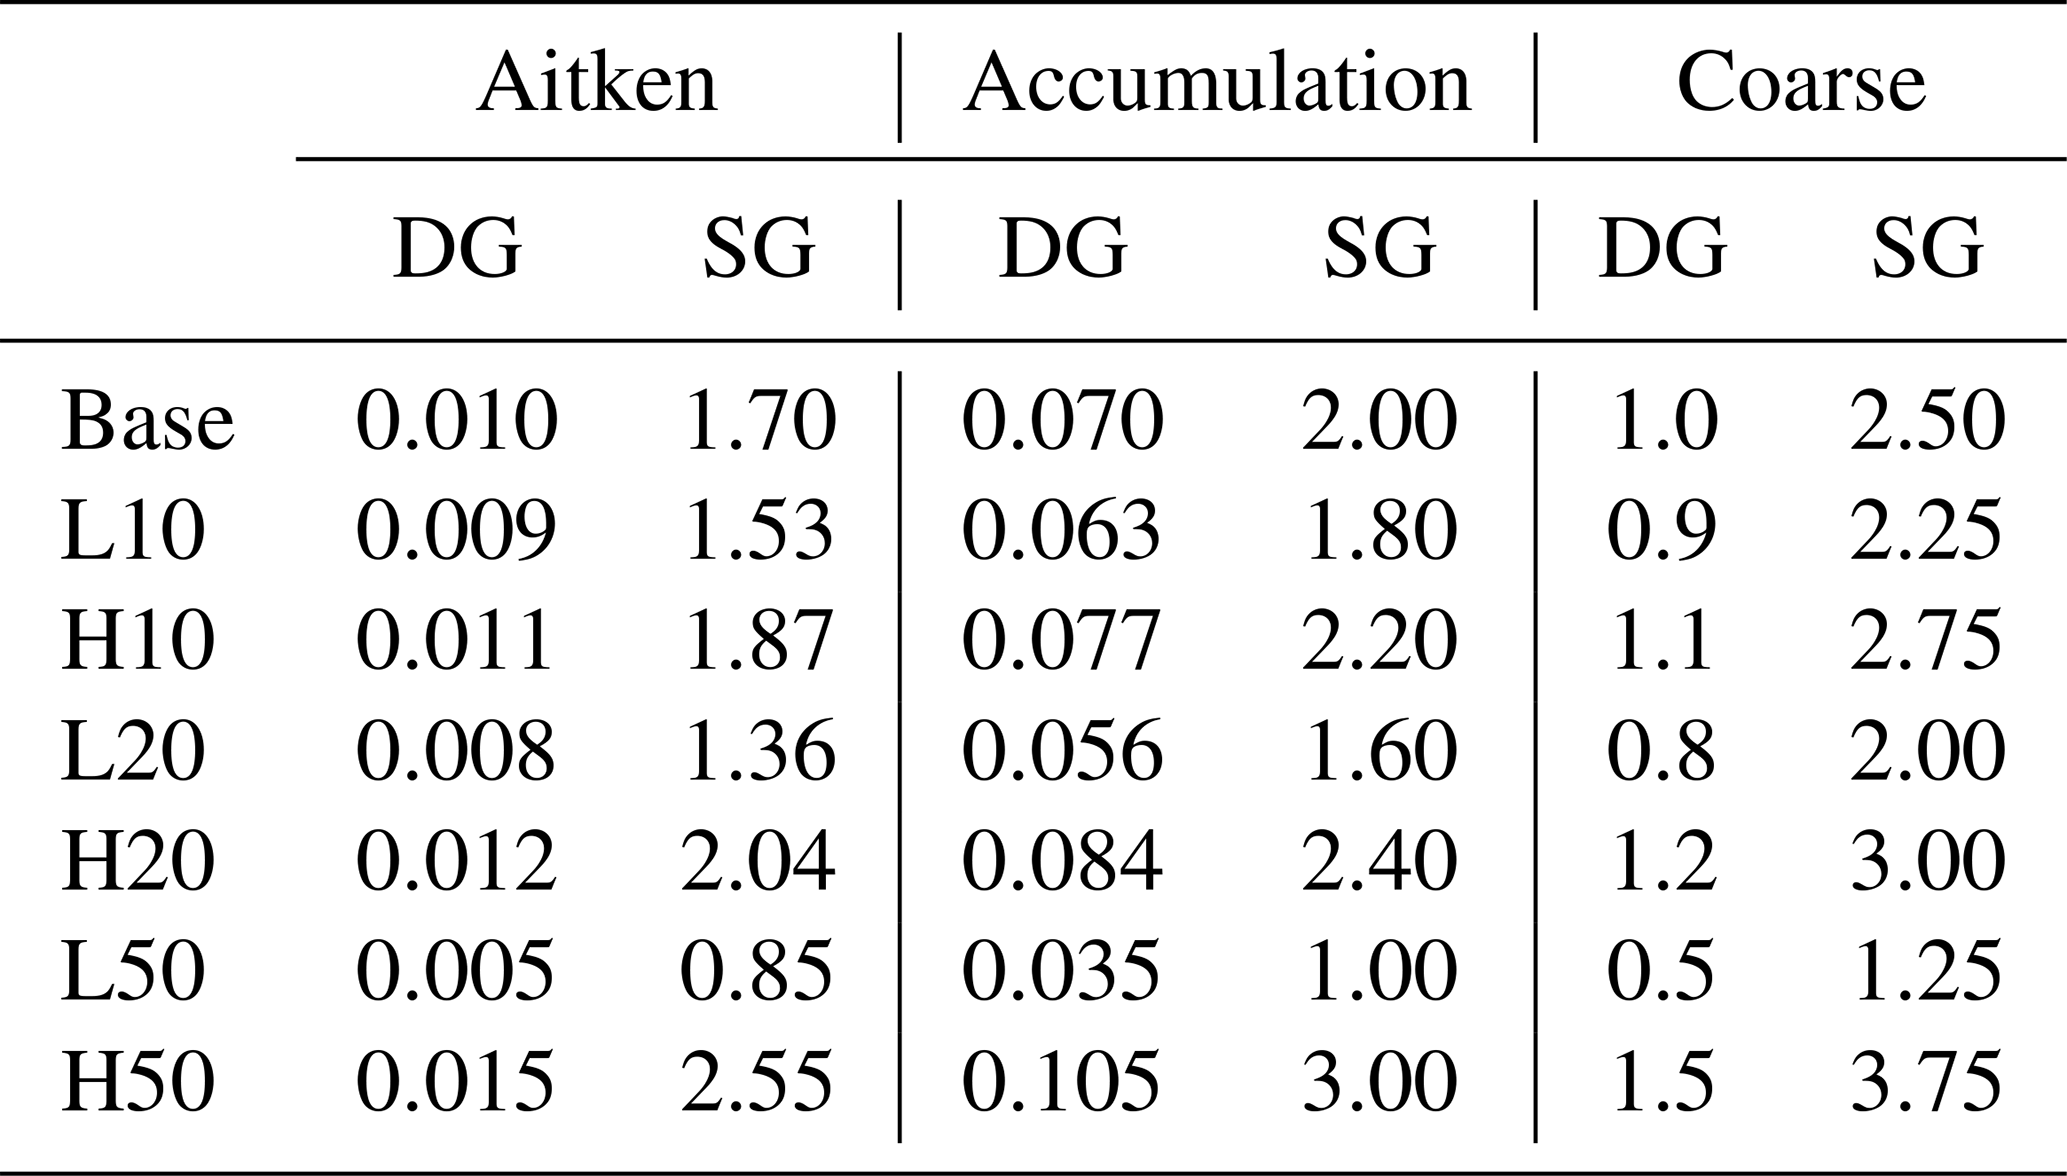
Table 3 is representative of the large uncertainty in characterizing the different modes of aerosol distributions. These values have been derived from a wide range of environments and over different locations worldwide. Regarding the geometric diameter, none of the works reviewed display a three-mode size distribution analogous to the parameters used in GOCART (base case). However, some similarities can be found. Regarding the smallest particles, the GOCART model represents the only mode (Aitken) whose values are similar to those modes referred to by Covert et al. (1996) as ultrafine and Mäkelä et al. (2000) and by Rissler et al. (2006) as nucleation. Vakkari et al. (2013) found similar but higher values for an ultrafine–nucleation mode. Thus, experiments in which DG increases (H10, H20, and H50_DGai) will a priori represent better this mode. However, even the H50_DGai experiment displays lower values (0.015) than those found by Tunved et al. (2003) (0.0294 and 0.0308) in the boundary layer over the Scandinavian Peninsula. So the GOCART model seems to be underestimating the DG for the Aitken mode over the target domain, and the H50_DGai could contribute to enhancing the skills of the modeling results.
The so-called Aitken mode by Covert et al. (1996), Mäkelä et al. (2000), Tunved et al. (2003), Rissler et al. (2006), and Brock et al. (2011) shows a similar value as mode 2 in Porter and Clarke (1997), Vakkari et al. (2013), and Marinescu et al. (2019). These values are slightly smaller than or in the range of the mode called accumulation and are expected to improve the representation of this mode. Moreover, the decrease in the DG for the accumulation mode is one of the cases with remarkable differences for AOD. Thus, special attention should be paid to a correct definition of this mode.
Whitby et al. (1972)Whitby (1978)Covert et al. (1996)Porter and Clarke (1997)Mäkelä et al. (2000)Deshler et al. (2003)Tunved et al. (2003)Rissler et al. (2006)Petzold et al. (2007)Brock et al. (2011)Vakkari et al. (2013)Brock et al. (2016)Marinescu et al. (2019)Table 3Summary of published observed lognormal size distribution parameters. ND = No data.

a Niger; b Cape Verde; c Israel; d Amazon region; e South Africa; f mean of nine cases; g winter: September–February mean, summer: March–August mean over different locations. h BL: boundary layer; i FT: free troposphere; j nu: nucleation, ul: ultrafine.
Finally, the model used in this contribution considers a coarse mode with DG 1 µm. Again, this value might be underestimated because the literature reviewed (Table 3) found DG for the coarse mode with values higher than 2 µm (maximum value of 1.5 µm in our H50 experiment) and up to 30. Thus, particles in our model are modeled smaller than those generally observed. Moreover, the increase in the DG in the coarse mode is one of the cases in which AOD shows noticeable differences. Marinescu et al. (2019) found a mode 4 with DG lower than but close to the coarse mode in our simulations. Hence, increasing the DG in the coarse mode in the GOCART model could improve the results of AOD in our simulations.
Values of SG in our base case are similar to those reported by Whitby (1978). However, observed SG values are highly uncertain. Most of these works found SG values lower than those used in our base case for all of the modes: (1) ultrafine–nucleation, which corresponds with our Aitken; and (2) Aitken and accumulation, which are represented by our accumulation and coarse modes. Tunved et al. (2003) observed SG values similar to the ones used for the Aitken mode in the base case (1.70) in both winter and summer in the boundary layer over the Scandinavian Peninsula. However, this value is underestimated in comparison with the measurements carried out by Rissler et al. (2006), Vakkari et al. (2013), and Marinescu et al. (2019).
Whitby et al. (1972) is the only work in which the SG value is higher than 2 for the accumulation mode. The rest of the works reported lower values than the value used by GOCART in the base case. Probably because of that, the reduction of this parameter is the case that shows a higher influence in AOD representation (for all the experiments 10 %, 20 %, and 50 %). As also happened for the accumulation mode, the SG in the base case for the coarse mode is highly overpredicted by the model when comparing its value with observations available in the literature.
Aerosol size distribution is, among others, a key property of atmospheric aerosols that importantly determines aerosol interactions with radiation and clouds, since optical properties (e.g., AOD) strongly depend on aerosol size distribution. Moreover, this distribution exerts a strong influence on ARIs and their associated radiative forcing. Hence, the main objective of this contribution is to study the impact of the representation of aerosol size distribution on aerosol optical properties over central Europe, particularly over the Mediterranean Basin, during summertime. The case study has been selected because the Mediterranean Basin presents intense formation, accumulation, and recirculation of aerosols from different sources, which are intensified during this summer episode.
In order to fulfill the objectives, a sensitivity test has been carried out by perturbing the parameters defining a lognormal size distribution (± 10 %, 20 %, and 50 %). The sensitivity experiments reveal that modifying (lowering) the standard deviation of the accumulation mode (L_SGac) presents the highest sensitivity with respect to the AOD representation. This modification provokes a narrowed distribution in the accumulation mode, resulting in two different scenarios: (1) over those areas where fire particles predominate in the base case, the transfer of particles from the accumulation to the coarse mode results in an increase in the total number and mass in the latter mode and an increase in AOD. (2) Over those areas where coarse particles dominate, particles are transferred from the accumulation to the coarse mode, although this favors the removal of particles, reducing the total number and mass and hence the levels of AOD. This removal of particles of the coarse mode during atmospheric transport was previously observed by Maring et al. (2003).
The reduction of the standard deviation of the accumulation mode is the only experiment in which all of the sensitivities tests run present important influences on AOD. Moreover, the response for all of the sensitivities is similar and increases as the modification becomes larger.
The rest of the sensitivity experiments only show significant differences when modifying the target parameters by 50 %. The experiment in which the diameter of the coarse mode is increased (H50_DGco) exerts the largest influence on AOD levels. For this experiment, a redistribution through the total size distribution occurs due to the increase in the coarse diameter, which produces a relocation of number and mass particles from the finer modes to the coarse. The other experiment showing an important response to the perturbations of the sensitivity test is the case in which the diameter of the accumulation mode is decreased (L50_DGac). Here, the reduction observed in AOD could be attributed to the reduction of the diameter assumed by the lognormal distribution of the accumulation mode. Hence, although mass and number concentrations are similar, the model is assuming that particles in the accumulation mode are smaller than in the base case, leading to a reduction of AOD.
The comparison of size distribution parameters (DG and SG) in the simulations and observations reveals that, generally, the base case underestimates the geometric diameter in all modes. This underestimation is even more noticeable for the coarse mode. Moreover, a mode is missed for the fine particles. While the model includes two modes (Aitken and accumulation) for particles smaller than 1 µm, observations indicate the presence of three modes (ultrafine–nucleation, Aitken, and accumulation). The differences found in the experiments when the DG is modified in the accumulation and coarse mode evince the need to carefully consider the definition of the value of this parameter in GOCART.
On the other hand, the modifications made to the standard deviation of the accumulation mode in the sensitivity experiments highly influence the AOD levels. This fact, together with the high uncertainty when measuring this parameter (as reported by observations), should be taken into account in order to improve the representation of size distribution in aerosol models (particularly in those using a fixed size distribution such as GOCART).
This contribution identifies those cases in which AOD exhibits a higher sensitivity to the target parameters. However, further experiments are needed in order to improve the representation of size distribution in models by using observational data (information for DG and SG from in situ and remote sensing observations). Although a more accurate fixed size distribution could be defined, the use of any fixed distribution has some limitations since aerosol size varies in space and time. The improvement of this representation will reduce the uncertainty associated with the effects of aerosols on climate, in particular related to ARIs.
The WRF-Chem code used to perform this work and the data presented here are available at https://doi.org/10.5281/zenodo.3768076 (Palacios-Peña et al., 2020b).
The supplement related to this article is available online at: https://doi.org/10.5194/gmd-13-5897-2020-supplement.
LPP wrote the paper with contributions from PJG. LPP, PJG, and JDF designed the experiments; LPP conducted the numerical simulations and compiled all the experiments. LPP did the analysis with the support of JDF, EPS, and PJG.
The authors declare that they have no conflict of interest.
The authors are grateful to the WRF-Chem development community and the G-MAR research group at the University of Murcia for the fruitful scientific discussions, especially Juan Pedro Montávez.
This research has been supported by the Spanish Ministry of the Economy and Competitiveness together with the European Regional Development Fund (ERDF/FEDER) (grant nos. CGL2017-87921-R and EST18/00718) and the Spanish Ministry of Education, Culture and Sports.
This paper was edited by Augustin Colette and reviewed by two anonymous referees.
Ackerman, T. P. and Toon, O. B.: Absorption of visible radiation in atmosphere containing mixtures of absorbing and nonabsorbing particles, Appl. Opt., 20, 3661–3668, https://doi.org/10.1364/AO.20.003661, 1981. a
Ackermann, I. J., Hass, H., Memmesheimer, M., Ebel, A., Binkowski, F. S., and Shankar, U.: Modal aerosol dynamics model for Europe: Development and first applications, Atmos. Environ., 32, 2981–2999, https://doi.org/10.1016/S1352-2310(98)00006-5, 1998. a
Andreae, M. and Rosenfeld, D.: Aerosol–cloud–precipitation interactions. Part 1. The nature and sources of cloud-active aerosols, Earth-Sci. Rev., 89, 13–41, https://doi.org/10.1016/j.earscirev.2008.03.001, 2008. a
Andreae, M. O. and Merlet, P.: Emission of trace gases and aerosols from biomass burning, Global Biogeochem. Cy., 15, 955–966, https://doi.org/10.1029/2000GB001382, 2001. a
Andreae, T. W., Andreae, M. O., Ichoku, C., Maenhaut, W., Cafmeyer, J., Karnieli, A., and Orlovsky, L.: Light scattering by dust and anthropogenic aerosol at a remote site in the Negev desert, Israel, J. Geophys. Res.-Atmos., 107, 4008, https://doi.org/10.1029/2001JD900252, 2002. a
Balzarini, A., Pirovano, G., Honzak, L., Ẑabkar, R., Curci, G., Forkel, R., Hirtl, M., San José, R., Tuccella, P., and Grell, G.: WRF-Chem model sensitivity to chemical mechanisms choice in reconstructing aerosol optical properties, Atmos. Environ., 115, 604–619, https://doi.org/10.1016/j.atmosenv.2014.12.033, 2015. a
Barnard, J. C., Fast, J. D., Paredes-Miranda, G., Arnott, W. P., and Laskin, A.: Technical Note: Evaluation of the WRF-Chem ”Aerosol Chemical to Aerosol Optical Properties” Module using data from the MILAGRO campaign, Atmos. Chem. Phys., 10, 7325–7340, https://doi.org/10.5194/acp-10-7325-2010, 2010. a, b
Bian, H., Tie, X., Cao, J., Ying, Z., Han, S., and Xue, Y.: Analysis of a Severe Dust Storm Event over China: Application of the WRF-Dust Model, Aerosol Air Qual. Res., 11, 419–428, https://doi.org/10.4209/aaqr.2011.04.0053, 2011. a
Bohren, C. F. and Huffman, D. R.: Absorption and Scattering of Light by Small Particles, John Wiley & Sons, Ltd, 530 pp., https://doi.org/10.1002/9783527618156, 2007. a
Boucher, O.: Atmospheric Aerosols: Properties and Climate Impacts, Springer Netherlands, xVII, 311 pp., https://doi.org/10.1007/978-94-017-9649-1, 2015. a
Boucher, O. and Anderson, T. L.: General circulation model assessment of the sensitivity of direct climate forcing by anthropogenic sulfate aerosols to aerosol size and chemistry, J. Geophys. Res.-Atmos., 100, 26117–26134, https://doi.org/10.1029/95JD02531, 1995. a
Boucher, O., Schwartz, S. E., Ackerman, T. P., Anderson, T. L., Bergstrom, B., Bonnel, B., Chýlek, P., Dahlback, A., Fouquart, Y., Fu, Q., Halthore, R. N., Haywood, J. M., Iversen, T., Kato, S., Kinne, S., Kirkevåg, A., Knapp, K. R., Lacis, A., Laszlo, I., Mishchenko, M. I., Nemesure, S., Ramaswamy, V., Roberts, D. L., Russell, P., Schlesinger, M. E., Stephens, G. L., Wagener, R., Wang, M., Wong, J., and Yang, F.: Intercomparison of models representing direct shortwave radiative forcing by sulfate aerosols, J. Geophys. Res.-Atmos., 103, 16979–16998, https://doi.org/10.1029/98JD00997, 1998. a
Boucher, O., Randall, D., Artaxo, P., Bretherton, C., Feingold, G., Forster, P., Kerminen, V.-M., Kondo, Y., Liao, H., Lohmann, U., Rasch, P., Satheesh, S., Sherwood, S., Stevens, B., and Zhang, X.: Clouds and aerosols, in: Climate Change 2013: The Physical Science Basis. Contribution of Working Group I to the Fifth Assessment Report of the Intergovernmental Panel on Climate Change, edited by: Stocker, T., Qin, D., Plattner, G.-K., Tignor, M., Allen, S., Boschung, J., Nauels, A., Xia, Y., Bex, V., , and Midgley, P., 571–657, Cambridge University Press, Cambridge University Press, Cambridge, United Kingdom and New York, NY, USA, 2013. a
Brock, C. A., Cozic, J., Bahreini, R., Froyd, K. D., Middlebrook, A. M., McComiskey, A., Brioude, J., Cooper, O. R., Stohl, A., Aikin, K. C., de Gouw, J. A., Fahey, D. W., Ferrare, R. A., Gao, R.-S., Gore, W., Holloway, J. S., Hübler, G., Jefferson, A., Lack, D. A., Lance, S., Moore, R. H., Murphy, D. M., Nenes, A., Novelli, P. C., Nowak, J. B., Ogren, J. A., Peischl, J., Pierce, R. B., Pilewskie, P., Quinn, P. K., Ryerson, T. B., Schmidt, K. S., Schwarz, J. P., Sodemann, H., Spackman, J. R., Stark, H., Thomson, D. S., Thornberry, T., Veres, P., Watts, L. A., Warneke, C., and Wollny, A. G.: Characteristics, sources, and transport of aerosols measured in spring 2008 during the aerosol, radiation, and cloud processes affecting Arctic Climate (ARCPAC) Project, Atmos. Chem. Phys., 11, 2423–2453, https://doi.org/10.5194/acp-11-2423-2011, 2011. a, b
Brock, C. A., Wagner, N. L., Anderson, B. E., Beyersdorf, A., Campuzano-Jost, P., Day, D. A., Diskin, G. S., Gordon, T. D., Jimenez, J. L., Lack, D. A., Liao, J., Markovic, M. Z., Middlebrook, A. M., Perring, A. E., Richardson, M. S., Schwarz, J. P., Welti, A., Ziemba, L. D., and Murphy, D. M.: Aerosol optical properties in the southeastern United States in summer – Part 2: Sensitivity of aerosol optical depth to relative humidity and aerosol parameters, Atmos. Chem. Phys., 16, 5009–5019, https://doi.org/10.5194/acp-16-5009-2016, 2016. a
Buseck, P. and Schwartz, S.: 4.04 – Tropospheric Aerosols, in: Treatise on Geochemistry, edited by: Holland, H. D. and Turekian, K. K., 91–142, Pergamon, Oxford, https://doi.org/10.1016/B0-08-043751-6/04178-5, 2003. a
Charlson, R. J., Schwartz, S. E., Hales, J. M., Cess, R. D., Coakley, J. A., Hansen, J. E., and Hofmann, D. J.: Climate Forcing by Anthropogenic Aerosols, Science, 255, 423–430, https://doi.org/10.1126/science.255.5043.423, 1992. a
Chin, M., Ginoux, P., Kinne, S., Torres, O., Holben, B. N., Duncan, B. N., Martin, R. V., Logan, J. A., Higurashi, A., and Nakajima, T.: Tropospheric aerosol optical thickness from the GOCART model and comparisons with satellite and Sun photometer measurements, J. Atmos. Sci., 59, 461–483, https://doi.org/10.1175/1520-0469(2002)059<0461:TAOTFT>2.0.CO;2, 2002. a, b, c, d, e
Claquin, T., Schulz, M., Balkanski, Y., and Boucher, O.: Uncertainties in assessing radiative forcing by mineral dust, Tellus B, 50, 491–505, https://doi.org/10.1034/j.1600-0889.1998.t01-2-00007.x, 1998. a
Covert, D. S., Wiedensohler, A., Aalto, P., Heintzenberg, J., Mcmurry, P. H., and Leck, C.: Aerosol number size distributions from 3 to 500 nm diameter in the arctic marine boundary layer during summer and autumn, Tellus B, 48, 197–212, https://doi.org/10.3402/tellusb.v48i2.15886, 1996. a, b, c
Dee, D. P., Uppala, S. M., Simmons, A. J., Berrisford, P., Poli, P., Kobayashi, S., Andrae, U., Balmaseda, M. A., Balsamo, G., Bauer, P., Bechtold, P., Beljaars, A. C. M., van de Berg, L., Bidlot, J., Bormann, N., Delsol, C., Dragani, R., Fuentes, M., Geer, A. J., Haimberger, L., Healy, S. B., Hersbach, H., Hólm, E. V., Isaksen, L., Kållberg, P., Köhler, M., Matricardi, M., McNally, A. P., Monge-Sanz, B. M., Morcrette, J.-J., Park, B.-K., Peubey, C., de Rosnay, P., Tavolato, C., Thépaut, J.-N., and Vitart, F.: The ERA-Interim reanalysis: Configuration and performance of the data assimilation system, Q. J. Roy. Meteorol. Soc., 137, 553–597, https://doi.org/10.1002/qj.828, 2011. a
Deshler, T., Hervig, M. E., Hofmann, D. J., Rosen, J. M., and Liley, J. B.: Thirty years of in situ stratospheric aerosol size distribution measurements from Laramie, Wyoming (41∘ N), using balloon-borne instruments, J. Geophys. Res.-Atmos., 108, 4167, https://doi.org/10.1029/2002JD002514, 2003. a
Dipu, S., Prabha, T. V., Pandithurai, G., Dudhia, J., Pfister, G., Rajesh, K., and Goswami, B.: Impact of elevated aerosol layer on the cloud macrophysical properties prior to monsoon onset, Atmos. Environ., 70, 454–467, https://doi.org/10.1016/j.atmosenv.2012.12.036, 2013. a
Eck, T. F., Holben, B. N., Reid, J. S., Dubovik, O., Smirnov, A., O'Neill, N. T., Slutsker, I., and Kinne, S.: Wavelength dependence of the optical depth of biomass burning, urban, and desert dust aerosols, J. Geophys. Res.-Atmos., 104, 31333–31349, https://doi.org/10.1029/1999JD900923, 1999. a
Geiger, H., Barnes, I., Bejan, I., Benter, T., and Spittler, M.: The tropospheric degradation of isoprene: an updated module for the regional atmospheric chemistry mechanism, Atmos. Environ., 37, 1503–1519, https://doi.org/10.1016/S1352-2310(02)01047-6, 2003. a
Ghan, S., Laulainen, N., Easter, R., Wagener, R., Nemesure, S., Chapman, E., Zhang, Y., and Leung, R.: Evaluation of aerosoladirect radiative forcing in MIRAGE, J. Geophys. Res.-Atmos., 106, 5295–5316, https://doi.org/10.1029/2000JD900502, 2001. a
Ginoux, P., Chin, M., Tegen, I., Prospero, J. M., Holben, B., Dubovik, O., and Lin, S.-J.: Sources and distributions of dust aerosols simulated with the GOCART model, J. Geophys. Res.-Atmos., 106, 20255–20273, https://doi.org/10.1029/2000JD000053, 2001. a, b, c, d, e
Giorgi, F.: Climate change hot-spots, Geophys. Res. Lett., 33, L08707, https://doi.org/10.1029/2006GL025734, 2006. a
Grell, G. A. and Freitas, S. R.: A scale and aerosol aware stochastic convective parameterization for weather and air quality modeling, Atmos. Chem. Phys., 14, 5233–5250, https://doi.org/10.5194/acp-14-5233-2014, 2014. a
Grell, G. A., Peckham, S. E., Schmitz, R., McKeen, S. A., Frost, G., Skamarock, W. C., and Eder, B.: Fully coupled “online” chemistry within the WRF model, Atmos. Environ., 39, 6957–6975, https://doi.org/10.1016/j.atmosenv.2005.04.027, 2005. a
Guenther, A., Karl, T., Harley, P., Wiedinmyer, C., Palmer, P. I., and Geron, C.: Estimates of global terrestrial isoprene emissions using MEGAN (Model of Emissions of Gases and Aerosols from Nature), Atmos. Chem. Phys., 6, 3181–3210, https://doi.org/10.5194/acp-6-3181-2006, 2006. a
Haywood, J. and Boucher, O.: Estimates of the direct and indirect radiative forcing due to tropospheric aerosols: A review, Rev. Geophys., 38, 513–543, https://doi.org/10.1029/1999RG000078, 2000. a
Heintzenberg, J.: Properties of the Log-Normal Particle Size Distribution, Aerosol Sci. Technol., 21, 46–48, https://doi.org/10.1080/02786829408959695, 1994. a
Hinds, W. C.: Aerosol technology: properties, behavior, and measurement of airborne particles, John Wiley & Sons, 2nd Edn., 504 pp., 2012. a
Hong, S.-Y., Noh, Y., and Dudhia, J.: A New Vertical Diffusion Package with an Explicit Treatment of Entrainment Processes, Mon. Weather Rev., 134, 2318–2341, https://doi.org/10.1175/MWR3199.1, 2006. a
Hu, Z., Huang, J., Zhao, C., Jin, Q., Ma, Y., and Yang, B.: Modeling dust sources, transport, and radiative effects at different altitudes over the Tibetan Plateau, Atmos. Chem. Phys., 20, 1507–1529, https://doi.org/10.5194/acp-20-1507-2020, 2020. a
Iacono, M. J., Delamere, J. S., Mlawer, E. J., Shephard, M. W., Clough, S. A., and Collins, W. D.: Radiative forcing by long-lived greenhouse gases: Calculations with the AER radiative transfer models, J. Geophys. Res.-Atmos., 113, D13103, https://doi.org/10.1029/2008JD009944, 2008. a
Janssens-Maenhout, G., Dentener, F., Van Aardenne, J., Monni, S., Pagliari, V., Orlandini, L., Klimont, Z., Kurokawa, J.-i., Akimoto, H., Ohara, T., Wankmüller, R., Battye, B., Grano, D., Zuber, A., and Keating, T.: EDGAR-HTAP: a harmonized gridded air pollution emission dataset based on national inventories, Tech. rep., European Commission Joint Research Centre Institute for Environment and Sustainability, Luxembourg, #JRC58434, 42 pp., https://doi.org/10.2788/14102, 2012. a
Jish Prakash, P., Stenchikov, G., Kalenderski, S., Osipov, S., and Bangalath, H.: The impact of dust storms on the Arabian Peninsula and the Red Sea, Atmos. Chem. Phys., 15, 199–222, https://doi.org/10.5194/acp-15-199-2015, 2015. a
Kalenderski, S. and Stenchikov, G.: High-resolution regional modeling of summertime transport and impact of African dust over the Red Sea and Arabian Peninsula, J. Geophys. Res.-Atmos., 121, 6435–6458, https://doi.org/10.1002/2015JD024480, 2016. a
Kok, J. F.: A scaling theory for the size distribution of emitted dust aerosols suggests climate models underestimate the size of the global dust cycle, P. Natl. Acad. Sci. USA, 108, 1016–1021, https://doi.org/10.1073/pnas.1014798108, 2011. a
Kumar, R., Barth, M. C., Pfister, G. G., Naja, M., and Brasseur, G. P.: WRF-Chem simulations of a typical pre-monsoon dust storm in northern India: influences on aerosol optical properties and radiation budget, Atmos. Chem. Phys., 14, 2431–2446, https://doi.org/10.5194/acp-14-2431-2014, 2014. a
LeGrand, S. L., Polashenski, C., Letcher, T. W., Creighton, G. A., Peckham, S. E., and Cetola, J. D.: The AFWA dust emission scheme for the GOCART aerosol model in WRF-Chem v3.8.1, Geosci. Model Dev., 12, 131–166, https://doi.org/10.5194/gmd-12-131-2019, 2019. a
Lennartson, E. M., Wang, J., Gu, J., Castro Garcia, L., Ge, C., Gao, M., Choi, M., Saide, P. E., Carmichael, G. R., Kim, J., and Janz, S. J.: Diurnal variation of aerosol optical depth and PM2.5 in South Korea: a synthesis from AERONET, satellite (GOCI), KORUS-AQ observation, and the WRF-Chem model, Atmos. Chem. Phys., 18, 15125–15144, https://doi.org/10.5194/acp-18-15125-2018, 2018. a
Liu, X., Easter, R. C., Ghan, S. J., Zaveri, R., Rasch, P., Shi, X., Lamarque, J.-F., Gettelman, A., Morrison, H., Vitt, F., Conley, A., Park, S., Neale, R., Hannay, C., Ekman, A. M. L., Hess, P., Mahowald, N., Collins, W., Iacono, M. J., Bretherton, C. S., Flanner, M. G., and Mitchell, D.: Toward a minimal representation of aerosols in climate models: description and evaluation in the Community Atmosphere Model CAM5, Geosci. Model Dev., 5, 709–739, https://doi.org/10.5194/gmd-5-709-2012, 2012. a
Mäkelä, J. M., Koponen, I. K., Aalto, P., and Kulmala, M.: ONE-YEAR DATA OF SUBMICRON SIZE MODES OF TROPOSPHERIC BACKGROUND AEROSOL IN SOUTHERN FINLAND, J. Aerosol Sci., 31, 595–611, https://doi.org/10.1016/S0021-8502(99)00545-5, 2000. a, b, c
Marinescu, P. J., Levin, E. J. T., Collins, D., Kreidenweis, S. M., and van den Heever, S. C.: Quantifying aerosol size distributions and their temporal variability in the Southern Great Plains, USA, Atmos. Chem. Phys., 19, 11985–12006, https://doi.org/10.5194/acp-19-11985-2019, 2019. a, b, c, d
Maring, H., Savoie, D. L., Izaguirre, M. A., Custals, L., and Reid, J. S.: Mineral dust aerosol size distribution change during atmospheric transport, J. Geophys. Res.-Atmos., 108, 8592, https://doi.org/10.1029/2002JD002536, 2003. a, b
Millán, M. M., Salvador, R., Mantilla, E., and Kallos, G.: Photooxidant dynamics in the Mediterranean basin in summer: results from European research projects, J. Geophys. Res.-Atmos., 102, 8811–8823, https://doi.org/10.1029/96JD03610, 1997. a
Morrison, H., Thompson, G., and Tatarskii, V.: Impact of Cloud Microphysics on the Development of Trailing Stratiform Precipitation in a Simulated Squall Line: Comparison of One- and Two-Moment Schemes, Mon. Weather Rev., 137, 991–1007, https://doi.org/10.1175/2008MWR2556.1, 2009. a, b
Myhre, G. and Stordal, F.: Global sensitivity experiments of the radiative forcing due to mineral aerosols, J. Geophys. Res.-Atmos., 106, 18193–18204, https://doi.org/10.1029/2000JD900536, 2001. a
Nabat, P., Somot, S., Mallet, M., Sevault, F., Chiacchio, M., and Wild, M.: Direct and semi-direct aerosol radiative effect on the Mediterranean climate variability using a coupled regional climate system model, Clim. Dynam., 44, 1127–1155, https://doi.org/10.1007/s00382-014-2205-6, 2015. a
Obiso, V. and Jorba, O.: Aerosol-radiation interaction in atmospheric models: Idealized sensitivity study of simulated short-wave direct radiative effects to particle microphysical properties, J. Aerosol Sci., 115, 46–61, https://doi.org/10.1016/j.jaerosci.2017.10.004, 2018. a
Obiso, V., Pandolfi, M., Ealo, M., and Jorba, O.: Impact of aerosol microphysical properties on mass scattering cross sections, J. Aerosol Sci., 112, 68–82, https://doi.org/10.1016/j.jaerosci.2017.03.001, 2017. a
Palacios-Peña, L., Baró, R., Guerrero-Rascado, J. L., Alados-Arboledas, L., Brunner, D., and Jiménez-Guerrero, P.: Evaluating the representation of aerosol optical properties using an online coupled model over the Iberian Peninsula, Atmos. Chem. Phys., 17, 277–296, https://doi.org/10.5194/acp-17-277-2017, 2017. a
Palacios-Peña, L., Baró, R., Baklanov, A., Balzarini, A., Brunner, D., Forkel, R., Hirtl, M., Honzak, L., López-Romero, J. M., Montávez, J. P., Pérez, J. L., Pirovano, G., San José, R., Schröder, W., Werhahn, J., Wolke, R., Žabkar, R., and Jiménez-Guerrero, P.: An assessment of aerosol optical properties from remote-sensing observations and regional chemistry–climate coupled models over Europe, Atmos. Chem. Phys., 18, 5021–5043, https://doi.org/10.5194/acp-18-5021-2018, 2018. a
Palacios-Peña, L., Jiménez-Guerrero, P., Baró, R., Balzarini, A., Bianconi, R., Curci, G., Landi, T. C., Pirovano, G., Prank, M., Riccio, A., Tuccella, P., and Galmarini, S.: Aerosol optical properties over Europe: an evaluation of the AQMEII Phase 3 simulations against satellite observations, Atmos. Chem. Phys., 19, 2965–2990, https://doi.org/10.5194/acp-19-2965-2019, 2019a. a
Palacios-Peña, L., Lorente-Plazas, R., Montávez, J. P., and Jiménez-Guerrero, P.: Saharan Dust Modeling Over the Mediterranean Basin and Central Europe: Does the Resolution Matter?, Front. Earth Sci., 7, 290, https://doi.org/10.3389/feart.2019.00290, 2019b. a, b, c, d, e, f, g, h
Palacios-Peña, L., Montávez, J. P., López-Romero, J. M., Jerez, S., Gómez-Navarro, J. J., Lorente-Plazas, R., Ruiz, J., and Jiménez-Guerrero, P.: Added Value of Aerosol-Cloud Interactions for Representing Aerosol Optical Depth in an Online Coupled Climate-Chemistry Model over Europe, Atmosphere, 11, 360, 2020a. a
Palacios-Peña, L., Fast, J. D., Pravia-Sarabia, E., and Jiménez-Guerrero, P.: Data and code of the GMD for review publication Sensitivity of aerosol optical properties to the aerosol size distribution over central Europe and the Mediterranean Basin, Zenodo, https://doi.org/10.5281/zenodo.3768076, 2020b. a
Papadimas, C. D., Hatzianastassiou, N., Matsoukas, C., Kanakidou, M., Mihalopoulos, N., and Vardavas, I.: The direct effect of aerosols on solar radiation over the broader Mediterranean basin, Atmos. Chem. Phys., 12, 7165–7185, https://doi.org/10.5194/acp-12-7165-2012, 2012. a
Pérez, C., Sicard, M., Jorba, O., Comerón, A., and Baldasano, J. M.: Summertime re-circulations of air pollutants over the north-eastern Iberian coast observed from systematic EARLINET lidar measurements in Barcelona, Atmos. Environ., 38, 3983–4000, https://doi.org/10.1016/j.atmosenv.2004.04.010, 2004. a
Petzold, A., Weinzierl, B., Huntrieser, H., Stohl, A., Real, E., Cozic, J., Fiebig, M., Hendricks, J., Lauer, A., Law, K., Roiger, A., Schlager, H., and Weingartner, E.: Perturbation of the European free troposphere aerosol by North American forest fire plumes during the ICARTT-ITOP experiment in summer 2004, Atmos. Chem. Phys., 7, 5105–5127, https://doi.org/10.5194/acp-7-5105-2007, 2007. a
Porter, J. N. and Clarke, A. D.: Aerosol size distribution models based on in situ measurements, J. Geophys. Res.-Atmos., 102, 6035–6045, https://doi.org/10.1029/96JD03403, 1997. a, b, c
Querol, X., Alastuey, A., Pey, J., Cusack, M., Pérez, N., Mihalopoulos, N., Theodosi, C., Gerasopoulos, E., Kubilay, N., and Koçak, M.: Variability in regional background aerosols within the Mediterranean, Atmos. Chem. Phys., 9, 4575–4591, https://doi.org/10.5194/acp-9-4575-2009, 2009. a
Rissler, J., Vestin, A., Swietlicki, E., Fisch, G., Zhou, J., Artaxo, P., and Andreae, M. O.: Size distribution and hygroscopic properties of aerosol particles from dry-season biomass burning in Amazonia, Atmos. Chem. Phys., 6, 471–491, https://doi.org/10.5194/acp-6-471-2006, 2006. a, b, c, d
Romakkaniemi, S., Arola, A., Kokkola, H., Birmili, W., Tuch, T., Kerminen, V.-M., Räisänen, P., Smith, J. N., Korhonen, H., and Laaksonen, A.: Effect of aerosol size distribution changes on AOD, CCN and cloud droplet concentration: Case studies from Erfurt and Melpitz, Germany, J. Geophys. Res.-Atmos., 117, D07202, https://doi.org/10.1029/2011JD017091, 2012. a, b
Saide, P. E., Gao, M., Lu, Z., Goldberg, D. L., Streets, D. G., Woo, J.-H., Beyersdorf, A., Corr, C. A., Thornhill, K. L., Anderson, B., Hair, J. W., Nehrir, A. R., Diskin, G. S., Jimenez, J. L., Nault, B. A., Campuzano-Jost, P., Dibb, J., Heim, E., Lamb, K. D., Schwarz, J. P., Perring, A. E., Kim, J., Choi, M., Holben, B., Pfister, G., Hodzic, A., Carmichael, G. R., Emmons, L., and Crawford, J. H.: Understanding and improving model representation of aerosol optical properties for a Chinese haze event measured during KORUS-AQ, Atmos. Chem. Phys., 20, 6455–6478, https://doi.org/10.5194/acp-20-6455-2020, 2020. a
Seinfeld, J. H. and Pandis, S. N.: Atmospheric Chemistry and Physics: From Air Pollution to Climate Change, John Wiley & Sons, INC., Second edn., 1225 pp., 2006. a
Skamarock, W. C., Klemp, J. B., Dudhia, J., Gill, D. O., Barker, D. M., Duda, M. G., Huang, X.-Y., Wang, W., and Powers, J. G.: A Description of the Advanced Research WRF Version 3 (No. NCAR/TN-475+STR), https://doi.org/10.1029/97JD01810, 2008. a
Soares, J., Sofiev, M., and Hakkarainen, J.: Uncertainties of wild-land fires emission in AQMEII phase 2 case study, Atmos. Environ., 115, 361–370, https://doi.org/10.1016/j.atmosenv.2015.01.068, 2015. a
Sofiev, M., Vankevich, R., Lotjonen, M., Prank, M., Petukhov, V., Ermakova, T., Koskinen, J., and Kukkonen, J.: An operational system for the assimilation of the satellite information on wild-land fires for the needs of air quality modelling and forecasting, Atmos. Chem. Phys., 9, 6833–6847, https://doi.org/10.5194/acp-9-6833-2009, 2009. a
Sprent, P. and Smeeton, N. C.: Applied nonparametric statistical methods, CRC press, New York, 2016. a
Stephens, M. A.: EDF Statistics for Goodness of Fit and Some Comparisons, J. Am. Stat. Assoc., 69, 730–737, https://doi.org/10.1080/01621459.1974.10480196, 1974. a, b
Stockwell, W. R., Kirchner, F., Kuhn, M., and Seefeld, S.: A new mechanism for regional atmospheric chemistry modeling, J. Geophys. Res.-Atmos., 102, 25847–25879, https://doi.org/10.1029/97JD00849, 1997. a
Stuefer, M., Freitas, S. R., Grell, G., Webley, P., Peckham, S., McKeen, S. A., and Egan, S. D.: Inclusion of ash and SO2 emissions from volcanic eruptions in WRF-Chem: development and some applications, Geosci. Model Dev., 6, 457–468, https://doi.org/10.5194/gmd-6-457-2013, 2013. a
Tegen, I. and Lacis, A. A.: Modeling of particle size distribution and its influence on the radiative properties of mineral dust aerosol, J. Geophys. Res.-Atmos., 101, 19237–19244, https://doi.org/10.1029/95JD03610, 1996. a
Tewari, M., Chen, F., Wang, W., Dudhia, J., LeMone, M., Mitchell, K., Ek, M., Gayno, G., Wegiel, J., and Cuenca, R.: Implementation and verification of the unified NOAH land surface model in the WRF model, in: 20th conference on weather analysis and forecasting/16th conference on numerical weather prediction, 11–15, 12–16 January 2004, Seattle, Washington, 2004. a
Tunved, P., Hansson, H.-C., Kulmala, M., Aalto, P., Viisanen, Y., Karlsson, H., Kristensson, A., Swietlicki, E., Dal Maso, M., Ström, J., and Komppula, M.: One year boundary layer aerosol size distribution data from five nordic background stations, Atmos. Chem. Phys., 3, 2183–2205, https://doi.org/10.5194/acp-3-2183-2003, 2003. a, b, c, d
Vakkari, V., Beukes, J. P., Laakso, H., Mabaso, D., Pienaar, J. J., Kulmala, M., and Laakso, L.: Long-term observations of aerosol size distributions in semi-clean and polluted savannah in South Africa, Atmos. Chem. Phys., 13, 1751–1770, https://doi.org/10.5194/acp-13-1751-2013, 2013. a, b, c, d
Wesely, M. L.: Parameterization of surface resistances to gaseous dry deposition in regional-scale numerical models, Atmos. Environ., 23, 1293–1304, https://doi.org/10.1016/0004-6981(89)90153-4, 1989. a
Whitby, K., Husar, R., and Liu, B.: The aerosol size distribution of Los Angeles smog, J. Colloid Interf. Sci., 39, 177–204, https://doi.org/10.1016/0021-9797(72)90153-1, 1972. a, b
Whitby, K. T.: The physical characteristics of sulfur aerosols, Atmos. Environ., 12, 135–159, https://doi.org/10.1016/0004-6981(78)90196-8, 1978. a, b
Wiedinmyer, C., Akagi, S. K., Yokelson, R. J., Emmons, L. K., Al-Saadi, J. A., Orlando, J. J., and Soja, A. J.: The Fire INventory from NCAR (FINN): a high resolution global model to estimate the emissions from open burning, Geosci. Model Dev., 4, 625–641, https://doi.org/10.5194/gmd-4-625-2011, 2011. a
Wild, O., Zhu, X., and Prather, M. J.: Fast-J: Accurate Simulation of In- and Below-Cloud Photolysis in Tropospheric Chemical Models, J. Atmos. Chem., 37, 245–282, https://doi.org/10.1023/A:1006415919030, 2000. a
Yang, J., Kang, S., and Ji, Z.: Sensitivity Analysis of Chemical Mechanisms in the WRF-Chem Model in Reconstructing Aerosol Concentrations and Optical Properties in the Tibetan Plateau, Aerosol Air Qual. Res., 18, 505–521, https://doi.org/10.4209/aaqr.2017.05.0156, 2018. a
Zaveri, R. A. and Peters, L. K.: A new lumped structure photochemical mechanism for large-scale applications, J. Geophys. Res.-Atmos., 104, 30387–30415, https://doi.org/10.1029/1999JD900876, 1999. a
Zhang, Y., Liu, Y., Kucera, P. A., Alharbi, B. H., Pan, L., and Ghulam, A.: Dust modeling over Saudi Arabia using WRF-Chem: March 2009 severe dust case, Atmos. Environ., 119, 118–130, https://doi.org/10.1016/j.atmosenv.2015.08.032, 2015. a
Zhao, C., Liu, X., Leung, L. R., Johnson, B., McFarlane, S. A., Gustafson Jr., W. I., Fast, J. D., and Easter, R.: The spatial distribution of mineral dust and its shortwave radiative forcing over North Africa: modeling sensitivities to dust emissions and aerosol size treatments, Atmos. Chem. Phys., 10, 8821–8838, https://doi.org/10.5194/acp-10-8821-2010, 2010. a
Zhao, C., Liu, X., Ruby Leung, L., and Hagos, S.: Radiative impact of mineral dust on monsoon precipitation variability over West Africa, Atmos. Chem. Phys., 11, 1879–1893, https://doi.org/10.5194/acp-11-1879-2011, 2011. a
Zhao, C., Chen, S., Leung, L. R., Qian, Y., Kok, J. F., Zaveri, R. A., and Huang, J.: Uncertainty in modeling dust mass balance and radiative forcing from size parameterization, Atmos. Chem. Phys., 13, 10733–10753, https://doi.org/10.5194/acp-13-10733-2013, 2013. a