the Creative Commons Attribution 4.0 License.
the Creative Commons Attribution 4.0 License.
 | 18 Nov 2020
The benefits of increasing resolution in global and regional climate simulations for European climate extremes
Carley E. Iles
Robert Vautard
Jane Strachan
Sylvie Joussaume
Bernd R. Eggen
Chris D. Hewitt
Many climate extremes, including heatwaves and heavy precipitation events, are projected to worsen under climate change, with important impacts for society. Future projections required for adaptation are often based on climate model simulations. Given finite resources, trade-offs must be made concerning model resolution, ensemble size, and level of model complexity. Here we focus on the resolution component. A given resolution can be achieved over a region using either global climate models (GCMs) or at lower cost using regional climate models (RCMs) that dynamically downscale coarser GCMs. Both approaches to increasing resolution may better capture small-scale processes and features (downscaling effect), but increased GCM resolution may also improve the representation of the large-scale atmospheric circulation (upscaling effect). The size of this upscaling effect is therefore important for deciding modelling strategies. Here we evaluate the benefits of increased model resolution for both global and regional climate models for simulating temperature, precipitation, and wind extremes over Europe at resolutions that could currently be realistically used for coordinated sets of climate projections at the pan-European scale. First we examine the benefits of regional downscaling by comparing EURO-CORDEX simulations at 12.5 and 50 km resolution to their coarser CMIP5 driving simulations. Secondly, we compare global-scale HadGEM3-A simulations at three resolutions (130, 60, and 25 km). Finally, we separate out resolution-dependent differences for HadGEM3-A into downscaling and upscaling components using a circulation analogue technique. Results suggest limited benefits of increased resolution for heatwaves, except in reducing hot biases over mountainous regions. Precipitation extremes are sensitive to resolution, particularly over complex orography, with larger totals and heavier tails of the distribution at higher resolution, particularly in the CORDEX vs. CMIP5 analysis. CMIP5 models underestimate precipitation extremes, whilst CORDEX simulations overestimate compared to E-OBS, particularly at 12.5 km, but results are sensitive to the observational dataset used, with the MESAN reanalysis giving higher totals and heavier tails than E-OBS. Wind extremes are somewhat stronger and heavier tailed at higher resolution, except in coastal regions where large coastal grid boxes spread strong ocean winds further over land. The circulation analogue analysis suggests that differences with resolution for the HadGEM3-A GCM are primarily due to downscaling effects.
- Article
(4352 KB) - Full-text XML
-
Supplement
(3213 KB) - BibTeX
- EndNote


Climate extremes, such as heatwaves and heavy precipitation events, are projected to worsen under climate change, with important impacts for society (Seneviratne et al., 2012). Such projections are generally based on numerical climate model simulations. However, given finite computational resources, trade-offs between model resolution, ensemble size, and the level of model complexity are necessary. For extreme events driven by large-scale processes such as stationary anticyclones, the proper simulation of the amplitude of extremes is limited by dynamics but also by land–atmosphere feedbacks and the many physical processes involved in the surface energy budget. Such extremes are typically heatwaves, droughts, and cold spells. Many other types of extreme events are by nature small scale, i.e. on the order of a few kilometres to a few hundred kilometres. Such is the case of convective precipitation, flash floods, extratropical wind storms, cyclones, and medicanes. These are poorly resolved at the resolution of global climate models (GCMs) in CMIP5 (Coupled Model Intercomparison Project Phase 5; Taylor et al., 2012). Increased resolution in GCMs may improve the representation of small-scale processes and features, including orography and coastlines (downscaling effect), but it may also potentially improve the representation of the interaction between small- and large-scale dynamical processes and ultimately improve the large-scale atmospheric flow (upscaling effect). For instance, a better representation of baroclinic eddies may help to better simulate large Rossby waves such as those inducing long-lived anomalies due to the inverse energy cascade. This may improve the simulation of the frequency and duration of heatwaves and cold spells, as well as related anomalies such as summer droughts. For precipitation and wind extremes, an improvement with resolution could be expected due to the small-scale processes and features involved, including convection and the influence of topography. However, upscaling effects may also have benefits by improving storm-track location and the duration of wet spells. An alternative approach to increasing the resolution of global-scale models is to use regional climate models (RCMs) driven by coarser GCMs to achieve a given high resolution over a limited area at lower cost. However, this technique only captures downscaling effects, since the RCM inherits the large-scale circulation from the driving GCM.
Current-generation GCMs commonly used for climate projections (e.g. CMIP5 models) have a horizontal grid spacing ranging from about 70 to 250 km. Resolution has been increasing further in CMIP6 (Eyring et al., 2016), with some 25 km simulations now being run under projects such as PRIMAVERA and HighResMIP (part of CMIP6; Haarsma et al., 2016). For coordinated RCM experiments, such as CORDEX (Coordinated Regional Downscaling Experiment; Giorgi et al., 2009), grid spacing is generally between 10 and 50 km (e.g. Jacob et al., 2014). In order to simulate convective precipitation a grid spacing of < 5 km is needed, which is very computationally expensive, but such ensembles of convection-permitting RCMs are currently in development (e.g. Coppola et al., 2020; Risanto et al., 2019). An important question is the extent to which increased resolution benefits the simulation of extreme events for both global and regional models for the kind of resolutions that can realistically be run for coordinated pan-continental climate projections, particularly whether using global high resolution adds further benefits over regional high resolution due to an improved large-scale circulation. We will address these questions focusing on Europe, for which a large number of coordinated RCM simulations at two standard resolutions are available as part of the EURO-CORDEX initiative (Jacob et al., 2014) and whose climate is highly variable and affected by a range of both large- and small-scale processes, which present challenges for adequate simulation. We focus on extreme precipitation, temperature, and wind to cover a range of phenomena that may be affected by resolution in different ways. Throughout the rest of this paper we use the term “resolution” to mean model horizontal grid spacing, whilst recognizing that a model's effective resolution, in terms of the scales it can capture, is always coarser than its grid spacing (Skamarock, 2004; Klaver et al., 2020).
The benefits of increased resolution for European precipitation extremes are well documented, whilst the effects on heatwaves, cold spells, and wind extremes are less well known. In GCMs, global precipitation tends to increase with resolution, and for grid point GCMs (as opposed to spectral GCMs) the fraction of land precipitation and moisture fluxes from land to ocean increases, largely due to better resolved orography (Vannière et al., 2019; Terai et al., 2018; Demory et al., 2014). Precipitation extremes tend to get heavier and in some studies agree better with observational estimates with increased resolution (Wehner et al., 2010; O'Brien et al., 2016; Kopparla et al., 2013; Shields et al., 2016; Vannière et al., 2019; Demory et al., 2020; Strandberg and Lind, 2020), unless the parameterization schemes are not suited to the resolution (e.g. Wehner et al., 2014, and possibly Bador et al., 2020, who found worse performance in higher-resolution versions of multiple GCMs whose parameterizations were not retuned at higher resolution, particularly in the tropics). In Europe, Schiemann et al. (2018) find that both mean and extreme precipitation are simulated better with increased resolution in HadGEM3A, mostly originating from better resolved orography. In contrast, Van Haren et al. (2015a) find that improvements in northern and central European mean and extreme winter precipitation with resolution are mostly associated with improved storm tracks in EC-Earth. For RCMs, extreme precipitation is improved with resolution when compared to high-resolution observations, particularly over complex orography, including frequency–intensity distributions and spatial patterns (e.g. Torma et al., 2015; Prein et al., 2016; Ruti et al., 2016; Fantini et al., 2018). However, benefits are smaller for regional and seasonal mean precipitation. Convection-permitting models (< 4 km grid spacing) are particularly beneficial in simulating summer extreme and sub-daily precipitation, including the diurnal cycle of convection, but can overdo extreme precipitation (e.g. Prein et al., 2015; Kendon et al., 2012, 2014).
For heatwaves, increasing horizontal resolution does not lead to obvious benefits in RCM simulations (see e.g. Vautard et al., 2013, for EURO-CORDEX), except improved spatial detail (Gutjahr et al., 2016). However, increased resolution may have more impact in global models since the large-scale circulation that contributes to heatwave formation may be affected. This remains a largely unstudied question, with the exception of a few studies such as Cattiaux et al. (2013), who find that increasing resolution in the IPSL GCM leads to a reduction in the cold bias of both cold and warm extremes in Europe, along with improved statistics, such as duration and frequencies, as well as improved weather regimes.
For wind extremes, stronger winds and better spatial detail with resolution have been found for regional models (e.g. Pryor et al., 2012; Kunz et al., 2010). Donat et al. (2010) found that observed storm loss estimates for Germany could be reconstructed more accurately through dynamical downscaling compared to using the coarser-resolution driving ERA-40 data directly. Ruti et al. (2016) found improvements in Mediterranean cyclogenesis in coupled Med-CORDEX RCMs relative to the ERA-Interim driving data, whilst extreme winds over the Mediterranean generally improve (i.e. are stronger) with higher-resolution RCMs (e.g. Ruti et al., 2016; Herrmann et al., 2011). Most GCM studies focus on the simulation of extratropical cyclones rather than wind directly. Such studies find an improvement in the representation of various aspects of Northern Hemisphere extratropical cyclones with increased resolution, including frequency, intensity, and the position of storm tracks (Colle et al., 2013; Jung et al., 2006, 2012), even in the higher-resolution CMIP5 models (∼ < 130 km; Zappa et al., 2013). de Vries et al. (2019) found that the resolution of Atlantic Gulf Stream sea surface temperature (SST) fronts affects winter extratropical cyclone strength. Gao et al. (2020) found that explosively intensifying “bomb” extratropical cyclones are more frequent and associated with stronger winds in higher-resolution GCMs. Whether the aforementioned improvements translate into an improvement in wind extremes remains to be assessed.
The persistence of weather regimes, such as blocking or the phase of the North Atlantic Oscillation, can be important drivers for extreme events in Europe. Using the ECMWF IFS model, Dawson et al. (2012) and Dawson and Palmer (2015) find that such weather regimes cannot be simulated realistically at typical CMIP5 resolution (∼ 125 km grid spacing) but are improved at 40 km and well simulated at 16 km. Cattiaux et al. (2013) find improvements at more modest resolutions in the IPSL model. However, multi-model GCM analyses by Strommen et al. (2019) and Fabiano et al. (2020) suggest that only some aspects of weather regimes are systematically improved with resolution and that these aspects are not consistent between atmosphere-only and coupled GCMs. Blocking frequency tends to be underestimated by CMIP5-resolution climate models (Anstey et al., 2013). This tends to be somewhat improved with resolution, particularly over the North Atlantic (Jung et al., 2012; Anstey et al., 2013; Matsueda et al., 2009, Berckmans et al., 2013, Davini et al., 2017a, b; Davini and D'Andrea, 2020; Strommen et al., 2019; Schiemann et al., 2020), although results tend to be somewhat sensitive to the season and model considered (Schiemann et al., 2017), and compensating errors may be involved (Davini et al., 2017a, for EC-EARTH). O'Reilly et al. (2016) find that having a well-resolved Gulf Stream SST front is also important for European winter blocking and associated cold spells. An important question is whether these improvements in the large-scale circulation translate into an improvement in the simulation of European climate extremes.
Here we examine the benefits of increased resolution for global and regional models for the simulation of European temperature, precipitation, and wind extremes. We further break down any resolution-related differences for a global model into upscaling and downscaling components. This will shed light on whether potential improvements in the large-scale circulation suggested in the literature translate into an improved representation of climate extremes. This is an important consideration in choosing how to distribute finite resources between global and regional models. We focus on the kind of models widely used to provide climate projections at a European scale by applying a consistent approach across model types. Firstly, the benefits of regional dynamical downscaling are explored by comparing EURO-CORDEX simulations at 50 and 12.5 km resolutions to their coarser driving CMIP5 GCMs. Secondly, the benefits of increased resolution for a global model are examined using HadGEM3-A at 130, 60, and 25 km resolution. Finally, the roles of upscaling versus downscaling will be examined using a circulation analogue technique applied to HadGEM3-A.
2.1 Observational data
Model simulations are evaluated using observational and reanalysis datasets. For daily precipitation and daily maximum temperature, we use the gridded station-based dataset E-OBS v15 on a 0.5∘ latitude–longitude grid (Haylock et al., 2008). This covers the European domain from 1950 to the present. Gridded datasets tend to reduce the magnitude of extremes compared to station data through smoothing effects but are more comparable to the grid box averages from GCMs (Haylock et al., 2008). E-OBS has a somewhat non-uniform underlying station density, with relatively high densities in Germany, Sweden, and Slovenia and low densities in other countries (e.g. Spain, France, Austria). It tends to underestimate precipitation extremes relative to higher-density regional datasets, especially where it has poor coverage due to missed extremes which are local in scale (Prein and Gobiet 2017; Herrera et al., 2019). However, such high-resolution datasets are not available at a pan-European scale. As a compromise, results are repeated for precipitation extremes using the 5.5 km resolution MESAN reanalysis (Landelius et al., 2016), which adjusts a downscaled first guess from the 22 km resolution HIRLAM reanalysis (Dahlgren et al., 2016) with a network of station-based precipitation observations. For much of Europe these are the same as those used for E-OBS, but with the addition of Swedish Meteorological and Hydrological Institute (SMHI) stations over Sweden and a high density of Météo-France stations over France (Landelius et al., 2016). MESAN provides daily precipitation data for the more limited period 1989–2010. Prein and Gobiet (2017) find that it gives heavier extremes than E-OBS in some regions (France, Spain, the Carpathians) but generally not as high as the high-resolution regional datasets (except in France). Neither dataset is corrected for gauge undercatch, which tends to be around 3 %–20 % for rain, up to 40 % for snow, and even 80 % for non-shielded gauges (Førland et al., 1996; Goodison et al., 1997).
Wind extremes tend to happen on sub-daily timescales, necessitating the use of sub-daily data to avoid missing as many events as with daily data (although events, or their peak magnitude, will still be missed). We use 10 m wind speed from three reanalysis datasets. These are the EURO4M DYNAD (Landelius et al., 2016), UERRA MESCAN-SURFEX (Bazile et al., 2017), and ERA5 (Hersbach et al., 2019) reanalyses. The former is available at 6-hourly intervals on a 5.5 km rotated grid over Europe for the period 1979–2013 and is computed through dynamical adaptation of a downscaled version of the 22 km resolution HIRLAM reanalysis to 5.5 km resolution orography using DYNAD (a simplified version of HIRLAM). MESCAN is also available at the same spatial and temporal resolution over Europe from 1961 onwards but is computed through dynamical downscaling of the 11 km UERRA-HARMONIE reanalysis. Both HIRLAM and UERRA-HARMONIE are forced by the ERA-Interim global reanalysis (ERA40 before 1979 for the latter). Finally, ERA5 is available globally at 0.25∘ and at hourly resolution from 1979 onwards. We subsample ERA5 to 6-hourly data by taking every sixth value in order to be consistent with the other reanalyses.
2.2 Climate model data
2.2.1 EURO-CORDEX and CMIP5
In order to examine the effect of dynamical downscaling for climate extremes, we make use of the EURO-CORDEX (Jacob et al., 2014) RCM simulations for the historical period over the European domain, which are driven by lower-resolution global-scale coupled CMIP5 GCMs. The GCMs are forced by observed records of anthropogenic and natural forcings, such as greenhouse gases, anthropogenic aerosols, land use changes, solar variability, and volcanic aerosols, to allow comparability to historical records. For the most part the RCMs inherit the effects of these forcing agents from the GCMs, with the exception of greenhouse gases, which are prescribed. A comparison of the RCM simulations with their driving CMIP5 simulations allows us to identify any value added by regional high resolution. The EURO-CORDEX simulations are available at 0.11∘ and 0.44∘ (12.5 and 50 km, respectively), allowing an assessment of the difference that increased regional resolution brings. Simulations are performed with the same model versions and parameterizations for both resolutions, except for REMO wherein rain advection is used at 0.11∘ but not 0.44∘ (Kotlarski et al., 2014). By examining the subset of GCM–RCM combinations that are common to both CORDEX resolutions along with their driving GCMs we can isolate the effects of changing resolution. Hereafter, this subset is referred to as the “common subset”. We also examine how representative the results for this common subset are by recalculating them with all available CMIP5 and CORDEX simulations using one member per model.
Daily precipitation (pr), daily maximum temperature (tasmax), and 3-hourly wind (sfcWind) were taken from both CORDEX and CMIP5. For wind, every other time step was taken in order to obtain 6-hourly data to be consistent with the reanalysis data. The simulations used are shown in Table S1 in the Supplement. These consist of 23 and 19 simulations for precipitation for the 0.44 and 0.11∘ CORDEX simulations, respectively, with 15 in the common subset, and 22 and 18 simulations for temperature, respectively, with 14 in the common subset. For wind, data were very limited for CORDEX at 0.44∘ and there was no overlap of models with those used for the 0.11∘ simulations. Therefore, the wind analysis in the main paper is based only on CORDEX 0.11∘ and CMIP5. There were 31 simulations for wind for CORDEX 0.11∘, with 15 in the common subset. CORDEX 0.11 and 0.44∘ were compared instead using the variable sfcWindmax (daily maximum wind), which was available for nine models at both resolutions (see Fig. S8). There seemed to be inconsistencies in the way sfcWindmax was calculated between CMIP5 models (mostly yielding stronger annual maximum winds compared to using 3-hourly data to varying extents, but sometimes weaker), which precluded basing the full analysis on this variable. When calculating ensemble medians for the common subset of simulations, we repeated GCM members that drive more than one RCM. The number of CMIP5 simulations used for the extended ensemble was 44 for precipitation, 42 for temperature, and 25 for wind.
2.2.2 UPSCALE simulations
In order to examine the benefits (or otherwise) of differences in resolution for a global model, we make use of simulations undertaken as part of the UPSCALE project (UK on PRACE: weather-resolving Simulations of Climate for globAL Environmental risk; Mizielinski et al., 2014). This consists of the atmosphere-only version of the Hadley Centre Global Environment Model 3 (HadGEM3-A) run at three different resolutions: N96 (130 km), N216 (60 km), and N512 (25 km), all with 85 vertical levels for the period 1985–2011 with five, three, and five ensemble members, respectively (or three, three, and five for wind data). The simulations are forced by observed records of greenhouse gases, aerosols, ozone, solar variability, and volcanic forcings following the AMIP-II procedure (Taylor et al., 2000) but using the higher-resolution OSTIA analysis (Operational Sea Surface Temperature and Sea Ice Analysis) for sea surface temperatures (SSTs) and sea ice (Donlon et al., 2012). Very few parameters differ between the resolutions, enhancing the comparability of the three ensembles. We use daily precipitation data, daily maximum temperatures, and 3-hourly wind (subsampled to 6-hourly).
2.3 Regridding
In order to compare models of different resolutions with each other and with the observational datasets it was necessary to regrid variables to a common grid. Using a high-resolution grid for evaluation would preserve the finer spatial detail and localized extremes for high-resolution simulations, but it is sometimes considered unfair for coarse-resolution models which cannot be expected to simulate the same intensities of extremes even for a perfect simulation due to spatial smoothing effects. If processes are captured better at higher resolution, improvements should still be visible when regridded to coarser resolution (Prein et al., 2016; Fantini et al., 2018). However, the finer spatial detail is an inherent advantage of high resolution and smoothing this out will result in partial information loss. We use the 0.5∘ regular longitude–latitude grid of E-OBS since it is between the resolution of the CORDEX models and CMIP5, and it is computationally feasible. Some of the benefits of higher resolution may be lost by doing this, putting our results on the conservative side. Nevertheless, sensitivity tests showed that results for MESAN did not change perceptibly by using a 0.5∘ grid compared to a 0.1∘ grid. We regrid the daily data before the calculation of annual extreme indices.
The sensitivity of the results to the regridding technique was investigated for a number of models of different resolutions and compared to results based on using the original grids (Fig. S1 in the Supplement). For the coarser-resolution models (e.g. HadCM3) results for precipitation extremes were particularly sensitive to the regridding technique, with much weaker extremes for some techniques, e.g. distance-weighted average remapping and bilinear interpolation, with unrealistic artefacts in the spatial patterns for many methods. For high-resolution models, the regridding technique did not make much difference to the results, although conservative remapping tended to dampen extreme precipitation, particularly for CORDEX 0.11. Overall, the nearest-neighbour method was chosen for precipitation for everything except CORDEX 0.11 and MESAN since it gave results very close to using the original grid for all model resolutions, preserving the amplitude of extremes and also having minimal artefacts when plotting spatial patterns of precipitation extremes. For going from high to lower resolution (e.g. 0.11 to 0.5∘) nearest neighbour is less appropriate since information from only a subset of grid cells is incorporated. Therefore, bicubic remapping was used for CORDEX 0.11 and MESAN, which also replicated results using the original grid very well (Fig. S1). Wind and temperature results were also somewhat sensitive to regridding technique, particularly for the coarser models. The above choices also seemed appropriate for these variables (nearest neighbour in most cases but bicubic for CORDEX 0.11, MESCAN, ERA5, and DYNAD), both in terms of replicating return period results using the original grid and retaining the blocky nature of the low-resolution simulations in the spatial patterns.
3.1 Extreme indices
In order to examine extremes, we adopt indices based on the Expert Team on Climate Change Detection and Indices (ETCCDI) (Zhang et al., 2011). For precipitation these are the annual maximum daily precipitation (Rx1day) and the annual maximum consecutive 5 d total (Rx5day). For temperature we use the annual maximum daily maximum temperature (TXx) and the annual maximum consecutive 5 d mean of daily maximum temperature (TXx5day). Rx1day and TXx5day are presented in the figures, whilst the other indices are commented on in the text. For wind we use the annual maximum of daily maximum wind, which we refer to as WindXx. This is based on 6-hourly data. These are therefore much rarer extremes than those based e.g. on the 95th or even 99th percentile, which would happen on average 1 in 20 d and 1 in 100 d, respectively. One drawback is that this makes robust statistics more challenging.
In order to examine how well the climate models simulate extremes and the differences between different resolutions, we first examine the spatial patterns of the climatological mean values of the indices and their biases with respect to observational datasets. We then examine return period plots (see definitions below) for a number of regions for each index, which highlights any differences in the shape of the tails of the distribution of the extremes. The regions used are based on the PRUDENCE regions (Christensen and Christensen, 2007) and the IPCC SREX regions (Seneviratne et al., 2012) and are shown in Fig. S2 and Table S2. A subset of representative regions are presented here, with some comments about the others.
3.2 Return periods
In order to calculate regional return periods and return values we first sort the data into ascending order for each grid cell. The return periods are calculated as N∕k, where N is the number of years of data, and k is the rank, with k=1 for the largest value. Return periods are therefore the inverse of the probability of an event exceeding a given value (called the “return value”). This is an empirical approach and has the limitation that return periods cannot exceed the number of years of data used (e.g. 36 years). This is still the case even if an extremely unusual event occurs. Fitting a generalized extreme value (GEV) distribution would allow estimates for higher return periods, but this would still be an extrapolation. The area-weighted regional average is made for given return periods over the associated return values. To avoid complications from missing data, grid cells in E-OBS with more than 5 d of missing data in any year during the period examined were masked for the whole period. Having one or more years missing would complicate the calculation of regional mean return periods and values. Models and observational datasets are masked to have the same spatial coverage, which is land only. A common time period across the models being examined and the observations they are being compared to is chosen to allow comparability. For the CMIP5 and CORDEX analysis 1970–2005 is used for temperature and precipitation and 1979–2005 for wind. For the UPSCALE runs we use 1985–2011 for temperature, 1989–2010 for precipitation to allow comparisons with MESAN (although 1986–2011 is used for the analogue analysis; see below), and 1986–2011 for wind.
In order to allow the shapes of the return period curves to be compared more easily between different types of models (i.e. CMIP5 and CORDEX at both resolutions), we first adjust each model to have the same climatological mean value of the extreme index in question. This effectively shifts the curves up or down but does not change their shape, which is the focus of these figures. Without such a shift, curves are too spread out to be able to discern differences in shape. Therefore, we cannot comment on mean biases of the extreme indices based on the return plots, but these biases are already shown and discussed based on map figures (see Sect. 3.1). We implement this adjustment by subtracting the difference between the model climatology of the index in question and the climatology of the reference observational dataset for each model at a grid cell level. We use E-OBS as the reference for temperature and precipitation and MESCAN for wind. The additional observational datasets shown in the return period plots are also adjusted in the same way. For the UPSCALE simulations, results can also be examined without the need to shift the curves to a common mean value because the same version of the same model is used for a given resolution, meaning that curves for individual simulations tend to cluster together instead of having large mean differences. In this way, differences in biases with resolution are also seen in the return period plots. Nevertheless, we also present UPSCALE results with the adjustment in Fig. S10 for comparison.
Confidence intervals for the observational datasets are calculated using a bootstrapping method. If, for example, the analysis period was 1970–2005 (i.e. 36 years), 1000 random samples of 36 years from this period are chosen from the same dataset, allowing the same year to be chosen more than once per iteration. For each random sample, the chosen values are sorted for each grid cell and a regional average is calculated as above, effectively yielding 1000 return period curves per region. The 5th and 95th percentile of these values are then calculated to give the confidence intervals.
4.1 The benefits of regional high resolution: EURO-CORDEX versus CMIP5
4.1.1 Temperature extremes
Figure 1 shows the spatial patterns of the climatological mean of TXx5day for the period 1970–2005 for E-OBS and the multi-model medians (MMMs) of CMIP5 and CORDEX at both resolutions, along with their biases with respect to E-OBS. The same general pattern can be seen in both E-OBS and the models, with hotter extremes in the south and cooler extremes in the north and over the mountains. At higher resolution the colder warm extremes over the Alps and Carpathians become more distinct. For the common subset the pattern of biases relative to E-OBS is similar for both CMIP5 and CORDEX, with cold biases in the north and west and hot biases in the south-east. However, the hot biases over the mountains are reduced with higher resolution since the model topography is higher. The cold bias over Scandinavia is also larger in CORDEX than in CMIP5. Biases for CORDEX using the whole ensemble are similar to those for the common subset. For CMIP5 the hot biases over the south-east and over mountain ranges are stronger when using all simulations compared to the subset. Findings for TXx are similar but hotter (not shown).
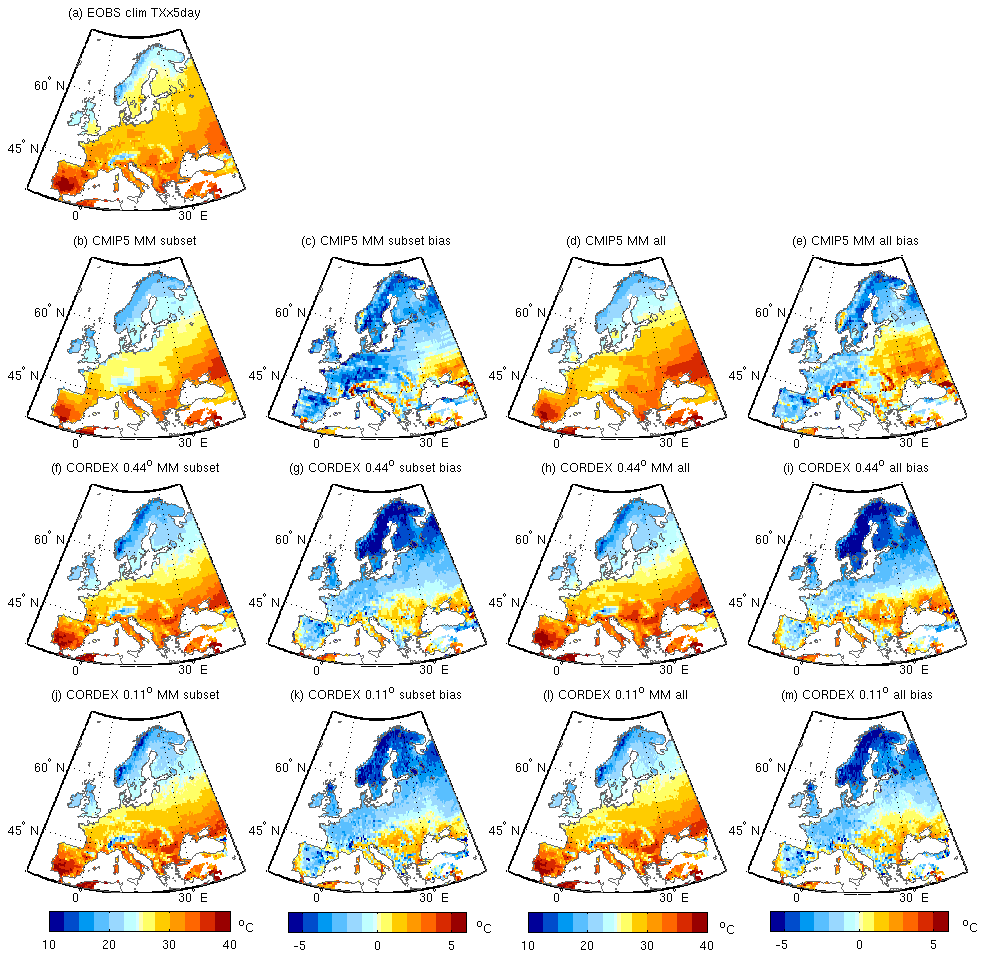
Figure 1Climatological mean of TXx5day for the period 1970–2005 for (a) E-OBS; the multi-model median of the common subset of models (see Methods) for (b) CMIP5, (f) CORDEX 0.44∘, and (j) CORDEX 0.11∘, (c, g, k) their biases with respect to E-OBS, and (d, e, h, i, j, k) the same for the full ensembles of CMIP5 and CORDEX. Units: degrees Celsius.
To give an idea of the level of consistency of results between models, results for individual models are shown in Fig. S3. Although the CMIP5 models agree on the general spatial pattern of temperature extremes, their absolute magnitudes vary considerably, although all are too hot over the Alps. There are also substantial differences between results from different RCMs, including those driven by the same GCM, although the driving GCM does seem to affect the overall magnitude of the temperature extremes. Biases of individual RCMs do not appear to be systematically smaller than that of their driving GCM. Patterns are very similar for the same GCM–RCM chains at both 12.5 and 50 km resolution. Results for different ensemble members of the same GCM or GCM–RCM chain are very consistent, suggesting that the differences between models are not due to internal variability.
In order to assess any effect of resolution on the shape of the tails of the statistical distribution of temperature extremes, Fig. 2 (left column) shows return period against magnitude for TXx5day for CMIP5, CORDEX at both resolutions, and E-OBS (see Methods). Results are shown for northern, central, and southern Europe and are representative of results for the smaller PRUDENCE regions that fall within their boundaries. There is no obvious difference in the shape of the tails between CMIP5 and CORDEX. Agreement with E-OBS is good for the multi-model median, although many individual ensemble members lie outside the range of the observational uncertainty.
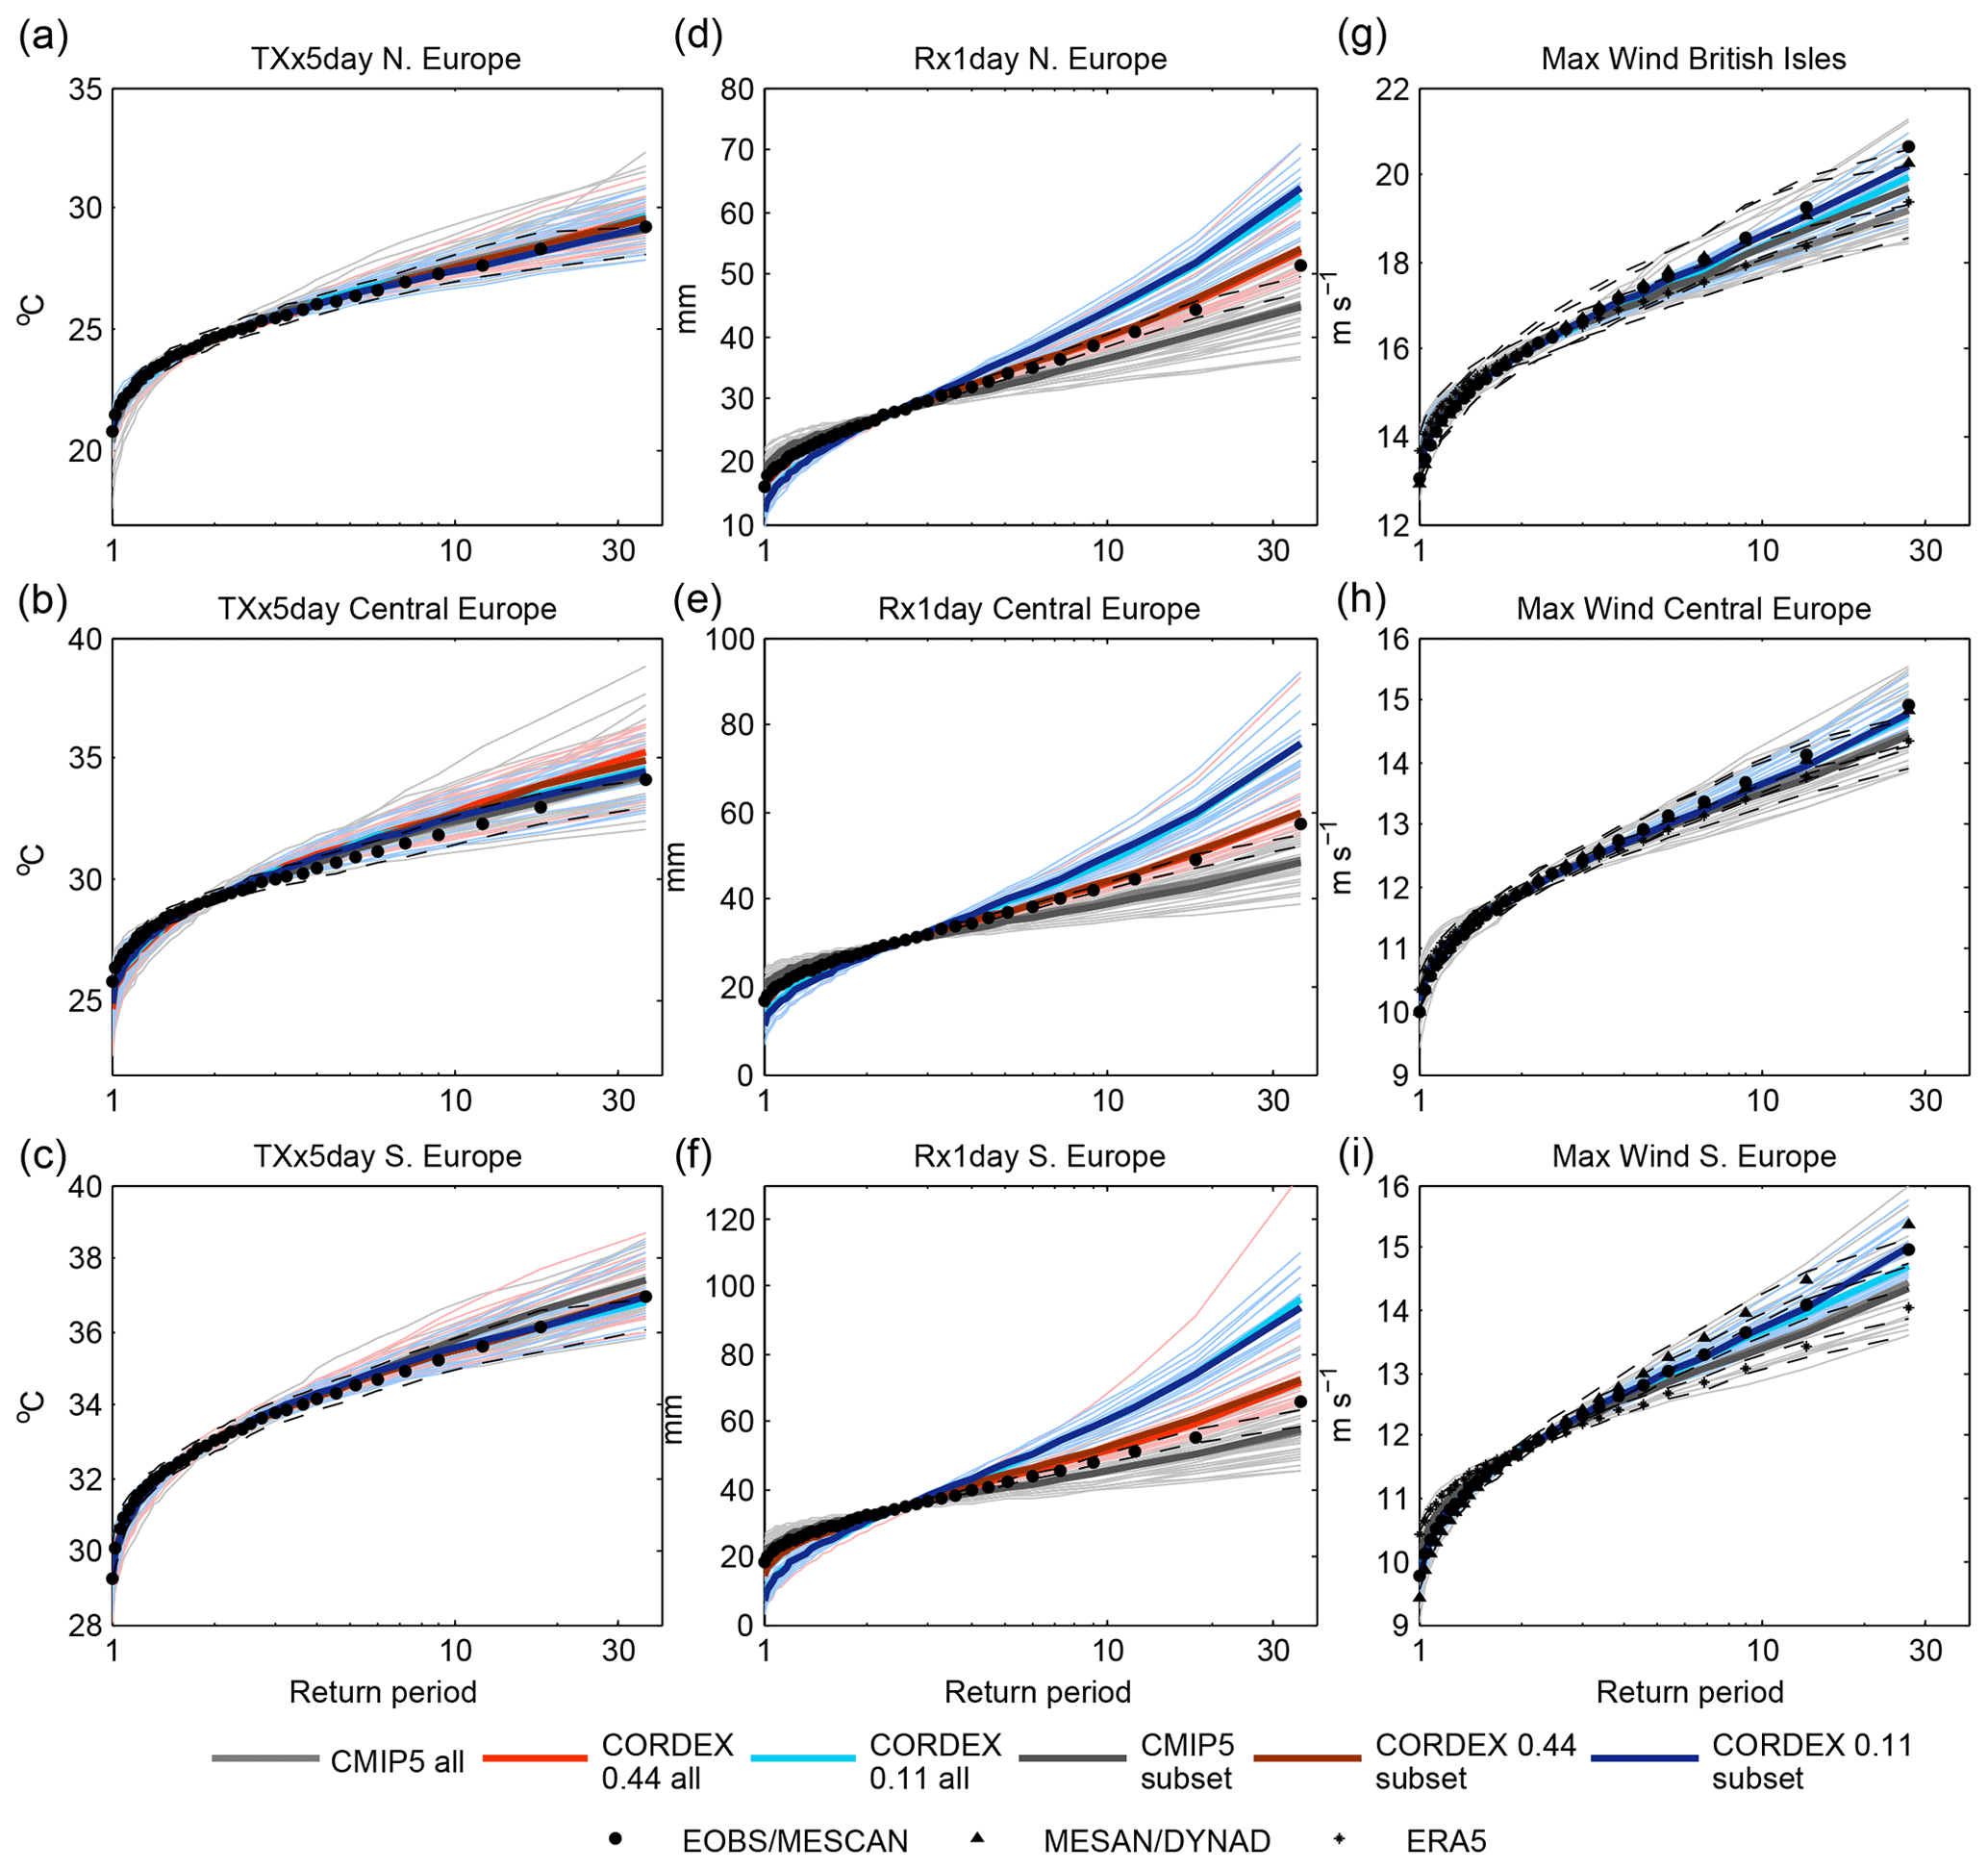
Figure 2Return period plots for (a, b, c) TXx5day, (d, e, f) Rx1day, and (g, h, i) annual maximum wind for CMIP5 and CORDEX for northern Europe (a, d) (except g: British Isles), central Europe (b, e, h), and southern Europe (c, f, i). CMIP5 is shown in grey, CORDEX 0.44∘ in red, and CORDEX 0.11∘ in blue. Thin lines are individual ensemble members, and thick lines are multi-model medians: lighter colours are for the full ensembles, and darker colours are for the subset of models common to CMIP5 and both CORDEX resolutions. Observational datasets are shown in black, circles are for E-OBS temperature and precipitation and MESCAN wind, triangles are for MESAN precipitation and DYNAD wind, and crosses are for ERA5 wind. Confidence intervals based on bootstrapping are shown with dashed lines for the observational datasets. The time periods considered are 1970–2005 for TXx5day and Rx1day and 1979–2005 for wind.
In summary, shapes of return period curves for temperature extremes appear to be insensitive to dynamical downscaling based on comparing CMIP5 to CORDEX at 0.11 and 0.44∘, but biases are affected, for instance, over mountains where hot biases decrease with resolution.
4.1.2 Precipitation extremes
Now we consider precipitation extremes for CMIP5 compared to CORDEX. Figure 3 shows the climatological mean of Rx1day for E-OBS and the MMMs of CMIP5 and CORDEX at both resolutions, as well as their differences with respect to E-OBS. The heaviest annual maximum precipitation totals in E-OBS occur over the Alps and the western side of coastal mountain ranges, including western Norway and north-eastern Spain. A similar spatial pattern of precipitation distribution can be seen in the models, although totals are lower in CMIP5 and higher in CORDEX. CMIP5 is drier than E-OBS over most of Europe, particularly over the areas of maximum observed precipitation (i.e. over or near mountains), whilst CORDEX is generally wetter than observed, particularly in these same locations and at higher resolution. Results using the entire ensembles are very similar to using the common subset of simulations. Previous studies suggest that E-OBS underestimates precipitation extremes since it is not corrected for gauge undercatch and has a relatively low underlying station density (e.g. Prein and Gobiet, 2017). Therefore, we also repeat the analysis using the MESAN reanalysis as the reference (Fig. S4) for the shorter period 1989–2005. MESAN uses a particularly high density of stations in France (see “Observational and model data” section). The climatology of Rx1day is wetter in MESAN than in E-OBS over most of Europe, most noticeably over the Alps and surrounding areas. This leads to the dry bias in CMIP5 appearing bigger and the wet bias in CORDEX decreasing, although it is still present in the 0.11∘ simulations. Using regional-scale very high-resolution datasets could improve agreement with the 0.11∘ simulations, since they tend to give heavier precipitation extremes (Prein and Gobiet, 2017). Gauge undercatch will also contribute to the difference, particularly for precipitation extremes associated with strong winds and in snow-dominated regions
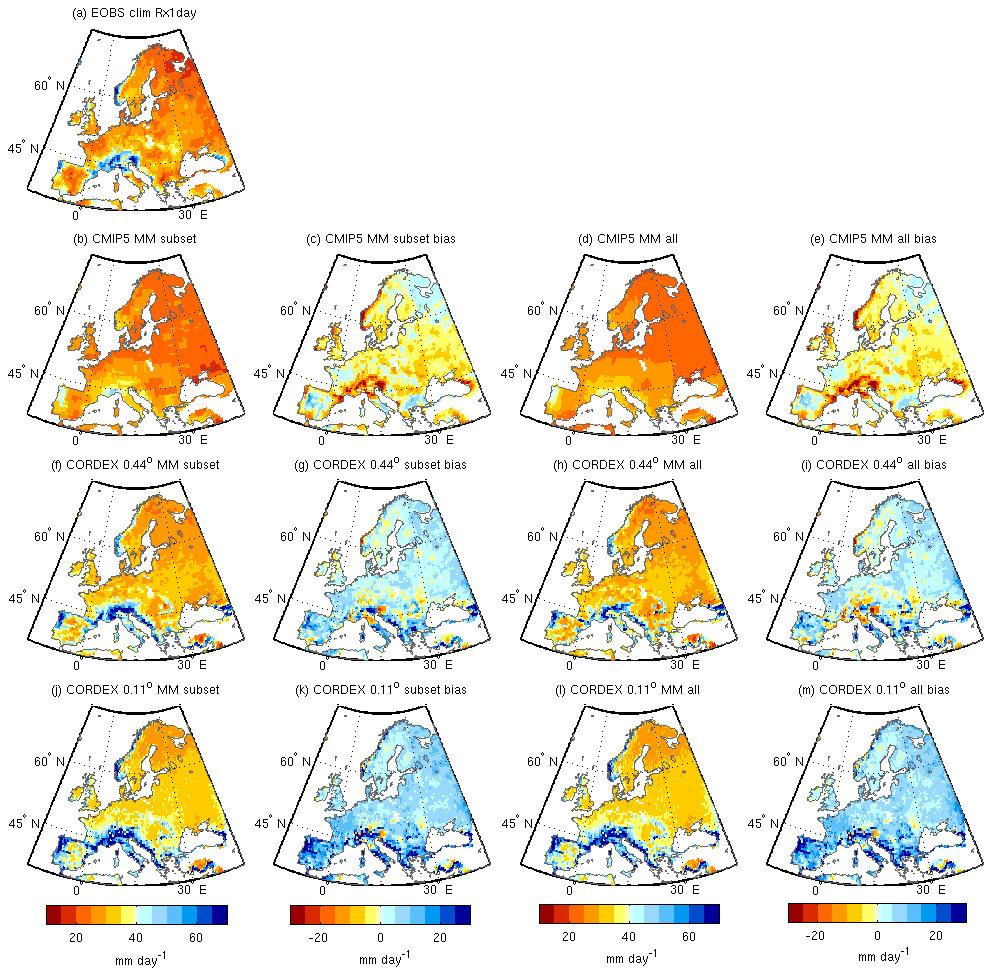
Figure 3As for Fig. 1 but for the climatological mean of Rx1day. Units: millimetres.
Figure S5 shows results for individual models. Again, whilst models agree on the general pattern of precipitation extremes, i.e. wettest over mountains, there are considerable inter-model differences concerning the magnitude, particularly over complex orography. A number of CMIP5 models have extremes that are too light everywhere, but all underestimate precipitation extremes over mountainous regions to a greater or lesser extent. RCMs systematically simulate heavier precipitation extremes compared to their driving GCMs, particularly over mountains, and these extremes tend to become heavier when moving from 0.44 to 0.11∘ in most cases. Many of the RCMs have heavier precipitation extremes than seen in E-OBS over much of Europe at 0.44∘, although this difference may disappear if compared to MESAN. This difference gets bigger at higher resolution and is largest over mountainous regions. The spatial patterns seem to be very RCM-dependent, with limited influence of biases in the driving GCM. Again, results are very consistent between ensemble members of the same models.
Figure 2 (middle column) shows return period curves for Rx1day for northern, central, and southern Europe. There is a clear separation in the tails of the distribution according to resolution, with CMIP5 having the lightest tails, CORDEX 0.44 in the middle, and CORDEX 0.11 with the heaviest tails across all regions (including the smaller PRUDENCE regions – not shown). Results using the common subset of models or the full ensembles are similar to each other. E-OBS tends to lie between CMIP5 and CORDEX 0.44 for southern Europe and closer to CORDEX 0.44 in central and northern Europe. Using MESAN gives slightly heavier tails in all three regions, particularly in southern Europe (Fig. S6) and France where the station density is highest (not shown), causing the best agreement to occur with CORDEX 0.44 everywhere. Results for Rx5day are similar, but with marginally less separation between the resolutions, whilst over northern and central Europe the best agreement with E-OBS happens at a slightly higher resolution than for Rx1day, i.e. either with CORDEX 0.44 or the lower end of the range of CORDEX 0.11 (not shown).
In summary, precipitation extremes are wetter and heavier tailed with higher resolution, especially over mountainous regions. CMIP5 has a dry bias, particularly over mountains, whilst CORDEX tends to be too wet relative to E-OBS, particularly at 0.11∘, but results are sensitive to the observational dataset used, with wet biases for CORDEX being reduced when compared to the higher-resolution MESAN dataset.
4.1.3 Wind extremes
Finally, we examine annual maximum wind (WindXx). Figure 4 shows the multi-model medians of climatological mean annual maximum wind for CMIP5 and CORDEX at 0.11∘ compared to three reanalysis datasets. Data for CORDEX 0.44∘ were very limited and did not overlap with the models used at 0.11∘; therefore, those results are not shown. The MESCAN and DYNAD reanalyses show strong extreme winds over the UK, the Norwegian mountains, and the NW coastline of France through to Denmark. Relatively strong winds are also seen over the Spanish plateau, as is a belt of strong winds running zonally across central Europe between somewhat slower winds to the north and south. The datasets differ in the magnitude of the winds, with DYNAD having more contrast between areas of low and high wind. MESCAN should be the more accurate of the two (Tomas Landelius, personal communication, 2020). ERA5 has notably slower winds, particularly over mountainous regions, but a similar overall zonal tripole pattern can be seen. Niermann et al. (2017) found that MESCAN underestimates extreme winds compared to station data over Germany. ERA5 must therefore underestimate even more. Concerning mean winds, Jourdier (2020) find that ERA5 underestimates wind speed compared to French stations, particularly over mountains.
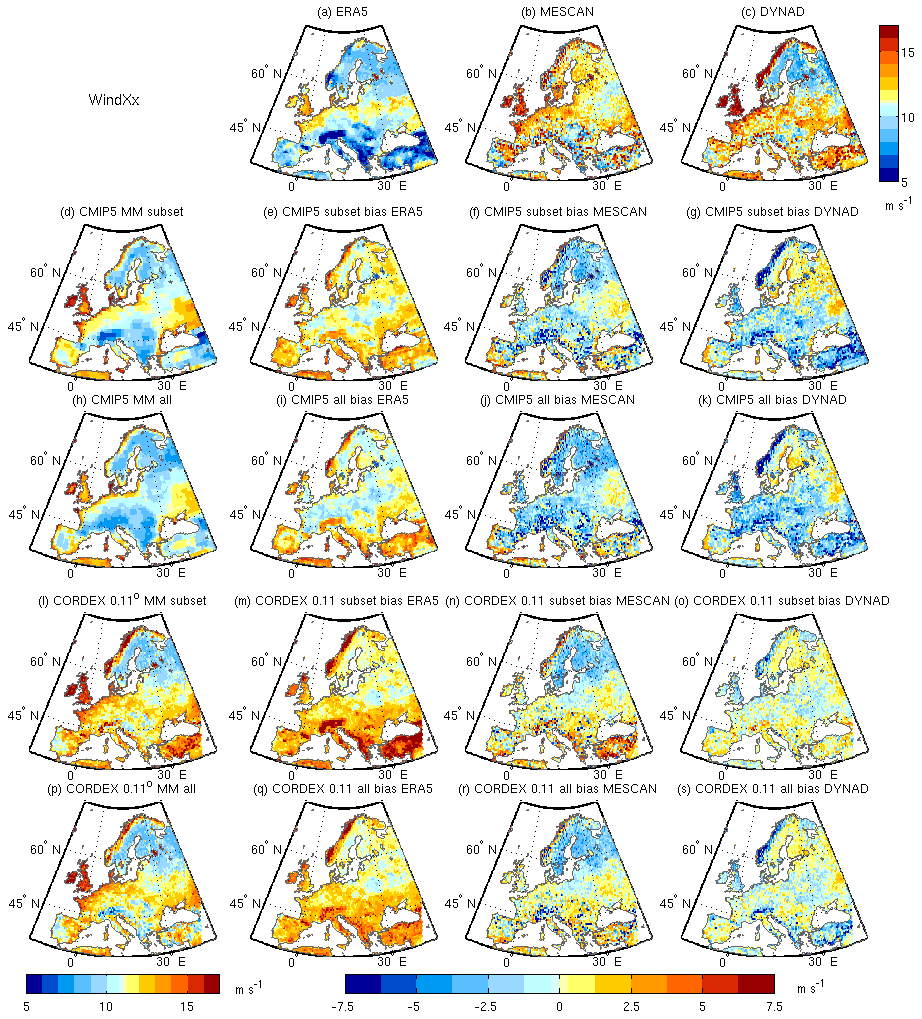
Figure 4Climatological mean of annual maximum wind for the period 1979–2005 for (a) ERA5, (b) MESCAN, (c) DYNAD, and the multi-model median of the common subset of models for (d) CMIP5 and (l) CORDEX 0.11∘ as well as their biases with respect to the reanalyses datasets (e–g, m–o). Panels (h–k) and (p–s) are the same but for the full ensembles of CMIP5 and CORDEX. Units: metres per second.
The CMIP5 driving model median shows a similar overall pattern of WindXx as the reanalyses, particularly ERA5, with a pattern of weaker winds in the north and south and a belt of stronger winds in the middle. However, CMIP5 does not tend to have stronger winds over mountains like in DYNAD and MESCAN. Using the whole CMIP5 ensemble gives similar results. The CORDEX multi-model medians show generally higher wind speeds than CMIP5 and capture the high wind speeds along western coastlines and over some mountainous terrain. Results for the common subset of simulations are similar to those obtained from the complete CORDEX ensembles, except that the latter show slow wind speeds over the Alps instead of high. This latter feature is very RCM-dependent, and indeed the overall pattern and magnitude of the extreme winds almost entirely reflect the choice of RCM with very little influence from the GCM (Fig. S7). For some RCMs the zonal tripole pattern is the clearest feature (ALADIN, COSMOcrCLIM), whilst for others it is the high winds over mountains and coastlines (RCA, HIRHAM5). The driving GCMs differ considerably in terms of the magnitude of extreme winds but have a similar overall pattern to each other (Fig. S7). Ensemble members of the same model give very similar results for both CORDEX and CMIP5. Multi-model median biases are dependent on the reanalysis used for reference, with CORDEX 0.11 being close to DYNAD and CMIP5 being closest to ERA5. In order to compare the two resolutions of CORDEX, results based on sfcWindmax instead of 3-hourly wind are presented in Fig. S8 (see Methods). Winds are either similar between the two resolutions (e.g. RCA and WRF) or stronger at higher resolution (RACMO, HIRHAM5). Again, the overall pattern is very RCM-dependent.
Figure 2 (right column) shows return period plots for WindXx for CMIP5 and CORDEX at 0.11∘. The British Isles are shown instead of northern Europe, since they are particularly affected by wind extremes, and for comparison with the results for the UPSCALE simulations, for which this region shows distinctive results. The distribution of annual maximum sfcWindmax has somewhat heavier tails in CORDEX 0.11 compared to CMIP5, regardless of the subset of models used in calculating the multi-model median in all regions examined. CORDEX 0.11 tends to be closest to DYNAD and MESCAN, whilst CMIP5 is closest to ERA5. Figure S9 shows that when using sfcWindmax, CORDEX 0.11 has heavier tails than CORDEX 0.44.
In summary, winds tend to be somewhat stronger and with somewhat heavier tails at higher resolution, with a large spread between models. Reanalysis datasets give fairly diverse results.
4.2 Global high resolution: UPSCALE
We now examine the benefits (or otherwise) of global high- vs. standard-resolution simulations for simulating climate extremes. Global high resolution may allow an improved representation of the large-scale circulation that cannot be captured by regional models, which may in turn affect the representation of climate extremes. For this we examine the UPSCALE simulations (Mizielinski et al., 2014), which consist of a small ensemble of HadGEM3-A simulations at three different resolutions: 130 km (N96), 60 km (N216), and 25 km (N512) (see “Observational and model data” section).
4.2.1 Temperature extremes
Figure 5 shows the ensemble mean climatological mean of TXx5day for the UPSCALE simulations over the period 1985–2011 at all three resolutions and their biases relative to E-OBS. The same general pattern of hotter extremes in the south and colder in the north and over mountainous regions can be seen at all three resolutions, but temperature extremes are hotter at higher resolution in the south and east and colder over mountains. The same pattern of biases is seen as for CORDEX and CMIP5, with cold biases in the north and hot in the south-east and over mountains. The mountain biases are reduced with higher resolution as the orography becomes better defined, whilst the hot bias in the SE and SW increases and the northern cold bias improves slightly. A coastal cold bias at low resolution disappears at higher resolution as the model land mask becomes more detailed. Note that the SSTs are prescribed and are the same for all simulations. Results for TXx are similar but hotter (not shown).

Figure 5Climatological mean of TXx5day for the ensemble means of three resolutions of HadGEM3-A (UPSCALE) GCM simulations (left) for the period 1985–2011 and their biases with respect to E-OBS (right). (a) E-OBS, (b, c) N96 (130 km), (d, e) N216 (60 km), and (f, g) N512 (25 km). Units: degrees Celsius.
Figure 6 (left column) shows regional return period plots for TXx5day for the UPSCALE simulations. Results are a little less consistent across regions for UPSCALE compared to the CMIP5 vs. CORDEX analysis, so we split northern Europe into the British Isles and Scandinavia, and add the Alps, to better capture regional variations. Since the ensemble means are only based on one model, results are presented without adjusting according to the climatology of TXx5day, although such adjusted results can be seen in Fig. S10 and allow differences in the shapes of the tails to be seen more clearly. TXx5day seems to be somewhat hotter with higher resolution over many regions, although this is not always clear-cut. The Alps are a notable exception, where the higher elevations with higher resolution give rise to colder temperature extremes. There are notable biases relative to E-OBS, with the models being too cold in the north, especially at low resolution, whilst in the south the colder subset of models (N96, the lowest UPSCALE resolution) agrees best with the E-OBS. Over the Alps, again the low-resolution simulations agree best with E-OBS, with the warmest temperatures, but this will depend on the height of the meteorological stations. This apparent contradiction with the reduced orographic hot bias with resolution in Fig. 5 comes from the stronger cold bias of the surrounding areas at low resolution. Figure S10 shows that differences between the shape of the tails with resolution are not systematic across regions and are mostly small, whilst agreement with E-OBS is good everywhere. Results for TXx are similar.
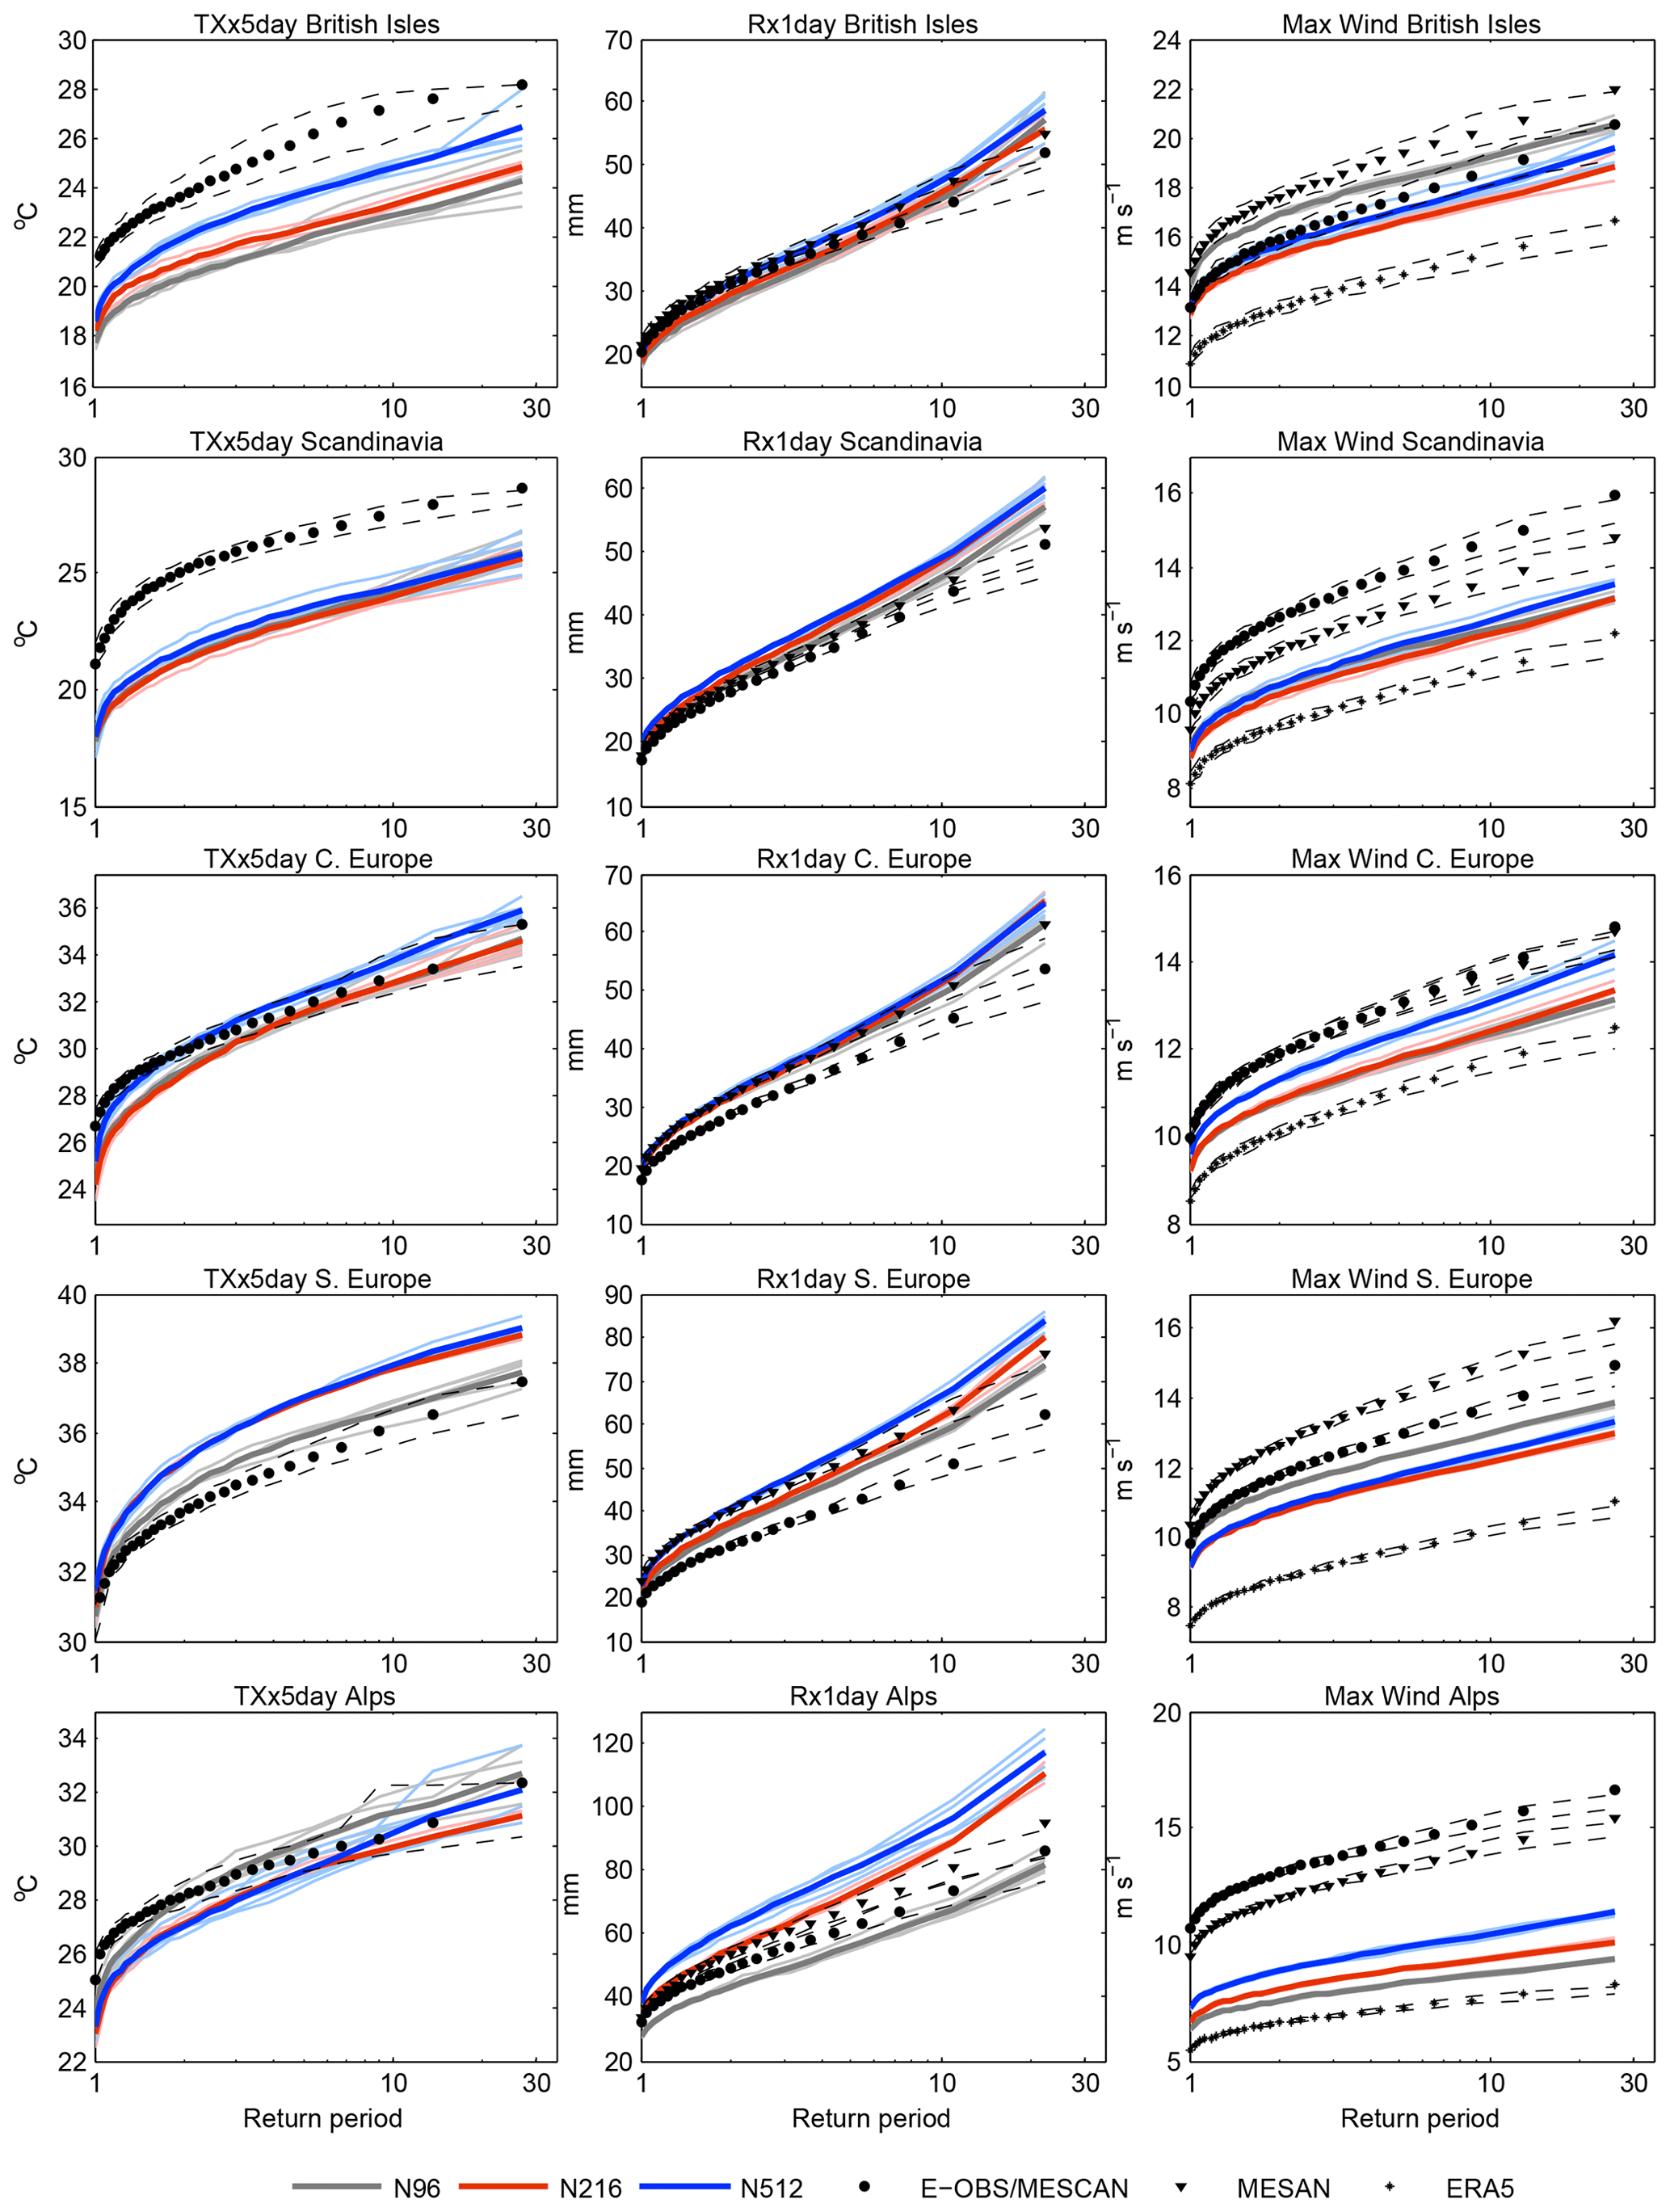
Figure 6Return period plots for (left) TXx5day; the middle column represents Rx1day and (right) annual maximum wind for the UPSCALE simulations for (top row) the British Isles, (second row) Scandinavia, (third row) central Europe, (fourth row) southern Europe, and (last row) the Alps. N96 is shown in grey, N216 in red, and N512 in blue. Thin lines are individual ensemble members, and thick lines represent ensemble means. Observational datasets are shown in black, circles are for E-OBS and MESCAN, triangles are for MESAN and DYNAD, and asterisks are for ERA5. Confidence intervals based on bootstrapping are shown with dashed lines for the observational datasets. The time periods considered are 1985–2011 for TXx5day, 1989–2010 for Rx1day, and 1986–2011 for wind. In contrast to Fig. 2 the curves have not been shifted to have the same mean value (see Methods); see Fig. S10 for the shifted version.
In summary, hot biases of temperature extremes over mountains are reduced with increased resolution for HadGEM3-A. Elsewhere, extremes tend towards getting hotter with resolution, whilst the shapes of the return period curves are insensitive.
4.2.2 Precipitation extremes
For precipitation, Fig. 7 shows the ensemble mean climatological mean of Rx1day for the period 1989–2010 for the three UPSCALE ensembles and their differences relative to E-OBS and MESAN. The overall pattern of Rx1day in the simulations is similar to that in the observational datasets, with heavier precipitation extremes and finer spatial detail with increasing resolution over complex orography. All resolutions have bands of heavy precipitation either side of the Alps, but these move closer together as the Alps become better defined. All simulations are generally wetter than E-OBS across most of Europe. The dry bias over orography in the Alps, southern Norway, and the Scottish Highlands is reduced with resolution, whilst a wet bias on the southern edge of the Alps and the coastal side of the Dinaric Alps in the Balkans appears instead. Comparing to MESAN instead of E-OBS, the general wet bias disappears, and the dry mountain bias over orography at low resolution increases. The differences between resolutions appear to be smaller than for the CMIP5 versus CORDEX analysis: all the UPSCALE simulations look most similar to CORDEX at 0.44∘. However, UPSCALE does not reach as fine a resolution as CORDEX at 0.11∘ (25 km vs. 12.5 km), and CMIP5 is on average slightly coarser than the N96 simulations. In addition, it should be noted that models with the same nominal resolution do not necessarily have the same effective resolution and that the effective resolution is always less than the nominal resolution (Skamarock, 2004; Klaver et al., 2020). Results are similar for Rx5day (not shown).
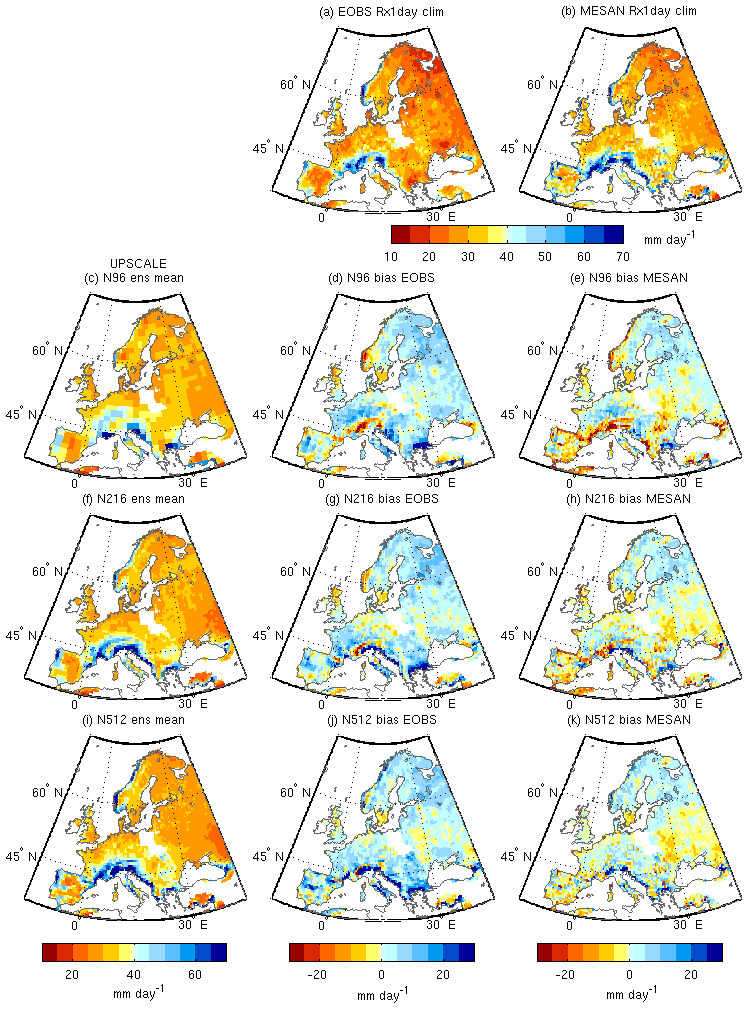
Figure 7Climatological mean of Rx1day for the ensemble means of three resolutions of UPSCALE (left) simulations for the period 1989–2010 and their biases with respect to E-OBS (middle) and the MESAN reanalysis (right). (a) E-OBS, (b) MESAN, (c–e) N96, (f–h) N216, and (i–k) N512. Units: millimetres.
Figure 6 (middle column) shows the return period plots for Rx1day for the three resolutions of UPSCALE ensembles. Slightly heavier precipitation extremes are found at higher resolution in all the regions shown (exceptions are France and mid-Europe – not shown). Although the differences are small, they are more obvious in southern Europe, especially in the Alps. Figure S10 shows that there is not much difference in the shape of the tails for most regions, although there are very slightly heavier tails at higher resolution for southern Europe (more so in the Mediterranean subregion – not shown) and more obvious differences over the Alps in the same direction, both of which are regions where convective precipitation is important. E-OBS tends to lie just below the model simulations for most regions (Fig. 6), although it agrees with the models for the British Isles and is between the low- and medium-resolution simulations over the Alps. MESAN gives higher values for observed Rx1day, which improves agreement in regions where E-OBS is below the models and causes a higher-resolution subset to agree better in the other regions (Fig. 6). For the curves that are adjusted to have the same climatological mean, E-OBS tends to lie just on the lower end of the ensemble for most regions, whilst MESAN gives slightly heavier tails and tends to improve agreement with models (Fig. S10). Results for Rx5day are broadly similar (except that both observational datasets lie above all the models for the British Isles).
In summary, precipitation extremes are somewhat wetter and heavier tailed with increasing resolution, mostly in southern Europe and the Alps for HadGEM3-A. Dry orographic biases decrease with resolution, but wet biases appear in the south next to mountain ranges instead.
4.2.3 Wind extremes
For wind extremes, Fig. 8 shows the spatial patterns of climatological mean annual maximum wind for UPSCALE and the same for three reanalyses. The spatial patterns are similar for the three different model resolutions, with the highest winds over the British Isles and coastal regions, lower wind speeds over the Alps, and the zonal tripole pattern described above. The main differences are that the lower-resolution model (N96) has stronger winds around the British Isles and western coastlines. This is likely because the larger coastal grid boxes overlap more with the ocean, which tends to have higher wind speeds, or due to differences in the model land mask itself with resolution. The wind speeds at higher resolution are a little stronger overall, most obviously in the central European zonal belt and over the Alps and Norwegian mountains. All resolutions show stronger winds than ERA5 over most of Europe. Compared to MESCAN winds are too weak in northern and southern Europe, particularly over mountainous regions, and a little too strong in between. Relative to DYNAD the pattern of differences is similar as for MESCAN, but with stronger negative differences over the Norwegian mountains and positive differences in other parts of northern Europe. There are positive coastal biases relative to all reanalyses for the N96 simulations that are reduced with increased resolution.
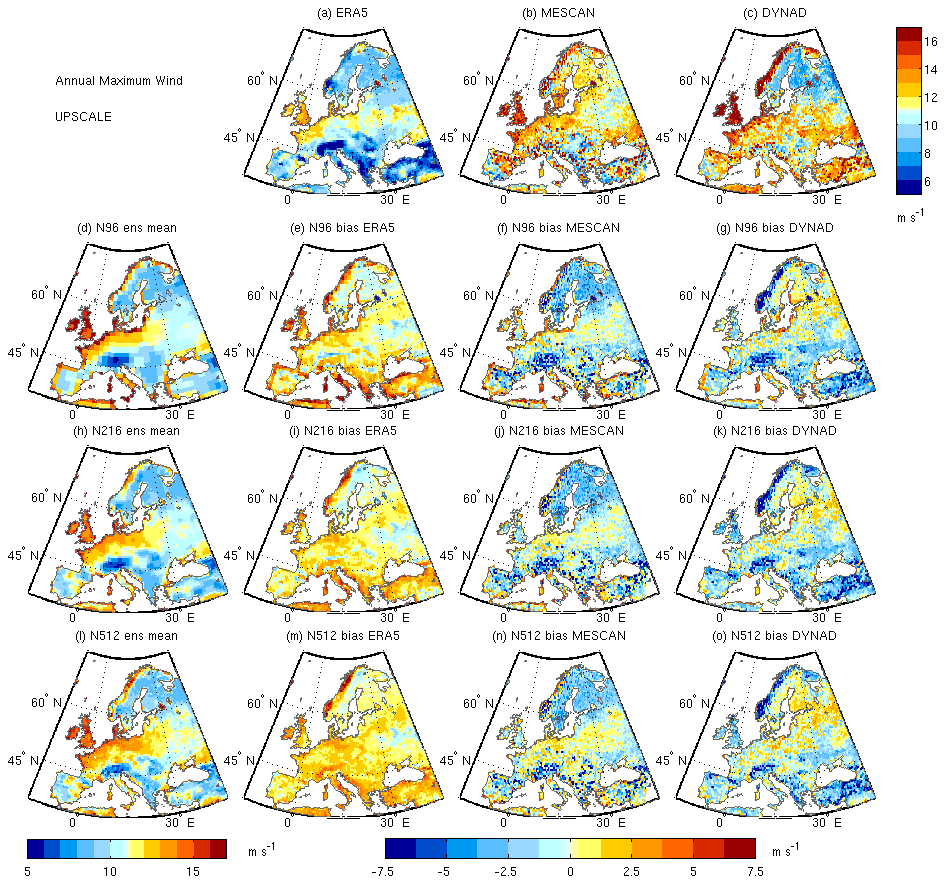
Figure 8Climatological mean of annual maximum wind for the ensemble means of three resolutions of UPSCALE (left) simulations for the period 1986–2011 and their biases with respect to the observational datasets ERA5 (left column), MESCAN (middle), and MESAN (right). (a) ERA5, (b) MESCAN, (c) DYNAD, (d–g) N96, (h–k) N216, and (l–o) N512. Units: metres per second.
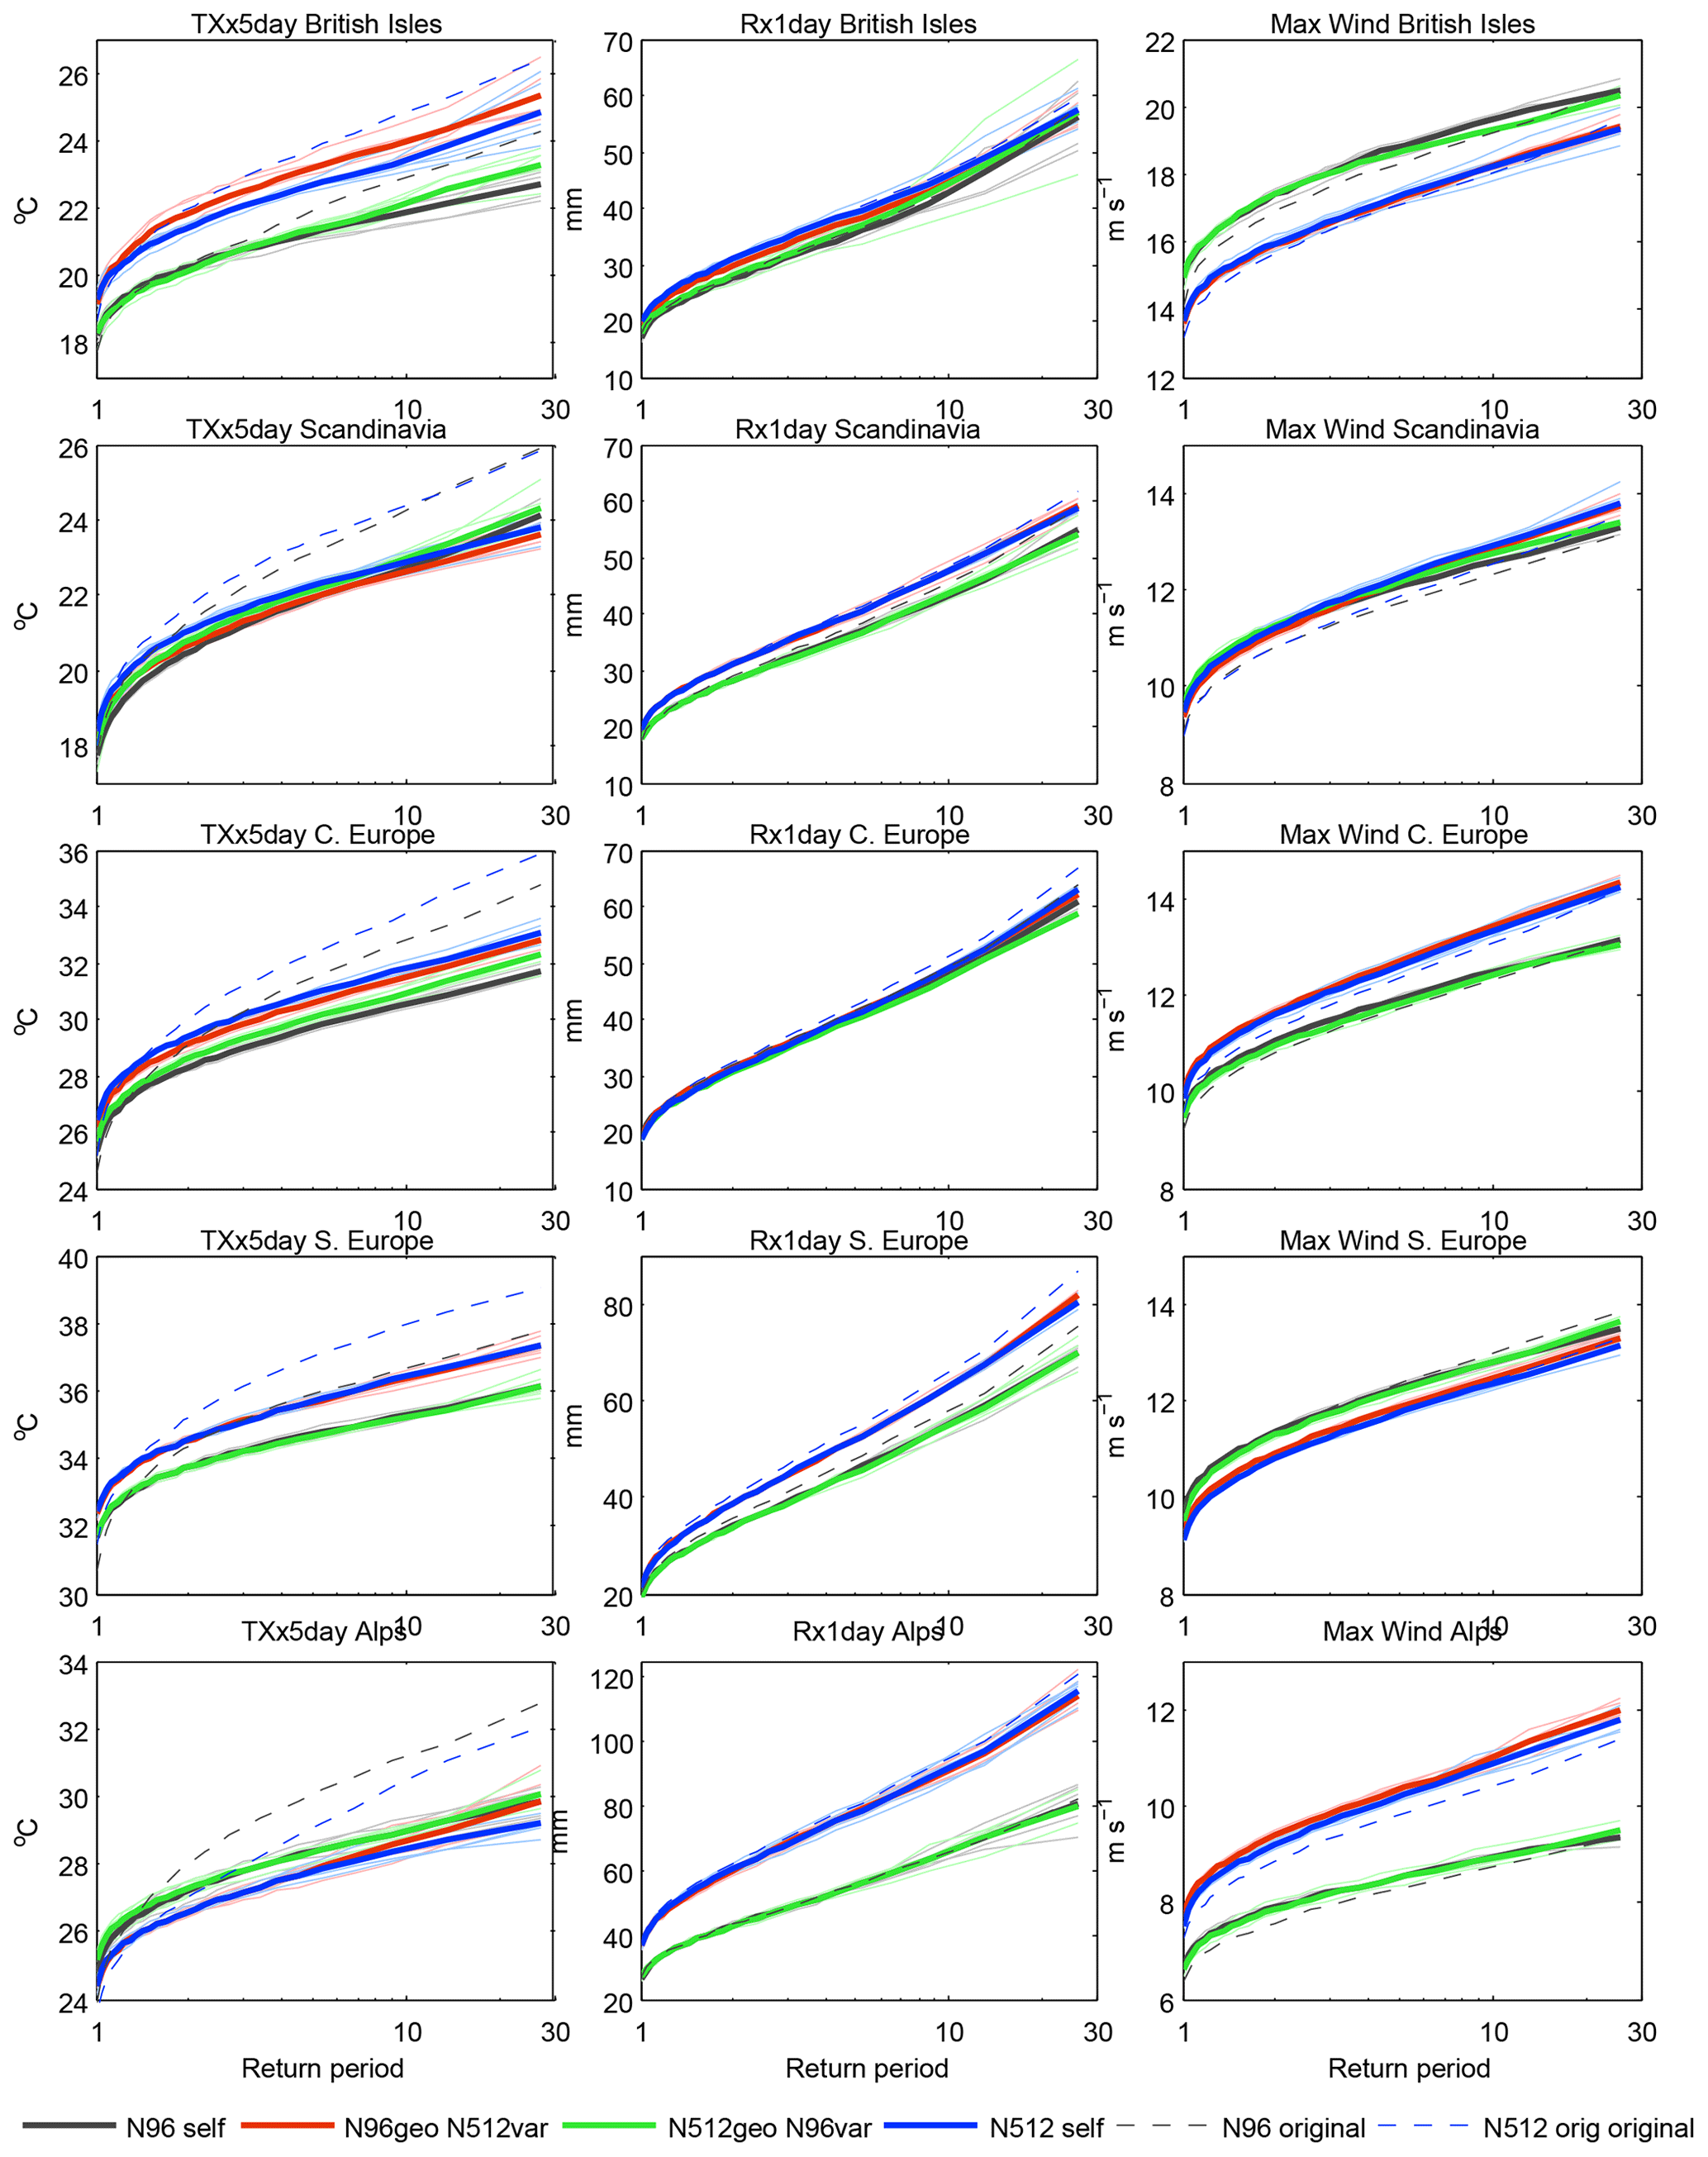
Figure 9Circulation analogue results. Return period plots for (left) TXx5day, (middle) Rx1day, and (right) annual maximum wind for (top) the British Isles, (second row) Scandinavia, (third row) central Europe, (fourth row) southern Europe, and (fifth row) the Alps. Grey represents the N96 self-analogues and blue the N512 self-analogues; red is for N96 circulation with N512 variables (e.g. precipitation), and green is for N512 circulation with N96 variables. Thin lines represent individual ensemble members, and thick lines represent the mean across individual ensemble members. The blue dashed line represents the original N512 ensemble mean results like those shown in Fig. 6 (although sometimes based on a different time period), and the grey dashed lines represent the equivalent for the N96 simulations. Results for TXx5day are based on the period 1985–2011, Rx1day 1986–2011, and wind 1986–2011.
Figure 6 (right column) shows the return period plots for some example regions for annual maximum wind for the UPSCALE simulations, without shifting the climatology. Over all regions examined (except the Mediterranean – not shown), the N512 simulations have stronger winds than the N216 simulations. The position of the curve for N96 is strongly related to how much coastline there is relative to land area per region, e.g. with faster winds than the other simulations over the British Isles and southern Europe but relatively slower winds over central Europe and particularly over the Alps. There are fairly large differences between reanalysis estimates, with ERA5 always having the slowest winds and the model simulations tending to lie between ERA5 and the other two reanalyses for most regions. For the adjusted versions of the return period plots (Fig. S10), differences in the shapes of the tails with resolution are generally small although with marginally heavier tails with increasing resolution over a number of regions, e.g the Alps (not all are shown). MESCAN and DYNAD have slightly heavier tails than ERA5, particularly over the Alps and southern Europe. The shape of the model curves agrees well with all reanalyses over the British Isles, Scandinavia, and central Europe, and it is between ERA5 and the other two reanalyses for the Alps and southern Europe.
In summary, winds are slightly stronger and heavier tailed at higher resolution in HadGEM3-A, except over coastal areas where large coastal grid boxes at low resolution bring strong ocean winds further over land.
4.3 Upscaling versus downscaling
For the global model results, any differences in the representation of extremes according to resolution could come from either upscaling or downscaling effects. Upscaling effects could include a better representation of the large-scale circulation, whilst downscaling allows a better representation of small-scale processes, such as convection, and an improved representation of orography and coastlines. In order to investigate which of these effects leads to the differences between the low-resolution (N96) and high-resolution (N512) HadGEM3-A simulations, we employ a circulation analogue technique (e.g. Vautard et al., 2016), which is frequently used in attribution studies (see e.g. Stott et al., 2016; Cattiaux et al., 2010). The idea is to determine whether the simulation of climate extremes changes between the two resolutions if both were to have the same large-scale circulation, i.e. isolating the downscaling effect, or conversely whether circulation differences explain any differences in extreme events whilst circulation-variable (e.g. precipitation) relationships stay the same, i.e. the upscaling effect.
For each day in the lower-resolution simulations we pick the nearest circulation analogue from anywhere in the higher-resolution simulations, providing it happens at the right time of year (i.e. within a 30 d window centred on the day of the year in question). We then record the associated temperature, precipitation, and wind values from the higher-resolution simulations to make a “u-chronic” dataset (e.g. Jézéquel, et al., 2018) that contains data from the high-resolution simulations but follows the daily sequence of circulation patterns from the low-resolution models. We then repeat the analysis of return periods and values as above. We also do the reverse (find analogues for the N512 circulation in the N96 ensemble and record the N96 temperature). Since results using analogues are not directly comparable to the original results due to the lack of an exact analogue match, we also perform “self-analogues”, i.e. finding circulation analogues for the N96 simulations within the N96 ensemble (excluding the same year from the same ensemble member) and creating a u-chronic time series (and the same for the N512 ensemble). Comparing the resulting return period curves tells us about the contribution of large-scale circulation and downscaling to differences in extremes between the two resolutions. For example, comparing the N96 self-analogue return curve to the version based on N512 circulation but with N96 precipitation shows us the contribution of any differences in the large-scale circulation between the resolutions, i.e. the upscaling effect. Comparing the N96 self-analogue to the version based on N96 circulation with N512 precipitation shows us the downscaling effect, i.e. any difference in the relationship between large-scale circulation and precipitation.
Analogues are defined using geopotential height at 500 hPa, since this avoids complications relating to surface heat lows associated with heatwaves in anticyclonic conditions that occur in summer, whilst also avoiding incomplete data due to mountain ranges. Geopotential height is regridded to a 2∘ grid using bilinear interpolation. This choice ensures that we are comparing analogues with the same resolution and does not penalize small-scale differences. Similarity between circulation states is quantified using pattern correlation, which is not affected by trends in geopotential height with global warming. For precipitation and wind the European domain used is −16 to 44∘ E and 34 to 72∘ N (roughly the same as the domain plotted in the map-based figures). For temperature, a larger domain is used, since the history and trajectory of air masses are important for temperature extremes. This domain is loosely based on the domain used by Cattiaux et al. (2010) and extends over the North Atlantic as well as Europe (−62 to 44∘ E and 24 to 80∘ N). However, results are very similar if the smaller domain is used (not shown). For the 5 d variables (Rx5day and TXx5day) the u-chronic dataset was smoothed using a 5 d running mean. We also tried smoothing the daily geopotential height, precipitation, and temperature datasets first and then performing the analogue analysis. The relationship between the different curves was largely consistent between the two approaches, but absolute values differed and the shape of the curves changed a little. Results presented here are based on the first approach.
Figure 9 shows the results of the analogue analysis. The blue curves show the results for the N512 self-analogues, grey represents the N96 self-analogues; red represents results using the circulation patterns from the N96 runs but with the N512 circulation-variable relationships, and green indicates N512 circulation with N96 circulation-variable relationships. The difference between the blue and red curves (or the grey and green curves) shows the contribution from differences in the large-scale circulation with resolution, whilst the difference between the blue and green curves (or the red and grey curves) indicates the downscaling effect.
For TXx5day downscaling effects are dominant over regions that have a clear difference between resolutions, although circulation differences also have a small effect in some regions such as the British Isles (Fig. 9). For Rx1day the different curves are very close together for some regions, making it difficult to discern the relative contributions from upscaling and downscaling. However, for regions with an obvious difference between resolutions, such as the Alps and southern Europe, downscaling effects seem to be the most important. Interestingly, these are regions where convective precipitation is particularly important for precipitation extremes. For wind extremes downscaling effects also dominate, particularly over the British Isles, central Europe, and the Alps. Results for TXx and Rx5day are very similar to those for TXx5day and Rx1day, respectively (not shown).
Also shown, using dashed lines, are the original ensemble mean results without using analogues. By comparing these with the self-analogue results we can see how successful the analogue technique is in recreating the original distributions. The self-analogue results tend to be close to the original results for wind and Rx1day but below them for Tx5day. Undertaking the 5 d smoothing first rather than last (see above) shifts analogue results upwards above the original curves, but the other aspects of the results are the same (not shown). A similar phenomenon is seen for Rx5day (not shown).
In summary, for all three types of extreme events, downscaling effects appear to dominate the differences seen between the 130 and 25 km HadGEM3-A simulations. This suggests that, at least for this model, any large-scale circulation differences obtained with global high resolution do not affect the statistics of these extreme events much.
We evaluated climate model simulations of temperature, precipitation, and wind extremes over Europe, addressing three issues: (1) the benefits of dynamical downscaling using regional climate models by comparing EURO-CORDEX simulations at two resolutions (12.5 and 50 km) to their driving coarser-resolution CMIP5 models; (2) the benefits of increased resolution for global models by comparing HadGEM3-A simulations at three resolutions (130, 60, and 25 km; referred to as the “UPSCALE” simulations); and (3) whether any differences according to resolution in the global model come from differences in the large-scale circulation (upscaling) or the representation of small-scale processes and features (downscaling) using a circulation analogue method.
For temperature extremes, increased resolution did not make much difference to results for the CORDEX vs. CMIP5 analysis in terms of the shapes of the return period curves, which all agreed well with observational data. Hot biases over mountains were reduced with increased resolution, although the cold bias over Scandinavia was worse in CORDEX than in CMIP5. This amplified Scandinavian cold bias in CORDEX is consistent with the findings of Sørland et al. (2018) for mean summer temperature, although we did not find the same reduction of the warm bias in eastern Europe in CORDEX as they did, possibly due to differences in the models used. Our findings agree with Vautard et al. (2013), who find limited benefits in simulating various aspects of heatwaves between the 0.44 and 0.11∘ versions of the EURO-CORDEX models. The reduction in orographic bias with increased resolution was also seen in the HadGEM3-A GCM simulations, along with a general tendency towards hotter extremes elsewhere, which reduces biases in the north and increases them in the south. Overall, the benefits of increasing resolution were limited or region-dependent. However, our results for the global model analysis are based on only one model, and the new model simulations and analyses being generated as part of the PRIMAVERA and HighResMIP projects (https://www.primavera-h2020.eu/, last access: 1 October 2020; Roberts et al., 2018; Haarsma et al., 2016) will be very useful for determining how representative our results for HadGEM3-A are of other GCMs. For instance, improvement in the simulation of summer blocking, which can be involved in heatwave generation, is very model-dependent (Schiemann et al., 2017). Furthermore, Cattiaux et al. (2013) find that the frequency, intensity, and duration of summer heatwaves improve in the IPSL model with resolution, associated with a better representation of the large-scale circulation. In addition, here we examine only one aspect of heatwaves (intensity), and it could be that results are different for other aspects, such as frequency, duration, and timing.
Precipitation extremes were more sensitive to resolution, particularly in the CMIP5 vs. CORDEX analysis, with heavier tails at higher resolution across all regions. Spatially, CMIP5 shows a general dry bias compared to E-OBS, particularly over mountainous regions, whilst CORDEX shows the opposite, with increasing wet differences at 0.11∘ compared to 0.44∘, which appears to be systematic across models. This is consistent with results for mean precipitation in EURO-CORDEX in Kotlarski et al. (2014). The higher-resolution MESAN reanalysis gave wetter extremes and heavier tails than E-OBS, agreeing best with the 0.44∘ resolution CORDEX simulations. Other studies suggest that country-scale higher-resolution precipitation datasets give even heavier precipitation extremes, which may agree best with the 0.11∘ simulations (e.g. Prein and Gobiet, 2017). Similarly, for mean precipitation, Prein and Gobiet (2017) find that RCM biases are of a similar size as the differences between different observational estimates. For extreme precipitation, various studies find that a number of aspects (biases, frequency–intensity distributions, spatial patterns) of mean and extreme precipitation improve in EURO-CORDEX at 0.11∘ compared to 0.44∘ when compared to such high-resolution datasets (e.g. Prein et al., 2016; Torma et al., 2015; Fantini et al., 2017). Prein et al. (2016) ascribe this mostly to the better representation of orography at higher resolution, but also the ability to capture the larger scales of convection. However, aside from improved spatial patterns, Casanueva et al. (2016) found only limited evidence for improvements in precipitation intensity, frequency, and derived indicators over the Alps and Spain with resolution in EURO-CORDEX. Some of the differences with resolution in our results may also be explained by parameterization schemes that tend to be tuned to one resolution and can behave sub-optimally at others.
For the UPSCALE global simulations, there was less difference in extreme precipitation with resolution, with the biggest differences in southern regions and over or near mountains and with heavier tails and wetter extremes at higher resolution. This reduced dry biases over orography, but wet biases next to some mountain ranges in the south emerged instead. However, these simulations span a narrower range of resolutions, i.e. not reaching the same high resolutions as CORDEX 0.11∘ but also not as coarse as some CMIP5 models. Other global model studies also tend to find an increase in precipitation extremes with increased resolution for Europe, which is continent-wide in summer and concentrated in mountainous regions in winter (Volosciuk et al., 2015; Wehner et al., 2014). This sometimes improves agreement with observational data (e.g. Kopparla et al., 2013; Wehner et al., 2014, for winter) but can overestimate summer extreme precipitation if parameterization schemes are not retuned (Wehner et al., 2014).
For wind extremes, higher resolution gave somewhat stronger winds and heavier tails for most regions for both the CORDEX vs. CMIP5 analysis and to a lesser extent for HadGEM3-A, except for regions dominated by coasts for the latter, for which large coastal grid boxes at lower resolution brought strong ocean winds further over land. Stronger winds with higher resolution are also found in previous studies (e.g. Pryor et al., 2012; Kunz et al., 2010; Gao et al., 2020). The largest differences we found were between CMIP5 and CORDEX at 0.44∘, with less difference between the two resolutions of CORDEX. Differences between reanalysis-based estimates made model evaluation difficult.
The results of the circulation analogue analysis on the HadGEM3-A GCM simulations suggested that downscaling effects were the dominant cause of differences with resolution for all three phenomena, with limited effects of any differences in the representation of the large-scale circulation. If this result also applied to other GCMs, it would suggest that dynamical downscaling with more economical limited-area models would be a better strategy for simulating European extreme events, whilst GCM efforts could focus on other aspects such as multiple members or multi-physics ensembles. However, we cannot reach this conclusion based solely on this analysis, since we examine only a single model, which may not be representative of other models, and because the range of resolutions considered may be too narrow. Demory et al. (2020) and Strandberg and Lind (2020) found that PRIMAVERA GCM simulations and EURO-CORDEX simulations at comparable resolution simulated fairly similar precipitation frequency–intensity distributions, which would agree with a limited influence of upscaling. However, a number of studies do find improvements in the large-scale circulation with resolution, including for extratropical cyclones and storm tracks (Colle et al., 2013; Jung et al., 2006, 2012; Zappa et al., 2013), Euro-Atlantic weather regimes (Dawson et al., 2012, 2018; Cattiaux et al., 2013; Strommen et al., 2019; Fabiano et al., 2020), and blocking (Jung et al., 2012; Anstey et al., 2013; Matsueda et al., 2009, Berckmans et al 2013; Schiemann et al., 2017, 2020; Davini et al 2017a, b; Dawson and Palmer, 2020; see also Introduction). Interestingly, Schiemann et al. (2017) find improvements in Euro-Atlantic blocking with resolution in all seasons in the same HadGEM3-A simulations as we analyse here. However, the net effects on extremes, given all uncertainties, were not explicitly investigated. Our study does not seem to be able to discern such effects. Other studies suggest that benefits from upscaling may require convective-permitting simulations (Hart et al., 2018).
Overall, our results suggest that whether or not increased resolution is beneficial for the simulation of extreme events over Europe depends on the event being considered. Benefits appear to be limited for heatwaves, whereas wind extremes and particularly precipitation extremes are more sensitive. We do not find any particular advantage in using a global high-resolution model compared to regional dynamical downscaling, with the caveats that this investigation needs to be extended to other GCMs, and a wider range of resolutions should be investigated.
In order to fully address the question of the benefits of increased resolution for European climate extremes, a number of aspects remain to be investigated. Firstly, the analysis could be widened to other types of extremes, for example sea level rise and storm surge, or other aspects of extremes could be considered, e.g. the timing, frequency, and duration of events. The global simulations we investigated were atmosphere-only, and the role of increased ocean resolution, vertical resolution, and model top height should be considered. Finally, we assume that better historical performance translates into more accurate future projections. Lhotka et al. (2018) find low sensitivity of heatwave projections to resolution in EURO-CORDEX RCMs. However, Van Haren et al. (2015b) and van der Linden et al. (2019) find stronger future summer drying and heating in central Europe with increased resolution in the EC-Earth GCM due to differences in atmospheric circulation. Concerning precipitation, future projections for large-scale and seasonal mean precipitation are consistent between large-scale regional and convective-permitting models, whilst there is evidence that summer sub-daily intensities increase more in the future in convection-permitting models (Kendon et al., 2014, 2017; Ban et al., 2015). For wind, Willison et al. (2015) find a larger response of the North Atlantic storm track to global warming with higher resolution in the regional WRF model. Furthermore, Baker et al. (2019) find that in winter the polar jet, storm tracks, and associated precipitation shift further north over the Euro-Atlantic region in the future with increased resolution in the same HadGEM3-A set-up as used here. The sensitivity of projections to resolution nevertheless remains an area that needs further research.
Finally, ongoing projects such as HighResMIP for CMIP6 (Haarsma et al., 2016) and the CORDEX Flagship Pilot Studies (FPS), particularly the FPS on Convective Phenomena at High Resolution over Europe and the Mediterranean (Coppola et al., 2019; Jacob et al., 2020), will enable the benefits of high resolution and its effect on European climate projections to be explored more thoroughly. The former will allow a systematic exploration of the effects of increased resolution for multiple GCMs through coordinated experiments simulating the past and future climate. The latter will include a first-of-its-kind large multi-model ensemble at convective-permitting resolution for decadal time slices in the present and future for a large domain covering central Europe and part of the Mediterranean.
The CMIP5 and CORDEX data used for this analysis are available from the Earth System Grid Federation portals and are detailed in Table S1. The HadGEM3-A UPSCALE simulations are available from the CEDA-JASMIN platform. E-OBS can be downloaded here: https://www.ecad.eu/download/ensembles/download.php (ECAD E-OBS gridded dataset, 2017). MESAN is available here: http://exporter.nsc.liu.se/620eed0cb2c74c859f7d6db81742e114/ (SMHI EURO4M MESAN data, 2020). ERA5 and MESCAN are available from the Copernicus Climate Data Store (2020) at https://cds.climate.copernicus.eu, whilst DYNAD winds are available from Tomas Landelius at SMHI.
The supplement related to this article is available online at: https://doi.org/10.5194/gmd-13-5583-2020-supplement.
CI, RV, and SJ conceptualized the study. CI carried out the analysis and wrote the paper. JS managed the CRECP project together with CH and BE, and all co-authors were involved in discussions to prepare the study and helped improve the paper.
The authors declare that they have no conflict of interest.
This work is published in the name of the European Commission, with funding from the European Union through the Copernicus Climate Change Service project C3S_34a Lot 3 (Copernicus Roadmap for European Climate Projections). The European Commission is not responsible for any use that many be made of the information contained. We acknowledge the WCRP's Working Group on Regional Climate and the Working Group on Coupled Modelling – the coordinating body of CORDEX and the panel responsible for CMIP5, respectively. We thank the climate modelling groups for producing and making available the model output listed in Supplement Table S1, which is available at http://pcmdi9.llnl.gov (last access” 1 December 2017). For CMIP, the US Department of Energy's Program for Climate Model Diagnosis and Intercomparison provides coordinating support and led the development of software infrastructure in partnership with the Global Organization for Earth System science portals. We thank the modelling team that produced the UPSCALE simulations and acknowledge the JASMIN and IPSL mesocentre computing clusters on which this analysis was performed. We thank Tomas Landelius from SMHI for making the DYNAD wind data available. We also acknowledge helpful input from the CRECP project scientific advisory board and useful discussions with UK Met Office scientists, in particular Malcolm Roberts and Carol McSweeney. We thank Abhishekh Srivastava and three other anonymous reviewers for their helpful comments and suggestions.
This research has been supported by the Copernicus Climate Change Service (grant no. C3S_34a Lot 3).
This paper was edited by Juan Antonio Añel and reviewed by Abhishekh Srivastava and three anonymous referees.
Anstey, J. A., Davini, P., Gray, L. J., Woollings, T. J., Butchart, N., Cagnazzo, C., Christiansen, B., Hardiman, S. C., Osprey, S. M., and Yang, S.: Multi-model analysis of Northern Hemisphere winter blocking: Model biases and the role of resolution, J. Geophys. Res.-Atmos., 118, 3956–3971, https://doi.org/10.1002/jgrd.50231, 2013.
Bador, M., Boé, J., Terray, L., Alexander, L. V., Baker, A., Bellucci, A., Haarsma, R., Koenigk, T., Moine, M.-P., Lohmann, K, Putrasahan, D. A., Roberts, C., Roberts, M., Scoccimarro, E., Schiemann, R., Seddon, J., Senan, R., Valcke, S., and Vanniere, B.: Impact of higher spatial atmospheric resolution on precipitation extremes over land in global climate models, J. Geophys. Res.-Atmos., 125, e2019JD032184, https://doi.org/10.1029/2019JD032184, 2020.
Baker, A. J., Schiemann, R., Hodges, K. I., Demory, M., Mizielinski, M. S., Roberts, M. J., Shaffrey, L. C., Strachan, J., and Vidale, P. L.: Enhanced Climate Change Response of Wintertime North Atlantic Circulation, Cyclonic Activity, and Precipitation in a 25-km-Resolution Global Atmospheric Model, J. Climate, 32, 7763–7781, https://doi.org/10.1175/JCLI-D-19-0054.1, 2019.
Ban, N., Schmidli, J., and Schär, C.: Heavy precipitation in a changing climate: Does short-term summer precipitation increase faster?, Geophys. Res. Lett., 42, 1165–1172, https://doi.org/10.1002/2014GL062588, 2015.
Bazile, E., Abida, R., Verrelle, A., Le Moigne, P., and Szczypta, C.: Report for the 55years MESCAN-SURFEX re-analysis, deliverable D2.8 of the UERRA project, 22 pp., available at: http://www.uerra.eu/publications/deliverable-reports.html (last access: 21 February 2020), 2017.
Berckmans, J., Woollings, T., Demory, M. E., Vidale, P.-L., and Roberts, M.: Atmospheric blocking in a high resolution climate model: influences of mean state, orography and eddy forcing, Atmos. Sci. Lett., 14, 34–40, https://doi.org/10.1002/asl2.412, 2013.
Casanueva, A., Kotlarski, S., Herrera, S., Fernández, J., Gutiérrez, J.M., Boberg, F., Colette, A., Christensen, O. B., Goergen, K., Jacob, D., Keuler, K., Nikulin, G., Teichmann C., and Vautard, R.: Daily precipitation statistics in a EURO-CORDEX RCM ensemble: added value of raw and bias-corrected high-resolution simulations, Clim. Dynam., 47, 719–737, https://doi.org/10.1007/s00382-015-2865-x, 2016.
Cattiaux, J., Vautard, R., Cassou, C., Yiou, P., Masson-Delmotte, V., and Codron, F.: Winter 2010 in Europe: A cold extreme in a warming climate, Geophys. Res. Lett., 37, L20704, https://doi.org/10.1029/2010GL044613, 2010.
Cattiaux, J., Quesada, B., Arakélian, A., Codron, F., Vautard, R., and Yiou, P.: North-Atlantic dynamics and European temperature extremes in the IPSL model: sensitivity to atmospheric resolution, Clim. Dynam., 40, 2293–2310, https://doi.org/10.1007/s00382-012-1529-3, 2013.
Christensen, J. H. and Christensen, O. B.: A summary of the PRUDENCE model projections of changes in European climate by the end of this century, Climatic Change, 81, 7–30, https://doi.org/10.1007/s10584-006-9210-7, 2007.
Colle, B. A., Zhang, Z., Lombardo, K., Liu, P., Chang, E., and Zhang, M.: Historical evaluation and future prediction in Eastern North America and western Atlantic extratropical cyclones in the CMIP5 models during the cool season, J. Climate, 26, 882–903, https://doi.org/10.1175/JCLI-D-12-00498.1, 2013.
Copernicus Climate Data Store: available at: https://cds.climate.copernicus.eu/#!/home, last access: 28 January 2020.
Coppola, E., Sobolowski, S., Pichelli, E., Raffaele, F., Ahrens, B., Anders, I., Ban, N., Bastin, S., Belda, M., Belusic, D., Caldas-Alvarez, A., Margarida Cardos, R., Davolio, S., Dobler, A., Fernandez, J., Fita Borrell, L., Fumiere, Q., Giorgi, F., Goergen, K., Guettler, I., Halenka, T., Heinzeller, D., Hodnebrog, Ø., Jacob, D., Kartsios, S., Katragko, E., Kendon, E., Khodayar, S., Kunstmann, H., Knist, S., Lavín, A., Lind, P., Lorenz, T., Maraun, D., Marelle, L., van Meijgaard, E., Milovac, J., Myhre, G., Panitz, H.-J., Piazza, M., Raffa, M., Raub, T., Rockel, B., Schär, C., Sieck, K., Soares, P. M. M., Somot, S., Srnec, L., Stocchi, P., Tölle, M., Truhetz, H., Vautard, R., de Vries, H., and Warrach-Sagi, K.: A first-of-its-kind multi-model convection permitting ensemble for investigating convective phenomena over Europe and the Mediterranean, Clim. Dynam., 55, 3–34, https://doi.org/10.1007/s00382-018-4521-8, 2020.
Dahlgren, P., Landelius, T., Kållberg, P., and Gollvik, S., A high-resolution regional reanalysis for Europe. Part 1: Three-dimensional reanalysis with the regional HIgh-Resolution Limited-Area Model (HIRLAM), Q. J. Roy. Meteor. Soc., 142, 2119–2131, https://doi.org/10.1002/qj.2807, 2016.
Davini, P., Corti, S., D'Andrea, F., Rivière, G., and von Hardenberg, J.: Improved Winter European Atmospheric Blocking Frequencies in High-Resolution Global Climate Simulations, J. Adv. Model. Earth Syst., 9, 2615–2634, https://doi.org/10.1002/2017MS001082, 2017a.
Davini, P., von Hardenberg, J., Corti, S., Christensen, H. M., Juricke, S., Subramanian, A., Watson, P. A. G., Weisheimer, A., and Palmer, T. N.: Climate SPHINX: evaluating the impact of resolution and stochastic physics parameterisations in the EC-Earth global climate model, Geosci. Model Dev., 10, 1383–1402, https://doi.org/10.5194/gmd-10-1383-2017, 2017b.
Davini, P. and D'Andrea, F.: From CMIP-3 to CMIP-6: Northern Hemisphere atmospheric blocking simulation in present and future climate, J. Climate, 33, 10021–10038, https://doi.org/10.1175/JCLI-D-19-0862.1, 2020.
Dawson, A. and Palmer, T. N.: Simulating weather regimes: impact of model resolution and stochastic parameterization, Clim. Dynam., 44, 2177–2193, https://doi.org/10.1007/s00382-014-2238-x, 2015.
Dawson, A., Palmer, T. N., and Corti, S.: Simulating regime structures in weather and climate prediction models, Geophys. Res. Lett., 39, L21805, https://doi.org/10.1029/2012GL053284, 2012.
Demory, M.-E., Vidale, P. L., Roberts, M. J., Berrisford, P., Strachan, J., Schiemann, R., and Mizielinski, M. S.: The role of horizontal resolution in simulating drivers of the global hydrological cycle, Clim. Dynam., 42, 2201–2225, https://doi.org/10.1007/s00382-013-1924-4, 2014.
Demory, M.-E., Berthou, S., Sørland, S. L., Roberts, M. J., Beyerle, U., Seddon, J., Haarsma, R., Schär, C., Christensen, O. B., Fealy, R., Fernandez, J., Nikulin, G., Peano, D., Putrasahan, D., Roberts, C. D., Steger, C., Teichmann, C., and Vautard, R.: Can high-resolution GCMs reach the level of information provided by 12–50 km CORDEX RCMs in terms of daily precipitation distribution?, Geosci. Model Dev. Discuss., https://doi.org/10.5194/gmd-2019-370, in review, 2020.
de Vries, H., Scher, S., Haarsma, R., Drijfhout, S., and van Delden, A.: How Gulf-Stream SST-fronts influence Atlantic winter storms, Clim. Dynam., 52, 5899–5909, https://doi.org/10.1007/s00382-018-4486-7, 2019.
Donat, M. G., Leckebusch, G. C., Wild, S., and Ulbrich, U.: Benefits and limitations of regional multi-model ensembles for storm loss estimations, Clim. Res., 44, 211–225, https://doi.org/10.3354/cr00891, 2010.
Donlon, C. J., Martin, M., Stark, J., Roberts-Jones, J., Fiedler, E., and Wimmer, W.: The Operational Sea Surface Temperature and Sea Ice Analysis (OSTIA) system, Remote Sens. Environ., 116, 140–158, https://doi.org/10.1016/j.rse.2010.10.017, 2012.
ECAD E-OBS gridded dataset: available at: https://www.ecad.eu/download/ensembles/download.php, last access: 20 November 2017.
Eyring, V., Bony, S., Meehl, G. A., Senior, C. A., Stevens, B., Stouffer, R. J., and Taylor, K. E.: Overview of the Coupled Model Intercomparison Project Phase 6 (CMIP6) experimental design and organization, Geosci. Model Dev., 9, 1937–1958, https://doi.org/10.5194/gmd-9-1937-2016, 2016.
Fabiano, F., Christensen, H. M., Strommen, K., Athanasiadis, P., Baker, A., Schiemann, R., and Corti, S.: Euro-Atlantic weather Regimes in the PRIMAVERA coupled climate simulations: impact of resolution and mean state biases on model performance, Clim. Dynam., 54, 5031–5048, https://doi.org/10.1007/s00382-020-05271-w, 2020.
Fantini, A., Raffaele, F., Torma, C., Bacer, S., Coppola, E., Giorgi, F., Ahrens, B., Dubois, C., Sanchez, E., and Verdecchia, M.: Assessment of multiple daily precipitation statistics in ERA-Interim driven Med-CORDEX and EURO-CORDEX experiments against high resolution observations, Clim. Dynam., 51, 877–900, https://doi.org/10.1007/s00382-016-3453-4, 2018.
Førland, E. J., Allerup, P., Dahlström, B., Elomaa, E., Jonsson, T., Madsen, H., Perala, J., Rissanen, P., Vedin, H., and Vejen, F.: M.: Manual for Operational Correction of Nordic Precipitation Data, Norwegian Meteorological Institute, Oslo, Norway, Report no. 24/96, ISSN 0805-9918, 72 pp., 1996.
Gao, J., G., Shoshiro, M., Roberts, M. J., Haarsma, R., Putrasahan, D., Roberts, C. D., Scoccimarro, E., Terray, L., Vannière, B., and Vidale, P. L.: Influence of model resolution on bomb cyclones revealed by HighResMIP-PRIMAVERA simulations, Environ. Res. Lett., 15, 084001, https://doi.org/10.1088/1748-9326/ab88fa, 2020.
Giorgi F., Jones C., and Asrar G. R.: Addressing climate information needs at the regional level: the CORDEX framework, WMO Bull., 58, 175–183, 2009.
Goodison, B. E., Louie, P. Y., and Yang, D.: The WMO solid precipitation measurement intercomparison, World Meteorological Organization-Publications-WMO TD, Geneva, Switzerland, Report No. 67, 65–70, 1997.
Gutjahr, O., Schefczyk, L., Reiter, P., and Heinemann, G.: Impact of the horizontal resolution on the simulation of extremes in COSMO-CLM, Meteorol. Z., 25, 543–562, https://doi.org/10.1127/metz/2016/0638, 2016.
Haarsma, R. J., Roberts, M. J., Vidale, P. L., Senior, C. A., Bellucci, A., Bao, Q., Chang, P., Corti, S., Fučkar, N. S., Guemas, V., von Hardenberg, J., Hazeleger, W., Kodama, C., Koenigk, T., Leung, L. R., Lu, J., Luo, J.-J., Mao, J., Mizielinski, M. S., Mizuta, R., Nobre, P., Satoh, M., Scoccimarro, E., Semmler, T., Small, J., and von Storch, J.-S.: High Resolution Model Intercomparison Project (HighResMIP v1.0) for CMIP6, Geosci. Model Dev., 9, 4185–4208, https://doi.org/10.5194/gmd-9-4185-2016, 2016.
Hart, N. C. G., Washington, R., and Stratton, R. A.: Stronger local overturning in convective-permitting regional climate model improves simulation of the subtropical annual cycle, Geophys. Res. Lett., 45, 11334–11342, https://doi.org/10.1029/2018GL079563, 2018.
Haylock, M. R., Hofstra, N., Klein Tank, A. M. G., Klok, E. J., Jones, P. D., and New, M.: A European daily high-resolution gridded data set of surface temperature and precipitation for 1950–2006, J. Geophys. Res.-Atmos., 113, D20119, https://doi.org/10.1029/2008JD010201, 2008.
Herrera, S., Cardoso, R. M., Soares, P. M., Espírito-Santo, F., Viterbo, P., and Gutiérrez, J. M.: Iberia01: a new gridded dataset of daily precipitation and temperatures over Iberia, Earth Syst. Sci. Data, 11, 1947–1956, https://doi.org/10.5194/essd-11-1947-2019, 2019.
Herrmann, M., Somot, S., Calmanti, S., Dubois, C., and Sevault, F.: Representation of spatial and temporal variability of daily wind speed and of intense wind events over the Mediterranean Sea using dynamical downscaling: impact of the regional climate model configuration, Nat. Hazards Earth Syst. Sci., 11, 1983–2001, https://doi.org/10.5194/nhess-11-1983-2011, 2011.
Hersbach, H., Bell, B., Berrisford, P., Horányi, A., Muñoz-Sabater, J., Nicolas, J., Radu, R., Schepers, D., Simmons, A., Soci, C., and Dee, D.: Global reanalysis: goodbye ERA-Interim, hello ERA5, ECMWF Newsletter, 159, 17–24, https://doi.org/10.21957/vf291hehd7, 2019.
Jacob, D., Petersen, J., Eggert, B., Alias, A., Christensen, O. B., Bouwer, L. M., Braun, A., Colette, A., Déqué, M., Georgievski, G., Georgopoulou, E., Gobiet, A., Menut, L., Nikulin, G., Haensler, A., Hempelmann, N., Jones, C., Keuler, K., Ko-vats, S., Kröner, N., Kotlarski, S., Kriegsmann, A., Martin, E., van Meijgaard, E., Moseley, C., Pfeifer, S., Preuschmann, S., Radermacher, C., Radtke, K., Rechid, D., Rounsevell, M., Samuelsson, P., Somot, S., Soussana, J.-F., Teichmann, C., Valentini, R., Vautard, R., Weber, B., and Yiou, P.: EURO-CORDEX: new high-resolution climate change projections for European impact research, Reg. Environ. Change, 14, 563–578, https://doi.org/10.1007/s10113-013-0499-2, 2014.
Jacob, D., Teichmann, C., Sobolowski, S., Katragkou, E., Anders, I., Belda, M., Benestad, R., Boberg, F., Buonomo, E., Cardoso, R. M., Casanueva, A., Christensen, O. B., Christensen, J. H., Coppola, E., De Cruz, L., Davin, E. L., Dobler, A., Domínguez, M., Fealy, R., Fernandez, J., Gaertner, M. A., García-Díez, M., Giorgi, F., Gobiet, A., Goergen, K., Gómez-Navarro, J. J., Alemán, J. J. G., Gutiérrez, C., Gutiérrez, J. M., Güttler, I., Haensler, A., Halenka, T., Jerez, S., Jiménez-Guerrero, P., Jones, R. G., Keuler, K., Kjellström, E., Knist, S., Kotlarski, S., Maraun, D., van Meijgaard, E., Mercogliano, P., Montávez, J. P., Navarra, A., Nikulin, G., de Noblet-Ducoudré, N., Panitz, H.-J., Pfeifer, S., Piazza, M., Pichelli, E., Pietikäinen, J.-P., Prein, A. F., Preuschmann, S., Rechid, D., Rockel, B., Romera, R., Sánchez, E., Sieck, K., Soares, P. M. M., Somot, S., Srnec, L., Sørland, S. L., Termonia, P., Truhetz, H., Vautard, R., Warrach-Sagi, K., and Wulfmeyer, V.: Regional climate downscaling over Europe: perspectives from the EURO-CORDEX community, Reg. Environ. Change, 20, 1–20, https://doi.org/10.1007/s10113-020-01606-9, 2020.
Jézéquel, A., Yiou, P., and Radanovics, S.: Role of circulation in European heatwaves using flow analogues, Clim. Dynam., 50, 1145–1159, https://doi.org/10.1007/s00382-017-3667-0, 2018.
Jourdier, B.: Evaluation of ERA5, MERRA-2, COSMO-REA6, NEWA and AROME to simulate wind power production over France, Adv. Sci. Res., 17, 63–77, https://doi.org/10.5194/asr-17-63-2020, 2020.
Jung, T., Gulev, S. K., Rudeva, I., and Soloviov, V.: Sensitivity of extratropical cyclone characteristics to horizontal resolution in the ECMWF model, Q. J. Roy. Meteor. Soc., 132, 1839–1857, https://doi.org/10.1256/qj.05.212, 2006.
Jung, T., Miller, M. J., Palmer, T. N., Towers, P., Wedi, N., Achuthavarier, D., Adams, J. M., Altshuler, E. L., Cash, B. A., Kinter, J. L., Marx, L., Stan, C., and Hodges, K. I.: High-Resolution Global Climate Simulations with the ECMWF Model in Project Athena: Experimental Design, Model Climate, and Seasonal Forecast Skill, J. Climate, 25, 3155–3172, https://doi.org/10.1175/JCLI-D-11-00265.1, 2012.
Kendon, E. J., Roberts, N. M., Senior, C. A., and Roberts, M. J.: Realism of rainfall in a very high-resolution regional climate model, J. Climate, 25, 5791–5806, https://doi.org/10.1175/JCLI-D-11-00562.1, 2012.
Kendon, E. J., Roberts, N. M., Fowler, H. J., Roberts, M. J., Chan, S. C., and Senior, C. A.: Heavier summer downpours with climate change revealed by weather forecast resolution model, Nat. Clim. Change, 4, 570–576, https://doi.org/10.1038/nclimate2258, 2014.
Kendon, E. J., Ban, N., Roberts, N. M., Fowler, H. J., Roberts, M. J., Chan, S. C., Evans, J. P., Fosser, G., and Wilkinson, J. M.: Do Convection-Permitting Regional Climate Models Improve Projections of Future Precipitation Change?, B. Am. Meteorol. Soc., 98, 79–93, https://doi.org/10.1175/BAMS-D-15-0004.1, 2017.
Klaver, R., Haarsma, R., Vidale, P. L., and Hazeleger, W.: Effective resolution in high resolution global atmospheric models for climate studies, Atmos. Sci. Lett., 21:e952, 1–8, https://doi.org/10.1002/asl.952, 2020.
Kopparla, P., Fischer, E. M., Hannay, C., and Knutti, R.: Improved simulation of extreme precipitation in a high-resolution atmosphere model, Geophys. Res. Lett., 40, 5803–5808, https://doi.org/10.1002/2013GL057866, 2013.
Kotlarski, S., Keuler, K., Christensen, O. B., Colette, A., Déqué, M., Gobiet, A., Goergen, K., Jacob, D., Lüthi, D., van Meijgaard, E., Nikulin, G., Schär, C., Teichmann, C., Vautard, R., Warrach-Sagi, K., and Wulfmeyer, V.: Regional climate modeling on European scales: a joint standard evaluation of the EURO-CORDEX RCM ensemble, Geosci. Model Dev., 7, 1297–1333, https://doi.org/10.5194/gmd-7-1297-2014, 2014.
Kunz, M., Mohr, S., Rauthe, M., Lux, R., and Kottmeier, Ch.: Assessment of extreme wind speeds from Regional Climate Models – Part 1: Estimation of return values and their evaluation, Nat. Hazards Earth Syst. Sci., 10, 907–922, https://doi.org/10.5194/nhess-10-907-2010, 2010.
Landelius, T., Dahlgren, P., Gollvik, S., Jansson, A., and Olsson, E.: A high-resolution regional reanalysis for Europe. Part 2: 2D analysis of surface temperature, precipitation and wind, Q. J. R. Meteorol. Soc, 142, 2132–2142, https://doi.org/10.1002/qj.2813, 2016.
Lhotka, O., Kyselý, J., and Farda, A.: Climate change scenarios of heat waves in Central Europe and their uncertainties, Theor. Appl. Climatol., 131, 1043–1054, https://doi.org/10.1007/s00704-016-2031-3, 2018.
Matsueda, M., Mizuta, R., and Kusunoki, S.: Future change in wintertime atmospheric blocking simulated using a 20-km-mesh atmospheric global circulation model, J. Geophys. Res., 114, D12114, https://doi.org/10.1029/2009JD011919, 2009.
Mizielinski, M. S., Roberts, M. J., Vidale, P. L., Schiemann, R., Demory, M.-E., Strachan, J., Edwards, T., Stephens, A., Lawrence, B. N., Pritchard, M., Chiu, P., Iwi, A., Churchill, J., del Cano Novales, C., Kettleborough, J., Roseblade, W., Selwood, P., Foster, M., Glover, M., and Malcolm, A.: High-resolution global climate modelling: the UPSCALE project, a large-simulation campaign, Geosci. Model Dev., 7, 1629–1640, https://doi.org/10.5194/gmd-7-1629-2014, 2014.
Niermann, D., Kaiser-Weiss, A., Borsche, M., van den Besselaar, E., Lussana, C., Isotta, F., Frei, C, Cantarello, L., Tveito, O. E., van der Schrier, G., Cornes, R., Vreede, E., Bojariu, R., and Davie, J.: Report for Deliverable 3.6 of the UERRA project: Scientific report on assessment of regional analysis against independent data sets, 138 pp., available at: http://www.uerra.eu/publications/deliverable-reports.html (last access: 8 February 2020), 2017.
O'Brien, T. A., Collins, W. D., Kashinath, K., Rübel, O., Byna, S., Gu, J., Krishnan, H., and Ullrich, P. A.: Resolution dependence of precipitation statistical fidelity in hindcast simulations, J. Adv. Model. Earth Syst., 8, 976–990, https://doi.org/10.1002/2016MS000671, 2016.
O'Reilly, C. H., Minobe, S., and Kuwano-Yoshida, A.: The influence of the Gulf Stream on wintertime European blocking, Clim. Dynam., 47, 1545–1567, https://doi.org/10.1007/s00382-015-2919-0, 2016.
Prein, A. F. and Gobiet, A.: Impacts of uncertainties in European gridded precipitation observations on regional climate analysis, Int. J. Climatol., 37, 305–327, https://doi.org/10.1002/joc.4706, 2017.
Prein, A. F., Langhans, W., Fosser, G., Ferrone, A., Ban, N., Goergen, K., Keller, M., Tölle, M., Gutjahr, O., Feser, F., Brisson, E., Kollet, S., Schmidli, J., Van Lipzig, N. P. M., and Leung, R.: A review on regional convection-permitting climate modeling: Demonstrations, prospects, and challenges, Rev. Geophys., 53, 323–361, https://doi.org/10.1002/2014RG000475, 2015.
Prein, A. F., Gobiet, A., Truhetz, H., Keuler, K., Goergen, K., Teichmann, C., Fox Maule, C., van Meijgaard, E., Déqué, M., Nikulin, G., Vautard, R., Colette, A., Kjellström, E., and Jacob, D.: Precipitation in the EURO-CORDEX 0.11∘ and 0.44∘ simulations: high resolution, high benefits?, Clim. Dynam., 46, 383–412, https://doi.org/10.1007/s00382-015-2589-y, 2016.
Pryor, S. C., Nikulin, G., and Jones, C.: Influence of spatial resolution on regional climate model derived wind climates, J. Geophys. Res., 117, D03117, https://doi.org/10.1029/2011JD016822, 2012.
Risanto, C. B., Castro, C. L., Moker Jr., J. M., Arellano Jr., A. F., Adams, D. K., Fierro, L. M., Minjarez Sosa, C. M.: Evaluating Forecast Skills of Moisture from Convective-Permitting WRF-ARW Model during 2017 North American Monsoon Season, Atmosphere-Basel, 10, 694, https://doi.org/10.3390/atmos10110694, 2019.
Roberts, M. J., Vidale, P. L., Senior, C., Hewitt, H. T., Bates, C., Berthou, S., Chang, P., Christensen, H. M., Danilov, S., Demory, M. E., Griffies, S. M., Haarsma, R., Jung, T., Martin, G., Minobe, S., Ringler, T., Satoh, M., Schiemann, R., Scoccimarro, E., Stephens, G., and Wehner, M. F.: The benefits of global high-resolution for climate simulation: process-understanding and the enabling of stakeholder decisions at the regional scale, B. Am. Meteorol. Soc., 99, 2341–2359, https://doi.org/10.1175/BAMS-D-15-00320.1, 2018.
Ruti, P. M., Somot, S., Giorgi, F., Dubois, C., Flaounas, E., Obermann, A., Dell'Aquila, A., Pisacane, G., Harzallah, A., Lombardi, E., Ahrens, B., Akhtar, N., Alias, A., Arsouze, T., Aznar, R., Bastin, S., Bartholy, J., Béranger, K., Beuvier, J., Bouffies-Cloché, S., Brauch, J., Cabos, W., Calmanti, S., Calvet, J., Carillo, A., Conte, D., Coppola, E., Djurdjevic, V., Drobinski, P., Elizalde-Arellano, A., Gaertner, M., Galàn, P., Gallardo, C., Gualdi, S., Goncalves, M., Jorba, O., Jordà, G., L'Heveder, B., Lebeaupin-Brossier, C., Li, L., Liguori, G., Lionello, P., Maciàs, D., Nabat, P., Önol, B., Raikovic, B., Ramage, K., Sevault, F., Sannino, G., Struglia, M. V., Sanna, A., Torma, C., and Vervatis, V.: Med-CORDEX Initiative for Mediterranean Climate Studies. B. Am. Meteorol. Soc., 97, 1187–1208, https://doi.org/10.1175/BAMS-D-14-00176.1, 2016.
Schiemann, R., Demory, M. E., Shaffrey, L. C., Strachan, J., Vidale, P. L., Mizielinski, M. S., Roberts, M. J., Matsueda, M., Wehner, M. F., and Jung, T.: The resolution sensitivity of Northern Hemisphere blocking in four 25-km atmospheric global circulation models, J. Climate, 30, 337–358, https://doi.org/10.1175/JCLI-D-16-0100.1, 2017.
Schiemann, R., Vidale, P. L., Shaffrey, L. C., Johnson, S. J., Roberts, M. J., Demory, M.-E., Mizielinski, M. S., and Strachan, J.: Mean and extreme precipitation over European river basins better simulated in a 25 km AGCM, Hydrol. Earth Syst. Sci., 22, 3933–3950, https://doi.org/10.5194/hess-22-3933-2018, 2018.
Schiemann, R., Athanasiadis, P., Barriopedro, D., Doblas-Reyes, F., Lohmann, K., Roberts, M. J., Sein, D. V., Roberts, C. D., Terray, L., and Vidale, P. L.: Northern Hemisphere blocking simulation in current climate models: evaluating progress from the Climate Model Intercomparison Project Phase 5 to 6 and sensitivity to resolution, Weather Clim. Dynam., 1, 277–292, https://doi.org/10.5194/wcd-1-277-2020, 2020.
Seneviratne, S. I., Nicholls, N., Easterling, D., Goodess, C. M., Kanae, S., Kossin, J., Luo, Y., Marengo, J., McInnes, K., Rahimi, M., Reichstein, M., Sorteberg, A., Vera, C., and Zhang, X.: Changes in climate extremes and their impacts on the natural physical environment, in: Managing the Risks of Extreme Events and Disasters to Advance Climate Change Adaptation. A Special Report of Working Groups I and II of the Intergovernmental Panel on Climate Change, edited by: Field, C. B., Barros, V., Stocker, T. F., Qin, D., Dokken, D. J., Ebi, K., L. Mastrandrea, M. D., Mach, K. J., Plattner, G.-K., Allen, S. K., Tignor, M., and Midgley, P. M., Cambridge University Press, Cambridge, UK, and New York, NY, USA, 109–230, 2012.
Shields, C. A., Kiehl, J. T., and Meehl, G. A.: Future changes in regional precipitation simulated by a half-degree coupled climate model: Sensitivity to horizontal resolution, J. Adv. Model. Earth Syst., 8, 863–884, https://doi.org/10.1002/2015MS000584, 2016.
Skamarock, W. C.: Evaluating Mesoscale NWP Models Using Kinetic Energy Spectra, Mon. Weather Rev., 132, 3019–3032, https://doi.org/10.1175/MWR2830.1, 2004.
SMHI EURO4M MESAN data: European high-resolution surafce reanalysis published as a CLIPC activity, available at: http://exporter.nsc.liu.se/620eed0cb2c74c859f7d6db81742e114/, last access: 13 November 2020.
Strandberg, G. and Lind, P.: The importance of model resolution on simulated precipitation in Europe – from global to regional model, Weather Clim. Dynam. Discuss., https://doi.org/10.5194/wcd-2020-31, in review, 2020.
Stott, P. A., Christidis, N., Otto, F. E., Sun, Y., Vanderlinden, J., van Oldenborgh, G. J., Vautard, R., von Storch, H., Walton, P., Yiou, P., and Zwiers, F. W.: Attribution of extreme weather and climate-related events, WIREs Clim. Change, 7, 23–41, https://doi.org/10.1002/wcc.380, 2016.
Strommen, K., Mavilia, I., Corti, S., Matsueda, M., Davini, P., von Hardenberg, J., Vidale, P.-L., and Mizuta, R.: The sensitivity of Euro-Atlantic regimes to model horizontal resolution, Geophys. Res. Lett., 46, 7810–7818, https://doi.org/10.1029/2019GL082843, 2019.
Taylor, K., Williamson, D., and Zwiers, F.: The sea surface temperature and sea-ice concentration boundary conditions for AMIP II simulations, Tech. Rep. 60, PCMDI, 25 pp., available at: https://pcmdi.llnl.gov/mips/amip/amip2/AMIP2EXPDSN/BCS/amip2bcs.html (last access: 11 November 2020), 2000.
Taylor, K. E., Stouffer, R. J., and Meehl, G. A.: An overview of CMIP5 and the experiment design, B. Am. Meteorol. Soc., 93, 485498, https://doi.org/10.1175/BAMS-D-11-00094.1, 2012.
Terai, C. R., Caldwell, P. M., Klein, S. A. Tang, Q., and Branstetter, M. L.: The atmospheric hydrologic cycle in the ACME v0.3 model, Clim. Dynam., 50, 3251–3279, https://doi.org/10.1007/s00382-017-3803-x, 2018.
Torma, C., Giorgi, F., and Coppola, E.: Added value of regional climate modeling over areas characterized by complex terrain – Precipitation over the Alps, J. Geophys. Res.-Atmos., 120, 3957–3972, https://doi.org/10.1002/2014JD022781, 2015.
van der Linden, E. C., Haarsma, R. J., and van der Schrier, G.: Impact of climate model resolution on soil moisture projections in central-western Europe, Hydrol. Earth Syst. Sci., 23, 191–206, https://doi.org/10.5194/hess-23-191-2019, 2019.
Van Haren, R., Haarsma, R. J., Van Oldenborgh, G. J., and Hazeleger, W.: Resolution Dependence of European Precipitation in a State-of-the-Art Atmospheric General Circulation Model, J. Climate, 28, 5134–5149, https://doi.org/10.1175/JCLI-D-14-00279.1, 2015a.
Van Haren, R., Haarsma, R. J., de Vries, H., van Oldenborgh, G. J., and Hazeleger, W.: Resolution dependence of circulation forced future central European summer drying, Environ. Res. Lett., 10, 055002, https://doi.org/10.1088/1748-9326/10/5/055002, 2015b.
Vanniere, B., Vidale, P. L., Demory, M.-E., Schiemann, R., Roberts, M. J., Roberts, C. D., Matsueda, M., Terray, L., Koenigk, T., and Senan, R.: Multi-model evaluation of the sensitivity of the global energy budget and hydrological cycle to resolution, Clim. Dynam., 52, 6817–6846, https://doi.org/10.1007/s00382-018-4547-y, 2019.
Vautard, R., Gobiet, A., Jacob, D., Belda, M., Colette, A., Déqué, M., Fernández, J., García-Díez, M., Goergen, K., Güttler, I., Halenka, T., Karacostas, T., Katragkou, E., Keuler, K., Kotlarski, S., Mayer, S., van Meijgaard, E., Nikulin, G., Patarcic, M., Scinocca, J., Sobolowski, S., Suklitsch, M., Teichmann, C., Warrach-Sagi, K., Wulfmeyer, V., and Yiou, P.: The simulation of European heat waves from an ensemble of regional climate models within the EURO-CORDEX project, Clim. Dynam., 41, 2555–2575, https://doi.org/10.1007/s00382-013-1714-z, 2013.
Vautard, R., Yiou, P., Otto, F., Stott, P., Christidis, N., van Oldenborgh, G. J., and Schaller, N.: Attribution of human-induced dynamical and thermodynamical contributions in extreme weather events, Environ. Res. Lett., 11, 114009, https://doi.org/10.1088/1748-9326/11/11/114009, 2016.
Volosciuk, C., Maraun, D., Semenov, V. A., and Park, W.: Extreme Precipitation in an Atmosphere General Circulation Model: Impact of Horizontal and Vertical Model Resolutions, J. Climate, 28, 1184–1205, https://doi.org/10.1175/JCLI-D-14-00337.1, 2015.
Wehner, M. F., Smith, R. L., Bala, G., and Duffy, P.: The effect of horizontal resolution on simulation of very extreme US precipitation events in a global atmosphere model, Clim. Dynam., 34, 241–247, https://doi.org/10.1007/s00382-009-0656-y, 2010.
Wehner, M. F., Reed, K. A., Li, F., Prabhat, Bacmeister, J., Chen, C.-T., Paciorek, C., Gleckler, P. J., Sperber, K. R., Collins, W. D., Gettelman, A., and Jablonowski, C.: The effect of horizontal resolution on simulation quality in the Community Atmospheric Model, CAM5.1, J. Adv. Model. Earth Syst., 6, 980–997, https://doi.org/10.1002/2013MS000276, 2014.
Willison, J., Robinson, W. A., and Lackmann, G. M.: North Atlantic Storm-Track Sensitivity to Warming Increases with Model Resolution, J. Climate, 28, 4513–4524, https://doi.org/10.1175/JCLI-D-14-00715.1, 2015.
Zappa, G., Shaffrey, L. C. and Hodges, K. I.: The Ability of CMIP5 Models to Simulate North Atlantic Extratropical Cyclones, J. Climate, 26, 5379–5396, https://doi.org/10.1175/JCLI-D-12-00501.1, 2013.
Zhang, X., Alexander, L., Hegerl, G. C., Jones, P., Tank, A. K., Peterson, T. C. Trewin, B., and Zwiers, F. W.: Indices for monitoring changes in extremes based on daily temperature and precipitation data, Climatic Change, 2, 851–870, https://doi.org/10.1002/wcc.147, 2011.