the Creative Commons Attribution 4.0 License.
the Creative Commons Attribution 4.0 License.
 | 01 Sep 2020
The importance of management information and soil moisture representation for simulating tillage effects on N2O emissions in LPJmL5.0-tillage
Stephen Del Grosso
Stephen Ogle
Stephen Williams
Sara Minoli
Susanne Rolinski
Jens Heinke
Jetse J. Stoorvogel
Christoph Müller
No-tillage is often suggested as a strategy to reduce greenhouse gas emissions. Modeling tillage effects on nitrous oxide (N2O) emissions is challenging and subject to great uncertainties as the processes producing the emissions are complex and strongly nonlinear. Previous findings have shown deviations between the LPJmL5.0-tillage model (LPJmL: Lund–Potsdam–Jena managed Land) and results from meta-analysis on global estimates of tillage effects on N2O emissions. Here we tested LPJmL5.0-tillage at four different experimental sites across Europe and the USA to verify whether deviations in N2O emissions under different tillage regimes result from a lack of detailed information on agricultural management, the representation of soil water dynamics or both. Model results were compared to observational data and outputs from field-scale DayCent model simulations. DayCent has been successfully applied for the simulation of N2O emissions and provides a richer database for comparison than noncontinuous measurements at experimental sites. We found that adding information on agricultural management improved the simulation of tillage effects on N2O emissions in LPJmL. We also found that LPJmL overestimated N2O emissions and the effects of no-tillage on N2O emissions, whereas DayCent tended to underestimate the emissions of no-tillage treatments. LPJmL showed a general bias to overestimate soil moisture content. Modifications of hydraulic properties in LPJmL in order to match properties assumed in DayCent, as well as of the parameters related to residue cover, improved the overall simulation of soil water and N2O emissions simulated under tillage and no-tillage separately. However, the effects of no-tillage (shifting from tillage to no-tillage) did not improve. Advancing the current state of information on agricultural management and improvements in soil moisture highlights the potential to improve LPJmL5.0-tillage and global estimates of tillage effects on N2O emissions.
- Article
(2817 KB) - Full-text XML
- BibTeX
- EndNote


Agricultural fields are often tilled to suppress weeds, incorporate crop residues, aerate the soil, prepare the seedbed and improve infiltration. The resulting changes in physical and chemical properties of the soil affect the living conditions of soil microbes and thus influence the formation of greenhouse gases (GHGs). Many field-scale models and experiments evaluated the effects of tillage and no-tillage on GHGs and soil organic carbon (SOC) (Álvaro-Fuentes et al., 2012; Del Grosso et al., 2009; Jin et al., 2017; Oorts et al., 2007). Nitrous oxide (N2O) is a very strong GHG, and it is predominantly emitted in agricultural production (Ciais et al., 2014; Smith, 2017). However, studies reported mixed results for the impacts of adapting no-tillage on N2O emissions from croplands (Deng et al., 2016; Venterea et al., 2011). For instance, no-tillage was found to increase N2O emissions (Mei et al., 2018; Van Kessel et al., 2013), decrease N2O emissions (Deng et al., 2016; Plaza-Bonilla et al., 2018; Yoo et al., 2016) or have no significant effects (Alvarez et al., 2012; Boeckx et al., 2011) in comparison to conventional tillage systems.
Soils emit N2O through a series of processes involving denitrification and nitrification. These processes are driven by microbial activity and strongly respond to soil properties such as moisture, temperature, oxygen, mineral N and organic carbon (Mosquera et al., 2005; Snyder et al., 2009; Van Kessel et al., 2013). These soil properties are affected by tillage (Lutz et al., 2019a, c) and other management practices (e.g., fertilizer application and residue treatment) (Van Kessel et al., 2013). Due to the complexity of the system, the simulation of tillage effects on N2O emissions is challenging and subject to great uncertainties.
Lutz et al. (2019a) extended a dynamic global vegetation, hydrology and crop model to explicitly account for the effects of tillage in the simulations of biogeochemical cycles, hydrology and crop yields. This enables simulations of the effects of tillage on crop productivity and the water, carbon and nitrogen cycles, including N2O emissions at the global scale. However, they found that simulated N2O emissions from no-tillage exceeded values in most of the climate zones reported in meta-analyses. These deviations between observations and simulations of tillage effects on N2O emissions can have several different causes, including missing processes and lack of process understanding. The parameterization of implemented processes and the detailed information on management aspects that are explicitly addressed in the model can also lead to model deficiencies that could cause the mismatch between observations and simulations.
For example, as detailed information about agricultural management practices is lacking for global-scale applications, assumptions on agricultural management are necessary in these global simulations about, e.g., the type, amount and timing of fertilizer application. Detailed information on fertilization can typically be dealt with in field-scale modeling experiments, whereas at the global scale, there is only general information on fertilization (e.g., Mueller et al., 2012; Potter et al., 2010) which is characterized by gaps and uncertainties (Erb et al., 2017). These generalizations may be a significant contributor to the overall uncertainty in agricultural impact assessments. For instance, Folberth et al. (2019) found that differences in management assumptions (about, e.g., growing season and fertilization) resulted in substantial differences in modeled crop yields using the same crop model.
Second, the formation of N2O in soils is very sensitive to soil moisture (Butterbach-Bahl et al., 2013). How the effect of tillage on soil moisture is simulated is thus another source of uncertainty that could explain the inaccuracy in modeling tillage effects on N2O emissions.
In this study, we test the importance of management information and the representation of soil water dynamics being able to simulate N2O emissions under different tillage regimes with LPJmL5.0-tillage model (LPJmL: Lund–Potsdam–Jena managed Land) (Lutz et al., 2019a) for four different experimental sites across Europe and the USA. Simulation results are compared to measurements of N2O emissions from experimental studies under tillage and no-tillage conditions in different simulation experiments, varying from using observed site-specific information to using the default assumptions usually applied in global-scale simulations. Because of the importance of soil moisture for N2O emissions, we test the accuracy of the simulated soil moisture dynamics and its effects on N2O emissions against observations at one selected site in Nebraska, USA, which was the only site with sufficient soil moisture data available. As simulating tillage effects on N2O emissions is generally challenging, we use the site-specific model DayCent (Del Grosso et al., 2009; Parton et al., 1996), which has previously been applied at the study sites, as a benchmark and to provide more detailed information on soil hydrology than the sparse observations. DayCent is a well-established model that has been used for questions related to agricultural impact assessments at various scales (e.g., Begum et al., 2019; Del Grosso et al., 2009, 2002; Gryze et al., 2010). DayCent can be used as a benchmark with which the underlying mechanisms can be analyzed and for improvements of LPJmL5.0-tillage even though the performance of DayCent has to be compared to observations first.
2.1 Overview
In Lutz et al. (2019a), model results deviated from meta-analyses when comparing simulated tillage effects on N2O emissions. First, we tested whether the deviations were due to a lack of detailed management information. Four experimental sites with detailed information available on management were identified. On those sites, LPJmL5.0-tillage was run using management assumptions usually utilized in a global simulation experiment (LPJmL.G.Orig). To find out if LPJmL5.0-tillage performed better with detailed information on management, we also applied LPJmL5.0-tillage using detailed site-specific management information to derive inputs (LPJmL.D.Orig).
The site-specific DayCent model was used as a benchmark to analyze the underlying mechanisms of the N2O-producing processes. For all the simulations of DayCent, detailed information of management was used. Except for the experimental site in Boigneville, France, DayCent has been used and calibrated for field-scale assessments at the chosen sites (i.e., Campbell et al., 2014; Del Grosso et al., 2009; Yang et al., 2017). Therefore, we expected it to perform better on simulating the effects of tillage on N2O emissions than LPJmL. We also expected to learn from the underlying mechanisms simulated by DayCent and to use this information for improving process representation and parameterization in LPJmL. All model versions considered here require similar inputs (soil properties, vegetation type, land management information, latitude, daily precipitation, and minimum and maximum daily air temperature).
2.2 LPJmL5.0-tillage
LPJmL5.0-tillage is a dynamic global vegetation, hydrology and crop model that simulates nitrogen (N), carbon (C) and water dynamics in natural and agricultural ecosystems. Soils are represented by five hydrologically active layers with different layer thicknesses.
LPJmL5.0-tillage (in the following referred to as LPJmL) uses three litter pools representing surface litter, incorporated litter and below-ground litter, as well as two soil organic matter (SOM) pools, per soil layer, which are characterized by fast and slow decomposition rates, respectively, and by separate C and N components for each pool. The surface litter pool consists of crop residues which are not removed at harvest or incorporated into the first soil layer through tillage. Residue cover is calculated from the surface litter following Gregory (1982). This residue cover intercepts some rainfall, promotes infiltration into the soil and limits soil evaporation. Moreover, the presence of a residue cover insulates the soil from air temperature fluctuations. The effects of residue cover on soil water dynamics and soil temperature fluctuations are thoroughly described in Lutz et al. (2019a).
Surface litter decomposes and is incorporated through bioturbation and tillage, forming the incorporated litter pool in the first layer. The below ground litter pool includes crop roots that remain in the soil after harvest. All pools are subject to decomposition with the rates dependent on temperature and moisture conditions. By incorporating residues into the soil column, decomposition is no longer a function of air temperature and the moisture of the aboveground litter but of the temperature and moisture regime of the first soil layer (0–200 mm). A fixed fraction of the decomposed litter is mineralized and emitted as CO2, whereas the remaining C is transferred to the soil C pool where it is then subject to soil C decomposition (see also Von Bloh et al., 2018). The mineralized N is added to the pool which is subject to further transformations into other forms of nitrogen (Von Bloh et al., 2018). The organic C and N in surface litter can thus supply the soil C and N pools through its incorporation into the soil as a result of tillage, followed by the decomposition of soil C and mineralization of soil N.
Nitrification and denitrification are simulated throughout the entire soil profile. Nitrification is modeled on Parton et al. (2001), with N2O emission from nitrification being proportional to the nitrification rate. The nitrification rate depends on the water-filled pore space (WFPS), soil temperature, and pH. Nitrification increases with higher levels of WFPS until it reaches the optimal WFPS value for nitrification (around 60 %). Denitrification rates depend on the soil temperature, the availability of organic carbon and , and they increase exponentially above 80 % WFPS. As denitrification is an anoxic process, denitrification rates are negligible for levels of WFPS that are less than ∼80 %. Following the approach from Bessou et al. (2010), N2O emissions from denitrification are assumed to be proportional to the denitrification rate (11 %) (Von Bloh et al., 2018).
In addition to tillage effects on residues (i.e., incorporating residues into the soil), tillage affects the hydraulic properties of the soil by decreasing the bulk density. Soil hydraulic parameters are calculated through a pedotransfer function (PTF) from Saxton and Rawls (2006) which uses soil texture, SOM and bulk density changes to calculate field capacity (FC), wilting point (WP), saturation (WSAT) and the saturated hydraulic conductivity (Ksat). The hydraulic parameters determine the water holding capacity and the water dynamics of the soil. For instance, soil water above WSAT runs off as lateral runoff, while remaining soil water above FC percolates to the next soil layer and generates lateral subsurface runoff or vertical seepage from the soil column.
A full overview of the tillage implementation in LPJmL5.0, as well as affected soil properties and processes, can be found in Lutz et al. (2019a), the nitrogen implementation is described by Von Bloh et al. (2018), and a comprehensive description of the LPJmL model is provided by Schaphoff et al. (2018).
2.3 DayCent
The DayCent ecosystem model simulates crop growth, soil water, C and nutrient dynamics (N, P) in natural and agricultural ecosystems (Del Grosso et al., 2009; Parton et al., 1998). The soil is represented by user-specified layers which are hydrologically active. DayCent has two litter pools, representing surface litter and below-ground litter and three SOM pools (active, slow and passive) characterized by different decomposition rates.
The active and the slow organic matter pools have surface and soil components, while the passive pool has only a soil component. The litter pools are partitioned into structural and metabolic pools as a function of the lignin to N ratio in the residue which are subject to decomposition. The decomposition products of litter supply the SOM pools (surface active, soil active, surface slow and soil slow) and are partitioned among pools based on lignin content. The decomposition of litter and soil organic matter and nutrient mineralization are a function of substrate availability, substrate quality (lignin content, C:N ratio), soil moisture, soil temperature and tillage intensity. N mineralization, N fertilization and N fixation supply the N pools. is distributed throughout the soil profile, whereas is confined to the top 10 cm. and can then be taken up by plants, leached to lower layers ( only) or transformed to N gas emissions (e.g., N2O) through nitrification or denitrification (Del Grosso et al., 2000; Parton et al., 2001). N2O emissions from nitrification are calculated as a function of soil concentration, temperature, pH, texture and the WFPS. The N2O emissions from nitrification are proportional to the nitrification rate. Nitrification increases with water content, approaches maximum rates at WFPS of 50 %–60 % and declines after field capacity is exceeded (Hartman et al., 2018). The model also assumes that the portion of nitrified N that is lost as N2O increases with water content between wilting point and field capacity. N2O from denitrification is calculated as a function of soil concentration, soil moisture, texture and heterotrophic CO2 respiration rate. Denitrification rates increase exponentially when the WFPS exceeds the texture-related threshold value (55 %–80 %) and become static as the soil approaches saturation (around 90 %) (Del Grosso et al., 2000). In addition to denitrification rates, N2O emissions also depend on the portion of N2 lost compared to N2O with the ratio of N2:N2O emissions assumed to increase as soils become wetter. The model can simulate different types of tillage (i.e., plowing, tandem disk and field cultivator). Depending on the type of tillage, the decomposition of litter and SOM (active and slow) pools is increased by a specific factor for a period of 1 month, and a fraction of aboveground residues is transferred to surface litter and top soil layer. Tillage also impacts soil temperature and water dynamics indirectly because the model assumes that precipitation intercepted by surface litter and living biomass evaporates before entering soil. The presence of surface litter insulates the soil from air temperature fluctuations.
If site level measurements of soil hydraulic properties required for DayCent are not available, they are calculated through the PTF from Saxton et al. (1986) and are static throughout the simulations. The PTF uses soil texture to calculate FC, WP, bulk density and Ksat. The soil water model simulates unsaturated water flow using Darcy's equation, runoff, snow dynamics and the effect of soil freezing on saturated water flow (Pannkuk et al., 1998). DayCent has been shown to reliably model soil water content, N mineralization and N2O emission rates from different soil types and management practices (Kelly et al., 2000; Parton et al., 2001). Del Grosso et al. (2002) provide an extensive overview of validated results for DayCent.
2.4 Experimental sites
Four experimental sites were selected in which the effects of tillage and no-tillage on N2O emissions were studied (Table 1 and Table 2). The sites were selected based on the availability of observational data and treatment combination of tillage and no-tillage.
Halvorson et al. (2006)Jin et al. (2017)Grandy et al. (2006)Oorts et al. (2007)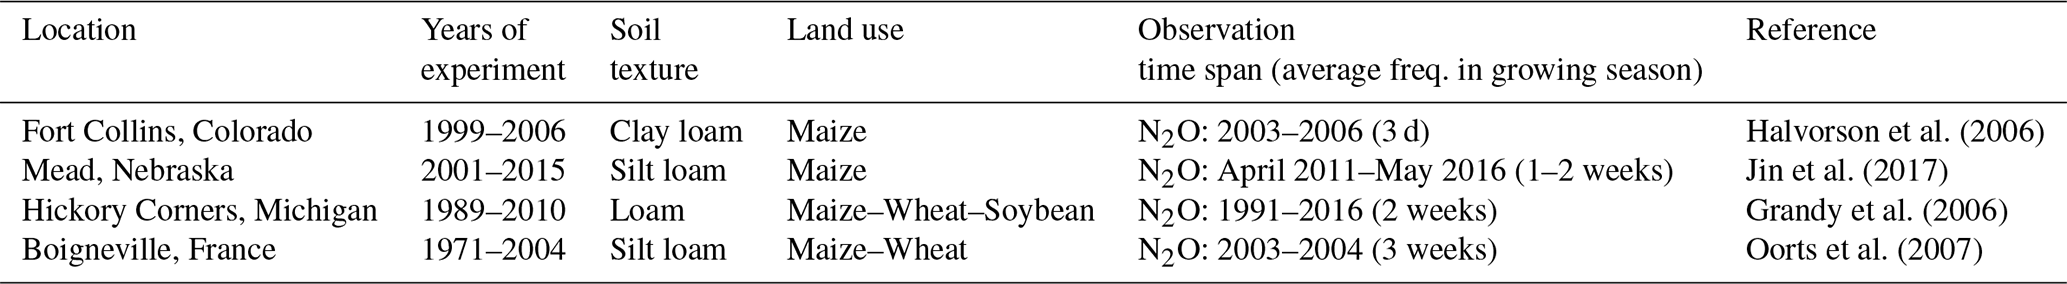
Table 2Overview of observed input data and LPJmL input data.
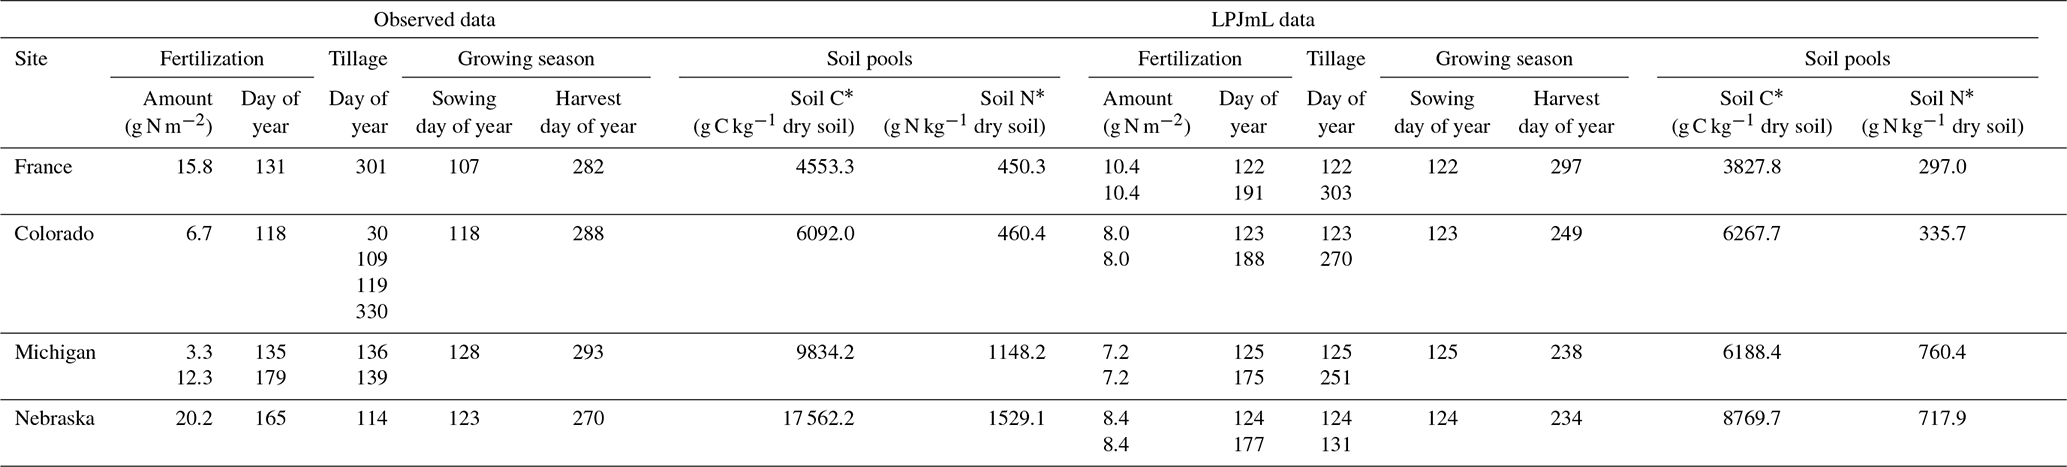
The data are for the years when maize is grown and vary between years.
* Size of pools is given for soil depth: France, Colorado, Michigan and Nebraska are from 0 to 0.2, 0.2, 1.0 and 1.0, respectively.
The first study site is located at the Agricultural Research, Development and Education Center (ARDEC) near Fort Collins, CO (40∘39′6′′ N, 104∘59′57′′ W; 1555 m a.s.l.). It was initiated in 1999 on a clay loam soil (fine-loamy, mixed, mesic Aridic Haplustalfs) that was continuously cropped with maize (Zea mays L.) for 6 years. Shortly before sowing, fertilizers (67 kg N ha−1) were applied. The fields were irrigated by sprinkler during the growing season. In the tillage treatment, fields were tilled shortly before sowing and at harvest, followed by tandem disking and then moldboard plowing to a depth of 25 to 30 cm. N2O emissions were measured three times per week during the growing season (2002–2006) with closed chambers. Soil moisture was measured two to three times per month during the growing season from 2003 to 2006. Soil organic carbon (SOC) was measured once in October 2005. A detailed description of the experimental site can be found in Halvorson et al. (2006).
The second study site is located at the University of Nebraska–Lincoln Agricultural Research and development Center, Ithaca, NE (41∘9′43.3′′ N, 96∘24′41.4′′ W; 349 m a.s.l.). The experiment was established in 2002 on a silt loam soil that was previously cropped with rain-fed maize, soybean (Glycine max (L.) Merr.), oat (Avena sativa L.) and alfalfa (Medicago sativa L.). Maize was grown continuously on the field after 2000. During the experiment, N fertilizers were injected to a depth of 10–15 cm once during the growing season at various rates and compositions (Table 1). The soil in tillage treatments was tilled before sowing and at harvest to a depth of 15–20 cm. The field was irrigated with varying irrigation amounts. N2O emissions were measured from April 2011 through May 2016 once or twice per week during the growing season using closed chambers. Soil moisture was measured at varying intervals from one to five times per month between 2011 and 2015. SOC was measured in May 2001, November 2010 and November 2014 for different depths (0–0.15, 0.15–0.30, 0.30–0.60, 0.60–0.90, 0.90–1.20 and 1.20–1.50 m). More information regarding the experimental study site is provided by Jin et al. (2017).
The third study site is the W. K. Kellogg Biological Station Long-Term Ecological Research (KBS LTER) experiment located in southwest Michigan (42∘24′ N, 85∘24′ W; 288 m a.s.l.) on loam soils (Typic Hapludalfs). The experiment was established in 1988 on an agricultural field that had been tilled for at least 100 years before the experiment. The crop rotation before 1995 consisted of maize followed by soybean. In 1995, wheat (Triticum aestivum L.) was planted after soybean, which resulted in a maize–soybean–wheat rotation. After the harvest of wheat, the fields stayed bare until the fields were cropped with maize again. This sequence was followed during the time span analyzed here (1989–2010). Different quantities of N fertilizers were applied at sowing and/or during the growing season for maize and during the growing season for wheat, and soybean did not receive fertilizers (Table 1). For the tillage treatment, the fields were tilled each year with sowing, then during the growing season and at harvest, to a depth of 20 cm. The fields were not irrigated during the experiment. N2O emissions were measured once or twice a month from June 1991 to October 2016 using closed chambers. Soil moisture was measured once per month during the growing season from 1989 until 2017. SOC was measured annually since 1989 at multiple sampling depths. More information regarding the experimental study site is provided by Grandy et al. (2006) and on the KBS LTER website (http://lter.kbs.msu.edu, last access: November 2018).
The last study site is located in Boigneville, France (48∘33′ N, 2∘33′ E; altitude unknown), on a silt loam soil (Haplic Luvisol) (FAO, 1998). The experiment started in 1970, and it has been tilled to 30 cm depth annually. During the experiment, the site was cropped with a maize–wheat rotation, with maize being sown in April and harvested in October, followed directly by tillage (20 cm for tillage treatments) and the sowing of wheat. After the harvest of wheat in April, the soil was left bare, tilled (20 cm) in November and left fallow until maize was planted in the next growing season. This sequence was followed during the time span analyzed here (2003–2004). During the experiment, the maize received N fertilizers in May and wheat in February and April (Table 1). The fields were irrigated between the end of June and July. N2O emissions were measured on average every three weeks using closed chambers. Soil moisture was not measured. Soil organic carbon was measured twice in 2003 and once in 2004 at various depths. More information regarding the study site can be found in Oorts et al. (2007).
2.5 Management information
2.5.1 LPJmL standard setup using global input data
In the LPJmL.G.Orig scenario, all management information as well as soil C and N pools were used as within the default global simulation of LPJmL (Table 3). The amount of mineral and organic fertilizers was provided by the global gridded crop model intercomparison (Elliott et al., 2015) of the Agricultural Model Intercomparison and Improvement Project (AgMIP; Rosenzweig et al., 2013). It is based on global, gridded data sets for each crop (Mueller et al., 2012; Potter et al., 2010). Fertilizer is assumed to consist of 50 % and 50 % . If fertilizer input is low (≤5.0 g N m−2), all is applied on the sowing date. Otherwise, only half of the fertilizer is applied on the sowing date and the remainder is applied when the phenological stage fraction (unitless) of the crop reaches 0.4 (Von Bloh et al., 2018). Irrigation events occur when the fractional soil moisture of the water holding capacity (unitless) is below an irrigation threshold value of 0.7 for maize (all sites), 0.8 for wheat in Boigneville, and 0.9 for wheat and soybean in Michigan (Jägermeyr et al., 2015).
Table 3Overview of management data used in LPJmL.D.Orig, LPJmL.G.Orig, DayCent and experimental runs.
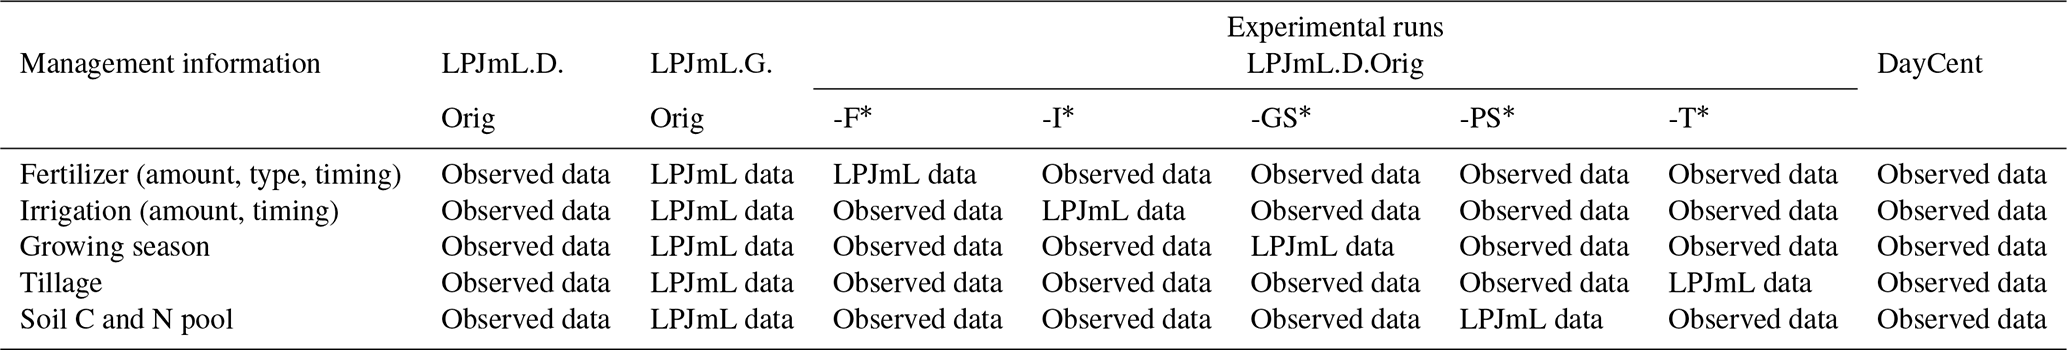
* Experimental runs; all management information is like in the Detail setting of the model except for one scenario. For example, LPJmL.D-F* excludes fertilization information. The other settings exclude information on irrigation (LPJmL.D-I*), growing season (LPJmL.D-GS*), N and C pool sizes (LPJmL.D-PS*), and tillage (LPJmL.D-T*).
In the experiments with tillage, tillage occurs twice a year: once at sowing and once on the day of harvest. Sowing dates are calculated internally following Waha et al. (2012). The sowing dates are thereby calculated based on a set of rules that depend on crop specific thresholds and climate. Here, the sowing date depends on a crop-specific temperature threshold (i.e., 14 ∘C for maize; Waha et al., 2012).
The size of the C and N pools are calculated internally during the spin-up (5000 years) of the natural vegetation and land-use history. The land-use history is simulated as with DayCent in order to establish a comparable starting point when the simulations for the experiments are conducted. The spin-up is thereby followed by a simulation of historical land-use change to account for effects on the pools based on the best available information on land management.
2.5.2 LPJmL detailed setup using observed input data
Site-specific observed information for all management inputs and soil C and N pools was prescribed for the LPJmL.D.Orig simulation (Table 3). For practical reasons, irrigation water was added to precipitation to enable the specification of the amount and the timing of irrigation events. This mimics a sprinkler irrigation technique as part of the irrigation water is intercepted by the canopy. As the current implementation of soil layers and tillage in LPJmL does not allow more detailed tillage types to be distinguished other than conventional tillage and no tillage, we ignored tillage activities that were less intensive (e.g., shredding). In order to specify the growing season, phenological heat unit requirements and base temperatures were parameterized so that the simulated harvest dates matched the reported harvest dates.
The soil C and organic N pools from the simulations were scaled to the observed values. This was done twice: once at the introduction of land-use during spin-up and once at the start of the treatment of the experimental site. If observations were not available for the start of the experiment, the first available observation was taken under the assumption that pool sizes remained stable over that time period. The pools (P) at each site were scaled as in Eq. (1):
where P(cor) is the scaled carbon or nitrogen content of the soil pools (g C or N m−2) in layer l of the experimental site, and P(sim) is the simulated amounts of C or N contained in the soil and litter pools of the different layers l of the experimental site. Total(obs) and Total(sim) are the total C or N contained in the soil and litter pools summed over the different layers l for which observational data of soil organic C and N were available (in g C or g N m−2, respectively) at the experimental site.
The differences between simulated and observed input data are depicted in Table 3.
2.6 LPJmL experimental simulations
Agricultural management consists of several practices. To analyze the importance of individual management aspects, we conducted a set of simulations like in LPJmL.D.Orig but ignored one site-specific management practice and replaced it with the global assumption as in LPJmL.G.Orig (Table 3). As an example, LPJmL.D.Orig-F refers to the simulation where all management information is like in LPJmL.D.Orig except for the fertilizer information. Instead, the amount, timing and type of fertilizers were used like in LPJmL.G.Orig. Other experimental simulations refer to LPJmL.D.Orig-I, LPJmL.D.Orig-GS, LPJmL.D.Orig-PS and LPJmL.D.Orig-T which use the management information like in LPJmL.D.Orig except for irrigation (I; timing and amount), growing season (GS; sowing and harvest days), C and N pool sizes (PS), and the timing of tillage (T), respectively. The naming of the simulation consists of three parts: (1) model used (LPJmL), (2) the experiment conducted (e.g., I, GS or PS), and (3) whether it includes modifications (Mod; see Sect. 2.7) or not (Orig).
2.7 Model modifications
Lutz et al. (2019a) found that LPJmL overestimates N2O emissions. Because of the importance of soil moisture for N2O emissions, we tested if modifying the simulation of soil moisture can contribute to improving the simulation of N2O emissions. We modified the model with respect to the treatment of the residue cover of the soil in no-tillage systems and with respect to changing the soil parameterization.
As the soil covered by residues under no-tillage practices in LPJmL simulations is very high and thus leads to high soil moisture levels throughout the year (as soil evaporation is reduced and infiltration is enhanced), we tested modifications of the relevant functions for this aspect. To this end, we tested modifications of the parameters that translate litter amounts into soil cover (Gregory, 1982) and those that determine how long the soil is covered with residues. Rather than changing well-established functions on litter decomposition (Schlüter et al., 2018), we modified the parameter on bioturbation that was introduced by Lutz et al. (2019a) and tested its effects on the reduction of the residue cover of the soil.
Lutz et al. (2019a) used an average value of 0.006 m2 g−1 (falsely described as 0.004 in their publication but used so in the code: https://doi.org/10.5281/zenodo.2652136) to translate litter biomass into a fraction of soil being covered with residues, which was applied to all litter neglecting variations in surface litter for different materials. The bioturbation rate was increased from 0.19 % d−1 to 0.63 % d−1 to account for the surface litter being transferred to the incorporated litter pool per day (equivalent to an annual bioturbation rate of 90 % versus 50 % as assumed previously).
High N2O emissions can also result from biases in the parameterization of hydraulic properties. For example, small differences between FC and WSAT lead to frequent triggering of denitrification. To study the role of soil moisture in causing deviations in tillage effects on N2O emissions, we analyzed if the parameterization of the hydraulic properties causes the overestimation in soil moisture. As observational data on the hydraulic properties are lacking, we here compared the hydraulic properties in relation to soil moisture from DayCent.
2.8 Analyses
2.8.1 N2O emissions
As N2O emissions are characterized by a high temporal variability, we analyzed two different aggregation levels: annual averages of N2O emissions and emissions of individual days within the year. We analyzed each tillage type (tt; i.e., conventional tillage and no-tillage) separately (N2Ott in Eq. 2) and differences between the two for both aggregation levels (N2Odiff,year in Eq. 3 and N2Odiff,day in Eq. 4).
where N2Ott is the annual average of simulated and observed N2O emissions (in g N ha−1 d−1) of tt – conventional tillage (till) or no-tillage (notill) – and ntt is the number of days with N2O emissions simulated or observed in the year of tt. Thus, ntt equals all 365 d in the simulations, but for the observations ntt is less than 365 as observations are not available for every day of the year. We thus assumed that the scarcer observations still represent the full year's dynamics.
The differences in N2O emissions on annual average (N2Odiff,year) were calculated as in Eq. (3):
where N2Oday,notill and N2Oday,till are daily N2O emissions (in g N ha−1 d−1) for all the days of the year and nnotill and ntill the number of days with N2O emissions simulated or observed in the year for no-tillage and tillage, respectively.
The differences in N2O emissions for individual days were calculated as in Eq. (4):
where N2Onotill and N2Onotill are daily emissions in all years.
The relative difference (RD; %) of no-tillage to conventional tillage was calculated as in Eq. (5):
where N2Onotill and N2Otill are daily N2O emissions (in g N ha−1 d−1) for all the days of the year, and n is the number of days with N2O emissions simulated or observed.
2.8.2 Soil moisture
For the analyses of soil moisture, we focused on the uppermost 0.2 m of the soil, which is the tillage-affected layer. We analyzed the experimental site in Nebraska as this site had the most observations of soil moisture compared to the other experimental sites. As N2O emissions are regulated by the WFPS in both LPJmL and DayCent, we normalized the soil moisture content and hydraulic properties to porosity (WSAT; mm). The WFPS (fraction) is calculated as in Eq. (6):
where W is the volumetric soil water content (mm). The WFPCFC (fraction) and WFPCWP (fraction) are the field capacity and wilting point values normalized to WFPS as in Eqs. (7) and (8):
The WFC and WWP are the water content at field capacity and wilting point, respectively.
2.8.3 Evaluation metrics
To quantify the performance of simulated N2O emissions, we conducted an analysis of coincidence (Eq. 9) and an analysis of association (Eq. 10), following Smith and Smith (2007). Therefore, we calculated the difference between simulated and observed values through the root mean square deviation (RMSD; in g N ha−1 d−1) of the different sites as in Eq. (9):
where Oi is the average observed N2O emission (in g N ha−1 d−1) of year i, Si is the average simulated value of N2O emission (in g N ha−1 d−1) of year i and n is the total number of valid value pairs for comparison.
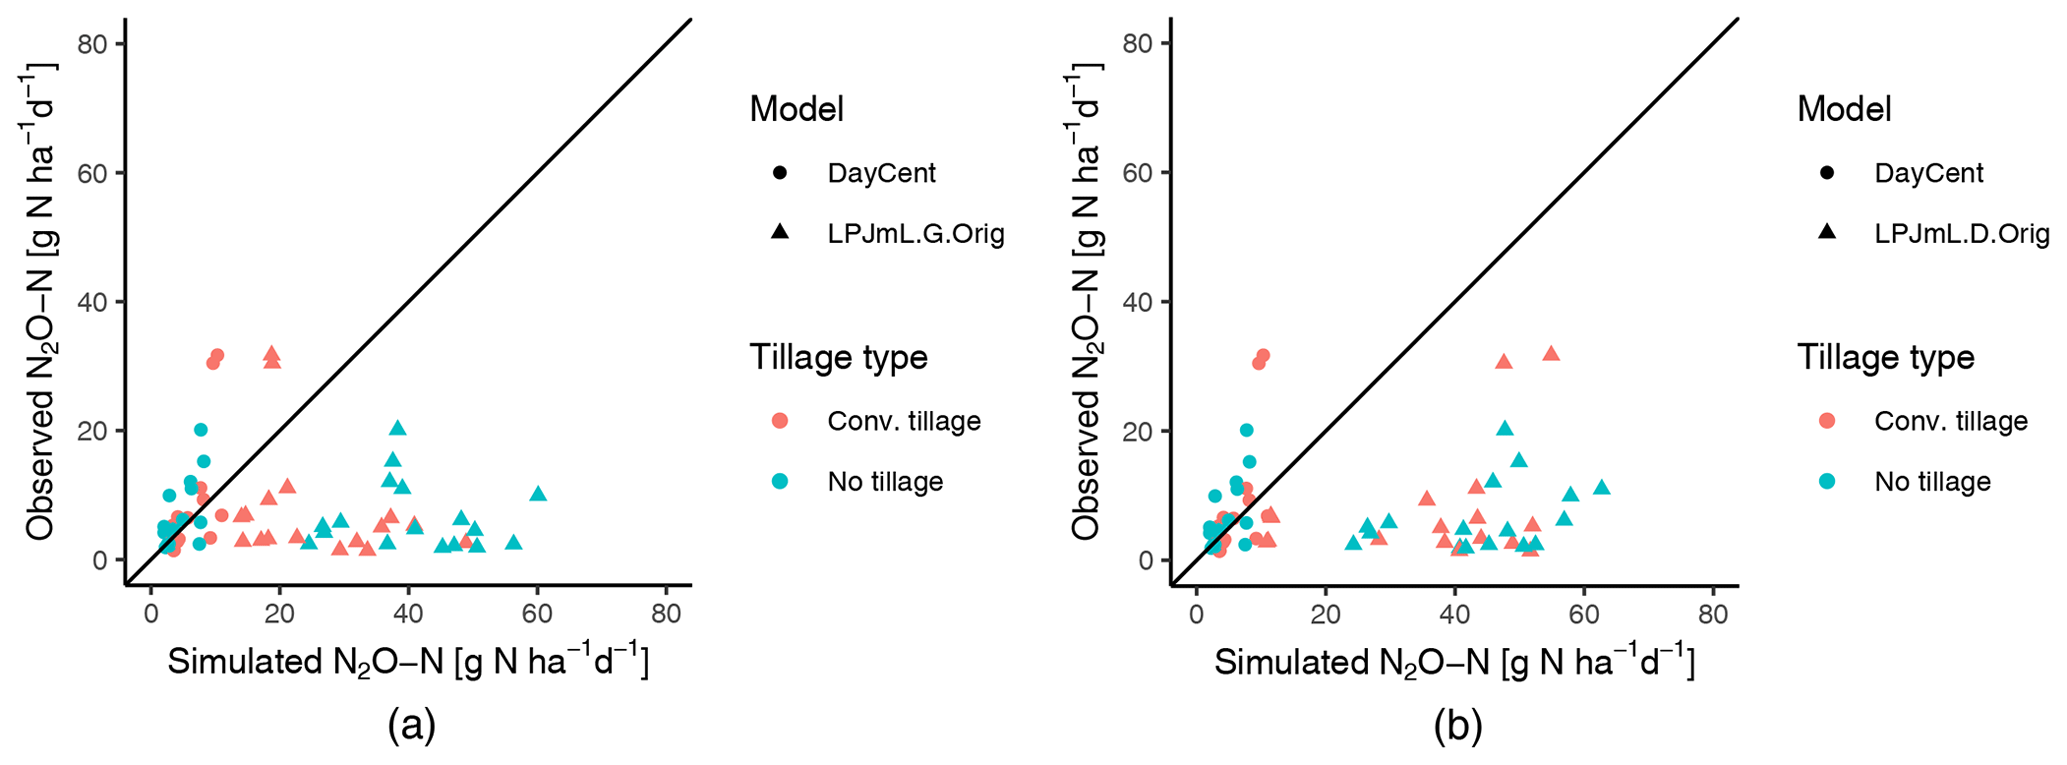
Figure 1Comparison of observed and simulated yearly averages of N2O emissions by tillage type and models LPJmL.G.Orig (a), LPJmL.D.Orig (b) and DayCent. The data refer to all four sites and years of the experiments. Each point represents the average of all measured daily values within 1 year and tillage treatment. Tillage types are indicated by different colors.
To describe how well the dynamics in the observations were captured in the simulations, we calculated the degree of association r as in Eq. (10):
where and are the average observed and average simulated values, respectively, over all years (in g N ha−1 d−1). We additionally calculated the significance of association between the measured and the simulated values through hypothesis testing using Student's t test, indicating significance levels with n.s. for p≥0.05, * for p<0.05, for p<0.01 for all r values.
The mean bias (MB; fraction) was calculated as in Eq. (11):
For soil moisture, the RMSD and r were calculated as well. However, here we focused on one site and calculated the average RMSD and r over all the years as not much variation in soil moisture is expected between the years.
3.1 Importance of management information
3.1.1 Tillage effects on N2O emissions
Annual averages
The N2O emissions were overestimated in the LPJmL.G.Orig experiment when analyzing yearly averages of the different sites (Fig. 1a). This effect was stronger for simulated emissions under no-tillage (RMSD = 36.2 g N ha−1 d−1, n.s.) than under tillage (RMSD = 23.6 g N ha−1 d−1, n.s.). DayCent was closer to the observed values for both tillage (RMSD = 7.60 g N ha−1 d−1, ) and no-tillage (RMSD = 4.61 g N ha−1 d−1, ). For the full statistical analyses, we refer to Table A1.
Using detailed site-specific management information in LPJmL (LPJmL.D.Orig) improved the correlation between the observed and simulated values (Fig. 1b). The simulated N2O emissions under no-tillage deviated more from the observed values (RMSD = 38.9 g N ha−1 d−1, r=0.36 n.s.) as the N2O emissions were still overestimated. The same was found for the simulated N2O emissions resulting under conventional tillage (RMSD = 31.7 g N ha−1 d−1, r=0.34 n.s.).
When analyzing the effect of tillage (difference between no-tillage and tillage), the observations showed a decrease in emissions by 16.0 % across all sites and years. However, observations across the different sites showed that no-tillage can have very different effects on N2O emissions. In Boigneville and Michigan, N2O emissions increased under no-tillage (49.3 % and 15.7 %, respectively), whereas it decreased in Colorado (by 9.01 %) and Nebraska (by 29.2 %). In response to no-tillage, LPJmL.G.Orig showed an increase in N2O emissions by 59.5 % (Fig. 2a) and LPJmL.D.Orig by 22.4 % (Fig. 2b), and DayCent showed a reduction of 24.3 %. LPJmL.D.Orig reproduced the observed differences in tillage better (RMSD = 12.0 g N ha−1 d−1, r=0.48 n.s.) than LPJmL.G.Orig (RMSD = 18.0 g N ha−1 d−1, n.s.) (see also Fig. 2). Yet both versions mainly projected an increase in N2O emissions from no-tillage practices. DayCent results were closer to the observed values but slightly underestimated the effects of no-tillage on N2O emissions (RMSD = 4.96 g N ha−1 d−1, ).
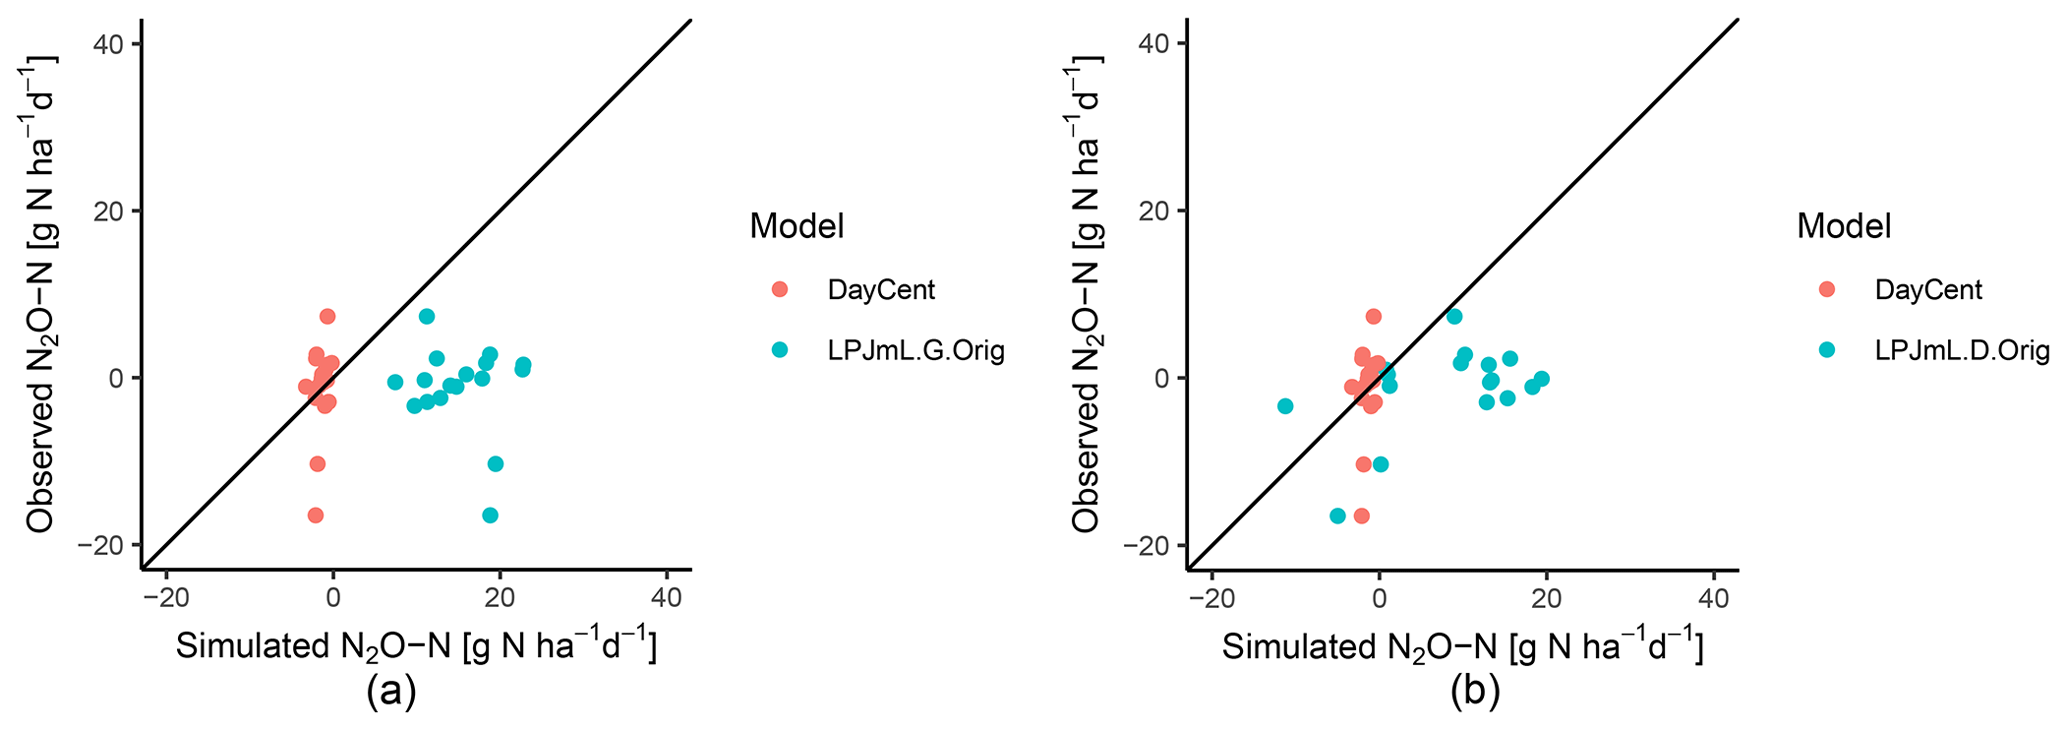
Figure 2Comparison of observed and simulated effects after converting to no-tillage (i.e., the difference between no-tillage and tillage). The data refer to yearly averages of N2O emissions and models LPJmL.G.Orig (a), LPJmL.D.Orig (b) and DayCent of all four sites and years of the experiments.
Daily emissions
The simulations with more detailed management information showed that these are relevant for the simulated tillage effects on N2O emissions on individual days (Fig. 3). On average, more accurate information on management improved the simulations of differences between conventional and no-tillage systems in LPJmL except for the site in Colorado. However, there was no clear pattern between the different experimental runs of LPJmL (Fig. A1). None of the simulations with partial usage of detailed management information (Table 3) performed clearly better or worse between the LPJmL simulations. There were only small differences in the distribution of no-tillage effects on N2O emissions, as well as between the averages.
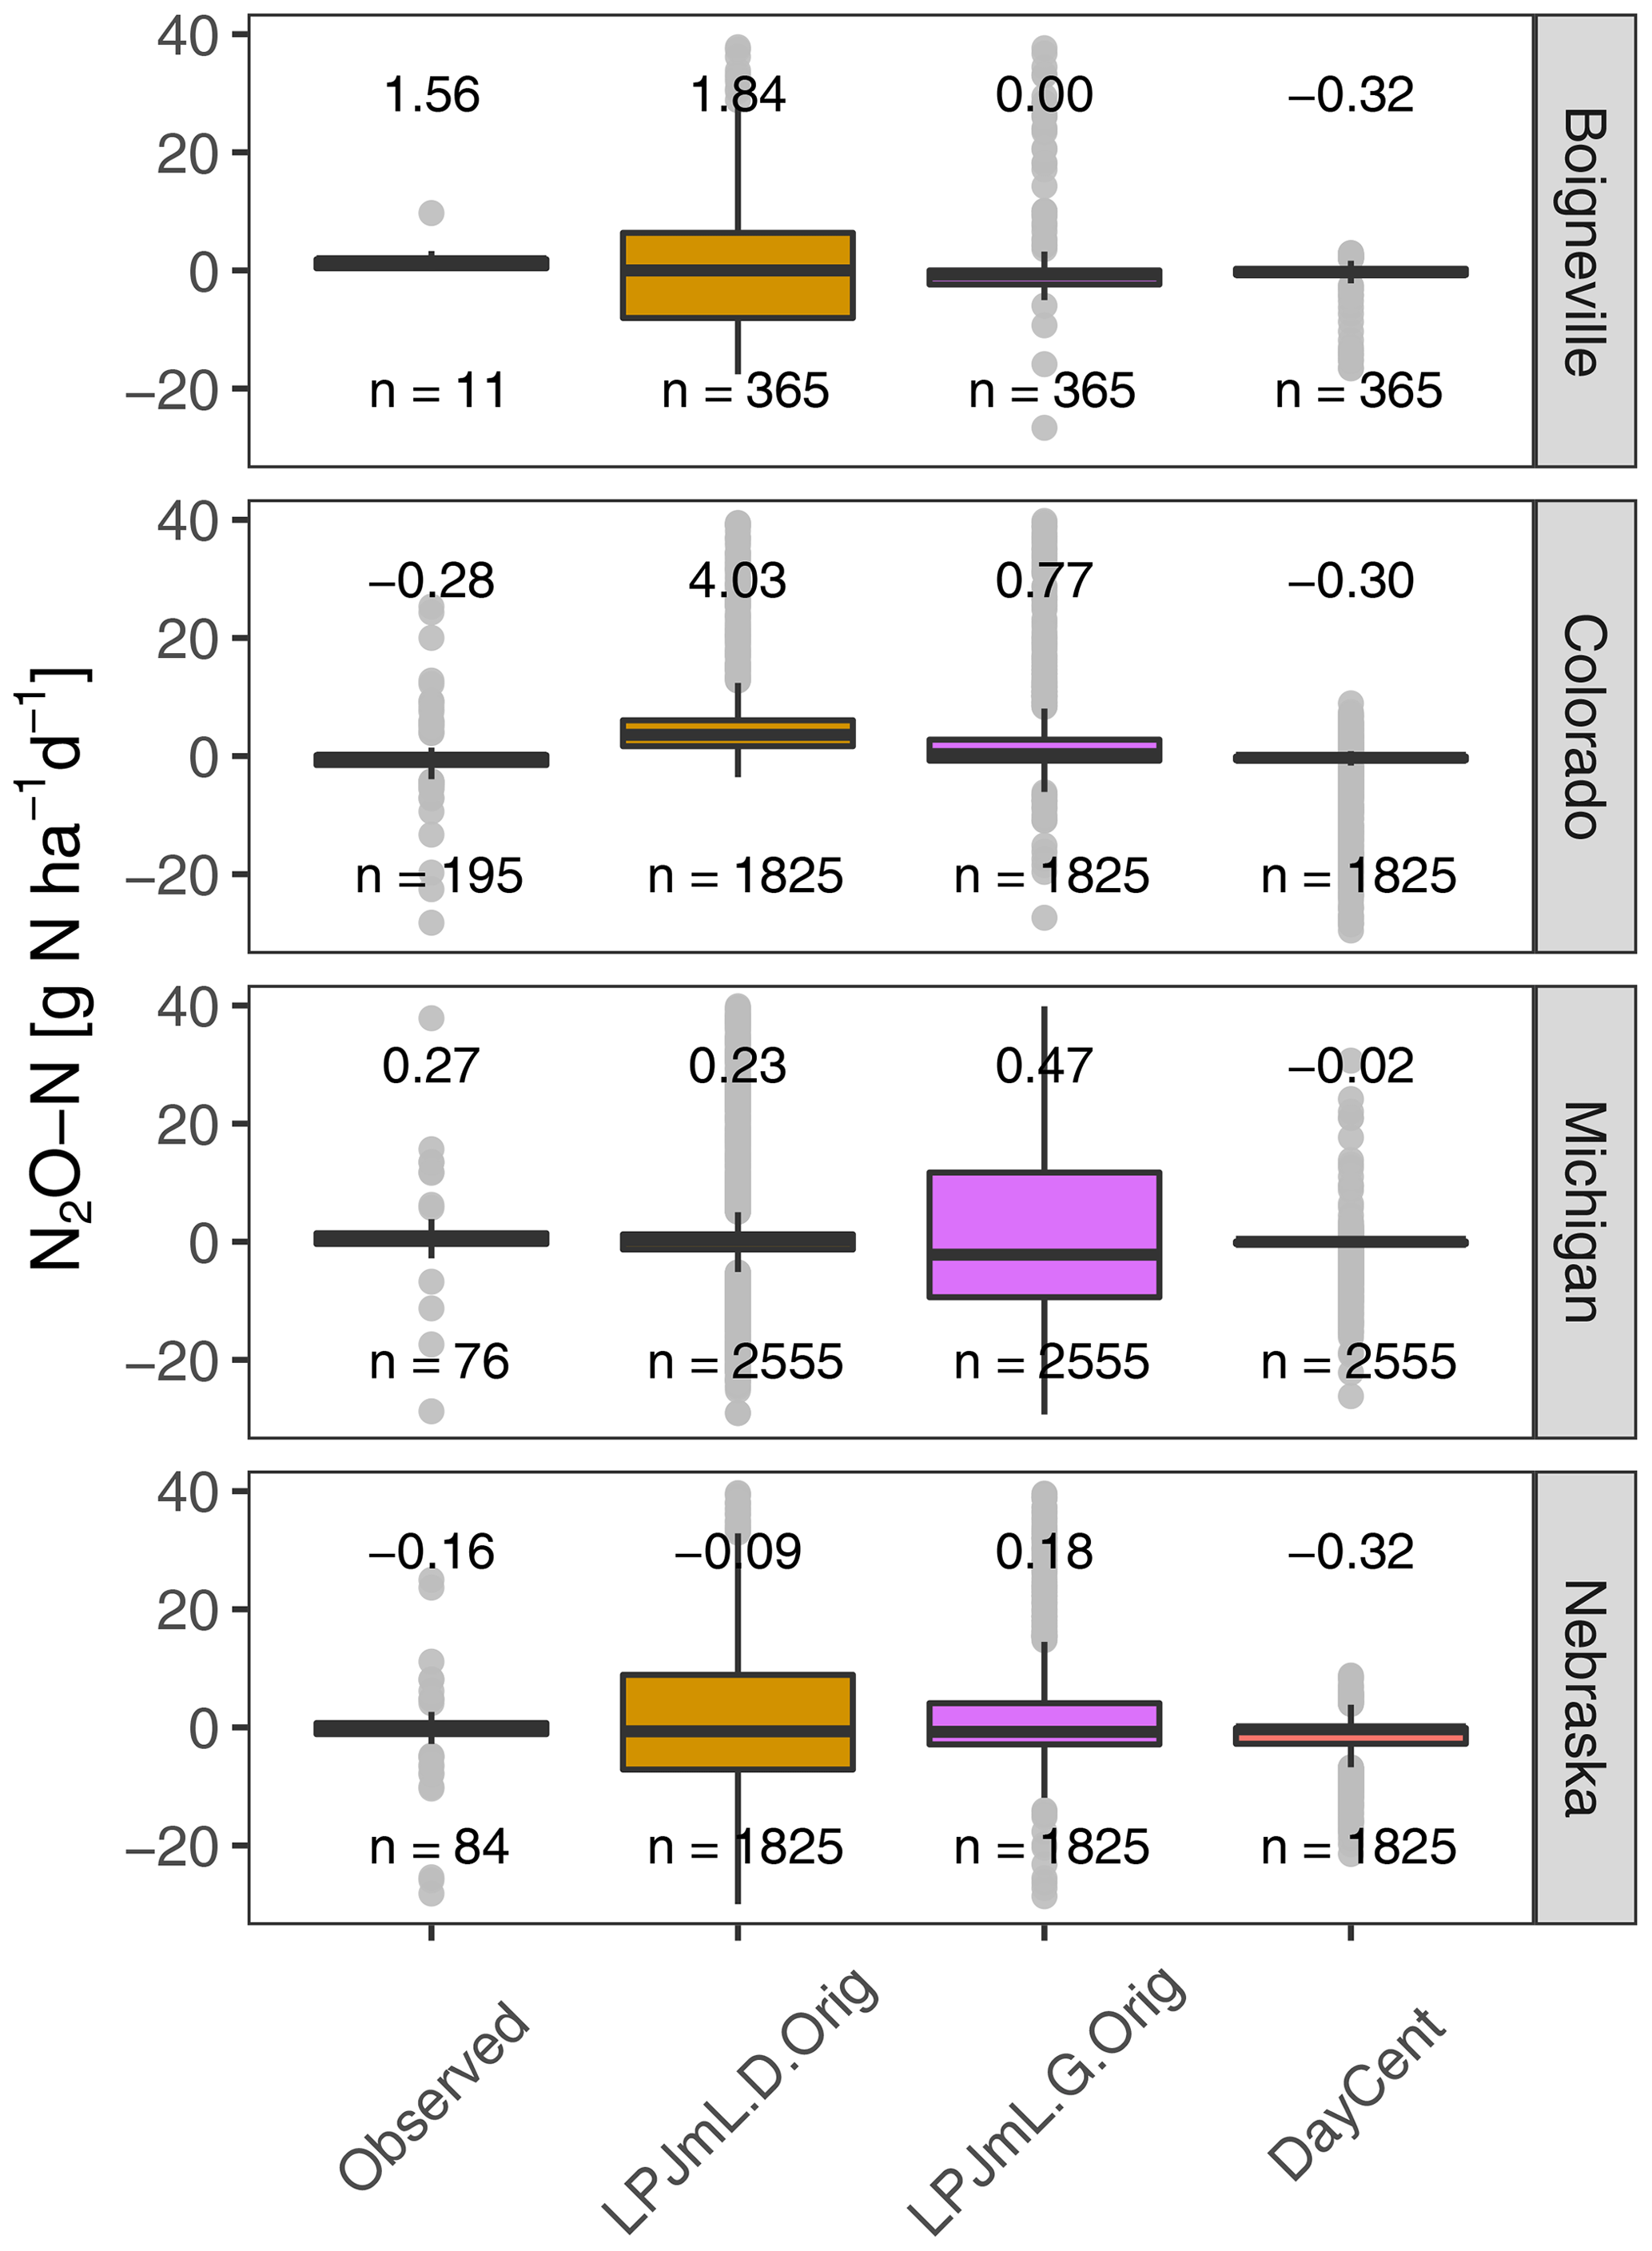
Figure 3Effects of no-tillage (i.e., the difference between no-tillage and tillage) on N2O emissions on individual days (and on average), including the original LPJmL settings, the observations and simulated values by DayCent. The numbers on top of the box plots represent the median values.
The observations showed that no-tillage both increased (Boigneville, Michigan) and decreased (Colorado, Nebraska) N2O emissions on average, as well as on the individual days. The positive and negative effects were reproduced by LPJmL.D.Orig except in Colorado. LPJmL.G.Orig, however, only reproduced the increase in N2O emissions in Michigan (Fig. 3). The negative effects were reproduced by DayCent in Colorado and Nebraska.
In Colorado, observations showed a decrease in N2O emissions under no-tillage compared to conventional tillage. In contrast, LPJmL.D.Orig and LPJmL.G.Orig showed an increase in emissions with no-tillage, whereas the observed decrease was well captured by DayCent. In Boigneville, the increase in N2O emissions under no-tillage was well captured by LPJmL.D.Orig. DayCent and LPJmL.G.Orig did not capture the increase in N2O emissions with no-tillage. In Nebraska, LPJmL.D.Orig and DayCent agreed with observations that no-tillage decreases N2O emission. In Michigan, no-tillage resulted mainly in an increase in emissions in LPJmL, which can also be found in the observations but not in DayCent simulations.
For all sites, LPJmL showed a high variability in N2O emissions between days (Fig. 3 and Table A1). The interquartile ranges from LPJmL simulations were often much wider compared to observations and DayCent simulations. Hence, the variability of no-tillage effects on daily N2O emissions was overestimated. DayCent tended to underestimate the variability of N2O emissions between days (Table A1).
In LPJmL, the N2O emissions from no-tillage were entirely caused by changes in denitrification, whereas no-tillage mainly caused decreases in N2O emissions from nitrification (Fig. A2). This can be explained by higher soil moisture levels with no-tillage in LPJmL. In general, higher soil moisture levels trigger N2O emissions from denitrification (anaerobic process), whereas nitrification is decreased (aerobic process). In DayCent, no-tillage mainly decreased N2O emissions emitted from nitrification and had little effect on denitrification.
3.2 Soil hydrology and model modifications
3.2.1 Soil hydrology
The soil moisture (WFPS) simulated by LPJmL.D.Orig in Nebraska is high compared to the observed values for no-tillage (RMSD = 0.24, unitless, r=0.28) (Fig. 4) and tillage (RMSD = 0.21, unitless, r=0.10). DayCent was closer to the observed values for no-tillage (RMSD = 0.10, unitless, r=0.50) and tillage (RMSD = 0.11, unitless, r=0.49).

Figure 4Observed and simulated soil moisture (fraction of the WFPS) of no-tillage in the top soil (0–20 cm) in Nebraska.
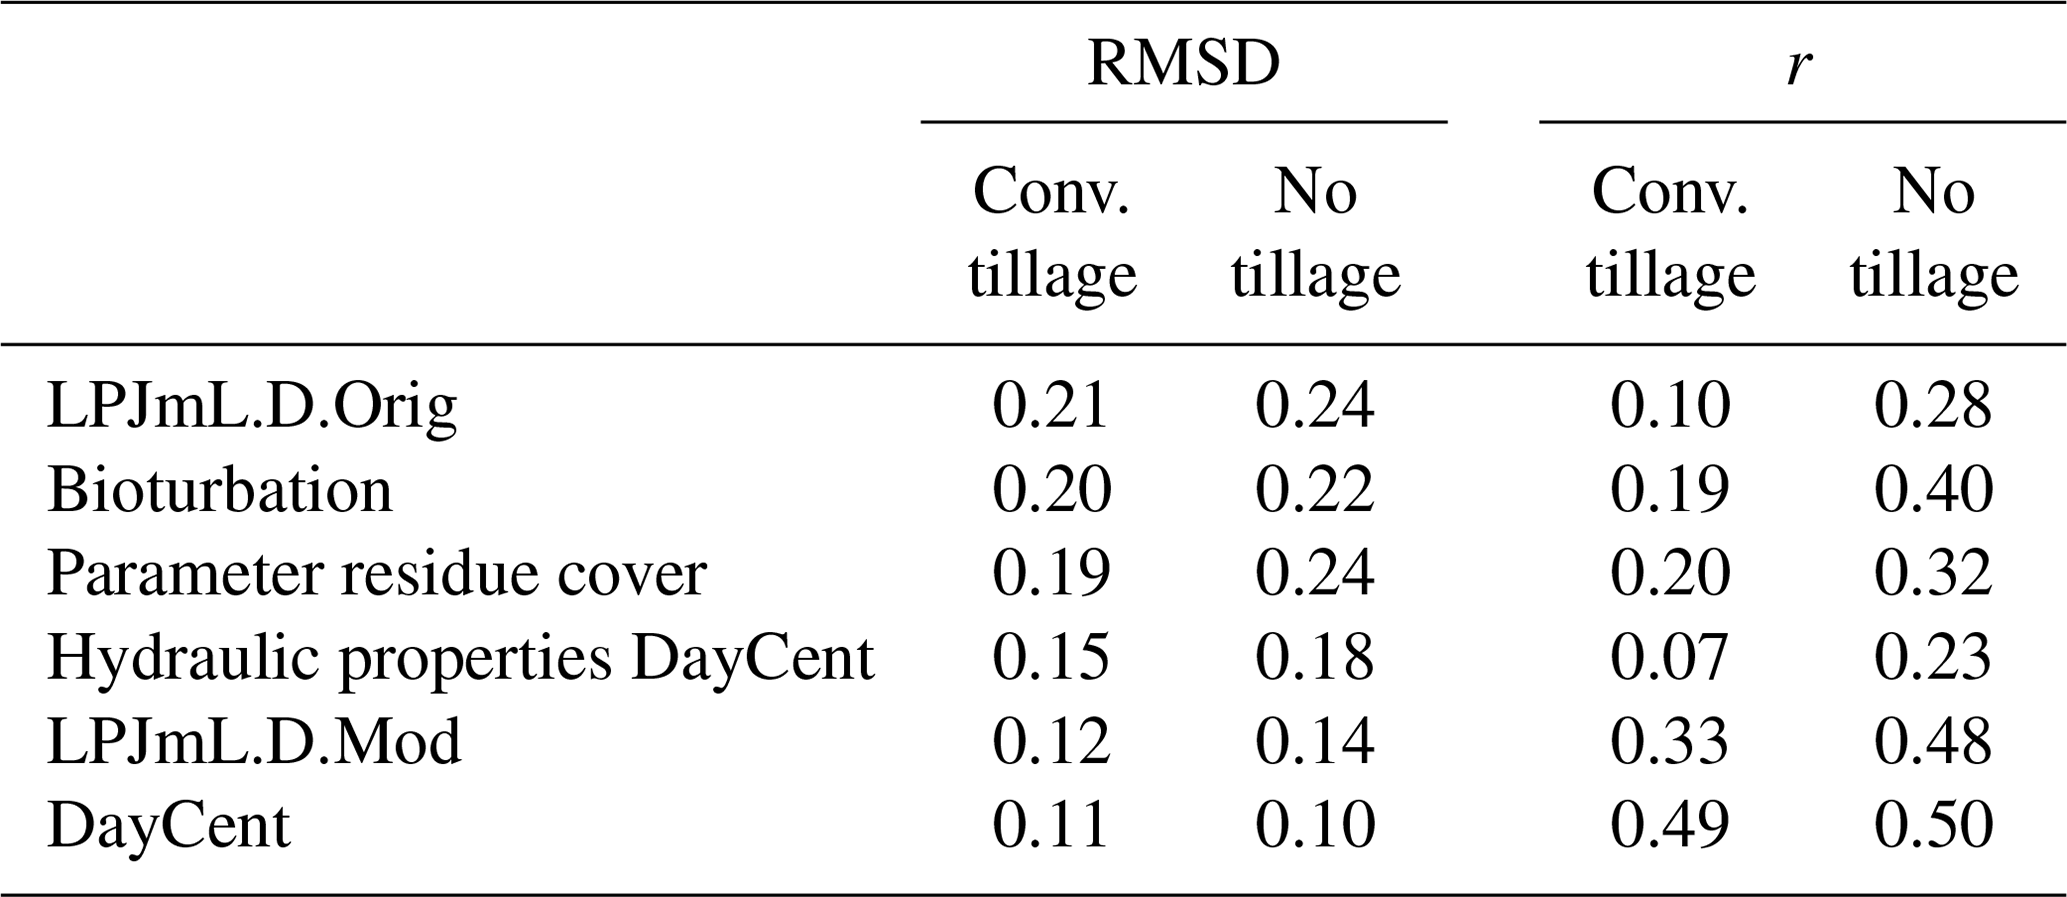
After modifying the parameters for surface litter and the hydraulic properties, the simulated soil moisture in the experiment LPJmL.D.Mod was closer to the observed values and simulation results from DayCent (Fig. 4). These combined effects showed the best performance for both tillage (RMSD = 0.12, unitless, r=0.33) and no-tillage (RMSD = 0.14, unitless, r=0.48), compared to implementing the modifications separately (Table 4). The dynamics in soil moisture simulated in the experiment LPJmL.D.Mod better reflected the dynamics simulated by DayCent. For instance, after October, a decrease in soil moisture was simulated by DayCent (and measured) which was previously not captured by LPJmL.D.Orig. In LPJmL.D.Orig, soil moisture was mostly stationary around FC, which in LPJmL.D.Mod was only the case from April to June.
Table 4Performance of DayCent and LPJmL compared to observed soil moisture (fraction of the WFPS) in Nebraska. The results are shown for both conventional tillage and no-tillage.
Although the simulation of soil moisture was improved with the modified settings, LPJmL simulations still overestimated soil moisture in comparison to observations. The PTFs used by both models to calculate the soil hydraulic properties (e.g., FC and WP) that influence water dynamics do not fully account for the influence of soil structure, which likely contributes to model errors (Fatichi et al., 2020).
3.2.2 Tillage effects on N2O emissions after modifications
Yearly averages
The modifications of the parameters for surface litter and the hydraulic properties improved the yearly tillage and no-tillage effects on N2O emissions across all the different sites (Fig. 5). The emissions under no-tillage (RMSD = 18.1 g N ha−1 d−1, ) and under tillage (RMSD = 16.3 g N ha−1 d−1, r=0.38 n.s.) were much closer to the observed values than with the original hydrologic parameterization. Although the modifications improved the simulation of tillage and no-tillage, LPJmL.D.Mod still overestimated the changes in emissions when switching from conventional tillage to no-tillage systems (Fig. 5; Table A1).
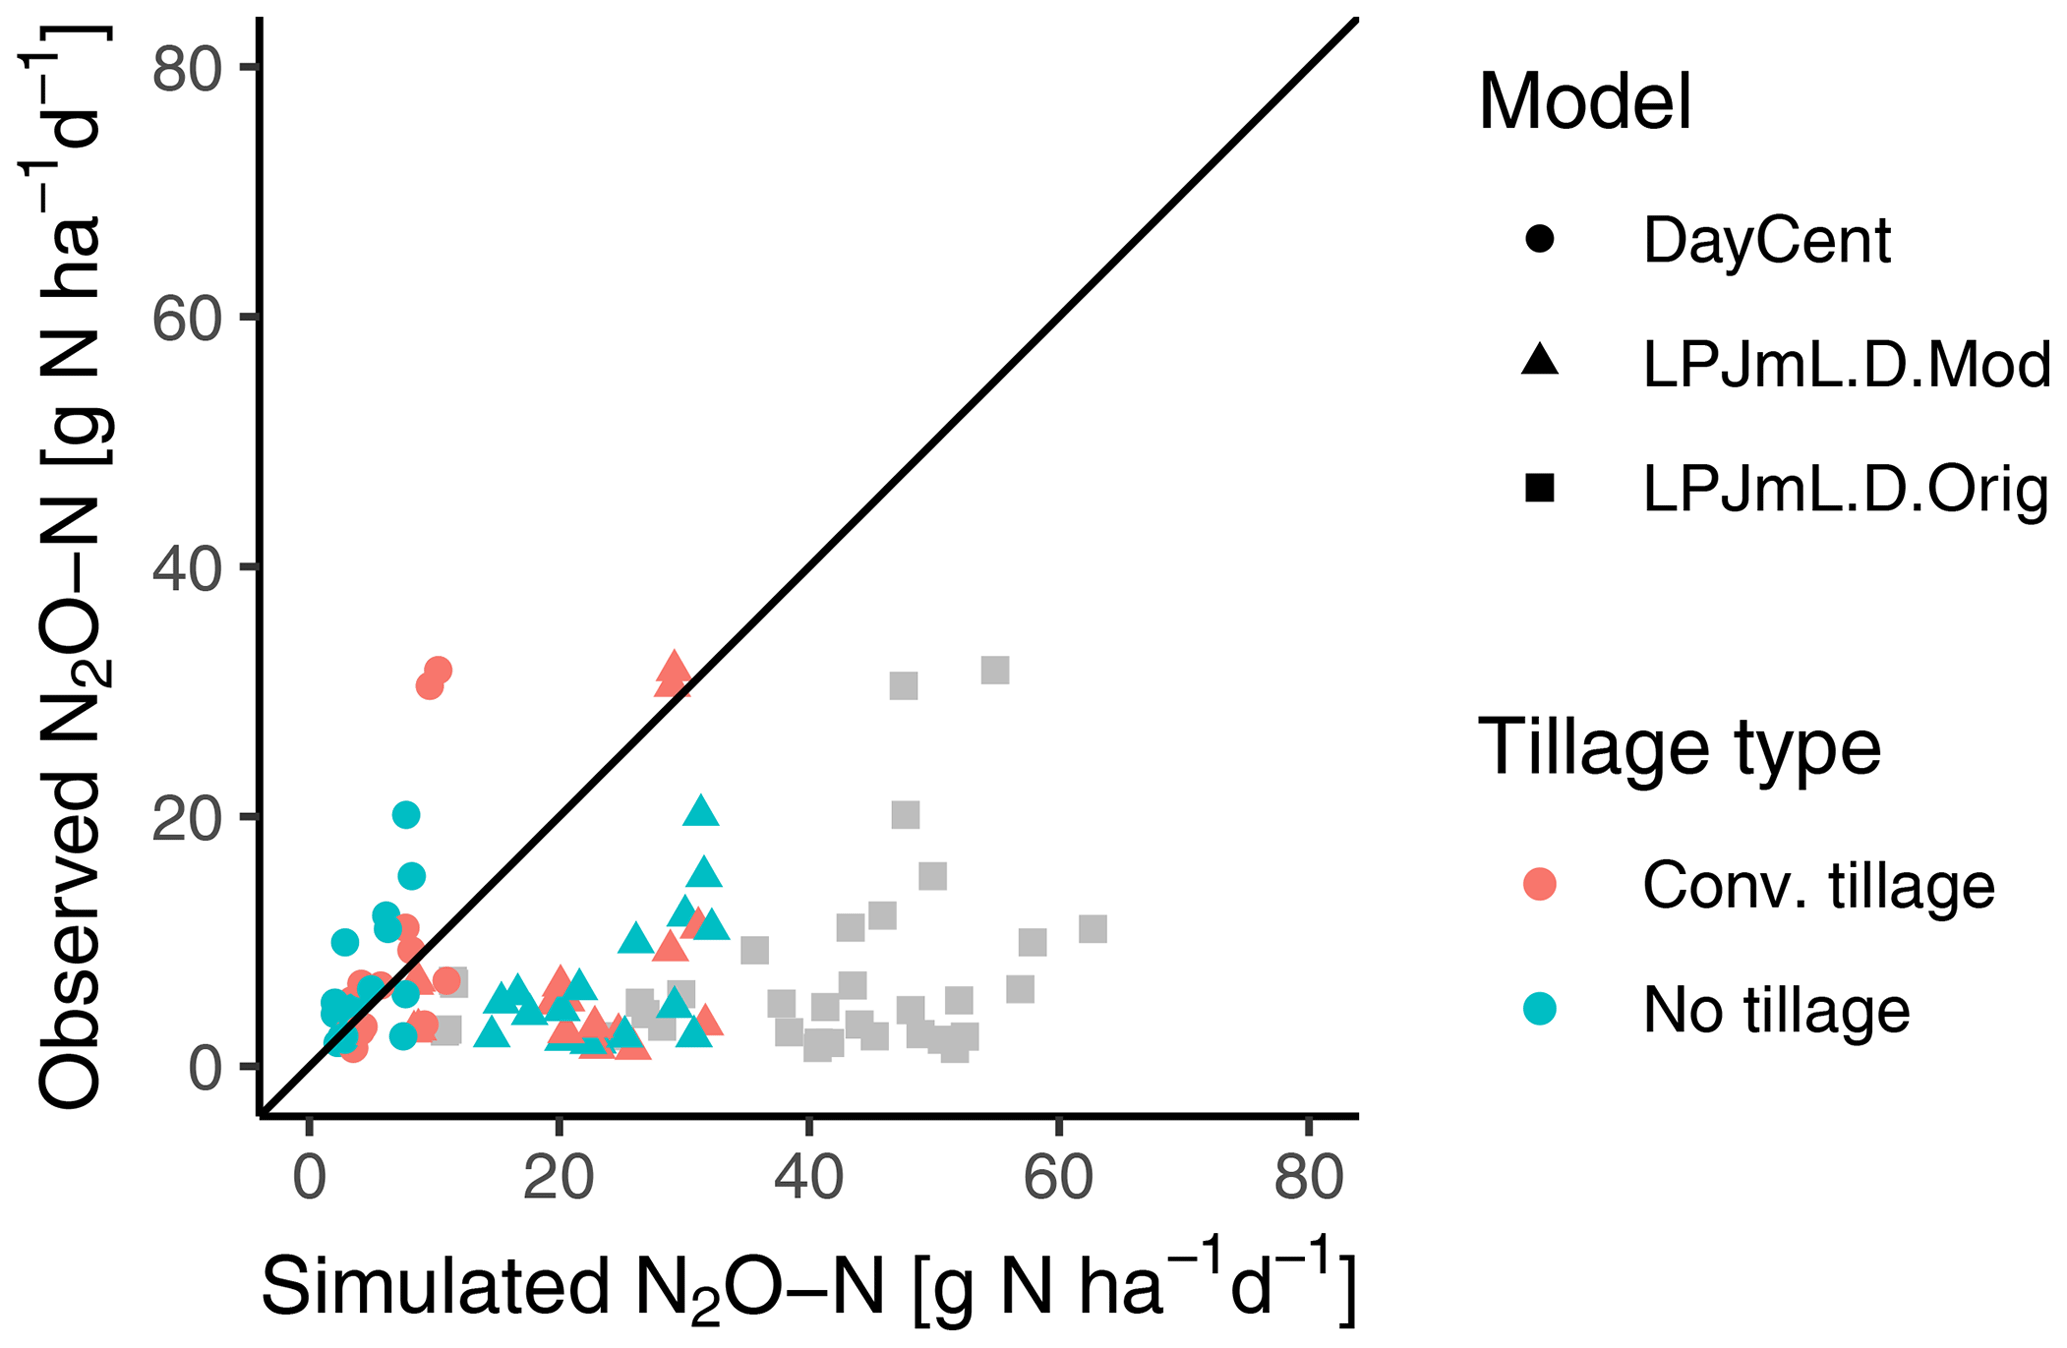
Figure 5Comparison of observed and simulated yearly averages of N2O emissions by tillage type and models DayCent, LPJmL.D.Mod and LPJmL.D.Orig (in gray). The data refer to all four sites and years of the experiments. Each point represents the average of all measured daily values within 1 year and tillage treatment. Tillage types are indicated by different colors.
The modifications did not improve the simulation of N2O emissions after shifting to no-tillage (Fig. 6). Although the deviations of the absolute differences between tillage systems decreased, the correlation with observations was less well captured (RMSD = 7.35 g N ha−1 d−1, n.s.), negating the improvements achieved through the consideration of detailed management information (LPJmL.G.Orig versus LPJmL.D.Orig). The conversion to no-tillage systems increased N2O emissions by 13.0 % in LPJmL.D.Mod. The increase in N2O emissions after shifting to no-tillage in the modified simulations was found across all sites in LPJmL.D.Mod, whereas DayCent showed decreases in N2O emissions across all sites at the yearly aggregation (Fig. 6). However, the observations showed both increases and decreases in N2O emissions after shifting to no-tillage for all sites at the yearly aggregation.
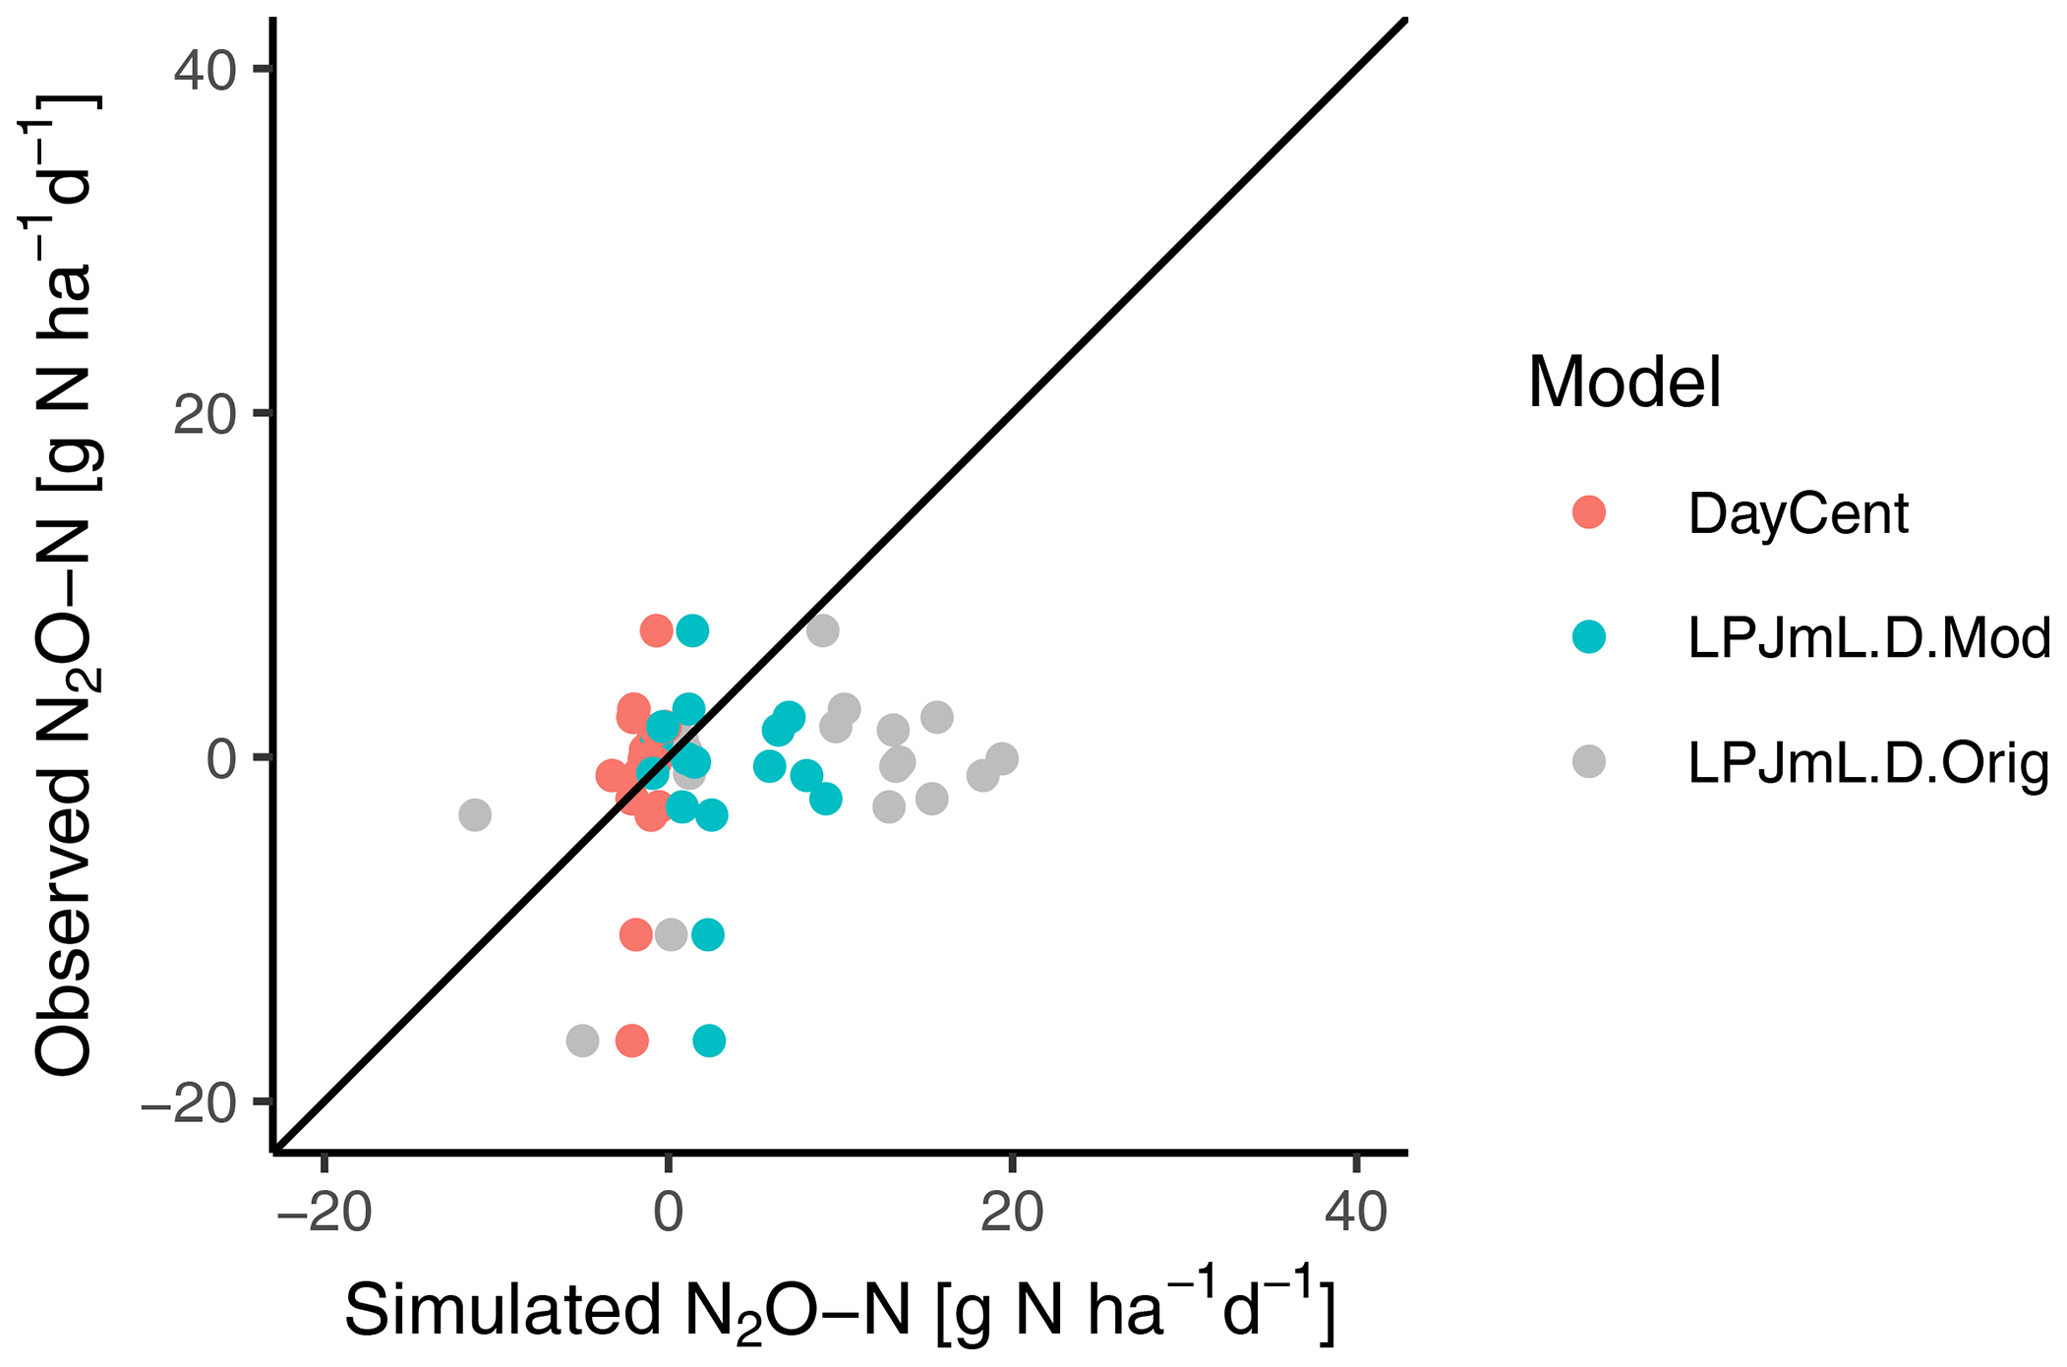
Figure 6Comparison of observed and simulated effects after converting to no-tillage (i.e., the difference between no-tillage and tillage). The data refer to yearly averages of N2O emissions and models DayCent, LPJmL.D.Mod and LPJmL.D.Orig (in gray). The data refer to all four sites and years of the experiments.
Daily emissions
The modified hydrology (LPJmL.D.Mod and LPJmL.G.Mod) decreased the variability of no-tillage effects on N2O emissions of individual days in most LPJmL simulations (Fig. A3). The interquartile ranges from daily N2O emissions simulated by LPJmL were more in agreement compared to the observations and DayCent as the variability of no-tillage effects on N2O emissions declined.
In the LPJmL.D.Mod experiment, simulated N2O emissions from no-tillage are now produced by both denitrification and nitrification (Fig. A2). The increases in emissions from denitrification were smaller than in the LPJmL.D.Orig experiment and closer to the simulated values by DayCent in Boigneville and Nebraska. The emissions from nitrification increased by switching from conventional tillage to no-tillage systems, whereas they decreased in the LPJmL.D.Orig experiment. However, changes in nitrification remain small compared to changes in denitrification.
Detailed information on agricultural management improved the LPJmL simulation of N2O emissions produced by tillage and no-tillage, as well as of the effect of switching from conventional tillage to no-tillage systems. However, also with detailed information, LPJmL overestimated the N2O emissions. The overestimation is caused by soil moisture being simulated too high resulting in high fluxes from denitrification. After correcting for the overestimation in soil moisture by modifying (1) the parameter that translate litter amounts into soil cover, (2) the parameter that determines the duration of the surface litter layer and (3) hydraulic properties, the yearly averages of N2O emissions were closer to the observed values for tillage and no-tillage separately but not for shifting from conventional tillage to no-tillage. However, the variability of no-tillage effects on N2O emissions between the days is now reduced in most of the LPJmL simulations, and the interquartile ranges from LPJmL simulations are now in better agreement with observations and DayCent.
DayCent performed better in simulating tillage and no-tillage effects on N2O emissions in the yearly averages. However, DayCent tended to underestimate the overall effects and the interannual variability of no-tillage on the emissions. DayCent mostly simulated a decrease in N2O emissions upon shifting to no-tillage. A major reason for this is that in DayCent conversion to no-tillage leads to increasing soil organic matter which is associated with decreased availability of mineral N. However, observations showed that no-tillage can also increase N2O emissions. For example, no-tillage can result in increased soil moisture content which can promote N2O emissions from denitrification. DayCent simulations showed basically no response in N2O emissions from denitrification. On the other hand, conventional tillage can increase the decomposition rate of (soil) organic matter through improved aeration of the soil. Increased decomposition leads to an increase in available N that can be transformed to N2O through nitrification and denitrification. The higher N2O emissions with conventional tillage in DayCent indicate that the increase in decomposition rate of (soil) organic matter due to tillage is dominant in comparison to the effect of the increased soil-moisture-driven denitrification rate.
The overall better performance of DayCent likely reflects the years of model development and testing at this scale and previous application at these sites (except the site in Boigneville) (Campbell et al., 2014; Del Grosso et al., 2008b; Yang et al., 2017), which enabled the more accurate reproduction of observed N2O emissions. The testing of the model performance, as well as improvements to reproduce observed N2O emissions, has been conducted in several studies (Necpálová et al., 2015; Fitton et al., 2014; Del Grosso et al., 2010). For example, model calibration has been conducted to test the model performance based on contributing parameters and key processes that affect N2O emissions. For instance, the maximum amount of N2O emissions produced during nitrification and the proportion of nitrified N that is lost as N2O can be specified. LPJmL is developed for global-scale applications and is therefore usually not calibrated as suitable calibration targets are typically not available at that scale.
The application of LPJmL at the experimental sites provided much insight into the deviations of the tillage effects on N2O emissions from observations. It enabled the use of site-specific information on agricultural management and soil C and N contents, whereas missing information at the global scale has to be supplemented with assumptions. Such assumptions can deviate significantly from observations. For example, there were large differences in soil N between the observed and simulated values in Michigan and Nebraska. The reason for these large differences is unclear. However, previous analyses have often shown poor agreement between measured and modeled soil mineral N values (see, for example, Del Grosso et al., 2008a).
As detailed information improved the simulation of tillage effects on N2O emissions, advancing the current state of information on agricultural management at the global scale could improve global estimates of tillage effects on N2O emissions. The study also highlighted the potential of improving the simulation of N2O emission by improving soil moisture dynamics. Any modification to improve LPJmL5.0-tillage needs to be evaluated at the global scale as LPJmL is typically applied at that scale (e.g., Heinke et al., 2019; Rolinski et al., 2018; Schaphoff et al., 2018). A first recommendation is to revisit the PTF used in LPJmL5.0-tillage. We saw in this exercise that LPJmL overestimated soil moisture independent of the tillage system. Although the modifications in residue cover improved the results on soil moisture, the most important modification was in the hydraulic properties resulting from the PTF. The modifications still resulted in relatively high soil moisture contents and therefore possibly still overestimated N2O emissions. A reason for this could be the relatively inefficient percolation of soil moisture to lower soil layers as soon as soil moisture is higher than FC.
In LPJmL, N2O emissions from denitrification increase exponentially after the WFPS reaches ∼80 %. This value is a proxy for assuming anaerobic conditions and is static for all soil texture types. However, finer-textured soils have lower gas diffusivity at a given WFPS than coarser textured soils (e.g., Del Grosso et al., 2000). In soils with lower gas diffusivity, denitrification is assumed to occur at lower levels of WFPS because atmospheric O2 may not diffuse into the soil fast enough to fully satisfy microbial demand (Parton et al., 1996). Proxy values of WFPS for anoxic conditions that are specific to soil texture type are currently not accounted for in LPJmL. In DayCent, the effect of gas diffusivity of different soil texture types is taken into account. An index of gas diffusivity is calculated based on the WFPS, bulk density and FC, which is a proxy for pore size distribution and air filled pore space. This index influences the denitrification rate and N2 to N2O and NOx to N2O ratios. For example, lower oxygen availability increases denitrification, and larger proportions of N2O will be further reduced to N2. In contrast to DayCent, LPJmL assumes that portions of N2 and N2O lost from denitrification are constant (i.e., 11 %), hence neglecting that, under completely anoxic conditions, N2O is fully reduced to N2. Including such processes in LPJmL might improve simulated N2O emissions. However, as very high WFPS conditions rarely occur in LPJmL for a long period of time and not at the experimental sites used for this study, the failure of the model to account for the effect that all denitrified N is emitted as N2 rather than as N2O likely has minimal relevance for our results.
N2O emissions are very dynamic in space and time and are characterized by hotspots (Butterbach-Bahl et al., 2013; Van Looy et al., 2017). In order to capture dynamics and hotspots of N2O emissions, measurements in high resolution are required (Barton et al., 2015). In this study, the measurements were of low temporal resolution at the experimental sites in Boigneville and Michigan which may have lead to high uncertainties in the observed effects of tillage types on N2O emissions. More frequent measurements of N2O emissions could improve the accuracy in determining N2O emissions under different tillage practices at those sites. Even though these constraints on measured data quality impose some uncertainty on the interpretation of our results, these data from the four experimental sites are deemed the most suitable for our study as they provide data on paired tillage–no-tillage experiments.
Previous findings have shown deviations between simulations with the LPJmL5.0-tillage model and the results from meta-analyses on global estimates of tillage effects on N2O emissions. In this study, we tested LPJmL5.0-tillage at different experimental sites to study whether deviations in N2O emissions result from a lack of detailed information on agricultural management, the representation of soil water dynamics or both. The results were compared to observed values of the experimental sites and to results of the field-scale model DayCent.
This study confirmed that the deviations in N2O emissions can be explained by both a lack of detailed information on management and relatively high soil moisture levels simulated by LPJmL5.0-tillage. Advancing the current state of information on agricultural management can thus improve global estimates of tillage effects on N2O emissions. Furthermore, the representation of soil water dynamics and N2O dynamics highlights the potential to improve LPJmL5.0-tillage. However, given the limited skill to reproduce observed patterns in simulations with LPJmL5.0-tillage, the model currently does not lend itself to the evaluation of the impacts of different tillage systems on N2O emissions but requires further research on better representation of soil hydrology and its effects on N2O emissions.
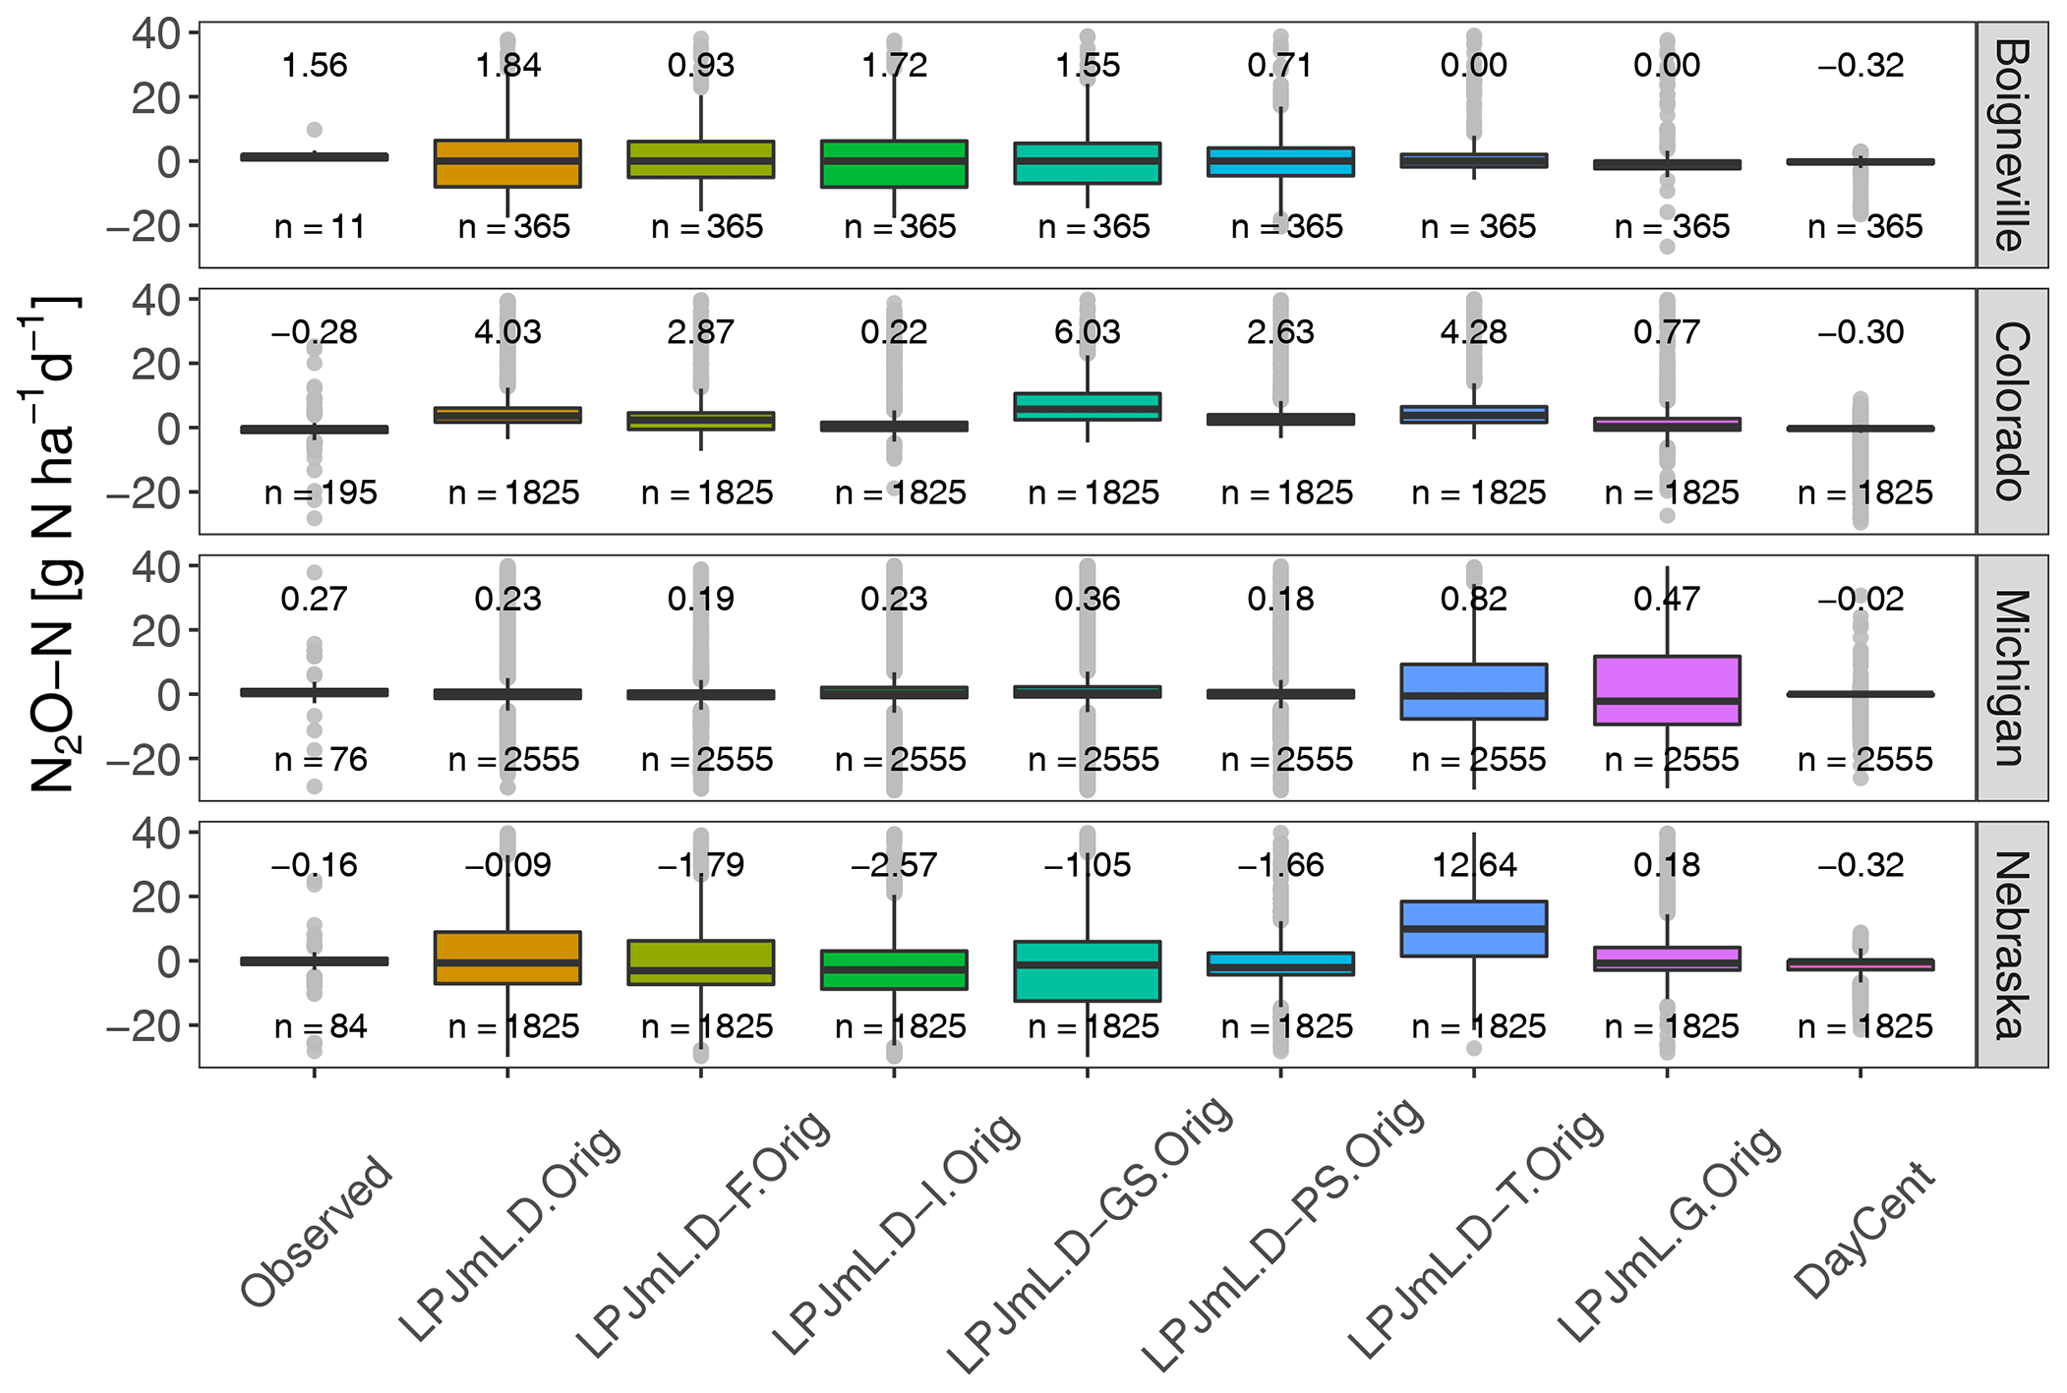
Figure A1Effects of no-tillage (i.e., the difference between no-tillage and tillage) on N2O emissions on individual days by the different experimental simulations, including the original runs of LPJmL, observations and the simulated values by DayCent. The numbers on top of the box plots represent the median values.
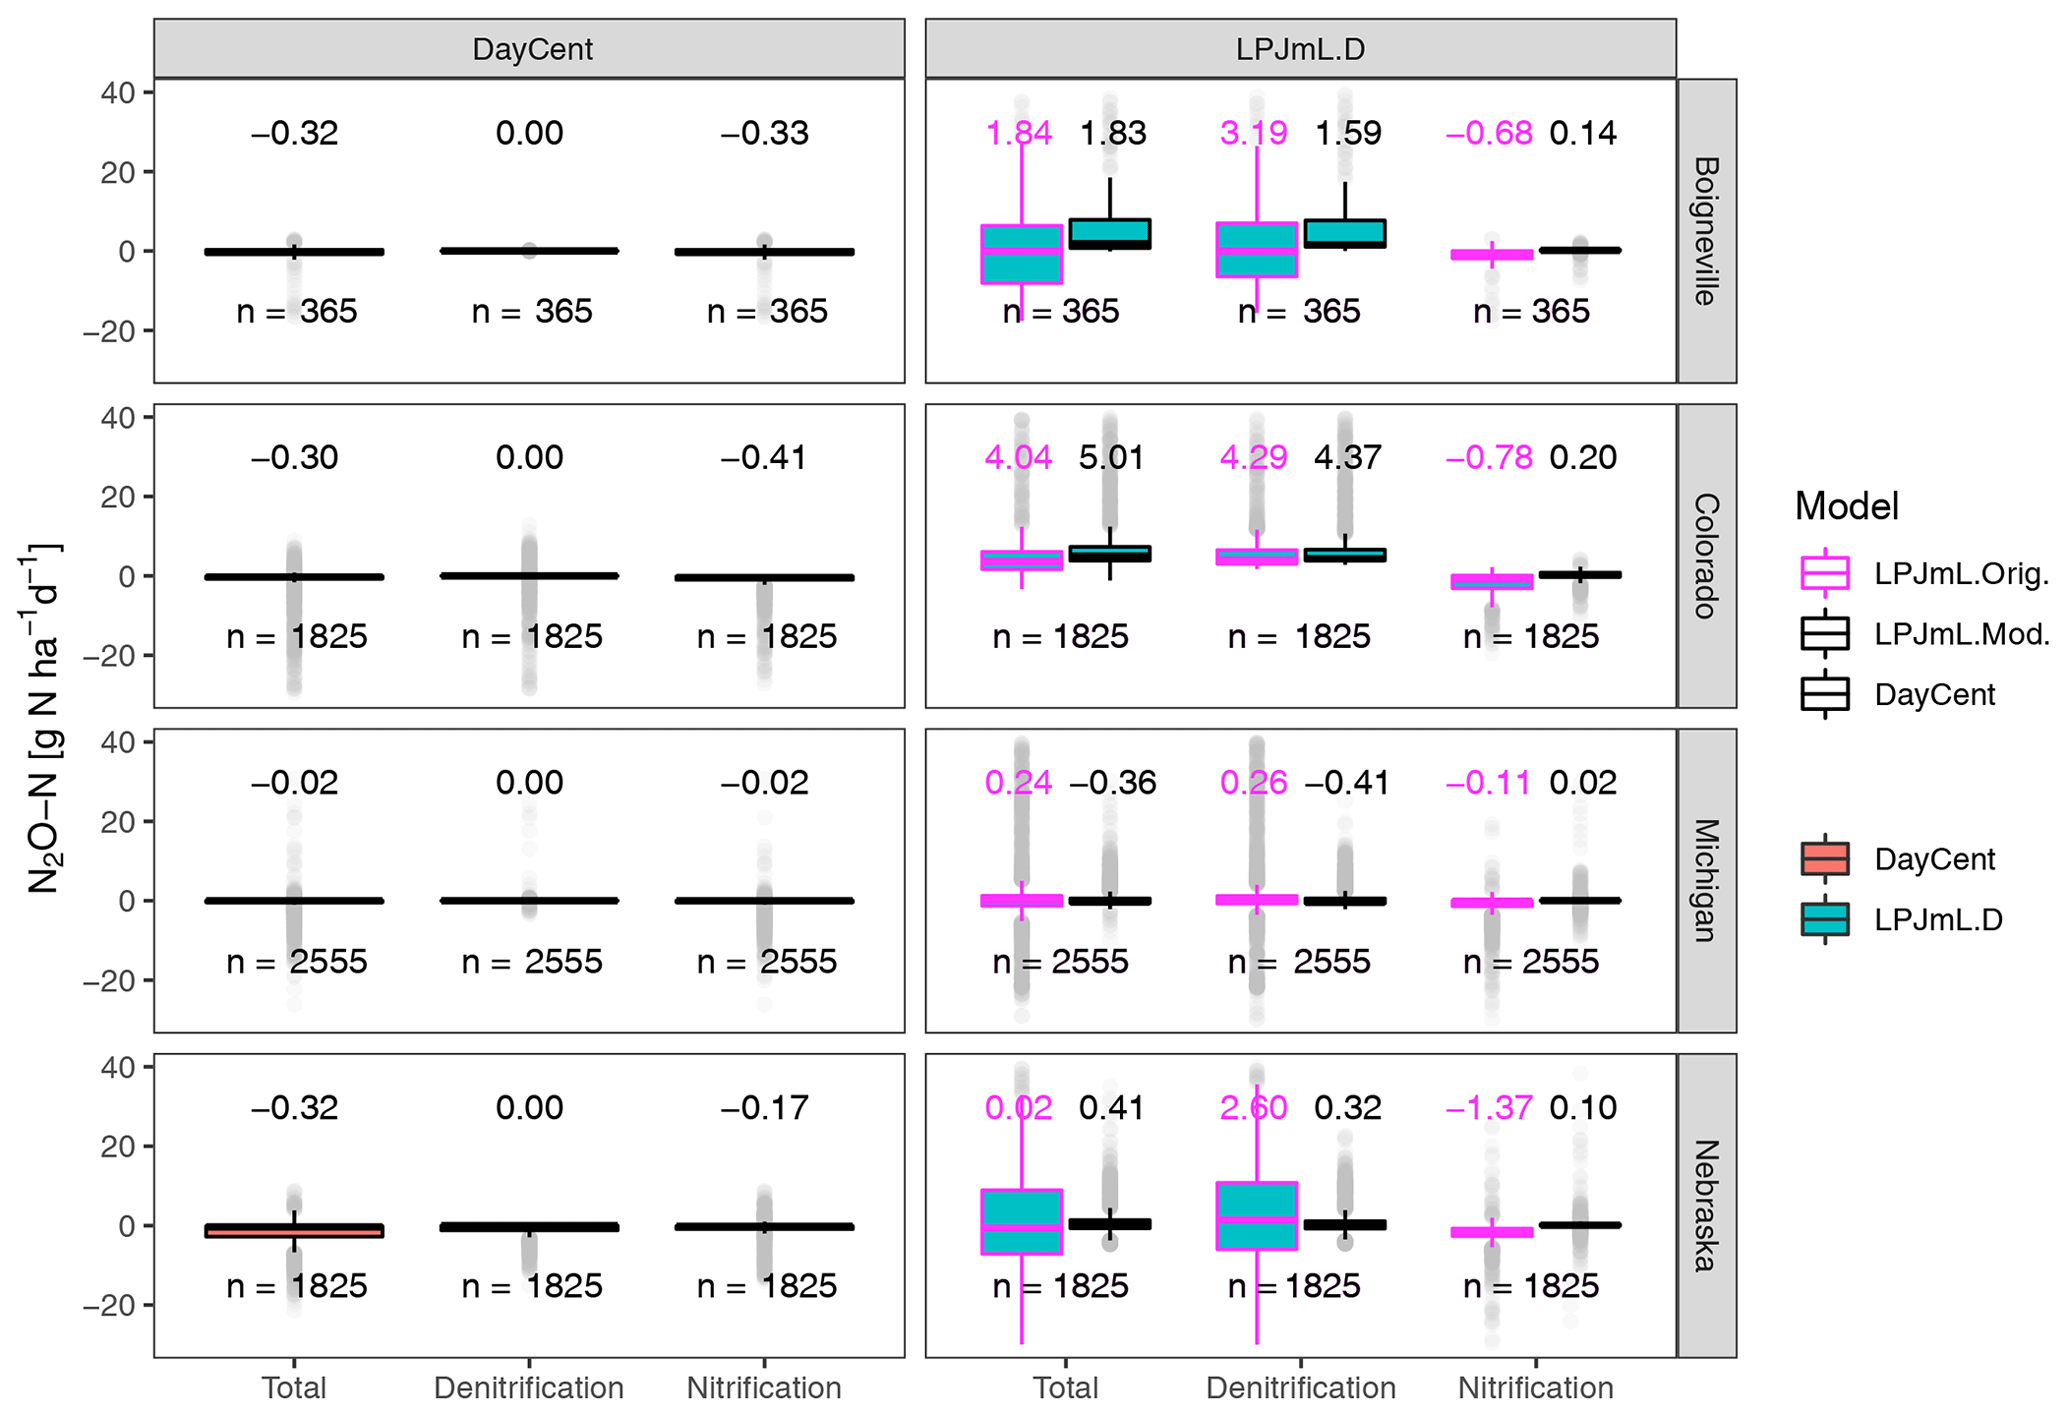
Figure A2The relative share of N2O emissions from nitrification and denitrification on individual days with no-tillage. The simulated values include the original (purple lines) and the modified (black lines) LPJmL settings. The numbers on top of the box plots represent the median values. The simulated values by DayCent are also shown. Observed values are not available.

Figure A3Effects of no-tillage (i.e., the difference between no-tillage and tillage) on N2O emissions on individual days by the different experimental simulations, including the original (purple lines) and the modified (black lines) simulations from LPJmL, observations, and the simulated values by DayCent. The numbers on top of the box plots represent the median values.
Table A1The performance of DayCent and LPJmL over all sites and years. RMSD is the root mean square deviation (in g N ha−1 d−1), r is the correlation coefficient (unitless), p is the significance of r (unitless), MB is the mean bias (unitless) and SD is the standard deviation (in g N ha−1 d−1).
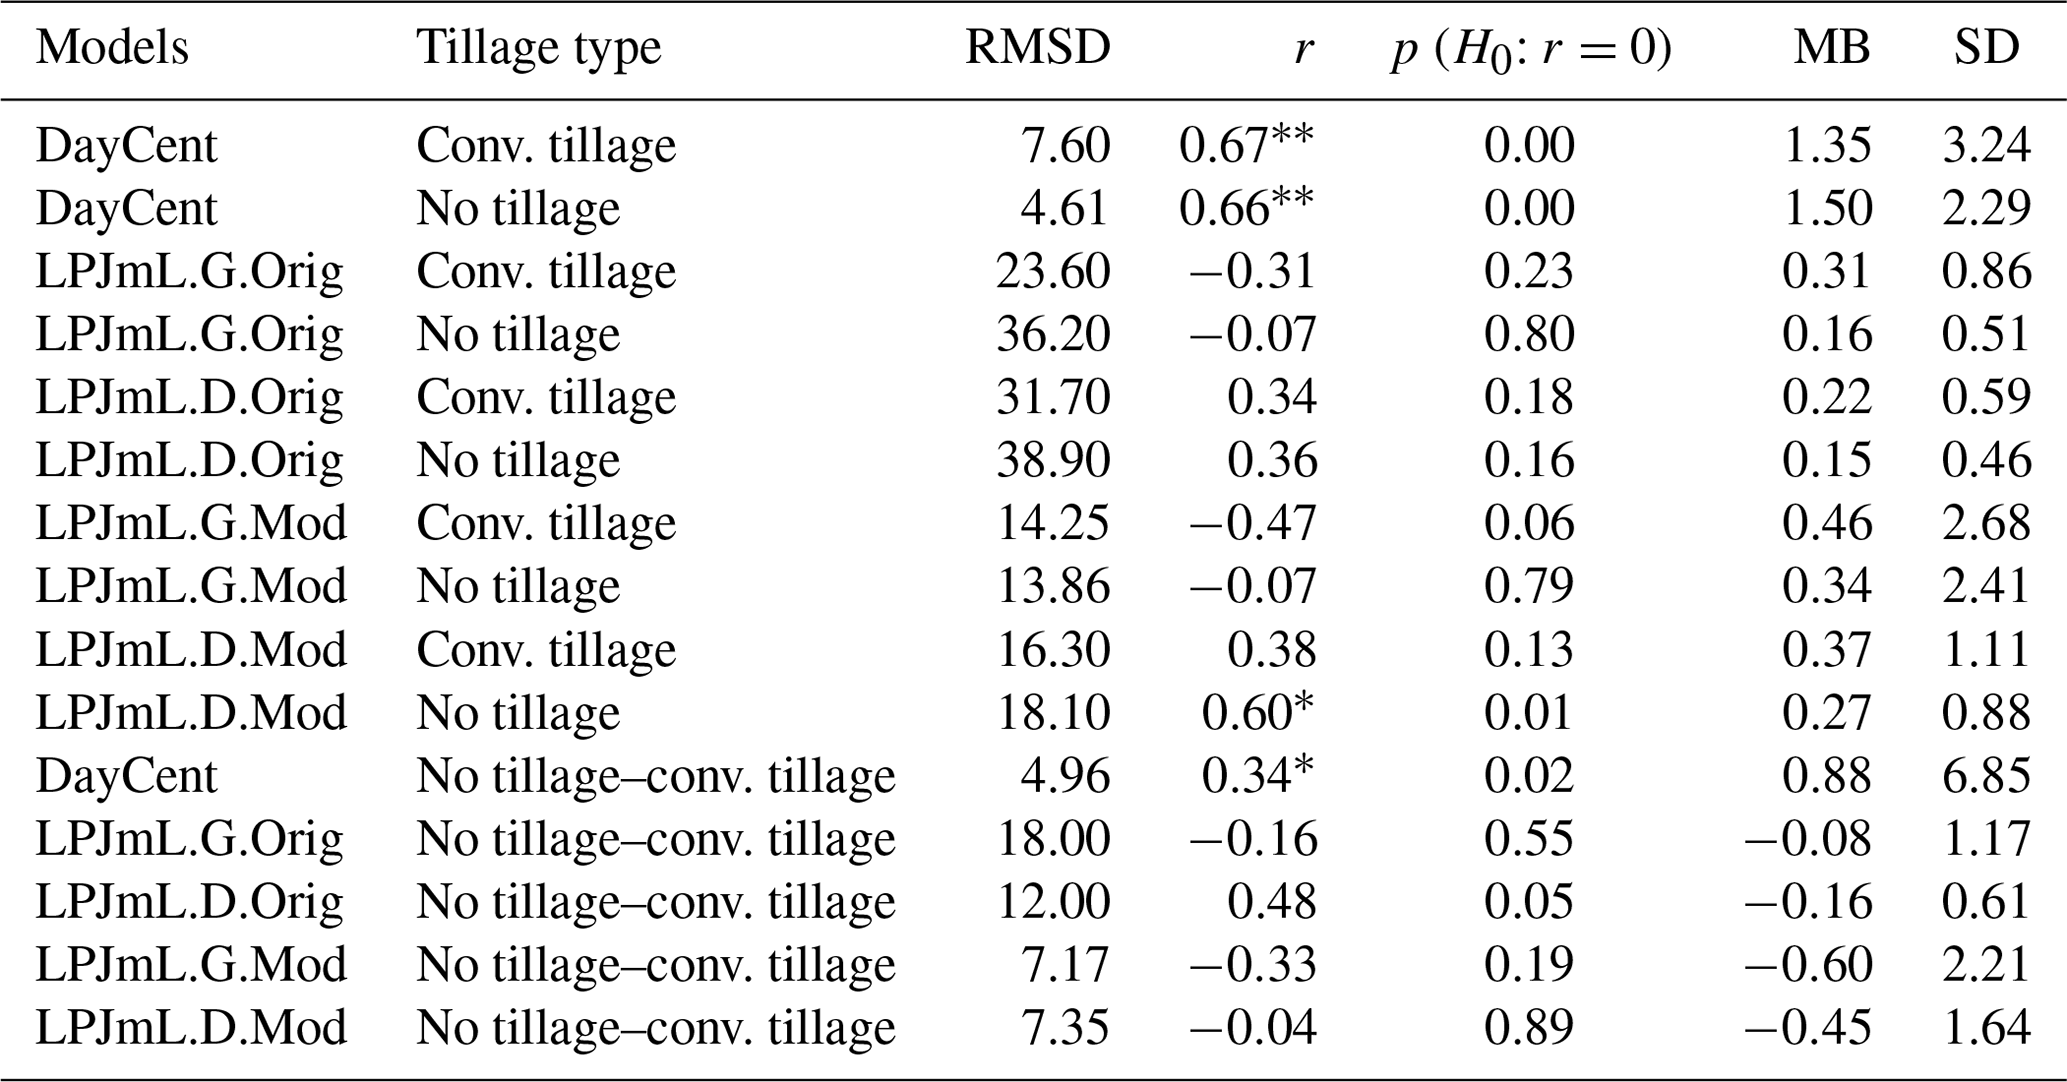
Significance levels are indicated with * for p<0.05 and for p<0.01 for all r values.
The LPJmL source code is publicly available under the GNU AGPL version 3 license. An exact version of the code described here and the R script used for postprocessing the data from the simulations conducted are archived under https://doi.org/10.5281/zenodo.3592381 (Lutz et al., 2019b).
FL and CM designed the study in discussion with SDG and SO. FL conducted all model simulations and wrote the paper with support from CM. FL prepared all figures with support from SM. FL conducted the analyses with input from CM and JH. All authors edited the paper.
The authors declare that they have no conflict of interest.
Femke Lutz, Sara Minoli and Susanne Rolinski gratefully thank the German Ministry for Education and Research (BMBF) for funding this work, which is part of the MACMIT project (01LN1317A). Femke Lutz also thanks the Huub and Julienne Spiertz Fund that enabled her to visit Colorado State University and the USDA to collaborate on this research. Support for this research was also provided by the NSF Long-Term Ecological Research program (DEB 1832042) at the Kellogg Biological Station and by Michigan State University AgBioResearch. We also would like to thank Melannie Hartman for the technical support for the DayCent simulations and Bernard Nicolardot for sharing the data of the experimental site in Boigneville.
This research has been supported by the Bundesministerium für Bildung und Forschung (grant no. 01LN1317A).
The publication of this article was funded by the
Open-access Fund of the Leibniz Association.
This paper was edited by Leena Järvi and reviewed by two anonymous referees.
Alvarez, C., Costantini, A., Alvarez, C. R., Alves, B. J., Jantalia, C. P., Martellotto, E. E., and Urquiaga, S.: Soil nitrous oxide emissions under different management practices in the semiarid region of the Argentinian Pampas, Nutr. Cycl. Agroecosyst., 94, 209–220, https://doi.org/10.1007/s10705-012-9534-9, 2012. a
Álvaro-Fuentes, J., Morell, F. J., Plaza-Bonilla, D., Arrúe, J. L., and Cantero-Martínez, C.: Modelling tillage and nitrogen fertilization effects on soil organic carbon dynamics, Soil Till. Res., 120, 32–39, https://doi.org/10.1016/j.still.2012.01.009, 2012. a
Barton, L., Wolf, B., Rowlings, D., Scheer, C., Kiese, R., Grace, P., Stefanova, K., and Butterbach-Bahl, K.: Sampling frequency affects estimates of annual nitrous oxide fluxes, Sci. Rep., 5, 1–9, https://doi.org/10.1038/srep15912, 2015. a
Begum, K., Kuhnert, M., Yeluripati, J. B., Ogle, S. M., Parton, W. J., Williams, S. A., Pan, G., Cheng, K., Ali, M. A., and Smith, P.: Modelling greenhouse gas emissions and mitigation potentials in fertilized paddy rice fields in Bangladesh, Geoderma, 341, 206–215, https://doi.org/10.1016/j.geoderma.2019.01.047, 2019. a
Bessou, C., Mary, B., Léonard, J., Roussel, M., Gréhan, E., and Gabrielle, B.: Modelling soil compaction impacts on nitrous oxide emissions in arable fields, Eur. J. Soil Sci., 61, 348–363, https://doi.org/10.1111/j.1365-2389.2010.01243.x, 2010. a
Boeckx, P., Van Nieuland, K., and Van Cleemput, O.: Short-term effect of tillage intensity on N2O and CO2 emissions, Agron. Sustain. Dev., 31, 453–461, https://doi.org/10.1007/s13593-011-0001-9, 2011. a
Butterbach-Bahl, K., Baggs, E. M., Dannenmann, M., Kiese, R., and Zechmeister-Boltenstern, S.: Nitrous oxide emissions from soils: how well do we understand the processes and their controls?, Philos. T. Roy. Soc. B, 368, 20130122, https://doi.org/10.1098/rstb.2013.0122, 2013. a, b
Campbell, E. E., Johnson, J. M., Jin, V. L., Lehman, R. M., Osborne, S. L., Varvel, G. E., and Paustian, K.: Assessing the soil carbon, biomass production, and nitrous oxide emission impact of corn stover management for bioenergy feedstock production using DAYCENT, Bioenergy Res., 7, 491–502, https://doi.org/10.1007/s12155-014-9414-z, 2014. a, b
Ciais, P., Sabine, C., Bala, G., Bopp, L., Brovkin, V., Canadell, J., Chhabra, A., DeFries, R., Galloway, J., and Heimann, M.: Carbon and other biogeochemical cycles, Cambridge University Press, Cambridge, 465–570, 2014. a
Del Grosso, S., Parton, W., Mosier, A., Ojima, D., Kulmala, A., and Phongpan, S.: General model for N2O and N2 gas emissions from soils due to denitrification, Global Biogeochem. Cy., 14, 1045–1060, https://doi.org/10.1029/1999GB001225, 2000. a, b
Del Grosso, S., Ojima, D., Parton, W., Mosier, A., Peterson, G., and Schimel, D.: Simulated effects of dryland cropping intensification on soil organic matter and greenhouse gas exchanges using the DAYCENT ecosystem model, Environ. Pollut., 116, S75–S83, https://doi.org/10.1016/S0269-7491(01)00260-3, 2002. a, b
Del Grosso, S., Halvorson, A., and Parton, W.: Testing DAYCENT model simulations of corn yields and nitrous oxide emissions in irrigated tillage systems in Colorado, J. Environ. Qual., 37, 1383–1389, https://doi.org/10.2134/jeq2007.0292, 2008a. a
Del Grosso, S., Parton, W., Ojima, D., Keough, C., Riley, T., and Mosier, A.: Chapter 18. DAYCENT Simulated Effects of Land Use and Climate on County Level N Loss Vectors in the USA,Academic Press/Elsevier, Amsterdam, Boston, 1–28, 2008b. a
Del Grosso, S., Ogle, S., Parton, W., and Breidt, F.: Estimating uncertainty in N2O emissions from US cropland soils, Global Biogeochem. Cy., 24, GB1009, https://doi.org/10.1029/2009GB003544, 2010. a
Del Grosso, S. J., Parton, W. J., Mosier, A. R., Ojima, D. S., Kulmala, A. E., and Phongpan, S.: General model for N2O and N2 gas emissions from soils due to dentrification, Global Biogeochem. Cy., 14, 1045–1060, https://doi.org/10.1029/1999gb001225, 2000. a
Del Grosso, S. J., Ojima, D. S., Parton, W. J., Stehfest, E., Heistemann, M., DeAngelo, B., and Rose, S.: Global scale DAYCENT model analysis of greenhouse gas emissions and mitigation strategies for cropped soils, Global Planet. Change, 67, 44–50, https://doi.org/10.1016/j.gloplacha.2008.12.006, 2009. a, b, c, d, e
Deng, Q., Hui, D., Wang, J., Yu, C.-L., Li, C., Reddy, K. C., and Dennis, S.: Assessing the impacts of tillage and fertilization management on nitrous oxide emissions in a cornfield using the DNDC model, J. Geophys. Res.-Biogeo., 121, 337–349, https://doi.org/10.1002/2015jg003239, 2016. a, b
Elliott, J., Müller, C., Deryng, D., Chryssanthacopoulos, J., Boote, K. J., Büchner, M., Foster, I., Glotter, M., Heinke, J., Iizumi, T., Izaurralde, R. C., Mueller, N. D., Ray, D. K., Rosenzweig, C., Ruane, A. C., and Sheffield, J.: The Global Gridded Crop Model Intercomparison: data and modeling protocols for Phase 1 (v1.0), Geosci. Model Dev., 8, 261–277, https://doi.org/10.5194/gmd-8-261-2015, 2015. a
Erb, K.-H., Luyssaert, S., Meyfroidt, P., Pongratz, J., Don, A., Kloster, S., Kuemmerle, T., Fetzel, T., Fuchs, R., Herold, M., Haberl, H., Jones, C. D., Marín-Spiotta, E., McCallum, I., Robertson, E., Seufert, V., Fritz, S., Valade, A., Wiltshire, A., and Dolman, A. J.: Land management: data availability and process understanding for global change studies, Global Change Biol., 23, 512–533, https://doi.org/10.1111/gcb.13443, 2017. a
FAO: World reference base for soil resources, in: vol. 3, Food & Agriculture Org., Rome, 1998. a
Fatichi, S., Or, D., Walko, R., Vereecken, H., Young, M. H., Ghezzehei, T. A., Hengl, T., Kollet, S., Agam, N., and Avissar, R.: Soil structure is an important omission in Earth System Models, Nat. Commun., 11, 1–11, https://doi.org/10.1038/s41467-020-14411-z, 2020. a
Fitton, N., Datta, A., Hastings, A., Kuhnert, M., Topp, C., Cloy, J., Rees, R., Cardenas, L., Williams, J., Smith, K., Chadwick, D., and Smith, P.: The challenge of modelling nitrogen management at the field scale: simulation and sensitivity analysis of N2O fluxes across nine experimental sites using DailyDayCent, Environ. Res. Lett., 9, 095003, https://doi.org/10.1088/1748-9326/9/9/095003, 2014. a
Folberth, C., Elliott, J., Müller, C., Balkovic, J., Chryssanthacopoulos, J., Izaurralde, R. C., Jones, C. D., Khabarov, N., Liu, W., Reddy, A., Schmid, E., Skalský, R., Yang, H., Arneth, H., Ciais, P., Deryng, D., Lawrence, P. J., Olin, S., Pugh, T. A. M., Ruane, A. C., and Wang, X.: Parameterization-induced uncertainties and impacts of crop management harmonization in a global gridded crop model ensemble, PLoS One, 14, e0221862, https://doi.org/10.1371/journal.pone.0221862, 2019. a
Grandy, A. S., Loecke, T. D., Parr, S., and Robertson, G. P.: Long-term trends in nitrous oxide emissions, soil nitrogen, and crop yields of till and no-till cropping systems, J. Environ. Qual., 35, 1487–1495, https://doi.org/10.2134/jeq2005.0166, 2006. a, b
Gregory, J. M.: Soil cover prediction with various amounts and types of crop residue, T. ASAE, 25, 1333–1337, https://doi.org/10.13031/2013.33723, 1982. a, b
Gryze, S. D., Wolf, A., Kaffka, S. R., Mitchell, J., Rolston, D. E., Temple, S. R., Lee, J., and Six, J.: Simulating greenhouse gas budgets of four California cropping systems under conventional and alternative management, Ecol. Appl., 20, 1805–1819, https://doi.org/10.1890/09-0772.1, 2010. a
Halvorson, A. D., Mosier, A. R., Reule, C. A., and Bausch, W. C.: Nitrogen and tillage effects on irrigated continuous corn yields, Agron. J., 98, 63–71, https://doi.org/10.2134/agronj2005.0174, 2006. a, b
Hartman, M., Parton, W., Del Grosso, S., Easter, M., Hendryx, J., Hilinski, T., Kelly, R., Keough, C., Killian, K., Lutz, S., Marx, E., McKeown, R., Ogle, S., Ojima, D., Paustian, K., Swan, A., and Williams, S.: The Daily Century Ecosystem, Soil Organic Matter, Nutrient Cycling, Nitrogen Trace Gas, and Methane Model: User Manual, Scientific Basis, and Technical Documentation., Natural Resource Ecology Laboratory, Colorado State University, Fort Collins, CO, 2018. a
Heinke, J., Müller, C., Lannerstad, M., Gerten, D., and Lucht, W.: Freshwater resources under success and failure of the Paris climate agreement, Earth Syst. Dynam., 10, 205–217, https://doi.org/10.5194/esd-10-205-2019, 2019. a
Jägermeyr, J., Gerten, D., Heinke, J., Schaphoff, S., Kummu, M., and Lucht, W.: Water savings potentials of irrigation systems: global simulation of processes and linkages, Hydrol. Earth Syst. Sci., 19, 3073–3091, https://doi.org/10.5194/hess-19-3073-2015, 2015. a
Jin, V. L., Schmer, M. R., Stewart, C. E., Sindelar, A. J., Varvel, G. E., and Wienhold, B. J.: Long-term no-till and stover retention each decrease the global warming potential of irrigated continuous corn, Global Change Biol., 23, 2848–2862, https://doi.org/10.1111/gcb.13637, 2017. a, b, c
Kelly, R., Parton, W., Hartman, M., Stretch, L., Ojima, D., and Schimel, D.: Intra‐annual and interannual variability of ecosystem processes in shortgrass steppe, J. Geophys. Res.-Atmos., 105, 20093–20100, https://doi.org/10.1029/2000JD900259, 2000. a
Lutz, F., Herzfeld, T., Heinke, J., Rolinski, S., Schaphoff, S., von Bloh, W., Stoorvogel, J. J., and Müller, C.: Simulating the effect of tillage practices with the global ecosystem model LPJmL (version 5.0-tillage), Geosci. Model Dev., 12, 2419–2440, https://doi.org/10.5194/gmd-12-2419-2019, 2019a. a, b, c, d, e, f, g, h, i
Lutz, F., Müller, C., Heinke, J., Minoli, S., and Rolinski, S.: LPJmL5.0-tillage: Original source code as used in Lutz et al., 2019: submitted to Geosci. Model Dev., https://doi.org/10.5281/zenodo.3592381, 2019b. a
Lutz, F., Stoorvogel, J. J., and Müller, C.: Options to model the effects of tillage on N2O emissions at the global scale, Ecol. Model., 392, 212–225, https://doi.org/10.1016/j.ecolmodel.2018.11.015, 2019c. a
Mei, K., Wang, Z., Huang, H., Zhang, C., Shang, X., Dahlgren, R. A., Zhang, M., and Xia, F.: Stimulation of N2O emission by conservation tillage management in agricultural lands: A meta-analysis, Soil Till. Res., 182, 86–93, https://doi.org/10.1016/j.still.2018.05.006, 2018. a
Mosquera, J., ter Beek, C., and Hol, J.: Precise soil management as a tool to reduce CH4 and N2O emissions from agricultural soil. II. Field measurements at arable soils in the Netherlands, Report 9067549851, Agrotechnology & Food Innovations, Animal Sciences Group Report No. 28, Wageningen, the Netherlands, 2005. a
Mueller, N. D., Gerber, J. S., Johnston, M., Ray, D. K., Ramankutty, N., and Foley, J. A.: Closing yield gaps through nutrient and water management, Nature, 490, 254–257, https://doi.org/10.1038/nature11420, 2012. a, b
Necpálová, M., Anex, R. P., Fienen, M. N., Del Grosso, S. J., Castellano, M. J., Sawyer, J. E., Iqbal, J., Pantoja, J. L., and Barker, D. W.: Understanding the DayCent model: Calibration, sensitivity, and identifiability through inverse modeling, Environ. Model. Softw., 66, 110–130, https://doi.org/10.1016/j.envsoft.2014.12.011, 2015. a
Oorts, K., Merckx, R., Gréhan, E., Labreuche, J., and Nicolardot, B.: Determinants of annual fluxes of CO2 and N2O in long-term no-tillage and conventional tillage systems in northern France, Soil Till. Res., 95, 133–148, https://doi.org/10.1016/j.still.2006.12.002, 2007. a, b, c
Pannkuk, C., Stockle, C., and Papendick, R.: Evaluating CropSyst simulations of wheat management in a wheat-fallow region of the US pacific northwest, Agric. Syst., 57, 121–134, https://doi.org/10.1016/s0308-521x(97)00076-0, 1998. a
Parton, W., Mosier, A., Ojima, D., Valentine, D., Schimel, D., Weier, K., and Kulmala, A. E.: Generalized model for N2 and N2O production from nitrification and denitrification, Global Biogeochem. Cy., 10, 401–412, https://doi.org/10.1029/96GB01455, 1996. a, b
Parton, W., Holland, E., Del Grosso, S., Hartman, M., Martin, R., Mosier, A., Ojima, D., and Schimel, D.: Generalized model for NOx and N2O emissions from soils, J. Geophys. Res.-Atmos., 106, 17403–17419, https://doi.org/10.1029/2001JD900101, 2001. a, b, c
Parton, W. J., Hartman, M., Ojima, D., and Schimel, D.: DAYCENT and its land surface submodel: description and testing, Global Planet. Change, 19, 35–48, https://doi.org/10.1016/s0921-8181(98)00040-x, 1998. a
Plaza-Bonilla, D., Álvaro Fuentes, J., Bareche, J., Pareja-Sánchez, E., Justes, É., and Cantero-Martínez, C.: No-tillage reduces long-term yield-scaled soil nitrous oxide emissions in rainfed Mediterranean agroecosystems: A field and modelling approach, Agr. Ecosyst. Environ., 262, 36–47, https://doi.org/10.1016/j.agee.2018.04.007, 2018. a
Potter, P., Ramankutty, N., Bennett, E. M., and Donner, S. D.: Characterizing the spatial patterns of global fertilizer application and manure production, Earth Interact., 14, 1–22, https://doi.org/10.1175/2009EI288.1, 2010. a, b
Rolinski, S., Müller, C., Heinke, J., Weindl, I., Biewald, A., Bodirsky, B. L., Bondeau, A., Boons-Prins, E. R., Bouwman, A. F., Leffelaar, P. A., te Roller, J. A., Schaphoff, S., and Thonicke, K.: Modeling vegetation and carbon dynamics of managed grasslands at the global scale with LPJmL 3.6, Geosci. Model Dev., 11, 429–451, https://doi.org/10.5194/gmd-11-429-2018, 2018. a
Rosenzweig, C., Jones, J. W., Hatfield, J. L., Ruane, A. C., Boote, K. J., Thorburn, P., Antle, J. M., Nelson, G. C., Porter, C., Janssen, S., Asseng, S., Basso, B., Ewert, F., Wallach, D., Baigorria, G., and Winter, J. M.: The agricultural model intercomparison and improvement project (AgMIP): protocols and pilot studies, Agr. Forest. Meteorol., 170, 166–182, https://doi.org/10.1016/j.agrformet.2012.09.011, 2013. a
Saxton, K., Rawls, W., Romberger, J., and Papendick, R.: Estimating generalized soil-water characteristics from texture, Soil Sci. Soc. Am. J., 50, 1031–1036, https://doi.org/10.2136/sssaj1986.03615995005000040039x, 1986. a
Saxton, K. E. and Rawls, W. J.: Soil Water Characteristic Estimates by Texture and Organic Matter for Hydrologic Solutions, Soil Sci. Soc. Am. J., 70, 1569–1577, https://doi.org/10.2136/sssaj2005.0117, 2006. a
Schaphoff, S., von Bloh, W., Rammig, A., Thonicke, K., Biemans, H., Forkel, M., Gerten, D., Heinke, J., Jägermeyr, J., Knauer, J., Langerwisch, F., Lucht, W., Müller, C., Rolinski, S., and Waha, K.: LPJmL4 – a dynamic global vegetation model with managed land – Part 1: Model description, Geosci. Model Dev., 11, 1343–1375, https://doi.org/10.5194/gmd-11-1343-2018, 2018. a, b
Schlüter, S., Großmann, C., Diel, J., Wu, G.-M., Tischer, S., Deubel, A., and Rücknagel, J.: Long-term effects of conventional and reduced tillage on soil structure, soil ecological and soil hydraulic properties, Geoderma, 332, 10–19, https://doi.org/10.1016/j.geoderma.2018.07.001, 2018. a
Smith, J. and Smith, P.: Environmental modelling: an introduction, Oxford University Press, Oxford, 2007. a
Smith, K.: Changing views of nitrous oxide emissions from agricultural soil: key controlling processes and assessment at different spatial scales, Eur. J. Soil Sci., 68, 137–155, https://doi.org/10.1111/ejss.12409, 2017. a
Snyder, C. S., Bruulsema, T. W., Jensen, T. L., and Fixen, P. E.: Review of greenhouse gas emissions from crop production systems and fertilizer management effects, Agr. Ecosyst. Environ., 133, 247–266, https://doi.org/10.1016/j.agee.2009.04.021, 2009. a
Van Kessel, C., Venterea, R., Six, J., Adviento-Borbe, M. A., Linquist, B., and van Groenigen, K. J.: Climate, duration, and N placement determine N2O emissions in reduced tillage systems: a meta-analysis, Global Change Biol., 19, 33–44, https://doi.org/10.1111/j.1365-2486.2012.02779.x, 2013. a, b, c
Van Looy, K., Bouma, J., Herbst, M., Koestel, J., Minasny, B., Mishra, U., Montzka, C., Nemes, A., Pachepsky, Y. A., Padarian, J., Schaap, M. G., Tóth, B., Verhoef, A., Vanderborght, J., van der Ploeg, M. J., Weihermüller, L., Zacharias, S., Zhang, Y., and Vereecken, H.: Pedotransfer functions in Earth system science: Challenges and perspectives, Rev. Geophys., 55, 1199–1256, https://doi.org/10.1002/2017RG000581, 2017. a
Venterea, R. T., Maharjan, B., and Dolan, M. S.: Fertilizer source and tillage effects on yield-scaled nitrous oxide emissions in a corn cropping system, J. Environ. Qual., 40, 1521–1531, https://doi.org/10.2134/jeq2011.0039, 2011. a
Von Bloh, W., Schaphoff, S., Müller, C., Rolinski, S., Waha, K., and Zaehle, S.: Implementing the nitrogen cycle into the dynamic global vegetation, hydrology, and crop growth model LPJmL (version 5.0), Geosci. Model Dev., 11, 2789–2812, https://doi.org/10.5194/gmd-11-2789-2018, 2018. a, b, c, d, e
Waha, K., Van Bussel, L., Müller, C., and Bondeau, A.: Climate-driven simulation of global crop sowing dates, Global Ecol. Biogeogr., 21, 247–259, https://doi.org/10.1111/j.1466-8238.2011.00678.x, 2012. a, b
Yang, Q., Zhang, X., Abraha, M., Del Grosso, S., Robertson, G., and Chen, J.: Enhancing the soil and water assessment tool model for simulating N2O emissions of three agricultural systems, Ecosyst. Health Sustain., 3, e01259, https://doi.org/10.1002/ehs2.1259, 2017. a, b
Yoo, J., Woo, S.-H., Park, K.-D., and Chung, K.-Y.: Effect of no-tillage and conventional tillage practices on the nitrous oxide (N2O) emissions in an upland soil: soil N2O emission as affected by the fertilizer applications, Appl. Biol. Chem., 59, 787–797, https://doi.org/10.1007/s13765-016-0226-z, 2016. a