the Creative Commons Attribution 4.0 License.
the Creative Commons Attribution 4.0 License.
 | 28 Aug 2019
Snowfall distribution and its response to the Arctic Oscillation: an evaluation of HighResMIP models in the Arctic using CPR/CloudSat observations
Abhay Devasthale
Tristan L'Ecuyer
Shiyu Wang
Torben Koenigk
Klaus Wyser
A realistic representation of snowfall in general circulation models (GCMs) of global climate is important to accurately simulate snow cover, surface albedo, high-latitude precipitation and thus the surface radiation budget. Hence, in this study, we evaluate snowfall in a range of climate models run at two different resolutions by comparing to the latest estimates of snowfall from the CloudSat Cloud Profiling Radar over the northern latitudes. We also evaluate whether the finer-resolution versions of the GCMs simulate the accumulated snowfall better than their coarse-resolution counterparts. As the Arctic Oscillation (AO) is the prominent mode of natural variability in the polar latitudes, the snowfall variability associated with the different phases of the AO is examined in both models and in our observational reference. We report that the statistical distributions of snowfall differ considerably between the models and CloudSat observations. While CloudSat shows an exponential distribution of snowfall, the models show a Gaussian distribution that is heavily positively skewed. As a result, the 10th and 50th percentiles, representing the light and median snowfall, are overestimated by up to factors of 3 and 1.5, respectively, in the models investigated here. The overestimations are strongest during the winter months compared to autumn and spring. The extreme snowfall represented by the 90th percentiles, on the other hand, is positively skewed, underestimating the snowfall estimates by up to a factor of 2 in the models in winter compared to the CloudSat estimates. Though some regional improvements can be seen with increased spatial resolution within a particular model, it is not easy to identify a specific pattern that holds across all models. The characteristic snowfall variability associated with the positive phase of AO over Greenland Sea and central Eurasian Arctic is well captured by the models.
- Article
(1305 KB) - Full-text XML
-
Supplement
(533 KB) - BibTeX
- EndNote


Snowfall is one of the key geophysical variables in the Earth system. From the climate perspective, snowfall regulates the surface albedo and air–surface interactions, thus playing a key role in the radiation budget over the high-latitude regions. Up to 80–90 % of incoming shortwave solar radiation is reflected by snow-covered surfaces during winter (Geiger, 1957; Barry, 1996). At the same time, snow cover acts as an excellent thermal insulator (Mellor, 1964; Sturm et al., 1997) in winter when the radiation balance is dominated by longwave radiation losses to space. Loss of highly reflective Arctic snow/ice surfaces would create more dark land or ocean surfaces and hence enhance surface warming by increasing the absorption of solar radiation. Snowfall is also the dominant form of precipitation in the polar regions and an important component of the hydrological cycle in the high-latitude regions during the winter half year. Most recently, Li et al. (2019) argued that the greenhouse effect of the falling snow (longwave forcing) is an important process and can potentially help explain the underestimated rate of sea-ice decline in climate models.
From the weather perspective, snowfall is also a key variable of socio-economic dimension. For example, snowfall events have an impact on air and surface traffic and winter tourism. The lack of sufficient snowfall at ski resorts can have large economic costs. Lake-effect snowfall is another example that can have catastrophic impacts on resource planning and economic costs down to a district level, as large amounts of snow are deposited in a short time. Furthermore, heavy snowfall events are linked to health concerns, such as heart attacks, especially in the elderly and vulnerable population (Auger et al., 2017).
In light of these multiple effects of snowfall, a good quantitative understanding of snowfall amount and its intraseasonal and interannual variability is needed, not the least to address key scientific questions related to future changes in the Earth system. Recent studies indicate a decreasing trend in snow cover over the Arctic, later snow cover onset and earlier snow-free dates and decrease in snow cover duration (Liston and Hiemstra, 2011; Callaghan et al., 2011). Declining Arctic sea ice is linked to heavy snowfall events over the large parts of northern hemispheric continents during recent winters (Liu et al., 2012). Also, studies have shown that the Arctic Oscillation (AO), the main index of circulation in the Arctic, has been in a positive phase over the last two decades, thereby resulting in an increase in the winter precipitation in northern Eurasia and a decrease over southern Eurasia and northeast Canada (Givati and Rosenfeld, 2013; Qu et al., 2015; Gong et al., 2014). The changes in the Arctic climate system have further implications for the midlatitude weather systems, including snowfall (Cohen et al., 2014, 2018).
In order to grasp a better understanding of such key processes and, more importantly, to be able to predict future changes in snowfall and associated feedbacks, both reliable observations of snowfall and high-fidelity global climate models are needed. Direct observations of snowfall have been very difficult in the past. Most precipitation observations are available on land. Gridded snowfall observations over the polar and oceanic regions are lacking. As a result, the snowfall variability and trends are often studied based on the reanalysis datasets and models that determine snowfall from climatology of temperature and precipitation (Roesch, 2006; Krasting et al., 2013). In contrast to the snowfall amount, snow cover observations are available from a number of passive satellite sensors with better spatiotemporal coverage (Bokhorst et al., 2016).
With the launch of active Cloud Profiling Radar (CPR) aboard NASA's CloudSat satellite in 2006, realistic estimates of global snowfall amounts are possible. Kulie et al. (2016) provided a first near-global survey of snowfall from shallow cumulus systems during CPR/CloudSat retrievals. Most recently, Palerme et al. (2017) evaluated how well the prominent global reanalysis datasets represent snowfall over Antarctica. With a record spanning more than a decade, CPR/CloudSat provides an unprecedented opportunity to statistically evaluate snowfall in global climate models.
The lack of snowfall observations in the past has meant that the snowfall processes in global models are not likely to be represented with high fidelity. Indeed, over the greater Alpine region, Terzzago et al. (2017) have shown considerable differences between snowfall observations and model simulations from the latest-generation regional and global climate models (RCMs, GCMs) participating in the Coordinated Regional Climate Downscaling Experiment over the European domain (EURO-CORDEX) and in the fifth phase of the Coupled Model Intercomparison Project (CMIP5) (Jacob et al., 2014; Taylor et al., 2012).
The atmosphere–ocean coupled climate models from CMIP5 indicate a snowfall redistribution in the Northern Hemisphere in future climate scenarios (Krasting et al., 2013). As greenhouse gases and surface temperature increases in the Arctic are expected to continue for a few more decades, studying snowfall–climate interactions becomes even more important. However, the first step in this direction is to evaluate the fidelity of climate models in simulating spatiotemporal distribution of snowfall using observations. Such detailed evaluation of GCMs likely to participate in the next Intergovernmental Panel on Climate Change (IPCC) assessments, using the latest CloudSat observations, over the northern high latitudes, including the Arctic, is currently lacking. Hence, the main aim of this study is to evaluate the HighResMIP (High Resolution Model Intercomparison Project) simulations for CMIP6 (Haarsma et al., 2016) under the PRIMAVERA (PRocess-based climate sIMulation: AdVances in high resolution modelling and European climate Risk Assessment) project. This project is a European Union H2020 project, wherein a total of seven state-of-the-art models are run at varying resolutions to understand the impact of resolution on different global climate processes. In this context, in the present study, we address the following questions. (1) How well do the GCMs used in the framework of the EU PRIMAVERA project simulate the northern high-latitude snowfall? (2) Does increasing the spatial resolution improve the snowfall representation in these models? (3) Do the models simulate the snowfall variability associated with the different phases of Arctic Oscillation (AO) realistically?
2.1 Models participating in the PRIMAVERA project
The snowfall from four HighResMIP models at different resolutions is evaluated against observations. Table 1 gives a brief description of the models that were used in this study. All models that are evaluated here are atmosphere-only models that are forced with the Hadley Centre Sea Ice and Sea Surface Temperature dataset (HadISST2.2) (Kennedy et al., 2017) and sea-ice concentrations and are run at two different horizontal resolutions. Since the focus is on northern high latitudes (beyond 50∘ N latitude), the models can be classified clearly into high (Hi-res) and low/coarse (Lo-res) setups with high-/low-resolution setups having a resolution below/above 35 km. The model simulations cover the satellite period from 1980 to 2015. The background aerosol climatology varies from model to model. The anthropogenic aerosol forcing is generated by the MACv2-SP method (Stevens et al., 2017), wherein the aerosol forcing is calculated based on the aerosol optical properties and fractional change in cloud droplet number concentrations. External forcing follows the HighResMIP protocol described in Haarsma et al. (2016). The state-of-the-art climate models feature prognostic microphysics schemes with several species of condensed water, typically liquid and ice cloud water, rain, snow and possibly also graupel. All processes related to water clouds – cloud condensation nuclei (CCN) activation, autoconversion and accretion – are relatively well known and also well represented in climate models. Ice processes, on the other hand, are far less explored and the parameterizations for ice nuclei activation or aggregation of ice crystals into snowflakes are only crude approximations to the complex real processes. Thus, the snowfall produced in the models is substantially less validated against observations and therefore still rather uncertain.
Williams et al. (2017)Williams et al. (2017)Haarsma et al. (2019)Haarsma et al. (2019)Stevens et al. (2013)Stevens et al. (2013)Roberts et al. (2018)Roberts et al. (2018)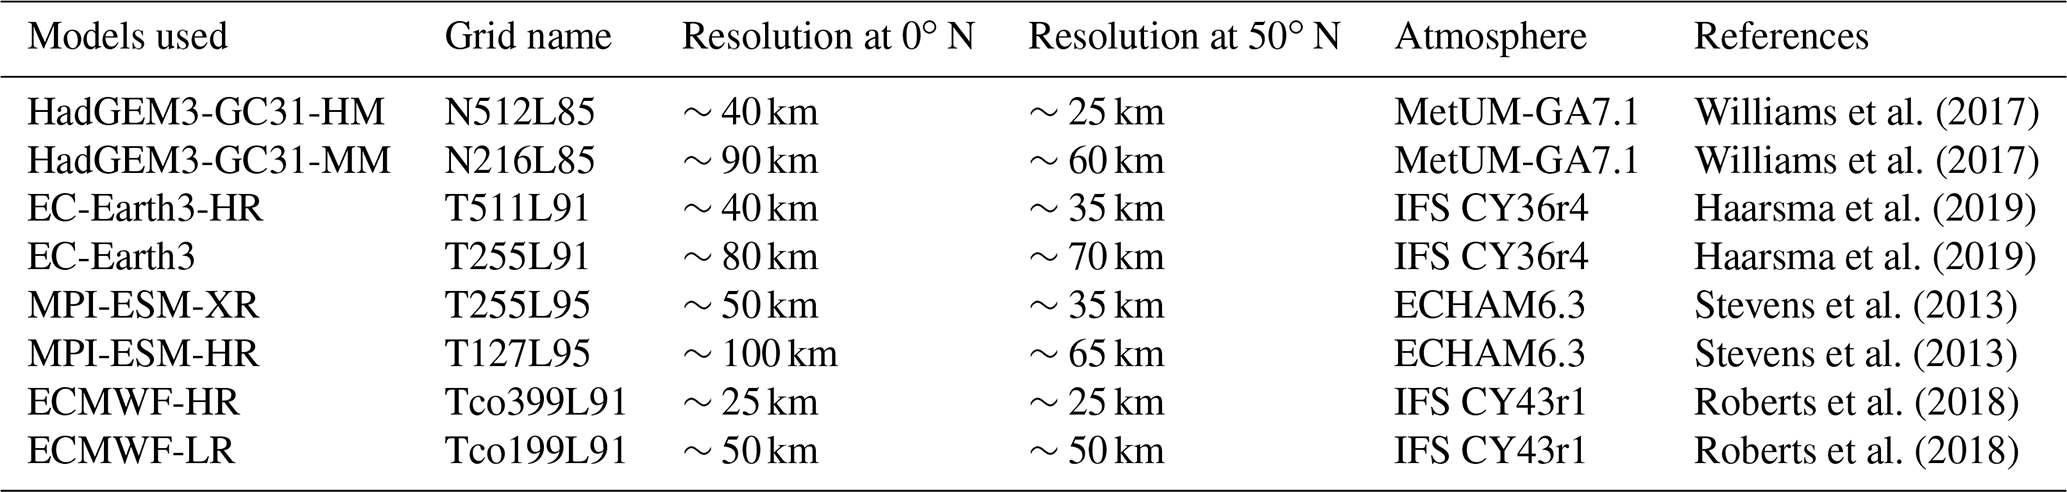
2.2 CloudSat snowfall retrievals
Launched in June 2006, nearly a decade-long record of snowfall estimates is derived from the active CPR (94 GHz) aboard NASA's CloudSat satellite. While primarily designed for studying the cloud vertical structure, CPR/CloudSat has proved immensely useful in providing precipitation estimates globally (cf. Stephens et al., 2018 for an overview). The radar has an intrinsic vertical resolution of 485 m, but measurements are oversampled to yield profiles at an effective vertical resolution of 239 m. CloudSat observes falling snow between 82∘ N and 82∘ S latitude along a ground track with a repeat cycle of 16 d (Kulie et al., 2016; McIlhattan et al., 2017). Due to its Sun-synchronous orbital configuration, the sampling is better at high-latitude regions (especially around 70∘ N), thus providing the first near-global estimates of snowfall (Kulie et al., 2016; Hiley et al., 2011; Kulie and Bennartz, 2009). In the present study, the 2C-SNOW-PROFILE product (version 5.0) that gives the snowfall accumulation in mm month−1 from 2006 to 2016 is used for evaluations (Wood, 2011; Wood et al., 2013). CloudSat observations are not available from May to October in 2011 due to a battery failure. There were two other brief anomalies due to battery failures in December 2009 and January 2011; however, neither lasted the whole month, so we still have data for those months for the analysis.
Uncertainties in the CloudSat snowfall estimates derive from numerous sources including the need to assume an exponential particle size distribution with temperature-dependent number concentration, the lack of explicit information about particle density, potential influences of attenuation from supercooled liquid water and the blind zone induced by ground clutter contamination in the four lowest CPR range bins that extends to 1 km above the surface (Hiley et al., 2011; Kulie and Bennartz, 2009). The impacts of these uncertainties have been assessed through numerous prior studies that compare CloudSat snowfall estimates to ground-based radar, in situ accumulation measurements, and seasonal and continental-scale accumulation estimates from reanalyses. While each source of snowfall information used in these studies has its own strengths and weaknesses precluding absolute error estimates from being derived, these studies generally suggest that the CloudSat snowfall product performs well over midlatitude and high-latitude regions. Comparisons against ground-based radar networks in the United States and Sweden, for example, suggest that CloudSat reproduces snowfall frequency and accumulation to within 25 % of ground-based radar over the range of scenes where the latter provide these measurements (Smalley et al., 2014; Norin et al., 2015, 2017). Palerme et al. (2014, 2017) further demonstrate that on continental scales, CloudSat reproduces seasonal snowfall accumulations in the ECMWF ERA-Interim reanalyses with high fidelity. While ERA-Interim regional snowfall accumulations suffer from model uncertainties, the integrated accumulation over Antarctica ultimately represents the net water vapor convergence over the ice sheet. Since the reanalyses routinely assimilate water vapor from satellite observations, this integrated accumulation is well constrained by independent satellite observations and provides a strong constraint on the net snowfall over the ice sheet. This result is further supported by Boening et al. (2012), who show remarkable consistency between estimates of recent Antarctic snowfall variability derived from reanalyses and CloudSat and completely independent ice sheet mass estimates from the Gravity Recovery and Climate Explorer (GRACE) satellite.
Nevertheless, a number of recent studies have pointed out the inherent limitations in the CloudSat observations that must be acknowledged when considering the results that follow. For example, due to contamination from ground clutter, CloudSat snowfall estimates must be extrapolated from 1 km above the surface (Smalley et al., 2014). This has implications for the snowfall estimates in those regions in the Arctic where low-level supercooled liquid clouds or diamond dust that precipitate very light snow are observed (Lemonnier and Wood, 2019). The snowfall from these systems could be either underestimated or missed entirely by CloudSat (Bennartz et al., 2019), although a recent study by Maahn et al. (2014) showed that a fraction of this underestimation may be offset by snow virga that CloudSat also fails to represent below 1 km. It is beyond the scope of the current study to add to the existing body of literature concerning the evaluation of CloudSat snowfall estimates but additional discussion of the strengths and limitations of the dataset can be found in Panegrossi et al. (2017) and Milani et al. (2018).
Another important limitation associated with the CloudSat snowfall observations is the limited spatial sampling provided by the nadir-sampling CPR. This is somewhat mitigated at high latitudes where sampling is greatly increased over lower latitudes, in particular if data are regridded to coarser resolution.
2.3 Methodology
The models output snowfall as snowfall flux (kg m−2 s−1). This monthly flux is converted into snowfall rate in mm month−1 using standard density of water. For the analysis, the model output is regridded to a grid. However, in the case of the observations, CloudSat has poor sampling (as mentioned in Sect. 2.2) along the latitudes as the spacing between the longitudes in the Arctic is very low. Hence, so as to avoid patchiness, CloudSat data are accumulated over a 3∘ longitude and 1∘ latitude grid and averaged over the seasons. This would still provide a sufficient number of samples to compute robust statistics. The following subsections describe the methodology adopted in this study to evaluate the model-derived snowfall against observations.
2.3.1 Analysis of snowfall percentiles
The seasonality in monthly accumulated snowfall amounts over the Arctic (north of 50∘ N) is evaluated in the model simulations against CloudSat retrievals. In this study, the results are presented for the autumn (September–October–November), winter (December–January–February) and spring (March–April–May) seasons separately. Since the snowfall distribution is often skewed, we evaluated percentile thresholds rather than averages to properly take into account the spread in the snowfall distribution. Three percentile thresholds, p10, p50 and p90, are used. The evaluation of p10 and p90 provides information on how the light and extreme snowfall events are captured by models, respectively, and p50 corresponds to the median snowfall. Since the CloudSat observations span the latest 10-year period from 2006 to 2016, a similar 10-year period from 2005 to 2014 is chosen from the model simulations.
2.3.2 AO analysis
The AO is the most dominant mode of natural atmospheric variability in the Arctic (Thompson and Wallace, 1998, 2000). For the observational reference, AO index from the NOAA web page (https://www.ncdc.noaa.gov/teleconnections/ao/) is chosen. Since the CloudSat data span only 10 years, the snowfall accumulation associated with all the positive and negative AO cases is considered. The model-simulated AO index (Thompson and Wallace, 1998) is defined as the first leading mode of empirical orthogonal function (EOF) analysis of monthly sea-level pressure anomalies poleward of 20∘ N latitude. The extended time period from 1980–2014 is used here to compute the AO index so as to disregard the internal/interannual variability arising from other sources.
Statistical evaluations using CloudSat retrievals
Figures 1–3, respectively, show the p10, p50 and p90 percentiles in snowfall from CloudSat (first row) and from the Hi-res models (rows 2–5). The three columns show the comparison for three seasons. The snowfall estimates from the Lo-res models are shown in Figs. S1–S3 in the Supplement. To establish that there is a sufficient number of snowfall events to calculate the statistics, the total number of snowing pixels available at the original CloudSat grid, accumulated for each season studied here from 2006 to 2014, and the monthly time series of the number of snowing pixels accumulated over the three selected regions shown in Fig. 5 are presented in Fig. S4. It can be seen that the monthly averages during the SON, DJF and MAM months are not represented by just a few strong events, and there are more than 2000 snowing pixels, depending on the region and the season.
The models simulate the spatial distribution of light snowfall (Fig. 1) reasonably well over southern Greenland, the Eurasian Arctic and northwestern Pacific during the winter months (DJF). However, p10 thresholds are up to a factor of 3 higher in the majority of the Hi-res models compared to the CloudSat observations over these regions, suggesting heavy overestimation of moderate snowfall and a strong negative skewness in the snowfall distribution in the models compared to the CloudSat observations. Here, it needs to be noted that CloudSat misses or underestimates the light snowfall below 1000 m due to contamination from ground clutter as explained in Sect. 2.2. This means that when analyzing the percentiles, the p10 in CloudSat could further shift to the lower values if we take into account these light snowfall events. This could result in an even larger difference between models and satellite retrievals. However, the knowledge about the frequency of occurrence of such events is lacking, as we do not have sufficient observations covering the Arctic.
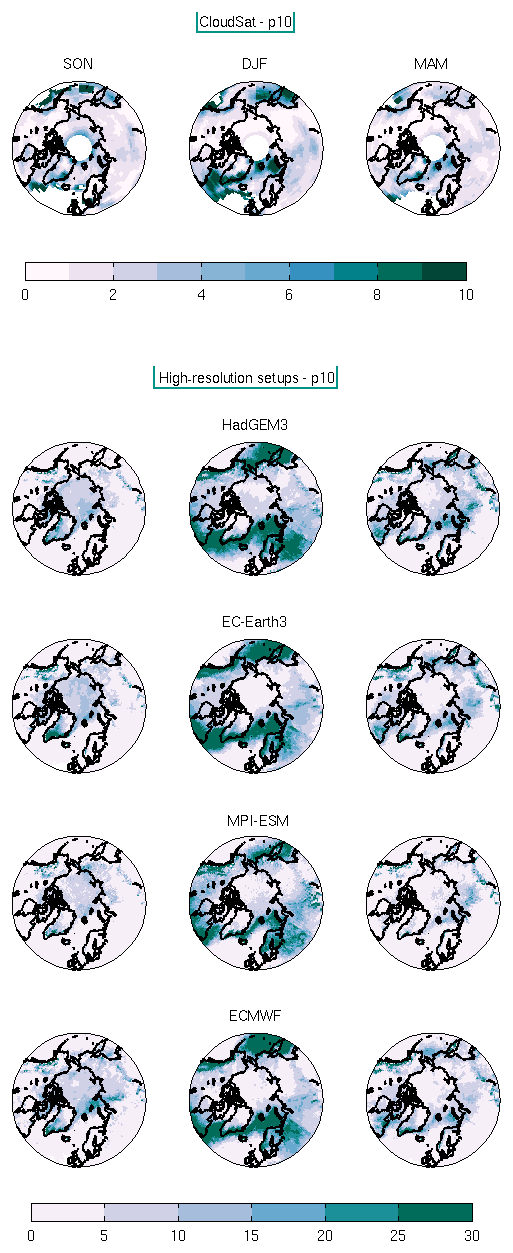
Figure 1The 10th percentile thresholds of monthly snowfall accumulations (mm month−1) for the SON, DJF and MAM months in the three columns, respectively. The top row shows the CloudSat observations and the other four rows below show snowfall from the Hi-res setups of HadGEM3, EC-Earth3, MPI-ESM and ECMWF, respectively.
Among the Hi-res models, MPI-ESM captures the light snowfall over these regions reasonably well. Excessive light snowfall is simulated over eastern Europe and Russia in winter compared to the observations. The Hi-res models, in general, tend to overestimate light snowfall in those high orographic regions such as along the Rocky and Ural mountain ranges and also at the border between the West Siberian Plain and the central Siberian upland during winter, which is not observed in the CloudSat retrievals. During autumn and spring months, a similar tendency is seen, but the models simulate the light snowfall well over Eurasia. The 10th percentiles lie around 5–10 mm month−1 in the Hi-res models, whereas this threshold is around 2–4 mm month−1 in the observations during these months. The southward extent of light snowfall that is observed in CloudSat, particularly over Europe/western Eurasia and over northern North America, is not simulated by the models. Irrespective of the season, the models strongly underestimate the light snowfall over the Gulf of Alaska.
The spatial distribution of median snowfall (Fig. 2) is represented well by the models, including over the mountainous regions in all the seasons. The regridding applied to the CloudSat snowfall data to obtain sufficient samples and to increase the robustness of the results has smoothed out such specifics to a certain extent compared to the Hi-res simulations. The increase of snowfall over the regions of high orography is still evident during the winter months. Here, too, the snowfall distribution in the models is negatively skewed compared to the observations, with the median snowfall overestimated by up to a factor of 1.5 in the Hi-res model setups in winter. The median snowfall lies around 40–50 mm month−1 in the heavy snowfall regions in the observations such as over southern Greenland and over the Andes mountain range, whereas in the models this lies above 60 mm month−1. The models simulate the snowfall reasonably well during autumn and spring months both spatially and in magnitude; however, it has to be noted that the median snowfall in the models does not extend as far as 50∘ N as it does in the observations.

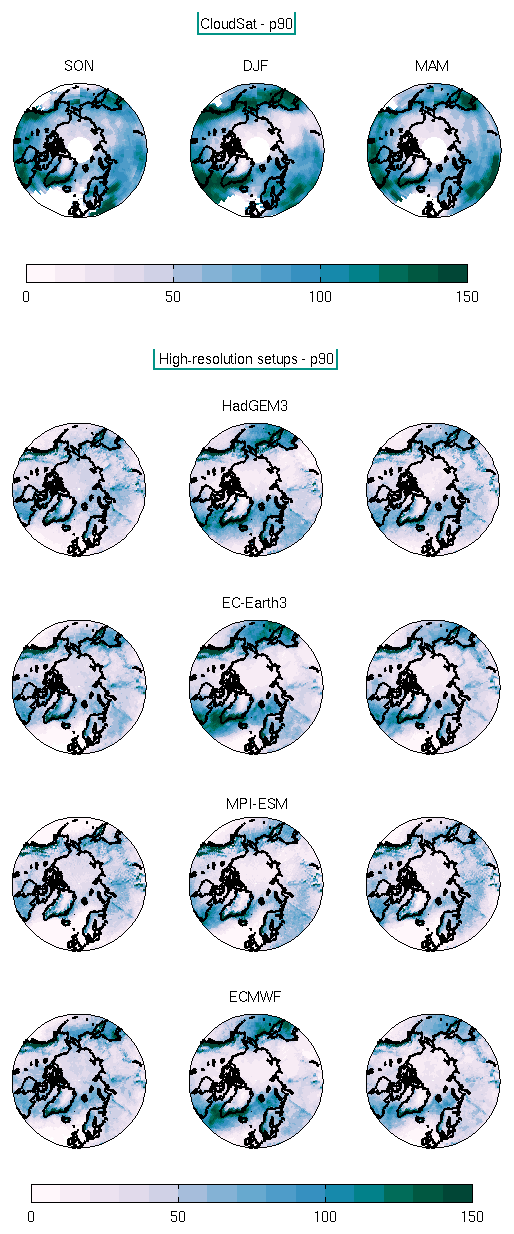
The accumulated extreme snowfall amounts, expressed as the 90th percentile, are shown in Fig. 3 from observations and Hi-res model setups. In this case, an opposite picture to that seen in the light and median snowfall is evident. Here, the models do not capture the spatial distribution of extreme snowfall, particularly, in autumn and spring months. The snowfall amount is markedly underestimated in all the seasons by all the models. In winter, though the models simulate the regions of heavy snowfall realistically over southern Greenland, over the western Pacific, they underestimate the magnitude by up to almost one-half compared to the observations. In this case, the snowfall distributions simulated by the models are positively skewed, with the 90th percentile value lying between 100 and 150 mm month−1 in the CloudSat retrievals and between 50 and 100 mm month−1 in the Hi-res model simulations.
These results are consistent with the study by Kay et al. (2018) applying a CloudSat simulator to the Community Earth System Model (CESM version 1) to evaluate the precipitation globally. Fully coupled simulations also showed similar tendencies, such as excessive light snow and inadequate heavy snowfall amounts, as atmospheric-only simulations over midlatitudes and high latitudes. This means that the main biases are from the atmospheric model due to the simplified parameterizations used in the representation of the complex ice processes.
As discussed in the previous section, the Hi-res model setups tend to overestimate light snowfall and underestimate extreme snowfall amounts more strongly in winter compared to the other months. To understand if increasing the spatial resolution would impact the snowfall distribution, the difference between the Hi-res model setups and their standard-resolution (Std-res) counterparts is analyzed and shown in Fig. 4 for the winter months. In this section, we focus on three main regions, namely, the north Pacific, Eurasian Arctic Ocean and south of Greenland. Columns 1–3 denote the three percentiles, p10, p50 and p90, respectively.
Over the northeast Pacific, the Hi-res setup of ECMWF overestimates light snowfall (i.e., 10th percentiles) by around 10–15 mm, whereas the Hi-res HadGEM3 model underestimates this compared to its Std-res counterpart. This means that the Hi-res setup of the HadGEM3 model reduces the positive bias, whereas the Std-res setup of the ECMWF model reduces the positive bias over this region. The Hi-res ECMWF and EC-Earth model versions overestimate the light snowfall amounts over Norwegian and Greenland seas. Light snowfall is overestimated in the Hi-res HadGEM3 model over the south of Greenland, whereas this is underestimated in EC-Earth and ECMWF models. Light snowfall is underestimated in the Hi-res ECMWF model along the east coast of Greenland. A change in resolution does not impact the simulation of light snowfall in the MPI-ESM model over these regions.
No notable change in the simulation of median snowfall (i.e., 50th percentiles) with change in resolution is seen in all the three models over the north Pacific, except HadGEM3, wherein a strong underestimation is seen in its Hi-res version. There is a marginal overestimation in the Barents Sea by the Hi-res EC-Earth model and an underestimation south of Greenland. A very patchy picture is seen in the median snowfall differences between the Hi-res and the Std-res setup of MPI-ESM, where no clear conclusions can be drawn. Over southern Greenland, the Hi-res setup of HadGEM3 overestimates the snowfall amount, whereas an opposite sign is seen in the EC-Earth model.
As explained in the previous section, the Hi-res setups of all the models used in this study underestimate the extreme snowfall (90th percentiles) by more than 50 %. Striking changes can be seen in the all the models with increasing resolution in this case. The Hi-res setups of HadGEM3, EC-Earth and ECMWF models overestimate the extreme snowfall over the Norwegian, Barents and Greenland seas compared to their low-resolution counterparts. This means that the Hi-res setup of these models improves the simulation of extreme snowfall in these regions. Similarly, an improvement can be seen around the Bering Strait in HadGEM3 and ECMWF models. The differences are patchy in the MPI-ESM model.
It was previously reported that the impact of using a higher model resolution is more profound when going from a coarser than 1∘ to about 50 km grid resolution but only has relatively small changes for further resolution increases to 10–20 km (Jung et al., 2012) in the simulation of extratropical cyclone characteristics. In this study, the high-latitude model resolutions vary from 50–60 to ∼25 km. Therefore, it is not surprising that only marginal changes are found. However, it needs to be noted that the resolution impact for single snowfall events on smaller temporal scales might differ from the monthly accumulated snowfalls.
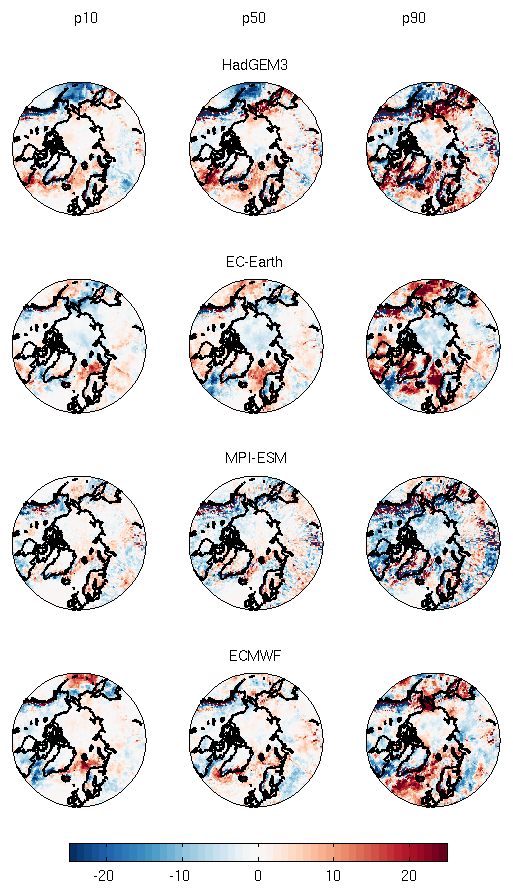
Figure 4The differences between Hi-res and Std-res model-simulated snowfall (Hi-res minus Std-res) for the DJF months for the 10th (left column), 50th (center) and 90th percentiles (right column).
To analyze the interannual variability in snowfall, four regions are selected: three as shown in Fig. 5 and the Arctic region north of 70∘ N. The selection is based on Figs. 1 to 3. These regions show high snowfall variability. Regions 1 to 3 are southern Greenland, the Eurasian Arctic Ocean and northwest Pacific, respectively. The time series of average snowfall in mm month−1 is presented in Fig. 6 for these three regions for the period 2005–2015. CloudSat observations are not available from May to October in 2011 due to a battery failure. The ensemble mean of monthly accumulated snowfall amounts from the Hi-res models and Std-res models are presented as the red and green curves and the CloudSat retrievals as the blue curve. Over southern Greenland, the northwest Pacific and Arctic, the simulated snowfall is overestimated, irrespective of the model resolution. Similar overestimation in snowfall is also simulated in the CMIP5 models over Antarctica (Palerme et al., 2017). The models seem to agree well with the observations over the Eurasian Arctic ocean. It can be noted that the wintertime seasonality in snowfall is more prolonged in the models, irrespective of the region, compared to the CloudSat observations. Simulation of snowfall is almost insensitive to the change in resolution over these regions.
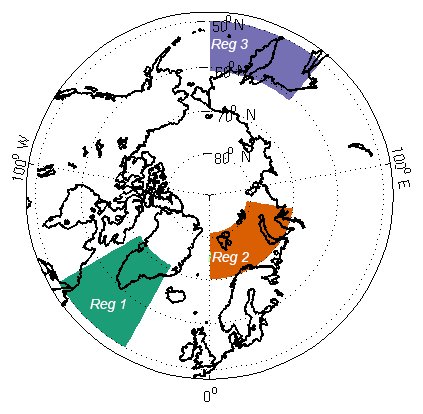
Figure 5Regions selected for this study. Reg1: southern Greenland; Reg2: Eurasian Arctic Ocean; and Reg3: northwest Pacific.
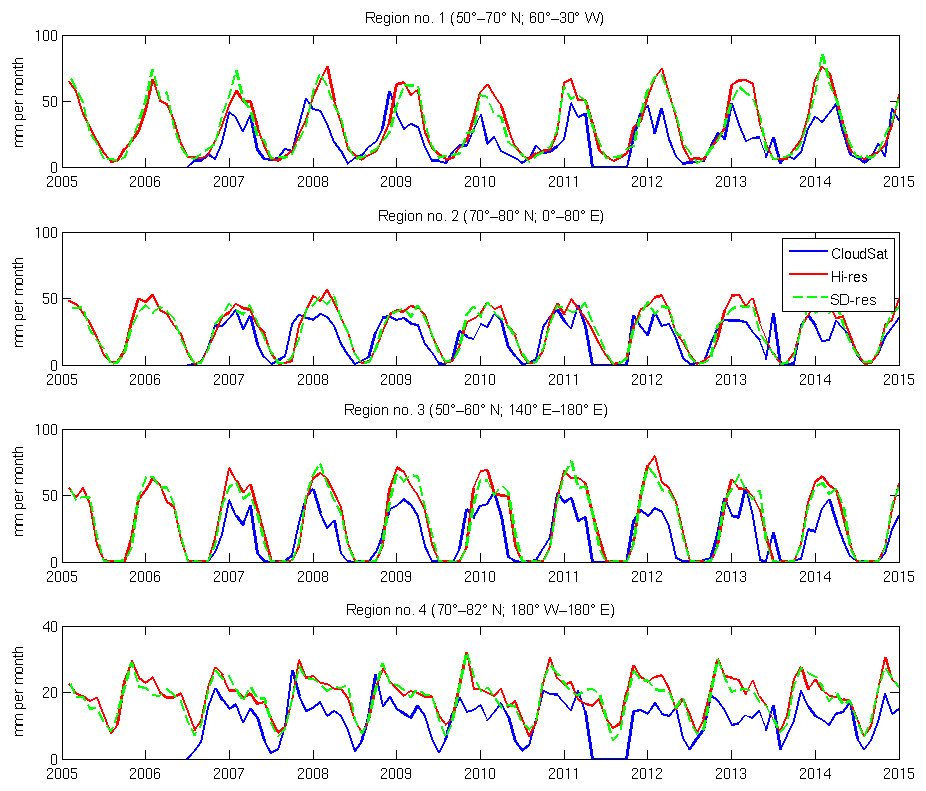
Figure 6Time series of snowfall (mm month−1) for the period 2005–2015 from CloudSat (blue line), Hi-res ensemble model mean (red) and Std-res ensemble model mean (green) over the three regions shown in Fig. 5 and over the whole Arctic.
The observed differences between the models and CloudSat observations can be best explained by investigating the statistical distribution of snowfall accumulation over the selected regions. Figure 7 shows this comparison of these distributions. In addition to the selected three regions, the snowfall distribution covering nearly the entire Arctic (70–82∘ N, 180∘ W–180∘ E; denoted as R4) is also shown. It is evident that the snowfall follows an exponential distribution, while all models show a Gaussian distribution that is heavily positively skewed. The light snowfall amounts are strongly underrepresented in the models. The right-hand tail of the distribution in CPR/CloudSat derived snowfall is much longer compared to the models. It is also interesting to note that the distributions have different shapes over the three selected areas, both in the models and observations, suggesting the importance of evaluating the distributions regionally.

Figure 7Statistical distribution of snowfall accumulation (mm month−1) over the three regions (R1–R3) shown in Fig. 5 and R4: over the entire Arctic (70–82∘ N) from Hi-res models and CloudSat observations. The vertical lines denote the p10 and p90 percentiles.
To summarize the model evaluation in a more quantitative manner and to add another dimension to the evaluation, the standard deviations, root mean squared differences and Pearson correlation coefficients are presented in Fig. 8 as a Taylor diagram using the entire time series for the three regions shown in Fig. 5 and as well as for the Arctic region (70–83∘N, 180∘ W–180∘ E, denoted as Reg4). The color-filled circles show results for the high-resolution versions and the empty circles their standard resolution counterparts. The correlations typically range between 0.6 and 0.8 irrespective of the region. Over all the regions and in the models, the snowfall variability is higher compared to the CloudSat observations. The regional differences among models are strong. For example, over Reg1, the standard deviations have large spread among models, while over Reg3 the models tend to cluster together (except MPI-ESM versions which are closest to the observations) and have similar variability. The comparison of standard resolution model versions with their high-resolution counterparts against CloudSat observations does not show a clear improvement in the high-resolution versions or a particular tendency that holds across all models.
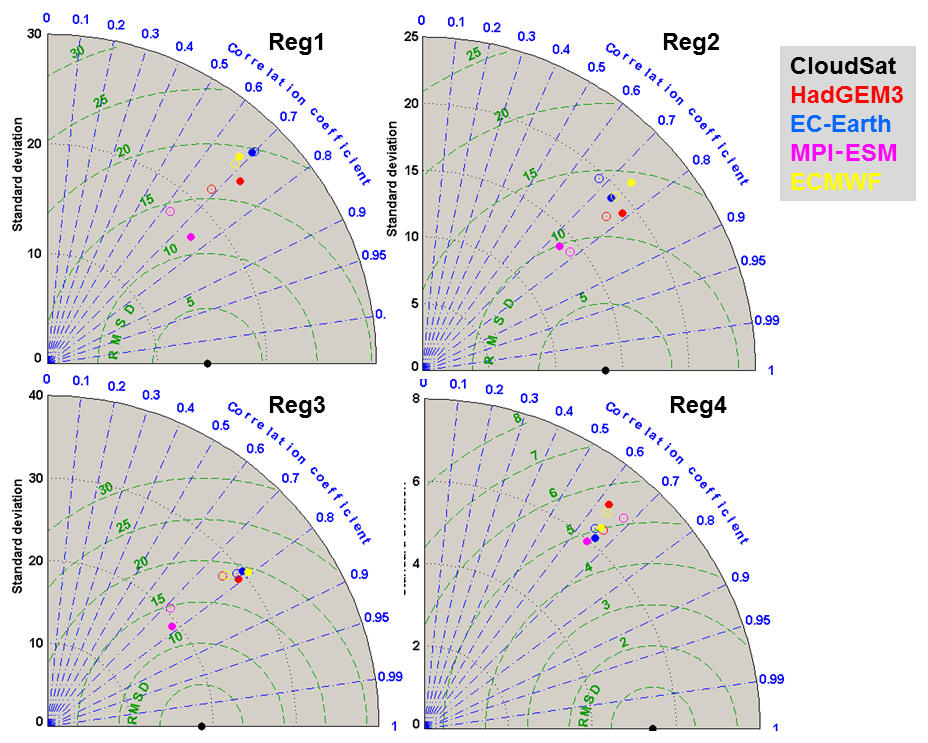
Figure 8Taylor diagram of snowfall accumulation over the four regions from both Hi-res and Std-res models with respect to CloudSat observations. The empty circles denote the Std-res version of the models and the filled circles denote their Hi-res counterparts.
AO determines the degree to which the Arctic air penetrates into the midlatitudes, and vice versa. The phases of the AO determine the interannual precipitation variability not only in the Arctic but also over Eurasia and North America (Bamzai, 2003). Considering the importance of wintertime snowfall variability associated with the AO in the Arctic climate system, we evaluated how well the models in question are able to capture the changes in the snowfall associated with the positive and negative phases of winter AO (DJF).
Figure 9 shows the snowfall response to the AO in terms of the differences in snowfall amounts between the positive and negative phases of the AO. The top row shows this response in the CloudSat observations. The other rows show the same for the Hi-res and Std-res setups. During the positive phases, the cyclonic systems penetrate deeper northward into the Greenland Sea and central Eurasian Arctic, leading to increased snowfall over these regions. In these cases, the snowfall is reduced over southern Greenland (Appenzeller et al., 1998). This characteristic snowfall response to the AO is captured well in the CloudSat observations. All models, however, show a consistence increase in the oceanic snowfall from the northern North Atlantic to the northernmost parts of the Greenland Sea. Irrespective of the models or model resolutions, the observed decrease in snowfall over southern Greenland is not simulated. This is due to the fact that the North Atlantic storm tracks during the positive phase of AO are either too zonal or shifted more southward in the climate models resulting in weaker cyclonic systems over the Greenland and Norwegian seas and stronger systems over continental Europe (Zappa et al., 2013). The Hi-res versions of the EC-EARTH and ECMWF models show even a stronger snowfall response to the AO over the oceanic regions around Greenland compared to their Std-res counterparts. The opposite tendency is observed in the case of HadGEM and MPI-ESM models over the same region. The CloudSat observations further show increased snowfall over continental regions covering the Ural Mountains and West Siberian Plain. All models also show this increase, albeit to a varying degree. In the Pacific sector of the Arctic, CloudSat observations do not show any clear, robust snowfall response to the AO. The simulated snowfall responses in the Hi-Res and Std-res setups of EC-Earth are strikingly different from one another in this sector.

Figure 9Difference between positive and negative phases of AO (AOP-AON) in snowfall accumulation (mm month−1) from CloudSat (top row) and models (rows 2–5). The Hi-res setups are on the left and their Std-res counterparts are on the right.
The ice processes and their parameterizations in the climate models, especially snowfall, are not adequately evaluated using observations. Given the importance of snowfall both from the climate and weather perspectives and the recent availability of snowfall estimates from CloudSat, we carried out a detailed comparison from a wide range of climate models at two horizontal resolutions each with satellite observations, with a focus over the Arctic. The following conclusions can be drawn from the comparisons.
The statistical distribution of snowfall is narrower in the GCMs compared to the CloudSat observations. In the case of light snowfall (10th percentiles), all high-resolution versions of the GCMs that are investigated here simulate the spatial distribution of light snowfall realistically. However, the 10th percentiles are overestimated by a factor of up to 3 in all the GCMs compared to the CloudSat observations. The Hi-res model setups overestimate light snowfall over the mountainous regions such as along the Rockies and Ural Mountains compared to their Std-res counterparts. The median snowfall represented by 50th percentiles is also up to a factor of 1.5 high in the models. The median snowfall lies around 40–50 mm month−1 in those heavy snowfall regions such as over southern Greenland and over the Andes in the observations, whereas these percentiles lie above 60 mm month−1 in the models. While the extreme snowfall accumulation (90th percentiles) is simulated better by the models, it is, in contrast to light and median snowfall, underestimated compared to the CloudSat observations.
The main reason behind the observed differences in the 10th, 50th and 90th percentiles of monthly snowfall accumulation is the fact that the CloudSat and models have different statistical distributions. The observed snowfall distribution follows an exponential distribution over the Arctic (north of 50∘ N), while all models follow a Gaussian distribution that is strongly positively skewed. This indicates that the light drizzle in the models is not adequately sensitive to the triggering/initiation and sustenance processes. On the other side of the statistical distribution, the models often remove cloud water quicker than expected in the heavy precipitation scenario, thus not allowing the building up of extreme snowfall as observed by CloudSat.
The wintertime seasonality in snowfall is more prolonged in the models compared to the CloudSat observations. The overestimation in model-simulated snowfall in the p10 and p50 percentiles is strongest during the DJF months. This indicates that the hydrometeor phase partitioning in the models is probably not realistic, in that the supercooled cloud liquid water and light liquid drizzle are underrepresented. This has implications for the local radiation budget, as the dynamical and radiative impacts of having prolonged wintertime snowfall at the expense of adequate liquid precipitation can be quite different.
Apart from the traditional statistical comparisons summarized above, we further investigated the snowfall response during the Arctic Oscillation. Such process-oriented evaluation provides an additional insight into how the models simulate a process that is a key for representing the dominant natural variability over this region. The characteristic snowfall variability during the AO, with increased snowfall over Greenland Sea and central Eurasian Arctic and reduced snowfall over southern Greenland and continental Europe, is captured well in CloudSat despite the short time period of the observations. The models simulate the increased snowfall in the above-mentioned regions realistically at varying magnitudes, but the snowfall reduction over southern Greenland is not simulated by any of the models.
Finally, since one of the main aims of the PRIMAVERA project is to examine the importance of having high spatial resolution, here, the high-resolution model simulations are contrasted against their standard-resolution counterparts. Although some regional improvements are seen in the snowfall estimates with a change in atmospheric resolution within a particular model, these improvements are minor and it is not easy to single out a particular pattern or systematic behavior that holds across all high-resolution models. This indicates that representing physical processes accurately in models is more important than purely improving spatial resolution, although both go hand in hand to a certain extent.
In a cautionary note, it should be acknowledged here that, although 10 years of snowfall estimates are now available from CPR/CloudSat, this time period is still shorter considering that the natural/internal variability can occur on multi-decadal timescales. It is therefore not expected that the models simulate all regional features realistically compared to CloudSat observations. CloudSat nonetheless provides the most reliable estimates of snowfall to date globally, and hence such evaluation provides insight into how well models can simulate snowfall to a first order.
Access to the model output data used in this study will be available through the European Research Council Horizon 2020 PRIMAVERA project (https://www.primavera-h2020.eu/modelling/, last access: 21 June 2019). More information regarding model configurations and data availability are available from the authors upon request. All CloudSat data used here are freely available through the CloudSat Data Processing Center and at the time of writing can be accessed online at http://www.cloudsat.cira.colostate.edu (last access: 19 March 2019). The MATLAB and CDO scripts used in this intercomparison are available from the lead author upon request.
The supplement related to this article is available online at: https://doi.org/10.5194/gmd-12-3759-2019-supplement.
The first author performed the analysis and drafted the manuscript. TL'E provided the snowfall estimates from CloudSat. All the co-authors contributed to the interpretation of the results and review of the manuscript.
The authors declare that they have no conflict of interest.
This study was financially supported by PRIMAVERA (PRocess-based climate sIMulation: AdVances in high resolution modelling and European climate Risk Assessment), a Horizon 2020 project funded by the European Commission. We thank the two anonymous referees and the editor, Alexander Robel, for providing constructive suggestions in improving the manuscript.
This research has been supported by the Horizon 2020 Framework Programme, H2020 European Research Council (PRIMAVERA (grant no. 641727)).
This paper was edited by Alexander Robel and reviewed by two anonymous referees.
Appenzeller, C., Stocker, T. F., and Anklin, M.: North Atlantic Oscillation dynamics recorded in Greenland ice cores, Science, 282, 446–449, 1998. a
Auger, N., Potter, B. J., Smargiassi, A., Bilodeau-Bertrand, M., Paris, C., and Kosatsky, T.: Association between quantity and duration of snowfall and risk of myocardial infarction, CMAJ, 189, 235–242, https://doi.org/10.1503/cmaj.161064, 2017. a
Bamzai, A. S.: Relationship between snow cover variability and Arctic Oscillation on a hierarchy of time scales, Int. J. Climatol., 23, 131–143, 2003. a
Barry, R. G.: The parameterization of surface albedo for sea ice and its snow cover, Progress in Physical Geography: Earth and Environment, 20, 63–79, https://doi.org/10.1177/030913339602000104, 1996. a
Bennartz, R., Fell, F., Pettersen, C., Shupe, M. D., and Schuettemeyer, D.: Spatial and temporal variability of snowfall over Greenland from CloudSat observations, Atmos. Chem. Phys., 19, 8101–8121, https://doi.org/10.5194/acp-19-8101-2019, 2019. a
Boening, C., Lebsock, M., Landerer, F., and Stephens, G.: Snowfall driven mass change on the East Antarctic Ice Sheet, Geophys. Res. Lett., 39, L21501, https://doi.org/10.1029/2012GL053316, 2012. a
Bokhorst, S., Pedersen, S. H., Brucker, L., Anisimov, O., Bjerke, J. W., Brown, R. D., Ehrich, D., Essery, R. L. H., Heilig, A., Ingvander, S., Johansson, C., Johansson, M., Jónsdóttir, I. S., Inga, N., Luojus, K., Macelloni, G., Mariash, H., McLennan, D., Rosqvist, G. N., Sato, A., Savela, H., Schneebeli, M., Sokolov, A., Sokratov, S. A., Terzago, S., Vikhamar-Schuler, D., Williamson, S., Qiu, Y., and Callaghan, T. V.: Changing Arctic snow cover: A review of recent developments and assessment of future needs for observations, modelling and impacts, Ambio, 45, 516–537, https://doi.org/10.1007/s13280-016-0770-0, 2016. a
Callaghan, T., Johansson, M., Brown, R., Groisman, P., Labba, N., Radionov, V., Barry, R., Bulygina, O., Essery, R., Frolov, D., Golubev, V., Grenfell, T., Petrushina, M., Razuvaev, V., Robinson, D., Romanov, P., Shindell, D., Shmakin, A., Sokratov, S., Warren, S., and Yang, D.: The changing face of Arctic snow cover: A synthesis of observed and projected changes, Ambio, 40, 17–31, https://doi.org/10.1007/s13280-011-0212-y, 2011. a
Cohen, J., Screen, J. A., Furtado, J. C., Barlow, M., Whittleston, D., Coumou, D., Francis, J., Dethloff, K., Entekhabi, D., Overland, J., and Jones, J.: Recent Arctic amplification and extreme mid-latitude weather, Nat. GeoSci., 7, 627–637, 2014. a
Cohen, J., Pfeiffer, K., and Francis, J. A.: Warm Arctic episodes linked with increased frequency of extreme winter weather in the United States, Nat. Commun., 9, 869, https://doi.org/10.1038/s41467-018-02992-9, 2018. a
Geiger, R.: The Climate near the ground, Harvard Univ. Press, Cambridge, MA, USA, 1957. a
Givati, A. and Rosenfeld, D.: The Arctic Oscillation, climate change and the effects on precipitation in Israel, Atmos. Res., 132–133, 114–124, https://doi.org/10.1016/j.atmosres.2013.05.001, 2013. a
Gong, D. Y., Gao, Y. Q., Guo, D., Mao, R., Yang, J., Hu, M., and Gao, M. N.: Interannual linkage between Arctic/North Atlantic oscillation and tropical Indian Ocean precipitation during boreal winter, Clim. Dynam., 42, 1007–1027, 2014. a
Haarsma, R. J., Roberts, M. J., Vidale, P. L., Senior, C. A., Bellucci, A., Bao, Q., Chang, P., Corti, S., Fučkar, N. S., Guemas, V., von Hardenberg, J., Hazeleger, W., Kodama, C., Koenigk, T., Leung, L. R., Lu, J., Luo, J.-J., Mao, J., Mizielinski, M. S., Mizuta, R., Nobre, P., Satoh, M., Scoccimarro, E., Semmler, T., Small, J., and von Storch, J.-S.: High Resolution Model Intercomparison Project (HighResMIP v1.0) for CMIP6, Geosci. Model Dev., 9, 4185–4208, https://doi.org/10.5194/gmd-9-4185-2016, 2016. a, b
Haarsma, R., le Sager, P., van den Oord, G., Bakhshi, R., van Noye, T., van Weele, M., von Hardenberg, J., Davini, P., Corti, S., Acosta, M., Bretonnière, P.-A., Caron, L.-P., Castrillo, M., Exarchou, E., Ruprich-Robert, Y., Tourigny, E., Wyser, K., Koenigk, T., and Fladrich, U.: PRIMAVERA versions of EC-Earth: EC-Earth3P and EC-Earth3P-HR. Description, model performance, data handling and validation, Geosci. Model Dev. Discuss., in preparation, 2019. a, b
Hiley, M. J., Kulie, M. S., and Bennartz, R.: Uncertainty analysis for CloudSat snowfall retrievals, J. Appl. Meteorol. Clim., 50, 399–418, https://doi.org/10.1175/2010JAMC2505.1, 2011. a, b
Jacob, D., Petersen, J., Eggert, B., Alias, A., Christensen, O. B., Bouwer, L. M., Braun, A., Colette, A., Déqué, M., Georgievski, G., Georgopoulou, E., Gobiet, A., Menut, L., Nikulin, G., Haensler, A., Hempelmann, N., Jones, C., Keuler, K., Kovats, S., Kröner, N., Kotlarski, S., Kriegsmann, A., Martin, E., van Meijgaard, E., Moseley, C., Pfeifer, S., Preuschmann, S., Radermacher, C., Radtke, K., Rechid, D., Rounsevell, M., Samuelsson, P., Somot, S., Soussana, J.-F., Teichmann, C., Valentini, R., Vautard, R., Weber, B., and Yiou, P.: EURO-CORDEX: new high-resolution climate change projections for European impact research, Reg. Environ. Change, 14, 563–578, 2014. a
Jung, T., Miller, M. J., Palmer, T. N., Towers, P., Wedi, N., Achuthavarier, D., Adams, J. M., Altshuler, E. L., Cash III, B. A., J. L. K., Marx, L., Stan, C., and Hodges, K. I.: High-Resolution Global Climate Simulations with the ECMWF Model in Project Athena: Experimental design, model climate, and seasonal forecast skill, J. Climate, 25, 3155–3172, https://doi.org/10.1175/JCLI-D-11-00265.1, 2012. a
Kay, J. E., L'Ecuyer, T., Pendergrass, A., Chepfer, H., Guzman, R., and Yettella, V.: Scale-aware and definition-aware evaluation of modeled near-surface precipitation frequency using CloudSat observations, J. Geophys. Res., 123, 4294–4309, https://doi.org/10.1002/2017JD028213, 2018. a
Kennedy, J., Titchner, H., Rayner, N., and Roberts, M.: input4MIPs.MOHC.SSTs and SeaIce.HighResMIP.MOHC-HadISST-2-2-0-0-0, Version 20170505, Earth System Grid Federation, https://doi.org/10.22033/ESGF/input4MIPs.1221, 2017. a
Krasting, J. P., Broccoli, A. J., Dixon, K. W., and Lanzante, J. R.: Future changes in Northern Hemisphere snowfall, J. Climate, 26, 7813–7828, https://doi.org/10.1175/JCLI-D-12-00832.1, 2013. a, b
Kulie, M. S. and Bennartz, R.: Utilizing spaceborne radars to retrieve dry snowfall, J. Appl. Meteorol. Clim., 48, 2564–2580, https://doi.org/10.1175/2009JAMC2193.1, 2009. a, b
Kulie, M. S., Milani, L., Wood, N. B., Tushaus, S. A., Bennartz, R., and L'Ecuyer, T. S.: A Shallow cumuliform snowfall census using spaceborne radar, J. Hydrometeorol., 17, 1261–1279, https://doi.org/10.1175/JHM-D-15-0123.1, 2016. a, b, c
Lemonnier, F., Madeleine, J.-B., Claud, C., Genthon, C., Durán-Alarcón, C., Palerme, C., Berne, A., Souverijns, N., van Lipzig, N., Gorodetskaya, I. V., L'Ecuyer, T., and Wood, N.: Evaluation of CloudSat snowfall rate profiles by a comparison with in situ micro-rain radar observations in East Antarctica, The Cryosphere, 13, 943–954, https://doi.org/10.5194/tc-13-943-2019, 2019. a
Li, J.-L. F., Richardson, M., Lee, W.-L., Fetzer, E., Stephens, G., Jiang, J., Hong, Y., Wang, Y.-H., Yu, J.-Y., and Liu, Y.: Potential faster Arctic sea ice retreat triggered by snowflakes' greenhouse effect, The Cryosphere, 13, 969–980, https://doi.org/10.5194/tc-13-969-2019, 2019. a
Liston, G. E. and Hiemstra, C. A.: The Changing Cryosphere: Pan-Arctic Snow Trends (1979–2009), J. Climate, 24, 5691–5712, https://doi.org/10.1175/JCLI-D-11-00081.1, 2011. a
Liu, J., Curry, J. A., Wang, H., Song, M., and Horton, R. M.: Impact of declining Arctic sea ice on winter snowfall, P. Natl. Acad. Sci. USA, 109, 4074–4079, https://doi.org/10.1073/pnas.1114910109, 2012. a
Maahn, M., Burgard, C., Crewell, S., Gorodetskaya, I. V., Kneifel, S., Lhermitte, S., Van Tricht, K., and van Lipzig, N. P.: How does the spaceborne radar blind zone affect derived surface snowfall statistics in polar regions?, J. Geophys. Res.-Atmos., 119, 13604–13620, https://doi.org/10.1002/2014JD022079, 2014. a
McIlhattan, E. A., L'Ecuyer, T. S., and Miller, N. B.: Observational evidence linking Arctic supercooled liquid cloud biases in CESM to snowfall processes, J. Climate, 30, 4477–4495, https://doi.org/10.1175/JCLI-D-16-0666.1, 2017. a
Mellor, M.: Properties of snow, Cold Regions Science and Engineering Monogr., No. III-A1, 57 pp., 1964. a
Milani, L., Kulie, M. S., Casella, D., Dietrich, S., L'Ecuyer, T. S., Panegrossia, G., Porcù, F., Sanò, P., and Wood, N. B.: CloudSat snowfall estimates over Antarctica and the Southern Ocean: An assessment of independent retrieval methodologies and multi-year snowfall analysis, Atmos. Res., 213, 121–135, 2018. a
Norin, L., Devasthale, A., L'Ecuyer, T. S., Wood, N. B., and Smalley, M.: Intercomparison of snowfall estimates derived from the CloudSat Cloud Profiling Radar and the ground-based weather radar network over Sweden, Atmos. Meas. Tech., 8, 5009–5021, https://doi.org/10.5194/amt-8-5009-2015, 2015. a
Norin, L., Devasthale, A., and L'Ecuyer, T. S.: The sensitivity of snowfall to weather states over Sweden, Atmos. Meas. Tech., 10, 3249–3263, https://doi.org/10.5194/amt-10-3249-2017, 2017. a
Palerme, C., Kay, J. E., Genthon, C., L'Ecuyer, T., Wood, N. B., and Claud, C.: How much snow falls on the Antarctic ice sheet?, The Cryosphere, 8, 1577–1587, https://doi.org/10.5194/tc-8-1577-2014, 2014. a
Palerme, C., Genthon, C., Claud, C., Kay, J. E., Wood, N. B., and L'Ecuyer, T.: Evaluation of current and projected Antarctic precipitation in CMIP5 models, Clim. Dynam., 48, 225–239, https://doi.org/10.1007/s00382-016-3071-1, 2017. a, b, c
Panegrossi, G., Rysman, J.-F., Casella, D., Marra, A. C., Sanò, P., and Kulie, M. S.: CloudSat-based assessment of GPM microwave imager snowfall observation capabilities, Remote Sens., 9, 1263, https://doi.org/10.3390/rs9121263, 2017. a
Qu, J. X., Gong, D. Y., and Li, S.: The possible influence of Arctic oscillation on South China Sea climate during boreal spring, Chinese Sci. Bull., 60, 2327–2337, https://doi.org/10.1360/N972015-00175, 2015. a
Roberts, C. D., Senan, R., Molteni, F., Boussetta, S., Mayer, M., and Keeley, S. P. E.: Climate model configurations of the ECMWF Integrated Forecasting System (ECMWF-IFS cycle 43r1) for HighResMIP, Geosci. Model Dev., 11, 3681–3712, https://doi.org/10.5194/gmd-11-3681-2018, 2018. a, b
Roesch, A.: Evaluation of surface albedo and snow cover in AR4 coupled climate models, J. Geophys. Res., 111, D15111, https://doi.org/10.1029/2005JD006473, 2006. a
Smalley, M., L'Ecuyer, T., Lebsock, M., and Haynes, J.: A comparison of precipitation occurrence from the NCEP Stage IV QPE product and the CloudSat Cloud Profiling Radar, J. Hydrometeorol., 15, 444–458, https://doi.org/10.1175/JHM-D-13-048.1, 2014. a, b
Stephens, G., Winker, D., Pelon, J., Trepte, C., Vane, D., Yuhas, C., L'Ecuyer, T., and Lebsock, M.: CloudSat and CALIPSO within the A-Train: Ten Years of actively observing the Earth system, B. Am. Meteorol. Soc., 99, 569–581, https://doi.org/10.1175/BAMS-D-16-0324.1, 2018. a
Stevens, B., Giorgetta, M., Esch, M., Mauritsen, T., Crueger, T., Rast, S., Salzmann, M., Schmidt, H., Bader, J., Block, K., Brokopf, R., Fast, I., Kinne, S., Kornblueh, L., Lohmann, U., Pincus, R., Reichler, T., and Roeckner, E.: Atmospheric component of the MPI-M Earth System Model: ECHAM6, J. Adv. Model. Earth Sy., 5, 146–172, 2013. a, b
Stevens, B., Fiedler, S., Kinne, S., Peters, K., Rast, S., Müsse, J., Smith, S. J., and Mauritsen, T.: MACv2-SP: a parameterization of anthropogenic aerosol optical properties and an associated Twomey effect for use in CMIP6, Geosci. Model Dev., 10, 433–452, https://doi.org/10.5194/gmd-10-433-2017, 2017. a
Sturm, M., Holmgren, J., König, M., and Morris, K.: The thermal conductivity of seasonal snow, J. Glaciol., 43, 26–41, 1997. a
Taylor, K. E., Stouffer, R. J., and Meehl, G. A.: An Overview of CMIP5 and the experiment design, B. Am. Meteorol. Soc., 93, 485–498, 2012. a
Terzago, S., von Hardenberg, J., Palazzi, E., and Provenzale, A.: Snow water equivalent in the Alps as seen by gridded data sets, CMIP5 and CORDEX climate models, The Cryosphere, 11, 1625–1645, https://doi.org/10.5194/tc-11-1625-2017, 2017. a
Thompson, D. W. J. and Wallace, J. M.: The Arctic Oscillation signature in the wintertime geopotential height and temperature fields, Geophys. Res. Lett., 25, 1297–1300, 1998. a, b
Thompson, D. W. J. and Wallace, J. M.: Annular modes in the extratropical circulation. Part I: Month-to-month variability, J. Climate, 13, 1000–1016, 2000. a
Williams, K. D., Copsey, D., Blockley, E. W., Bodas-Salcedo, A., Calvert, D., Comer, R., Davis, P., Graham, T., Hewitt, H. T., Hill, R., Hyder, P., Ineson, S., Johns, T. C., Keen, A. B., Lee, R. W., Megann, A., Milton, S. F., Rae, J. G. L., Roberts, M. J., Scaife, A. A., Schiemann, R., Storkey, D., Thorpe, L., Watterson, I. G., Walters, D. N., West, A., Wood, R. A., Woollings, T., and Xavier, P. K.: The Met Office Global Coupled Model 3.0 and 3.1 (GC3.0 and GC3.1) Configurations, J. Adv. Model. Earth Sy., 10, 357–380, https://doi.org/10.1002/2017MS001115, 2017. a, b
Wood, B. N.: Estimation of snow microphysical properties with application to millimeter-wavelength radar retrievals for snowfall rate, PhD thesis, Colorado State University, Fort Collins, CO, USA, available at: http://hdl.handle.net/10217/48170 (last access: 3 August 2015), 2011. a
Wood, K. R., Overland, J. E., Salo, S. A., Bond, N. A., Williams, W. J., and Dong, X.: Is there a “new normal” climate in the Beaufort Sea?, Polar Res., 32, 19552, https://doi.org/10.3402/polar.v32i0.19552, 2013. a
Zappa, G., Shaffrey, L. C., and Hodges, K. I.: The ability of CMIP5 models to simulate North Atlantic extratropical cyclones, J. Climate, 26, 5379–5396, https://doi.org/10.1175/JCLI-D-12-00501.1, 2013. a
- Abstract
- Introduction
- Models, observations and methodology
- Results
- The impact of higher spatial resolution
- Seasonality and interannual variability over selected regions
- Response of snowfall to the AO
- Conclusions
- Code and data availability
- Author contributions
- Competing interests
- Acknowledgements
- Financial support
- Review statement
- References
- Supplement