the Creative Commons Attribution 4.0 License.
the Creative Commons Attribution 4.0 License.
 | 12 Aug 2019
ORCHIDEE MICT-LEAK (r5459), a global model for the production, transport, and transformation of dissolved organic carbon from Arctic permafrost regions – Part 1: Rationale, model description, and simulation protocol
Simon P. K. Bowring
Ronny Lauerwald
Bertrand Guenet
Dan Zhu
Matthieu Guimberteau
Ardalan Tootchi
Agnès Ducharne
Philippe Ciais
Few Earth system models adequately represent the unique permafrost soil biogeochemistry and its respective processes; this significantly contributes to uncertainty in estimating their responses, and that of the planet at large, to warming. Likewise, the riverine component of what is known as the “boundless carbon cycle” is seldom recognised in Earth system modelling. The hydrological mobilisation of organic material from a ∼1330–1580 PgC carbon stock to the river network results in either sedimentary settling or atmospheric “evasion”, processes widely expected to increase with amplified Arctic climate warming. Here, the production, transport, and atmospheric release of dissolved organic carbon (DOC) from high-latitude permafrost soils into inland waters and the ocean are explicitly represented for the first time in the land surface component (ORCHIDEE) of a CMIP6 global climate model (Institut Pierre Simon Laplace – IPSL). The model, ORCHIDEE MICT-LEAK, which represents the merger of previously described ORCHIDEE versions MICT and LEAK, mechanistically represents (a) vegetation and soil physical processes for high-latitude snow, ice, and soil phenomena and (b) the cycling of DOC and CO2, including atmospheric evasion, along the terrestrial–aquatic continuum from soils through the river network to the coast at 0.5 to 2∘ resolution. This paper, the first in a two-part study, presents the rationale for including these processes in a high-latitude-specific land surface model, then describes the model with a focus on novel process implementations, followed by a summary of the model configuration and simulation protocol. The results of these simulation runs, conducted for the Lena River basin, are evaluated against observational data in the second part of this study.
- Article
(2970 KB) - Full-text XML
- BibTeX
- EndNote


High-latitude permafrost soils contain large stores of frozen, often ancient, and relatively reactive carbon up to depths of over 30 m. Soil warming caused by contemporary anthropogenic climate change can be expected to destabilise these stores (Schuur et al., 2015) via microbial or hydrological mobilisation following spring–summer thaw and riverine discharge (Vonk et al., 2015a) as the boundary between discontinuous and continuous permafrost migrates poleward and toward the continental interior over time. The high-latitude soil carbon reservoir may amount to ∼1330–1580 PgC (Hugelius et al., 2013, 2014; Tarnocai et al., 2009) – over double that stored in the contemporary atmosphere – while the yearly lateral flux of carbon from soils to running waters may amount to about a fifth of net ecosystem carbon exchange (∼400 TgC yr−1), about ∼40 % of which may be contributed by dissolved organic carbon (DOC; McGuire et al., 2009). Excluding the dissolved inorganic carbon and soil CO2 input components of the total riverine carbon flux, the vast majority (85 %) of riverine organic carbon transferred to the Arctic Ocean occurs as DOC, as described in (e.g.) Suzuki et al. (2006)
The fact that, to our knowledge, no existing land surface models are able to adequately simultaneously represent this unique high-latitude permafrost soil environment, the transformation of soil organic carbon (SOC) to its eroded particulate and DOC forms and their subsequent lateral transport, as well as the response of all these to warming, entails significant additional uncertainty in projecting global-scale biogeochemical responses to human-induced environmental change.
Fundamental to these efforts is the ability to predict the medium under which carbon transformation will occur – in the soil, streams, rivers, or sea – and under what metabolising conditions, since these will determine the process mix that will ultimately enable either terrestrial redeposition and retention, ocean transfer, or the atmospheric release of permafrost-derived organic carbon. In the permafrost context, this implies being able to accurately represent (i) the source, reactivity, and transformation of released organic matter; and (ii) the dynamic response of hydrological processes to warming, since water phase determines carbon, heat, and soil moisture availability for metabolisation and lateral transport.
For this purpose, we take a specific version of the terrestrial component of the Institut Pierre Simon Laplace (IPSL) global Earth system model (ESM) ORCHIDEE (Organising Carbon and Hydrology In Dynamic Ecosystems), one that is specifically coded for, calibrated with, and evaluated on high-latitude phenomena and permafrost processes, called ORCHIDEE-MICT (where MICT stands for aMeliorated Interactions between Carbon and Temperature; Guimberteau et al., 2018). This code is then adapted to include DOC production in the soil (ORCHIDEE-SOM; Camino-Serrano et al., 2018), the “priming” of SOC (ORCHIDEE-PRIM; Guenet et al., 2016, 2018), and the riverine transport of DOC and CO2, including in-stream transformations, carbon and water exchanges with wetland soils, and gaseous exchange between river surfaces and the atmosphere (ORCHILEAK; Lauerwald et al., 2017); the suffix “LEAK” is not an acronym but refers to the leakage of carbon from terrestrial to aquatic realms.
The resulting model, dubbed ORCHIDEE MICT-LEAK, hereafter referred to as MICT-L for brevity, is therefore able to represent (a) permafrost soil and snow physics, thermodynamics to a depth of 38 m, and dynamic soil hydrology to a depth of 2 m; (b) improved representation of biotic stress response to cold, heat, and moisture at high latitudes; (c) explicit representation of the active layer and frozen soil hydrologic barriers, as well as the buildup of soil carbon stocks via the primary production and vertical translocation (turbation) of SOC and DOC; (d) DOC leaching from tree canopies, atmospheric deposition, litter and soil organic matter, its adsorption–desorption to and from soil particles, its transport and transformation to dissolved CO2 (), and atmospheric release, as well as the production and hydrological transport of plant-root-zone-derived dissolved CO2; (e) improved representation of C cycling on floodplains; and (f) priming of organic matter in the soil column and subsequent decomposition dynamics. In combination, these model properties allow us to explore the possibility of reproducing important emergent phenomena observed in recent empirical studies (Fig. 1) arising from the interaction of a broad combination of different processes and factors.
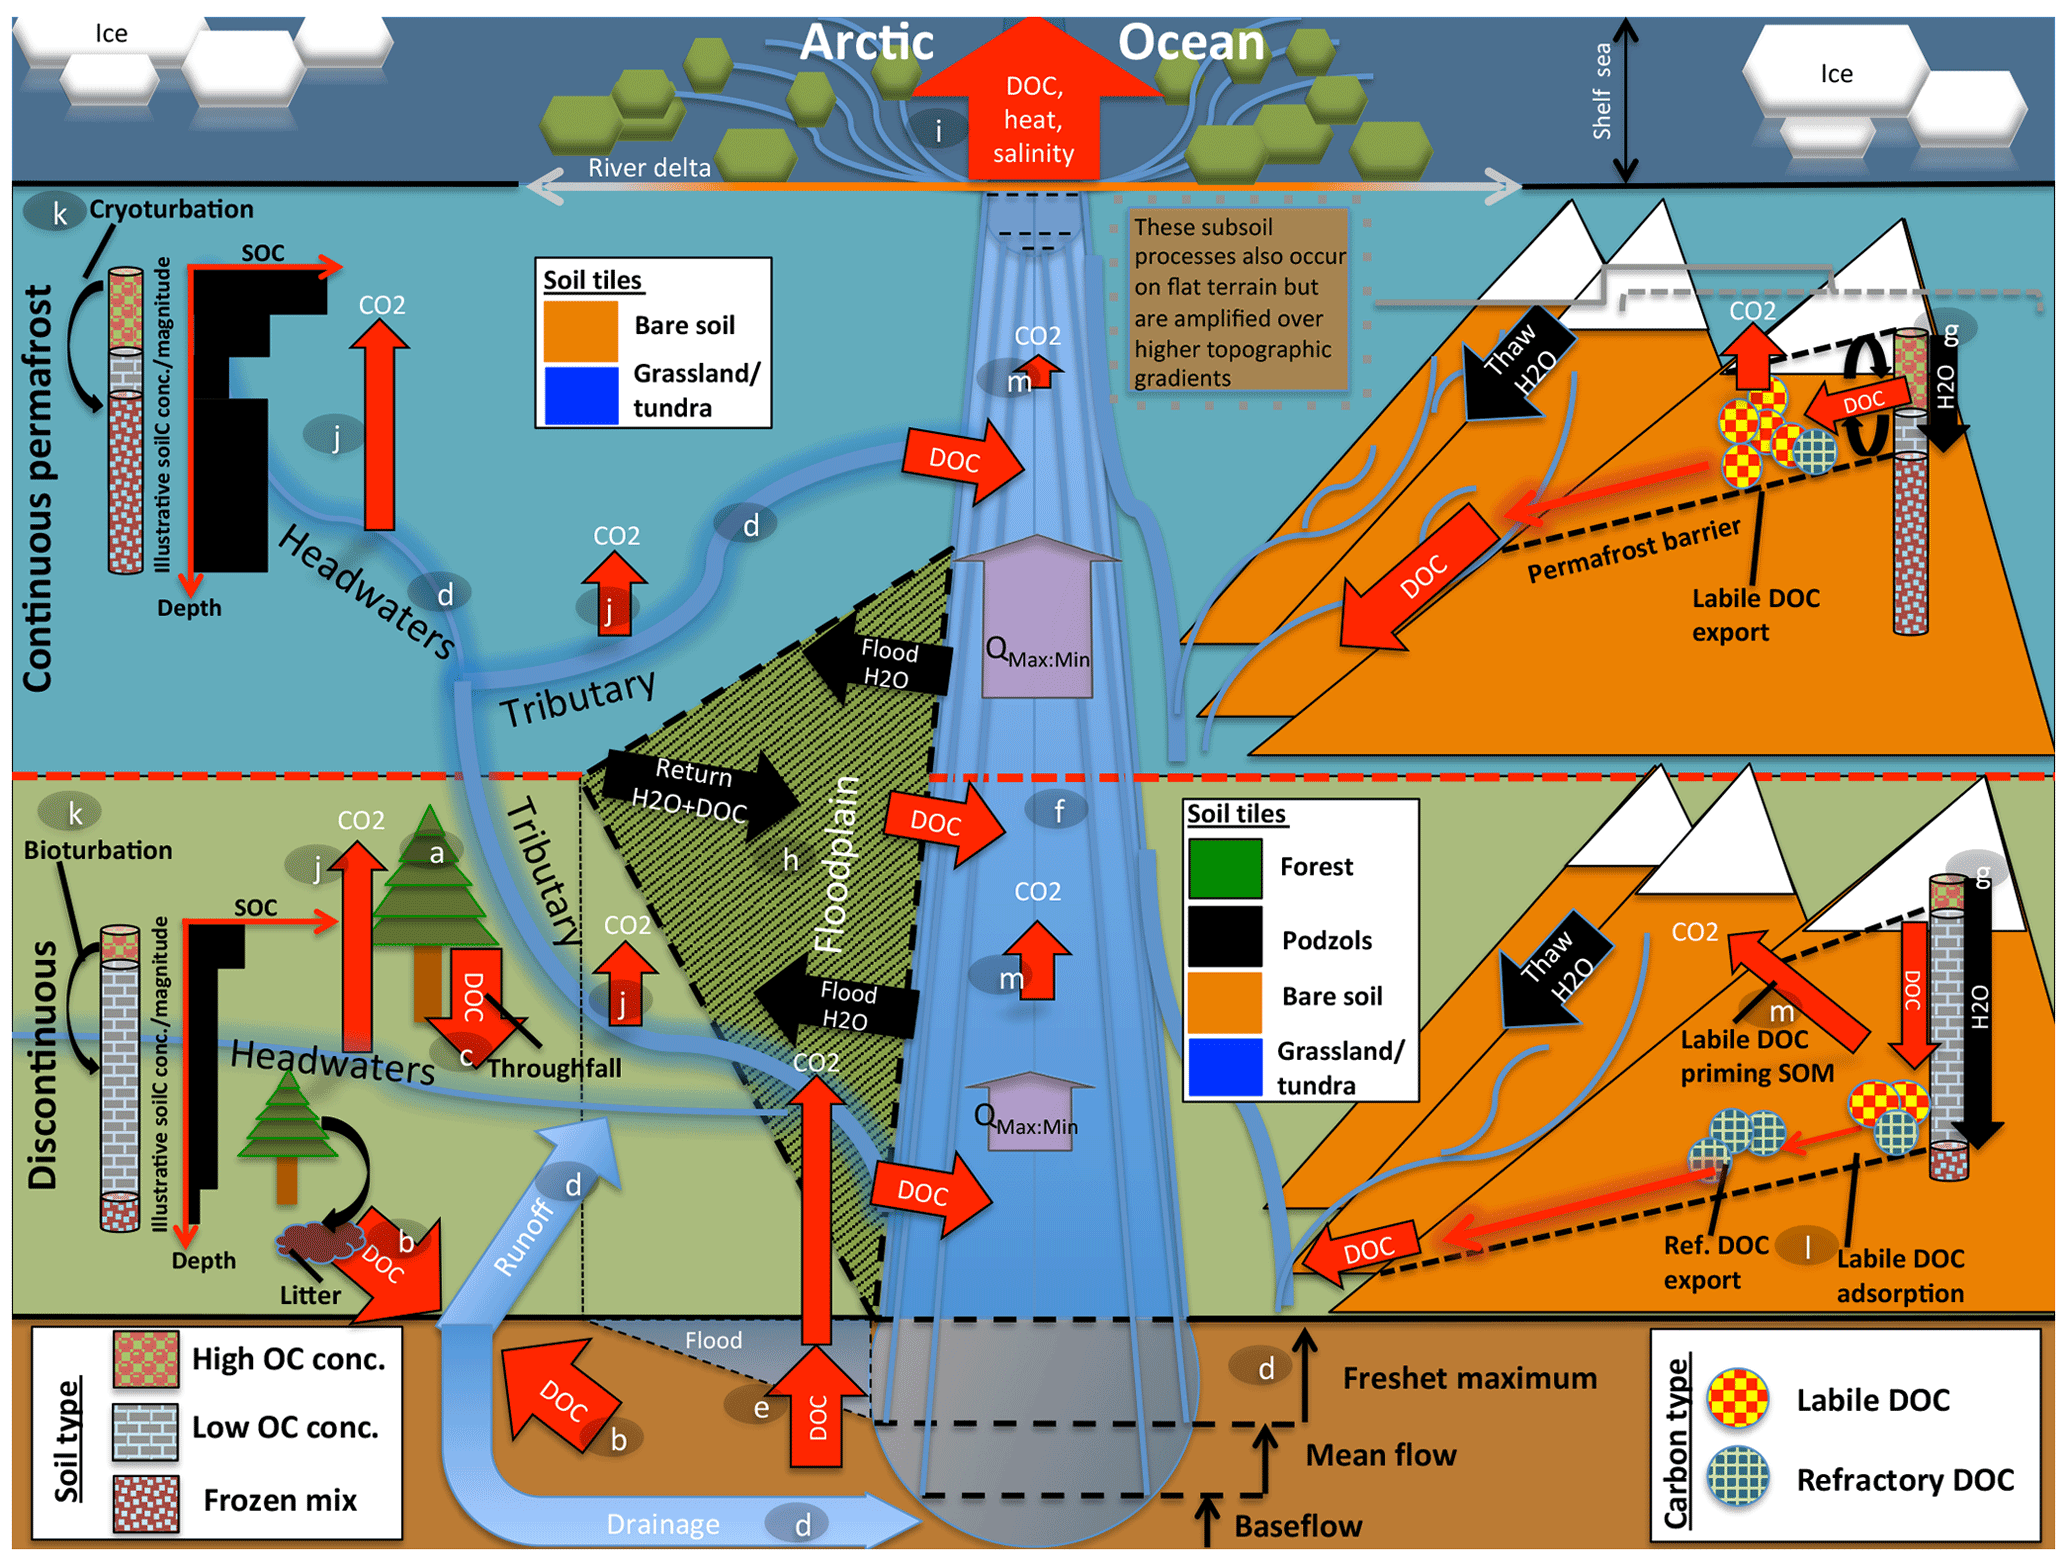
Figure 1Cartoon diagram illustrating the landscape-scale emergent phenomena observed in high-latitude river systems that are captured by the processes represented in this model. Here, the terrestrial area is shown in vertically ascending order as subsoil, discontinuous permafrost, continuous permafrost, and the maritime boundary. Note that tributaries in the figure may be represented in the model by either the “fast” or “stream” pool, depending on their size. Representative soil types, their distributions, and carbon concentrations are shown for the two permafrost zones, as are the different dynamics occurring on “flat” (left) and “sloping” land (right) arising from their permafrost designation. Carbon exports from one subsystem to another are shown in red. The relative strength of the same processes occurring in each permafrost band are indicated by relative arrow size. Note that the high CO2 evasion in headwaters versus tributaries versus main stem is shown here. Proposed and modelled mechanisms of soil carbon priming, adsorption, and rapid metabolisation are shown. The arrows QMax:Min refer to the ratio of maximum to minimum discharge at a given point in the river, which is the ratio indicating hydrologic volatility, the magnitude of which is influenced by permafrost coverage. Soil tiles, a model construct used for modulating soil permeability and implicit–explicit decomposition, are shown to indicate the potential differences in these dynamics for the relevant permafrost zones. Note that the marine shelf sea system, as shown in the uppermost rectangle, is not simulated in this model, although our outputs can be coupled for that purpose. Letters mark the processes of carbon flux in permafrost regions that are implicitly or explicitly included in the model and can be referred to in subsections of the Methods text. These refer to (a) biomass generation, (b) DOC generation and leaching, (c) throughfall and its DOC, (d) hydrological mobilisation of soil DOC, (e) soil flooding, (f) landscape routing of water and carbon, (g) infiltration and topography, (h) floodplain representation, (i) oceanic outflow, (j) dissolved carbon export and riverine atmospheric evasion, (k) turbation and soil carbon with depth (e.g. Hugelius et al., 2013; Tarnocai et al., 2009; Koven et al., 2015), (l) adsorption, and (m) priming.
To our knowledge very few attempts have been made at the global scale to model DOC production and lateral transfer from the permafrost region that explicitly accounts for such a broad range of high-latitude-specific processes, which in turn allows us to match and evaluate simulation outputs with specific observed processes, enhancing our ability to interpret the output from theses models and improve our understanding of the processes represented. The only other attempt at doing so is a pan-Arctic modelling study by Kicklighter et al. (2013), which is based on a relatively simplified scheme for soil, water, and biology. The following segment briefly overviews the dynamics, emergent properties, and overall significance across scales of permafrost region river basins.
A giant, reactive, fast-draining funnel: a permafrost basin overview
Permafrost has a profound impact on Arctic river hydrology. In permafrost regions, a permanently frozen soil layer acts as a “cap” on groundwater flow (see the permafrost barrier on the right-hand side of Fig. 1). This implies that (i) near-surface runoff becomes by far the dominant flow path draining permafrost watersheds (Ye et al., 2009), as shown in Fig. 1d; (ii) the seasonal amplitude of river discharge, expressed by the ratio of maximum to minimum discharge (Qmax:min in Fig. 1), over continuous versus discontinuous permafrost catchments is higher as a result of the permafrost barrier; (iii) this concentration of water volume near the surface causes intense leaching of DOC from litter and relevant unfrozen soil layers (Fig. 1g, d; e.g. Suzuki et al., 2006; Drake et al., 2015; Spencer et al., 2015; Vonk et al., 2015a, b); and (iv) permafrost SOC stocks beneath the active layer are physically and thermally shielded from aquatic mobilisation and metabolisation, respectively (Fig. 1g).
Rapid melting of snow and soil or river ice during spring freshet (May–June) drives intense seasonal discharge, with peaks often 2 orders of magnitude (e.g. Van Vliet et al., 2012) above baseflow rates (Fig. 1d). These events are the cause of four largely synchronous processes: (i) biogenic matter is rapidly transported from elevated headwater catchments (Fig. 1, right-hand side) (McClelland et al., 2016). (ii) Plant material at the soil surface is intensely leached, with subsequent mobilisation and transformation of this dissolved matter via inland waters (Fig. 1d, b, j); during spring freshet, riverine DOC concentrations increase and bulk annual marine DOC exports are dominated by the terrestrial DOC flux to the rivers that occurs at this time (Holmes et al., 2012). Indeed, DOC concentrations during the thawing season tend to be greater than or equal to those in the Amazon, particularly in the flatter Eurasian rivers (Holmes et al., 2012; McClelland et al., 2012), and DOC concentrations are affected at watershed scale by parent material, ground ice content (O'Donnell et al., 2016), and active layer depth (Suzuki et al., 2006). (iii) Sudden inundation of the floodplain regions in spring and early summer (Fig. 1h; Smith and Pavelsky, 2008) further spurs the lateral flux of both particulate and dissolved matter in the process and its redeposition (Zubrzycki et al., 2013) or atmospheric evasion (Fig. 1j, m). (iv) Snowmelt-induced soil water saturation favours the growth of moss and sedge-based ecosystems (e.g. Selvam et al., 2017; Tarnocai et al., 2009; Yu, 2011), as well as the retention of their organic matter (OM), i.e. peat formation, which is not shown in Fig. 1 as this is not represented in this model version but is generated in a separate branch of ORCHIDEE (Qiu et al., 2018).
Midsummer river low flow and a deeper active layer allow for the hydrological intrusion and leaching of older soil horizons (e.g. the top part of Pleistocene-era Yedoma soils), and their subsequent dissolved transport (e.g. Wickland et al., 2018). These sometimes-ancient low-molecular-weight carbon compounds appear to be preferentially and rapidly metabolised by microbes in headwater streams (Fig. 1j), which may constitute a significant fraction of aggregate summer CO2 evasion in Arctic rivers (Denfeld et al., 2013; Vonk et al., 2015). This is likely due to the existence of a significant labile component of frozen carbon (Drake et al., 2015; Vonk et al., 2013; Woods et al., 2011).
CO2 evasion rates from Arctic inland waters (Fig. 1j, e, m), which include both lakes and rivers, are estimated to be 40–84 TgC yr−1 (McGuire et al., 2009), of which 15–30 TgC yr−1 or one-third of the total inland evasion flux is thought to come from rivers. Recent geostatistically determined estimates of boreal lake annual emissions alone now stand at 74–347 TgC yr−1 (Hastie et al., 2018), although this is likely a substantial overestimate (Bogard et al., 2019), which potentially lowers the riverine fraction of total CO2 evasion. These numbers should be compared with estimates of pan-Arctic DOC discharge from rivers of 25–36 TgC yr−1 (Holmes et al., 2012; Raymond et al., 2007). The subsequent influx of terrestrial carbon to the shelf zone is thought to total 45–54 TgC yr−1. Rivers supply the Arctic Ocean with an estimated 34 Tg of carbon-equivalent DOC (DOC-C) yr−1 (Holmes et al., 2012), while depositing 5.8 Tg yr−1 of particulate carbon, these being sourced from rivers draining low- and high-elevation headwaters, respectively (McClelland et al., 2016). These dynamics are all subject to considerable amplification by changes in temperature and hydrology (e.g. Drake et al., 2015; Frey and McClelland, 2009; Tank et al., 2018).
Average annual discharge in Eurasian Arctic rivers increased by at least 7 % between 1936 and 1999 (Peterson et al., 2002), driven by increasing temperatures and runoff (Berezovskaya et al., 2005), the subsequent interplay of increasing annual precipitation, decreasing snow depth and snow water equivalent (SWE) mass (Kunkel et al., 2016; Mudryk et al., 2015), and greater evapotranspiration (Suzuki et al., 2018; Zhang et al., 2009). Although net discharge trend rates over North America were negative over the period 1964–2003, since 2003 they have been positive on average (Déry et al., 2016). These dynamic and largely increasing hydrologic flux trends point towards temperature- and precipitation-driven changes in the soil column, in which increased soil water–snow thaw and microbial activity (Graham et al., 2012; MacKelprang et al., 2011; Schuur et al., 2009) converge to raise soil leaching and DOC export rates to the river basin and beyond (e.g. Vonk et al., 2015b). Further, microbial activity generates its own heat, which incubation experiments have shown may be sufficient to significantly warm the soil further (Hollesen et al., 2015) in a positive feedback.
Arctic region fire events are also on the rise and likely to increase with temperature and severity over time (Ponomarev et al., 2016). The initial burning of biomass is accompanied by active layer deepening, priming of deeper soil horizons (De Baets et al., 2016), and a significant loading of pyrogenic DOC in Arctic watersheds, up to half of which is rapidly metabolised (Myers-Pigg et al., 2015).
In these contexts, the implications of (polar-amplified) warmer temperatures leading to active layer deepening towards the future (transition from continuous to discontinuous permafrost, as shown in the upper and lower segments of Fig. 1) are clear and unique: the potentially sizable aquatic mobilisation and microbial metabolisation (Xue, 2017) of dissolved and eroded OM, deeper hydrological flow paths, an increase in total carbon, and water mass and heat transfer to the aquatic network and, ultimately, the Arctic Ocean and atmosphere (Fig. 1i).
The advantage of having a terrestrial model that can be coupled to a marine component of an overarching global climate model (GCM) is in this case the representation of a consistent transboundary scheme such that output from one model is integrated as input to another. This is particularly important given the context in which these terrestrial outflows occur.
Because of its small size, a uniquely large and shallow continental shelf, the global climatological significance of its seasonal sea ice (Rhein et al., 2013) and its rapid decline (Findlay et al., 2015), the Arctic Ocean has been described as a giant estuary (McClelland et al., 2012) acting as a funnel for the transport, processing, and sedimentation of terrestrial OM. Because of its small surface area and shallow seas (Jakobsson, 2002), the Arctic Ocean holds relatively little volume and is consequently sensitive to inputs of freshwater, heat, alkalinity, and nutrients that flush out from terrestrial sources, particularly at discharge peak.
High suspended particle loads in river water as they approach the mouth (Heim et al., 2014) cause lower light availability and water albedo and hence higher temperatures (Bauch et al., 2013; Janout et al., 2016), which can affect the nearshore sea ice extent, particularly in spring (Steele and Ermold, 2015). Volumes of riverine freshwater and total energy flux (Lammers et al., 2007) are expected to increase with warmer temperatures, along with an earlier discharge peak (Van Vliet et al., 2012, 2013). In doing so, freshwaters may in the future trigger an earlier onset of ice retreat (Stroeve et al., 2014; Whitefield et al., 2015) via a feedback between freshwater albedo, ice melt, and seawater albedo amplified by intermediary state variables such as water vapour and cloudiness (Serreze and Barry, 2011).
Both terrestrially exported and older shelf carbon in the Arctic Ocean face considerable disruption (McGuire et al., 2009; Schuur et al., 2015) from the combined effects of increased freshwater, heat, sediment, nutrient, and organic carbon flows from rapidly warming Arctic river watersheds, as well as those from melting sea ice, warmer marine water temperatures, and geothermal heat sources (Janout et al., 2016; Shakhova et al., 2015). Because ORCHIDEE is a subcomponent of the overarching IPSL ESM, there is scope for coupling riverine outputs of water, DOC, CO2(aq), and heat from the terrestrial model as input for the IPSL marine components (Fig. 1i). Nonetheless, these are not the objectives of the present paper, the aim of which is rather to validate the simulated variable output produced by the model described in detail below against observations and empirical knowledge for the Lena basin, but they are included here descriptively to scope the plausible future applications of ORCHIDEE MICT-LEAK, given our present empirical understanding of their potential significance. The choice of the Lena River basin in eastern Siberia as the watershed of study for model evaluation owes itself to its size, the presence of floodplains, and mountain areas, which allow us to test the model behaviour for contrasting topography, the relatively low impact of damming on the river, given that ORCHIDEE only simulates undammed fluvial “natural flow”, and its mixture of continuous and discontinuous permafrost with tundra grassland in the north and boreal forests in the south; it is described in greater detail in Part 2 of this study.
The Methods section summarises the model structure and associated rationale for each of the model sub-branches or routines relevant to this study and follows with the setup and rationale for the simulations carried out as validation exercises.
This section overviews the processes represented in the model being described in this paper, which is referred to as ORCHIDEE MICT-LEAK, hereafter referred to MICT-L for brevity. MICT-L is at its heart a merge of two distinct models: the high-latitude land surface component of the IPSL Earth system model ORCHIDEE MICT and the DOC production and transport branch of ORCHIDEE's default or “trunk” version (Krinner et al., 2005), ORCHILEAK. The original merger of these two code sets was between ORCHILEAK and ORCHIDEE-MICT, which are described in Camino-Serrano et al. (2018), Lauerwald et al. (2017), and Guimberteau et al. (2018).
However, numerous improvements in code performance and process additions postdating these publications have been included in this code. Furthermore, novel processes included in neither of these two core models are added to MICT-L, such as the diffusion of DOC through the soil column to represent its turbation and preferential stabilisation at depth in the soil, as described in Sect. 2.11.
In terms of code architecture, the resulting model is substantially different from both of its parents owing to the fact that the two models were developed on the basis of ORCHIDEE trunk revisions 2728 and 3976 for ORCHILEAK and MICT, respectively, which have a temporal model development distance of over 2 years and subsequently evolved in their own directions. These foundational differences, which mostly affect the formulation of soil, carbon, and hydrology schemes, mean that different aspects of each are necessarily forced into the subsequent code. Where these differences were considered scientific or code improvements, they were included in the resulting scheme. Despite architectural novelties introduced, MICT-L carries with it a marriage of much the same schemes detailed exhaustively in Guimberteau et al. (2018) and Lauerwald et al. (2017). As such, the following model description details only new elements of the model, those that are critical to the production and transport of DOC from permafrost regions, and parameterisations specific to this study (Fig. 2).
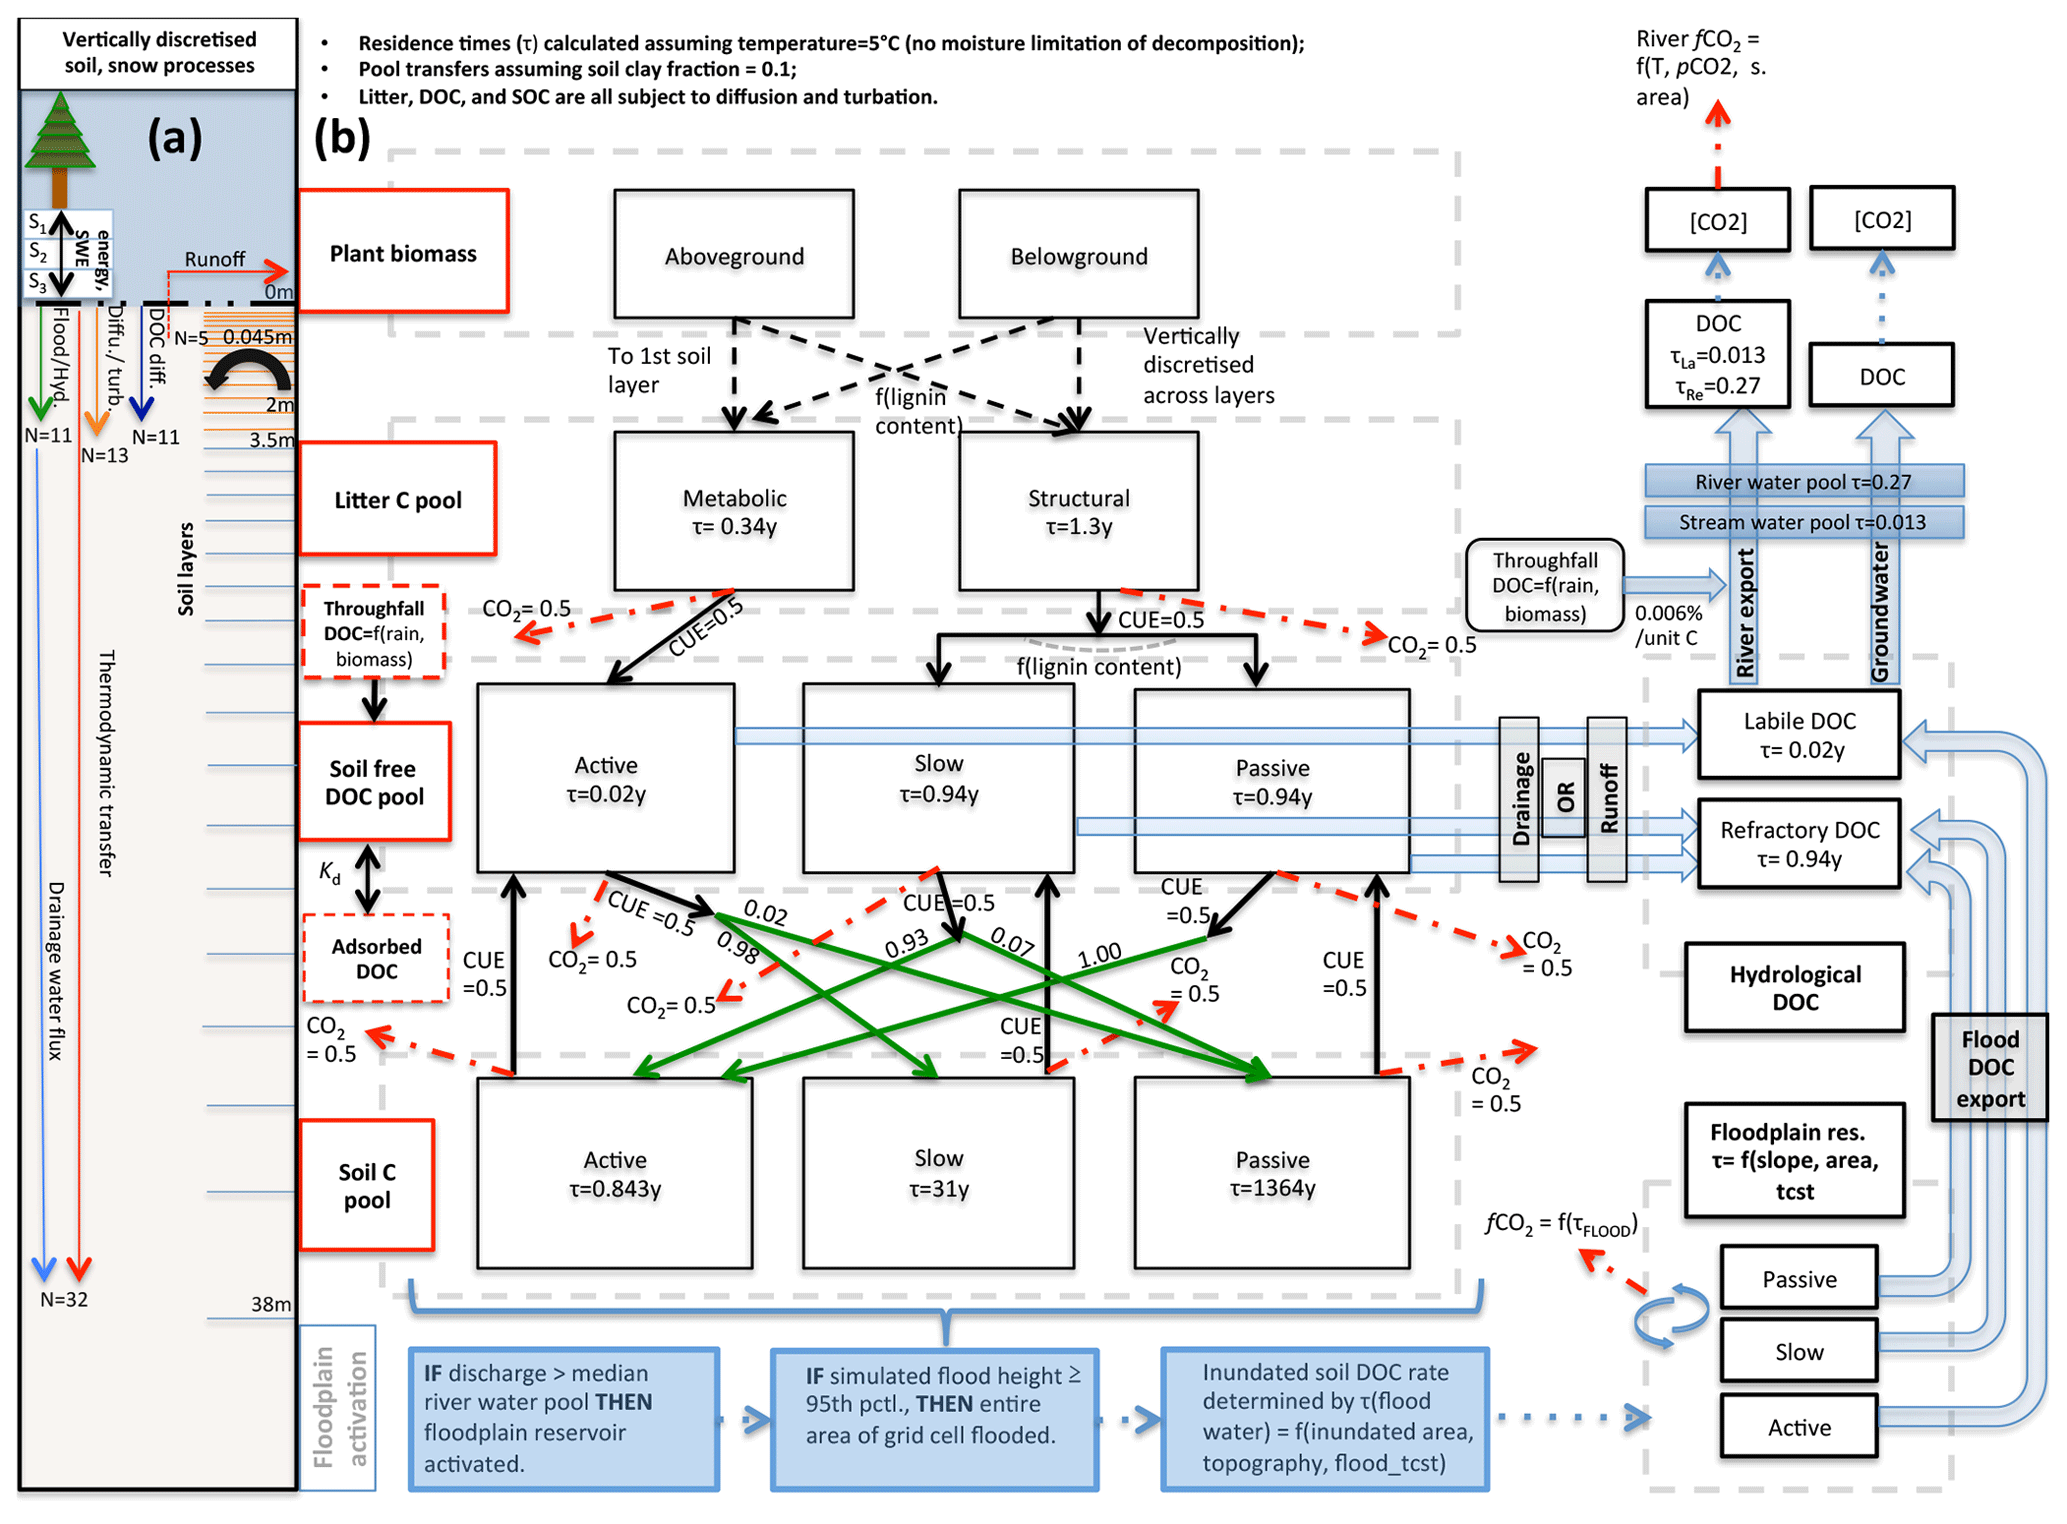
Figure 2Carbon and water flux map for core DOC elements in model structure relating to DOC transport and transformation. (a) Summary of the differing extent of the vertical discretisation of soil and snow for different processes calculated in the model. Discretisation occurs along 32 layers, the thickness of which increases geometrically from 0 to 38 m. N refers to the number of layers, SWE is snow water equivalent, and Sn is snow layer n. Orange layers indicate the depth to which diffusive carbon (turbation) fluxes occur. (b) Conceptual map of the production, transfer, and transformation of carbon in its vertical and lateral (i.e. hydrological) flux as calculated in the model. Red boxes indicate meta-reservoirs of carbon, black boxes the actual pools as they exist in the model. Black arrows indicate carbon fluxes between pools, dashed red arrows give carbon loss as CO2, and green arrows highlight the fractional distribution of DOC to SOC (no carbon loss incurred in this transfer), a feature of this model. For a given temperature (5 ∘C) and soil clay fraction, the fractional fluxes between pools are given for each flux, while residence times for each pool (τ) are in each box. The association of carbon dynamics with the hydrological module is shown by the blue arrows. Blue-coloured boxes illustrate the statistical sequence which activates the Boolean floodplain module. Note that for readability, the generation and lateral flux of dissolved CO2 is omitted from this diagram but is described at length in the Methods section.
2.1 Model description
MICT-L is based largely on ORCHIDEE-MICT, into which the DOC production, transport, and transformation processes developed in the ORCHILEAK model version and tested so far only for the Amazon have been transplanted, allowing these same processes to be generated in high-latitude regions with permafrost soils and a river flow regime dominated by snowmelt. The description that ensues roughly follows the order of the carbon and water flow chain depicted in Fig. 2b. At the heart of the scheme is the vegetative production of carbon, which occurs along a spectrum of 13 plant functional types (PFTs) that differ from one another in terms of plant physiological and phenological uptake and release parameters (Krinner et al., 2005). Together, these determine grid-scale net primary production. At the northern high latitudes, boreal trees (PFTs 7–9) and C3 grasses (PFT 10) dominate landscape biomass and primary production. Thus, in descending order yearly primary production over the Lena basin is roughly broken down between C3 grasses (48 %), boreal needleleaf summergreen trees (27 %), boreal needleleaf evergreen trees (12 %), boreal broadleaf summergreen trees (8 %), and temperate broadleaved evergreen trees (6 %). Naturally these basin aggregates are heterogeneously distributed along latitude and temperature contours, with grasses–tundra dominating at the high latitudes and (e.g.) temperate broadleaf trees existing only at the southern edges of the basin.
2.2 Biomass generation (Fig. 1a)
Biomass generation, consisting of foliage, roots, aboveground and belowground sapwood and heartwood, carbon reserves, and fruit pools in the model, results in the transfer of these carbon stores to two downstream litter pools: structural and metabolic litter (Fig. 2b). This distinction, defined by lignin concentration of each biomass pool (Krinner et al., 2005), separates the relatively reactive litter fraction such as leafy matter from its less-reactive, recalcitrant counterpart (woody, “structural” material), with the consequence that the turnover time of the latter is roughly fourfold that of the former. These two litter pools are further subdivided into aboveground and belowground pools, with the latter explicitly discretised over the first 2 m of the soil column, a feature first introduced to the ORCHIDEE model by Camino-Serrano et al. (2014, 2018). This marks a significant departure from the original litter formulation in ORCHIDEE-MICT, in which the vertical distribution of litter influx to the soil carbon pool follows a prescribed root profile for each PFT. This change now allows for the production of DOC from litter explicitly at a given soil depth in permafrost soils.
2.3 DOC generation and leaching (Fig. 1b)
The vast majority of DOC produced by the model is generated initially from the litter pools via decomposition such that half of all of the decomposed litter is returned to the atmosphere as CO2, as defined by the microbial carbon use efficiency (CUE) – the fraction of carbon assimilated versus respired by microbes post-consumption – here set at 0.5 following Manzoni et al. (2012). The non-respired half of the litter feeds into “active”, “slow”, and “passive” free DOC pools, which correspond to DOC reactivity classes in the soil column in an analogous extension to the standard CENTURY formulation (Parton et al., 1987). Metabolic litter contributes exclusively to the active DOC pool, while structural litter feeds into the other two; the distribution between them is dependent on the lignin content of the structural litter. The reactive SOC pools then derive directly from this DOC reservoir in that fractions of each DOC pool, defined again by the CUE, are directly transferred to three different SOC pools, while the remainder adds to the heterotrophic soil respiration. Depending on the clay content and bulk density of the soil, a fraction of DOC is adsorbed to the mineral soil and does not take part in these reactions until it is gradually desorbed when concentrations of free DOC decrease in the soil column. This scheme is explained in detail in Camino-Serrano et al. (2018). The value of the fractional redistributions between free DOC and SOC after adsorption is shown in Fig. 2b.
The approximate ratio of relative residence times for the three SOC pools in our model (active : slow : passive) is at a soil temperature of 5 ∘C, or 0.843, 31, and 1364 years for the three pools, respectively (Fig. 2b). These are based on our own exploratory model runs and subsequent calculations. The residence time of the active DOC pool is ∼7 d (0.02 years), while the slow and passive DOC pools both have a residence time of ∼343 d (0.94 years) at that same temperature. Upon microbial degradation in the model, the SOC of each pool either reverts to DOC or CO2, and the ratio between these is again determined again by the CUE, which is set in this study at 0.5 for all donor pools, in keeping with the parameter configuration in Lauerwald et al. (2017) from Manzoni et al. (2012). This step in the chain of flows effectively represents leaching of SOC to DOC. Note that the reversion of SOC to DOC occurs only along active–active, slow–slow, and passive–passive lines in Fig. 2b, while the conversion of DOC to SOC is distributed differently to build up a reasonable distribution of soil carbon stock reactivities. Note also that the microbial CUE is invoked twice in the chain of carbon breakdown, meaning that the “effective” CUE of the SOC–litter system is approximately 0.25.
2.4 Throughfall and its DOC (Fig. 1c)
In MICT-L, DOC generation also occurs in the form of wet and dry atmospheric deposition and canopy exudation, collectively attributed to the throughfall, i.e. the amount of precipitation reaching the ground. Wet atmospheric deposition originates from organic compounds dispersed in atmospheric moisture, which become deposited within rainfall and are assumed here to maintain a constant concentration. This concentration we take from the average of reported rainfall DOC concentrations in the empirical literature measured at sites >55∘ N (Bergkvist and Folkeson, 1992; Clarke et al., 2007; Fröberg et al., 2006; Lindroos et al., 2011; Rosenqvist et al., 2010; Starr et al., 2003; Wu et al., 2010), which is 3 mgC L−1 of rainfall. Dry DOC deposition occurs through aerosol-bound organic compounds, here assumed to fall on the canopy; canopy exudation refers to plant sugars exuded from the leaf surface (e.g. honeydew) or from their extraction by heterotrophs such as aphids. These two are lumped together in our estimates of canopy DOC generation (gDOC per gram leaf carbon), which is calibrated as follows.
We take the average total observation-based throughfall DOC flux rate per square metre of forest from the aforementioned literature bundle (15.7 gC m−2 yr−1) and subtract from it the wet deposition component (product of rainfall over our simulation area and the rain DOC content). The remainder is then the canopy DOC, which we scale to the average leaf biomass simulated in a 107-year calibration run over the Lena River basin. From this we obtain a constant tree-canopy DOC production rate of g DOC-C per gram of leaf biomass per day (Eq. 1). This is the same for all PFTs except those representing crops, for which this value equals 0, reflecting how at a very general level crops are small and tend not to be characterised by high organic acid loss rates from leaves due to e.g. aphids because of human control. Note that this production of DOC should be C initially fixed by photosynthesis, but it is represented here as an additional carbon flux. The dry deposition of DOC through the canopy is given by
where TFDRY is the dry deposition of DOC from the canopy, MLEAF is leaf biomass, dt is the time step of the surface hydrology and energy balance module (30 min), and “day” is 24 h. This accumulates in the canopy, can be flushed out with the throughfall, and percolates into the soil surface or adds to the DOC stock of surface waters. The wet and canopy deposition which hits the soil is then assumed to be split evenly between the labile and refractory DOC pools (following Aitkenhead-Peterson et al., 2003).
2.5 Hydrological mobilisation of soil DOC (Fig. 1d)
All DOC pools, leached from the decomposition of either litter and SOC or as throughfall inputs, reside at this point in discrete layers within the soil column but are now also available for vertical advection and diffusion, as well as lateral export from the soil column as a carbon tracer, via soil drainage and runoff.
The export of DOC from the soil to rivers occurs through surface runoff, soil-bottom drainage, or flooding events (see Sect. 2.8, “Representation of floodplain hydrology and their DOC budget”). Runoff is activated when the maximum water infiltration rate of the specific soil has been exceeded, meaning that water arrives at the soil surface faster than it can enter, forcing it to be transported laterally across the surface. DOC is drawn up into this runoff water flux from the first five layers of the soil column, which correspond to a cumulative source depth of 4.5 cm.
Drainage of DOC occurs first as its advection between the discrete soil layers and its subsequent export from the 11th layer, which represents the bottom of the first 2 m of the soil column, from which export is calculated as a proportion of the DOC concentration at this layer. Below this, soil moisture and DOC concentrations are no longer explicitly calculated, except in the case that they are cryoturbated below this up to a depth of 3 m. DOC drainage is proportional to but not a constant multiplier of the water drainage rate for two reasons. First, as water percolates through the soil column, it carries DOC along from one layer to another through the entirety of the soil column, but this percolation is blocked when the soil is entirely frozen; i.e. it is assumed that all soil pores are filled with ice, which blocks percolation. This implies that DOC transport is not just determined by what enters from the top but also by the belowground production from litter, the sorption and desorption to and from particulate soil organic carbon in the soil column, DOC mineralisation within the soil column, and water vertical transport entraining DOC between the non-frozen soil layers using the hydraulic conductivity calculated by the model as a function of soil texture, soil carbon, and time-dependent soil moisture (Guimberteau et al., 2018).
Secondly, in order to account for preferential flow paths in the soil created by the subsoil actions of flora and fauna, as well as for the existence of non-homogenous soil textures at depth that act as aquitards, DOC infiltration must account for the fact that area-aggregated soils drain more slowly, increasing the residence time of DOC in the soil. Thus, a reduction factor which reduces the vertical advection of DOC in soil solution by 80 % compared to the advection is applied to represent a slowdown in DOC percolation through the soil and increase its residence time there.
In MICT-L, as in ORCHILEAK, a “poor-soil” module reads off from a map giving fractional coverage of land underlain by Podzols and Arenosols at the 0.5∘ grid scale, as derived from the Harmonized World Soil Database (Nachtergaele et al., 2010). Due to their low pH and nutrient levels, areas identified by this soil-type criterion experience soil organic matter decomposition rates half those of other soils (Lauerwald et al., 2017), as derived from Bardy et al. (2011), Vitousek and Sanford (1986), and Vitousek and Hobbie (2000). To account for the very low DOC-filtering capacity of these coarse-grained, base, and clay-poor soils (DeLuca and Boisvenue, 2012, Fig. 2b), no reduction factor in DOC advection rate relative to that of water in the soil column is applied when DOC is generated within these poor soils.
By regulating both decomposition and soil moisture flux, the poor-soil criterion effectively serves a similar if not equal function to a soil “tile” for DOC infiltration in the soil column (inset box of Fig. 1) because soil tiles (forest, grassland–tundra–cropland, and bare soil) are determinants of soil hydrology, which affects moisture-limited decomposition. Here however, the poor-soil criterion is applied uniformly across the three soil tiles of each grid cell. This modulation in MICT-L is of significance for the Arctic region, given that large fractions of the discontinuous permafrost region are underlain by Podzols, particularly in Eurasia. For the Arctic as a whole, Podzols cover ∼15 % of the total surface area (DeLuca and Boisvenue, 2012). Further, in modelled frozen soils, a sharp decline in hydraulic conductivity is imposed by the physical barrier of ice filling the soil pores, which retards the flow of water to depth in the soil, imposing a cap on drainage and thus potentially increasing runoff of water laterally across the soil surface (Gouttevin et al., 2012). In doing so, frozen soil layers overlain by liquid soil moisture will experience enhanced residence times of water in the carbon-rich upper soil layers, potentially enriching their DOC load. Note that ice wedges, an important component of permafrost landscapes and their thaw processes, are not included in the current terrestrial representation but have been previously simulated in other models (Lee et al., 2014).
Thus, for all the soil layers in the first 2 m, DOC stocks are controlled by production from litter and SOC decay, as well as their advection, diffusion, consumption by DOC mineralisation, and buffering by adsorption and desorption processes.
2.6 Routing scheme
The routing scheme in ORCHIDEE, first described in detail in Ngo-Duc et al. (2007) and presented after some version iterations in Guimberteau et al. (2012), is the module which, when activated, represents the transport of water collected by the runoff and drainage simulated by the model along the prescribed river network in a given watershed. In doing so, its purpose is to coarsely represent the hydrologic coupling between precipitation inputs to the model and subsequent terrestrial runoff and drainage (or evaporation) calculated by it, on the one hand, and the eventual discharge of freshwater to the marine domain on the other. In other words, the routing scheme simulates the transport of water by rivers and streams by connecting rainfall and continental river discharge with the land surface.
To do so, the routing scheme first inputs a map of global watersheds at the 0.5∘ scale (Oki et al., 1999; Vörösmarty et al., 2000), which gives watershed and sub-basin boundaries and the direction of water flow based on topography to the model. The water flows themselves are comprised of three distinct linear reservoirs within each sub-basin (slow, fast, stream). Each water reservoir is represented at the scale (here: four sub-grid units per grid cell) and updated with the lateral inflows and outflows at a daily time step. The slow water reservoir aggregates the soil drainage, i.e. the vertical outflow from the 11th layer (2 m depth) of the soil column, effectively representing “shallow groundwater” transport and storage. The fast water reservoir aggregates surface runoff simulated in the model, effectively representing overland hydrologic flow. The slow and fast water reservoirs feed a delayed outflow to the stream reservoir of the next downstream sub-grid quadrant
The water residence time in each reservoir depends on the nature of the reservoir (increasing residence time in the following order: stream < fast < slow reservoir). More generally, residence time locally decreases with topographic slope and the grid cell length used as a proxy for the main tributary length (Ducharne et al., 2003; Guimberteau et al., 2012). This is done to reproduce the hydrological effects of geomorphological and topographic factors in Manning's equation (Manning, 1891) and determines the time that water and DOC remain in soils prior to entering the river network or groundwater. In this way the runoff and drainage are exported from subunit to subunit and from grid cell to grid cell.
2.7 Grid-scale water and carbon routing (Fig. 1f, g)
Waterborne, terrestrially derived DOC and dissolved CO2 in the soil solution are exported over the land surface using the same routing scheme. When exported from soil or litter, DOC remains differentiated in the numerical simulations according to its initial reactivity within the soil (active, slow, passive). However, because the terrestrial slow and passive DOC pools (Camino-Serrano et al., 2018) are given the same residence time, these two pools are merged when exported (Lauerwald et al., 2017): active DOC flows into a labile DOC hydrological export pool, while the slow and passive DOC pools flow into a refractory DOC hydrological pool (Fig. 2b), owing to the fact that the residence time of these latter soil DOC pools is the same in their original (ORCHIDEE-SOM) formulation (Camino-Serrano et al., 2018), and retained and merged into a single hydrological DOC pool in Lauerwald et al. (2017). The water residence times in each reservoir of each sub-grid-scale quadrant determine the decomposition of DOC into CO2 within water reservoirs, before non-decomposed DOC is passed on to the next reservoir in the downstream sub-grid quadrant.
The river-routing calculations, which occur at a daily time step, are then aggregated to 1 d for the lateral transfer of water, CO2(aq), and DOC from upstream grids to downstream grids according to the river network. Note that carbonate chemistry in rivers and total alkalinity routing are not calculated here.
In this framework, the fast and slow residence times of the water pools in the routing scheme determine the time that water and DOC remain in overland and groundwater flow before entering the river network. Note that while we do not explicitly simulate headwaters as they exist in a geographically determinant way in the real world, we do simulate what happens to the water before it flows into a waterbody large enough to be represented in the routing scheme by the water pool called “stream”, representing a real-world river of stream order 4 or higher. The fast reservoir is thus the runoff water flow that is destined to enter the stream water reservoir and implicitly represents headwater streams of Strahler order 1 to 3 by filling the spatial and temporal niche between overland runoff and the river stem. The dynamics of headwater hydrological and DOC dynamics (Sect. 2.10) are of potentially great significance with respect to carbon processing, as headwater catchments have been shown to be “hotspots” of carbon metabolisation and outgassing in Arctic rivers, despite their relatively small areal fraction (Denfeld et al., 2013; Drake et al., 2015; Mann et al., 2015; Suzuki et al., 2006; Venkiteswaran et al., 2014; Vonk et al., 2013, 2015a, b). Thus, in what follows in this study, we refer to what in the code are called the fast and stream pools, which represent the small streams and large stream or river pools, respectively, using the terms stream and river to denote these from here on.
Furthermore, the differentiated representation of water pools and mean grid cell slope, combined with the dynamic active layer simulated for continuous versus discontinuous permafrost, is important for reproducing the phenomena observed by Kutscher et al. (2017) and Zhang et al. (2017) for sloping land, as shown on the right-hand side of Fig. 1. In discontinuous permafrost and permafrost-free regions, these phenomena encompass landscape processes (sub-grid in the model) through which water flow is able to re-infiltrate the soil column and leach more refractory DOC deeper in the soil column, leading to a more refractory signal in the drainage waters. In contrast, in continuous permafrost regions, the shallow active layer will inhibit the downward re-infiltration flux of water and encourage leaching at the more organic-rich and labile surface soil layer, resulting in a more labile DOC signal from the drainage in these areas (Fig. 1). In addition, places with higher elevation and slope in these regions tend to experience extreme cold, leading to lower net primary production (NPP) and therefore DOC leaching. The re-infiltration processes mentioned are thought to be accentuated in areas with higher topographic relief (Jasechko et al., 2016), which is why they are represented on sloping areas in Fig. 1.
2.8 Representation of floodplain hydrology and its DOC budget (Fig. 1e, h)
The third terrestrial DOC export pathway in MICT-L is through flooding of floodplains, a transient period that occurs when stream water is forced by high discharge rates over the riverbanks and flows onto a flat floodplain area of the grid cell that the river crosses, thus inundating the soil. Such a floodplain area is represented as a fraction of a grid cell with the maximum extent of inundation, termed the “potential flooded area” being predefined from a forcing file (Tootchi et al., 2019). Here, the DOC pools that are already being produced in these inundated areas from litter and SOC decomposition in the first five layers of the soil column are directly absorbed by the overlying floodwaters. These floodwaters may then either process the DOC directly, via oxidisation to CO2 (Sect. 2.10, 2.11), or return them to the river network as floodwaters recede to the river main stem, at which point they join the runoff and drainage export flows from upstream.
MICT-L includes the floodplain hydrology part of the routing scheme (d'Orgeval et al., 2008; Guimberteau et al., 2012), as well as additions and improvements described in Lauerwald et al. (2017). The spatial areas that are available for potential flooding are predefined by an input map originally based on the map of Prigent et al. (2007). However, for this study, we used an alternative map of the “regularly flooded areas” derived from the method described in Tootchi et al. (2019), which in this study uses an improved input potential flooding area forcing file specific to the Lena basin that combines three high-resolution surface water and inundation datasets derived from satellite imagery: GIEMS-D15 (Fluet-Chouinard et al., 2015), which results from the downscaling of the map of Prigent et al. (2007) at 15 arcsec (ca 500 m at the Equator); ESA-CCI land cover (at 300 m ∼ 10 arcsec); and JRC surface water at 1 arcsec (Pekel et al., 2016). The “fusion” approach followed by this forcing dataset stems from the assumption that the potential flooding areas identified by the different datasets are all valid despite their uncertainties, although none of them are exhaustive. The resulting map was constructed globally at 15 arcsec resolution, and care was taken to exclude large permanent lakes from the potential flooding area based on the HydroLAKES database (Messager et al., 2016). In the Lena River basin, the basin against which we evaluate ORCHIDEE MICT-LEAK in Part 2 of this study, this new potential floodplain file gives a maximum floodable area of 12.1 % (2.4×10⁵ km2) of the 2.5×10⁶ km2 basin, substantially higher than previous estimates of 4.2 % by Prigent et al. (2007).
With this improved forcing, river discharge becomes available to flood a specific predefined floodplain grid fraction, creating a temporary floodplain hydrologic reservoir, the magnitude of which is defined by the excess of discharge at that point over a threshold value given by the median simulated water storage in each grid cell over a 30-year period. The maximum extent of within-grid flooding is given by another threshold, the calculated height of floodwaters beyond which it is assumed that the entire grid is inundated. This height, which was previously fixed at 2 m, is now determined by the 90th percentile of all floodwater height levels calculated per grid cell from the total water storage of that grid cell over a reference simulation period for the Lena basin using the same methodology introduced by Lauerwald et al. (2017). The residence time of water on the floodplains (τflood) is a determinant of its resulting DOC concentration, since during this period it appropriates all DOC produced by the top five layers of the soil column.
2.9 Oceanic outflow (Fig. 1i)
The routing of water and DOC through the river network ultimately leads to their export from the terrestrial system at the river mouth (Fig. 1), which for high-latitude rivers is almost always a sub-delta of the greater “estuary” described by McClelland et al. (2012) that drains into the Arctic Ocean. Otherwise, the only other loss pathway for carbon export once in the river network is through its decomposition to CO2 and subsequent escape to the atmosphere from the river surface. DOC decomposition is assigned a constant fraction for the labile and refractory DOC pools of 0.3 and 0.01 d−1 at 25 ∘C, respectively, modulated by a water-temperature-dependent Arrhenius rate term. Because the concentration of dissolved CO2 (referred to as CO2(aq.)) in river water is derived not only from in-stream decomposition of DOC, but also from CO2(aq.) inputs from the decomposition of litter, SOC, and DOC in both upland soils and inundated soils, the model also represents the lateral transport of CO2(aq.) from soils through the river network. Note that autochthonous primary production and derivative carbon transformations are ignored here, as they are considered relatively minor contributors in the Arctic lateral flux system (Cauwet and Sidorov, 1996; Sorokin and Sorokin, 1996).
2.10 Dissolved CO2 export and river evasion (Fig. 1j)
Soil CO2(aq.) exports are simulated by first assuming a constant concentration of CO2(aq.) with surface runoff and drainage water fluxes of 20 and 2 mgC L−1, corresponding to a pCO2 of 50 000 and 5000 µatm at 25 ∘C in the soil column, respectively. These quantities are then scaled with total (root, microbial, litter) soil respiration by a scaling factor first employed in Lauerwald et al. (2019). At high latitudes, soil respiration is dominantly controlled by microbial decomposition, and for the Lena basin initial model tests suggest that its proportional contribution to total respiration is roughly 90 % versus 10 % from root respiration. Thus, CO2(aq.) enters and circulates the rivers via the same routing scheme as that for DOC and river water. The lateral transfers of carbon are aggregated from the 30 min time steps at which they are calculated with a 48 time step period so that they occur within the model as a daily flux. The calculation of the river network pCO2 can then be made from CO2(aq.) and its equilibrium with the atmosphere, which is a function of its solubility () with respect to the temperature of the water surface TWATER (Eq. 2):
where the pCO2 (atm.) of a given (e.g. stream, fast, slow, and floodplain) water pool (pCO2POOL) is given by the dissolved CO2 concentration in that pool [CO2(aq)], the molar weight of carbon (12.011 g mol−1), and . Water temperature (TWATER; ∘C) is not simulated by the model but is derived here from the average daily surface temperature (TGROUND; ∘C) in the model (Eq. 3), a derivation calculated for ORCHIDEE by Lauerwald et al. (2017) and retained here. Note that while dissolved CO2 enters from the terrestrial reservoir from organic matter decomposition, it is also generated in situ within the river network as DOC is respired microbially.
With our water temperature estimate, both and the Schmidt number (Sc, Eq. 4) from Wanninkhof (1992) can be calculated, allowing for the simulation of actual gas exchange velocities from standard conditions. The Schmidt number links the gas transfer velocity of any soluble gas (in this case carbon dioxide) from the water surface to water temperature. For more on the Schmidt number, see Wanninkhof (2014, 1992). The CO2 that evades is then subtracted from the [CO(2aq)] stocks of each of the different hydrologic reservoirs – river, flood, and stream.
CO2 evasion is therefore assumed to originate from the interplay of CO2 solubility, the relative gradient in partial pressures of CO2 between air and water, and gas exchange kinetics. Evasion as a flux from river and floodplain water surfaces is calculated at a daily time step; however, in order to satisfy the sensitivity of the relative gradient of partial pressures of CO2 in the water column and atmosphere to both CO2 inputs and evasion, the pCO2 of water is calculated at a more refined 6 min time step. The daily lateral flux of CO2 inputs to the water column are thus equally broken up into 240 (6 min) segments per day and distributed to the pCO2 calculation. Other relevant carbon-processing pathways, such as the photochemical breakdown of riverine dissolved organic carbon, are not explicitly included here, despite the suggestion by some studies that the photochemical pathway dominates DOC processing in Arctic streams (e.g. Cory et al., 2014). Rather, these processes are bundled into the aggregate decomposition rates used in the model, which thus include both microbial and photochemical oxidation. This is largely because it is unclear how different factors contribute to breaking down DOC in a dynamic environment and also the extent to which our DOC decomposition and CO2 calculations implicitly include both pathways – e.g. to what extent the equations and concepts used in their calculation confound bacterial with photochemical causation, since both microbial activity and incident UV light are a function of temperature and total incident light.
2.11 Soil layer processes: turbation (Fig. 1k), adsorption (Fig. 1l)
The soil carbon module is discretised into a 32-layer scheme totalling 38 m of depth, which it shares with the soil thermodynamics to calculate temperature through the entire column. An aboveground snow module (Wang et al., 2013) is discretised into three layers of differing thickness, heat conductance, and density, which collectively act as a thermodynamically insulating intermediary between the soil and atmosphere (Fig. 2a). Inputs to the three soil carbon pools are resolved only for the top 2 m of the soil, where litter and DOC are exchanged with SOC in decomposition and adsorption–desorption processes. The decomposition of SOC pools, calculated in each soil layer, is dependent on soil temperature, moisture, and texture (Koven et al., 2009; Zhu et al., 2016), while the vertical transfer of SOC is enabled by the representation of cryoturbation (downward movement of matter due to repeated freeze–thaw) in permafrost regions and bioturbation (by soil organisms) in non-permafrost regions in terms of a diffusive flux.
Cryoturbation, given a diffusive mixing rate (Diff) of 0.001 m2 yr−1 (Koven et al., 2009), is possible to 3 m of depth (the diffusive rate declines linearly to zero from the active layer bottom to 3 m) and extends the soil column carbon concentration depth in permafrost regions from 2 m. Bioturbation is possible to 2 m of depth, with a mixing rate of 0.0001 m2 yr−1 (Koven et al., 2013) declining to zero at 2 m (Eq. 5). In MICT-L, these vertical exchanges in the soil column are improved. Now, we explicitly include the cryoturbation and bioturbation of both belowground litter and DOC. These were not possible in ORCHIDEE-MICT because, for the former, the belowground litter distribution was not explicitly discretised or vertically dynamic and, for the latter, because DOC was not produced in prior versions. Diffusion is given by
where DOCi is the DOC in pool i at depth z (gC m−3), IN is the inflow of carbon to that pool (gC m−3 d−1), ki is the decomposition rate of that pool (d−1), Φ is the temperature-dependent rate modifier for DOC decomposition, and Diff is the diffusion coefficient (m2 yr−1). The vertical diffusion of DOC in non-permafrost soils represented here (that is, the non-cryoturbated component) appears to be consistent with recent studies reporting an increased retention of DOC in the deepening active layer of organic soils (Zhang et al., 2017). This vertical translocation of organic carbon, whether in solid or liquid phase, appears to be an important component of the high rates of SOC buildup observed at depth in deep permafrost soils.
2.12 Priming (Fig. 1m)
MICT-L also incorporates a scheme for the priming of organic matter decomposition, a process in which the relative stability of SOC is impacted by the intrusion of or contact with SOC of greater reactivity, resulting in enhanced rates of decomposition. This was first introduced by Guenet et al. (2016) and updated in Guenet et al. (2018). This process has shown itself to be of potentially large significance for SOC stocks and their respiration in high-latitude regions based on empirical in situ and soil incubation studies (De Baets et al., 2016; Walz et al., 2017; Wild et al., 2014, 2016; Zhang et al., 2017), as well as modelling exercises (Guenet et al., 2018). Here, priming of a given soil pool is represented through the decomposition of soil carbon (dSOC ∕ dt) by the following equation:
where INSOC is the carbon input to that pool, k is the SOC decomposition rate (1 ∕ dt), FOC (Kg) is a stock of matter interacting with this SOC pool to produce priming, c is a parameter controlling this interaction, SOC is the SOC reservoir (Kg), and θ,Φ, and γ are the zero-dimensional moisture, temperature, and soil texture rate modifiers that modulate decomposition in the code, are originally determined by the CENTURY formulation (Parton et al., 1987), and subsequently re-estimated to include priming in Guenet et al. (2016, 2018).
The variable FOC (fresh organic carbon) is an umbrella term used for specifying all of the carbon pools which together constitute carbon that is considered potential priming donor material – i.e. more labile – to a given receptor carbon pool. Thus, for the slow soil carbon pool, FOC incorporates the active soil carbon pool plus the aboveground and belowground structural and metabolic litter pools because these pools are donors to the slow pool and are considered to accelerate its turnover through priming. Importantly, previous studies with priming in ORCHIDEE employed this scheme on a version which resolves neither the vertical discretisation of the soil column nor the explicit vertical diffusion processes presented here. This is potentially significant, since the vertical diffusion of relatively reactive matter may strongly impact (accelerate) the decomposition of low-reactivity matter in the deeper non-frozen horizons of high-latitude soils, while the explicit discretisation of the soil column is a significant improvement in terms of the accuracy of process representation within the column itself.
Anther carbon-relevant scheme included in MICT-L is a prognostic fire routine (SPITFIRE) calibrated for the trunk version of ORCHIDEE (Yue et al., 2016), which is available in our code but not activated in the simulations conducted here. As a result, we do not simulate the ∼13 % of Arctic riverine DOC attributed to biomass burning by Myers-Pigg et al. (2015) or the ∼8 % of DOC discharge to the Arctic Ocean from the same source (Stubbins et al., 2017). Likewise, a crop harvest module consistent with that in ORCHIDEE-MICT exists in MICT-L but remains deactivated for our simulations.
A module introduced in the last version of ORCHIDEE-MICT (Guimberteau et al., 2018), in which the soil thermal transfer, porosity, and moisture are strongly affected by SOC concentration, is deactivated here because it is inconsistent with the new DOC scheme. Specifically, while carbon is conserved in both the MICT and MICT-L soil schemes, MICT-L introduces a new reservoir into which part of the total organic carbon in the soil – the DOC – must now go. This then lowers the SOC concentration being read by this thermix module, causing significant model artefacts in soil thermodynamics and hydrology in early exploratory simulations. Ensuring the compatibility of this routine with the DOC scheme will be a focal point of future developments in MICT-L. Other processes being developed for ORCHIDEE-MICT, including high-latitude peat formation (Qiu et al., 2018), methane production, and microbial heat-generating processes that are being optimised and calibrated, are further pending additions to this particular branch of the ORCHIDEE-MICT series.
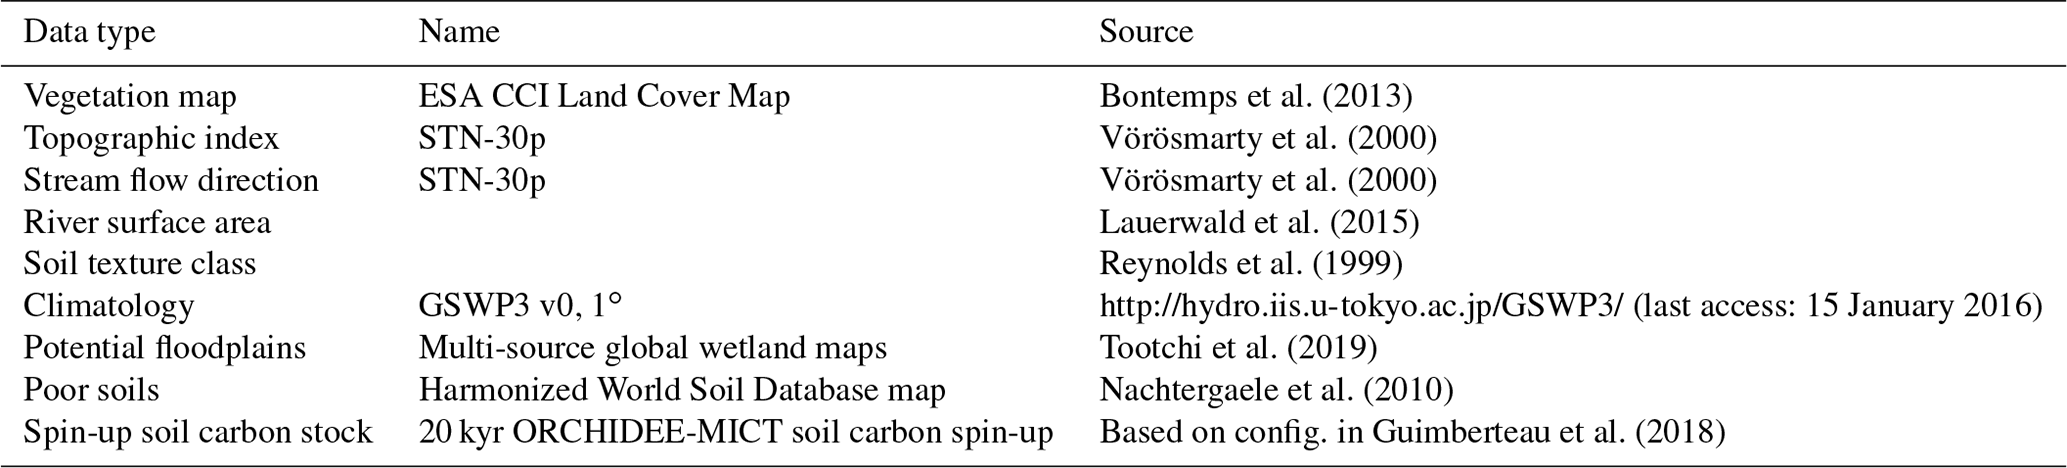
Table 1Data type, name, and sources of data files used to drive the model in the study simulations.
The soil carbon spin-up component of ORCHIDEE, which is available to both its trunk and MICT branches, was omitted from this first version of MICT-L owing to the code burden required for ensuring compatibility with the soil carbon scheme in MICT-L. However, because we are simulating high-latitude permafrost regions, having a realistic soil carbon pool at the outset of the simulations is necessary if we are to untangle the dynamics of SOC and DOC with a changing environment. Because the soil carbon spin-up in ORCHIDEE-MICT is normally run over more than 10 000 years (Guimberteau et al., 2108) and because running MICT-L for this simulation period in its normal, non-spin-up simulation mode would impose an unreasonable burden on computing resources, here we directly force the soil carbon output from a MICT spin-up directly into the restart file of a MICT-L simulation.
A 20 000-year spin-up loop over 1961–1990 (these years were chosen to mimic coarsely warmer mid-Holocene climate) forced by GSWP-3 climatology, the configuration of which derives directly from that used in Guimberteau et al. (2018), was thus used to replace the three soil carbon pool values from a 1-year MICT-L simulation to set their initial values. A conversion of this soil carbon from volumetric to areal units was applied owing to different read–write standards in ORCHILEAK versus ORCHIDEE-MICT. This artificially imposed, MICT-derived SOC stock would then have to be exposed to MICT-L code, the large differences of which in terms of soil carbon module architecture compared to MICT would drive a search for new equilibrium soil carbon stocks.
Due to the long residence times of the passive SOC pool, reaching full equilibrium requires a simulation length on the order of 20 000 years – again an overburden. As we are interested primarily in DOC in this study, which derives mostly from the active and slow SOC pools, the model was run until these two pools reached a quasi-steady-state equilibria (Part 2 Supplement, Fig. S1). This was done by looping over the same 30-year cycle (1901–1930) of climate forcing data from GSWP-3 during the pre-industrial period (Table 1) and the first year (1901) of a prescribed vegetation map (ESA CCI Land Cover Map; Bontemps et al., 2013) – to ensure that the equilibrium of DOC, dissolved CO2, and active and slow SOC pools is driven not just by a single set of environmental factors in 1 year – for a total of 400 years. The parameter configuration adhered as close as possible to that used in the original ORCHIDEE-MICT spin-up simulations to avoid excessive equilibrium drift from the original SOC state (Fig. 3).
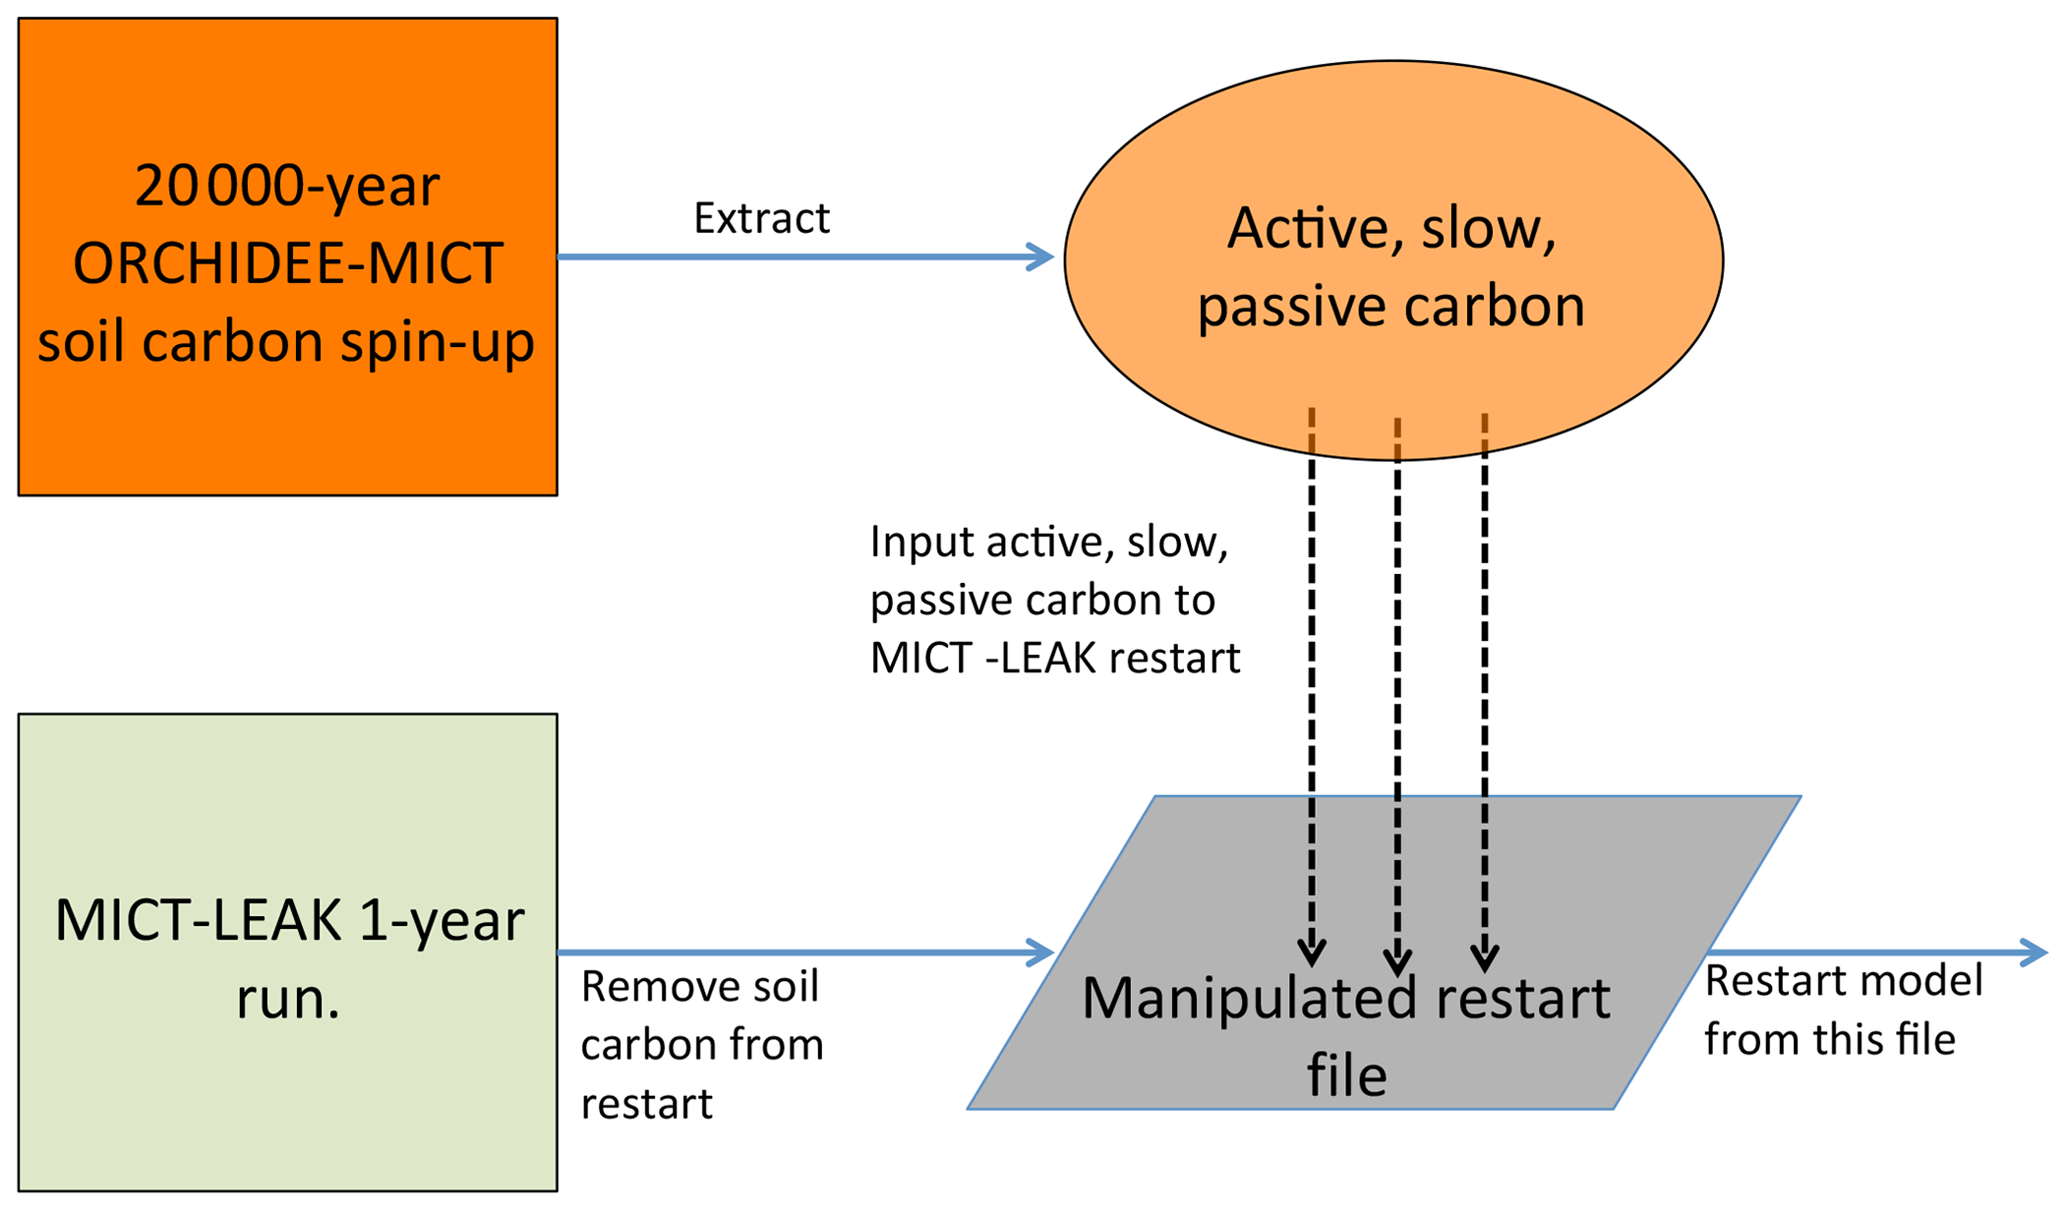
Figure 3Flow diagram illustrating the stepwise stages required to implement the model's soil carbon stock prior to conducting transient historical simulations.
This first part of a two-part study has described a new branch of the high-latitude version of the ORCHIDEE-MICT land surface model, in which the production, transport, and transformation of DOC and dissolved CO2 in soils and along the inland water network of explicitly represented northern permafrost regions have been implemented for the first time. Novel processes with respect to ORCHIDEE-MICT include the discretisation of litter inputs to the soil column, the production of DOC and CO2(aq.) from organic matter and decomposition, respectively, the transport of DOC into the river-routing network and its potential mineralisation to CO2(aq.) in the water column, and subsequent evasion from the water surface to the atmosphere. In addition, an improved floodplain representation has been implemented, which allows for the hydrologic cycling of DOC and CO2 in these inundated areas. In addition to descriptions of these processes, this paper outlines the protocols and configuration adopted for simulations using this new model that will be used for its evaluation over the Lena River basin in the second part of this study.
The source code for ORCHIDEE MICT-LEAK revision 5459 is available via http://forge.ipsl.jussieu.fr/orchidee/wiki/GroupActivities/CodeAvalaibilityPublication/ORCHIDEE_ gmd-2018-MICT-LEAK_r5459 (https://doi.org/10.14768/20181114002.1, Bowring, 2018).
Primary data and scripts used in the analysis and other supplementary information that may be useful in reproducing the author's work can be obtained by contacting the corresponding author.
This software is governed by the CeCILL licence under French law and abiding by the rules of distribution of free software. You can use, modify, and/or redistribute the software under the terms of the CeCILL licence as circulated by CEA, CNRS, and INRIA at the following URL: http://www.cecill.info (last access: 1 August 2019).
SPKB coded this model version, conducted the simulations, and wrote the main body of the paper. RL gave consistent input to the coding process and made numerous code improvements and bug fixes. BG advised on the inclusion of priming processes in the model and advised on the study design and model configuration; DZ gave input on the modelled soil carbon processes and model configuration. MG, AT, and AD contributed to improvements in hydrological representation and floodplain forcing data. PC oversaw all developments leading to the publication of this study. All authors contributed to suggestions regarding the final content of the study.
The authors declare that there is no conflict of interest.
Simon P. K. Bowring acknowledges funding from the European Union's Horizon 2020 research and innovation programme under Marie Skłodowska-Curie grant agreement no. 643052, “C-CASCADES” programme. Simon P. K. Bowring received a PhD grant. Matthieu Guimberteau acknowledges funding from the European Research Council Synergy grant ERC-2013-SyG-610028 IMBALANCE-P. Ronny Lauerwald acknowledges funding from the European Union's Horizon 2020 research and innovation programme under grant agreement no. 703813 for the Marie Skłodowska-Curie European Individual Fellowship “C-Leak”.
This research has been supported by the Marie Skłodowska-Curie ESR grant (C-CASCADES (grant no. 643052)), the Marie Skłodowska-Curie European Individual Fellowship (C-Leak (grant no. 703813)), and the European Research Council Synergy grant (IMBALANCE-P grant no. (ERC-2013-SyG-610028)).
This paper was edited by Hisashi Sato and reviewed by Hisashi Sato and two anonymous referees.
Aitkenhead-Peterson, J. A., McDowell, W. H., and Neff, J. C.: Sources, Production, and Regulation of Allochthonous Dissolved Organic Matter Inputs to Surface Waters, in: Aquatic Ecosystems, 25–70, Academic Press, 2003.
Bardy, M., Derenne, S., Allard, T., Benedetti, M. F., and Fritsch, E.: Podzolisation and exportation of organic matter in black waters of the Rio Negro (upper Amazon basin, Brazil), Biogeochemistry, 106, 71–88, https://doi.org/10.1007/s10533-010-9564-9, 2011.
Bauch, D., Hölemann, J. A., Nikulina, A., Wegner, C., Janout, M. A., Timokhov, L. A., and Kassens, H.: Correlation of river water and local sea-ice melting on the Laptev Sea shelf (Siberian Arctic), J. Geophys. Res. Ocean., 118, 550–561, https://doi.org/10.1002/jgrc.20076, 2013.
Berezovskaya, S., Yang, D., and Hinzman, L.: Long-term annual water balance analysis of the Lena River, Glob. Planet. Change, 48, 84–95, https://doi.org/10.1016/j.gloplacha.2004.12.006, 2005.
Bergkvist, B. O. and Folkeson, L.: Soil acidification and element fluxes of a Fagus sylvatica forest as influenced by simulated nitrogen deposition, Water, Air, Soil Pollut., 65, 111–133, https://doi.org/10.1007/BF00482753, 1992.
Bogard, M. J., Kuhn, C. D., Johnston, S. E., Striegl, R. G., Holtgrieve, G. W., Dornblaser, M. M., Spencer, R. G. M., Wickland, K. P., and Butman, D. E.: Negligible cycling of terrestrial carbon in many lakes of the arid circumpolar landscape, Nat. Geosci., 12, 180, https://doi.org/10.1038/s41561-019-0299-5, 2019.
Bontemps, S., Defourny, P., Radoux, J., Van Bogaert, E., Lamarche, C., Achard, F., Mayaux, P., Boettcher, M., Brockmann, C., Kirches, G., Zülkhe, M., Kalogirou, V., Seifert, F., and Arino, O.: Consistent global land cover maps for climate modelling communities: current achievements of the ESA' and cover CCI, in ESA Living Planet Symposium 2013, 2013.
Bowring, S.: ORCHIDEE_MICT-LEAK revision 5459, Institut Pierre Simon Laplace (IPSL), https://doi.org/10.14768/20181114002.1, 2018.
Camino-Serrano, M., Gielen, B., Luyssaert, S., Ciais, P., Vicca, S., Guenet, B., Vos, B. De, Cools, N., Ahrens, B., Altaf Arain, M., Borken, W., Clarke, N., Clarkson, B., Cummins, T., Don, A., Pannatier, E. G., Laudon, H., Moore, T., Nieminen, T. M., Nilsson, M. B., Peichl, M., Schwendenmann, L., Siemens, J., and Janssens, I.: Linking variability in soil solution dissolved organic carbon to climate, soil type, and vegetation type, Global Biogeochem. Cy., 28, 497–509, https://doi.org/10.1002/2013GB004726, 2014.
Camino-Serrano, M., Guenet, B., Luyssaert, S., Ciais, P., Bastrikov, V., De Vos, B., Gielen, B., Gleixner, G., Jornet-Puig, A., Kaiser, K., Kothawala, D., Lauerwald, R., Peñuelas, J., Schrumpf, M., Vicca, S., Vuichard, N., Walmsley, D., and Janssens, I. A.: ORCHIDEE-SOM: modeling soil organic carbon (SOC) and dissolved organic carbon (DOC) dynamics along vertical soil profiles in Europe, Geosci. Model Dev., 11, 937–957, https://doi.org/10.5194/gmd-11-937-2018, 2018.
Cauwet, G. and Sidorov, I.: The biogeochemistry of Lena River: Organic carbon and nutrients distribution, Mar. Chem., 211–227, 1996.
Clarke, N., Wu, Y., and Strand, L. T.: Dissolved organic carbon concentrations in four Norway spruce stands of different ages, Plant Soil, 299, 275–285, https://doi.org/10.1007/s11104-007-9384-4, 2007.
Cory, R. M., Ward, C. P., Crump, B. C., and Kling, G. W.: Sunlight controls water column processing of carbon in arctic fresh waters, Science, 345, 925–928, https://doi.org/10.1126/science.1253119, 2014.
De Baets, S., Van de Weg, M. J., Lewis, R., Steinberg, N., Meersmans, J., Quine, T. A., Shaver, G. R., and Hartley, I. P.: Investigating the controls on soil organic matter decomposition in tussock tundra soil and permafrost after fire, Soil Biol. Biochem., 99, 108–116, https://doi.org/10.1016/j.soilbio.2016.04.020, 2016.
DeLuca, T. H. and Boisvenue, C.: Boreal forest soil carbon: Distribution, function and modelling, Forestry, 161–184, https://doi.org/10.1093/forestry/cps003, 2012.
Denfeld, B., Frey, K., and Sobczak, W.: Summer CO2 evasion from streams and rivers in the Kolyma River basin, north-east Siberia, Polar, 32, 19704, https://doi.org/10.3402/polar.v32i0.19704, 2013.
Déry, S. J., Stadnyk, T. A., MacDonald, M. K., and Gauli-Sharma, B.: Recent trends and variability in river discharge across northern Canada, Hydrol. Earth Syst. Sci., 20, 4801–4818, https://doi.org/10.5194/hess-20-4801-2016, 2016.
d'Orgeval, T., Polcher, J., and de Rosnay, P.: Sensitivity of the West African hydrological cycle in ORCHIDEE to infiltration processes, Hydrol. Earth Syst. Sci., 12, 1387–1401, https://doi.org/10.5194/hess-12-1387-2008, 2008.
Drake, T. W., Wickland, K. P., Spencer, R. G. M., McKnight, D. M., and Striegl, R. G.: Ancient low–molecular-weight organic acids in permafrost fuel rapid carbon dioxide production upon thaw, P. Natl. Acad. Sci. USA, 112, 13946–13951, https://doi.org/10.1073/pnas.1511705112, 2015.
Ducharne, A., Golaz, C., Leblois, E., Laval, K., Polcher, J., Ledoux, E., and De Marsily, G.: Development of a high resolution runoff routing model, calibration and application to assess runoff from the LMD GCM, J. Hydrol., 280, 207–228, https://doi.org/10.1016/S0022-1694(03)00230-0, 2003.
Findlay, H. S., Gibson, G., Kędra, M., Morata, N., Orchowska, M., Pavlov, A. K., Reigstad, M., Silyakova, A., Tremblay, J.-É., Walczowski, W., Weydmann, A., and Logvinova, C.: Responses in Arctic marine carbon cycle processes: conceptual scenarios and implications for ecosystem function, Polar Res., 34, 24252, https://doi.org/10.3402/polar.v34.24252, 2015.
Fluet-Chouinard, E., Lehner, B., Rebelo, L. M., Papa, F., and Hamilton, S. K.: Development of a global inundation map at high spatial resolution from topographic downscaling of coarse-scale remote sensing data, Remote Sens. Environ., 158, 348–361, https://doi.org/10.1016/j.rse.2014.10.015, 2015.
Frey, K. E. and McClelland, J. W.: Impacts of permafrost degradation on arctic river biogeochemistry, Hydrol. Process., 169–182, https://doi.org/10.1002/hyp.7196, 2009.
Fröberg, M., Berggren, D., Bergkvist, B., Bryant, C. and Mulder, J.: Concentration and fluxes of dissolved organic carbon (DOC) in three Norway spruce stands along a climatic gradient in Sweden, Biogeochemistry, 77, 1–23, https://doi.org/10.1007/s10533-004-0564-5, 2006.
Gouttevin, I., Menegoz, M., Dominé, F., Krinner, G., Koven, C., Ciais, P., Tarnocai, C. and Boike, J.: How the insulating properties of snow affect soil carbon distribution in the continental pan-Arctic area, J. Geophys. Res.-Biogeo., 117, G02020, https://doi.org/10.1029/2011JG001916, 2012.
Graham, D. E., Wallenstein, M. D., Vishnivetskaya, T. A., Waldrop, M. P., Phelps, T. J., Pfiffner, S. M., Onstott, T. C., Whyte, L. G., Rivkina, E. M., Gilichinsky, D. A., Elias, D. A., MacKelprang, R., Verberkmoes, N. C., Hettich, R. L., Wagner, D., Wullschleger, S. D., and Jansson, J. K.: Microbes in thawing permafrost: The unknown variable in the climate change equation, ISME J., 6, 709–712, https://doi.org/10.1038/ismej.2011.163, 2012.
Guenet, B., Moyano, F. E., Peylin, P., Ciais, P., and Janssens, I. A.: Towards a representation of priming on soil carbon decomposition in the global land biosphere model ORCHIDEE (version 1.9.5.2), Geosci. Model Dev., 9, 841–855, https://doi.org/10.5194/gmd-9-841-2016, 2016.
Guenet, B., Camino-Serrano, M., Ciais, P., Tifafi, M., Maignan, F., Soong, J. L., and Janssens, I. A.: Impact of priming on global soil carbon stocks, Glob. Change Biol., 9, 841-–855, https://doi.org/10.1111/gcb.14069, 2018.
Guimberteau, M., Drapeau, G., Ronchail, J., Sultan, B., Polcher, J., Martinez, J.-M., Prigent, C., Guyot, J.-L., Cochonneau, G., Espinoza, J. C., Filizola, N., Fraizy, P., Lavado, W., De Oliveira, E., Pombosa, R., Noriega, L., and Vauchel, P.: Discharge simulation in the sub-basins of the Amazon using ORCHIDEE forced by new datasets, Hydrol. Earth Syst. Sci., 16, 911–935, https://doi.org/10.5194/hess-16-911-2012, 2012.
Guimberteau, M., Zhu, D., Maignan, F., Huang, Y., Yue, C., Dantec-Nédélec, S., Ottlé, C., Jornet-Puig, A., Bastos, A., Laurent, P., Goll, D., Bowring, S., Chang, J., Guenet, B., Tifafi, M., Peng, S., Krinner, G., Ducharne, A., Wang, F., Wang, T., Wang, X., Wang, Y., Yin, Z., Lauerwald, R., Joetzjer, E., Qiu, C., Kim, H., and Ciais, P.: ORCHIDEE-MICT (v8.4.1), a land surface model for the high latitudes: model description and validation, Geosci. Model Dev., 11, 121–163, https://doi.org/10.5194/gmd-11-121-2018, 2018.
Hastie, A., Lauerwald, R., Weyhenmeyer, G., Sobek, S., Verpoorter, C., and Regnier, P.: CO2 evasion from boreal lakes: Revised estimate, drivers of spatial variability, and future projections, Glob. Change Biol., 24, 1873–1883, https://doi.org/10.1111/gcb.13902, 2018.
Heim, B., Abramova, E., Doerffer, R., Günther, F., Hölemann, J., Kraberg, A., Lantuit, H., Loginova, A., Martynov, F., Overduin, P. P., and Wegner, C.: Ocean colour remote sensing in the southern Laptev Sea: evaluation and applications, Biogeosciences, 11, 4191–4210, https://doi.org/10.5194/bg-11-4191-2014, 2014.
Hollesen, J., Matthiesen, H., Møller, A. B., and Elberling, B.: Permafrost thawing in organic Arctic soils accelerated by ground heat production, Nat. Clim. Change, 5, 574, https://doi.org/10.1038/nclimate2590, 2015.
Holmes, R. M., McClelland, J. W., Peterson, B. J., Tank, S. E., Bulygina, E., Eglinton, T. I., Gordeev, V. V., Gurtovaya, T. Y., Raymond, P. A., Repeta, D. J., Staples, R., Striegl, R. G., Zhulidov, A. V. and Zimov, S. A.: Seasonal and Annual Fluxes of Nutrients and Organic Matter from Large Rivers to the Arctic Ocean and Surrounding Seas, Estuar. Coasts, 35, 369–382, https://doi.org/10.1007/s12237-011-9386-6, 2012.
Hugelius, G., Bockheim, J. G., Camill, P., Elberling, B., Grosse, G., Harden, J. W., Johnson, K., Jorgenson, T., Koven, C. D., Kuhry, P., Michaelson, G., Mishra, U., Palmtag, J., Ping, C.-L., O'Donnell, J., Schirrmeister, L., Schuur, E. A. G., Sheng, Y., Smith, L. C., Strauss, J., and Yu, Z.: A new data set for estimating organic carbon storage to 3 m depth in soils of the northern circumpolar permafrost region, Earth Syst. Sci. Data, 5, 393–402, https://doi.org/10.5194/essd-5-393-2013, 2013.
Hugelius, G., Strauss, J., Zubrzycki, S., Harden, J. W., Schuur, E. A. G., Ping, C.-L., Schirrmeister, L., Grosse, G., Michaelson, G. J., Koven, C. D., O'Donnell, J. A., Elberling, B., Mishra, U., Camill, P., Yu, Z., Palmtag, J., and Kuhry, P.: Estimated stocks of circumpolar permafrost carbon with quantified uncertainty ranges and identified data gaps, Biogeosciences, 11, 6573–6593, https://doi.org/10.5194/bg-11-6573-2014, 2014.
Jakobsson, M.: Hypsometry and volume of the Arctic Ocean and its constituent seas, Geochem. Geophys. Geosys., 43, 264–272, https://doi.org/10.1029/2001GC000302, 2002.
Janout, M., Hãlemann, J., Juhls, B., Krumpen, T., Rabe, B., Bauch, D., Wegner, C., Kassens, H., and Timokhov, L.: Episodic warming of near-bottom waters under the Arctic sea ice on the central Laptev Sea shelf, Geophys. Res. Lett., 43, 264–272, https://doi.org/10.1002/2015GL066565, 2016.
Jasechko, S., Kirchner, J. W., Welker, J. M., and McDonnell, J. J.: Substantial proportion of global streamflow less than three months old, Nat. Geosci., 9, 126, https://doi.org/10.1038/ngeo2636, 2016.
Kicklighter, D. W., Hayes, D. J., Mcclelland, J. W., Peterson, B. J., Mcguire, A. D., and Melillo, J. M.: Insights and issues with simulating terrestrial DOC loading of Arctic river networks, Ecol. Appl., 23, 1817–1836, https://doi.org/10.1890/11-1050.1, 2013.
Koven, C., Friedlingstein, P., Ciais, P., Khvorostyanov, D., Krinner, G., and Tarnocai, C.: On the formation of high-latitude soil carbon stocks: Effects of cryoturbation and insulation by organic matter in a land surface model, Geophys. Res. Lett., 10, 7109–7131, https://doi.org/10.1029/2009GL040150, 2009.
Koven, C. D., Riley, W. J., Subin, Z. M., Tang, J. Y., Torn, M. S., Collins, W. D., Bonan, G. B., Lawrence, D. M., and Swenson, S. C.: The effect of vertically resolved soil biogeochemistry and alternate soil C and N models on C dynamics of CLM4, Biogeosciences, 10, 7109–7131, https://doi.org/10.5194/bg-10-7109-2013, 2013.
Koven, C. D., Schuur, E. A. G., Schädel, C., Bohn, T. J., Burke, E. J., Chen, G., Chen, X., Ciais, P., Grosse, G., Harden, J. W., Hayes, D. J., Hugelius, G., Jafarov, E. E., Krinner, G., Kuhry, P., Lawrence, D. M., MacDougall, A. H., Marchenko, S. S., McGuire, A. D., Natali, S. M., Nicolsky, D. J., Olefeldt, D., Peng, S., Romanovsky, V. E., Schaefer, K. M., Strauss, J., Treat, C. C., and Turetsky, M.: A simplified, data-constrained approach to estimate the permafrost carbon-climate feedback, Philos. T. R. Soc. A, 373, 20140423, https://doi.org/10.1098/rsta.2014.0423, 2015.
Krinner, G., Viovy, N., de Noblet-Ducoudré, N., Ogée, J., Polcher, J., Friedlingstein, P., Ciais, P., Sitch, S., and Prentice, I. C.: A dynamic global vegetation model for studies of the coupled atmosphere-biosphere system, Global Biogeochem. Cy., 19, GB1015, https://doi.org/10.1029/2003GB002199, 2005.
Kunkel, K. E., Robinson, D. A., Champion, S., Yin, X., Estilow, T. and Frankson, R. M.: Trends and Extremes in Northern Hemisphere Snow Characteristics, Curr. Clim. Chang. Reports, 2, 65–73, https://doi.org/10.1007/s40641-016-0036-8, 2016.
Kutscher, L., Mörth, C. M., Porcelli, D., Hirst, C., Maximov, T. C., Petrov, R. E., and Andersson, P. S.: Spatial variation in concentration and sources of organic carbon in the Lena River, Siberia, J. Geophys. Res.-Biogeo., 122, 1999–2016, https://doi.org/10.1002/2017JG003858, 2017.
Lammers, R. B., Pundsack, J. W., and Shiklomanov, A. I.: Variability in river temperature, discharge, and energy flux from the Russian pan-Arctic landmass, J. Geophys. Res.-Biogeo., 112, G04S59, https://doi.org/10.1029/2006JG000370, 2007.
Lauerwald, R., Regnier, P., Camino-Serrano, M., Guenet, B., Guimberteau, M., Ducharne, A., Polcher, J., and Ciais, P.: ORCHILEAK (revision 3875): a new model branch to simulate carbon transfers along the terrestrial–aquatic continuum of the Amazon basin, Geosci. Model Dev., 10, 3821–3859, https://doi.org/10.5194/gmd-10-3821-2017, 2017.
Lee, H., Swenson, S. C., Slater, A. G., and Lawrence, D. M.: Effects of excess ground ice on projections of permafrost in a warming climate, Environ. Res. Lett., 9, 124006, https://doi.org/10.1088/1748-9326/9/12/124006, 2014.
Lindroos, A. J., Derome, J., Derome, K., and Smolander, A.: The effect of scots pine, norway spruce and silver birch on the chemical composition of stand throughfall and upper soil percolation water in northern Finland, Boreal Environ. Res., 16, 240–250, 2011.
MacKelprang, R., Waldrop, M. P., Deangelis, K. M., David, M. M., Chavarria, K. L., Blazewicz, S. J., Rubin, E. M., and Jansson, J. K.: Metagenomic analysis of a permafrost microbial community reveals a rapid response to thaw, Nature, 480, 368–371, https://doi.org/10.1038/nature10576, 2011.
Mann, P. J., Eglinton, T. I., McIntyre, C. P., Zimov, N., Davydova, A., Vonk, J. E., Holmes, R. M., and Spencer, R. G. M.: Utilization of ancient permafrost carbon in headwaters of Arctic fluvial networks, Nat. Commun., 6, 7856, https://doi.org/10.1038/ncomms8856, 2015.
Manning, R.: On the Flow of Water in Open Channels and Pipes, Trans. Inst. Civ. Eng. Irel., https://doi.org/10.1021/bi2010619, 1891.
Manzoni, S., Taylor, P., Richter, A., Porporato, A., and Ågren, G. I.: Environmental and stoichiometric controls on microbial carbon-use efficiency in soils, New Phytol., 196, 79–91, https://doi.org/10.1111/j.1469-8137.2012.04225.x, 2012.
McClelland, J. W., Holmes, R. M., Dunton, K. H., and Macdonald, R. W.: The Arctic Ocean Estuary, Estuar. Coasts, 25, 353–368, https://doi.org/10.1007/s12237-010-9357-3, 2012.
McClelland, J. W., Holmes, R. M., Peterson, B. J., Raymond, P. A., Striegl, R. G., Zhulidov, A. V., Zimov, S. A., Zimov, N., Tank, S. E., Spencer, R. G. M., Staples, R., Gurtovaya, T. Y., and Griffin, C. G.: Particulate organic carbon and nitrogen export from major Arctic rivers, Global Biogeochem. Cy., 30, 629–643, https://doi.org/10.1002/2015GB005351, 2016.
McGuire, A. D., Anderson, L. G., Christensen, T. R., Dallimore, S., Guo, L., Hayes, D. J., Heimann, M., Lorenson, T. D., Macdonald, R. W., and Roulet, N.: Sensitivity of the carbon cycle in the Arctic to climate change, Ecol. Monogr., 79, 523–555, https://doi.org/10.1890/08-2025.1, 2009.
Messager, M. L., Lehner, B., Grill, G., Nedeva, I., and Schmitt, O.: Estimating the volume and age of water stored in global lakes using a geo-statistical approach, Nat. Commun., 7, 13603, https://doi.org/10.1038/ncomms13603, 2016.
Mudryk, L. R., Derksen, C., Kushner, P. J. and Brown, R.: Characterization of Northern Hemisphere snow water equivalent datasets, 1981–2010, J. Climate, 28, 8037–8051, https://doi.org/10.1175/JCLI-D-15-0229.1, 2015.
Myers-Pigg, A. N., Louchouarn, P., Amon, R. M. W., Prokushkin, A., Pierce, K., and Rubtsov, A.: Labile pyrogenic dissolved organic carbon in major Siberian Arctic rivers: Implications for wildfire-stream metabolic linkages, Geophys. Res. Lett., 42, 377–385, https://doi.org/10.1002/2014GL062762, 2015.
Nachtergaele, F., van Velthuizen, H., Verelst, L., Batjes, N. H., Dijkshoorn, K., van Engelen, V. W. P., Fischer, G., Jones, A., Montanarella, L., Petri, M., Prieler, S., Shi, X., Teixera, E., and Wiberg, D.: The harmonized world soil database, Proc. 19th World Congr. Soil Sci. Soil Solut. a Chang. World, Brisbane, Aust., 1–6 August 2010, 34–37, 2010.
Ngo-Duc, T., Laval, K., Ramillien, G., Polcher, J., and Cazenave, A.: Validation of the land water storage simulated by Organising Carbon and Hydrology in Dynamic Ecosystems (ORCHIDEE) with Gravity Recovery and Climate Experiment (GRACE) data, Water Resour. Res., 43, https://doi.org/10.1029/2006WR004941, 2007.
O'Donnell, J. A., Aiken, G. R., Swanson, D. K., Panda, S., Butler, K. D., and Baltensperger, A. P.: Dissolved organic matter composition of Arctic rivers: Linking permafrost and parent material to riverine carbon, Global Biogeochem. Cy., 30, 1811–1826, https://doi.org/10.1002/2016GB005482, 2016.
Oki, T., Nishimura, T., and Dirmeyer, P. A.: Assessment of annual runoff from land surface models using Total Runoff Integrating Pathways (TRIP), J. Meteorol. Soc. Jpn., 77, 235–255, 1999.
Parton, W. J., Schimel, D. S., Cole, C. V., and Ojima, D. S.: Analysis of Factors Controlling Soil Organic Matter Levels in Great Plains Grasslands, Soil Sci. Soc. Am. J., 51, 1173–1179, 1987.
Pekel, J.-F., Cottam, A., Gorelick, N., and Belward, A. S.: Global Surface Water – Data Users Guide (JRC) High-resolution mapping of global surface water and its long-term changes, Nature, 540, p. 418, https://doi.org/10.1038/nature20584, 2016.
Peterson, B. J., Holmes, R. M., McClelland, J. W., Vörösmarty, C. J., Lammers, R. B., Shiklomanov, A. I., Shiklomanov, I. A., and Rahmstorf, S.: Increasing river discharge to the Arctic Ocean, Science, 298, 2171–2173, https://doi.org/10.1126/science.1077445, 2002.
Ponomarev, E. I., Kharuk, V. I., and Ranson, K. J.: Wildfires dynamics in Siberian larch forests, Forests, 7, p. 125, https://doi.org/10.3390/f7060125, 2016.
Prigent, C., Papa, F., Aires, F., Rossow, W. B. and Matthews, E.: Global inundation dynamics inferred from multiple satellite observations, 1993–2000, J. Geophys. Res. Atmos., 112, D12107, https://doi.org/10.1029/2006JD007847, 2007.
Qiu, C., Zhu, D., Ciais, P., Guenet, B., Krinner, G., Peng, S., Aurela, M., Bernhofer, C., Brümmer, C., Bret-Harte, S., Chu, H., Chen, J., Desai, A. R., Dušek, J., Euskirchen, E. S., Fortuniak, K., Flanagan, L. B., Friborg, T., Grygoruk, M., Gogo, S., Grünwald, T., Hansen, B. U., Holl, D., Humphreys, E., Hurkuck, M., Kiely, G., Klatt, J., Kutzbach, L., Largeron, C., Laggoun-Défarge, F., Lund, M., Lafleur, P. M., Li, X., Mammarella, I., Merbold, L., Nilsson, M. B., Olejnik, J., Ottosson-Löfvenius, M., Oechel, W., Parmentier, F.-J. W., Peichl, M., Pirk, N., Peltola, O., Pawlak, W., Rasse, D., Rinne, J., Shaver, G., Schmid, H. P., Sottocornola, M., Steinbrecher, R., Sachs, T., Urbaniak, M., Zona, D., and Ziemblinska, K.: ORCHIDEE-PEAT (revision 4596), a model for northern peatland CO2, water, and energy fluxes on daily to annual scales, Geosci. Model Dev., 11, 497–519, https://doi.org/10.5194/gmd-11-497-2018, 2018.
Raymond, P. A., McClelland, J. W., Holmes, R. M., Zhulidov, A. V., Mull, K., Peterson, B. J., Striegl, R. G., Aiken, G. R. and Gurtovaya, T. Y.: Flux and age of dissolved organic carbon exported to the Arctic Ocean: A carbon isotopic study of the five largest arctic rivers, Global Biogeochem. Cy., 21, GB4011, https://doi.org/10.1029/2007GB002934, 2007.
Rhein, M., Rintoul, S., Aoki, S., Campos, E., Chambers, D., Feely, R. A., Gulev, S., Johnson, G., Josey, S., Kostianoy, A., Mauritzen, C., Roemmich, D., Talley, L., Wang, F., and IPCC: Observations: Ocean, in: Climate Change 2013: The Physical Science Basis. Contribution of Working Group I to the Fifth Assessment Report of the Intergovernmental Panel on Climate Change, 2013.
Rosenqvist, L., Hansen, K., Vesterdal, L., and van der Salm, C.: Water balance in afforestation chronosequences of common oak and Norway spruce on former arable land in Denmark and southern Sweden, Agr. Forest Meteorol., 150, 196–207, https://doi.org/10.1016/j.agrformet.2009.10.004, 2010.
Schuur, E. A. G., Vogel, J. G., Crummer, K. G., Lee, H., Sickman, J. O., and Osterkamp, T. E.: The effect of permafrost thaw on old carbon release and net carbon exchange from tundra, Nature, 459, p. 556, https://doi.org/10.1038/nature08031, 2009.
Schuur, E. A. G., McGuire, A. D., Schädel, C., Grosse, G., Harden, J. W., Hayes, D. J., Hugelius, G., Koven, C. D., Kuhry, P., Lawrence, D. M., Natali, S. M., Olefeldt, D., Romanovsky, V. E., Schaefer, K., Turetsky, M. R., Treat, C. C., and Vonk, J. E.: Climate change and the permafrost carbon feedback, Nature, 520, p. 171, https://doi.org/10.1038/nature14338, 2015.
Selvam, B. P., Lapierre, J. F., Guillemette, F., Voigt, C., Lamprecht, R. E., Biasi, C., Christensen, T. R., Martikainen, P. J., and Berggren, M.: Degradation potentials of dissolved organic carbon (DOC) from thawed permafrost peat, Sci. Rep., 7, 45811, https://doi.org/10.1038/srep45811, 2017.
Serreze, M. C. and Barry, R. G.: Processes and impacts of Arctic amplification: A research synthesis, Global Planet. Change, 77, 85–96, https://doi.org/10.1016/j.gloplacha.2011.03.004, 2011.
Shakhova, N., Semiletov, I., Sergienko, V., Lobkovsky, L., Yusupov, V., Salyuk, A., Salomatin, A., Chernykh, D., Kosmach, D., Panteleev, G., Nicolsky, D., Samarkin, V., Joye, S., Charkin, A., Dudarev, O., Meluzov, A. and Gustafsson, O.: The East Siberian Arctic Shelf: Towards further assessment of permafrost-related methane fluxes and role of sea ice, Philos. T. R. Soc. A, 373, 20140451, https://doi.org/10.1098/rsta.2014.0451, 2015.
Smith, L. C. and Pavelsky, T. M.: Estimation of river discharge, propagation speed, and hydraulic geometry from space: Lena River, Siberia, Water Resour. Res., 44, W03427, https://doi.org/10.1029/2007WR006133, 2008.
Sorokin, Y. I. and Sorokin, P. Y.: Plankton and primary production in the Lena River Estuary and in the south-eastern Laptev sea, Estuar. Coast. Shelf S., 43, 399–418, https://doi.org/10.1006/ecss.1996.0078, 1996.
Spencer, R. G. M., Mann, P. J., Dittmar, T., Eglinton, T. I., McIntyre, C., Holmes, R. M., Zimov, N., and Stubbins, A.: Detecting the signature of permafrost thaw in Arctic rivers, Geophys. Res. Lett., 42, 2830–2835, https://doi.org/10.1002/2015GL063498, 2015.
Starr, M., Lindroos, A. J., Ukonmaanaho, L., Tarvainen, T. and Tanskanen, H.: Weathering release of heavy metals from soil in comparison to deposition, litterfall and leaching fluxes in a remote, boreal coniferous forest, Appl. Geochem., 18, 607–613, https://doi.org/10.1016/S0883-2927(02)00157-9, 2003.
Steele, M. and Ermold, W.: Loitering of the retreating sea ice edge in the Arctic Seas, J. Geophys. Res.-Oceans, 120, 7699–7721, https://doi.org/10.1002/2015JC011182, 2015.
Stroeve, J. C., Markus, T., Boisvert, L., Miller, J., and Barrett, A.: Changes in Arctic melt season and implications for sea ice loss, Geophys. Res. Lett., 41, 1216–1225, https://doi.org/10.1002/2013GL058951, 2014.
Stubbins, A., Mann, P. J., Powers, L., Bittar, T. B., Dittmar, T., McIntyre, C. P., Eglinton, T. I., Zimov, N., and Spencer, R. G. M.: Low photolability of yedoma permafrost dissolved organic carbon, J. Geophys. Res.-Biogeo., 122, 200–211, https://doi.org/10.1002/2016JG003688, 2017.
Suzuki, K., Konohira, E., Yamazaki, Y., Kubota, J., Ohata, T., and Vuglinsky, V.: Transport of organic carbon from the Mogot Experimental Watershed in the southern mountainous taiga of eastern Siberia, Hydrol. Res., 37, 303–312, https://doi.org/10.2166/nh.2006.015, 2006.
Suzuki, K., Matsuo, K., Yamazaki, D., Ichii, K., Iijima, Y., Papa, F., Yanagi, Y., and Hiyama, T.: Hydrological variability and changes in the Arctic circumpolar tundra and the three largest pan-Arctic river basins from 2002 to 2016, Remote Sens., 10, 402, https://doi.org/10.3390/rs10030402, 2018.
Tank, S. E., Fellman, J. B., Hood, E., and Kritzberg, E. S.: Beyond respiration: Controls on lateral carbon fluxes across the terrestrial-aquatic interface, Limnol. Oceanogr. Lett., 3, 76–88, https://doi.org/10.1002/lol2.10065, 2018.
Tarnocai, C., Canadell, J. G., Schuur, E. A. G., Kuhry, P., Mazhitova, G., and Zimov, S.: Soil organic carbon pools in the northern circumpolar permafrost retion, Global Biogeochem. Cy., 23, Gb2023 https://doi.org/10.1029/2008gb003327, 2009.
Tootchi, A., Jost, A., and Ducharne, A.: Multi-source global wetland maps combining surface water imagery and groundwater constraints, Earth Syst. Sci. Data, 11, 189–220, https://doi.org/10.5194/essd-11-189-2019, 2019.
van Vliet, M. T. H., Yearsley, J. R., Franssen, W. H. P., Ludwig, F., Haddeland, I., Lettenmaier, D. P., and Kabat, P.: Coupled daily streamflow and water temperature modelling in large river basins, Hydrol. Earth Syst. Sci., 16, 4303–4321, https://doi.org/10.5194/hess-16-4303-2012, 2012.
Van Vliet, M. T. H., Franssen, W. H. P., Yearsley, J. R., Ludwig, F., Haddeland, I., Lettenmaier, D. P., and Kabat, P.: Global river discharge and water temperature under climate change, Glob. Environ. Chang., 23, 450–464, https://doi.org/10.1016/j.gloenvcha.2012.11.002, 2013.
Venkiteswaran, J. J., Schiff, S. L., and Wallin, M. B.: Large carbon dioxide fluxes from headwater boreal and sub-boreal streams, PLoS One, 9, e101756, https://doi.org/10.1371/journal.pone.0101756, 2014.
Vitousek, P. M. and Hobbie, S.: Heterotrophic nitrogen fixation in decomposing litter: Patterns and regulation, Ecology, 81, 2366–2376, 2000.
Vitousek, P. M. and Sanford, R. L.: Nutrient Cycling in Moist Tropical Forest, Ecology, 17, 137–167 https://doi.org/10.1146/annurev.es.17.110186.001033, 1986.
Vonk, J. E., Mann, P. J., Davydov, S., Davydova, A., Spencer, R. G. M., Schade, J., Sobczak, W. V., Zimov, N., Zimov, S., Bulygina, E., Eglinton, T. I., and Holmes, R. M.: High biolability of ancient permafrost carbon upon thaw, Geophys. Res. Lett., 40, 2689–2693, https://doi.org/10.1002/grl.50348, 2013.
Vonk, J. E., Tank, S. E., Mann, P. J., Spencer, R. G. M., Treat, C. C., Striegl, R. G., Abbott, B. W., and Wickland, K. P.: Biodegradability of dissolved organic carbon in permafrost soils and aquatic systems: a meta-analysis, Biogeosciences, 12, 6915–6930, https://doi.org/10.5194/bg-12-6915-2015, 2015a.
Vonk, J. E., Tank, S. E., Bowden, W. B., Laurion, I., Vincent, W. F., Alekseychik, P., Amyot, M., Billet, M. F., Canário, J., Cory, R. M., Deshpande, B. N., Helbig, M., Jammet, M., Karlsson, J., Larouche, J., MacMillan, G., Rautio, M., Walter Anthony, K. M., and Wickland, K. P.: Reviews and syntheses: Effects of permafrost thaw on Arctic aquatic ecosystems, Biogeosciences, 12, 7129–7167, https://doi.org/10.5194/bg-12-7129-2015, 2015b.
Vörösmarty, C. J., Fekete, B. M., Meybeck, M., and Lammers, R. B.: Global system of rivers: Its role in organizing continental land mass and defining land-To-Ocean linkages, Global Biogeochem. Cy., 14, 599–621, https://doi.org/10.1029/1999GB900092, 2000.
Walz, J., Knoblauch, C., Böhme, L., and Pfeiffer, E. M.: Regulation of soil organic matter decomposition in permafrost-affected Siberian tundra soils – Impact of oxygen availability, freezing and thawing, temperature, and labile organic matter, Soil Biol. Biochem., 110, 34–43, https://doi.org/10.1016/j.soilbio.2017.03.001, 2017.
Wang, T., Ottlé, C., Boone, A., Ciais, P., Brun, E., Morin, S., Krinner, G., Piao, S., and Peng, S.: Evaluation of an improved intermediate complexity snow scheme in the ORCHIDEE land surface model, J. Geophys. Res.-Atmos., 118, 6064–6079, https://doi.org/10.1002/jgrd.50395, 2013.
Wanninkhof, R.: Relationship between wind speed and gas exchange over the ocean revisited, Limnol. Oceanogr.-Meth., 12, 351–362, https://doi.org/10.4319/lom.2014.12.351, 2014.
Wanninkhof, R. H.: Relationship between wind speed and gas exchange, J. Geophys. Res., 97, 7373–7382, https://doi.org/10.1029/92JC00188, 1992.
Whitefield, J., Winsor, P., McClelland, J., and Menemenlis, D.: A new river discharge and river temperature climatology data set for the pan-Arctic region, Ocean Model., 88, 1–15, https://doi.org/10.1016/j.ocemod.2014.12.012, 2015.
Wickland, K. P., Waldrop, M. P., Aiken, G. R., Koch, J. C., Jorgenson, M. T., and Striegl, R. G.: Dissolved organic carbon and nitrogen release from boreal Holocene permafrost and seasonally frozen soils of Alaska, Environ. Res. Lett., 13, 065011, https://doi.org/10.1088/1748-9326/aac4ad, 2018.
Wild, B., Schnecker, J., Alves, R. J. E., Barsukov, P., Bárta, J., Čapek, P., Gentsch, N., Gittel, A., Guggenberger, G., Lashchinskiy, N., Mikutta, R., Rusalimova, O., Šantrůčková, H., Shibistova, O., Urich, T., Watzka, M., Zrazhevskaya, G., and Richter, A.: Input of easily available organic C and N stimulates microbial decomposition of soil organic matter in arctic permafrost soil, Soil Biol. Biochem., 75, 143–151, https://doi.org/10.1016/j.soilbio.2014.04.014, 2014.
Wild, B., Gentsch, N., Capek, P., Diáková, K., Alves, R. J. E., Bárta, J., Gittel, A., Hugelius, G., Knoltsch, A., Kuhry, P., Lashchinskiy, N., Mikutta, R., Palmtag, J., Schleper, C., Schnecker, J., Shibistova, O., Takriti, M., Torsvik, V. L., Urich, T., Watzka, M., Šantrūcková, H., Guggenberger, G., and Richter, A.: Plant-derived compounds stimulate the decomposition of organic matter in arctic permafrost soils, Sci. Rep., 6, 25607–25607, https://doi.org/10.1038/srep25607, 2016.
Woods, G. C., Simpson, M. J., Pautler, B. G., Lamoureux, S. F., Lafrenière, M. J., and Simpson, A. J.: Evidence for the enhanced lability of dissolved organic matter following permafrost slope disturbance in the Canadian High Arctic, Geochim. Cosmochim. Ac., 75, 7226–7241, https://doi.org/10.1016/j.gca.2011.08.013, 2011.
Wu, Y., Clarke, N., and Mulder, J.: Dissolved organic carbon concentrations in throughfall and soil waters at level II monitoring plots in norway: Short- and long-term variations, Water. Air. Soil Pollut., 205, 273–288, https://doi.org/10.1007/s11270-009-0073-1, 2010.
Xue, K.: Tundra soil carbon is vulnerable to rapid microbial decomposition under climatewarming, Nat. Clim. Change, 6, 595–600, https://doi.org/10.1038/NCLIMATE2940, 2017.
Ye, B., Yang, D., Zhang, Z., and Kane, D. L.: Variation of hydrological regime with permafrost coverage over Lena Basin in Siberia, J. Geophys. Res.-Atmos., 114, D07102, https://doi.org/10.1029/2008JD010537, 2009.
Yu, Z.: Holocene carbon flux histories of the world's peatlands: Global carbon-cycle implications, Holocene, 21, 761–774, https://doi.org/10.1177/0959683610386982, 2011.
Yue, C., Ciais, P., Zhu, D., Wang, T., Peng, S. S., and Piao, S. L.: How have past fire disturbances contributed to the current carbon balance of boreal ecosystems?, Biogeosciences, 13, 675–690, https://doi.org/10.5194/bg-13-675-2016, 2016.
Zhang, K., Kimball, J. S., Mu, Q., Jones, L. A., Goetz, S. J., and Running, S. W.: Satellite based analysis of northern ET trends and associated changes in the regional water balance from 1983 to 2005, J. Hydrol., 379, 92–110, https://doi.org/10.1016/j.jhydrol.2009.09.047, 2009.
Zhang, X., Hutchings, J. A., Bianchi, T. S., Liu, Y., Arellano, A. R., and Schuur, E. A. G.: Importance of lateral flux and its percolation depth on organic carbon export in Arctic tundra soil: Implications from a soil leaching experiment, J. Geophys. Res.-Biogeo., 122, 796–810, https://doi.org/10.1002/2016JG003754, 2017.
Zhu, D., Peng, S., Ciais, P., Zech, R., Krinner, G., Zimov, S., and Grosse, G.: Simulating soil organic carbon in yedoma deposits during the Last Glacial Maximum in a land surface model, Geophys. Res. Lett., 43, 5133–5142, https://doi.org/10.1002/2016GL068874, 2016.
Zubrzycki, S., Kutzbach, L., Grosse, G., Desyatkin, A., and Pfeiffer, E.-M.: Organic carbon and total nitrogen stocks in soils of the Lena River Delta, Biogeosciences, 10, 3507–3524, https://doi.org/10.5194/bg-10-3507-2013, 2013.
unlockedby warming is globally significant. One way it can be mobilised is into rivers, the sea, or the atmosphere: a vector previously ignored in climate modelling. We present a model scheme for resolving this vector at a global scale.