the Creative Commons Attribution 4.0 License.
the Creative Commons Attribution 4.0 License.
 | 03 May 2019
Calibration and analysis of the uncertainty in downscaling global land use and land cover projections from GCAM using Demeter (v1.0.0)
Chris R. Vernon
Maoyi Huang
Katherine V. Calvin
Ian P. Kraucunas
Demeter is a community spatial downscaling model that disaggregates land use and land cover changes projected by integrated human–Earth system models. Demeter has not been intensively calibrated, and we still lack good knowledge about its sensitivity to key parameters and parameter uncertainties. We used long-term global satellite-based land cover records to calibrate key Demeter parameters. The results identified the optimal parameter values and showed that the parameterization substantially improved the model's performance. The parameters of intensification ratio and selection threshold were the most sensitive and needed to be carefully tuned, especially for regional applications. Further, small parameter uncertainties after calibration can be inflated when propagated into future scenarios, suggesting that users should consider the parameterization equifinality to better account for the uncertainties in Demeter-downscaled products. Our study provides a key reference for Demeter users and ultimately contributes to reducing the uncertainties in Earth system model simulations.
- Article
(4084 KB) - Full-text XML
-
Supplement
(3838 KB) - BibTeX
- EndNote


Land use and land cover change (LULCC) represents one of the most important human impacts on the Earth system (Hibbard et al., 2017). Besides its socioeconomic effects, LULCC is directly linked to many natural land surface processes, such as land surface energy balance and the carbon and water cycle (e.g., Piao et al., 2007; Law et al., 2018; Sleeter et al., 2018; Pongratz et al., 2006), and indirectly affects the climate system (e.g., Dickinson and Kennedy, 1992; Findell et al., 2017; Costa and Foley, 2000). Thus, LULCC has been considered a key process in simulating Earth system dynamics, and LULCC inputs at appropriate time steps and spatial resolutions are required to match the setup of Earth system models (ESMs) and the nature of the spatial heterogeneity of Earth system processes (Brovkin et al., 2013; Lawrence et al., 2016; Prestele et al., 2017).
While recent historical LULCC information can be obtained by ground investigation or satellite remote sensing (Friedl et al., 2002; Hansen et al., 2000; Loveland et al., 2000; Zhang et al., 2003), projections of future LULCC largely rely on mathematical models that bring socioeconomic and other diverse sectoral information together in a coherent framework to simulate the interactions between natural and human systems. However, these integrated models project LULCC at subregional level, i.e., the basic spatial units that have uniform properties for every sector (e.g., agricultural, energy, and water, etc.), typically ranging from a few hundred to millions of square kilometers (Edmonds et al., 2012). For example, the Global Change Assessment Model (GCAM) has been widely used to explore future societal and environmental scenarios under different climate mitigation policies, which provides LULCC projections at the regional–agroecological or water basin level (Edmonds et al., 1997; Edmonds and Reilly, 1985; Kim et al., 2006). ESMs divide the Earth's surface into a number of grid cells and the forcing data have to be available at the same spatial resolution to drive the ESMs (Taylor et al., 2012). Therefore, spatial downscaling of subregional LULCC has become a critical step for linking models like GCAM and ESMs to investigate the effects of LULCC on processes in the natural world and further the interactions between human and natural systems (Hibbard and Janetos, 2013; Lawrence et al., 2012).
There have been a few spatial disaggregation studies for LULCC, e.g., the Global Land Use Model (Hurtt et al., 2011) and a dynamic global land use model (Meiyappan et al., 2014), with various geographical and socioeconomic assumptions. In previous studies, we have developed a new simple and efficient LULCC downscaling model, named Demeter (version 1.0.0), to bridge GCAM and ESMs (Le Page et al., 2016; Vernon et al., 2018; West et al., 2014) and made it available online at https://doi.org/10.5281/zenodo.1214342. Compared to other models, Demeter makes minimal assumptions on socioeconomic impacts. Instead, it uses a few parameters to implicitly characterize the spatial patterns of land use changes (see introductions in Sect. 2.1). Demeter has been successfully applied at both global (Le Page et al., 2016) and regional (West et al., 2014) levels for downscaling GCAM-projected land use and land cover changes and has been further developed with an extensible output module that streamlines the production of specific output formats required by various ESMs (Vernon et al., 2018). However, Demeter's parameters (discussed in Sect. 2.1), which include many geographic patterns of long-term land cover changes such as intensification and expansion, are difficult to determine by either literature review or simple mathematical calculations. Therefore, Demeter's parameter values were empirically determined, and a complete analysis of Demeter's parametric sensitivity and uncertainties, as well as a rigorous model calibration, has not been conducted to help minimize the propagation of downscaling errors. In recent years, a growing number of long-term global remote-sensing-based LULCC datasets have been made available (e.g., the Land Cover project of the European Space Agency (ESA) Climate Change Initiative, MODIS Land Cover product collection 6), so it has become possible to use these datasets to calibrate Demeter parameters. The major objective of this study is to develop a framework for calibrating the key parameters of Demeter, testing and quantifying the parameter sensitivities and uncertainties, and demonstrating how the parameter uncertainties would affect downscaled products.
2.1 Demeter
Demeter is a land use and land cover change downscaling model, which is designed to disaggregate projections of land allocations generated by GCAM and other models. For example, GCAM projects land cover areas in each of its spatial units (e.g., regional agroecological zones, referred to here as regional AEZs) for each land cover type, and Demeter uses gridded observational land cover data (e.g., satellite-based land cover product) as the reference spatial distribution for land cover types and allocates the GCAM-projected land area changes to grid level at a target spatial resolution, following some user-defined rules and spatial constraints (Fig. S1). Below we briefly summarize the key processes of Demeter, and the detailed algorithms can be found in three earlier publications (Le Page et al., 2016; Vernon et al., 2018; West et al., 2014).
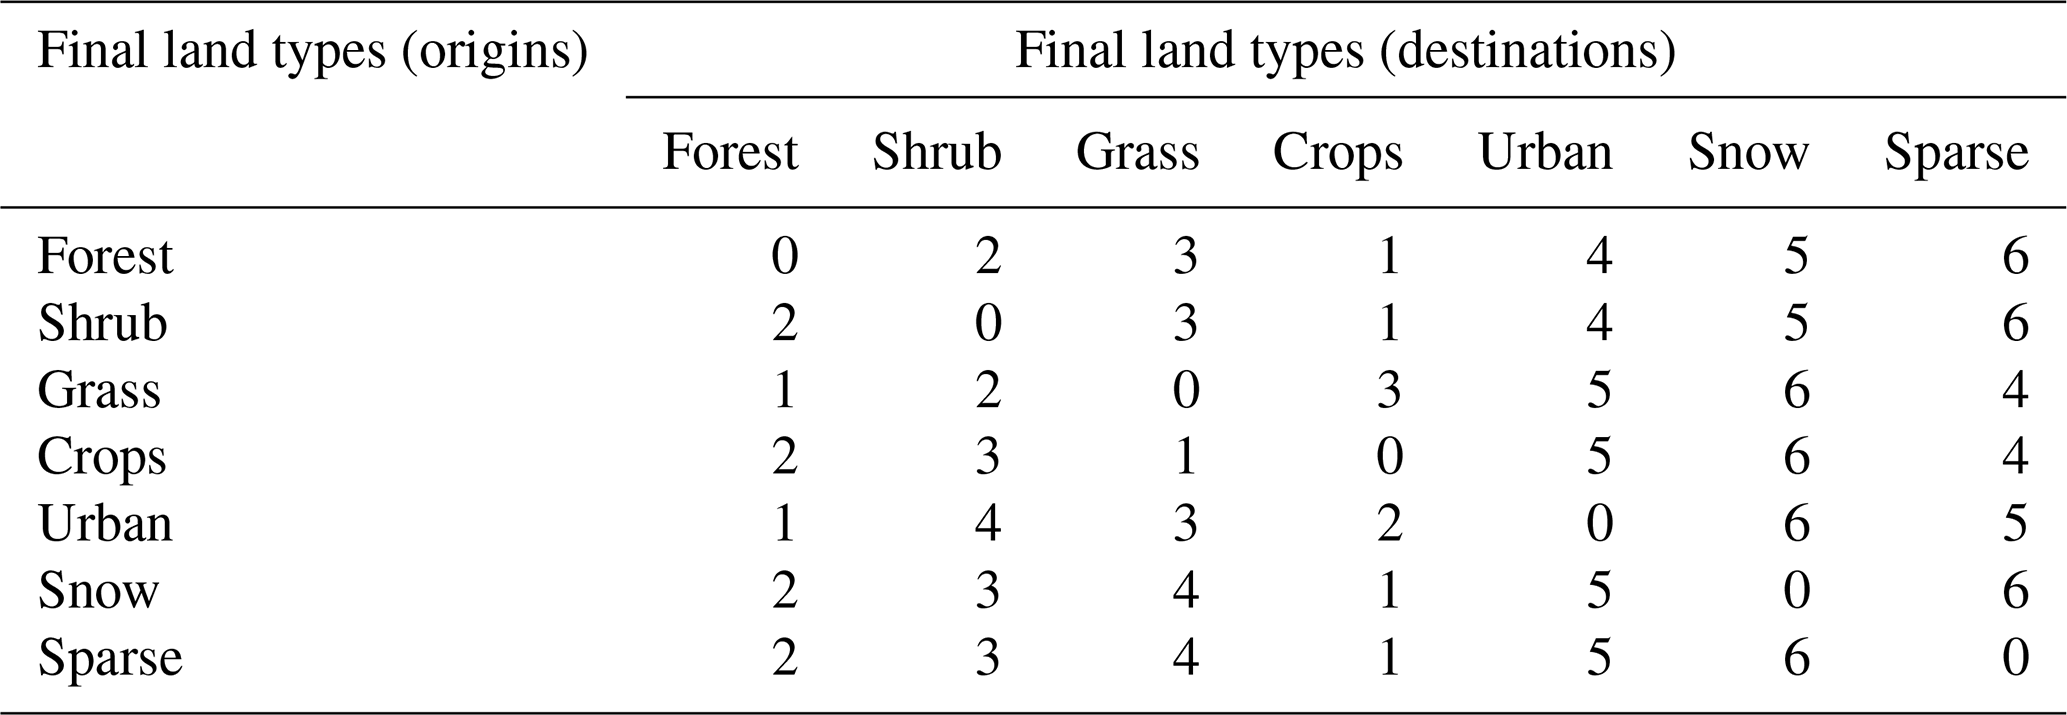
Demeter first reconciles the land cover classes defined in the parent model and the reference dataset to user-defined unified final land types (FLTs). Downscaled land cover types will be presented in FLTs. For example, if Demeter reclassifies the 22 GCAM land cover types and the 16 International Geosphere–Biosphere Programme (IGBP) land cover types from the reference dataset into seven FLTs (forest, shrub, grass, crops, urban, and sparse), the seven FLTs will be the land types represented in Demeter's outputs by default. Demeter then harmonizes the GCAM-projected land cover areas and the reference dataset at the first time step (or “base year”) to make sure they are consistent with the GCAM spatial units and allocates the projected land cover changes by intensification and extensification. Intensification is the process of increasing a particular land cover in a grid cell in which it already exists, while extensification creates new land cover in grid cells in which it does not yet exist but is in proximity to an existing allocation. The order of transitions among land cover types is defined by “transition priorities” during the processes of intensification and extensification. A parameter (r, from 0 to 1) is defined as the ratio of intensification, and thus 1−r of the land cover change is for extensification. Proximal relationships are defined by spatial constraints that determine the probability that a grid cell may contain a particular land use or land cover class. The current Demeter setup includes three spatial constraints: kernel density (KD), soil workability (SW), and nutrient availability (NA). KD measures the probability density of a land cover type around a given grid cell, and SW and NA are normalized scalars (0–1) for agricultural suitability. For each land cover type and grid cell, KD is calculated by the spatial distance (D) at the runtime, and SW and NA are estimated from the Harmonized World Soil Database (HWSD, FAO/IIASA/ISRIC/ISSCAS/JRC, 2012). A suitability index (SI) from 0 to 1 is defined as the weighted average of the three spatial constraints to assess how suitable a grid cell is to receive a land cover type:
where wK, wS, and wN are the weights for KD, SW, and NA, respectively, and the sum of them is 1. In the process of extensification, Demeter ranks candidate grid cells based on their suitability indices and selects the most suitable candidate grid cells following a user-defined threshold percentage (τ) for extensification. In other words, τ determines the number of grid cells to be selected and used for the tentative and actual conversion of land cover types.
Table 1Transition priorities by analyzing the 24-year global land cover records from the Land Cover CCI project of the European Space Agency Climate Change Initiative. The rows and columns represent the origins and destinations of the transitions, respectively. The smaller numbers indicate higher transition priorities.
2.2 Calibrate Demeter with historical land cover record and sensitivity analysis
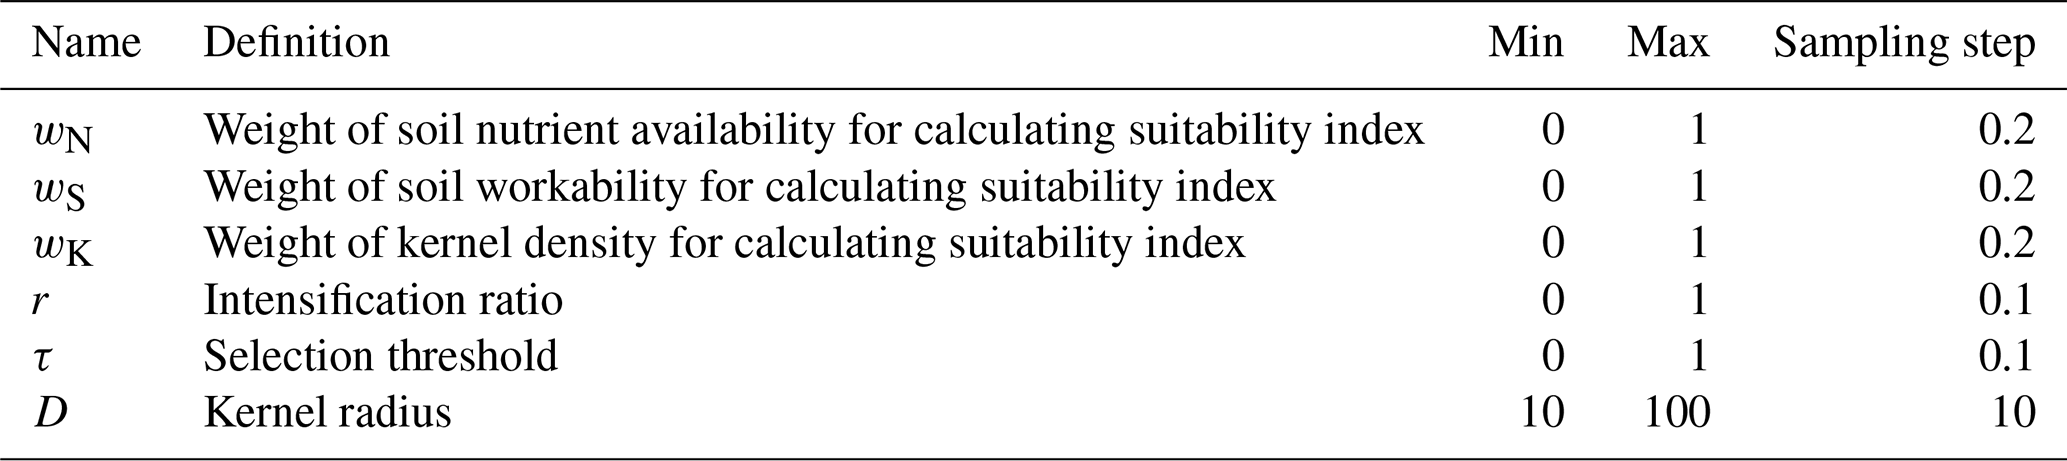
As indicated above, users should define a few parameters, including the treatment order, the transition priorities for allocating the land cover changes, the intensification ratio r, the selection threshold τ, the radius for calculating kernel density D, and weights for the spatial constraints (wK, wS, and wN), in order to use Demeter for downscaling projected land cover change. These parameters were determined empirically in previous studies. Here we calibrated these parameters for Demeter using a time series of global land cover records from the Land Cover project of the European Space Agency Climate Change Initiative (referred to as CCI-LC products hereafter). The CCI-LC products have been generated by critically revisiting all algorithms required for the generation of a global land cover product from various Earth observation (EO) instruments, thus providing a globally consistent land cover record over 2 decades (1992–2015). The CCI-LC products are available at 300 m spatial resolution with an annual time step and classify the global land cover into 38 groups. We reclassified the CCI-LC products into the seven default FLTs (Table S1) and resampled them into 0.25∘ resolution with the official software tools, following the description of CCI-LC products in the user guide (http://maps.elie.ucl.ac.be/CCI/viewer/download/ESACCI-LC-Ph2-PUGv2_2.0.pdf, last access: 18 April 2019). Figure 1 shows large interannual global changes for the seven FLT areas, especially for the forests and croplands, which have decreased and increased over 0.6 million km2 over the past 2 decades, respectively. We used the gridded 0.25∘ CCI-LC over the 24-year period as observational data (below referred to “LC-grid-obs”) and aggregated them into GCAM's regional AEZ level to produce a synthetic GCAM-projected land cover change (below referred to “LC-AEZ-syn”). In this way, we can apply Demeter to LC-AEZ-syn to calibrate Demeter with the LC-grid-obs by tuning the parameters of Demeter.
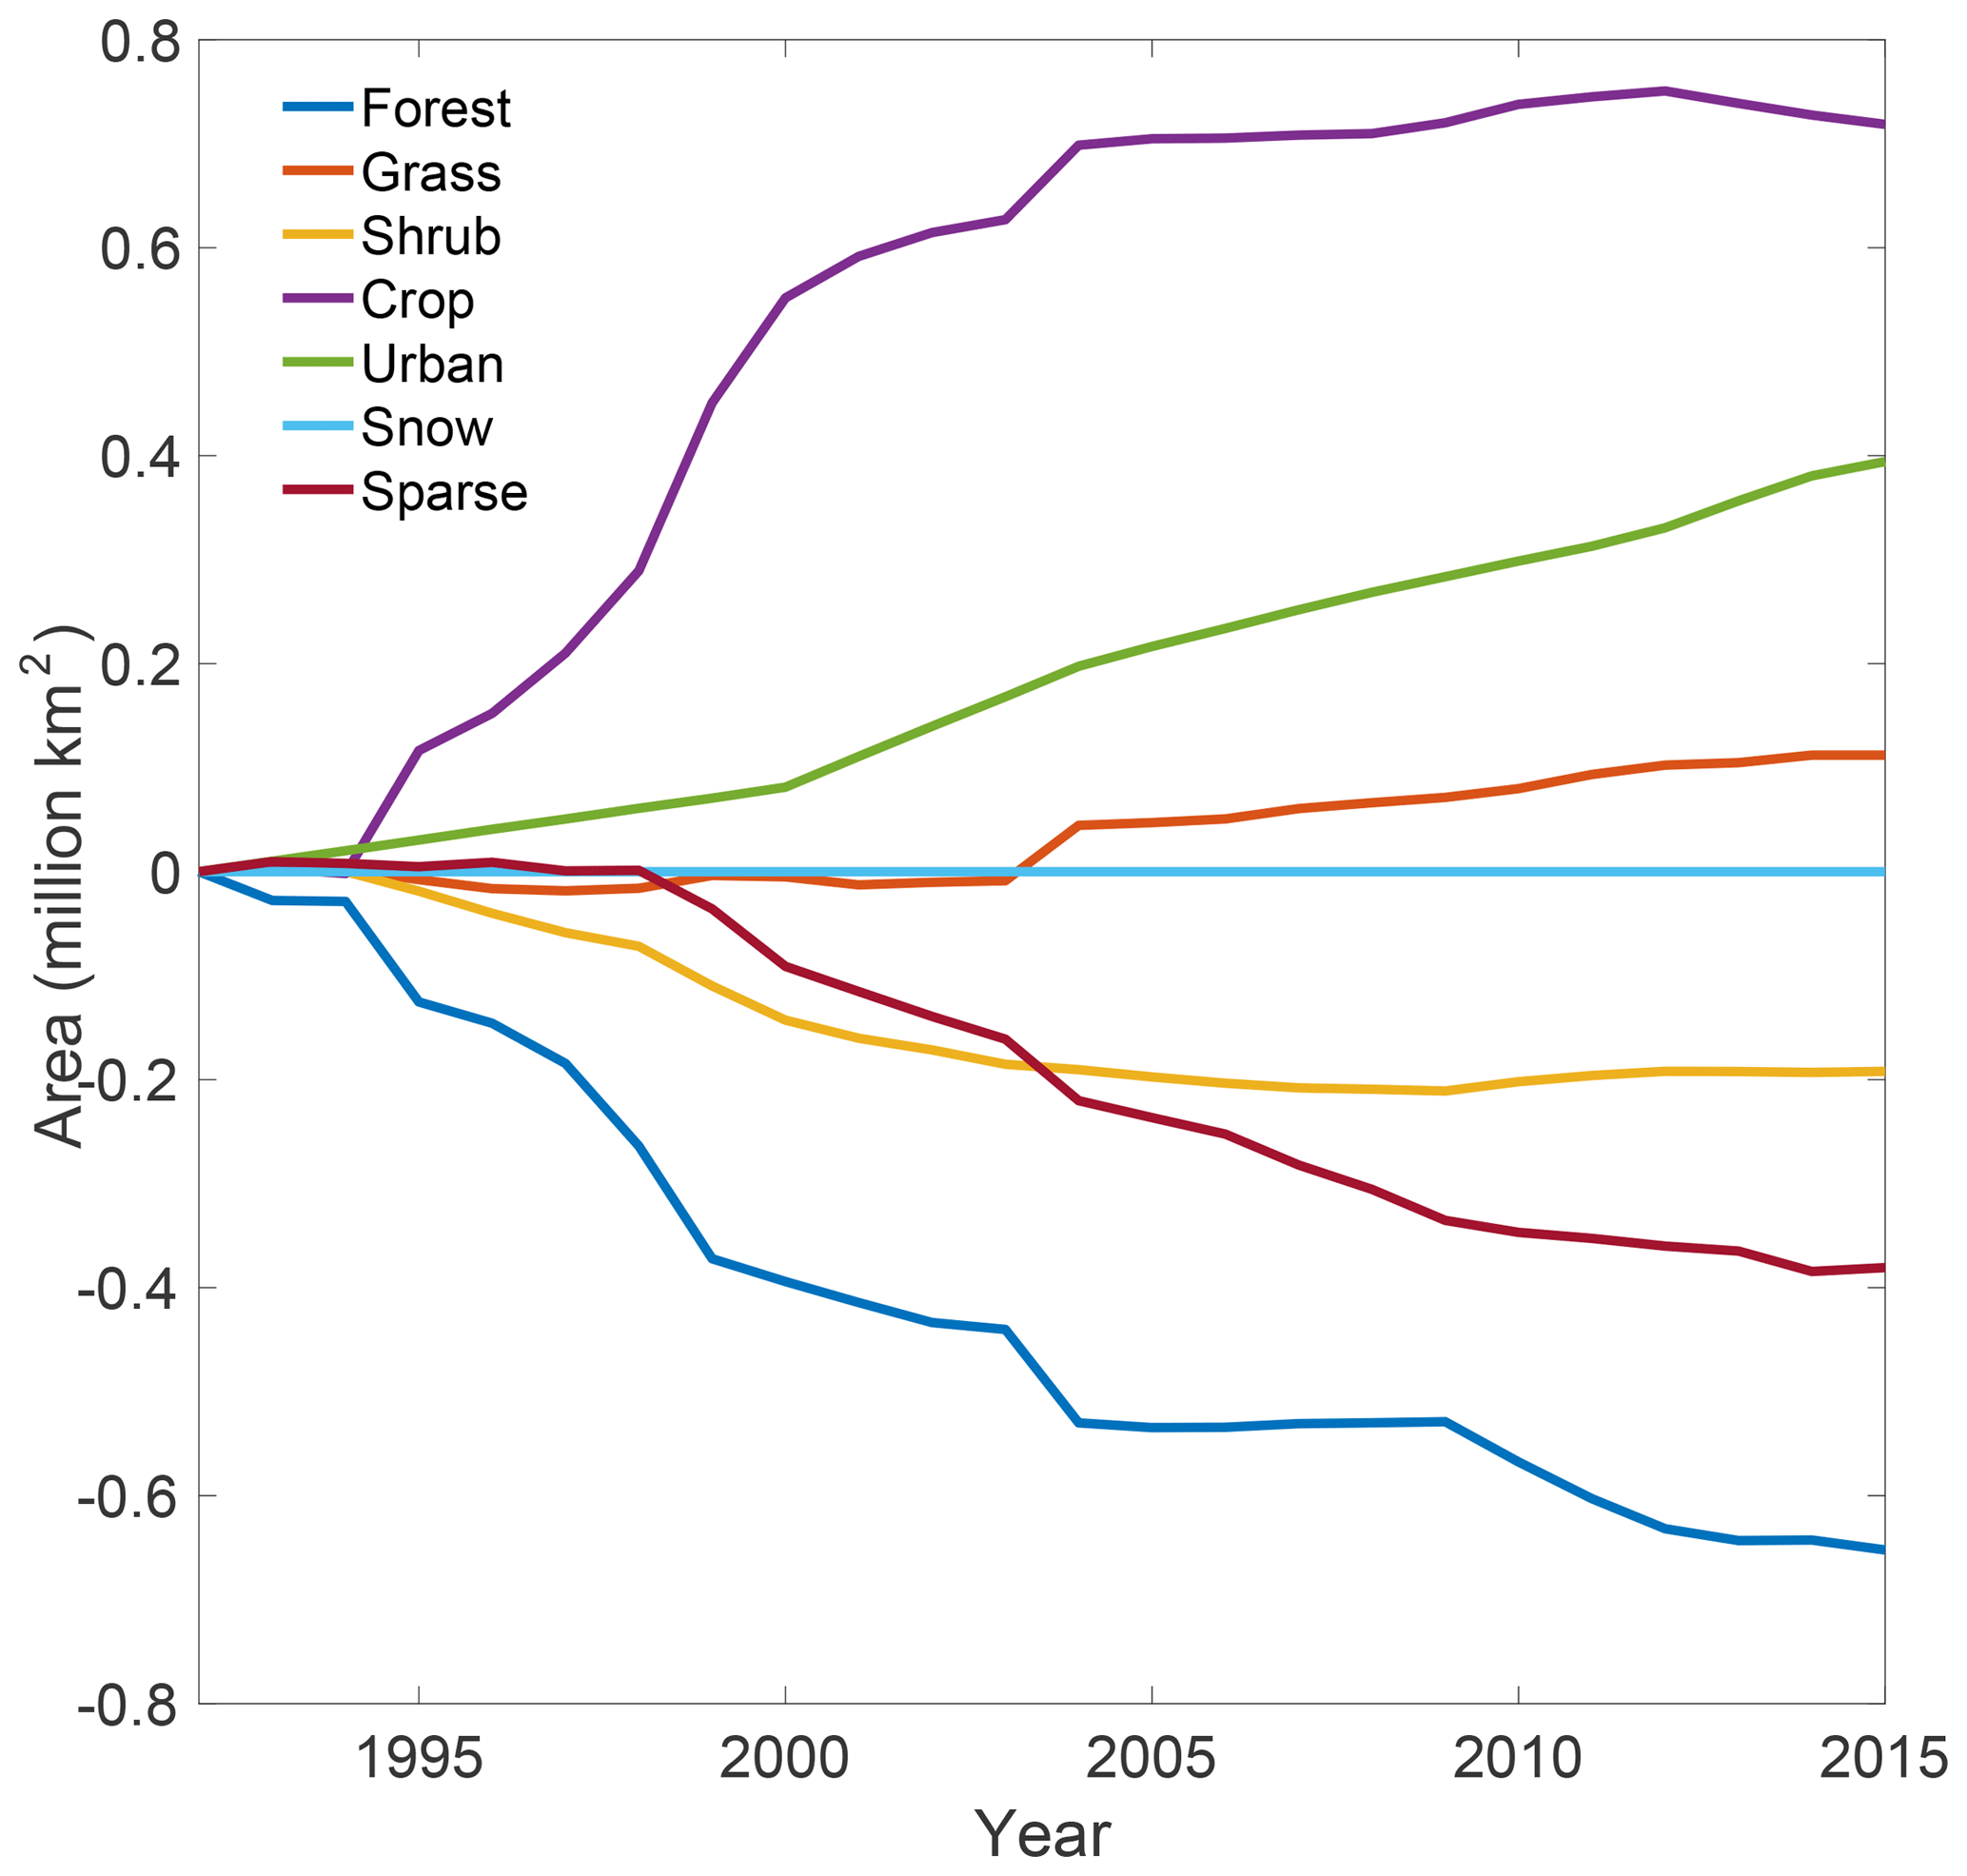
Figure 1Interannual changes in global final land type (FLT) areas over 1992–2015 relative to 1992, as indicated by the ESA CCI-LC product.
A preliminary sensitivity analysis of Demeter indicated that the downscaled results are less sensitive to treatment order and transition priorities (Le Page et al., 2016), and thus we used the default treatment order, i.e., from least to greatest: urban, snow, sparse, crops, forest, grass, shrub. We decided the transition priorities by sorting the probabilities of transitioning one FLT to another based on the 24-year CCI-LC record (Table 1). To calibrate the other six parameters (r, τ, wK, wS, wN, and D), we sampled their values at equal intervals (Table 2) and generated all possible combinations (23 100 in total) for a Monte Carlo ensemble Demeter downscaling experiment using LC-AEZ-syn as the input. The Monte Carlo experiment generated 23 100 sets of downscaled 0.25∘ global land use and land cover areas, which were compared against LC-grid-obs to calculate their similarities to the observational data, ranked by their discrepancies from the least to greatest to determine the likelihood of the parameters. We calculated the discrepancies as the root mean square error (Ey) between the downscaled and observed land cover areas for each year,
and the average of the discrepancies over the years (E):
where g is the index for G grid cells over the globe (G= 265 852), l is the index for the L FLTs (L=8), and y is the index for Y years. We chose 1992, 2000, 2005, 2010, and 2015 to be consistent with the GCAM time steps, and thus Y=5. Ad and Ao are the downscaled and observational land cover areas for grid cell g, FLT l, and year y. The unit for Ey and E is km2.
To test the model sensitivity to these key parameters, we conducted a sensitivity analysis using the results from the Monte Carlo experiment. The first-order and total-order Sobol sensitivity indices were used to identify the model sensitivity to each of the six parameters (Saltelli et al., 2004). Let θi denote the ith parameter (, here n=6), and ε is the model outputs (i.e., the discrepancies between downscaled and observed land cover areas); the first-order Sobol index (Si) is defined as
Here Var and E are the statistical variance and expectation. And the total-order Sobol index (ST,i) is defined as the sum of sensitivity indices at any order involved parameter θi, where denotes the nth-order sensitivity index.
The first-order Sobol index represents the contribution to the output variance of the main effect of θi, and therefore it measures the effect of varying θi alone; the total-order Sobol index measures the contribution to output variance of θi and includes all variance caused by its interactions with other parameters. Larger Sobol indices indicate higher parameter sensitivities.
Table 2Key parameters and their sampling range and steps for calibration in this study.
2.3 Propagate the parameter uncertainties to GCAM LULCC downscaling
We selected parameter combinations that produced the smallest 5 % and 10 % of E values based on their rankings from the Monte Carlo experiment and used them as “acceptable” parameters to represent the parameter uncertainties after calibration (Fig. 2). We used Demeter with these parameters to downscale the GCAM-projected LULCC at a 5-year time step from 2005 to 2100 under a reference scenario to examine the uncertainties of land cover areas for each FLT to demonstrate how different downscaled LULCC can be induced by uncertain parameters. The reference scenario is a business-as-usual case with no explicit climate mitigation efforts that reaches a high radiative forcing level of over 7 W m−2 in 2100. We only saved the downscaling results in 2005, 2010, 2050, and 2100 considering the size of the output files and computational cost. Finally, we calculated the standard deviation across the downscaled land cover areas for each FLT driven by different parameter combinations, which indicates the parameter-induced model uncertainties.
3.1 Parameter estimation and sensitivity
The Monte Carlo Demeter experiment driven by the 23 100 ensemble parameter sets produced diverse downscaled LULCC realizations. As shown in Fig. 2a, the disagreements between the downscaled FLT fraction and the reference record, measured by the average root mean square error (E, Eq. 3) for all the FLTs and grid cells over the five years (1992, 2000, 2005, 2010, and 2015), are mainly distributed between 8 and 17 km2 (about 1 %–3 % of the area of a 0.25∘ grid cell).

Figure 2(a) Histogram of E values, i.e., the global average discrepancies between the downscaled and observed land cover areas with the 23 100 ensemble parameter sets; the vertical dashed line in (a) shows the interval of the “acceptable” 5 % parameters, as described in Sect. 2.3. (b) The probability density of each of the acceptable 5 % parameters, as shown by the violin plots; the black lines across the six parameters show all the acceptable 5 % parameter sets, and the red line indicates the global optimal parameter values; the box plots and horizontal bar inside the violin plots indicate the interquartile ranges and the mean of the parameter values, respectively. (c) Same as (b) but showing the “best” 10 % parameter sets. Note that the values of D were divided by 100 for the purpose of illustration in (b) and (c).
Figure 3 shows the relationship between the values of the six parameters and their corresponding E values resulting from the Monte Carlo experiment. We found that the E values are significantly correlated with all six parameters (p<0.01). The intensification ratio (r) has the strongest linear correlation with the E values (R2=0.64), followed by the selection threshold (τ) (R2=0.24). Overall, the parameters wK and τ are positively correlated with E values (positive slopes of the trend lines), while wN, wS, r, and D hold negative correlations, indicating that smaller wK and τ, and larger wN, wS, r, and D, are associated with smaller E values.
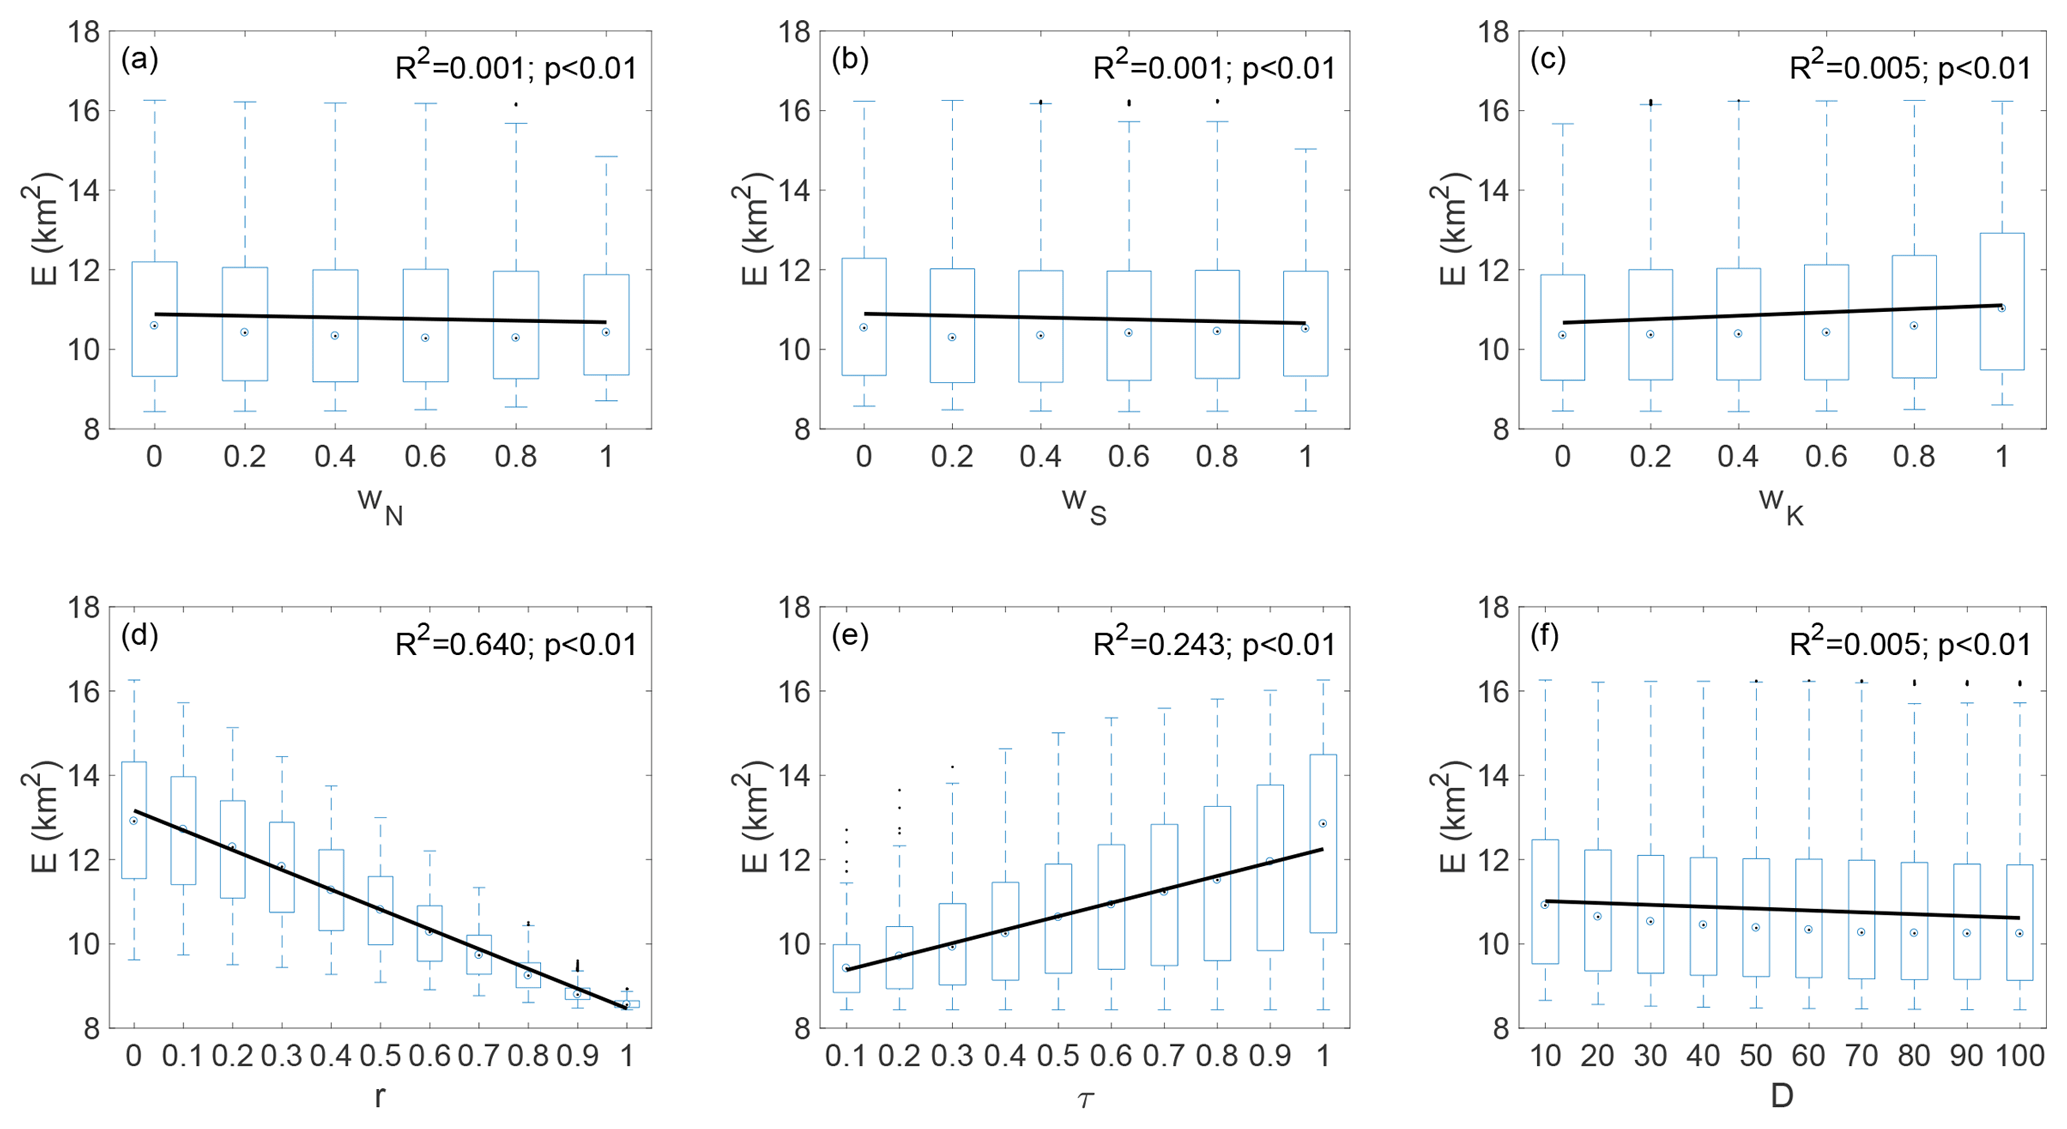
Figure 3Relationships between the six Demeter parameters and the global average discrepancies between the downscaled and observed land cover areas (E values) resulted from the Monte Carlo ensemble experiment. Box plots shows the distributions of the E values, and the solid lines show the linear trends.
Figure 4 shows the first-order and total-order Sobol indices calculated with the parameter ensemble and the associated E values. As indicated by the first-order Sobol indices, the intensification ratio r directly contributes about 59 % to the variability of the E values, followed by the selection threshold τ and kernel radius D, which directly contribute 29 % and 1 % to the variability of the E values. The other parameters (wN, wS, and wK) have few direct contributions to the E variability. The total-order Sobol indices showed a similar order of parameter importance; r and its interactions with other parameters contributed about 70 % of the E variability, τ contributed about 40 %, D contributed about 3 %, and wN, wS, and wK contributed 2 % each. It is clear that the downscaling error is most sensitive to the intensification ratio, followed by the selection threshold, but not sensitive to the kernel radius and the weighting factors of the spatial constraints.
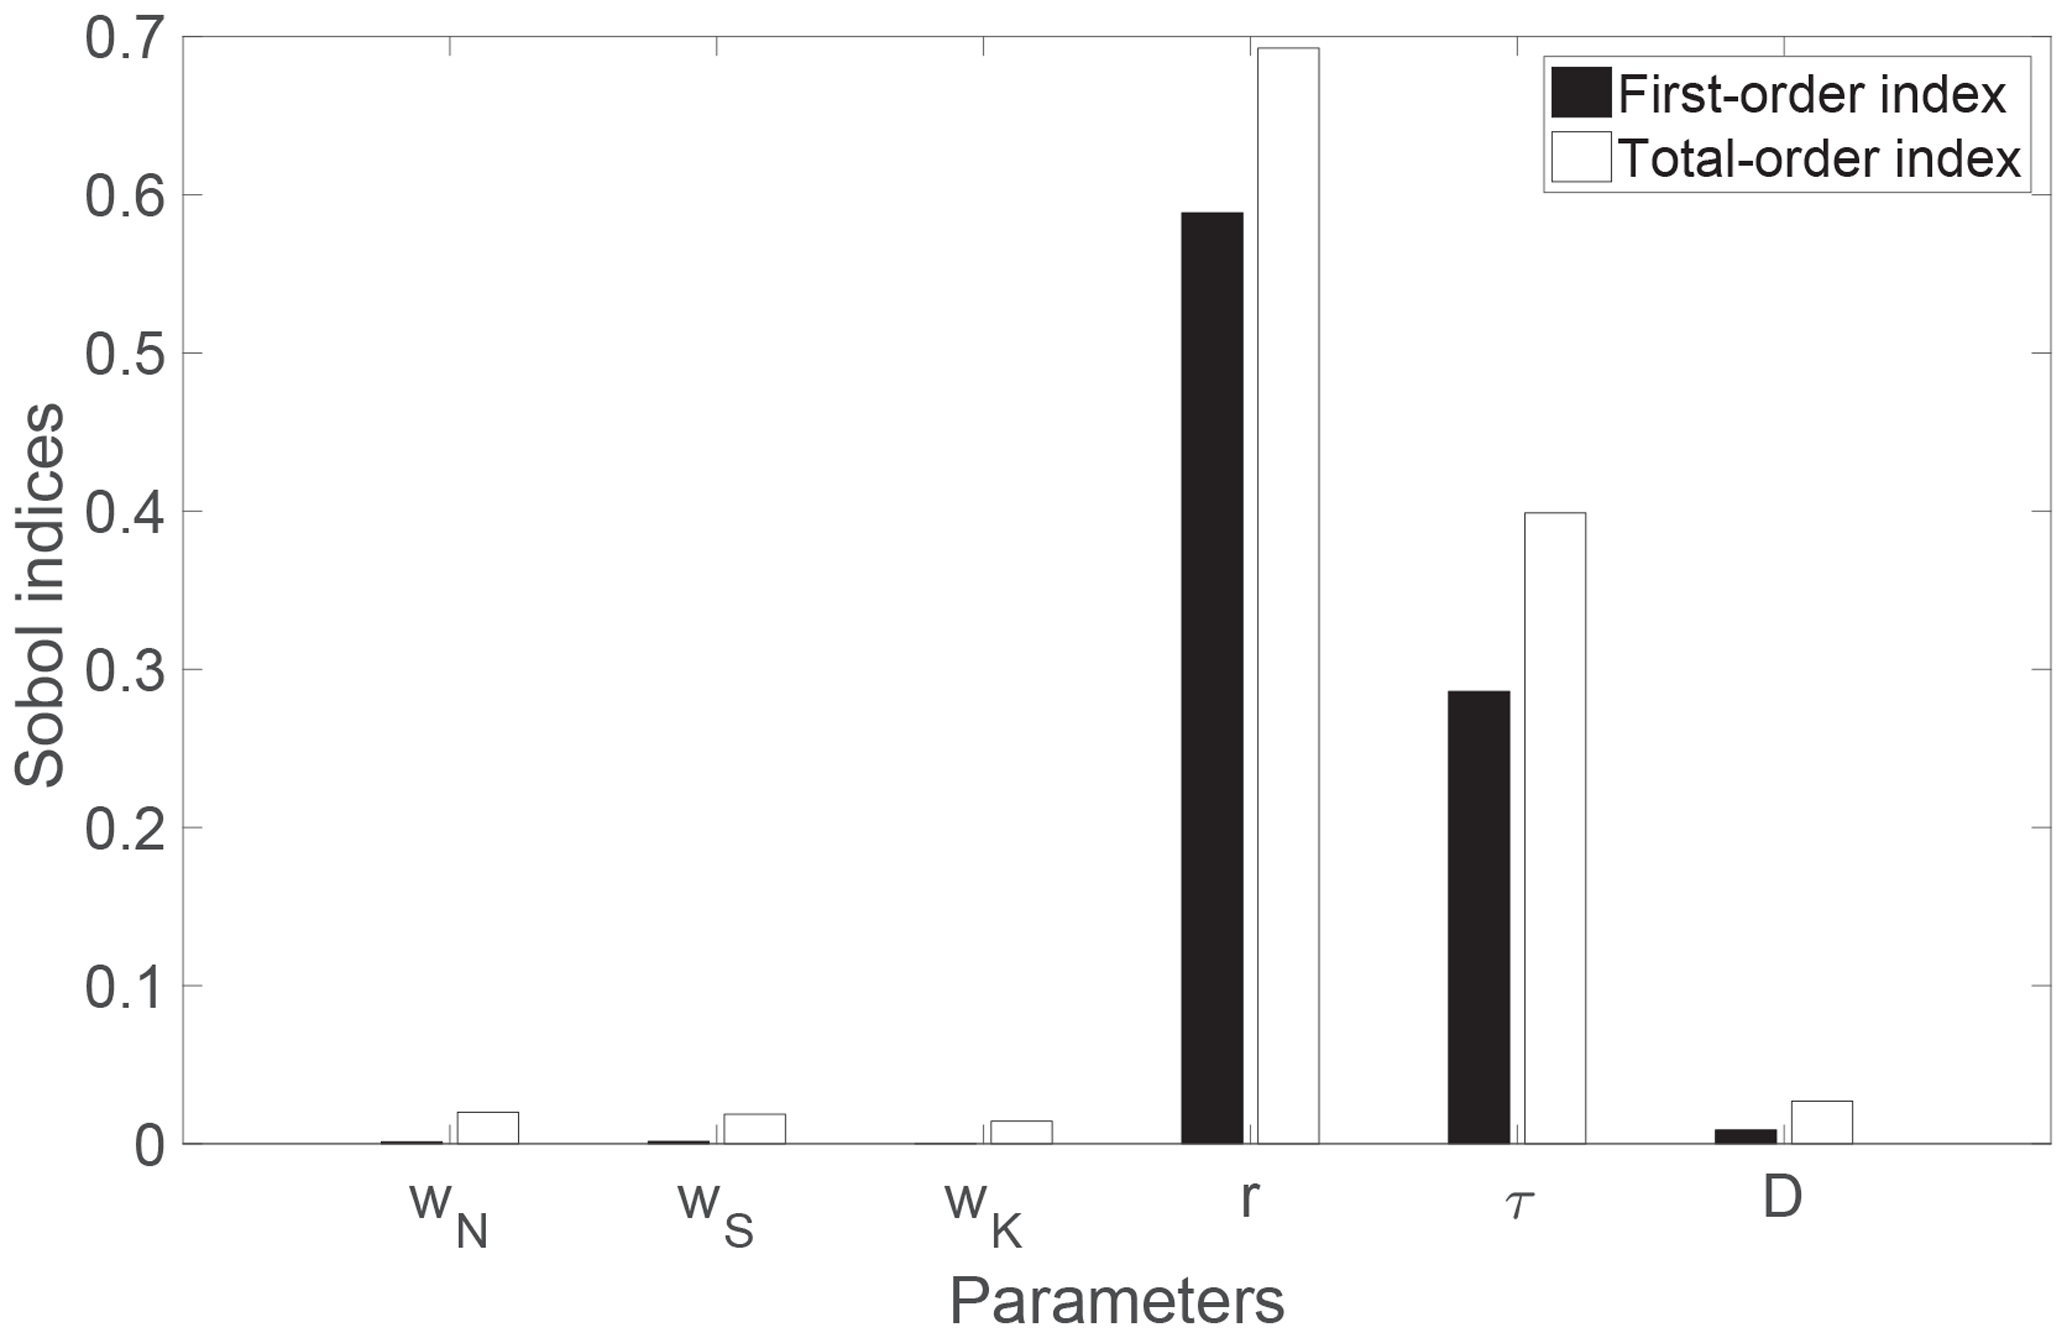
Figure 4Sobol sensitivity indices for the six Demeter parameters. Higher indices indicate higher sensitivities.
We identified the “best” parameters, which are associated with the lowest E, and marked them as the red line in Fig. 2b. We also selected acceptable parameters that have E values lower than the 5 % quantile in Fig. 2a (hereafter referred to as the “top 5 % parameters”) and thus have a similar performance as the best parameters (differences of E<1 %); we used them to represent the uncertainty of the parameters shown as the probability density distributions in Fig. 2b. The best wN, wS, wK, r, τ, and D are 0, 0.6, 0.4, 1, 0.6, and 100, respectively. All the parameters are constrained with the calibration compared to their uniform prior distributions. The intensification ratio r has been constrained into a small range (0.9–1.0 and mostly 1.0) from 0 to 1.0. Constraints on the other parameters are relatively weaker: wN, wS, and wK have been narrowed to the ranges of 0–0.8, 0.2–1.0, and 0–0.8 and primarily distributed in 0–0.4, 0.2–0.6, and 0–0.4 (the first and third quantiles), respectively; τ and D have been constrained into the range of 0.2–1.0 and 30–100 with the first and third quantiles being 0.2–0.8 and 40–90, respectively. This analysis again indicates that r is the most sensitive parameter, and therefore its posterior distribution can be significantly narrowed through the calibration. In addition, we also selected the acceptable parameters that have E values lower than the 10 % quantile (top 10 % parameters), as shown in Fig. 2a and c. Similar distributions of the top 10 % parameters are found as those of the top 5 % parameters, with some small extension on the ranges of 5 % parameters.
3.2 Performance of Demeter in downscaling LULCC
Demeter generally performs well in downscaling synthetic land use and land cover change with small disagreements with the reference data. For all FLTs, the disagreements between the downscaled FLT fraction and the reference record in 1992 (i.e., E1992 in Eq. 2) are close to zero since we used it as the harmonization year. The disagreements in 2000 (E2000) are mainly distributed in a range between 5 and 15 km2 (about 1 %–2 % of a 0.25∘ grid cell), with the median about 10 km2 and the mean slightly above 12 km2 (Fig. 5h). The disagreements increase over years at a rate of about 1 km2 per 5-year time step and reach 13–24 km2 (median: 15 km2; mean: 18 km2) in 2015. Overall, the average disagreements over the five years (E) are mainly distributed in 8–17 km2 (also shown in Fig. 2a), with a median of about 10 km2 and a mean of about 12 km2.
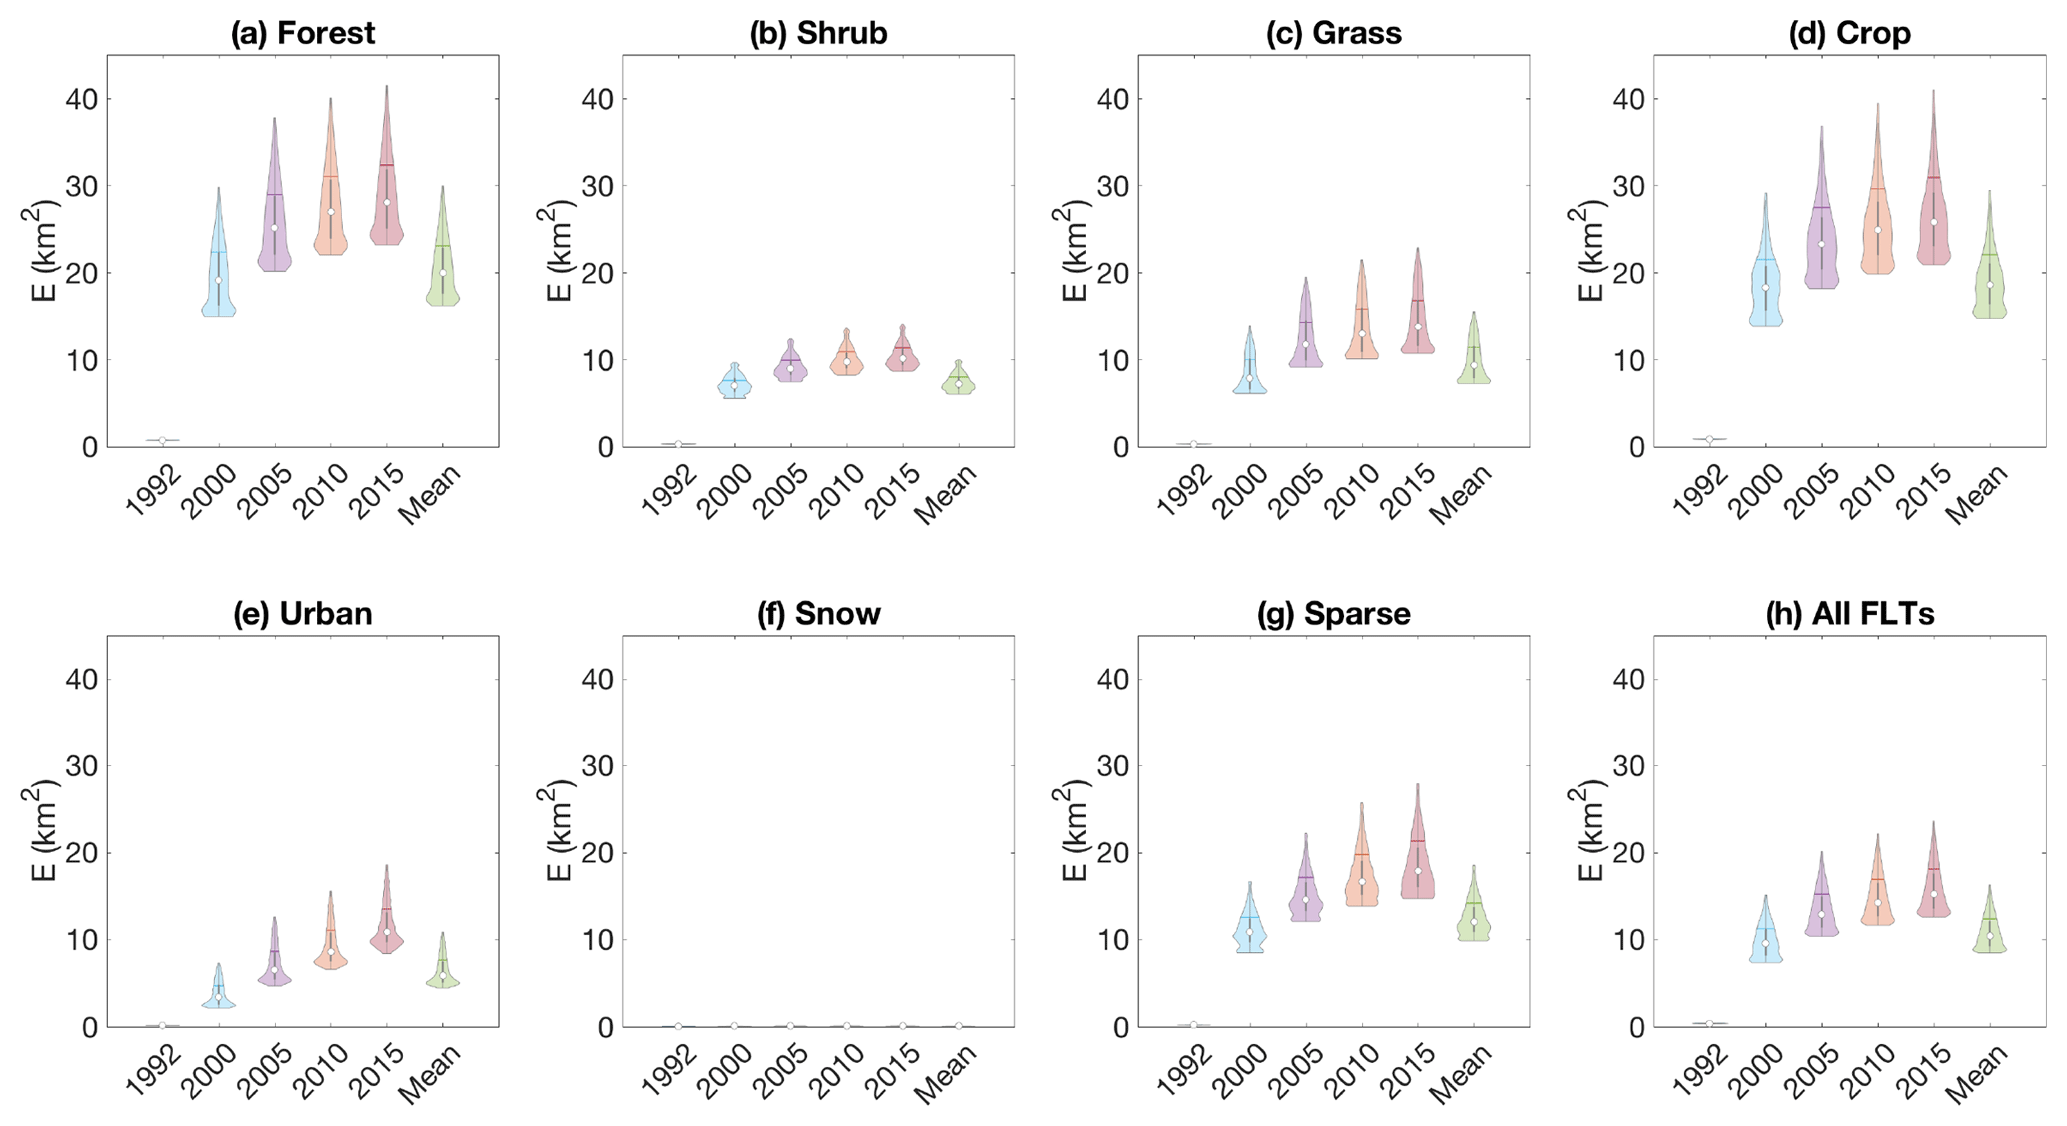
Figure 5Possibility densities for the E values between downscaled and observational final land type areas for 1992, 2000, 2005, 2010, 2015, and the mean of the five time steps. The box plots and horizontal bar inside the violin plots indicate the interquartile ranges and the mean of the parameter values, respectively. Note that the E values for snow are close to 0 and thus not visible in the figure.
The errors for each of the FLTs follow the same increasing trend over the years. Forest and crops have the largest disagreements between the downscaled and reference distributions with the errors primarily located in the range of 20–40 km2 on average over the five time steps (Fig. 5a, d). The errors for sparse lands are relatively smaller, which mainly fall into the range of 10–20 km2 (Fig. 5g), followed by grass, shrub, and urban, with the errors mainly distributed in 0–10 km2 on average over the five years. Errors for snow are near zero since there was little areal change for this FLT in the CCI-LC record (Fig. 1), and little LULCC allocation was needed in the downscaling process over the years.
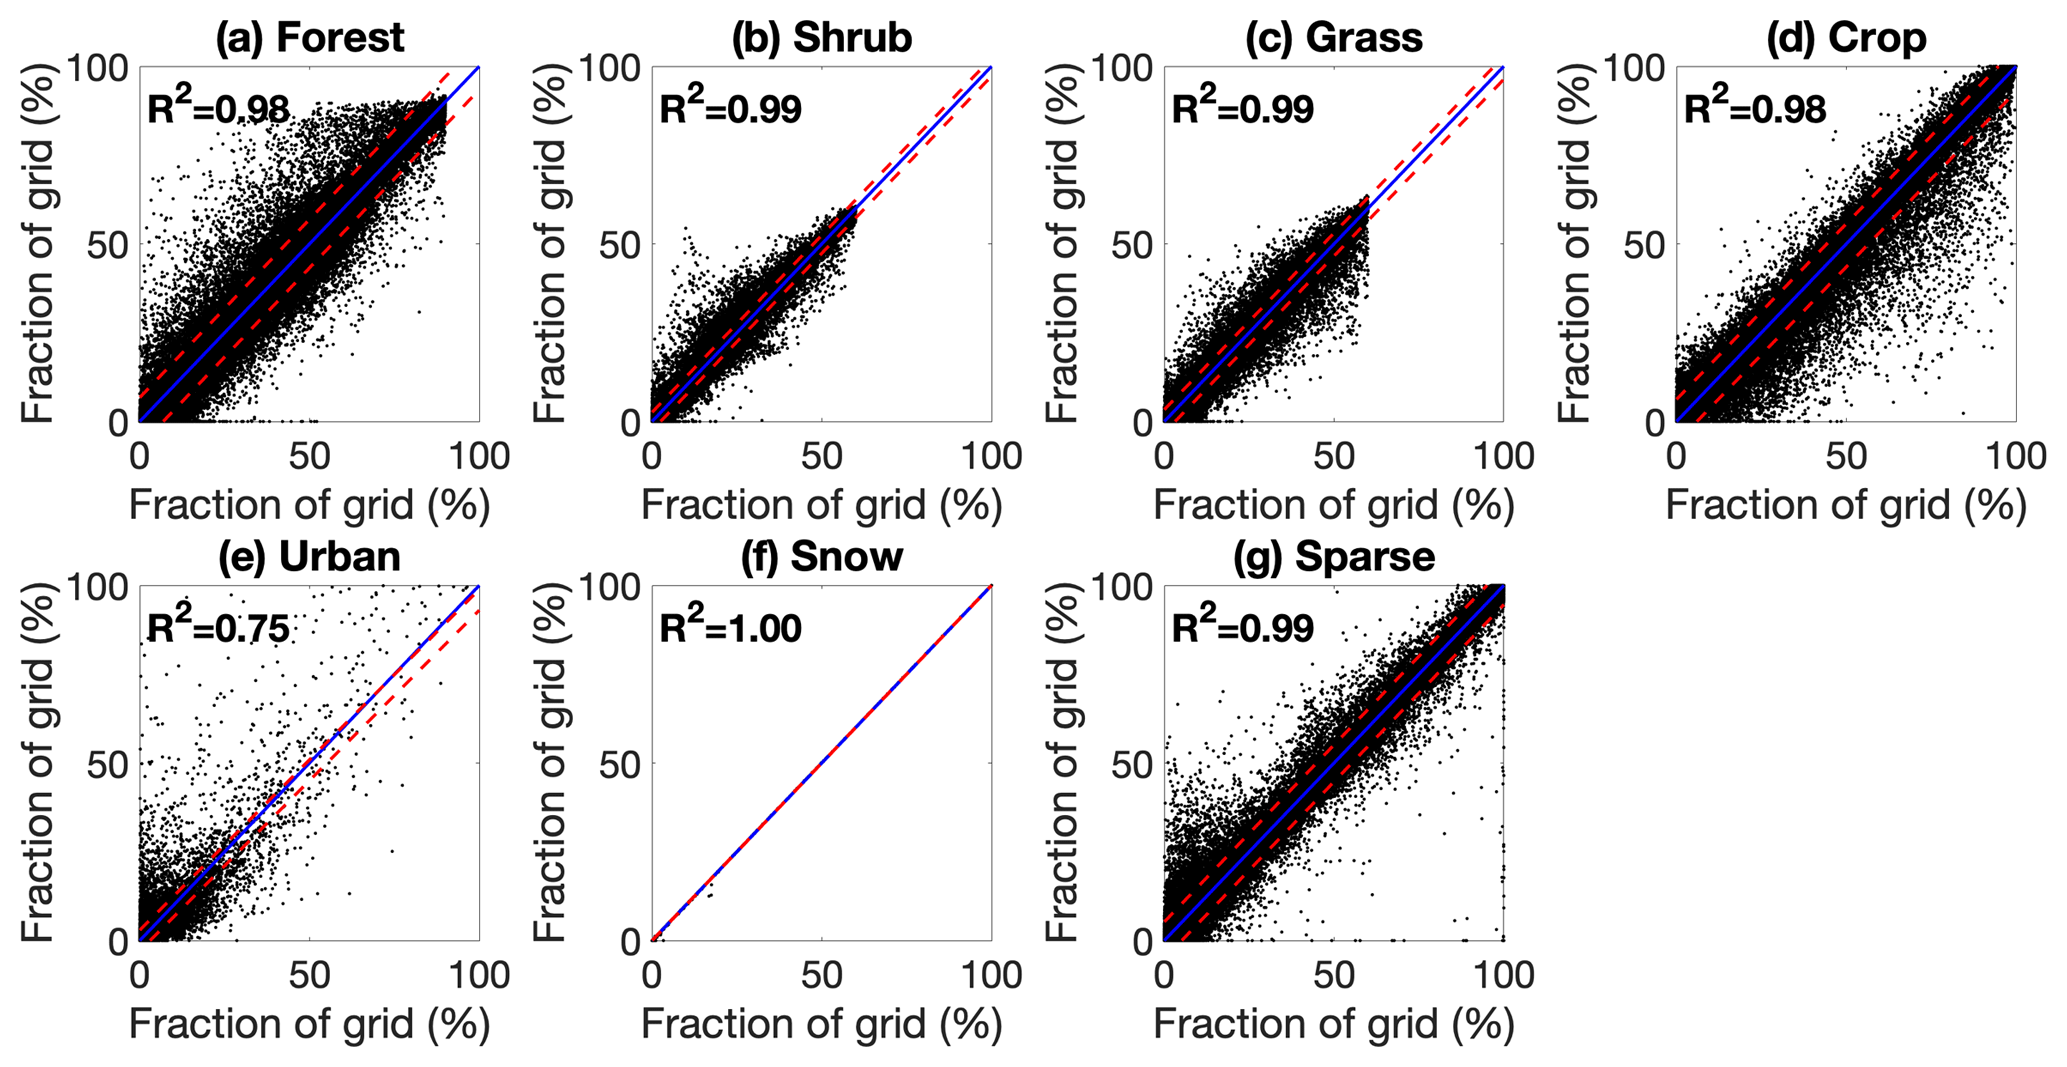
Figure 6Comparison between the observed and downscaled final land types with optimal parameters over the 265 852 0.25∘ grid cells in 2015. The blue solid lines show the 1 : 1 line, and the red dashed lines show the 95 % confidence intervals.
Figure 6 shows the comparison between reference gridded CCI-LC FLTs and the downscaled FLTs driven by the best parameters (see Sect. 3.1) among the 265 852 0.25∘ grid cells in 2015. Except for urban, the downscaled land cover of other FLTs matches the reference record very well (all R2 are above 0.98). The R2 is 1 for snow due to little change in snow and ice area in the CCI-LC record. Figure 7 demonstrates the spatial distribution of FLT fraction from the reference data and the best downscaled results, together with their differences, using crops as an example. We find that the downscaled results have successfully reproduced the spatial pattern of crops from the reference data, and similar conclusions can be drawn for other FLTs (see Figs. S2–S6; figure for snow was not shown because of little change for this FLT). However, the misallocation of land cover change takes places in most regional AEZs, especially where LULCC was significant (e.g., Brazil, eastern China, temperate Africa, and northern Eurasia; Figs. 7 and S1–S5) over the study years, likely due to the application of an improper global ratio of intensification. For example, the North China Plain has experienced extensive urbanization by converting a large area of cropland into urban development during the past few decades (Liu et al., 2010). However, since the calibrated intensification ratio is high (Fig. 2), Demeter tends to underestimate urban expansion and thus overestimate cropland area that should be urbanized. Similarly, cropland has been largely expanded and thus applying a high intensification ratio could not capture such changes.
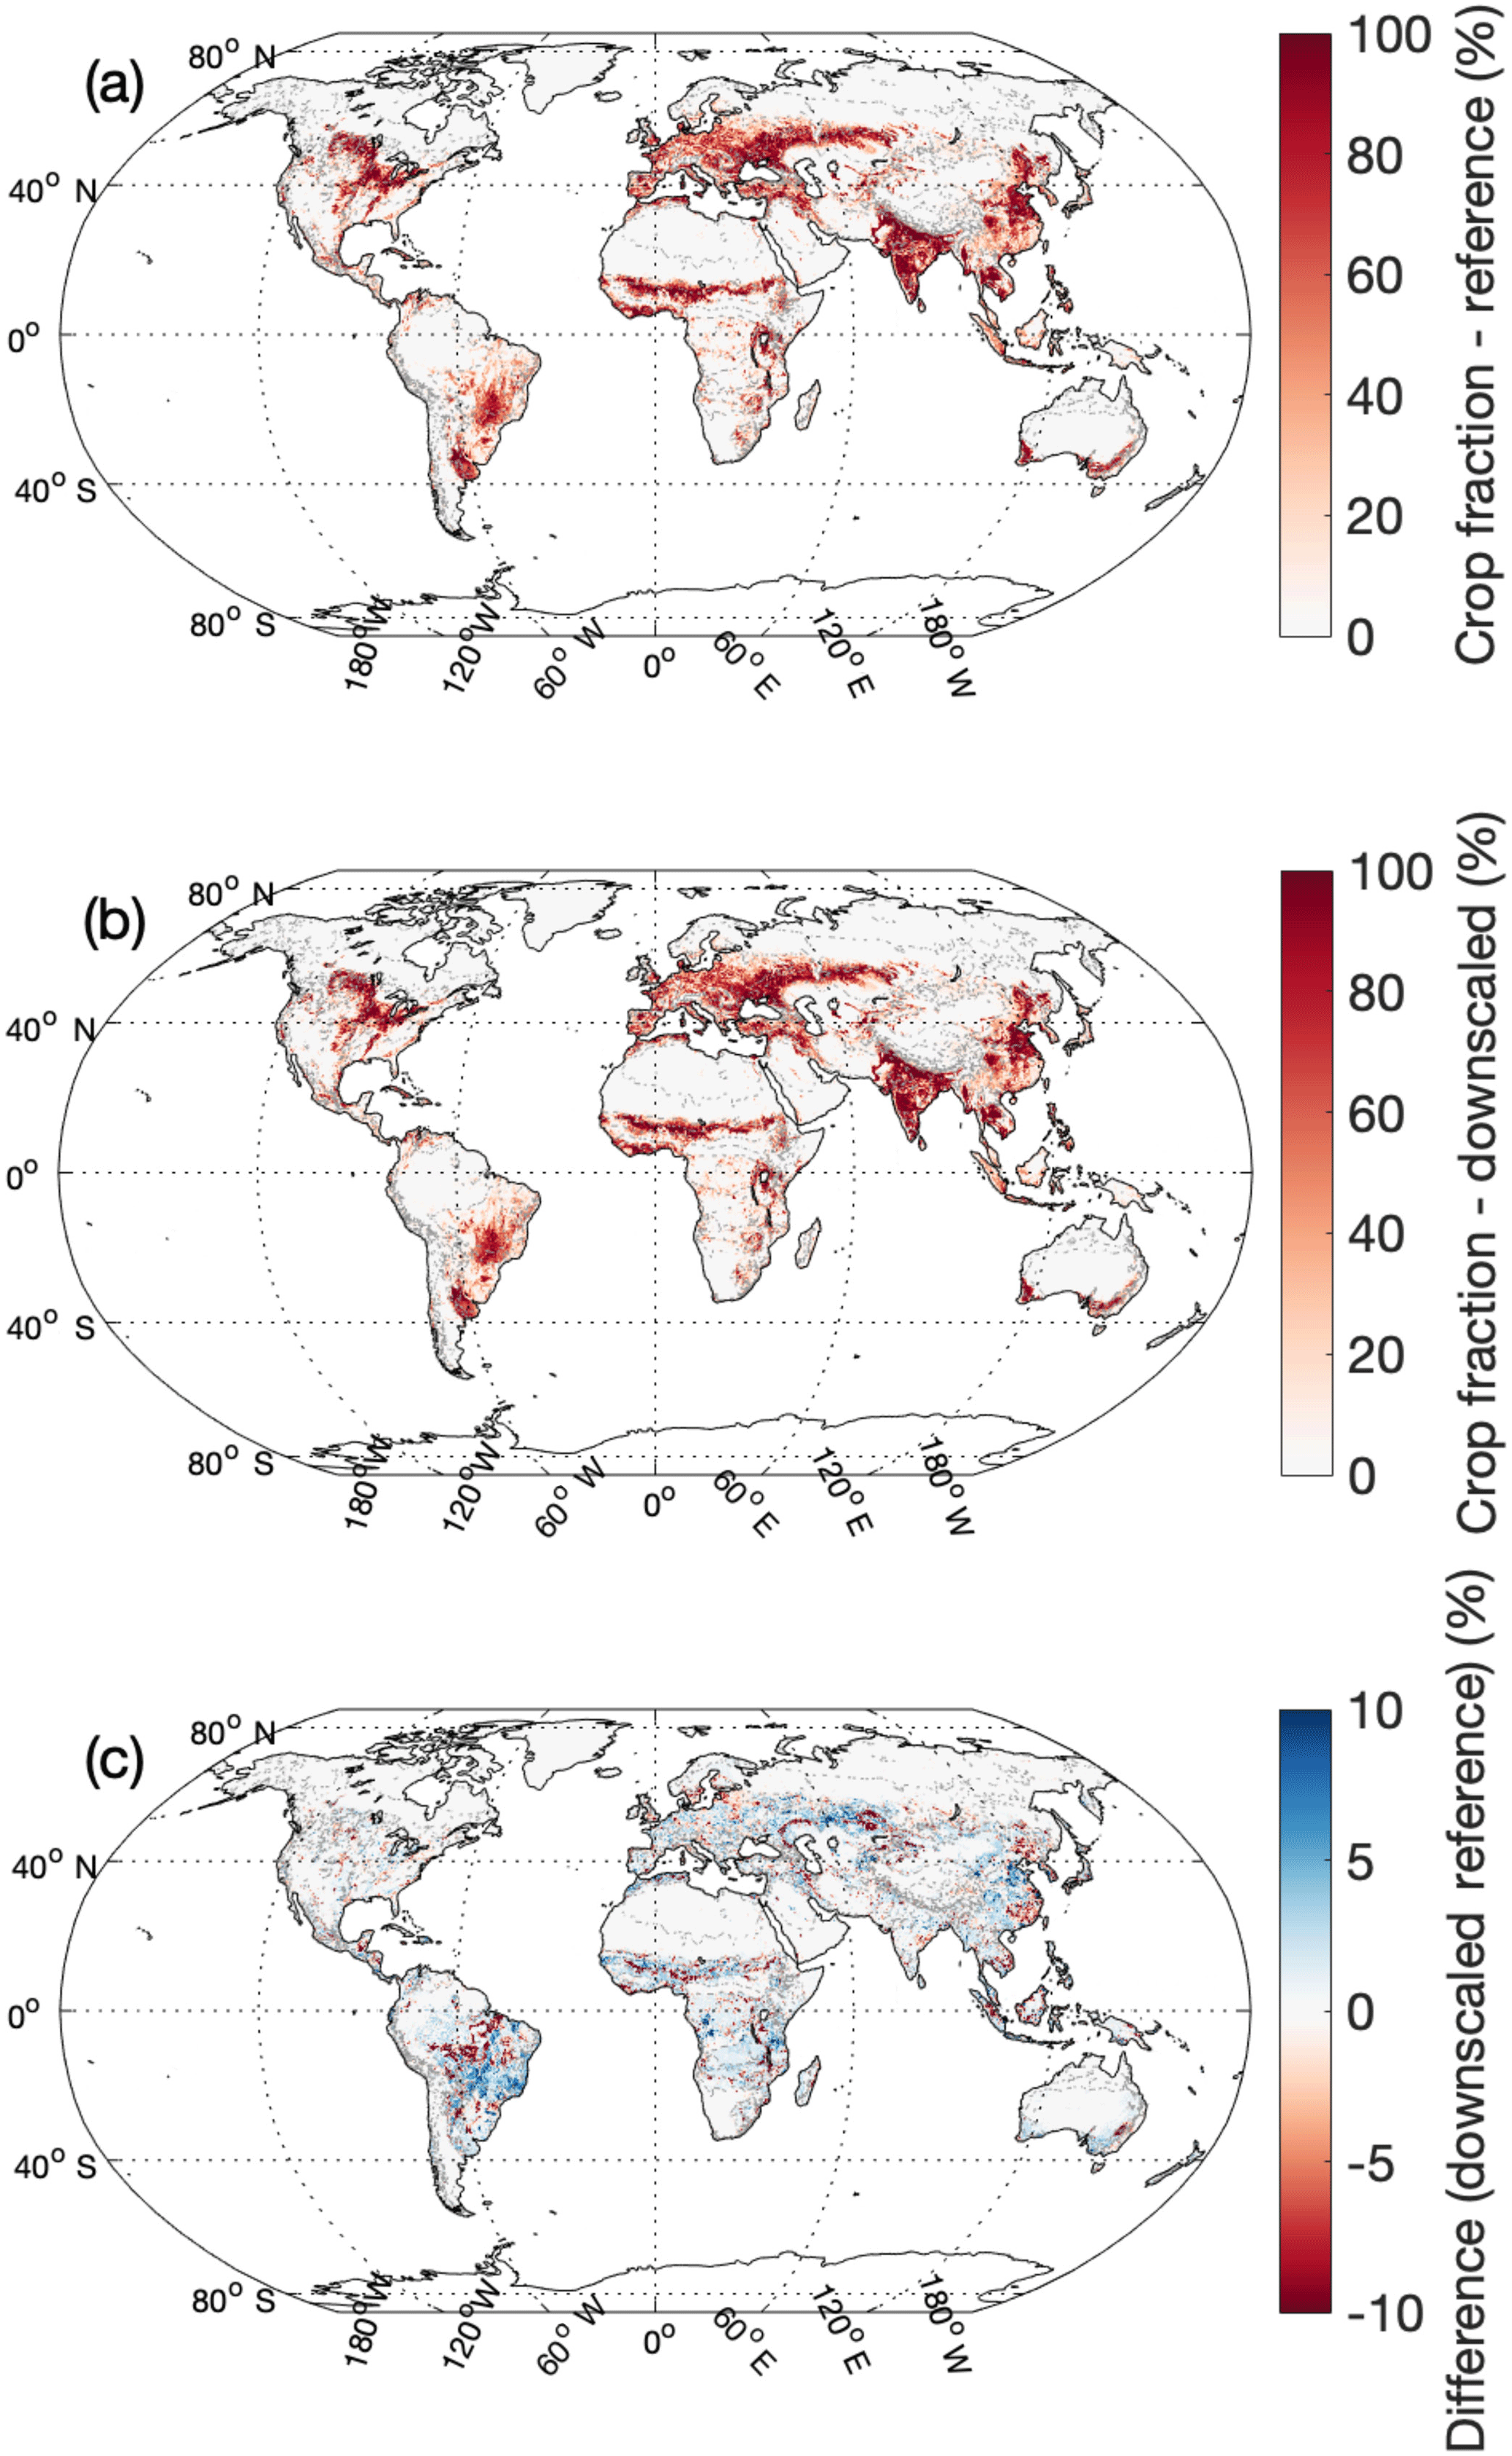
Figure 7Spatial pattern of the observed and downscaled crop densities (measured by percentage fraction of the grid cell) and their differences in 2015. The grey dotted lines show the boundaries of the GCAM regional AEZs.
3.3 Uncertainty propagation
While applying the acceptable parameters (top 5 % and 10 %) in downscaling GCAM projections of LULCC under the reference scenario, we found that these well-constrained parameters induced considerable uncertainties in the downscaled results. For each grid cell, we calculated the standard deviation (σ) of the downscaled land cover areas with different parameters for each FLT. Figure 8 shows the mean σ of the 265 852 0.25∘ grid cells over the globe for 2005, 2010, 2050, and 2100, as well as the spatial variability of σ (calculated as the standard deviation over the grid cells and shown as the shaded area in Fig. 8). As shown by the grey lines and shading in Fig. 8, the uncertainty of the top 5 % parameters has a minor effect on downscaled urban and snow areas, since GCAM projected little areal change in urban and snow. Downscaled sparse areas were slightly affected by the choice of parameters, indicated by small mean σ (about 2 km2 per grid cell). However, the other FLTs, including forest, shrub, grass, and crops, have larger σ values, which also showed an increasing trend over time. The global mean σ for forest and shrub reached about 3 to 4 km2 per grid cell and about 6 to 8 km2 for grass and crops in 2100. The spatial variability of σ was also larger for these FLTs; for example, the standard deviation of σ reached over 15 km2 per grid cell in 2100 for crops, and the maximum σ can be over 350 km2 per grid cell in some grid cells (Fig. S7). Similar results can be found by using the top 10 % parameters but with slightly higher magnitudes (red lines and shaded areas in Figs. 8 and S8).
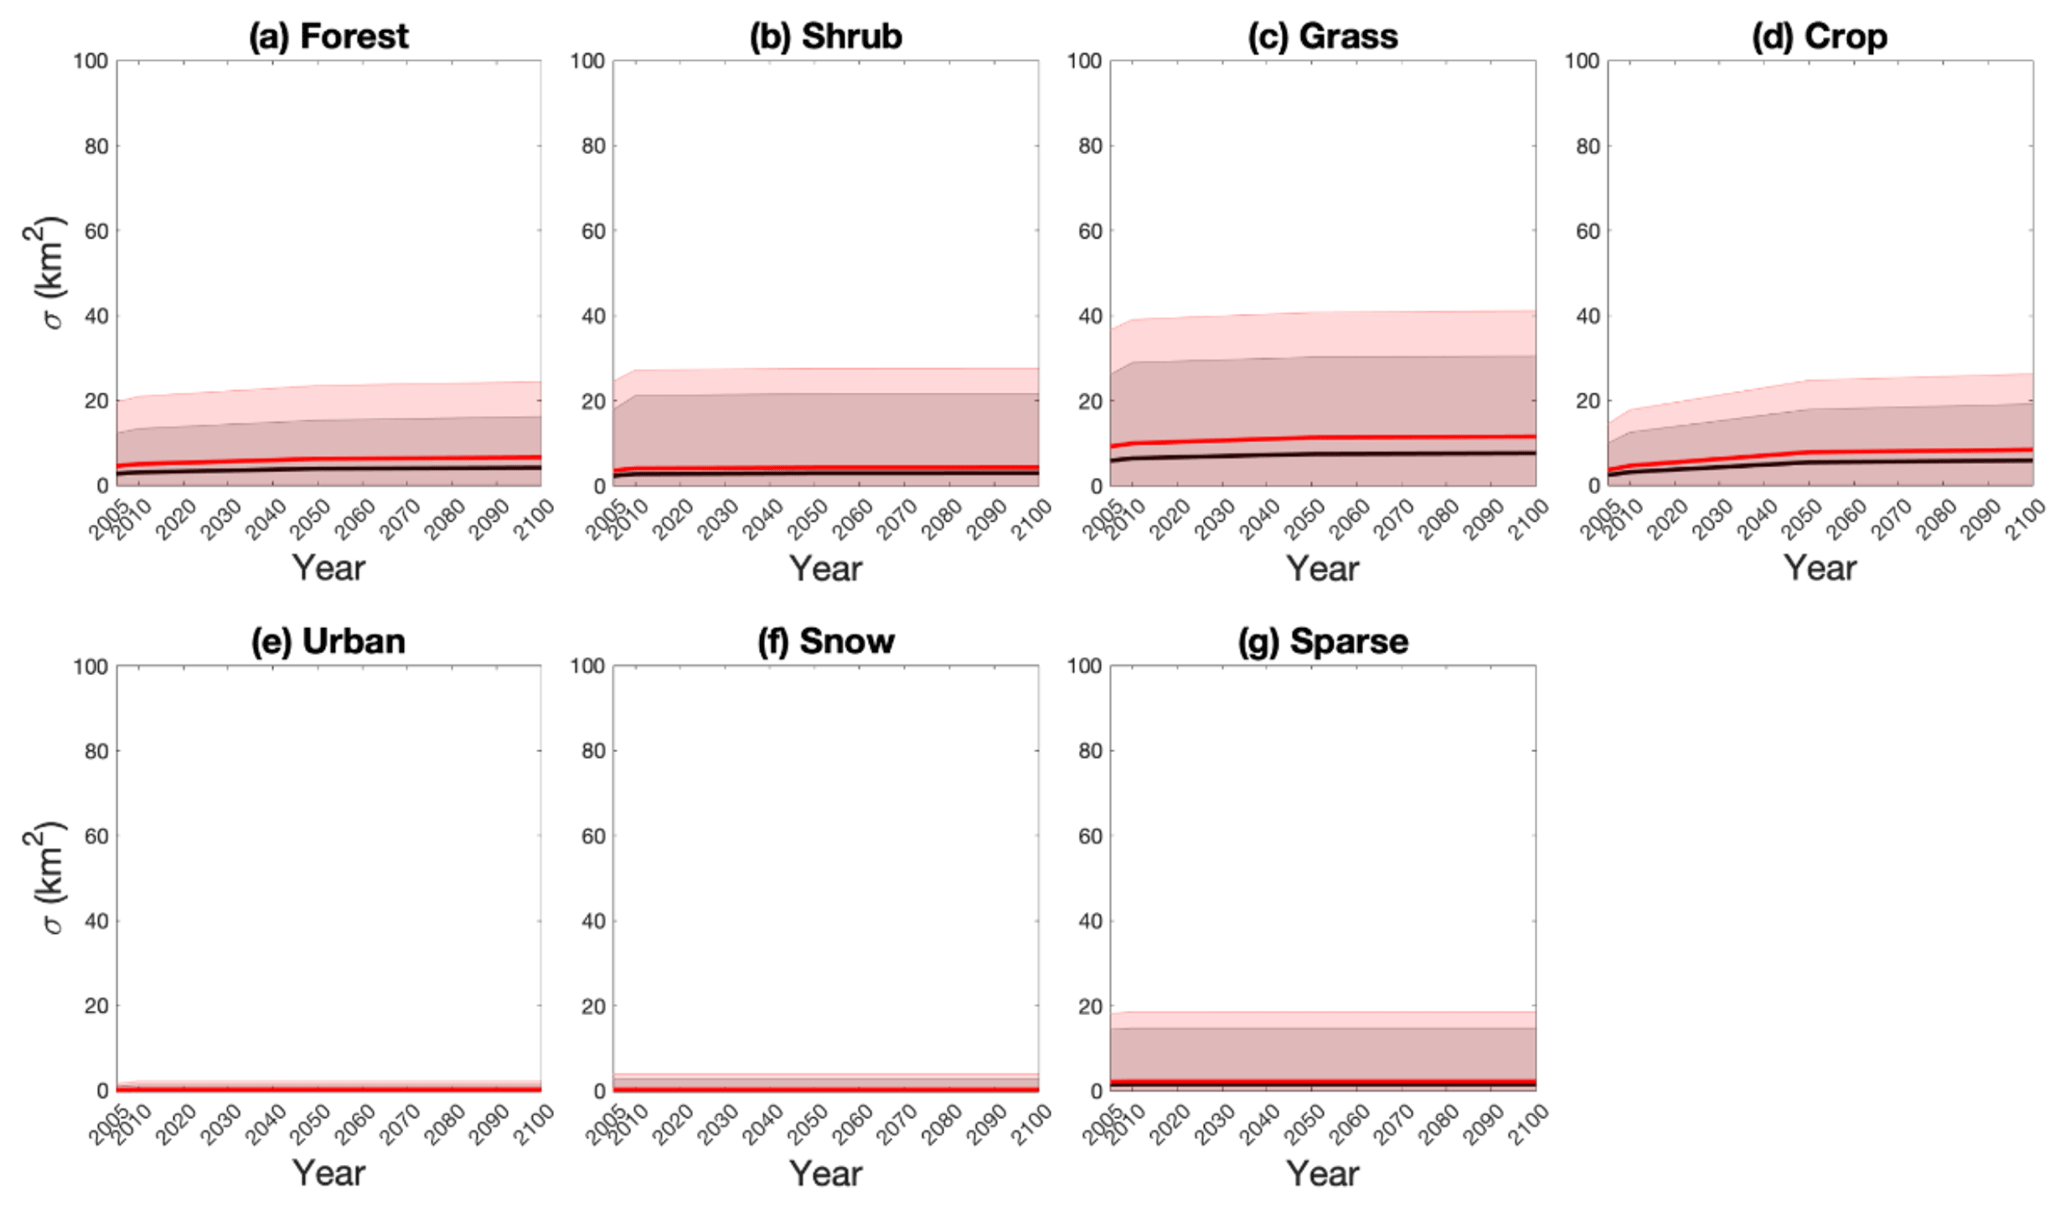
Figure 8The mean (shown as the solid lines) and standard deviations (σ, shown as the shaded area) for the downscaled final land type (FLT) areas when propagating the parameter uncertainties into the GCAM-projected land use and land cover change downscaling in the 21st century. The black and red colors represent using the top 5 % and 10 % parameters, respectively.
To date, there have been only a handful of methods for downscaling projected global land use and land cover change. For example, Hoskins et al. (2016) fitted a statistical model relating coarse-scaled spatial patterns in land cover classes to finer-scaled land cover and other explaining variables. Many more studies have used a complex land use modeling approach (e.g., Houet et al., 2017; Hoskins et al., 2016; Meiyappan et al., 2014; Hurtt et al., 2011; Souty et al., 2012) that combines a variety of socioeconomic processes to provide global-scale land use allocations. Our results demonstrated that Demeter is an effective tool for downscaling global land use and land cover change, although it adapts a relatively simpler approach. However, choices of parameter values are critically important for a simple model, since it is possible that some complicated processes are simplified and represented by a single parameter. Although an uncalibrated Demeter can lead to noticeable errors and uncertainties in downscaled land cover areas, our results have shown the effectiveness of the calibration efforts in minimizing downscaling errors and constraining uncertainties.
A central purpose of our study is to make suggestions for setting up parameters for Demeter's global applications, shown as the global optimal values in Fig. 2. Interestingly, we found that the parameters of intensification ratio (r) and selection threshold (τ) strongly affected the downscaled results, while the weights of the spatial constraints and kernel radius showed small impacts on the results. This indicates that the selected spatial constraints (soil workability and nutrient availability) and spatial autocorrelation (measured by kernel density) provide loose constraints on land allocation in the downscaling process, and therefore users should focus more on the quality of other parameters such as r and τ to which the model is more sensitive. In addition, the intensification ratio has been strictly constrained to a range close to 1.0, suggesting that the intensification of land cover, especially cropland, may be the major contributor to global land use and land cover change; thus, spatial constraints on extensification are not very effective. We also noticed that the optimal weight for soil nutrient availability for calculating the suitability indices is zero (Fig. 2). A possible reason is that soil nutrient availability has a similar spatial distribution as cropland in CCI-LC data, thus providing little additional information on constraining the downscaling processes (Fig. S10). This result suggests that users could ignore the input of soil nutrient availability if it is not available or difficult to collect, and the quantification of the downscaling uncertainty is not required.
There have been a number of numerical methods for model calibration, such as gradient methods (Ypma, 1995), evolutionary algorithms (Ashlock, 2006), and data assimilation techniques (Kalnay, 2002). Our calibration method is relatively simpler, and the sampling steps are relatively coarse. As a result, it is possible that the calibrated parameters can be further improved with a more rigorous calibration strategy, although these biases should be small since the sampling bins are narrow and the sensitive parameters are well constrained (Fig. 2). However, our method has a few advantages for this particular global land use and land cover change downscaling model calibration problem. First, we sampled the whole parameter space, and thus our Monte Carlo downscaling experiments can represent the parameter uncertainties well. Second, the other methods mentioned above typically adjust model parameters and run the model iteratively to find the parameters to hit the local or global minimum cost function value (Chong and Zak, 2013); this can be very time-consuming due to the size of the datasets and the difficulty of algorithm parallelization. The Monte Carlo ensemble runs of Demeter in our method can be easily parallelized, and it is thus computationally efficient. Finally, the saved downscaled results from the global Monte Carlo downscaling experiment can be reused for regional applications. Our study provided an optimal set of Demeter parameters. It is worth noting that these parameters are optimized to minimize the average discrepancies between the downscaled and historically observed land cover areas at the global scale, and they may thus need to be recalibrated when Demeter is applied to a particular region. For example, the best estimate of the intensification ratio is 1 for a global downscaling experiment, probably due to the fact that intensification is a more common phenomenon than extensification for land use and land cover change in the past 2 decades as recorded by the CCI-LC data. However, this high intensification ratio for crops may be more realistic for regions with a long-term agricultural history (e.g., India), while it should become lower for the United States (US) where cropland extensification happened rapidly in the past century. We extracted grid cells in the conterminous US (grid cells between 25 and 50∘ N and between 125 and 65∘ W) and India (grid cells between 7 and 33∘ N and between 68 and 98∘ E) and used them together with the same method as the global calibration to determine the optimal parameters for the US and India, which clearly showed that the intensification ratio remained 1 for India but moved towards lower values for the US (Fig. S9). Therefore, we recommend future effort to examine reginal parameterization for Demeter's applications at specific regional AEZ levels. Since some of the key parameters have a clear physical definition (e.g., the intensification ratio) and while the global optimal values could be used as a starting point, it would be helpful to review local historical land use change to infer these parameters when applying Demeter to a specific region.
In addition, although the downscaled urban land use can capture most of the variability in reality, it is clear that Demeter's performance for urban is not as good as that for other land cover types (Fig. 6). On the other hand, accurate projection of the spatial extent and pattern of urbanization is becoming more important for a better understanding of its environmental, ecological, and socioeconomic impacts in such an era of rapid urbanization (Georgescu et al., 2012; Jones et al., 1990; Merckx et al., 2018; Zhang et al., 2018). Thus, future effort should be made to improve the downscaling accuracy of urban land use. The relatively larger errors could be due to the limited consideration of complex urbanization processes and the lack of specific parameterization of the urban land cover type. While incorporating a better representation of urbanization in Demeter can be more complicated, it is possible to improve the model performance by further parameterizing the model with more historical urban data. For example, global satellite-observed nightlights have been used for mapping urban areas (Elvidge et al., 2009; Li and Zhou, 2017b; Zhou et al., 2014) and producing a global record of annual urban dynamics (1992–2013) (Li and Zhou, 2017a), which will be particularly useful for the future calibration of Demeter on urban dynamics.
Model calibration can usually provide several sets of parameters to allow the calibrated model to give similar results, which is called equifinality (Beven and Freer, 2001). As a result, the calibrated parameters become another source of uncertainty in model-simulated results. Equifinality also exists in our calibrations. We observed noticeable growing uncertainties in downscaled land cover areas while propagating the parameter uncertainties into the Demeter downscaling practices with GCAM-projected LULCC in the 21st century. Therefore, while calibration can remarkably reduce the uncertainty of the parameters, it may be better to use sets of constrained parameters rather than a single set of “best” parameters in the practice of Demeter for the purpose of accounting for parameter uncertainty and providing more reliable land use and land cover change downscaling. Moreover, it is worth noting that the calibrated parameters are tuned for FLTs, which we believe have covered most land cover types and are directly useful in most cases. When users need to consider more FLTs in their global applications, the optimal values introduced in this study can be used as a starting point for further tuning.
We developed a Monte Carlo ensemble experiment for Demeter, a land use and land cover change downscaling model of GCAM, analyzed the model's sensitivity to its key parameters, and calibrated the parameters to minimize the mismatch between model-downscaled and satellite-observed land use and land cover change in the past 2 decades. We identified the optimal parameter values for global applications of Demeter and showed that the parameterization of Demeter substantially improved the model's performance in downscaling global land use and land cover change. The intensification ratio and selection threshold turned out to be the most sensitive parameters and thus need to be carefully tuned, especially when Demeter is used for regional applications. Further, the small uncertainty of parameters after calibration can result in considerably larger uncertainties in the results when propagating them into the practice of downscaling GCAM projections, suggesting that Demeter users consider parameterization equifinality to better account for the uncertainties in Demeter-downscaled land use and land cover changes.
The source code of GCAM and Demeter is available at https://github.com/JGCRI/gcam-core (last access: 18 April 2019) and https://doi.org/10.5281/zenodo.1214342 (Vernon, 2019). The scripts for performing the calibration and analysis are available at https://doi.org/10.5281/zenodo.2634584 (Chen et al., 2019a).
The ESA-CCI data were downloaded from https://www.esa-landcover-cci.org/ (last access: 3 April 2017). Other data, e.g., input and configuration files for Demeter experiments in this paper, are available at https://doi.org/10.25584/data.2019-04.715/1505616 (Chen et al., 2019b).
The supplement related to this article is available online at: https://doi.org/10.5194/gmd-12-1753-2019-supplement.
MC conceived the study, and all the authors contributed to designing the study. MC led the data acquisition and performed the experiment and analysis with technical assistance from CRV; MC wrote the paper with input from all the coauthors.
The authors declare that they have no conflict of interest.
This research was supported by the U.S. Department of Energy, Office of Science, as part of research in the MultiSector Dynamics, Earth and Environmental System Modeling Program.
This paper was edited by David Lawrence and reviewed by two anonymous referees.
Ashlock, D.: Evolutionary Computation for Modeling and Optimization, Springer-Verlag, New York, 2006.
Beven, K. and Freer, J.: Equifinality, data assimilation, and uncertainty estimation in mechanistic modelling of complex environmental systems using the GLUE methodology, J. Hydrol., 249, 11–29, https://doi.org/10.1016/S0022-1694(01)00421-8, 2001.
Brovkin, V., Boysen, L., Arora, V. K., Boisier, J. P., Cadule, P., Chini, L., Claussen, M., Friedlingstein, P., Gayler, V., van den Hurk, B. J. J. M., Hurtt, G. C., Jones, C. D., Kato, E., de Noblet-Ducoudré, N., Pacifico, F., Pongratz, J., and Weiss, M.: Effect of Anthropogenic Land-Use and Land-Cover Changes on Climate and Land Carbon Storage in CMIP5 Projections for the Twenty-First Century, J. Clim., 26, 6859–6881, https://doi.org/10.1175/JCLI-D-12-00623.1, 2013.
Chen, M., Vernon, C. R., Huang, M., Calvin, K. V., and Kraucunas, I. P.: IMMM-SFA/chen_et_al_gmd_2019: Chen et al. 2019, GMD supporting code, https://doi.org/10.5281/zenodo.2634584, 2019a.
Chen, M., Vernon, C. R., Huang, M., Calvin, K. V., and Kraucunas, I. P.: IMMM-SFA/chen_et_al_gmd_2019: Chen et al. 2019, GMD supporting data, https://doi.org/10.25584/data.2019-04.715/1505616, 2019b.
Chong, E. K. P. and Zak, S. H.: An introduction to optimization, 4th edn., John Wiley & Sons, Inc., Hoboken, NJ, 2013.
Costa, M. H. and Foley, J. A.: Combined Effects of Deforestation and Doubled Atmospheric CO2 Concentrations on the Climate of Amazonia, J. Climate, 13, 18–34, https://doi.org/10.1175/1520-0442(2000)013<0018:CEODAD>2.0.CO;2, 2000.
Dickinson, R. E. and Kennedy, P.: Impacts on regional climate of Amazon deforestation, Geophys. Res. Lett., 19, 1947–1950, https://doi.org/10.1029/92GL01905, 1992.
Edmonds, J. and Reilly, J.: Global Energy: Assessing the Future, Oxford University Press, New York, 1985.
Edmonds, J., Wise, M., Pitcher, H., Richels, R., Wigley, T., and Maccracken, C.: An integrated assessment of climate change and the accelerated introduction of advanced energy technologies, Mitig. Adapt. Strateg. Glob. Chang., 1, 311–339, https://doi.org/10.1007/BF00464886, 1997.
Edmonds, J. A., Calvin, K. V, Clarke, L. E., Janetos, A. C., Kim, S. H., Wise, M. A., and McJeon, H. C.: Integrated Assessment Modeling, in Encyclopedia of Sustainability Science and Technology, edited by: Meyers, R. A., Springer New York, New York, NY, 5398–5428, 2012.
Elvidge, C. D., Sutton, P. C., Tuttle, B. T., Ghosh, T., and Baugh, K. E.: Global urban mapping based on nighttime lights, Glob. Mapp. Hum. Settl., 129–144, 2009.
FAO/IIASA/ISRIC/ISSCAS/JRC: Harmonized World Soil Database (version 1.2), FAO, Rome, Italy and IIASA, Laxenburg, Austria, 2012.
Findell, K. L., Berg, A., Gentine, P., Krasting, J. P., Lintner, B. R., Malyshev, S., Santanello, J. A., and Shevliakova, E.: The impact of anthropogenic land use and land cover change on regional climate extremes, Nat. Commun., 8, 989, https://doi.org/10.1038/s41467-017-01038-w, 2017.
Friedl, M. A., McIver, D. K., Hodges, J. C. F., Zhang, X. Y., Muchoney, D., Strahler, A. H., Woodcock, C. E., Gopal, S., Schneider, A., Cooper, A., Baccini, A., Gao, F., and Schaaf, C.: Global land cover mapping from MODIS: algorithms and early results, Remote Sens. Environ., 83, 287–302, https://doi.org/10.1016/S0034-4257(02)00078-0, 2002.
Georgescu, M., Moustaoui, M., Mahalov, A., and Dudhia, J.: Summer-time climate impacts of projected megapolitan expansion in Arizona, Nat. Clim. Chang., 3, 37–41, https://doi.org/10.1038/nclimate1656, 2012.
Hansen, M. C., Defries, R. S., Townshend, J. R. G., and Sohlberg, R.: Global land cover classification at 1 km spatial resolution using a classification tree approach, Int. J. Remote Sens., 21, 1331–1364, https://doi.org/10.1080/014311600210209, 2000.
Hibbard, K. A. and Janetos, A. C.: The regional nature of global challenges: a need and strategy for integrated regional modeling, Clim. Change, 118, 565–577, https://doi.org/10.1007/s10584-012-0674-3, 2013.
Hibbard, K. A., Hoffman, F. M., Huntzinger, D., and West, T. O.: Changes in land cover and terrestrial biogeochemistry, in: Climate Science Special Report: Fourth National Climate Assessment, Volume I, edited by: Wuebbles, D. J., Fahey, D. W., Hibbard, K. A., Dokken, D. J., Stewart, B. C., and Maycock, T. K., U.S. Global Change Research Program, Washington, DC, USA, 277–302, 2017.
Hoskins, A. J., Bush, A. , Gilmore, J. , Harwood, T. , Hudson, L. N., Ware, C., Williams, K. J. and Ferrier, S.: Downscaling land-use data to provide global 30′′ estimates of five land-use classes, Ecol. Evol., 6, 3040–3055, https://doi.org/10.1002/ece3.2104, 2016.
Houet, T., Grémont, M., Vacquié, L., Forget, Y., Marriotti, A., Puissant, A., Bernardie, S., Thiery, Y., Vandromme, R., and Grandjean, G.: Downscaling scenarios of future land use and land cover changes using a participatory approach: an application to mountain risk assessment in the Pyrenees (France), Reg. Environ. Chang., 17, 2293–2307, https://doi.org/10.1007/s10113-017-1171-z, 2017.
Hurtt, G., Chini, L., Frolking, S., Betts, R., Feddema, J., Fischer, G., Fisk, J., Hibbard, K., Houghton, R., Janetos, A., Jones, C., Kindermann, G., Kinoshita, T., Klein Goldewijk, K., Riahi, K., Shevliakova, E., Smith, S., Stehfest, E., Thomson, A., Thornton, P., van Vuuren, D., and Wang, Y.: Harmonization of land-use scenarios for the period 1500–2100: 600 years of global gridded annual land-use transitions, wood harvest, and resulting secondary lands, Clim. Change, 109, 117–161, https://doi.org/10.1007/s10584-011-0153-2, 2011.
Jones, P. D., Groisman, P. Y., Coughlan, M., Plummer, N., Wang, W.-C., and Karl, T. R.: Assessment of urbanization effects in time series of surface air temperature over land, Nature, 347, 169–172, https://doi.org/10.1038/347169a0, 1990.
Kalnay, E.: Atmospheric modeling, data assimilation and predictability, Cambridge University Press, 2002.
Kim, S. H., Edmonds, J., Lurz, J., Smith, S. J., and Wise, M.: The ObjECTS Framework for Integrated Assessment: Hybrid Modeling of Transportation, The Energy Journal, International Association for Energy Economics, 63–92, 2006.
Law, B. E., Hudiburg, T. W., Berner, L. T., Kent, J. J., Buotte, P. C., and Harmon, M. E.: Land use strategies to mitigate climate change in carbon dense temperate forests, P. Natl. Acad. Sci. USA, 115, 3663–3668, 2018.
Lawrence, D. M., Hurtt, G. C., Arneth, A., Brovkin, V., Calvin, K. V., Jones, A. D., Jones, C. D., Lawrence, P. J., de Noblet-Ducoudré, N., Pongratz, J., Seneviratne, S. I., and Shevliakova, E.: The Land Use Model Intercomparison Project (LUMIP) contribution to CMIP6: rationale and experimental design, Geosci. Model Dev., 9, 2973–2998, https://doi.org/10.5194/gmd-9-2973-2016, 2016.
Lawrence, P. J., Feddema, J. J., Bonan, G. B., Meehl, G. A., O'Neill, B. C., Oleson, K. W., Levis, S., Lawrence, D. M., Kluzek, E., Lindsay, K., and Thornton, P. E.: Simulating the Biogeochemical and Biogeophysical Impacts of Transient Land Cover Change and Wood Harvest in the Community Climate System Model (CCSM4) from 1850 to 2100, J. Clim., 25, 3071–3095, https://doi.org/10.1175/JCLI-D-11-00256.1, 2012.
Le Page, Y., West, T. O., Link, R., and Patel, P.: Downscaling land use and land cover from the Global Change Assessment Model for coupling with Earth system models, Geosci. Model Dev., 9, 3055–3069, https://doi.org/10.5194/gmd-9-3055-2016, 2016.
Li, X. and Zhou, Y.: A Stepwise Calibration of Global DMSP/OLS Stable Nighttime Light Data (1992–2013), Remote Sens., 9, 637, https://doi.org/10.3390/rs9060637, 2017a.
Li, X. and Zhou, Y.: Urban mapping using DMSP/OLS stable night-time light: a review, Int. J. Remote Sens., 38, 6030–6046, https://doi.org/10.1080/01431161.2016.1274451, 2017b.
Liu, J., Zhang, Z., Xu, X., Kuang, W., Zhou, W., Zhang, S., Li, R., Yan, C., Yu, D., Wu, S., and Jiang, N.: Spatial patterns and driving forces of land use change in China during the early 21st century, J. Geogr. Sci., 20, 483–494, https://doi.org/10.1007/s11442-010-0483-4, 2010.
Loveland, T. R., Reed, B. C., Brown, J. F., Ohlen, D. O., Zhu, Z., Yang, L., and Merchant, J. W.: Development of a global land cover characteristics database and IGBP DISCover from 1 km AVHRR data, Int. J. Remote Sens., 21, 1303–1330, https://doi.org/10.1080/014311600210191, 2000.
Meiyappan, P., Dalton, M., O'Neill, B. C., and Jain, A. K.: Spatial modeling of agricultural land use change at global scale, Ecol. Modell., 291, 152–174, https://doi.org/10.1016/j.ecolmodel.2014.07.027, 2014.
Merckx, T., Souffreau, C., Kaiser, A., Baardsen, L. F., Backeljau, T., Bonte, D., Brans, K. I., Cours, M., Dahirel, M., Debortoli, N., De Wolf, K., Engelen, J. M. T., Fontaneto, D., Gianuca, A. T., Govaert, L., Hendrickx, F., Higuti, J., Lens, L., Martens, K., Matheve, H., Matthysen, E., Piano, E., Sablon, R., Schön, I., Van Doninck, K., De Meester, L., and Van Dyck, H.: Body-size shifts in aquatic and terrestrial urban communities, Nature, 558, 113–116, https://doi.org/10.1038/s41586-018-0140-0, 2018.
Piao, S., Friedlingstein, P., Ciais, P., de Noblet-Ducoudré, N., Labat, D., and Zaehle, S.: Changes in climate and land use have a larger direct impact than rising CO2 on global river runoff trends, P. Natl. Acad. Sci. USA, 104, 15242–15247, 2007.
Pongratz, J., Bounoua, L., DeFries, R. S., Morton, D. C., Anderson, L. O., Mauser, W., and Klink, C. A.: The Impact of Land Cover Change on Surface Energy and Water Balance in Mato Grosso, Brazil, Earth Interact., 10, 1–17, https://doi.org/10.1175/EI176.1, 2006.
Prestele, R., Arneth, A., Bondeau, A., de Noblet-Ducoudré, N., Pugh, T. A. M., Sitch, S., Stehfest, E., and Verburg, P. H.: Current challenges of implementing anthropogenic land-use and land-cover change in models contributing to climate change assessments, Earth Syst. Dynam., 8, 369–386, https://doi.org/10.5194/esd-8-369-2017, 2017.
Saltelli, A., Tarantola, S., Campolongo, F., and Ratto, M.: Sensitivity Analysis in Practice: A Guide to Assessing Scientific Models, Wiley, 2004.
Sleeter, B. M., Liu, J., Daniel, C., Rayfield, B., Sherba, J., Hawbaker, T. J., Zhu, Z., Selmants, P. C., and Loveland, T. R.: Effects of contemporary land-use and land-cover change on the carbon balance of terrestrial ecosystems in the United States, Environ. Res. Lett., 13, 45006, https://doi.org/10.1088/1748-9326/aab540, 2018.
Souty, F., Brunelle, T., Dumas, P., Dorin, B., Ciais, P., Crassous, R., Müller, C., and Bondeau, A.: The Nexus Land-Use model version 1.0, an approach articulating biophysical potentials and economic dynamics to model competition for land-use, Geosci. Model Dev., 5, 1297–1322, https://doi.org/10.5194/gmd-5-1297-2012, 2012.
Taylor, K. E., Stouffer, R. J., and Meehl, G. A.: An Overview of CMIP5 and the Experiment Design, B. Am. Meteorol. Soc., 93, 485–498, https://doi.org/10.1175/BAMS-D-11-00094.1, 2012.
Vernon, C.: IMMM-SFA/demeter: Demeter – Version 1.0.0, https://doi.org/10.5281/zenodo.1214342, 2019.
Vernon, C. R., Le Page, Y., Chen, M., Huang, M., Calvin, K. V, Kraucunas, I. P., and Braun, C. J.: Demeter – A Land Use and Land Cover Change Disaggregation Model, J. Open Res. Softw., 6, 15, https://doi.org/10.5334/jors.208, 2018.
West, T. O., Le Page, Y., Huang, M., Wolf, J., and Thomson, A. M.: Downscaling global land cover projections from an integrated assessment model for use in regional analyses: results and evaluation for the US from 2005 to 2095, Environ. Res. Lett., 9, 64004, https://doi.org/10.1088/1748-9326/9/6/064004, 2014.
Ypma, T.: Historical Development of the Newton–Raphson Method, SIAM Rev., 37, 531–551, https://doi.org/10.1137/1037125, 1995.
Zhang, W., Villarini, G., Vecchi, G. A., and Smith, J. A.: Urbanization exacerbated the rainfall and flooding caused by hurricane Harvey in Houston, Nature, 563, 384–388, https://doi.org/10.1038/s41586-018-0676-z, 2018.
Zhang, X., Friedl, M. A., Schaaf, C. B., Strahler, A. H., Hodges, J. C. F., Gao, F., Reed, B. C., and Huete, A.: Monitoring vegetation phenology using MODIS, Remote Sens. Environ., 84, 471–475, https://doi.org/10.1016/S0034-4257(02)00135-9, 2003.
Zhou, Y., Smith, S. J., Elvidge, C. D., Zhao, K., Thomson, A., and Imhoff, M.: A cluster-based method to map urban area from DMSP/OLS nightlights, Remote Sens. Environ., 147, 173–185, https://doi.org/10.1016/j.rse.2014.03.004, 2014.