the Creative Commons Attribution 3.0 License.
the Creative Commons Attribution 3.0 License.
Particle swarm optimization for the estimation of surface complexation constants with the geochemical model PHREEQC-3.1.2
Ramadan Abdelaziz
Broder J. Merkel
Mauricio Zambrano-Bigiarini
Sreejesh Nair
Sorption of metals on minerals is a key process in treatment water, natural aquatic environments, and other water-related technologies. Sorption processes are usually simulated with surface complexation models; however, identifying numeric values for the thermodynamic constants from batch experiments requires a robust parameter estimation technique that does not get trapped in local minima. Recently, particle swarm optimization (PSO) techniques have attracted many researchers as an efficient and effective optimization technique to find (near-)optimum model parameters in several fields of research. In this work, uranium at low concentrations was sorbed on quartz at different pH, and the hydroPSO R optimization package was used – the first time – to calibrate the PHREEQC geochemical model, version 3.1.2. Results show that thermodynamic parameter values identified with hydroPSO are more reliable than those identified with the well-known parameter estimation (PEST) software, when both parameter estimation software are coupled to PHREEQC using the same thermodynamic input data. In addition, post-processing tools included in hydroPSO were helpful for the correct interpretation of uncertainty in the obtained model parameters and simulated values. Thus, hydroPSO proved to be an efficient and versatile optimization tool for identifying reliable thermodynamic parameter values of the PHREEQC geochemical model.
- Article
(1148 KB) - Full-text XML
- BibTeX
- EndNote


Particle swarm optimization technique (PSO) is an evolutionary optimization technique proposed by Eberhart and Kennedy (1995) and was influenced by the activities of flocks of birds in search of corn (Kennedy and Eberhart, 1995; Eberhart and Kennedy, 1995). Both PSO and genetic algorithms (GAs) share a few similarities (Eberhart and Shi, 1998). GAs have evolutionary operators like crossover or selection, while PSO does not have it (Eberhart and Shi, 1998). Recently, PSO has been implemented in a wide range of applications, e.g., in the water resources (e.g., Bisselink et al. 2016; Zambrano-Bigiarini and Rojas, 2013; Abdelaziz and Zambrano-Bigiarini, 2014; Formetta et al., 2014), geothermal resources (Ma et al., 2013; Beck et al., 2010), finance and economics (Das, 2012), structural design (Kaveh and Talatahari, 2009; Schutte and Groenwold, 2003), and applications of video and image analysis (Donelli and Massa, 2005; Huang and Mohan, 2007; Abdelaziz et al., 2018). For example, the groundwater model MODFLOW2000/2005 was linked with PSO to estimate permeability coefficients (Sedki and Ouazar, 2010) and a multi-objective PSO code was used to derive rainfall–runoff model parameters by introducing the Pareto rank concept (Gill et al., 2006). Notwithstanding recent popularity, PSO has never been used to calculate the parameters of a surface complexation model (SCM) simulating sorption behavior of metal and metalloids on mineral surfaces. Hence, this paper attempts to examine the efficiency and effectiveness of PSO for parameter estimation of a surface complexation model as the PHREEQC (Parkhurst and Appelo, 1999).
Nowadays, a number of PSO software codes exist, such as MADS (Harp and Vesselinov, 2011; Vesselinov and Harp, 2012) and OSTRICH (Matott, 2005), with most of the codes using the basic PSO formulation developed in 1995. However, in this paper, we use the latest standard particle swarm optimization proposed in literature (Clerc, 2012; Zambrano-Bigiarini et al., 2013), named SPSO2011, as implemented in the hydroPSO R package (R Core team, 2016) version 0.3-3 (Zambrano-Bigiarini and Rojas, 2013, 2014). hydroPSO is an independent R package that includes the newest standard PSO (SPSO-2011), which was specifically developed to calibrate a wide range of environmental models. In addition, the plotting functions in hydroPSO are user-friendly and aid the numeric and visual interpretation of the optimization results. The source code, installation files, tutorial (vignette), and manual are available on https://cran.r-project.org/web/package=hydroPSO (last access: 12 June 2018).
hydroPSO is used in this article, for the first time, to estimate the parameters of a surface complexation for uranium(VI)–quartz system, to properly capture the non-linear interactions between the model parameters. The aim of this article is to examine the suitability of hydroPSO as a global optimization tool for parameter estimation of geochemical models, in particular PHREEQC v3.1.2. To this end, surface/sorption reaction constants (logK) of the SCM obtained with hydroPSO will be compared to those previously obtained with parameter estimation (PEST) software (Doherty, 2010) by Nair et al. (2014).
PEST and PSO are both model-independent parameter optimizers; i.e., they do not require making any change to the model code. PEST uses the Gauss–Marquardt–Levenberg method to minimize, in the weighted least squares sense, the differences between observations and the corresponding model-simulated values (Abdelaziz and Bakr, 2012; Edet et al., 2014). PEST is a gradient-based algorithm that initially calculates the Jacobian matrix and is then used to build and upgrade parameter set, to enhance the searching ability to obtain a better objective function value (Doherty, 2010). The model then iterates adjusting the model parameters on the basis of a new Marquardt lambda value (Doherty, 2010), which drives the objective function for faster convergence. As a local optimizer, PEST is sensitive to the initial condition (see a complete description in Doherty, 2010). In contrast, PSO is global optimizer which randomly initializes a population of particles within the D-dimensional parameter space. PSO allows initializing the position of each particle using a random uniform distribution or Latin hypercube sampling (LHS), while velocities can be initialized at zero, with two different random distributions, or with two different LHS strategies (see Zambrano-Bigiarini and Rojas, 2013). Velocity and position of each particle in the parameter space are updated in successive iterations following equations specific to the selected PSO version (see a complete description in Zambrano-Bigiarini and Rojas, 2013, and Abdelaziz and Zambrano-Bigiarini, 2014). As a state-of-the-art global optimizer, PSO is less subject get trapped in local minima compared to PEST.
PHREEQC version 3.1.2 (Parkhurst and Appelo, 1999) and the database of Nuclear Energy Agency thermodynamic (NEA_2007) (Grenthe et al., 2007), as well as the LLNL database (Lawrence Livermore National Laboratory) are used to model sorption of metal species. Both databases were modified by setting constant values for and species (M equals Ca, Mg, Sr) obtained from Geipel et al. (2008) and Dong and Brooks (2006, 2008). PHREEQC is a geochemical software which is able to simulate sorption, surface complexation, and other types of reactions. SCMs are considered to be able to describe the processes at liquid–solid interfaces (Huber and Lützenkirchen, 2009), and have been widely used to simulate the sorption of metal species from aqueous solution depending on its concentration, pH value, ionic strength, and redox conditions (Davis et al., 2004; Štamberg et al., 2003; Zheng et al., 2003). A different group of reactions has taken place between aqueous species in the bulk solution and the surface of the sorbent leads to the formation of surface complexes (Nair et al., 2014). The surface complexation constants for these reactions are indispensable and independent of changes in solution condition or solution complex (Dzombak and Morel, 1990; Hayes et al., 1991; Volesky, 2003).
Table 1Complexation reactions with their respective logK range values.

Q_xOH is the silanol surface site.
There are different type of SCMs, such as the generalized two-layer model (GTLM), non-electrostatic model (NEM), constant capacitance model (CCM), diffuse-layer model (DLM), and modified triple-layer model (modified TLM). Here, a GTLM (Dzombak and Morel, 1990) was used to simulate the sorption behavior of U(VI) on quartz. The GTLM was used instead of other models because it is relatively simple and can be used in a wide range of chemical conditions. A comprehensive review of the GTLM is presented in Dzombak and Morel (1990). Quartz is a non-porous and non-layered mineral, and therefore the actual area of surface is supposed to be equal to the specific surface area. In this study, the surface of quartz is considered as a single binding site which takes the charge for every surface reaction. The sorption reactions and logK values are related to the aqueous species and thus depend on the thermodynamic database used. Uranyl carbonate complexes ((UO2)2CO3(OH)3−, , and ) are the dominant species under our experimental conditions. Therefore, the surface complexation reactions for quartz were calculated with respect to these species.
The sorption of U(VI) on quartz was investigated and discussed by Huber and Lützenkirchen (2009) without considering the formation of alkaline metal uranyl carbonates. The formation of Mg-, Ca-, and Sr–uranyl-carbonato complexes shows a significant impact on the sorption of uranium on quartz. This was studied by Nair and Merkel (2011) in batch experiments adding 10 g of powdered quartz to 0.1 L of water containing rather low U(VI) concentrations ( M) in the absence and presence of Mg, Sr, and Ca (1 mM) at a pH value between 9 and 6.5 in steps of 0.5. NaHCO3 ( M) and NaCl ( M) were used as ionic strength buffers. The low U concentrations were used to avoid precipitation of Ca–U carbonates. In the absence of alkaline earth elements, the percentage of uranium was sorbed on quartz approximately 90 % independent from pH. In the existence of Mg, Sr, and Ca, the percentage of sorption of uranium on quartz decreased to 50 %, 30 %, and 10 % respectively (Nair and Merkel, 2011). In this paper, the surface was the generalized two-layer model and was taken from Dzombak and Morel (1990) with no explicit calculation of the diffuse-layer composition.
Table 1 displays the parameter ranges used to optimize the six parameters selected to calibrate PHREEQC, based on Nair et al. (2014).
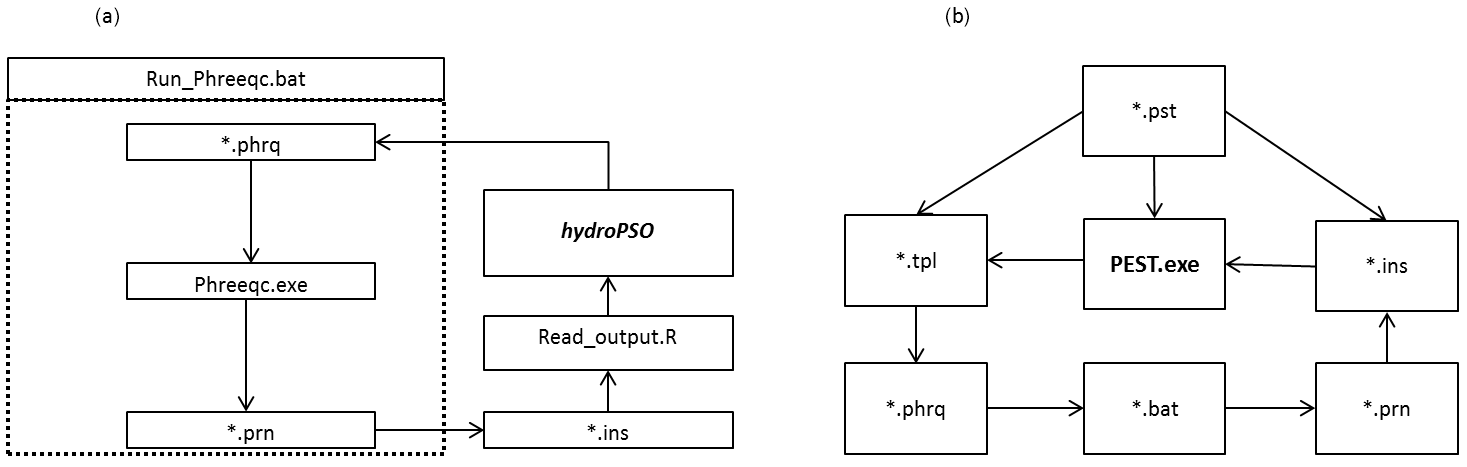
Figure 1Flow chart used to couple (a) PHREEQC with hydroPSO and (b) PHREEQC with PEST for inverse modeling of surface complexation constants for uranium carbonate (U(VI)) species on quartz using the PHREEQC geochemical model.
Inverse modeling is a complex issue for modelers as a result of the numerous uncertainties in model parameters and observations (e.g., Carrera et al., 2005; Beven, 2006). PSO is an evolutionary optimization algorithm originally developed by Kennedy and Eberhart (1995), which has proven to be highly efficient when solving a large collection of case studies from different disciplines (see, e.g., Poli, 2008). In PSO, each individual of the population searches for the global optimum in a multi-dimensional parameter space, considering the individual and collective past experiences. The canonical PSO algorithm starts with a random initialization of the particles' positions and velocities within the parameter space. Velocity and position of each particle in the parameter space are updated in successive iterations following equations specific to the selected PSO version, in order to find the minimum or (maximum) value of a user-defined objective function (see a complete description in Zambrano-Bigiarini and Rojas, 2013). In the last decades, several improvements have been proposed to the canonical PSO algorithm, and the selected optimization tool implements several of them in a single piece of software. The hydroPSO R package v0.3-3 (Rojas and Zambrano-Bigiarini, 2012; Zambrano-Bigiarini and Rojas, 2013, 2014) is a model-independent optimization package, which implements a state-of-the-art PSO algorithm to carry out a global parameter optimization, and it has been successfully applied as calibration tool for both hydrogeological and hydrological models (Zambrano-Bigiarini and Rojas, 2013; Thiemig et al., 2013; Abdelaziz and Zambrano-Bigiarini, 2014; Bisselink et al., 2016). In particular, hydroPSO implements six PSO variants (equations used to update particles' position and velocities), four topologies (ways in which particles are linked during each iteration), two initialization of particles' positions (random uniform distribution or Latin hypercube sampling), and five alternatives for initializing particles' velocities, among other fine-tuning options (see Zambrano-Bigiarini and Rojas, 2013). In the application of hydroPSO to PHREEQC, the following configuration was used: a swarm with 10 particles, 200 iterations, LH initialization of particle positions and velocities, random topology with five informants, acceleration coefficients c1 and c2 equal to 2.05, linearly decreasing clamping factor for Vmax in the range [1.0, 0.5], and use of Clerc's constriction factor instead of the inertia weight. hydroPSO requires no instruction or template files as UCODE (Poeter et al., 2005; Abdelaziz and Merkel, 2015) and PEST software (Doherty, 2010, 2013) do. In order to couple hydroPSO with the PHREEQC geochemical model, three text files have to be prepared by the user to handle data transfer between the model code and the optimization engine. These files include (i) ParamFiles.txt, which describes the names of a set of parameters to be estimated and locations in the model input files to be utilized in the inverse modeling, (ii) ParamRanges.txt, which defines the minimum and maximum values that each selected parameter might have during the optimization, and (iii) PSO_OBS.txt, which contains the observations that will be compared against its simulated counterparts. In addition, a user-defined R script file (Read_output.R) should define the instructions to read model outputs. Finally, for coupling hydroPSO with PHREEQC, an R script template provided by hydroPSO developers was slightly modified by the user in order to carry out the optimization. Figure 1a shows a flow chart that depicts how hydroPSO is coupled with PHREEQC to calibrate its parameters. Run-phreeqc.bat is a batch file to run PHREEQC-3.1.2 in the DOS environment, which reads *.phrq files to produce *.prn files as output (simulated data); *.ins files are instructions to read model outputs, by using the Read_output.R script. At each iteration, hydroPSO modifies model parameter values to minimize the value of the user-defined objective function. Finally, the new parameter values are updated following the locations provided in the “ParamFiles.txt” file. In contrast, to couple PEST with PHREEQC, four files are required. These include (i) template files (*.tpl), (ii) instruction files (*.ins), (iii) a main control file (*.pst), and (iv) a batch file to execute PHREEQC and PEST(*.bat). Template files are built to modify the input files for PHREEQC with other values while an instruction file is used to extract the simulated values from the output file for PHREEQC. The main control file includes the model application to be run, the observations, parameters to be estimated, control data keywords, and others. Further information about PEST can be found in its manual (Doherty, 2010). Figure 1a, b show the key files used to couple PHREEQC with hydroPSO and explain the flowchart and files involved in the inverse modeling of the surface complexation constants for the U(VI) sorption model.
For numerical optimization, the residual sum of squares (RSS or SSR; see Eq. 1) was utilized to compute the goodness of fit (GoF) between the corresponding model outputs () and observed U-carbonate concentration values ( at different pH values for every iteration step i; n is the number of observation points (measured sorption U(VI) onto quartz). Minimizing the residual sum of squares was chosen as the method for estimating the surface/sorption reaction constants in calibrations by Nair et al. (2014) when PEST was combined with PHREEQC. It was decided for consistency to select SSR as the criterion for goodness of fit when applying hydroPSO with PHREEQC. After some initial trials, the number of maximum iterations (T) was set to 200 and the number of particles used to search for the minimum RSS in the parameter space was fixed at 10 (i.e., 2000 model runs). All the input files required for running PHREEQC and hydroPSO can be found at Zenodo (https://zenodo.org/record/1044951#.WgVTbVuCzIU, last access: 10 November 2017), including all the optimization results.
One approach to evaluate model performance is by plotting the simulation against observed values (i.e., visualizing model outputs), as shown in Fig. 1. The coefficient of determination (R2) for the relation between calculated and observed values is 0.89, indicating that the simulated values obtained with the best parameter set found by hydroPSO are able to explain a good portion of the variability of the response data (Fig. 2).
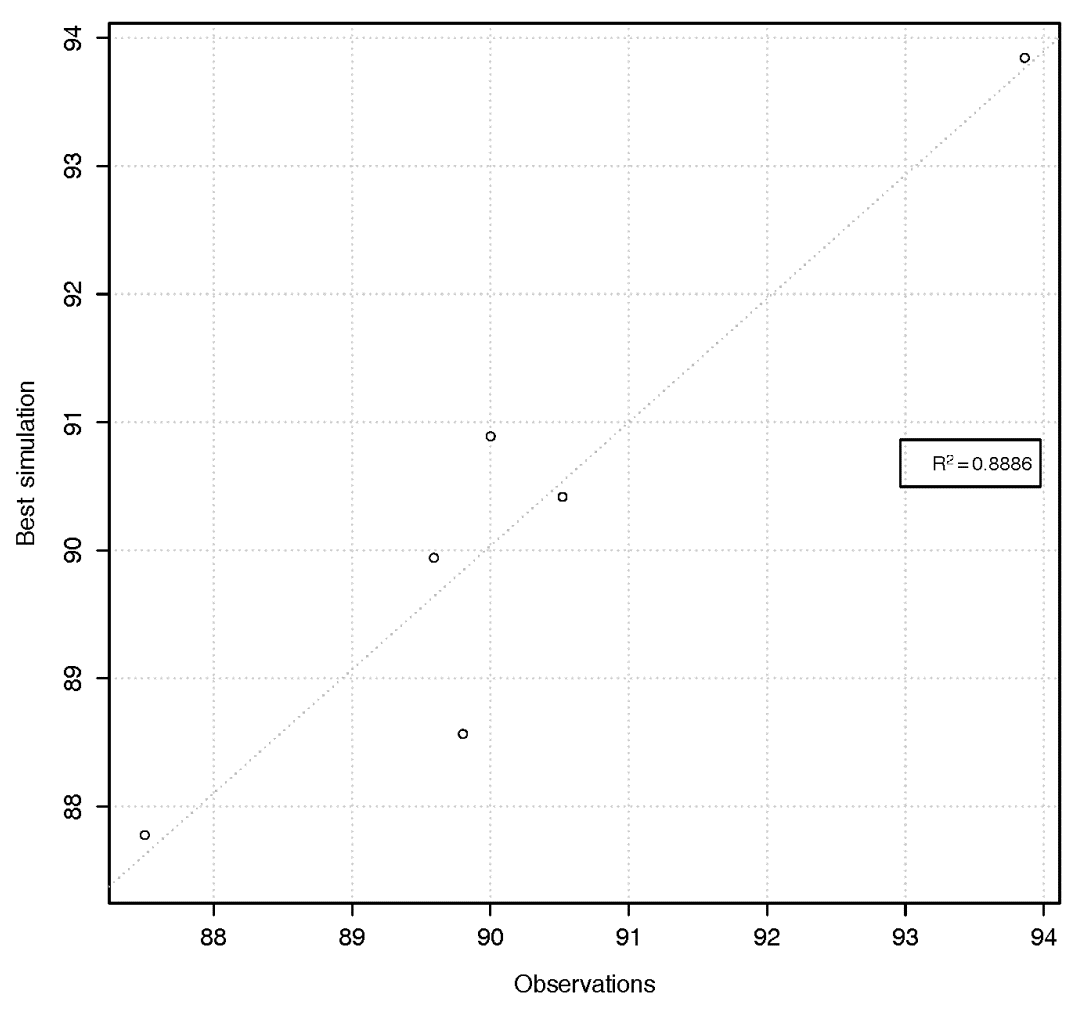
Figure 2Scatter plot with the experimentally observed and calculated values of uranium carbonate (sorption percentage).
In hydroPSO, there are two types of criteria for convergence:
-
“absolute”, when the global optimum found in a given iteration is below/above a user-defined threshold (useful for minimization/maximization problems where the true minimum/maximum is known); and
-
“relative”, when the absolute difference between the model performance in the current iteration and the model performance in the previous iteration for the best performing particle is less than or equal to a user-defined threshold (useful to prevent too many model runs without any improvement in the optimum found by the algorithm).
If none of the two previous criteria are met, then the algorithm stops when the user-defined number of iterations is finally achieved. Figure 3 shows the evolution of the best model performance (i.e., smallest RSS) found by all the particles in a given iteration, and the normalized swarm radius (δnorm, a measure of the spread of the population in the range of search-space) versus the iterations number. One may observe that both δnorm and the best model performance become smaller with an increasing iteration number, which indicates that the main particles are “flying” around a small region within the parameter space. Only 100 iterations (i.e., model runs) were enough to reach the region of the global optimum (i.e., RSS ca. 2.52), and the remaining iterations were just used to refine the search, as shown in Fig. 3.
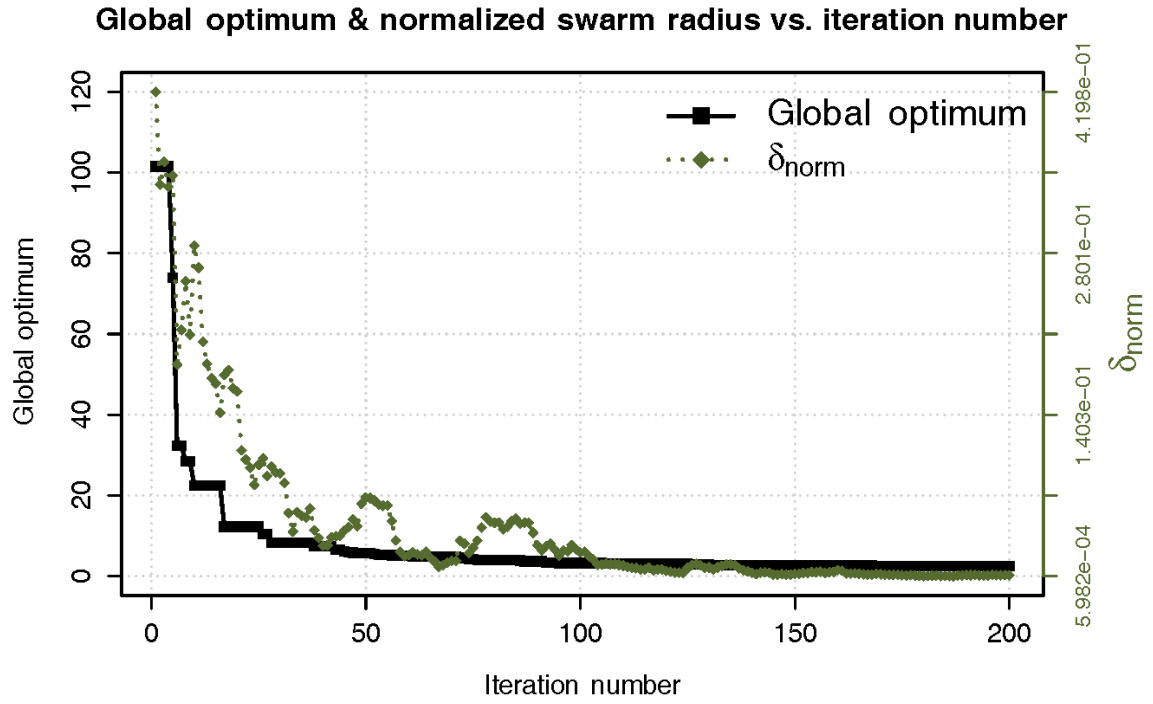
Figure 3Evolution of the normalized swarm radius (δ norm) and the global optimum (SSR) over 200 iterations.
The boxplots in Fig. 4 are graphical representations of the values sampled during optimization. The bottom and top of the box show the first and third quartiles of the distribution of each one of the surface/sorption reaction constants (logK) sampled during the optimization, respectively. The horizontal line within the box denotes the median of the distribution. Points outside the whiskers are considered to be outliers, where notches are within , IQR represents the interquartile range and n the total number of parameter sets used in the optimization. The horizontal red lines in Fig. 4 point out the optimum value found during optimization for each parameter.
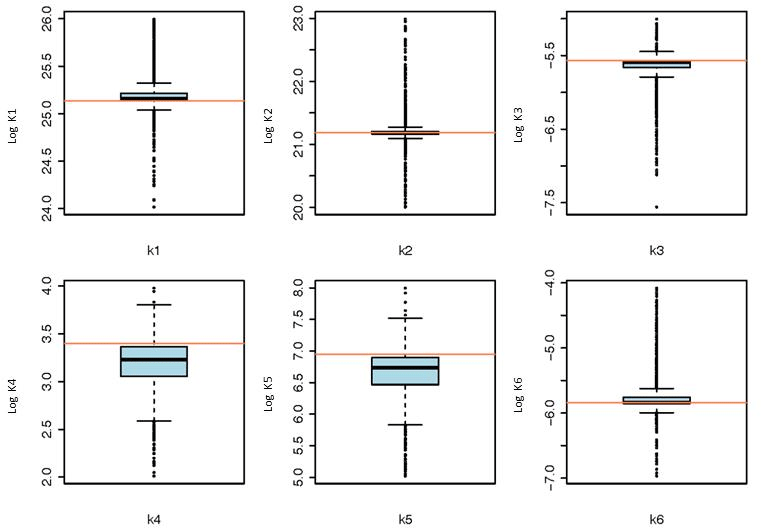
Figure 4Boxplots for the optimized parameters. The horizontal red lines indicate the optimum value for each parameter. Parameter names are defined in Table 1.

Quasi-three-dimensional dotty plots in Fig. 5 depict the goodness-of-fit values achieved by different parameter sets. They are suitable for identifying ranges where different sets of parameters lead to the same model performance (equifinality, Beven, 2006). So, Fig. 5 also shows the model performance as function of the interaction of different parameter ranges. The (quasi-)three-dimensional dotty plot shown in Fig. 5 is a projection of the values of pairs of parameters onto the RSS response surface. Parameter values where the model presents high performance are shown in light blue (points density), whilst the parameter values where the model shows low performance are shown in dark red (points density). Figure 5 was used to identify regions of the solution space with good and bad model performance.
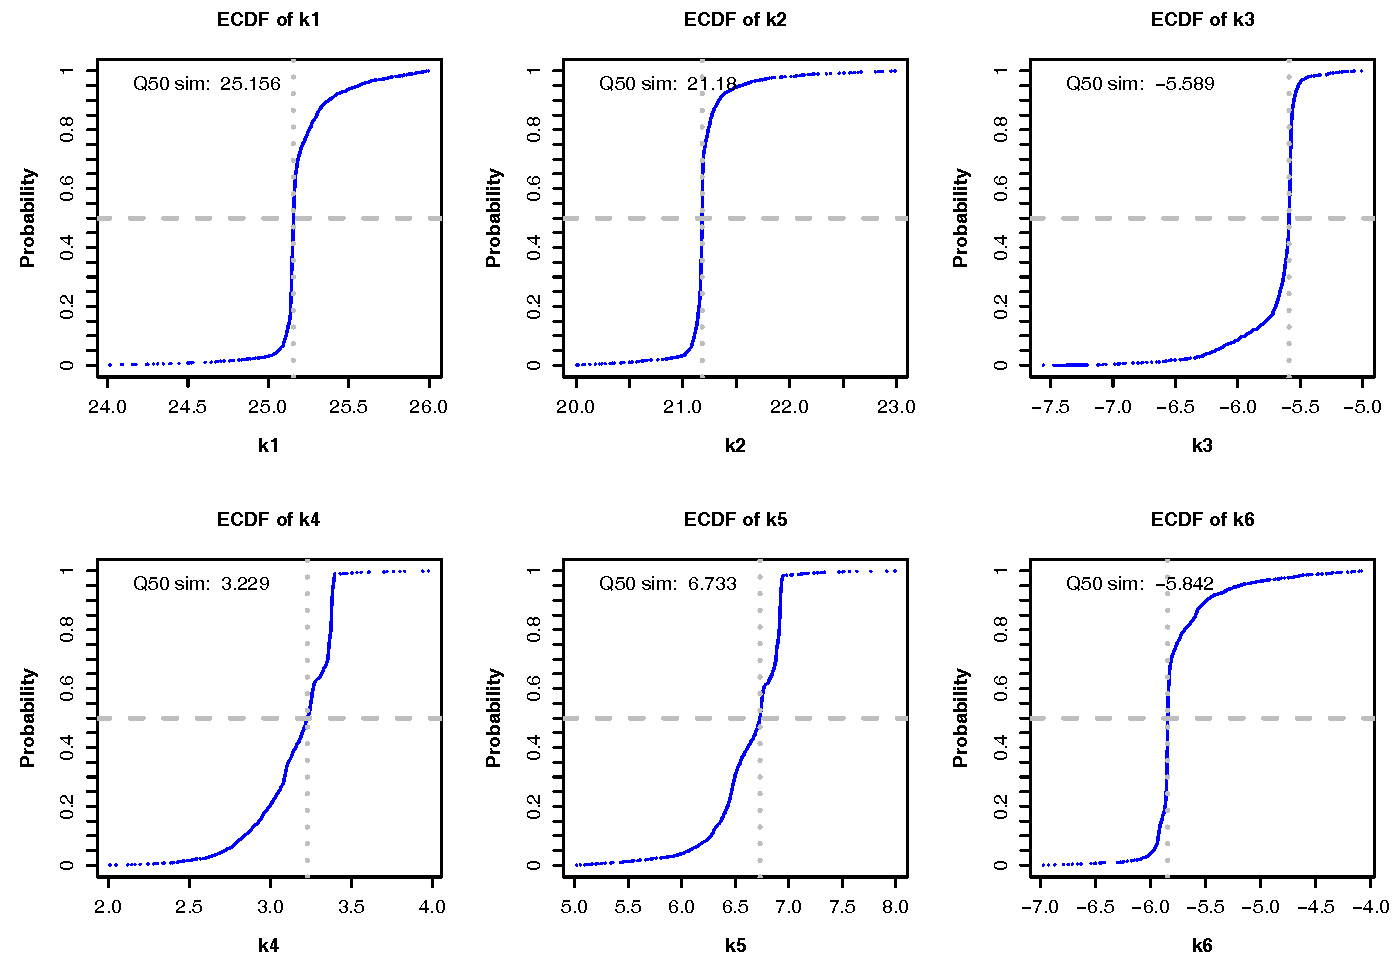

Figure 7Histograms of calibrated parameter values. Horizontal axis shows the sampled range for each parameter, and the vertical axis represents the amount of parameter sets in each of the classes used to divide the horizontal axis.
Visual inspection of Fig. 5 shows a good exploratory capability of PSO because the particles are well spread over the entire range space. It is clearly visible that the parameter samples are denser around the optimum value (lowest SSR), showing a small uncertainty range around the optimum value.
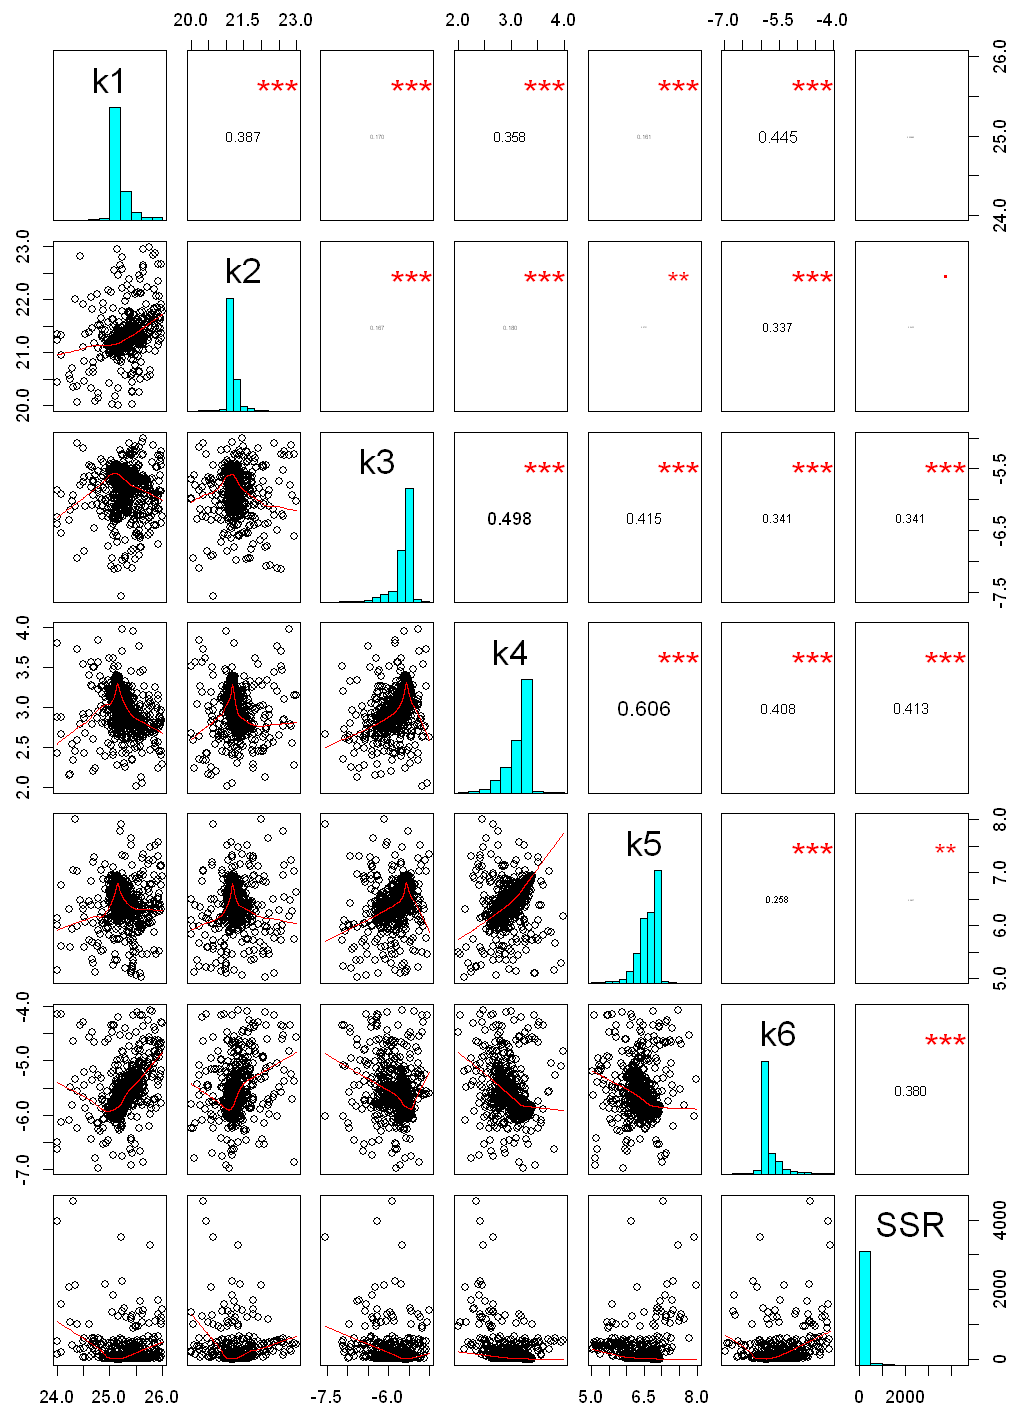
Figure 8Correlation matrix between model performance (SSR) and calibrated parameters. Red lines represent lowest smoothing, using locally weighted polynomial regression, and numbers in the upper panel represents the Pearson-moment correlation coefficient between each pair of parameters. Vertical and horizontal axes illustrate the physical range utilized for parameter optimization. stands for a p<0.001; stands for p<0.01, according to level of statistical significance
Figures 6 and 7 give a graphical summary for optimized parameters. Empirical cumulative density functions (ECDFs) in Fig. 6 show the sampled frequencies for the six calibrated parameters. The horizontal gray dotted lines show the median of the distribution (cumulative probability equal to 0.5), while the vertical gray dotted lines depict the corresponding parameter value displayed at the top of every panel in Fig. 6. The thin vertical red line in Fig. 7 points out the optimum value achieved for each parameter. Histograms in Fig. 7 show near-normal distributions for K1 and K2, while K4 and K5 follow a skewed distribution with sampled values concentrated near the upper boundary of each parameter.
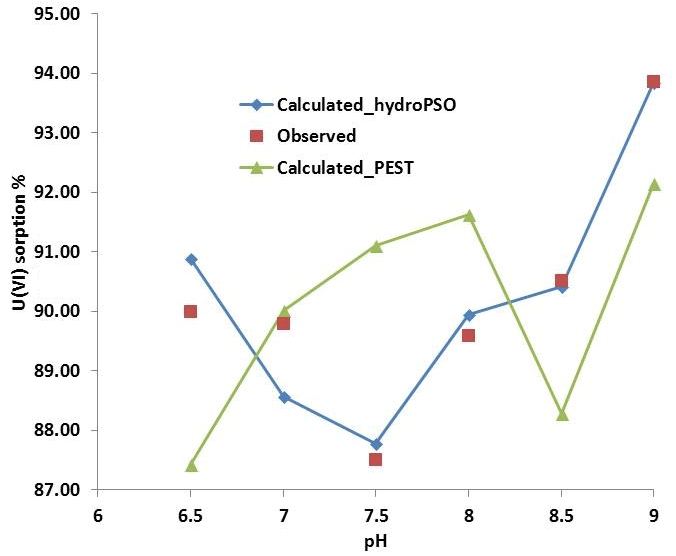
Figure 9Observed and simulated sorption of uranium in quartz vs. pH with both PEST and hydroPSO calibrated logK values.
Figure 8 illustrates the correlation matrix among K values and model performance (SSR), with horizontal and vertical axes displaying the ranges used for the calibration of each parameter. The figure shows that the highest correlation coefficient occurred among the measure of model performance (SSR) and K4, K6, and K3. In addition, a higher correlation coefficient was observed between K4 and K5, K3 and K4, and K1 and K6.
Figure 9 shows the model output using hydroPSO fitted logK values and the monitored sorption ratio.
It is worthwhile to mention that the surface complexation constants for Eqs. (1), (2), and (5) (Table 1) are more important, and the equations that are less important are Eqs. (3), (4), and (6) in optimizing the logK values. It proves that , , and are the most dominant species for sorption on quartz. The surface complexation constants for Eqs. (2) and (4) were 21.18 and 3.229, respectively (Nair et al., 2014), which is higher than the electrostatic (ES) and non-electrostatic (NES) models, while the optimized value for Eq. (1) is 25.156, which is higher than the NES model and almost the same as the ES model (Nair et al., 2014).
The experimental conditions used to calibrate PHREEQC with hydroPSO were the same as during the PEST optimization carried out by Nair et al. (2014). In other words, PEST was applied for the same experiment and the same data, and Fig. 9 shows that the logK values obtained with hydroPSO are better than those obtained by PEST, except for pH = 7. The main reason is that PSO is a global optimization technique, which searches for optimum values in the whole parameter space using the parameter ranges given in Table 1, while PEST searches in a neighborhood of the initial solution. In particular, local optimization carried out by PEST minimize a weighted least squares objective function via the Gauss–Marquardt–Levenberg non-linear regression method (Marquardt, 1963). Actually, a major drawback of PEST, as of all gradient-based techniques, is the dependency of the quality of the optimization results upon the initial point used for the optimization, which might lead to a local optimum rather than the global one. Thus, PSO techniques offer promising possibilities for similar surface complexation and reactive transport applications in hydrogeology and hydrochemistry.
The coupling of hydroPSO and PHREEQC was successfully carried to estimate surface complexation constants for uranium (VI) species on quartz, based on a data set published by Nair and Merkel (2011), and Nair et al. (2014). The open-source hydroPSO R package proved to be a useful tool for inverse modeling of surface complexation models with PHREEQC and allowed a prompt evaluation of the calibration results. Furthermore, thermodynamic values obtained with hydroPSO provided a better match to observation sorption rates in comparison to those obtained with PEST, using the same input data and experimental setup.
PHREEQC is available at http://www.hydrochemistry.eu/ph3/index.html (Parkhurst and Appelo, 2016). Source code, tutorials, and the reference manual of hydroPSO can be obtained from https://CRAN.R-project.org/package=hydroPSO (Zambrano-Bigiarini and Rojas, 2012). The PHREEQC model input files along with the R scripts used for coupling it with hydroPSO and the model outputs can be obtained from the Zenodo repository (https://zenodo.org/record/1044951#.WgVTbVuCzIU, last access: 10 November 2017; Abdelaziz, 2017).
All authors contributed to the writing of the paper. RA developed the coupling of PHREEQC and hydroPSO, carried out all simulations, and prepared the manuscript. MZB, BJM, and SN were involved in visualizing and writing some chapters. RA and co-authors contributed in reviewing and editing.
The authors declare that they have no conflict of interest.
The authors thank the topical editor Claire Levy and the anonymous reviewers
whose helped us to improve the original manuscript
significantly. The authors would also like to thank Autumn Dinkelman for proofreading this paper.
Edited by: Claire Levy
Reviewed by: two anonymous referees
Abdelaziz, R.: Coupling of hydroPSO and PHREEQC (Version version3) [Data set], Zenodo, https://doi.org/10.5281/zenodo.1044951, 2017.
Abdelaziz, R. and Bakr, M. I.: Inverse modeling of groundwater flow of Delta Wadi El-Arish, J. Water Resour. Protect., 4, 432, https://doi.org/10.4236/jwarp.2012.47050, 2012.
Abdelaziz, R. and Merkel, B. J.: Sensitivity analysis of transport modeling in a fractured gneiss aquifer, J. Afr. Earth Sci., 103, pp.121-127, https://doi.org/10.1016/j.jafrearsci.2014.12.003, 2015.
Abdelaziz, R. and Zambrano-Bigiarini, M.: Particle Swarm Optimization for inverse modeling of solute transport in fractured gneiss aquifer, J. Contam. Hydrol., 164, 285–298, https://doi.org/10.1016/j.jconhyd.2014.06.003, 2014.
Abdelaziz, R., El-Rahman, Y. A., and Wilhelm, S.: Landsat-8 data for chromite prospecting in the Logar Massif, Afghanistan, Heliyon, 4, e00542, https://doi.org/10.1016/j.heliyon.2018.e00542, 2018.
Beck, M., Hecht-Méndez, J., de Paly, M., Bayer, P., Blum, P., and Zell, A.: Optimization of the energy extraction of a shallow geothermal system, 2010 IEEE Congress on Evolutionary Computation, 1–7, https://doi.org/10.1109/cec.2010.5585921, 2010.
Beven, K.: A manifesto for the equifinality thesis, J. Hydrol., 320, 18–36, https://doi.org/10.1016/j.jhydrol.2005.07.007, 2006.
Bisselink, B., Zambrano-Bigiarini, M., Burek, P., and de Roo, A.: Assessing the role of uncertain precipitation estimates on the robustness of hydrological model parameters under highly variable climate conditions, J. Hydrol., 8, 112–129, https://doi.org/10.1016/j.ejrh.2016.09.003, 2016.
Clerc, M.: Standard Particle Swarm Optimisation, Technical Report, Particle Swarm Central, available at: http://clerc.maurice.free.fr/pso/SPSO_descriptions.pdf, last access: 24 September 2012.
Carrera, J, Alcolea, A., Medina, A., Hidalgo, J., and Slooten, L. J.: Inverse problem in hydrogeology, Hydrogeol. J., 13, 206–222, https://doi.org/10.1007/s10040-004-0404-7, 2005.
Das, P.: Economics of Distributed Generation Using Particle Swarm Optimization: A Case Study, Economics, International Journal of Science, Engineering and Technology Research (IJSETR) vol. 1, issue 5, available at: http://ijsetr.org/wp-content/uploads/2013/08/IJSETR-VOL-1-ISSUE-5-191-199.pdf (last access: January 2017), 2012.
Davis, J. A., Meece, D. E., Kohler M., and Curtis, G. P.: Approaches to surface complexation modeling of uranium(VI) adsorption on aquifer sediments, Geochim. Cosmochim. Ac., 68, 3621–3641, https://doi.org/10.1016/j.gca.2004.03.003, 2004.
Doherty, J.: PEST: Model-independent Parameter Estimation, User Manual, 5th edn., Watermark Numerical Computing, Brisbane, Queensland, Australia, 2010.
Doherty, J.: Addendum to the PEST manual, Technical Report Watermark Numerical Computing, Brisbane, Queensland, Australia, 2013.
Donelli, M. and Massa, A.: Computational approach based on a particle swarm optimizer for microwave imaging of two-dimensional dielectric scatterers, IEEE T. Microw. Theory, 53, 1761–1776, https://doi.org/10.1109/tmtt.2005.847068, 2005.
Dong, W. M. and Brooks, S. C.: Determination of the formation constants of ternary complexes of uranyl and carbonate with alkaline earth metals (Mg2+, Ca2+, Sr2+, and Ba2+) using anion exchange method, Environ. Sci. Technol., 40, 4689–4695, https://doi.org/10.1021/es0606327, 2006.
Dong, W. M. and Brooks, S. C.: Formation of aqueous MgUO2(CO complex and uranium anion exchange mechanism onto an exchange resin, Environ. Sci. Technol., 42, 1979–1983, https://doi.org/10.1021/es0711563, 2008.
Dzombak, D. A. and Morel, F. M.: Surface complexation modeling: Hydrous ferric oxide, John Wiley & Sons, New York, 1990.
Eberhart, R. and Kennedy, J.: A new optimizer using particle swarm theory, Proceedings of the Sixth International Symposium on Micro Machine and Human Science, MHS'95, 39–43, https://doi.org/10.1109/mhs.1995.494215, 1995.
Eberhart, R. C. and Shi, Y.: Comparison between genetic algorithms and particle swarm optimization, in: Evolutionary Programming VII, edited by: Porto, V., Saravanan, N., Waagen, D., and Eiben, A., Springer, Berlin, Heidelberg, 1447, 611–616, https://doi.org/10.1007/BFb0040812, 1998.
Edet, A., Abdelaziz, R., Merkel, B., Okereke, C., and Nganje, T.: Numerical groundwater flow modeling of the coastal plain sand aquifer, Akwa Ibom State, SE Nigeria, J. Water Resour. Protect., 6, 43934, https://doi.org/10.4236/jwarp.2014.64025, 2014.
Formetta, G., Kampf, S. K., David, O., and Rigon, R.: Snow water equivalent modeling components in NewAge-JGrass, Geosci. Model Dev., 7, 725–736, https://doi.org/10.5194/gmd-7-725-2014, 2014.
Geipel, G., Amayri, S., and Bernhard, G.: Mixed complexes of alkaline earth uranyl carbonates: a laser-induced time-resolved fluorescence spectroscopic study, Spectrochim. Acta A, 71, 53–58, https://doi.org/10.1016/j.saa.2007.11.007, 2008.
Gill, M. K., Kaheil, Y. H., Khalil, A., McKee, M., and Bastidas, L.: Multiobjective particle swarm optimization for parameter estimation in hydrology, Water Resour. Res., 42, W07417, https://doi.org/10.1029/2005WR004528, 2006.
Grenthe, I., Fuger, J., Konings R., Lemire, R. J., Muller, A. B., and Wanner, J.: The Chemical Thermodynamics of Uranium, Elsevier, New York, 2007.
Harp, D. and Vesselinov, V. V.: Recent developments in MADS algorithms: ABAGUS and Squads, EES-16 Seminar Series, LA-UR-11-11957, 2011.
Hayes, K. F., Redden, G., Ela, W., and Leckie, J. O.: Surface complexation models: an evaluation of model parameter estimation using FITEQL and oxide mineral titration data, J. Colloid Interf. Sci., 142, 448–469, https://doi.org/10.1016/0021-9797(91)90075-j, 1991.
Huang, F. Y., Li, R. J., Liu, H. X., and Li, R.: A modified particle swarm algorithm combined with fuzzy neural network with application to financial risk early warning, in: Services Computing, 2006, APSCC'06, IEEE Asia-Pacific Conference, 168–173, https://doi.org/10.1109/apscc.2006.12, 2006.
Huang, T. and Mohan, A. S.: A microparticle swarm optimizer for the reconstruction of microwave images, IEEE T. Antenn. Propag., 55, 568–576, https://doi.org/10.1109/tap.2007.891545, 2007.
Huber, F. and Lützenkirchen, J.: Uranyl Retention on Quartz-New Experimental Data and Blind Prediction Using an Existing Surface Complexation Model, Aquat. Geochem., 15, 443–456, https://doi.org/10.1007/s10498-009-9060-9, 2009.
Kaveh, A. and Talatahari, S.: A particle swarm ant colony optimization for truss structures with discrete variables, J. Constr. Steel Res., 65, 1558–1568, https://doi.org/10.1016/j.jcsr.2009.04.021, 2009.
Kennedy, J. and Eberhart, R.: Particle swarm optimization, in: neural networks, 1995, Proceedings IEEE International Conference on Neural Networks, 1942–1948, https://doi.org/10.1109/icnn.1995.488968, 1995.
Ma, R. J., Yu, N. Y., and Hu, J. Y.: Application of particle swarm optimization algorithm in the heating system planning problem, Sci. World J., 2013, 718345, https://doi.org/10.1155/2013/718345, 2013.
Marquardt, D.: An algorithm for least-squares estimation of nonlinear parameters, J. Soc. Ind. Appl. Math., 11, 431–441, https://doi.org/10.1137/0111030, 1963.
Matott, L.: Ostrich: An Optimization Software Tool, Documentation and User's Guide, Version 1.6, Department of Civil, Structural and Environmental Engineering, University at Buffalo, Buffalo, NY, 2005.
Nair, S. and Merkel B. J.: Impact of Alkaline Earth Metals on Aqueous Speciation of Uranium(VI) and Sorption on Quartz, Aquat. Geochem., 17, 209–219, https://doi.org/10.1007/s10498-011-9120-9, 2011.
Nair, S., Karimzadeh, L., and Merkel, B. J.: Surface complexation modeling of Uranium (VI) sorption on quartz in the presence and absence of alkaline earth metals, Environ. Earth Sci., 71, 1737–1745, https://doi.org/10.1007/s12665-013-2579-5, 2014.
Parkhurst, D. L. and Appelo, C. A.: User's Guide to PHREEQC (version 2). A Computer Program for Speciation, Batch-Reaction, One-Dimensional Transport, and Inverse Geochemical Calculation, USGS, Water Resources Investigation Report, 99–4259, https://doi.org/10.3133/wri994259, 1999.
Parkhurst, D. L. and Appelo, C. A.: PHREEQC v3.1.2 (Version v3.1.2), available at: http://www.hydrochemistry.eu/ph3/index.html (last access: July 2017), 2016.
Poeter, E., Hill, M., Banta, E., Mehl, S., and Christensen, S.: UCODE 2005 and six other computer codes for universal sensitivity analysis, calibration, and uncertainty evaluation, US Geological Survey Techniques and Methods, vol. 6-A11, https://doi.org/10.3133/tm6a11, 2005.
Poli, R.: Analysis of the publications on the applications of particle swarm optimisation, J. Artif. Evol. Appl., 2008, 685175, https://doi.org/10.1155/2008/685175, 2008.
R Core team: R: A Language and Environment for Statistical Computing, R Foundation for Statistical Computing. Vienna, Austria, available at: http://www.R-project.org/, last access: 10 March 2016.
Rojas, R. and Zambrano-Bigiarini, M.: Tutorial for interfacing hydroPSO with SWAT-2005 and MODFLOW-2005, Technical Report, available at: http://www.rforge.net/hydroPSO/files/hydroPSO_vignette.pdf (last access: 3 February 2014), 2012.
Schutte, J. F. and Groenwold, A. A.: Sizing design of truss structures using particle swarms, Struct. Multidiscip. O., 25, 261–269, https://doi.org/10.1007/s00158-003-0316-5, 2003.
Sedki, A. and Ouazar, D.: Swarm intelligence for groundwater management optimization, J. Hydroinform., 13, 520–532, https://doi.org/10.2166/hydro.2010.163, 2011.
Štamberg, K., Venkatesan, K. A., and Vasudeva Rao, P. R.: Surface complexation modeling of uranyl ion sorption on mesoporous silica, Colloid Surface A, 221, 149–162, https://doi.org/10.1016/s0927-7757(03)00139-0, 2003.
Thiemig, V., Rojas, R., Zambrano-Bigiarini, M., and De Roo, A.: Hydrological evaluation of satellite-based rainfall estimates over the Volta and Baro-Akobo Basin, J. Hydrol., 499, 324–338, https://doi.org/10.1016/j.jhydrol.2013.07.012, 2013.
Vesselinov, V. V. and Harp, D. R.: Adaptive hybrid optimization strategy for calibration and parameter estimation of physical process models, Comput. Geosci., 49, 10–20, https://doi.org/10.1016/j.cageo.2012.05.027, 2012.
Volesky, B.: Biosorption process simulation tools, Hydrometallurgy, 71, 179–190, https://doi.org/10.1016/s0304-386x(03)00155-5, 2003.
Zambrano-Bigiarini, M. and Rojas, R.: hydrPSO V0.3.3 (Version V0.3.3), available at: https://CRAN.R-project.org/package=hydroPSO (last access: 6 December 2018), 2012.
Zambrano-Bigiarini, M. and Rojas, R.: A model-independent Particle Swarm Optimisation software for model calibration, Environ. Model. Softw., 43, 5–25, https://doi.org/10.1016/j.envsoft.2013.01.004, 2013.
Zambrano-Bigiarini, M. and Rojas, R.: hydroPSO: Particle Swarm Optimisation, with focus on Environmental Models, available at: http://www.rforge.net/hydroTSM/ (last access: August 2017), R package version 0.3-3, 2014.
Zambrano-Bigiarini, M., Clerc, M., and Rojas, R.: Standard particle swarm optimisation 2011 at cec-2013: A baseline for future pso improvements, Evolutionary Computation (CEC), 2013 IEEE Congress, 2337–2344, https://doi.org/10.1109/cec.2013.6557848, 2013.
Zheng, Z., Tokunaga, T. K., and Wan, J.: Influence of calcium carbonate on U (VI) sorption to soils, Environ. Sci. Technol., 37, 5603–5608, https://doi.org/10.1021/es0304897, 2003.