the Creative Commons Attribution 4.0 License.
the Creative Commons Attribution 4.0 License.
 | 25 Mar 2019
Realized ecological forecast through an interactive Ecological Platform for Assimilating Data (EcoPAD, v1.0) into models
Yuanyuan Huang
Mark Stacy
Jiang Jiang
Nilutpal Sundi
Shuang Ma
Volodymyr Saruta
Chang Gyo Jung
Zheng Shi
Jianyang Xia
Paul J. Hanson
Daniel Ricciuto
Predicting future changes in ecosystem services is not only highly desirable but is also becoming feasible as several forces (e.g., available big data, developed data assimilation (DA) techniques, and advanced cyber-infrastructure) are converging to transform ecological research into quantitative forecasting. To realize ecological forecasting, we have developed an Ecological Platform for Assimilating Data (EcoPAD, v1.0) into models. EcoPAD (v1.0) is a web-based software system that automates data transfer and processing from sensor networks to ecological forecasting through data management, model simulation, data assimilation, forecasting, and visualization. It facilitates interactive data–model integration from which the model is recursively improved through updated data while data are systematically refined under the guidance of model. EcoPAD (v1.0) relies on data from observations, process-oriented models, DA techniques, and the web-based workflow.
We applied EcoPAD (v1.0) to the Spruce and Peatland Responses Under Climatic and Environmental change (SPRUCE) experiment in northern Minnesota. The EcoPAD-SPRUCE realizes fully automated data transfer, feeds meteorological data to drive model simulations, assimilates both manually measured and automated sensor data into the Terrestrial ECOsystem (TECO) model, and recursively forecasts the responses of various biophysical and biogeochemical processes to five temperature and two CO2 treatments in near-real time (weekly). Forecasting with EcoPAD-SPRUCE has revealed that mismatches in forecasting carbon pool dynamics are more related to model (e.g., model structure, parameter, and initial value) than forcing variables, opposite to forecasting flux variables. EcoPAD-SPRUCE quantified acclimations of methane production in response to warming treatments through shifted posterior distributions of the CH4:CO2 ratio and the temperature sensitivity (Q10) of methane production towards lower values. Different case studies indicated that realistic forecasting of carbon dynamics relies on appropriate model structure, correct parameterization, and accurate external forcing. Moreover, EcoPAD-SPRUCE stimulated active feedbacks between experimenters and modelers to identify model components to be improved and additional measurements to be taken. It has become an interactive model–experiment (ModEx) system and opens a novel avenue for interactive dialogue between modelers and experimenters. Altogether, EcoPAD (v1.0) acts to integrate multiple sources of information and knowledge to best inform ecological forecasting.
- Article
(3563 KB) - Full-text XML
-
Supplement
(897 KB) - BibTeX
- EndNote


One ambitious goal of ecology as a science discipline is to forecast states and services of ecological systems. Forecasting in ecology is not only desirable for scientific advances in this discipline but also has practical values to guide resource management and decision-making towards a sustainable planet Earth. The practical need for ecological forecasting is particularly urgent in this rapidly changing world, which is experiencing unprecedented natural resource depletion, increasing food demand, serious biodiversity crisis, accelerated climate changes, and widespread pollution in the air, waters, and soils (Clark et al., 2001; Mouquet et al., 2015). As a result, a growing number of studies have reported forecasting of, e.g., phenology (Diez et al., 2012), carbon dynamics (Luo et al., 2016; Gao et al., 2011; Thomas et al., 2017), species dynamics (Clark et al., 2003; Kearney et al., 2010), pollinator performance (Corbet et al., 1995), epidemics (Ong et al., 2010), fishery (Hare et al., 2010), algal bloom (Stumpf et al., 2009), crop yield (Bastiaanssen and Ali, 2003), biodiversity (Botkin et al., 2007), plant extinction risk (Fordham et al., 2012), and ecosystem service (Craft et al., 2009) in the last several decades. Despite its broad applications, ecological forecasting is still sporadically practiced and lags far behind demand due to the lack of infrastructure that enables timely integration of models with data. This paper introduces a fully interactive infrastructure, the Ecological Platform for Assimilating Data (EcoPAD, v1.0) into models, to inform near-time ecological forecasting with iterative data–model integration.
Ecological forecasting relies on both models and data. However, currently the ecology research community has not yet adequately integrated observations with models to best inform forecasts. Forecasts generated from scenario approaches are qualitative and scenarios are often not based on ecological knowledge (Coreau et al., 2009, 2010). Data-driven forecasts using statistical methods are generally limited for extrapolation and sometimes contaminated by confounding factors (Schindler and Hilborn, 2015). The recent emergent mechanism-free nonparametric approach, which depends on the statistical pattern extracted from data, is reported to be promising for short-term forecast (Ward et al., 2014; Perretti et al., 2013; Sugihara et al., 2012) but has limited capability in long-term prediction due to the lack of relevant ecological mechanisms. Process-based models provide capacity in long-term prediction and flexibility in capturing short-term dynamics on the basis of a mechanistic understanding (Coreau et al., 2009; Purves et al., 2013). Wide applications of process-based models are limited by their often complicated numerical structure and sometimes unrealistic parameterization (Moorcroft, 2006). The complex and uncertain nature of ecology precludes the practice of incorporating as many processes as possible into mechanistic models. Our current incomplete knowledge about ecological systems and unrepresented processes under novel conditions is partly reflected in model parameters associated with large uncertainties. Good forecasting therefore requires effective communication between process-based models and data to estimate realistic model parameters and capture context-dependent ecological phenomena.
Data–model fusion, or data–model integration, is an important step to combine models with data. But previous data–model integration activities have mostly been done in an ad hoc manner instead of being interactive. For example, data from a network of eddy covariance flux tower sites across the United States and Canada were compared with gross primary productivity (GPP) estimated from different models (Schaefer et al., 2012). Luo and Reynolds (1999) used a model to examine ecosystem responses to gradual, as in the real world, vs. step increases in CO2 concentration as in elevated CO2 experiments. Parton et al. (2007) parameterized CO2 impacts in an ecosystem model with data from a CO2 experiment in Colorado. Such model–experiment interactions encounter a few issues: (1) models are not always calibrated for individual sites and therefore not accurate; (2) it is not very effective because it is usually a one-time practice without many iterative processes between experimenters and modelers (Dietze et al., 2013; Lebauer et al., 2013); (3) it is usually unidirectional as data are normally used to train models, while the guidance of the model for efficient data collection is limited; and (4) it is not streamlined and could not be disseminated with common practices among the research community (Lebauer et al., 2013; Dietze et al., 2013; Walker et al., 2014).
A few research groups have developed data assimilation systems to facilitate data–model integration in a systematic way. For example, data–model integration systems, such as the Data Assimilation Research Testbed – DART (Anderson et al., 2009) – and the Carbon Cycle Data Assimilation Systems – CCDAS (Scholze et al., 2007; Peylin et al., 2016), combine various data streams (e.g., FLUXNET data, satellite data, and inventory data) with process-based models through data assimilation algorithms such as the Kalman filter (Anderson et al., 2009) and variational methods (Peylin et al., 2016). These data assimilation systems automate model parameterization and provide an avenue to systematically improve models by combining as much data as possible. Data-informed model improvements normally happen after the end of a field experiment, and interactive data–model integration is limited as feedbacks from models to ongoing experimental studies are not adequately realized. In addition, wide applications of these data assimilation systems in ecological forecasting are constrained by limited user interactions with a steep learning curve to understand these systems, especially for experimenters who have limited training in modeling.
Web-based technology facilitates interactions. Web-based modeling, which provides user-friendly interfaces to run models in the background, is usually supported by the scientific workflow, a sequence of processes through which a piece of work passes from initiation to completion. For example, TreeWatch.Net (https://treewatch.net, last access: January 2019) has recently been developed to make use of high-precision individual tree-monitoring data to parameterize process-based tree models in real time and to assess instant tree hydraulics and carbon status with online result visualization (Steppe et al., 2016). Although the web portal of TreeWatch.Net is currently limited to the purpose of visualization, it broadens the application of data–model integration and strengthens the interaction between modeling research and the general public. The Predictive Ecosystem Analyzer (PEcAn) is a scientific workflow that wraps around different ecosystem models and manages the flows of information coming in and out of the model (Lebauer et al., 2013). PEcAn enables web-based model simulations. Such a workflow has advantages, for example making ecological modeling and analysis convenient, transparent, reproducible, and adaptable to new questions (Lebauer et al., 2013) and encouraging user–model interactions. PEcAn uses the Bayesian meta-analysis to synthesize plant trait data to estimate model parameters and associated uncertainties, i.e., the prior information for process-based models. Parameter uncertainties are propagated to model uncertainties and displayed as outputs. It is still not fully interactive in that states are not updated iteratively according to observations and the web-based data assimilation and ecological forecasting have not yet been fully realized.
Iterative model–data integration provides an approach to constantly improve ecological forecasting and is an important step, especially in realizing near-real-time ecological forecasting. Instead of projecting into the future by assimilating observations only once, iterative forecasting constantly updates forecasting along with ongoing new data streams and/or improved models. Forecasting is likely to be improved unidirectionally so that either only models are updated through observations, or only data collections and field experimentations are improved according to theoretical and model information, but not both. Ecological forecasting can also be bidirectionally improved so that both models and field experimentations are optimized hand-in-hand over time. Although the bidirectional case is rare in ecological forecasting, unidirectional iterative forecasting has been reported. One excellent example of forecasting by dynamically and repeatedly integrating data with models is from infectious disease studies (Niu et al., 2014; Ong et al., 2010). The dynamics of infectious diseases are traditionally captured by susceptible–infected–removed (SIR) models. In the forecasting of the Singapore H1N1-2009 infections, SIR model parameters and the number of individuals in each state were updated daily, combining data renewed from local clinical reports. The evolution of epidemic-related parameters and states was captured by iteratively assimilating observations to inform forecasting. As a result, the model correctly forecasted the timing of the peak and decline of the infection ahead of time. Iterative forecasting dynamically integrates data with models and makes the best use of both data and theoretical understandings of ecological processes.
The aim of this paper is to present a fully interactive platform, the web-based EcoPAD (v1.0), to best inform ecological forecasting. The interactive feature of EcoPAD (v1.0) is reflected in iterative model updating and forecasting by dynamically integrating models with new observations, bidirectional feedbacks between experimenters and modelers, and flexible user–model communication through web-based simulation, data assimilation, and forecasting. Such an interactive platform provides the infrastructure to effectively integrate available resources from models and data, modelers and experimenters, and scientists and the general public to improve scientific understanding of ecological processes, boost ecological forecasting practice, and transform ecology towards quantitative forecasting.
In the following sections, we first describe the system design and major components of EcoPAD (v1.0). We then use the Spruce and Peatland Responses Under Climatic and Environmental change (SPRUCE) experiment (Hanson et al., 2017) as a test bed to elaborate the functionality and new opportunities brought by the platform. We finally discuss the implications of EcoPAD (v1.0) for better ecological forecasting.
2.1 General description: web-based data assimilation and forecast
EcoPAD (v1.0) (https://ecolab.nau.edu/ecopad_portal/, last access: January 2019) focuses on linking ecological experiments and data with models and allows for easily accessible and reproducible data–model integration with interactive web-based simulation, data assimilation, and forecast capabilities. Specifically, EcoPAD (v1.0) enables automated near-time ecological forecasting that works hand-in-hand between modelers and experimenters and updates periodically in a manner similar to weather forecasting. The system is designed to streamline web request–response, data management, modeling, prediction, and visualization to boost the overall throughput of observational data, promote data–model communication, inform ecological forecasting, and improve scientific understanding of ecological processes (see the Supplement for detailed functionalities of EcoPAD v1.0). To realize such data-informed ecological forecasting, the essential components of EcoPAD (v1.0) include experiments and data, process-based models, data assimilation techniques, and the scientific workflow (Figs. 1–3). The scientific workflow of EcoPAD (v1.0) that wraps around ecological models and data assimilation algorithms acts to move datasets in and out of structured and cataloged data collections (metadata catalog), while leaving the logic of the ecological models and data assimilation algorithms untouched (Figs. 1, 3). Once a user makes a request through the web browser or command line utilities, the scientific workflow takes charge of triggering and executing corresponding tasks, be it pulling data from a remote server, running a particular ecological model, automating forecasting, or making the result easily understandable to users (Figs. 1, 3). With the workflow, the system is agnostic to operation system, environment, and programming language and is built to horizontally scale to meet the demands of the model and the end-user community.
2.2 Components
2.2.1 Data
Data are an important component of EcoPAD (v1.0) and EcoPAD (v1.0) offers systematic data management to digest diverse data streams. The “big data” ecology generates a large volume of very different datasets across various scales (Mouquet et al., 2015; Hampton et al., 2013). These datasets might have high temporal resolutions, such as those from real-time ecological sensors, or the display of spatial information from remote sensing sources and data stored in the geographic information system (GIS). These datasets may also include, but are not limited to, inventory data, laboratory measurements, FLUXNET databases, or data from long-term ecological networks (Baldocchi et al., 2001; Johnson et al., 2010; Robertson et al., 2012). Such data contain information related to environmental forcing (e.g., precipitation, temperature, and radiative forcing), site characteristics (e.g., soil texture and species composition), and biogeochemical composition. Datasets in EcoPAD (v1.0) are derived from other research projects in comma-separated value files or other loosely structured data formats. These datasets are first described and stored with appropriate metadata via either manual operation or scheduled automation from sensors. Each project has a separate folder where data are stored. Data are generally separated into two categories. One is used as boundary conditions for modeling and the other category is related to observations that are used for data assimilation. Scheduled sensor data are appended to existing data files with prescribed frequency. Attention is then given to how the particular dataset varies over space (x, y) and time (t). When the spatiotemporal variability is understood, it is then placed in metadata records that allow for query through its scientific workflow.
2.2.2 Ecological models
A process-based ecological model is another essential component of EcoPAD (Fig. 1). In this paper, the Terrestrial ECOsystem (TECO) model is applied as a general ecological model for demonstration purposes since the workflow and data assimilation system of EcoPAD (v1.0) are relatively independent of the specific ecological model. Linkages among the workflow, data assimilation system, and ecological model are based on messaging. For example, the data assimilation system generates parameters that are passed to ecological models. The state variables simulated from ecological models are passed back to the data assimilation system. Models may have different formulations. As long as they take in the same parameters and generate the same state variables, they are functionally identical from the “eye” of the data assimilation system.

Figure 1Schema of approaches to forecast future ecological responses from common practice (a) and the Ecological Platform for Assimilation of Data (EcoPAD, v1.0) (b). The common practice makes use of observations to develop or calibrate models to make predictions, while the EcoPAD (v1.0) approach advances the common practice through its fully interactive platform. EcoPAD (v1.0) consists of four major components: experiment and data, model, data assimilation, and the scientific workflow (green arrows or lines). Data and model are iteratively integrated through its data assimilation systems to improve forecasting. Its near-real-time forecasting results are shared among research groups through its web interface to guide new data collections. The scientific workflow enables web-based data transfer from sensors, model simulation, data assimilation, forecasting, result analysis, visualization, and reporting, encouraging broad user–model interactions, especially for experimenters and the general public with a limited background in modeling. Images from the SPRUCE field experiments (https://mnspruce.ornl.gov/, last access: January 2019) are used to represent the data collection and the flowchart of the TECO model is used to delegate ecological models.
TECO simulates ecosystem carbon, nitrogen, water, and energy dynamics (Weng and Luo, 2008; Shi et al., 2016). The original TECO model has four major submodules (canopy, soil water, vegetation dynamics, and soil carbon and nitrogen) and is further extended to incorporate methane biogeochemistry and snow dynamics (Huang et al., 2017; Ma et al., 2017). As in the global land surface model CABLE (Wang et al., 2010; Wang and Leuning, 1998), canopy photosynthesis that couples surface energy and water and carbon fluxes is based on a two-big-leaf model (Wang and Leuning, 1998). Leaf photosynthesis and stomatal conductance are based on the common scheme from Farquhar et al. (1980) and Ball et al. (1987), respectively. Transpiration and associated latent heat losses are controlled by stomatal conductance, soil water content, and the rooting profile. Evaporation losses of water are balanced between the soil water supply and the atmospheric demand based on the difference between saturation vapor pressure and the actual atmospheric vapor pressure. Soil moisture in different soil layers is regulated by water influxes (e.g., precipitation and percolation) and effluxes (e.g., transpiration and runoff). Vegetation dynamic tracks processes such as growth, allocation, and phenology. The soil carbon and nitrogen module tracks carbon and nitrogen through processes such as litterfall, soil organic matter (SOM) decomposition, and mineralization. SOM decomposition modeling follows the general form of the Century model (Parton et al., 1988) as in most Earth system models. SOM is divided into pools with different turnover times (the inverse of decomposition rates), which are modified by environmental factors such as the soil temperature and moisture.
2.2.3 Data assimilation
Data assimilation is growing in importance as process-based ecological models, despite largely simplifying the real systems, need to be complex enough to address sophisticated ecological issues. These ecological issues are composed of an enormous number of biotic and abiotic factors interacting with each other. Data assimilation techniques provide a framework to combine models with data to estimate model parameters (Shi et al., 2016), test alternative ecological hypotheses through different model structures (Liang et al., 2015), assess the information content of datasets (Weng and Luo, 2011), quantify uncertainties (Zhou et al., 2012; Weng et al., 2011; Keenan et al., 2012), derive emergent ecological relationships (Bloom et al., 2016), identify model errors, and improve ecological predictions (Luo et al., 2011b) (Fig. 2). Under the Bayesian paradigm, data assimilation techniques treat the model structure and the initial and parameter values as priors that represent our current understanding of the system. As new information from observations or data becomes available, model parameters and state variables can be updated accordingly. The posterior distributions of estimated parameters or state variables are imprinted with information from the model, observations, and data as the chosen parameters act to reduce mismatches between observations and model simulations. Future predictions benefit from such constrained posterior distributions through forward modeling (Fig. S1 in the Supplement). As a result, the probability density function of predicted future states through data assimilation normally has a narrower spread than that without data assimilation when everything else is equal (Niu et al., 2014; Luo et al., 2011b; Weng and Luo, 2011).
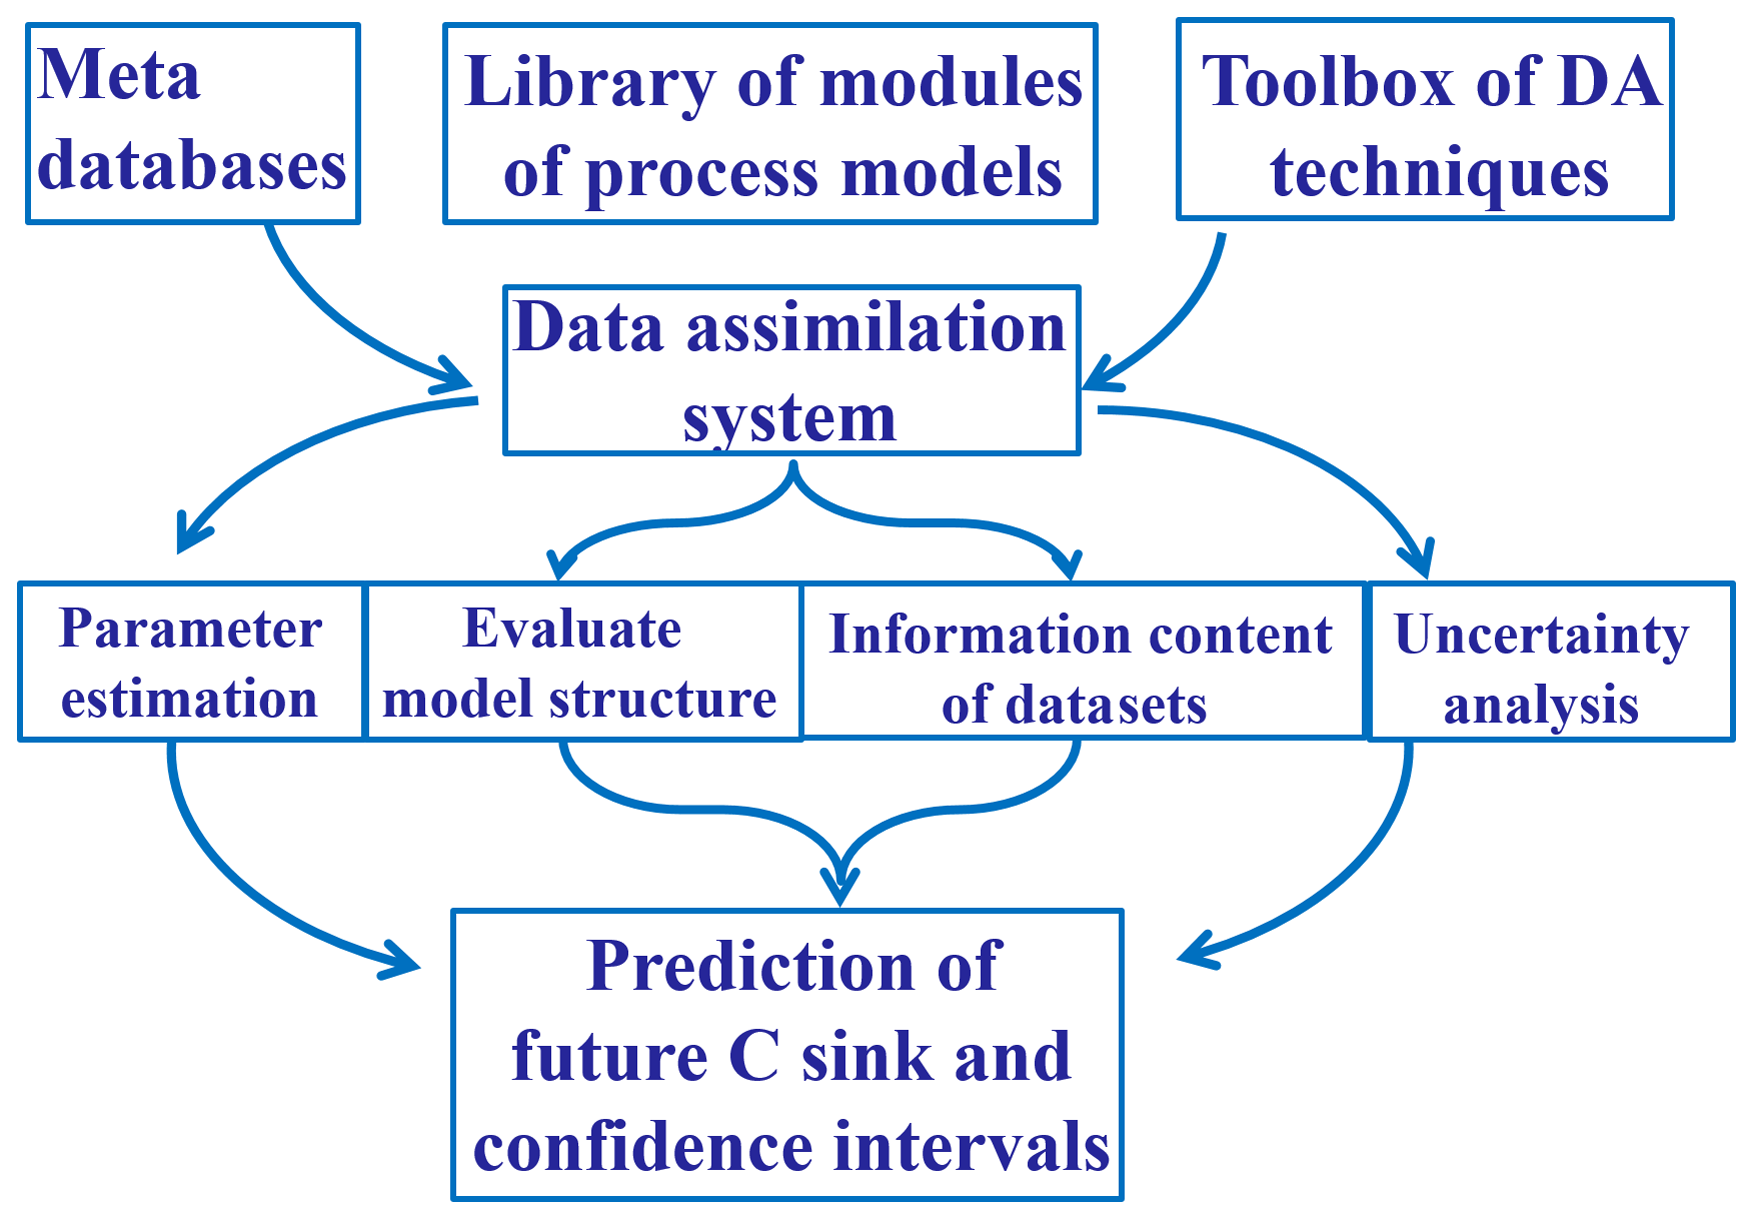
Figure 2The data assimilation system inside the Ecological Platform for Assimilation of Data (EcoPAD, v1.0) towards better forecasting of terrestrial carbon dynamics.
EcoPAD (v1.0) is open to different data assimilation techniques since the scientific workflow of EcoPAD (v1.0) is independent of the specific data assimilation algorithm. For demonstration, Markov chain Monte Carlo (MCMC) (Xu et al., 2006) is described in this study.
MCMC is a class of sampling algorithms to draw samples from a probability distribution obtained through constructed Markov chains to approximate the equilibrium distribution. The Bayesian-based MCMC method takes into account various uncertainty sources that are crucial in interpreting and delivering forecasting results (Clark et al., 2001). In the application of MCMC, the posterior distribution of a parameter for given observations is proportional to the prior distribution of that parameter and the likelihood function linked to the fit or match (or cost function) between model simulations and observations. EcoPAD (v1.0) currently adopts a batch mode; that is, the cost function is treated as a single function to be minimized and different observations are standardized by their corresponding standard deviations (Xu et al., 2006). For simplicity, we assume uniform distributions in priors and Gaussian or multivariate Gaussian distributions in observational errors, which can be operationally expanded to other specific distribution forms depending on the available information. A detailed description is available in Xu et al. (2006).
2.2.4 Scientific workflow
EcoPAD (v1.0) relies on its scientific workflow to interface with ecological models and data assimilation algorithms, manage diverse data streams, and automate iterative ecological forecasting in response to various user requests. Workflow is a relatively new concept in the ecology literature but is essential to realize real- or near-real-time forecasting. Thus, we describe it in detail below. The essential components of the scientific workflow of EcoPAD (v1.0) include the metadata catalog, web application-programming interface (API), the asynchronous task or job queue (Celery), and the container-based virtualization platform (docker). The workflow system of EcoPAD (v1.0) also provides structured result access and visualization.
Metadata catalog and data management
Datasets can be placed and queried in EcoPAD (v1.0) via a common metadata catalog, which allows for effective management of diverse data streams. Calls for good management of current large and heterogeneous ecological datasets are common (Vitolo et al., 2015; Michener and Jones, 2012; Ellison, 2010). Kepler (Ludascher et al., 2006) and the Analytic Web (Osterweil et al., 2010) are two example systems that endeavor to provide efficient data management through the storage of metadata, including clear documentation of data provenance. Similarly to these systems, EcoPAD (v1.0) takes advantage of modern information technology, especially the metadata catalog, to manage diverse data streams. The EcoPAD (v1.0) metadata scheme includes a description of the data product, security, access pattern, and time stamp of last metadata update. We use MongoDB (https://www.mongodb.com/, last access: January 2019), a NoSQL database technology, to manage heterogeneous datasets to make documentation, query, and storage fast and convenient. Through MongoDB, measured datasets can be easily fed into ecological models for various purposes such as to initialize the model, calibrate model parameters, evaluate model structure, and drive model forecasts. For datasets from real-time ecological sensors that are constantly updating, EcoPAD (v1.0) is set to automatically fetch new data streams with adjustable frequency according to research needs.
Web API, asynchronous task queue, and docker
The representational state transfer (RESTful) API can deliver data to a wide variety of applications is the gateway of EcoPAD (v1.0) and enables a wide array of user interfaces and data dissemination activities. Once a user makes a request, such as through clicking on relevant buttons from a web browser, the request is passed through the RESTful API to trigger specific tasks. The RESTful API bridges the talk between the client (e.g., a web browser or command line terminal) and the server (Fig. 3). The API exploits the full functionality and flexibility of the HyperText Transfer Protocol (HTTP) such that data can be retrieved and ingested from EcoPAD (v1.0) through the use of simple HTTP headers and verbs (e.g., GET, PUT, POST, etc.). Hence, a user can incorporate summary data from EcoPAD (v1.0) into a website with a single line of html code. Users will also be able to access data directly through programming environments like R, Python, and MATLAB. Simplicity, ease of use, and interoperability are among the main advantages of this API, which enables web-based modeling.
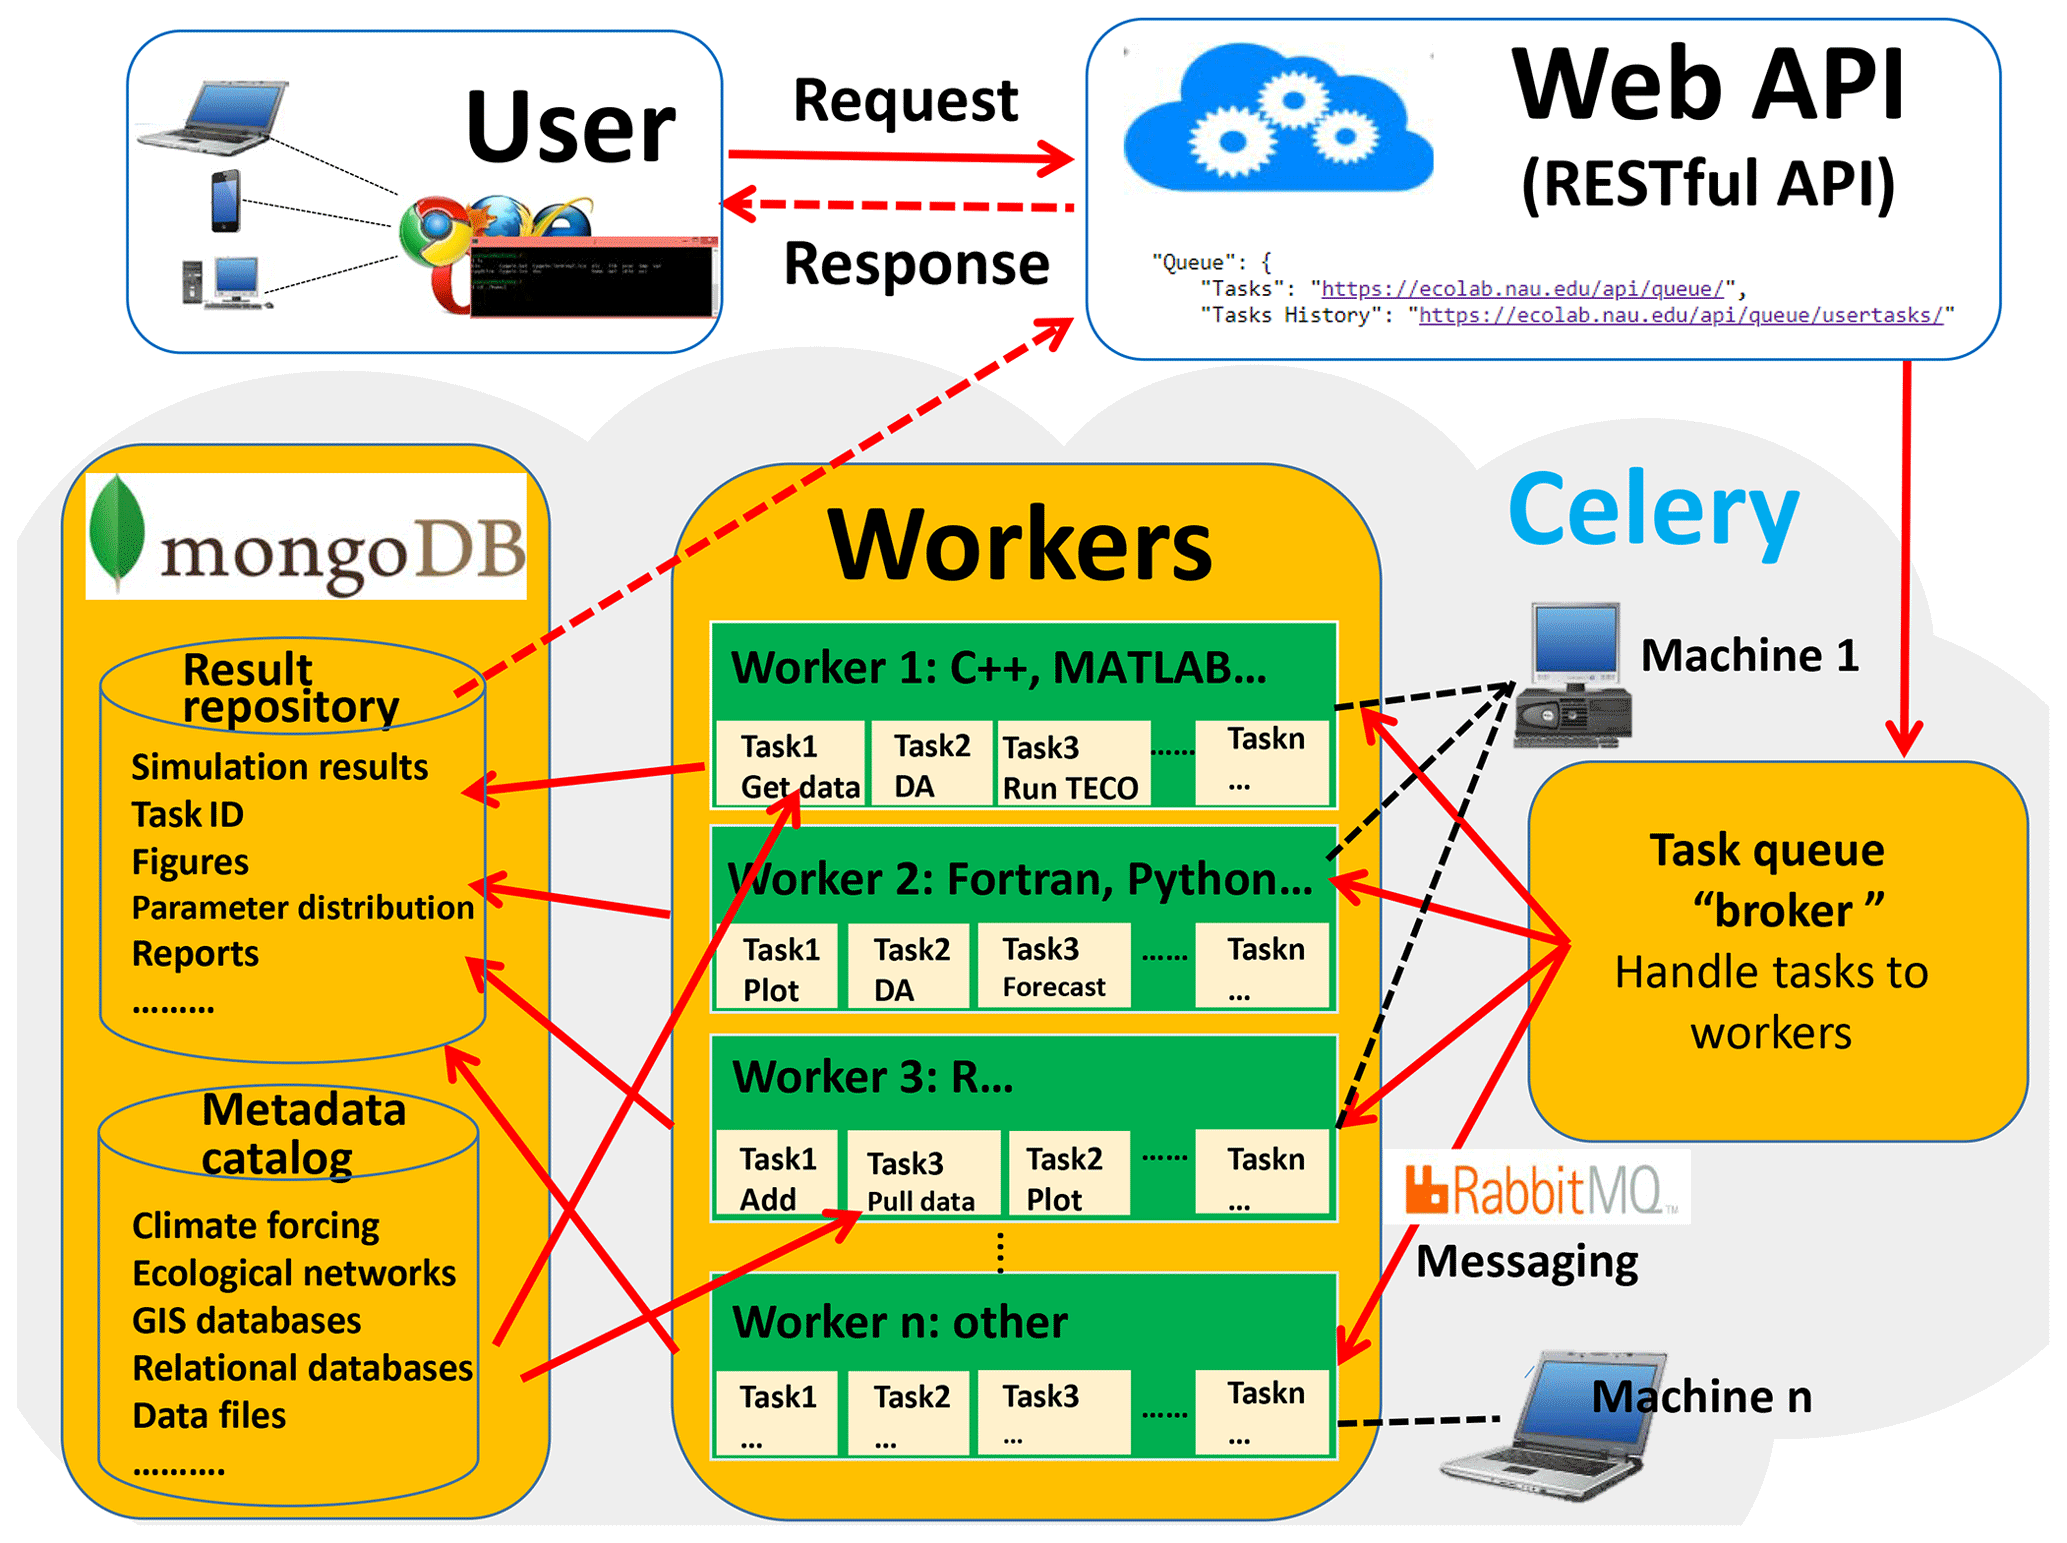
Figure 3The scientific workflow of EcoPAD (v1.0). The workflow wraps ecological models and data assimilation algorithms with the docker containerization platform. Users trigger different tasks through the representational state transfer (RESTful) application-programming interface (API). Tasks are managed through the asynchronous task queue, Celery. Tasks can be executed concurrently on a single or more worker servers across different scalable IT infrastructures. MongoDB is a database software that takes charge of data management in EcoPAD (v1.0), and RabbitMQ is a message broker.
Celery (https://github.com/celery/celery, last access: January 2019) is an asynchronous task or job queue that runs in the background (Fig. 3). The task queue (i.e., Celery) is a mechanism used to distribute work across work units such as threads or machines. Celery communicates through messages, and EcoPAD (v1.0) takes advantage of the RabbitMQ (https://www.rabbitmq.com/, last access: January 2019) to manage messaging. After the user submits a command, the request or message is passed to Celery via the RESTful API. These messages may trigger different tasks, which include but are not limited to pulling data from a remote server where original measurements are located, accessing data through a metadata catalog, running model simulations with user-specified parameters, conducting data assimilation that recursively updates model parameters, forecasting future ecosystem status, and post-processing model results for visualization. The broker inside Celery receives task messages and handles out tasks to available Celery workers that perform the actual tasks (Fig. 3). Celery workers are in charge of receiving messages from the broker, executing tasks, and returning task results. The worker can be a local or remote computation resource (e.g., the cloud) that has connectivity to the metadata catalog. Workers can be distributed into different information technology (IT) infrastructures, which makes the EcoPAD (v1.0) workflow expandable. Each worker can perform different tasks depending on the tools installed in each worker. One task can also be distributed to different workers. In such a way, the EcoPAD (v1.0) workflow enables the parallelization and distributed computation of actual modeling tasks across various IT infrastructures and is flexible in implementing additional computational resources by connecting additional workers.
Another key feature that makes EcoPAD (v1.0) easily portable and scalable among different operation systems is the utilization of a container-based virtualization platform, the docker (https://www.docker.com/, last access: January 2019). The docker can run many applications that rely on different libraries and environments on a single kernel with its lightweight containerization. Tasks that execute TECO in different ways are wrapped inside different docker containers that can “talk” with each other. Each docker container embeds the ecosystem model into a complete file system that contains everything needed to run an ecosystem model: the source code, model input, run time, system tools, and libraries. Docker containers are both hardware-agnostic and platform-agnostic, and they are not confined to a particular language, framework, or packaging system. Docker containers can be run from a laptop, workstation, virtual machine, or any cloud compute instance. This is done to support the widely varied number of ecological models running in various languages (e.g., MATLAB, Python, Fortran, C, and C) and environments. In addition to wrapping the ecosystem model into a docker container, software applied in the workflow, such as Celery, RabbitMQ, and MongoDB, are all lightweight and portable encapsulations through docker containers. Therefore, EcoPAD (v1.0) is readily portable and applicable in different environments.
Structured result access and visualization
EcoPAD (v1.0) enables structured result storage, access, and visualization to track and analyze data–model fusion practice. Upon the completion of the model task, the model wrapper code calls a post-processing callback function. This callback function allows model-specific data requirements to be added to the model result repository. Each task is associated with a unique task ID and model results are stored within the local repository that can be queried by the unique task ID. The storage and query of model results are realized via the MongoDB and RESTful API (Fig. 3). Researchers are authorized to review and download model results and parameters submitted for each model run through a web-accessible URL (link). The EcoPAD (v1.0) web page also displays a list of historical tasks (with URL) performed by each user. All current and historical model inputs and outputs are available to download, including the aggregated results produced for graphical web applications. In addition, EcoPAD (v1.0) also provides a task report that contains an all-inclusive recap of submitted parameters, task status, and model outputs with links to all data and graphical results for each task. Such structured result storage and access make sharing, tracking, and referring to modeling studies instantaneous and clear.
3.1 SPRUCE project overview
EcoPAD (v1.0) is being applied to the SPRUCE experiment located at the USDA Forest Service Marcell Experimental Forest (MEF; N, W) in northern Minnesota (Kolka et al., 2011). SPRUCE is an ongoing project that focuses on long-term responses of northern peatland to climate warming and increased atmospheric CO2 concentration (Hanson et al., 2017). At SPRUCE, ecologists measure various aspects of responses of organisms (from microbes to trees) and ecological functions (carbon, nutrient, and water cycles) to a warming climate. One of the key features of the SPRUCE experiments is manipulative deep soil–peat heating (0–3 m) and whole-ecosystem warming treatments (peat + air warmings), which include tall trees (>4 m) (Hanson et al., 2017). Together with elevated atmospheric CO2 treatments, SPRUCE provides a platform for exploring mechanisms controlling the vulnerability of organisms, biogeochemical processes, and ecosystems in response to future novel climatic conditions. The SPRUCE peatland is especially sensitive to future climate change and also plays an important role in feeding back to future climate change through greenhouse gas emissions as it stores a large amount of soil organic carbon. Vegetation in the SPRUCE site is dominated by Picea mariana (black spruce) and Sphagnum spp. (peat moss). The studied peatland also has an understory that includes ericaceous and woody shrubs. There are also a limited number of herbaceous species. The whole-ecosystem warming treatments include a large range of both aboveground and belowground temperature manipulations (ambient, control plots of +0, +2.25, +4.5, +6.75, and +9 ∘C) in large 115 m2 open-topped enclosures with elevated CO2 manipulations (+0 or +500 ppm). The difference between ambient and +0 ∘C treatment plots is the open-topped and controlled-environment enclosures.
The SPRUCE project generates a large variety of observational datasets that reflect ecosystem dynamics from different scales and are available from the project web page (https://mnspruce.ornl.gov/, last access: January 2019) and file transfer protocol (FTP) site (ftp://sprucedata.ornl.gov/, last access: January 2019). These datasets come from multiple sources, including half-hourly automated sensor records, species surveys, laboratory measurements, and laser-scanning images. The involvement of both modeling and experimental studies in the SPRUCE project creates the opportunity for data–model communication. Datasets are pulled from SPRUCE archives and stored in the EcoPAD (v1.0) metadata catalog for running the TECO model and conducting data–model fusion or forecasting. The TECO model has been applied to simulate and forecast carbon dynamics with productions of CO2 and CH4 from different carbon pools, soil temperature response, snow depth, and freeze–thaw cycles at the SPRUCE site (Jiang et al., 2018; Huang et al., 2017; Ma et al., 2017).
3.2 EcoPAD-SPRUCE web portal
We assimilate multiple streams of data from the SPRUCE experiment to the TECO model using the MCMC algorithm and forecast ecosystem dynamics in both near time and for the next 10 years. Our forecasting system for SPRUCE is available at https://ecolab.nau.edu/ecopad_portal/ (last access: January 2019). From the web portal, users can check our current near- and long-term forecasting results, conduct model simulation, data assimilation, and forecasting runs, and analyze and visualize model results. Detailed information about the interactive web portal is provided in the Supplement.
3.3 Near-time ecosystem forecasting and feedback to experimenters
As part of the forecasting functionality, EcoPAD-SPRUCE automates near-time (weekly) forecasting with continuously updated observations from SPRUCE experiments (Fig. 4). We set up the system to automatically pull new data streams every Sunday from the SPRUCE FTP site that holds observational data and update the forecasting results based on new data streams. Updated forecasting results for the next week are customized for the SPRUCE experiments with different manipulative treatments and displayed in the EcoPAD-SPRUCE portal. At the same time, these results are sent back to SPRUCE communities and displayed together with near-term observations for experimenter reference.
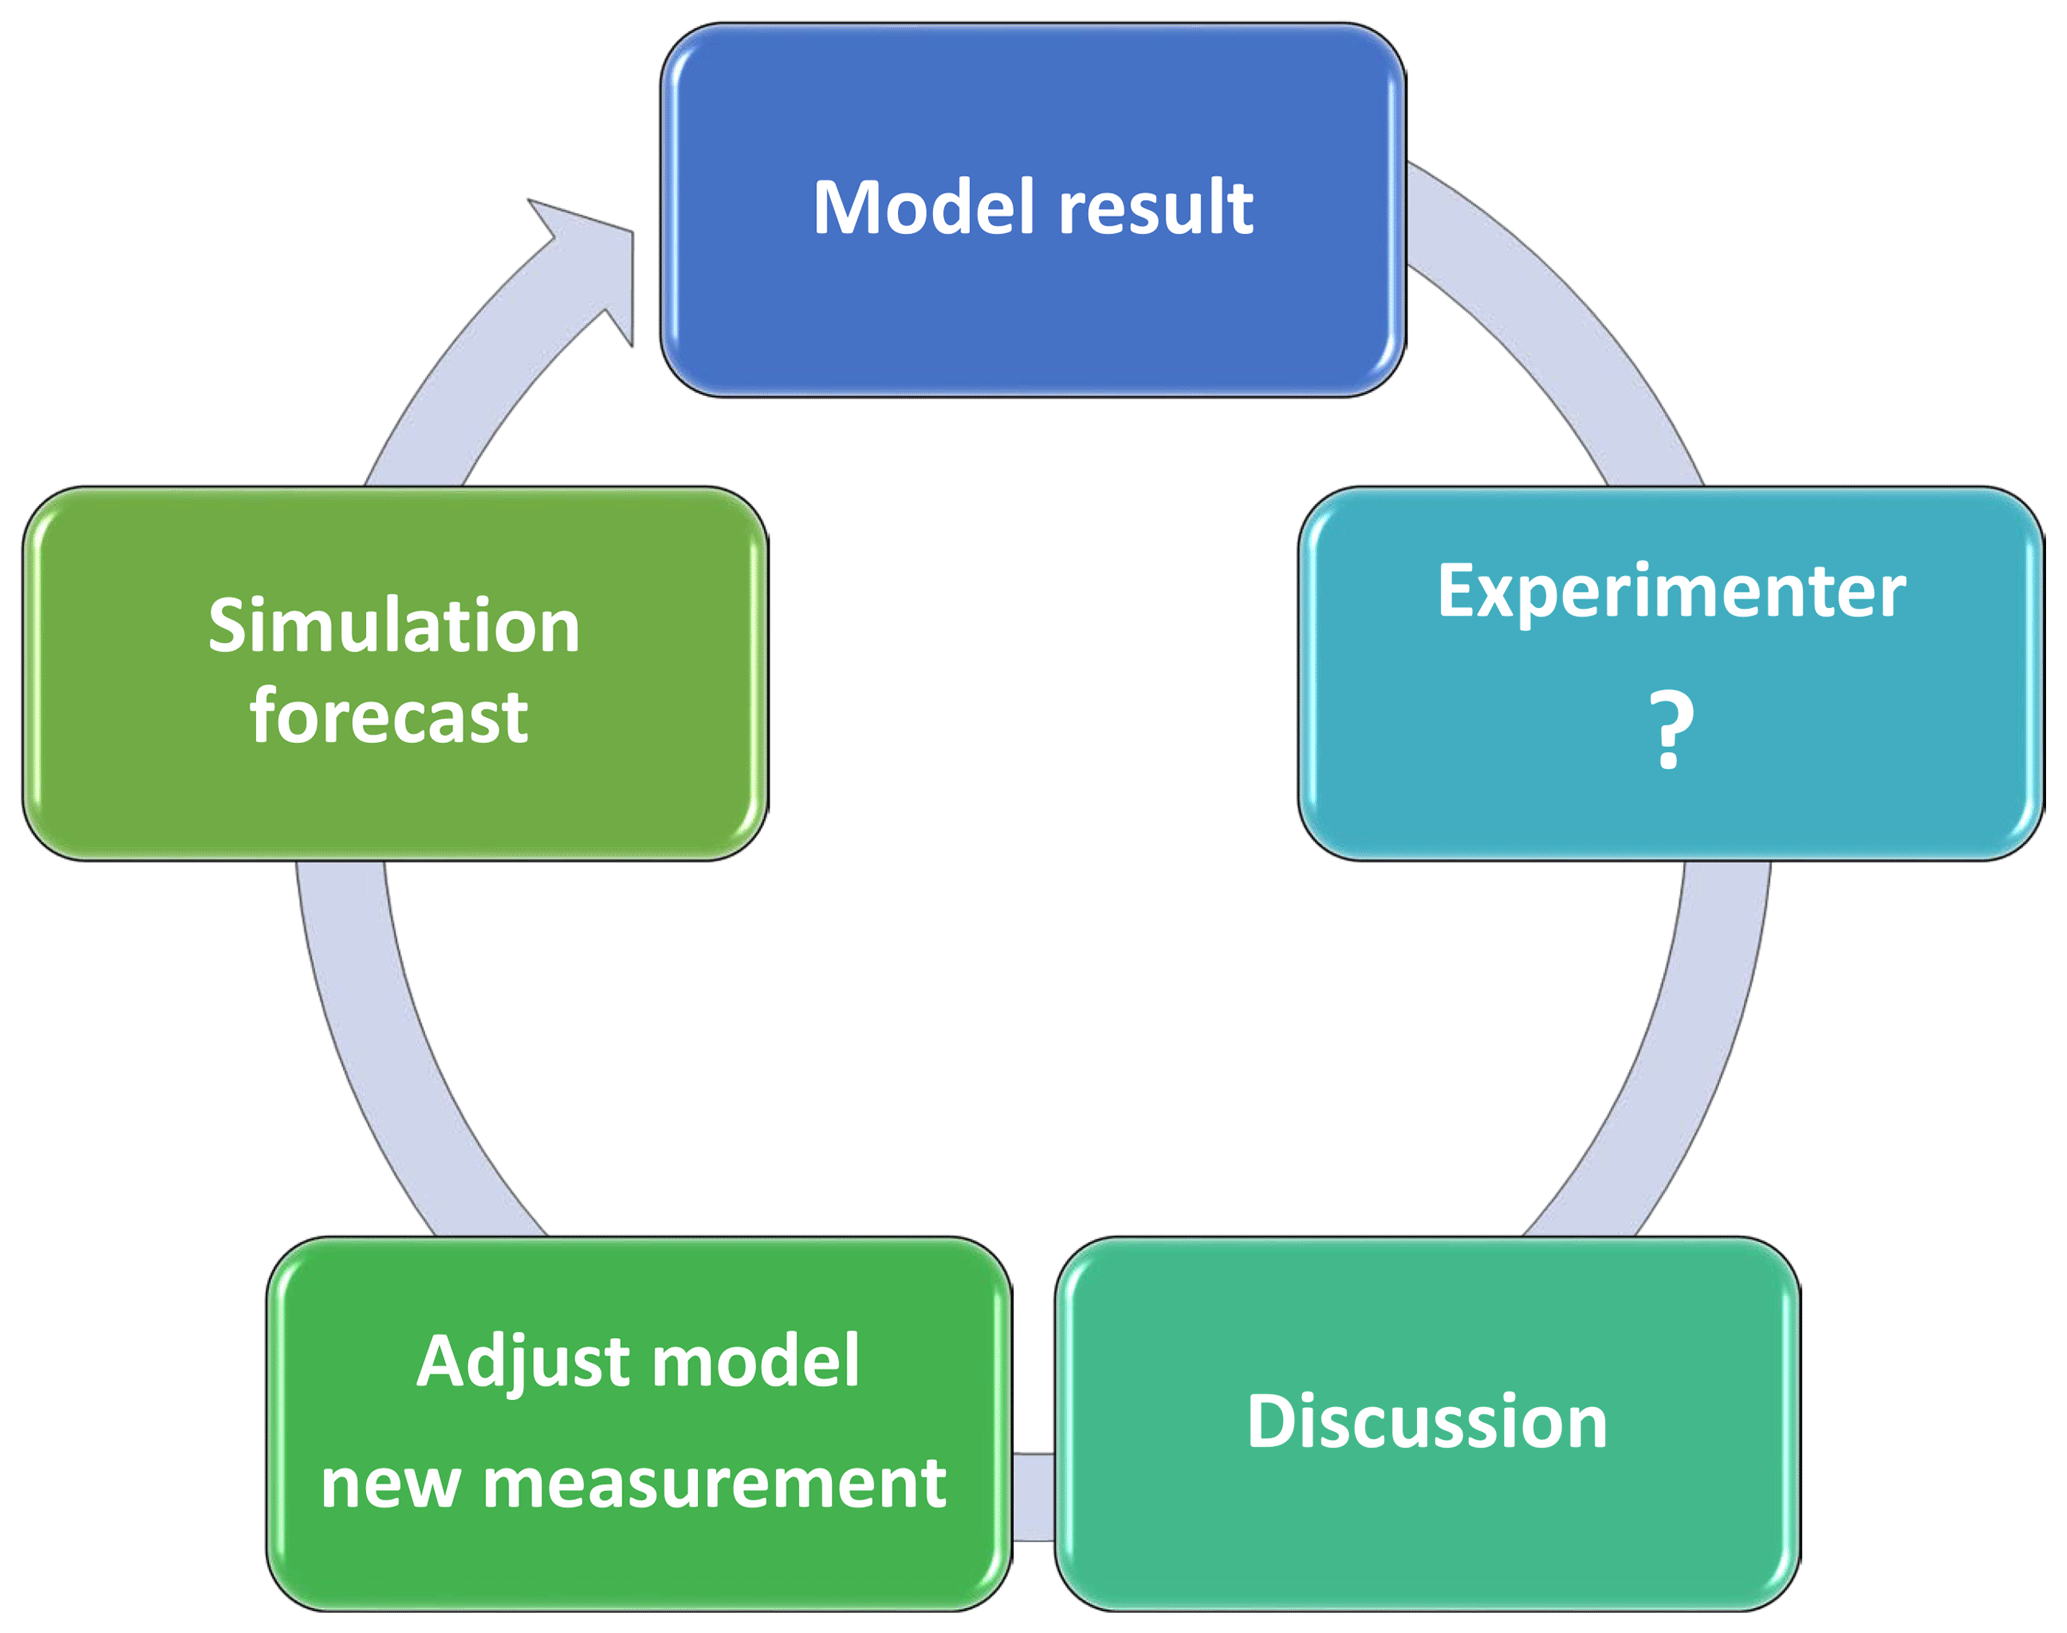
Figure 4Schema of interactive communication between modelers and experimenters through the prediction–question–discussion–adjustment–prediction cycle to improve ecological forecasting. The schema is inspired by an episode of experimenter–modeler communication stimulated by the EcoPAD-SPRUCE platform. The initial methane model constrained by static-chamber methane measurements was used to predict the relative contributions of three methane emission pathways (i.e., ebullition, plant-mediated transportation (PMT), and diffusion) to the overall methane fluxes under different warming treatments (+0, +2.25, +4.5, +6.75, and +9 ∘C). The initial results indicated a dominant contribution from ebullition, especially under +9 ∘C, which was doubted by experimenters. The discrepancy stimulated communication between modelers and experimenters, with detailed information listed in Table 1. After extensive discussion, the model structure was adjusted and field observations were reevaluated. A second round of forecasting yielded more reliable predictions.
3.4 New approaches to ecological studies towards better forecasting
3.4.1 Case 1: interactive communications among modelers and experimenters
EcoPAD-SPRUCE provides a platform to stimulate interactive communication between modelers and experimenters through the loop of prediction–question–discussion–adjustment–prediction (Fig. 4). We illustrate how the prediction–question–discussion–adjustment–prediction cycle and stimulation of modeler–experimenter communication improve ecological predictions through one episode during the study of the relative contribution of different pathways to methane emissions. An initial methane model was built upon information (e.g., site characteristics and environmental conditions) provided by SPRUCE field scientists, taking into account important processes in methane dynamics, such as production, oxidation, and emissions, through three pathways (i.e., diffusion, ebullition, and plant-mediated transportation). The model was used to predict the relative contributions of different pathways to overall methane emissions under different warming treatments after being constrained by measured surface methane fluxes. Initial forecasting results, which indicated a strong contribution from ebullition under high warming treatments, were sent back to the SPRUCE group. Experimenters doubted such a high contribution from the ebullition pathway and a discussion was stimulated. It is difficult to accurately distinguish the three pathways from field measurements. Field experimenters provided potential avenues to extract measurement information related to these pathways, while modelers examined model structure and parameters that may not be well constrained by available field information. A detailed discussion is provided in Table 1. After extensive discussion, several adjustments were adopted as a first step to move forward. For example, the three-porosity model that was used to simulate the diffusion process was replaced by the Millington–Quirk model to more realistically represent methane diffusions in peat soil; the measured static-chamber methane fluxes were also questioned and scrutinized more carefully to clarify that they did not capture the episodic ebullition events. Measurements such as these related to pore water gas data may provide additional inference related to ebullition. The updated forecasting is more reasonable than the initial results, although more studies are in need to ultimately quantify methane fluxes from different pathways.
Table 1Discussion stimulated by EcoPAD-SPRUCE forecasting among modelers and experimenters on how to improve predictions of the relative contribution of different pathways of methane emissions.

3.4.2 Case 2: acclimation of ecosystem carbon cycling to experimental manipulations
As a first step, CH4 static-chamber flux measurements were assimilated into TECO to assess potential acclimation phenomena during methane production under five warming treatments (+0, +2.25, +4.5, +6.75, +9 ∘C). Initial results indicated a reduction in both the CH4:CO2 ratio and the temperature sensitivity of methane production based on their posterior distributions (Fig. 5). The mean CH4:CO2 ratio decreased from 0.675 (+0 ∘C treatment) to 0.505 (+9 ∘C), while the temperature sensitivity (Q10) for CH4 production decreased from 3.33 (+0 ∘C) to 1.22 (+9 ∘C treatment). Such shifts quantify the potential acclimation of methane production to warming, and future climate warming is likely to have a smaller impact on emissions than most current predictions that do not take account of acclimation.
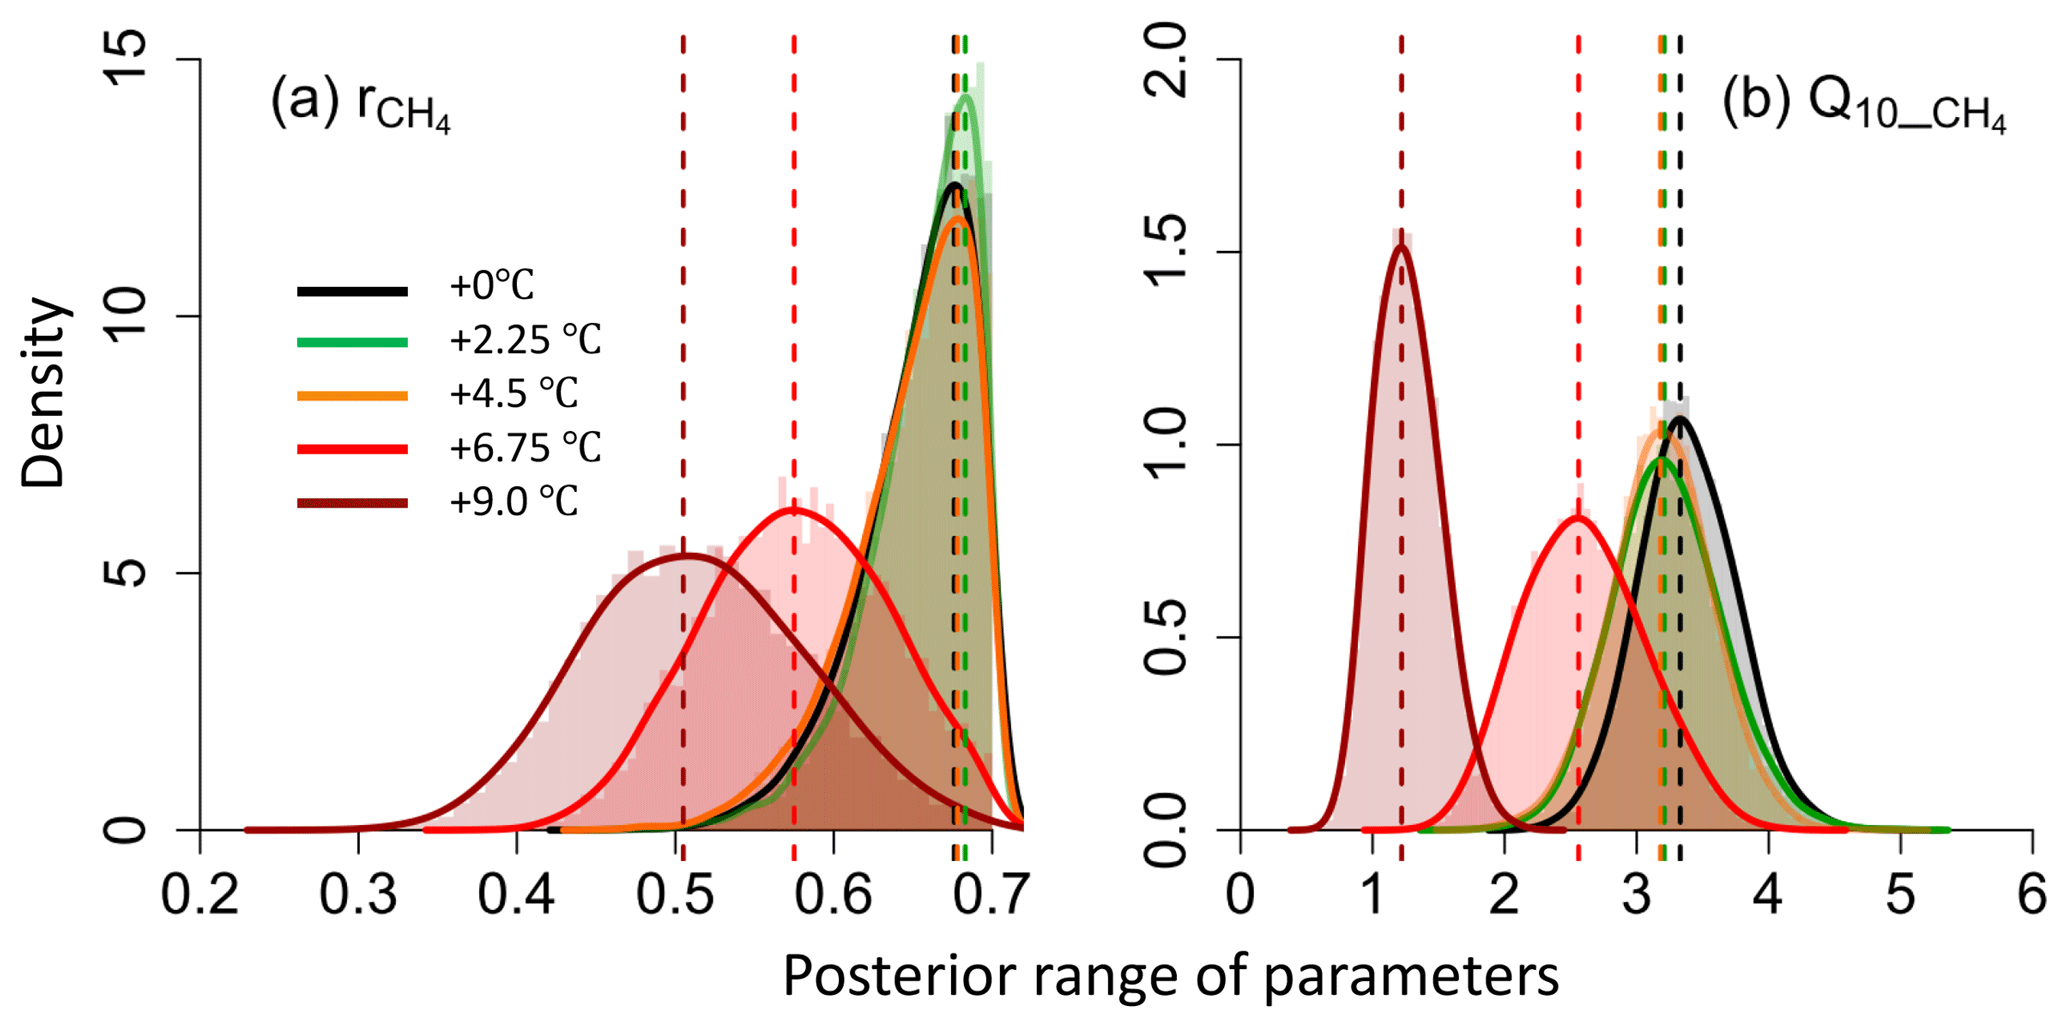
Figure 5Posterior distribution of the ratio of CH4:CO2 (a) and the temperature sensitivity of methane production (, b) under five warming treatments.
Despite the fact that these results are preliminary, as more relevant datasets are under collection with current ongoing warming manipulations and measurements, assimilating observations through EcoPAD (v1.0) provides a quantitative approach to assess acclimation through time. Melillo et al. (2017) revealed that the thermal acclimation of soil respiration in Harvard Forest is likely to be phase (time) dependent during their 26-year soil warming experiment. EcoPAD (v1.0) provides the possibility to trace the temporal path of acclimation with its streamlined structure and archive capacity. Shi et al. (2015) assimilated carbon-related measurements in a tallgrass prairie into the TECO model to study acclimation after 9-year warming treatments. They revealed a reduction in the allocation of GPP to shoot, the turnover rates of the shoot and root carbon pools, and an increase in litter and fast carbon turnovers in response to warming treatments. Similarly, as time goes on, the SPRUCE experiment will generate more carbon-cycling-related datasets under different warming and CO2 treatments, which can be mounted to EcoPAD (v1.0) to systematically quantify acclimations in carbon cycling through time in the future.
3.4.3 Case 3: partitioning of uncertainty sources
Uncertainties in ecological studies can come from observations (including the forcing that drives the model), different model structures to represent the real world, and the specified model parameters (Luo et al., 2016). Previous studies tended to focus on one aspect of the uncertainty sources instead of disentangling the contribution from different sources. For example, model intercomparison projects (MIPs), such as TRENDY, focus on uncertainty caused by different model structures with prescribed external forcing (Sitch et al., 2008). Keenan et al. (2012) used data assimilation to constrain parameter uncertainties in projecting Harvard Forest carbon dynamics. Ahlstrom et al. (2012) forced one particular vegetation model by 18 sets of forcings from climate models of the Coupled Model Intercomparison Project Phase 5 (CMIP5), while the parameter or model structure uncertainty is not taken into account.
EcoPAD (v1.0) is designed to provide a thorough picture of uncertainties from multiple sources, especially in carbon cycling studies. By focusing on multiple instead of one source of uncertainty, ecologists can allocate resources to areas that cause relatively high uncertainty. The attribution of uncertainties in EcoPAD (v1.0) will rely on an ensemble of ecosystem models, the data assimilation system, and climate forcing with quantified uncertainty. Jiang et al. (2018) focused specifically on the relative contribution of parameter uncertainty vs. climate forcing uncertainty in forecasting carbon dynamics at the SPRUCE site. By assimilating pretreatment measurements (2011–2014) from the SPRUCE experiment, Jiang et al. (2018) estimated uncertainties in key parameters that regulate peatland carbon dynamics. Combined with the stochastically generated climate forcing (e.g., precipitation and temperature), Jiang et al. (2018) found that external forcing resulted in higher uncertainty than parameters in forecasting carbon fluxes, but caused lower uncertainty than parameters in forecasting carbon pools. Therefore, more efforts are required to improve forcing measurements for studies that focus on carbon fluxes (e.g., GPP), while reductions in parameter uncertainties are more important for studies in carbon pool dynamics. Despite the fact that Jiang et al. (2018) do not quantify model structure uncertainty, incorporating multiple models into EcoPAD (v1.0) is in progress, and future uncertainty assessment will benefit from EcoPAD (v1.0) with its systematically archived model simulation, data assimilation, and forecasting.
3.4.4 Case 4: improving biophysical estimation for better ecological prediction
Carbon cycling studies can also benefit from EcoPAD (v1.0) through improvements in biophysical estimation. The soil environmental condition is an important regulator of belowground biological activities and also feeds back to aboveground vegetation growth. Biophysical variables, such as soil temperature, soil moisture, ice content, and snow depth, are key predictors of ecosystem dynamics. After constraining the biophysical module by detailed monitoring data from the SPRUCE experiment through the data assimilation component of EcoPAD (v1.0), Huang et al. (2017) forecasted soil thermal dynamics under future conditions and studied the responses of soil temperature to hypothetical air warming. This study emphasized the importance of accurate climate forcing in providing robust thermal forecasts. In addition, Huang et al. (2017) revealed nonuniform responses of soil temperature to air warming. Soil temperature responded more strongly to air warming during summer compared to winter. Soil temperature increased more in shallow soil layers compared to deep soils in summer in response to air warming. Therefore, extrapolating manipulative experiments based on air warming alone may not reflect the real temperature sensitivity of SOM if soil temperature is not monitored. As a robust quantification of environmental conditions is known to be a first step towards a better understanding of ecological process, improvement in soil thermal predictions through the EcoPAD (v1.0) data assimilation system is helpful in telling apart biogeochemical responses from environmental uncertainties and also in providing field ecologists with key environmental conditions beforehand.
3.4.5 Case 5: how do the updated model and data contribute to reliable forecasting?
Through constantly adjusted model and external forcing according to observations and weekly archived model parameter, model structure, external forcing, and forecasting results, the contribution of model and data updates can be tracked by comparing forecasted vs. realized simulations. For example, Fig. 6 illustrates how updated external forcing (compared to stochastically generated forcing) and shifts in ecosystem state variables shape ecological predictions. “Updated” means the real meteorological forcing monitored from the weather station. We use stochastically generated forcing to represent future meteorological conditions. Future precipitation and air temperature were generated by vector autoregression using a historical dataset (1961–2014) monitored by the weather station. Photosynthetically active radiation (PAR), relative humidity, and wind speed were randomly sampled from the joint frequency distribution at a given hour each month. Detailed information on weather forcing is available in Jiang et al. (2018). Similarly as in other EcoPAD-SPRUCE case studies, TECO is trained through data assimilation with observations from 2011–2014 and used to forecast GPP and total soil organic carbon content at the beginning of 2015. For demonstrating purposes, Fig. 6 only shows three series of forecasting results instead of updates from every week. Series 1 (S1) records forecasted GPP and soil carbon with stochastically generated weather forcing from January 2015–December 2024 (Fig. 6a, b, cyan). Series 2 (S2) records simulated GPP and soil carbon with observed (updated) climate forcing from January 2015 to July 2016 and forecasted GPP and soil carbon with stochastically generated forcing from August 2016–December 2024 (Fig. 6a, b, red). Similarly, the stochastically generated forcing in Series 3 (S3) starts from January 2017 (Fig. 6a, b, blue). For each series, predictions were conducted with randomly sampled parameters from the posterior distributions and stochastically generated forcing. We displayed 100 mean values (across an ensemble of forecasts with different parameters) corresponding to 100 forecasts with stochastically generated forcing.
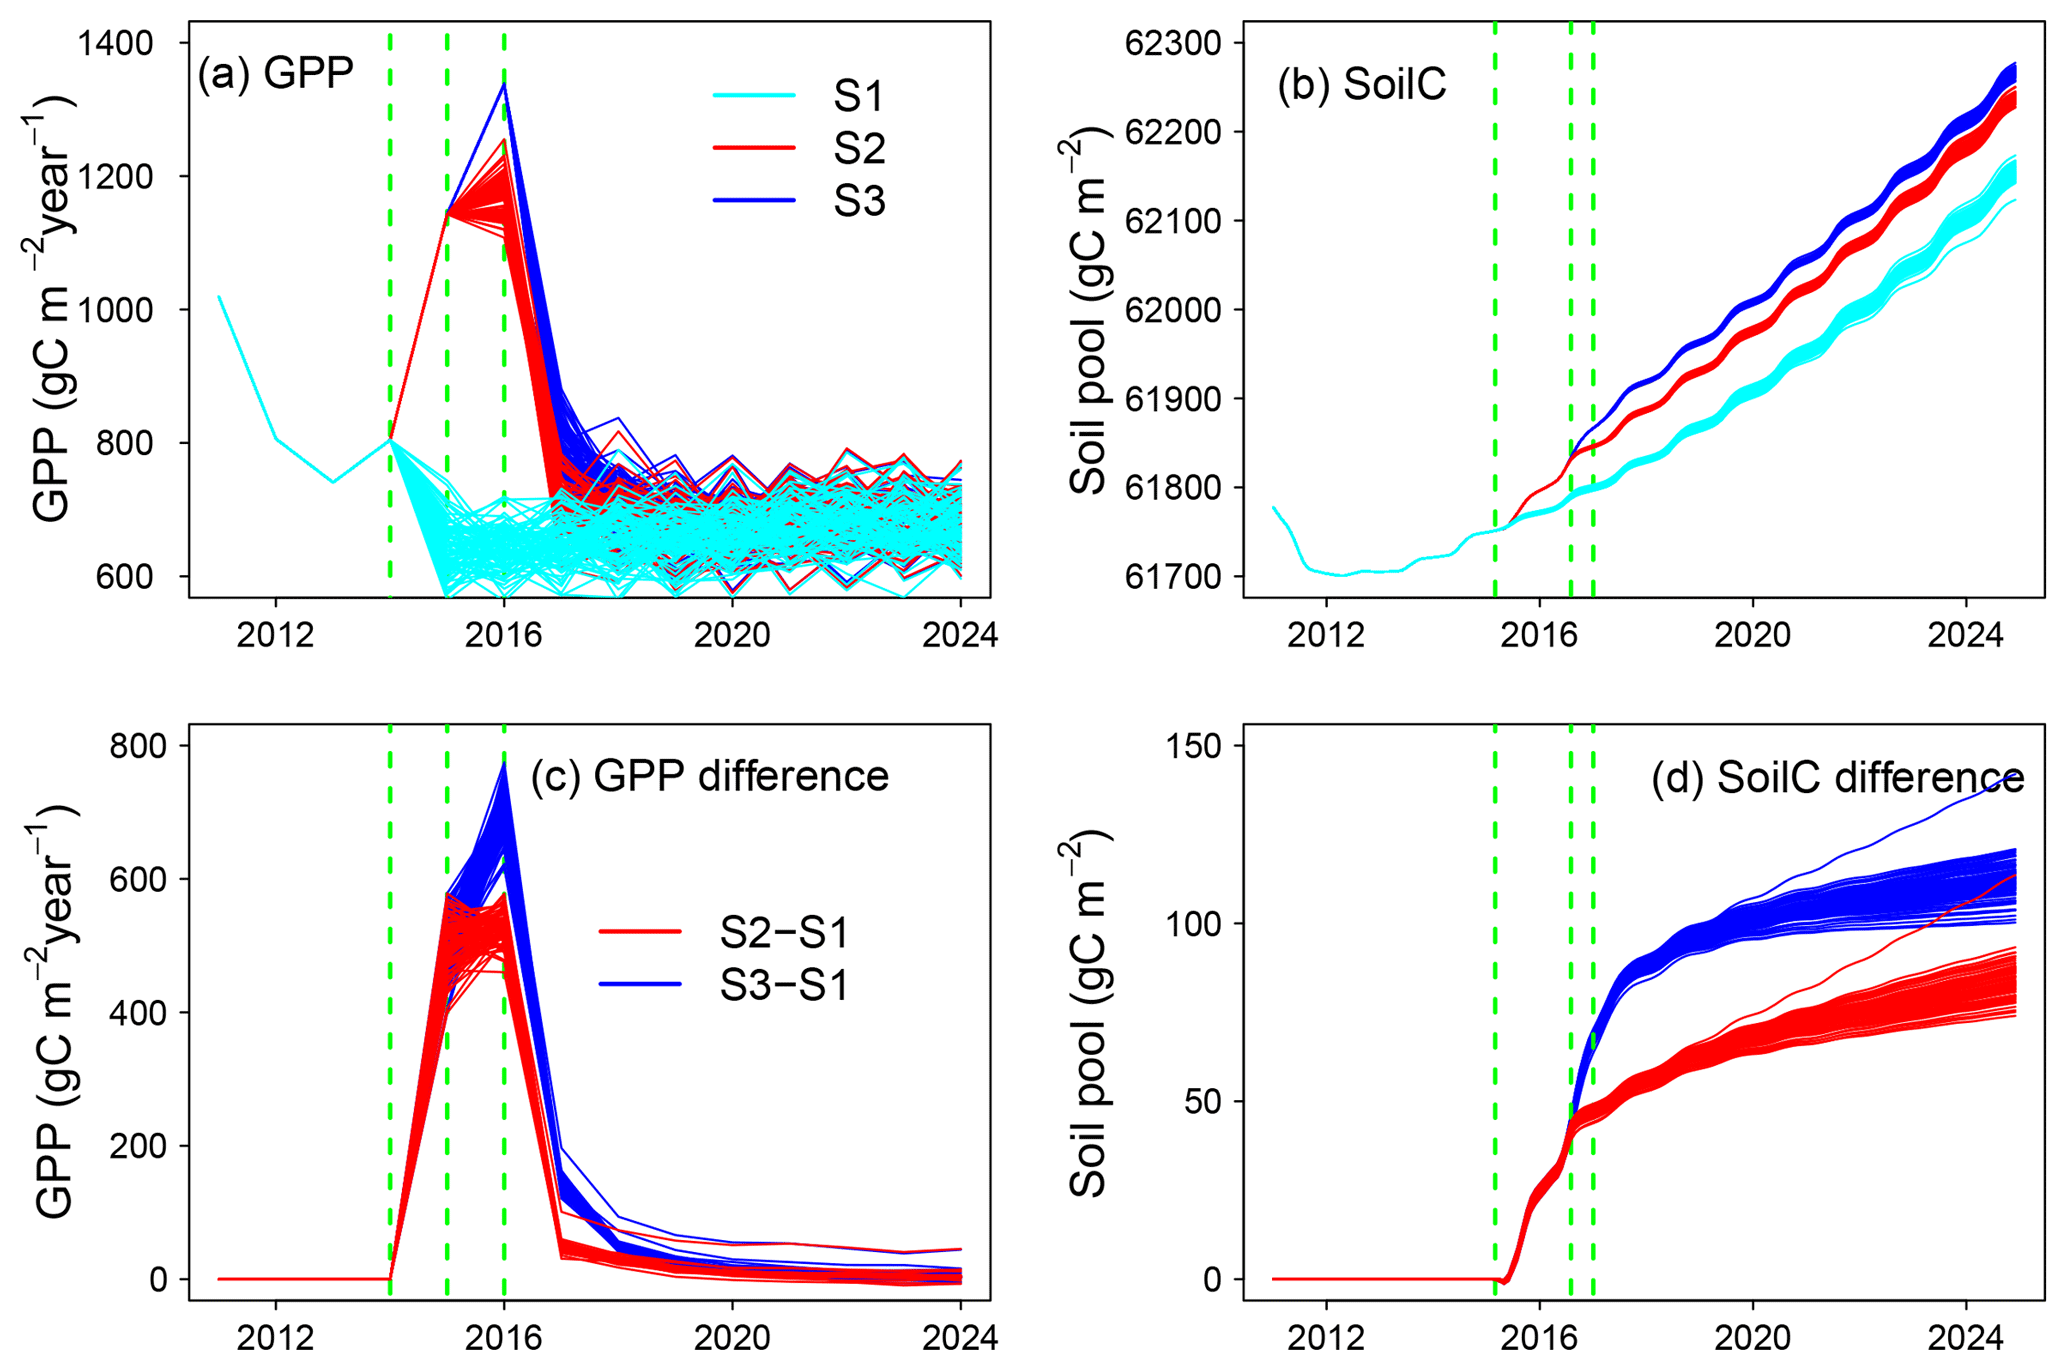
Figure 6Updated vs. un-updated forecasting of gross primary production (GPP; panels a, c) and soil organic C content (SoilC; panels b, d). The upper panels show three series of forecasting with updated vs. stochastically generated weather forcing. “Updated” means the real meteorology forcing monitored from field weather stations. Cyan indicates forecasting with 100 stochastically generated weather forcings from January 2015 to December 2024 (S1); red corresponds to updated forecasting with two stages, which is updating with measured weather forcing from January 2015 to July 2016, followed by forecasting with 100 stochastically generated weather forcings from August 2016 to December 2024 (S2); and blue shows updated forecasting with measured weather forcing from January 2015 to December 2016, followed by forecasting with 100 stochastically generated weather forcings from January 2017 to December 2024 (S3). Panels (c) and (d) display mismatches between updated forecasting (S2, 3) and the original un-updated forecasting (S1). Red displays the difference between S2 and S1 (S2–S1), and blue shows the discrepancy between S3 and S1 (S3–S1). Dashed green lines indicate the start of forecasting with stochastically generated weather forcing. Note that panels (a) and (c) are plotted on a yearly timescale and panels (b) and (d) show results on a monthly timescale.
GPP is highly sensitive to climate forcing. The differences between the updated (S2, 3) and initial forecasts (S1) reach almost 800 gC m−2 yr−1 (Fig. 6c). The discrepancy is strongly dampened in the following 1–2 years. The impact of updated forecasts is close to 0 after approximately 5 years. However, the soil carbon pool shows a different pattern. The soil carbon pool is increased by less than 150 gC m−2, which is relatively small compared to the carbon pool size of ca. 62 000 gC m−2. The impact of updated forecasts grows with time and is highest at the end of the simulation year 2024. GPP is sensitive to the immediate change in climate forcing, while the updated ecosystem status (or initial value) has a minimum impact on the long-term forecast of GPP. The impact of updated climate forcing is relatively small for soil carbon forecasts during our study period. Soil carbon is less sensitive to the immediate change in climate compared to GPP. However, the alteration of system status affects the soil carbon forecast, especially on a longer timescale.
Since we are archiving updated forecasts every week, we can track the relative contribution of ecosystem status, forcing uncertainty, and parameter distributions to the overall forecasting patterns of different ecological variables and how these patterns evolve in time. In addition, as more observations of ecological variables (e.g., carbon fluxes and pool sizes) become available, it is feasible to diagnose key factors that promote robust ecological forecasting by comparing the archived forecasts vs. observations and analyzing archives of model parameters, initial values, and climate forcing.
4.1 The necessity of interactive infrastructure to realize ecological forecasting
Interactions enable the exchange and extension of information to benefit from collective knowledge. For example, manipulative studies will have a much broader impact if the implications of their results can be extended from the regression between environmental variables and ecosystem response, such as being integrated into an ecosystem model through model–data communication. Such an approach will allow us to gain information about the processes responsible for ecosystem response, constraining models, and making more reliable predictions. Going beyond the common practice of model–data assimilation, in which model updating lags far behind observations, EcoPAD (v1.0) enables iterative model updating and forecasting by dynamically integrating models with new observations in near-real time. This near-real-time interactive capacity relies on its scientific workflow that automates data management, model simulation, data simulation, and result visualization. The system design encourages thorough interactions between experimenters and modelers. Forecasting results from SPRUCE were shared among research groups with different backgrounds through the web interface. Expertise from different research groups was integrated to improve a second round of forecasting. Again, thanks to the workflow, new information or adjustments are incorporated into forecasting efficiently, making the forecasting system fully interactive.
We also benefit from the interactive EcoPAD (v1.0) platform to broaden user–model interactions and to broadcast forecasting results. Learning about ecosystem models and data–model fusion techniques may undermine one's productivity and even discourage researchers from learning modeling techniques because of their complexity and long learning curve. Because EcoPAD (v1.0) can be accessed from a web browser and does not require any coding from the user's side, the time lag between learning the model structure and obtaining model-based results for one's study is minimal, which opens the door for non-modeler groups to “talk” with models. The online storage of one's results lowers the risk of data loss. The results of each model run can be easily tracked and shared with a unique ID and web address. In addition, the web-based workflow also saves time for experts with automated model running, data assimilation, forecasting, structured result access, and instantaneous graphic outputs, bringing the possibility for a thorough exploration of more essential parts of the system. The simplicity in use of EcoPAD (v1.0) at the same time may limit access to the code and lower flexibility. Flexibility for users with higher demands, for example those who want to test alternative data assimilation methods, use a different carbon cycle model, change the number of calibrated parameters, or include observations for other variables, is provided through the GitHub repository (https://github.com/ou-ecolab, last access: January 2019). This GitHub repository contains code and instructions for installing, configuring, and controlling the whole system; users can adapt the workflow to wrap their own model based on their needs. On the one hand, the open-source web-based system broadens the user community. On the other hand, it increases the risk of misuse and misinterpretation. We encourage users to be critical and consult system developers to avoid inappropriate application of the system.
4.2 Implications for better ecological forecasting
Specific to the reliable forecasting of carbon dynamics, our initial exploration from EcoPAD-SPRUCE indicates that realistic model structure, correct parameterization, and accurate external environmental conditions are essential. The model structure captures important mechanisms that regulate ecosystem carbon dynamics. Adjustment in the model structure is critical to our improvement of methane forecasting. Model parameters may vary between observation sites and change with time or environmental conditions (Medlyn et al., 1999; Luo et al., 2001). A static or wrong parameterization misses important mechanisms (e.g., acclimation and adaptation) that regulate future carbon dynamics. Parameters that are not well constrained, for example caused by a lack of information from observational data, contribute to high forecasting uncertainty and low reliability in forecasting results. Correct parameterization is especially important for long-term carbon pool predictions as parameter uncertainty resulted in high forecasting uncertainty in our case study (Jiang et al., 2018). Parameter values derived under ambient conditions were not applicable to the warming treatment in our methane case due to acclimation. The external environmental condition is another important factor in carbon predictions. The external environmental condition includes both the external climatic forcing that is used to drive ecosystem models and also the environmental condition that is simulated by ecosystem models. As we showed that air warming may not proportionally transfer to soil warming, realistic soil environmental information needs to be appropriately represented to predict soil carbon dynamics (Huang et al., 2017). The impact of external forcing is especially obvious in short-term carbon flux predictions. Forcing uncertainty resulted in higher forecasting uncertainty in carbon flux compared to that from parameter uncertainty (Jiang et al., 2018). Mismatches in forecasted vs. realized forcing greatly increased simulated GPP and the discrepancy diminished in the long run. A reliable external environmental condition, to some extent, reduces the complexity in diagnosing modeled carbon dynamics.
Pool-based vs. flux-based predictions are regulated differently by external forcing and initial states, which indicates that differentiated efforts are required to improve short- vs. long-term predictions. External forcing, which has not been well emphasized in previous carbon studies, has a strong impact on short-term forecasting. The large response of GPP to forecasted vs. realized forcing, as well as the stronger forcing-caused uncertainty in GPP predictions, indicates that correct forcing information is a key step in short-term flux predictions. In this study, we stochastically generated the climate forcing based on local climatic conditions (1961–2014), which is not sufficient to capture local short-term climate variability. As a result, updated GPP went outside our ensemble forecasting. On the other hand, parameters and historical information about pool status are more important in long-term pool predictions. Therefore, improvement in long-term pool size predictions cannot be achieved with accurate climatic information alone. Instead, it requires accumulation in knowledge related to site history and processes that regulate pool dynamics.
Furthermore, reliable forecasting requires an understanding of uncertainty sources in addition to future mean states. Uncertainty and complexity are major factors that lead to the belief in “computationally irreducible” and low intrinsic predictability of ecological systems (Beckage et al., 2011; Coreau et al., 2010; Schindler and Hilborn, 2015). Recent advances in computational statistical methods offer a way to formally account for various uncertainty sources in ecology (Clark et al., 2001; Cressie et al., 2009). The Bayesian approach embedded in EcoPAD (v1.0) brings the opportunity to understand and communicate forecasting uncertainty. Our case study revealed that forcing uncertainty is more important in flux-based predictions, while parameter uncertainty is more critical in pool-based predictions. Actually, how forecasting uncertainty changes with time, what the dominate contributors of forecasting uncertainty are (e.g., parameter, initial condition, model structure, observation errors, forcing, etc.), how uncertainty sources interact among different components, and to what extent unconstrained parameters affect forecasting uncertainty are all valuable questions that can be explored through EcoPAD (v1.0).
4.3 Applications of EcoPAD (v1.0) to manipulative experiments and observation sites
Broadly speaking, data–model integration stands to increase the overall precision and accuracy of model-based experimentation (Luo et al., 2011b; Niu et al., 2014). Systems for which data have been collected in the field and that are well represented by ecological models therefore have the capacity to receive the highest benefits from EcoPAD (v1.0) to improve forecasts. In a global change context, experimental manipulations, including ecosystem responses to changes in precipitation regimes, carbon dioxide concentrations, temperatures, season lengths, and species compositional shifts, can now be assimilated into ecosystem models (Shi et al., 2016; Xu et al., 2006; Gao et al., 2011; Lebauer et al., 2013). The impacts of these global change factors on carbon cycling and ecosystem functioning can now be measured in a scientifically transparent and verifiable manner. This leads to ecosystem modeling of systems and processes that can obtain levels of confidence that lend credibility (from the public point of view) to the forward progress of science toward forecasting and predicting (Clark et al., 2001). These are the strengths of a widely available interface devoted to data–model integration towards better forecasting.
The data–model integration framework of EcoPAD (v1.0) creates a smart interactive model–experiment (ModEx) system. ModEx has the capacity to form a feedback loop in which field experiments guide modeling and modeling influences experimental focus (Luo et al., 2011a). We demonstrated how EcoPAD (v1.0) works hand-in-hand between modelers and experimenters in the life cycle of the SPRUCE project. The EcoPAD-SPRUCE system operates while experimenters are making measurements or planning for future research. Information is constantly fed back between modelers and experimenters, and simultaneous efforts from both parties illustrate how communication between models and data advance and shape our understanding towards better forecasts during the life cycle of a scientific project. ModEx can be extended to other experimental systems to do the following: (1) predict what an ecosystem's response might be to treatments once the experimenter has selected a site and decided the experimental plan; (2) assimilate the data experimenters are collecting during the experiment to constrain model predictions; (3) project what an ecosystem's responses may likely be in the rest of the experiment; (4) tell experimenters which important datasets they may want to collect in order to understand the system; (5) periodically update the projections; and (6) improve the models, the data assimilation system, and field experiments during the process.
In addition to manipulative experiments, the data assimilation system of EcoPAD (v1.0) can be used for automated model calibration for FLUXNET sites or other observation networks, such as NEON and LTER (Johnson et al., 2010; Robertson et al., 2012). The application of EcoPAD (v1.0) at FLUXNET, NEON, or LTER sites includes three steps in general. First, build the climate forcing in the suitable formats of EcoPAD (v1.0) from the database of each site. Second, collect the prior information (include observations of state variables) in the data assimilation system from FLUXNET, NEON, or LTER sites. Third, incorporate the forcing and prior information into EcoPAD (v1.0) and then run EcoPAD (v1.0) with the dynamic data assimilation system. Furthermore, the proposed continental-scale ecology study (Schimel, 2011), EcoPAD (v1.0) once properly applied could also help evaluate and optimize the field deployment of environmental sensors and supporting cyber-infrastructure, which will be necessary for larger, more complex environmental observing systems being planned in the US and across different continents.
4.4 Future developments
EcoPAD (v1.0) will expand as time goes on. The system is designed to incorporate multiple process-based models, diverse data assimilation techniques, and various ecological state variables for different ecosystems. The case studies presented in earlier sections are based primarily on one model. A multiple (or ensemble) model approach is helpful in tracking uncertainty sources from our process understanding. With rapidly evolving ecological knowledge, emerging models with different hypotheses, such as the microbial–enzyme model (Wieder et al., 2013), enhance our capacity in ecological prediction but can also benefit from rapid tests against data if incorporated into EcoPAD (v1.0). In addition to MCMC (Braswell et al., 2005; Xu et al., 2006), a variety of data assimilation techniques have been recently applied to improve models for ecological forecasting, such as the EnKF (Gao et al., 2011), genetic algorithms (Zhou and Luo, 2008), and 4-D variational assimilation (Peylin et al., 2016). Future development will incorporate different optimization techniques to offer users the option to search for the best model parameters by selecting and comparing the best method for their specific studies. We focus mostly on carbon-related state variables in the SPRUCE example, and the data assimilation system in EcoPAD (v1.0) needs to include more observed variables for constraining model parameters. For example, the NEON sites not only provide measured ecosystem CO2 fluxes and soil carbon stocks, but also resource (e.g., GPP–transpiration for water and GPP–intercepted PAR for light) use efficiency (Johnson et al., 2010).
Researchers interested in creating their own multiple model and/or multiple assimilation scheme version of EcoPAD (v1.0) can start from the GitHub repository (https://github.com/ou-ecolab, last access: January 2019) where the source code of the EcoPAD (v1.0) workflow is archived. To add a new variable that is not forecasted in the EcoPAD-SPRUCE example requires modelers and experimenters to work together to understand their process-based model, observations, and how messaging works in the workflow of EcoPAD (v1.0) following the example of EcoPAD-SPRUCE. To add a new model or a new data assimilation scheme for variables that are forecasted in EcoPAD-SPRUCE, researchers need to create additional dockers and mount them to the existing workflow with knowledge of how information is passed within the workflow (see the Supplement for detailed information).
With these improvements, one goal of EcoPAD (v1.0) is to enable the research community to understand and reduce forecasting uncertainties from different sources and forecast various aspects of future biogeochemical and ecological changes as data become available. EcoPAD (v1.0) acts as a tool to link model and data, not as a substitution for either model or data. Ecological forecasting through EcoPAD (v1.0) relies strongly on theoretical (model) and empirical (data) ecological studies. Questions regarding the major factors regulating temporal variability in methane emissions cannot be directly answered by EcoPAD (v1.0). How to make use of EcoPAD (v1.0) to inspire breakthroughs in both theoretical and empirical ecological studies is worth future exploration.
The power of EcoPAD (v1.0) also lies in the potential service it can bring to society. Forecasting with carefully quantified uncertainty is helpful in providing support for natural resource managers and policy makers (Clark et al., 2001). It is always difficult to bring complex mathematical ecosystem models to the general public, which creates a gap between current scientific advances and public awareness. The web-based interface from EcoPAD (v1.0) makes modeling as easy as possible without losing the connection to the mathematics behind the models. It will greatly transform environmental education and encourage citizen science (Miller-Rushing et al., 2012; Kobori et al., 2016) in ecology and climate change with future outreach activities to broadcast the EcoPAD (v1.0) platform.
The fully interactive web-based Ecological Platform for Assimilating Data (EcoPAD, v1.0) into models aims to promote data–model integration towards predictive ecology by making complex ecosystem model and data assimilation techniques accessible to different audience. It is supported by meta-databases of biogeochemical variables, libraries of modules for process models, a toolbox of inversion techniques, and a scalable scientific workflow. Through these components, it automates data management, model simulation, data assimilation, ecological forecasting, and result visualization, providing an open, convenient, transparent, flexible, scalable, traceable, and readily portable platform to systematically conduct data–model integration towards better ecological forecasting.
We illustrated several of its functionalities through the Spruce and Peatland Responses Under Climatic and Environmental change (SPRUCE) experiment. The iterative forecasting approach from EcoPAD-SPRUCE through the prediction–question–discussion–adjustment–prediction cycle and extensive communication between model and data creates a new paradigm to best inform forecasting. In addition to forecasting, EcoPAD (v1.0) enables an interactive web-based approach to conduct model simulation, estimate model parameters or state variables, quantify uncertainty in estimated parameters and projected states of ecosystems, evaluate model structures, and assess sampling strategies. Altogether, EcoPAD-SPRUCE creates a smart interactive model–experiment (ModEx) system from which experimenters can know what an ecosystem's response might be at the beginning of their experiments, constrain models through collected measurements, predict an ecosystem's response in the rest of the experiments, adjust measurements to better understand their system, periodically update projections, and improve models, the data assimilation system, and field experiments.
Specifically for forecasting carbon dynamics, EcoPAD-SPRUCE revealed that better forecasting relies on improvements in model structure, parameterization, and accurate external forcing. Accurate external forcing is critical for short-term flux-based carbon predictions, while the right process understanding, parameterization, and historical information are essential for long-term pool-based predictions. In addition, EcoPAD (v1.0) provides an avenue to disentangle different sources of uncertainties in carbon cycling studies and to provide reliable forecasts with accountable uncertainties.
The EcoPAD (v1.0) portal is available at https://ecolab.nau.edu/ecopad_portal/ (Jiang et al., 2019a), and code is provided at the GitHub repository (https://github.com/ou-ecolab, Jiang et al., 2019b).
Relevant data for this paper are available at the SPRUCE project web page (https://mnspruce.ornl.gov/, last access: January 2019) and the EcoPAD (v1.0) web portal (https://ecolab.nau.edu/ecopad_portal/, Jiang et al., 2019a). Additional data can be requested from the corresponding author.
The supplement related to this article is available online at: https://doi.org/10.5194/gmd-12-1119-2019-supplement.
YH, MS, JJ, and YL designed this study. YH, JJ, NS, and MS built the workflow. JJ built the simulation and data assimilation systems. SM tested the system and conducted research related to methane. PJH and DR were in charge of observational data collection, transfer, and archiving. VS and CGJ maintained and made further improvements to the system. YH conducted the analysis and drafted the paper. All authors discussed the results and contributed to the paper.
The authors declare that they have no conflict of interest.
SPRUCE components of this work (PJH, DMR) are based upon work supported by the U.S. Department of Energy, Office of Science, Office of Biological and Environmental Research. Oak Ridge National Laboratory is managed by UT-Battelle, LLC, for the U.S. Department of Energy under contract DE-AC05-00OR22725.
This paper was edited by Philippe Peylin and reviewed by two anonymous referees.
Ahlstrom, A., Schurgers, G., Arneth, A., and Smith, B.: Robustness and uncertainty in terrestrial ecosystem carbon response to CMIP5 climate change projections, Environ. Res. Lett., 7, 044008, https://doi.org/10.1088/1748-9326/7/4/044008, 2012.
Anderson, J., Hoar, T., Raeder, K., Liu, H., Collins, N., Torn, R., and Avellano, A.: The data assimilation research testbed A Community Facility, B. Am. Meteorol. Soc., 90, 1283–1296, https://doi.org/10.1175/2009bams2618.1, 2009.
Baldocchi, D., Falge, E., Gu, L. H., Olson, R., Hollinger, D., Running, S., Anthoni, P., Bernhofer, C., Davis, K., Evans, R., Fuentes, J., Goldstein, A., Katul, G., Law, B., Lee, X. H., Malhi, Y., Meyers, T., Munger, W., Oechel, W., U, K. T. P., Pilegaard, K., Schmid, H. P., Valentini, R., Verma, S., Vesala, T., Wilson, K., and Wofsy, S.: FLUXNET: A new tool to study the temporal and spatial variability of ecosystem-scale carbon dioxide, water vapor, and energy flux densities, B. Am. Meteorol. Soc., 82, 2415–2434, https://doi.org/10.1175/1520-0477(2001)082<2415:fantts>2.3.co;2, 2001.
Ball, J. T., Woodrow, I. E., and Berry, J. A.: A model predicting stomatal conductance and its contribution to the control of photosynthesis under different environmental conditions, in: Progress in Photosynthesis Research, edited by: Biggens, J. Martinus Nijhoff Publishers, The Netherlands, 221–224, 1987.
Bastiaanssen, W. G. M. and Ali, S.: A new crop yield forecasting model based on satellite measurements applied across the Indus Basin, Pakistan, Agr. Ecosyst. Environ., 94, 321–340, https://doi.org/10.1016/s0167-8809(02)00034-8, 2003.
Beckage, B., Gross, L. J., and Kauffman, S.: The limits to prediction in ecological systems, Ecosphere, 2, UNSP 125, https://doi.org/10.1890/es11-00211.1, 2011.
Bloom, A. A., Exbrayat, J. F., van der Velde, I. R., Feng, L., and Williams, M.: The decadal state of the terrestrial carbon cycle: Global retrievals of terrestrial carbon allocation, pools, and residence times, P. Natl. Acad. Sci. USA, 113, 1285–1290, https://doi.org/10.1073/pnas.1515160113, 2016.
Botkin, D. B., Saxe, H., Araujo, M. B., Betts, R., Bradshaw, R. H. W., Cedhagen, T., Chesson, P., Dawson, T. P., Etterson, J. R., Faith, D. P., Ferrier, S., Guisan, A., Hansen, A. S., Hilbert, D. W., Loehle, C., Margules, C., New, M., Sobel, M. J., and Stockwell, D. R. B.: Forecasting the effects of global warming on biodiversity, Bioscience, 57, 227–236, https://doi.org/10.1641/b570306, 2007.
Braswell, B. H., Sacks, W. J., Linder, E., and Schimel, D. S.: Estimating diurnal to annual ecosystem parameters by synthesis of a carbon flux model with eddy covariance net ecosystem exchange observations, Glob. Change Biol., 11, 335–355, https://doi.org/10.1111/j.1365-2486.2005.00897.x, 2005.
Clark, J. S., Carpenter, S. R., Barber, M., Collins, S., Dobson, A., Foley, J. A., Lodge, D. M., Pascual, M., Pielke, R., Pizer, W., Pringle, C., Reid, W. V., Rose, K. A., Sala, O., Schlesinger, W. H., Wall, D. H., and Wear, D.: Ecological forecasts: An emerging imperative, Science, 293, 657–660, https://doi.org/10.1126/science.293.5530.657, 2001.
Clark, J. S., Lewis, M., McLachlan, J. S., and HilleRisLambers, J.: Estimating population spread: What can we forecast and how well?, Ecology, 84, 1979–1988, https://doi.org/10.1890/01-0618, 2003.
Corbet, S. A., Saville, N. M., Fussell, M., PrysJones, O. E., and Unwin, D. M.: The competition box: A graphical aid to forecasting pollinator performance, J. Appl. Ecol., 32, 707–719, https://doi.org/10.2307/2404810, 1995.
Coreau, A., Pinay, G., Thompson, J. D., Cheptou, P. O., and Mermet, L.: The rise of research on futures in ecology: rebalancing scenarios and predictions, Ecol. Lett., 12, 1277–1286, https://doi.org/10.1111/j.1461-0248.2009.01392.x, 2009.
Coreau, A., Treyer, S., Cheptou, P. O., Thompson, J. D., and Mermet, L.: Exploring the difficulties of studying futures in ecology: what do ecological scientists think?, Oikos, 119, 1364–1376, https://doi.org/10.1111/j.1600-0706.2010.18195.x, 2010.
Craft, C., Clough, J., Ehman, J., Joye, S., Park, R., Pennings, S., Guo, H. Y., and Machmuller, M.: Forecasting the effects of accelerated sea-level rise on tidal marsh ecosystem services, Front. Ecol. Environ., 7, 73–78, https://doi.org/10.1890/070219, 2009.
Cressie, N., Calder, C. A., Clark, J. S., Hoef, J. M. V., and Wikle, C. K.: Accounting for uncertainty in ecological analysis: the strengths and limitations of hierarchical statistical modeling, Ecol. Appl., 19, 553–570, https://doi.org/10.1890/07-0744.1, 2009.
Dietze, M. C., Lebauer, D. S., and Kooper, R.: On improving the communication between models and data, Plant Cell Environ., 36, 1575–1585, https://doi.org/10.1111/pce.12043, 2013.
Diez, J. M., Ibanez, I., Miller-Rushing, A. J., Mazer, S. J., Crimmins, T. M., Crimmins, M. A., Bertelsen, C. D., and Inouye, D. W.: Forecasting phenology: from species variability to community patterns, Ecol. Lett., 15, 545–553, https://doi.org/10.1111/j.1461-0248.2012.01765.x, 2012.
Ellison, A. M.: Repeatability and transparency in ecological research, Ecology, 91, 2536–2539, https://doi.org/10.1890/09-0032.1, 2010.
Farquhar, G. D., Caemmerer, S. V., and Berry, J. A.: A biochemical-model of photosynthetic CO2 assimilation in leaves of C3 species, Planta, 149, 78–90, https://doi.org/10.1007/bf00386231, 1980.
Fordham, D. A., Akcakaya, H. R., Araujo, M. B., Elith, J., Keith, D. A., Pearson, R., Auld, T. D., Mellin, C., Morgan, J. W., Regan, T. J., Tozer, M., Watts, M. J., White, M., Wintle, B. A., Yates, C., and Brook, B. W.: Plant extinction risk under climate change: are forecast range shifts alone a good indicator of species vulnerability to global warming?, Glob. Change Biol., 18, 1357–1371, https://doi.org/10.1111/j.1365-2486.2011.02614.x, 2012.
Gao, C., Wang, H., Weng, E. S., Lakshmivarahan, S., Zhang, Y. F., and Luo, Y. Q.: Assimilation of multiple data sets with the ensemble Kalman filter to improve forecasts of forest carbon dynamics, Ecol. Appl., 21, 1461–1473, 2011.
Hampton, S. E., Strasser, C. A., Tewksbury, J. J., Gram, W. K., Budden, A. E., Batcheller, A. L., Duke, C. S., and Porter, J. H.: Big data and the future of ecology, Front. Ecol. Environ., 11, 156–162, https://doi.org/10.1890/120103, 2013.
Hanson, P. J., Riggs, J. S., Nettles, W. R., Phillips, J. R., Krassovski, M. B., Hook, L. A., Gu, L., Richardson, A. D., Aubrecht, D. M., Ricciuto, D. M., Warren, J. M., and Barbier, C.: Attaining whole-ecosystem warming using air and deep-soil heating methods with an elevated CO2 atmosphere, Biogeosciences, 14, 861–883, https://doi.org/10.5194/bg-14-861-2017, 2017.
Hare, J. A., Alexander, M. A., Fogarty, M. J., Williams, E. H., and Scott, J. D.: Forecasting the dynamics of a coastal fishery species using a coupled climate-population model, Ecol. Appl., 20, 452–464, https://doi.org/10.1890/08-1863.1, 2010.
Huang, Y., Jiang, J., Ma, S., Ricciuto, D., Hanson, P. J., and Luo, Y.: Soil thermal dynamics, snow cover and frozen depth under five temperature treatments in an ombrotrophic bog: Constrained forecast with data assimilation, J. Geophys. Res.-Biogeo., 122, 2046–2063, https://doi.org/10.1002/2016JG003725, 2017.
Jiang, J., Huang, Y., Ma, S., Stacy, M., Shi, Z., Ricciuto, D. M., Hanson, P. J., and Luo, Y.: Forecasting responses of a northern peatland carbon cycle to elevated CO2 and a gradient of experimental warming, J. Geophys. Res.-Biogeo., 123, 1057–1071, https://doi.org/10.1002/2017jg004040, 2018.
Jiang, J., Huang, Y., and Jung, C. G.: EcoPAD v1.0 at the SPRUCE site, available at: https://ecolab.nau.edu/ecopad_portal/, last access: January 2019a.
Jiang, J., Stacy, M., Huang, Y., Sundi, N., and Ma., S.: GitHub site of EcoPAD v1.0 code, available at: https://github.com/ou-ecolab, last access: January 2019b.
Johnson, B. R., Kampe, T. U., and Kuester, M.: Development of airborne remote sensing instrumentations for NEON, SPIE Optical Engineering+ Applications, 78090I-78090I-78010, https://doi.org/10.1117/12.860182, August, 2010.
Kearney, M. R., Wintle, B. A., and Porter, W. P.: Correlative and mechanistic models of species distribution provide congruent forecasts under climate change, Conserv. Lett., 3, 203–213, https://doi.org/10.1111/j.1755-263X.2010.00097.x, 2010.
Keenan, T. F., Davidson, E., Moffat, A. M., Munger, W., and Richardson, A. D.: Using model-data fusion to interpret past trends, and quantify uncertainties in future projections, of terrestrial ecosystem carbon cycling, Glob. Change Biol., 18, 2555–2569, https://doi.org/10.1111/j.1365-2486.2012.02684.x, 2012.
Kobori, H., Dickinson, J. L., Washitani, I., Sakurai, R., Amano, T., Komatsu, N., Kitamura, W., Takagawa, S., Koyama, K., Ogawara, T., and Miller-Rushing, A. J.: Citizen science: a new approach to advance ecology, education, and conservation, Ecol. Res., 31, 1–19, https://doi.org/10.1007/s11284-015-1314-y, 2016.
Kolka, R. K., Sebestyen, S. D., Verry, E. S., and Brooks, K. N.: Peatland biogeochemistry and watershed hydrology at the Marcell Experimental Forest, CRC Press, Boca Raton, 488 pp., 2011.
Lebauer, D. S., Wang, D., Richter, K. T., Davidson, C. C., and Dietze, M. C.: Facilitating feedbacks between field measurements and ecosystem models, Ecol. Monogr., 83, 133–154, https://doi.org/10.1890/12-0137.1, 2013.
Liang, J. Y., Li, D. J., Shi, Z., Tiedje, J. M., Zhou, J. Z., Schuur, E. A. G., Konstantinidis, K. T., and Luo, Y. Q.: Methods for estimating temperature sensitivity of soil organic matter based on incubation data: A comparative evaluation, Soil Biol. Biochem., 80, 127–135, https://doi.org/10.1016/j.soilbio.2014.10.005, 2015.
Ludascher, B., Altintas, I., Berkley, C., Higgins, D., Jaeger, E., Jones, M., Lee, E. A., Tao, J., and Zhao, Y.: Scientific workflow management and the Kepler system, Concurr. Comp.-Pract. E., 18, 1039–1065, https://doi.org/10.1002/cpe.994, 2006.
Luo, Y. Q. and Reynolds, J. F.: Validity of extrapolating field CO2 experiments to predict carbon sequestration in natural ecosystems, Ecology, 80, 1568–1583, https://doi.org/10.1890/0012-9658(1999)080[1568:VOEFCE]2.0.CO;2, 1999.
Luo, Y. Q., Wan, S. Q., Hui, D. F., and Wallace, L. L.: Acclimatization of soil respiration to warming in a tall grass prairie, Nature, 413, 622–625, https://doi.org/10.1038/35098065, 2001.
Luo, Y. Q., Melillo, J., Niu, S. L., Beier, C., Clark, J. S., Classen, A. T., Davidson, E., Dukes, J. S., Evans, R. D., Field, C. B., Czimczik, C. I., Keller, M., Kimball, B. A., Kueppers, L. M., Norby, R. J., Pelini, S. L., Pendall, E., Rastetter, E., Six, J., Smith, M., Tjoelker, M. G., and Torn, M. S.: Coordinated approaches to quantify long-term ecosystem dynamics in response to global change, Glob. Change Biol., 17, 843–854, https://doi.org/10.1111/j.1365-2486.2010.02265.x, 2011a.
Luo, Y. Q., Ogle, K., Tucker, C., Fei, S. F., Gao, C., LaDeau, S., Clark, J. S., and Schimel, D. S.: Ecological forecasting and data assimilation in a data-rich era, Ecol. Appl., 21, 1429–1442, 2011b.
Luo, Y. Q., Ahlstrom, A., Allison, S. D., Batjes, N. H., Brovkin, V., Carvalhais, N., Chappell, A., Ciais, P., Davidson, E. A., Finzi, A. C., Georgiou, K., Guenet, B., Hararuk, O., Harden, J. W., He, Y. J., Hopkins, F., Jiang, L. F., Koven, C., Jackson, R. B., Jones, C. D., Lara, M. J., Liang, J. Y., McGuire, A. D., Parton, W., Peng, C. H., Randerson, J. T., Salazar, A., Sierra, C. A., Smith, M. J., Tian, H. Q., Todd-Brown, K. E. O., Torn, M., van Groenigen, K. J., Wang, Y. P., West, T. O., Wei, Y. X., Wieder, W. R., Xia, J. Y., Xu, X., Xu, X. F., and Zhou, T.: Toward more realistic projections of soil carbon dynamics by Earth system models, Global Biogeochem. Cy., 30, 40–56, https://doi.org/10.1002/2015gb005239, 2016.
Ma, S., Jiang, J., Huang, Y. Y., Shi, Z., Wilson, R. M., Ricciuto, D., Sebestyen, S. D., Hanson, P. J., and Luo, Y. Q.: Data-Constrained Projections of Methane Fluxes in a Northern Minnesota Peatland in Response to Elevated CO2 and Warming, J. Geophys. Res.-Biogeosci., 122, 2841–2861, https://doi.org/10.1002/2017jg003932, 2017.
Medlyn, B. E., Badeck, F. W., De Pury, D. G. G., Barton, C. V. M., Broadmeadow, M., Ceulemans, R., De Angelis, P., Forstreuter, M., Jach, M. E., Kellomaki, S., Laitat, E., Marek, M., Philippot, S., Rey, A., Strassemeyer, J., Laitinen, K., Liozon, R., Portier, B., Roberntz, P., Wang, K., and Jarvis, P. G.: Effects of elevated CO2 on photosynthesis in European forest species: a meta-analysis of model parameters, Plant Cell Environ., 22, 1475–1495, https://doi.org/10.1046/j.1365-3040.1999.00523.x, 1999.
Melillo, J. M., Frey, S. D., DeAngelis, K. M., Werner, W. J., Bernard, M. J., Bowles, F. P., Pold, G., Knorr, M. A., and Grandy, A. S.: Long-term pattern and magnitude of soil carbon feedback to the climate system in a warming world, Science, 358, 101–105, https://doi.org/10.1126/science.aan2874, 2017.
Michener, W. K. and Jones, M. B.: Ecoinformatics: supporting ecology as a data-intensive science, Trends Ecol. Evol., 27, 85–93, https://doi.org/10.1016/j.tree.2011.11.016, 2012.
Miller-Rushing, A., Primack, R., and Bonney, R.: The history of public participation in ecological research, Front. Ecol. Environ., 10, 285–290, https://doi.org/10.1890/110278, 2012.
Moorcroft, P. R.: How close are we to a predictive science of the biosphere?, Trends Ecol. Evol., 21, 400–407, https://doi.org/10.1016/j.tree.2006.04.009, 2006.
Mouquet, N., Lagadeuc, Y., Devictor, V., Doyen, L., Duputie, A., Eveillard, D., Faure, D., Garnier, E., Gimenez, O., Huneman, P., Jabot, F., Jarne, P., Joly, D., Julliard, R., Kefi, S., Kergoat, G. J., Lavorel, S., Le Gall, L., Meslin, L., Morand, S., Morin, X., Morlon, H., Pinay, G., Pradel, R., Schurr, F. M., Thuiller, W., and Loreau, M.: REVIEW: Predictive ecology in a changing world, J. Appl. Ecol., 52, 1293–1310, https://doi.org/10.1111/1365-2664.12482, 2015.
Niu, S. L., Luo, Y. Q., Dietze, M. C., Keenan, T. F., Shi, Z., Li, J. W., and Chapin, F. S.: The role of data assimilation in predictive ecology, Ecosphere, 5, 65, https://doi.org/10.1890/es13-00273.1, 2014.
Ong, J. B. S., Chen, M. I. C., Cook, A. R., Lee, H. C., Lee, V. J., Lin, R. T. P., Tambyah, P. A., and Goh, L. G.: Real-Time Epidemic Monitoring and Forecasting of H1N1-2009 Using Influenza-Like Illness from General Practice and Family Doctor Clinics in Singapore, Plos One, 5, e10036, https://doi.org/10.1371/journal.pone.0010036, 2010.
Osterweil, L. J., Clarke, L. A., Ellison, A. M., Boose, E., Podorozhny, R., and Wise, A.: Clear and Precise Specification of Ecological Data Management Processes and Dataset Provenance, IEEE T. Autom. Sci. Eng., 7, 189–195, https://doi.org/10.1109/tase.2009.2021774, 2010.
Parton, W. J., Stewart, J. W. B., and Cole, C. V.: Dynamics of c, n, p and s in grassland soils – a model, Biogeochemistry, 5, 109–131, https://doi.org/10.1007/bf02180320, 1988.
Parton, W. J., Morgan, J. A., Wang, G. M., and Del Grosso, S.: Projected ecosystem impact of the Prairie Heating and CO2 Enrichment experiment, New Phytol., 174, 823–834, https://doi.org/10.1111/j.1469-8137.2007.02052.x, 2007.
Perretti, C. T., Munch, S. B., and Sugihara, G.: Model-free forecasting outperforms the correct mechanistic model for simulated and experimental data, P. Natl. Acad. Sci. USA, 110, 5253–5257, https://doi.org/10.1073/pnas.1216076110, 2013.
Peylin, P., Bacour, C., MacBean, N., Leonard, S., Rayner, P., Kuppel, S., Koffi, E., Kane, A., Maignan, F., Chevallier, F., Ciais, P., and Prunet, P.: A new stepwise carbon cycle data assimilation system using multiple data streams to constrain the simulated land surface carbon cycle, Geosci. Model Dev., 9, 3321–3346, https://doi.org/10.5194/gmd-9-3321-2016, 2016.
Purves, D., Scharlemann, J., Harfoot, M., Newbold, T., Tittensor, D. P., Hutton, J., and Emmott, S.: Time to model all life on Earth, Nature, 493, 295–297, 2013.
Robertson, G. P., Collins, S. L., Foster, D. R., Brokaw, N., Ducklow, H. W., Gragson, T. L., Gries, C., Hamilton, S. K., McGuire, A. D., and Moore, J. C.: Long-term ecological research in a human-dominated world, BioScience, 62, 342–353, 2012.
Schaefer, K., Schwalm, C. R., Williams, C., Arain, M. A., Barr, A., Chen, J. M., Davis, K. J., Dimitrov, D., Hilton, T. W., Hollinger, D. Y., Humphreys, E., Poulter, B., Raczka, B. M., Richardson, A. D., Sahoo, A., Thornton, P., Vargas, R., Verbeeck, H., Anderson, R., Baker, I., Black, T. A., Bolstad, P., Chen, J. Q., Curtis, P. S., Desai, A. R., Dietze, M., Dragoni, D., Gough, C., Grant, R. F., Gu, L. H., Jain, A., Kucharik, C., Law, B., Liu, S. G., Lokipitiya, E., Margolis, H. A., Matamala, R., McCaughey, J. H., Monson, R., Munger, J. W., Oechel, W., Peng, C. H., Price, D. T., Ricciuto, D., Riley, W. J., Roulet, N., Tian, H. Q., Tonitto, C., Torn, M., Weng, E. S., and Zhou, X. L.: A model-data comparison of gross primary productivity: Results from the North American Carbon Program site synthesis, J. Geophys. Res.-Biogeo., 117, G03010, https://doi.org/10.1029/2012jg001960, 2012.
Schimel, D.: The era of continental-scale ecology, Front. Ecol. Environ., 9, p. 311, 2011.
Schindler, D. E. and Hilborn, R.: Prediction, precaution, and policy under global change, Science, 347, 953–954, https://doi.org/10.1126/science.1261824, 2015.
Scholze, M., Kaminski, T., Rayner, P., Knorr, W., and Giering, R.: Propagating uncertainty through prognostic carbon cycle data assimilation system simulations, J. Geophys. Res.-Atmos., 112, D17305, https://doi.org/10.1029/2007jd008642, 2007.
Shi, Z., Xu, X., Hararuk, O., Jiang, L. F., Xia, J. Y., Liang, J. Y., Li, D. J., and Luo, Y. Q.: Experimental warming altered rates of carbon processes, allocation, and carbon storage in a tallgrass prairie, Ecosphere, 6, 210, https://doi.org/10.1890/es14-00335.1, 2015.
Shi, Z., Yang, Y. H., Zhou, X. H., Weng, E. S., Finzi, A. C., and Luo, Y. Q.: Inverse analysis of coupled carbon-nitrogen cycles against multiple datasets at ambient and elevated CO2, J. Plant Ecol., 9, 285–295, https://doi.org/10.1093/jpe/rtv059, 2016.
Sitch, S., Huntingford, C., Gedney, N., Levy, P. E., Lomas, M., Piao, S. L., Betts, R., Ciais, P., Cox, P., Friedlingstein, P., Jones, C. D., Prentice, I. C., and Woodward, F. I.: Evaluation of the terrestrial carbon cycle, future plant geography and climate-carbon cycle feedbacks using five Dynamic Global Vegetation Models (DGVMs), Glob. Change Biol., 14, 2015–2039, https://doi.org/10.1111/j.1365-2486.2008.01626.x, 2008.
Steppe, K., von der Crone, J. S., and Pauw, D. J. W.: TreeWatch.net: A Water and Carbon Monitoring and Modeling Network to Assess Instant Tree Hydraulics and Carbon Status, Front. Plant Sci., 7, 993, https://doi.org/10.3389/fpls.2016.00993, 2016.
Stumpf, R. P., Tomlinson, M. C., Calkins, J. A., Kirkpatrick, B., Fisher, K., Nierenberg, K., Currier, R., and Wynne, T. T.: Skill assessment for an operational algal bloom forecast system, J. Marine Syst., 76, 151–161, https://doi.org/10.1016/j.jmarsys.2008.05.016, 2009.
Sugihara, G., May, R., Ye, H., Hsieh, C. H., Deyle, E., Fogarty, M., and Munch, S.: Detecting Causality in Complex Ecosystems, Science, 338, 496–500, https://doi.org/10.1126/science.1227079, 2012.
Thomas, R. Q., Brooks, E. B., Jersild, A. L., Ward, E. J., Wynne, R. H., Albaugh, T. J., Dinon-Aldridge, H., Burkhart, H. E., Domec, J.-C., Fox, T. R., Gonzalez-Benecke, C. A., Martin, T. A., Noormets, A., Sampson, D. A., and Teskey, R. O.: Leveraging 35 years of Pinus taeda research in the southeastern US to constrain forest carbon cycle predictions: regional data assimilation using ecosystem experiments, Biogeosciences, 14, 3525–3547, https://doi.org/10.5194/bg-14-3525-2017, 2017.
Vitolo, C., Elkhatib, Y., Reusser, D., Macleod, C. J. A., and Buytaert, W.: Web technologies for environmental Big Data, Environ. Modell. Softw., 63, 185–198, https://doi.org/10.1016/j.envsoft.2014.10.007, 2015.
Walker, A. P., Hanson, P. J., De Kauwe, M. G., Medlyn, B. E., Zaehle, S., Asao, S., Dietze, M., Hickler, T., Huntingford, C., Iversen, C. M., Jain, A., Lomas, M., Luo, Y. Q., McCarthy, H., Parton, W. J., Prentice, I. C., Thornton, P. E., Wang, S. S., Wang, Y. P., Warlind, D., Weng, E. S., Warren, J. M., Woodward, F. I., Oren, R., and Norby, R. J.: Comprehensive ecosystem model-data synthesis using multiple data sets at two temperate forest free-air CO2 enrichment experiments: Model performance at ambient CO2 concentration, J. Geophys. Res.-Biogeo., 119, 937–964, https://doi.org/10.1002/2013jg002553, 2014.
Wang, Y. P. and Leuning, R.: A two-leaf model for canopy conductance, photosynthesis and partitioning of available energy I: Model description and comparison with a multi-layered model, Agr. Forest Meteorol., 91, 89–111, https://doi.org/10.1016/s0168-1923(98)00061-6, 1998.
Wang, Y. P., Law, R. M., and Pak, B.: A global model of carbon, nitrogen and phosphorus cycles for the terrestrial biosphere, Biogeosciences, 7, 2261–2282, https://doi.org/10.5194/bg-7-2261-2010, 2010.
Ward, E. J., Holmes, E. E., Thorson, J. T., and Collen, B.: Complexity is costly: a meta-analysis of parametric and non-parametric methods for short-term population forecasting, Oikos, 123, 652–661, https://doi.org/10.1111/j.1600-0706.2014.00916.x, 2014.
Weng, E. S. and Luo, Y. Q.: Soil hydrological properties regulate grassland ecosystem responses to multifactor global change: A modeling analysis, J. Geophys. Res.-Biogeo., 113, G03003, https://doi.org/10.1029/2007jg000539, 2008.
Weng, E. S. and Luo, Y. Q.: Relative information contributions of model vs. data to short- and long-term forecasts of forest carbon dynamics, Ecol. Appl., 21, 1490–1505, 2011.
Weng, E. S., Luo, Y. Q., Gao, C., and Oren, R.: Uncertainty analysis of forest carbon sink forecast with varying measurement errors: a data assimilation approach, J. Plant Ecol., 4, 178–191, https://doi.org/10.1093/jpe/rtr018, 2011.
Wieder, W. R., Bonan, G. B., and Allison, S. D.: Global soil carbon projections are improved by modelling microbial processes, Nat. Clim. Change, 3, 909–912, https://doi.org/10.1038/nclimate1951, 2013.
Xu, T., White, L., Hui, D. F., and Luo, Y. Q.: Probabilistic inversion of a terrestrial ecosystem model: Analysis of uncertainty in parameter estimation and model prediction, Global Biogeochem. Cy., 20, GB2007, https://doi.org/10.1029/2005gb002468, 2006.
Zhou, T. and Luo, Y. Q.: Spatial patterns of ecosystem carbon residence time and NPP-driven carbon uptake in the conterminous United States, Global Biogeochem. Cy., 22, GB3032, https://doi.org/10.1029/2007gb002939, 2008.
Zhou, X. H., Zhou, T., and Luo, Y. Q.: Uncertainties in carbon residence time and NPP-driven carbon uptake in terrestrial ecosystems of the conterminous USA: a Bayesian approach, Tellus B, 64, 17223, https://doi.org/10.3402/tellusb.v64i0.17223, 2012.