the Creative Commons Attribution 4.0 License.
the Creative Commons Attribution 4.0 License.
 | 27 Nov 2025
Enhancing simulations of snowpack properties in land surface models with the Soil, Vegetation and Snow scheme v2.0 (SVS2)
Nicolas R. Leroux
Vincent Fortin
Maria Abrahamowicz
Georgina Woolley
Giulia Mazzotti
Manon Gaillard
Matthieu Lafaysse
Alain Royer
Florent Domine
Nathalie Gauthier
Nick Rutter
Chris Derksen
Stéphane Bélair
Snow microstructure – characterized by density, grain size, grain shape and arrangement – fundamentally determines snowpack macroscopic properties. Despite this critical role, many land surface models (LSMs) lack explicit representation of snow microstructure. This limitation has become increasingly critical as future spaceborne missions for snow water equivalent measurement demand advanced modelling systems capable of accurately estimating snowpack properties, including microstructure, across diverse climatic and vegetation regions. The Soil Vegetation and Snow (SVS) LSM, used by Environment and Climate Change Canada for operational land surface and hydrological predictions, has been substantially upgraded to address these challenges. SVS version 2.0 (SVS2) incorporates the detailed multilayer Crocus snowpack model, enabling distinct simulations of snowpack evolution in both open terrain and forested areas within each grid cell. Crocus within SVS2 has been upgraded from its original alpine design with three major enhancements to handle Canada's varied snowpack conditions: an advanced albedo parameterization that accounts for spatial variability in light-absorbing particle deposition, new physical parameterizations tailored to Arctic snow characteristics, and a refined canopy model for forest environments. Significant improvements in simulations of near-surface density predictions are evident along a latitudinal transect from southern Quebec to the Canadian Arctic, while challenges remain in simulation of density and specific surface area in basal snow layers. SVS2 achieved substantial gains in snow melt-out timing accuracy, reducing prediction errors by over 50 % compared to the alpine Crocus version and surpassing two established snow reference products (ERA5-Land and ERA5-Crocus). These enhancements position SVS2 as a substantial advancement for future operational snow modeling applications across Canada.
- Article
(8125 KB) - Full-text XML
-
Supplement
(4982 KB) - BibTeX
- EndNote


Snow cover plays a crucial role in Earth's climate system, influencing surface energy balance, water resources, ecosystem dynamics and ground thermal regime across vast regions of the planet (e.g., Armstrong and Brun, 2008; Flanner et al., 2011; Trujillo et al., 2012; Park et al., 2015; Sturm et al., 2017; Immerzeel et al., 2020). The role of snow is explained by unique physical properties such as its high albedo, the fraction of incident solar radiation reflected by the snow, and its low thermal conductivity governing heat transfer through the snowpack (Warren, 1982; Sturm et al., 1997; Armstrong and Brun, 2008). Snow physical properties are governed by the geometrical arrangement of individual components (air, ice, and possibly water and impurities) at the micrometer scale, referred to as snow microstructure (Fierz et al., 2009). For example, snow albedo in the near-infrared range strongly depends on snow specific surface area and the shape of ice particles (Domine et al., 2006; Robledano et al., 2023), while snow thermal conductivity depends on snow density and anisotropy (Yen, 1981; Calonne et al., 2011; Leinss et al., 2020). Snow microstructure also controls liquid water content in the snowpack (Yamaguchi et al., 2010) and its microwave scattering properties (Picard et al., 2022). Snow microstructural properties can strongly vary with depth, and control penetration of solar radiation, conduction of heat, and percolation of meltwater through the snowpack (e.g. Wever et al., 2016; Domine et al., 2016b; Barrere et al., 2017).
Land surface models (LSMs) serve as the terrestrial component of Earth System Models, Numerical Weather Prediction (NWP) systems, and hydrological models, representing complex interactions between the atmosphere and land surface processes (e.g., Overgaard et al., 2006; Fisher and Koven, 2020; Blyth et al., 2021). Within all of these models, snowpack schemes are essential components that simulate accumulation, evolution, and melt of seasonal snow cover (e.g., Boone and Etchevers, 2001; Niu et al., 2011; Vionnet et al., 2012; Arduini et al., 2019). They solve the energy and mass balance equations using approaches of varying complexity (Essery et al., 2013; Lafaysse et al., 2017). The representation of snowpack processes in land surface models presents a fundamental trade-off between computational efficiency and physical realism. One or two layer snowpack schemes represent a simplified snowpack and only simulate its bulk properties. Such simplified models are used operationally in certain climate models (Melton et al., 2020), NWP systems (Douville et al., 1995; Bélair et al., 2003), and hydrological models (Marks et al., 1999; Leonardini et al., 2021; Pomeroy et al., 2022).
Multi-layer snowpack schemes of intermediate complexity have been developed within LSMs to improve the representation of the snowpack internal properties (e.g., Boone and Etchevers, 2001; Niu et al., 2011; Essery et al., 2013; Decharme et al., 2016; Arduini et al., 2019; Lawrence et al., 2019; Pflug et al., 2019). These schemes vertically discretize the snowpack with a prescribed number of layers (up to 12) of fixed maximum thickness and account for some internal processes, such as snow settling, water percolation and refreezing. Cristea et al. (2022) have shown that such multi-layer schemes improve the representation of heat transport and mass storage within the snowpack. By incorporating multi-layer snowpack representations into their respective models, Saha et al. (2017) and Arduini et al. (2019) demonstrated enhanced accuracy in simulating both 2 m air temperature and snow depth across snow-covered areas. These improvements resulted from better representation of surface snow thermal conductivity and albedo, as well as more realistic snowpack thermal regime. Schemes of intermediate complexity do not generally include an explicit representation of snow microstructure and many snow properties are derived from snow density (Boone and Etchevers, 2001; Essery et al., 2013).
Among the 21 snowpack models used in the Earth System Model – Snow Model Intercomparison Project (ESM-Snow MIP, Menard et al., 2021), only three of them (Crocus (Brun et al., 1992; Vionnet et al., 2012), SNOWPACK (Bartelt and Lehning, 2002), and the Snow Metamorphism and Albedo Process model (SMAP Niwano et al., 2012)) explicitly simulate the evolution of snow microstructure, through snow metamorphism. These detailed multi-layer snowpack schemes simulate evolution of vertical layering without pre-defined assumptions about this layering for a given total snow height. These schemes can be used to simulate formation of distinct layers, such as surface hoar (Horton and Jamieson, 2016) or ice layers resulting from freezing rain (Quéno et al., 2018). Despite their ability to simulate advanced snow processes, detailed snowpack schemes are rarely implemented in LSMs nor used over large extents due to concerns about computational costs and associated data storage. For example, SNOWPACK is not implemented in any LSM with the exception of the CRYOWRF coupled snow/atmosphere model (Sharma et al., 2023). On the other hand, Crocus is implemented as a snow option in the SURFace EXternalisée (SURFEX) modelling platform (Vionnet et al., 2012; Masson et al., 2013), but its operational use is restricted to avalanche hazard forecasting over relatively small regions (Lafaysse et al., 2013). Large scale applications of Crocus within SURFEX (Brun et al., 2013; Ramos Buarque et al., 2025) or within the Land Information System (LIS, Navari et al., 2024) have nonetheless shown potential to provide accurate estimation of bulk snowpack properties (depth, density, snow water equivalent, SWE) across large spatial areas.
Development of future spaceborne missions to retrieve SWE (Derksen et al., 2021; Tsang et al., 2021) requires state-of-the-art modelling systems to provide accurate estimation of snowpack properties (including microstructure) across large areas with contrasting climate and vegetation. Snow microstructural properties are required to inform SWE retrieval (King et al., 2018; Rutter et al., 2019; Singh et al., 2024) and data assimilation of brightness temperature and radar backscatter (Larue et al., 2018; Shrestha and Barros, 2025). This critical need is driving improvements in snow representation within LSMs (Navari et al., 2024). In this context, Environment and Climate Change Canada (ECCC), in collaboration with the Canadian Space Agency and Natural Resources Canada, is spearheading the preparation of the Terrestrial Snow Mass Mission (TSMM Derksen et al., 2021). This innovative dual Ku-band spaceborne mission aims to retrieve SWE at a 500 m resolution across the Northern Hemisphere. Currently, ECCC utilizes the Soil Vegetation and Snow version 1.0 (SVS1) (Alavi et al., 2016; Husain et al., 2016; Leonardini et al., 2021) LSM for operational land surface and hydrological predictions across Canada (Gaborit et al., 2017; Durnford et al., 2021). However, SVS1 presents significant limitations: it employs a one-layer snowpack scheme based on the force-restore approach (Leonardini et al., 2021) that does not simulate snow microstructure by design. Moreover, SVS1 does not include key processes affecting snow evolution in forested terrain, such as snow interception by the canopy. These substantial shortcomings underscore the need to enhance SVS1 and significantly expand its capabilities to accurately simulate snow microstructure.
This article presents version 2.0 of SVS (SVS2), focusing specifically on snowpack processes. Built upon the existing code architecture of SVS1, SVS2 introduces major updates across several key components. The snowpack scheme now relies on the externalized version of the detailed Crocus snowpack model (Brun et al., 1992; Vionnet et al., 2012; Lafaysse et al., 2017), incorporating significant developments such as a revised snow albedo scheme (Gaillard et al., 2025), and novel physical parameterizations for Arctic snowpack properties (Woolley et al., 2024) synthesizing earlier works (Barrere et al., 2017; Gouttevin et al., 2018; Royer et al., 2021b). A notable enhancement compared to SVS1 is the new forest canopy module, which includes snow interception and is integrated with Crocus to improve snowpack simulations in forested terrain. Additionally, SVS2 features a new soil module that solves heat diffusion, accounting for soil freezing and thawing processes based on Boone et al. (2000). While SVS2 has been previously applied in several studies (Vionnet et al., 2022; Leroux et al., 2023; Woolley et al., 2024, 2025; Gaillard et al., 2025; Meloche et al., 2024), this article provides a comprehensive description of SVS2 and demonstrates its capability to simulate snowpack properties, including microstructure, across extensive geographical regions. Section 2 gives a general description of SVS2, its snow component and its canopy module. Additional details on non-snow components can be found in the Supplement. Section 3 then details simulation configurations, evaluation datasets, and methodologies. Simulations results are presented and discussed in Sect. 4. Finally, Sect. 5 summarizes the findings and provides concluding remarks.
2.1 Land surface tiling
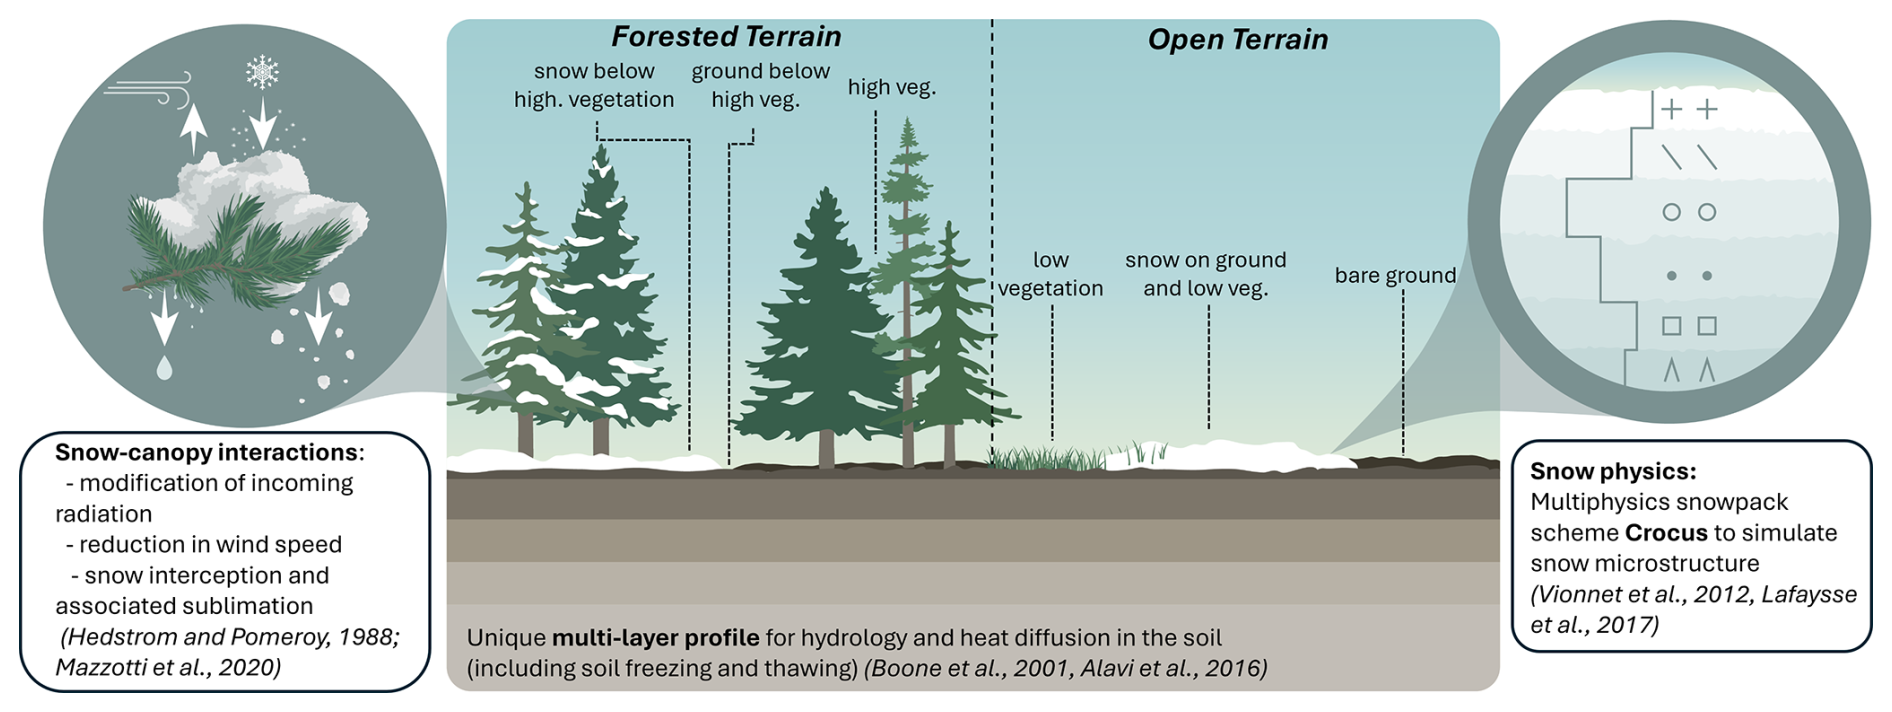
SVS2 employs a tiling approach to capture land surface heterogeneity within individual grid cells. The model represents six distinct subgrid land surface fractions (“tiles”): (i) exposed snow-free bare ground, (ii) snow-free low vegetation, (iii) snowpack covering bare ground and low vegetation, (iv) high vegetation with intercepted snow, (v) snow-free ground beneath high vegetation canopy, and (vi) snowpack beneath high vegetation canopy. High vegetation in SVS2 encompasses forests of varying density with trees exceeding 3 m in height. Depending on environmental conditions, certain tiles may become inactive within a grid cell (e.g., during snow-free periods or in areas lacking high vegetation). SVS2 computes the surface energy budget and associated surface temperature evolution for each active land surface tile. Figure 1 illustrates the land surface tiling structure in SVS2.
All land surface tiles interact directly with the atmosphere and are energetically and hydrologically coupled with one single atmospheric layer above (Fig. 1). The energy and mass balances of tiles beneath high vegetation (tiles v and vi) experience additional modifications from canopy processes that alter incoming radiation, wind speed, and precipitation through interception mechanisms, as described in Sect. 2.3. Following the approach used in the EC-Land model (Boussetta et al., 2021), SVS2 utilizes a single soil column beneath all land surface tiles. This soil column employs a multi-layer scheme to resolve thermal and hydrological processes, including freeze-thaw dynamics (Boone et al., 2000; Decharme et al., 2011; Alavi et al., 2016). Direct energetic and hydrological coupling exists between the soil column and all surface tiles except high vegetation. High vegetation instead exerts indirect influence through two pathways: (i) modifications to the surface energy budget of underlying tiles (tiles v and vi) and (ii) transpiration that alters soil water content in soil layers.
Snow-covered land surface tiles and the high vegetation tile are described in Sects. 2.2 and 2.3. The rest of SVS2 is described in the Supplement. Section S1.2 in the Supplement details the surface energy budget for exposed and shaded snow-free bare ground and for snow-free low vegetation. Computation of soil thermal regime and hydrology is detailed in Sect. S1.3. Finally, model numerical implementations are described in Sect. S2 and Fig. S2 gives an overview of the order of operations within one model time step.
2.2 Snowpack representation
2.2.1 Detailed snowpack scheme Crocus
In SVS2, snowpack evolution over bare ground, low vegetation, and below high vegetation is simulated with the detailed snowpack scheme Crocus (Brun et al., 1992; Vionnet et al., 2012; Lafaysse et al., 2017). When a SVS2 grid cell contains both high vegetation and open terrain, the Crocus snow model runs twice in parallel for that cell: once in open terrain with unperturbed meteorological forcing and once in forested terrain with energy and mass flux modified by the presence of high vegetation as detailed in Sect. 2.3. The implementation of Crocus within SVS2 relies on the standalone version of Crocus that has been recently developed to facilitate the use of Crocus within existing LSMs. Mazzotti et al. (2024) have used this version of Crocus to develop an hyper-resolution forest snow model.
Crocus is a multilayer snowpack scheme that simulates seasonal evolution of physical properties of the snowpack and its vertical layering. Crocus simulates the main internal snowpack processes, including heat diffusion, compaction, liquid water transport, and snow metamorphism. For each snow layer, Crocus simulates evolution of its thickness, density, liquid water content, temperature, age, and snow microstructure, represented by the snow optical diameter and snow grain sphericity. In addition, Crocus uses a historical variable to identify past presence of liquid water or faceted crystals in the layer. Snow type can be diagnosed from the snow microstructure and historical variables (Brun et al., 1992). Crocus within SVS2 includes the multi-physics ensemble modeling framework ESCROC (Ensemble System Crocus, Lafaysse et al., 2017) that can provide estimates of model uncertainty associated with parameterizations of surface and internal snow process.
Snow optical diameter is inversely proportional to snow specific surface area (SSA) that governs the snowpack optical and microwave properties (e.g. Warren, 1982; Picard et al., 2022). Sphericity is a semi-empirical variable that describes the ratio of angular versus rounded shape in a given snow layer (Brun et al., 1992; Carmagnola et al., 2014). Evolution of optical diameter and of sphericity in Crocus is computed using metamorphism laws as described in Brun et al. (1992), Carmagnola et al. (2014), and Baron (2023). For dry snow in a given layer, the temporal evolution of optical diameter and sphericity are a function of the vertical temperature gradient, whereas, for wet snow, the increase in optical diameter and sphericity with time depends on liquid water content.
Crocus uses a dynamic discretization to represent the evolution of snowpack layering. New snow layers can be created by snowfall events until a user-defined maximum number of layers is reached. Aggregation routines are then used to merge layers with similar physical properties, maintaining sufficiency thin layers close to the snow surface and the bottom of the snowpack to compute heat exchanges with the atmosphere and soil, respectively. A maximum number of 50 snow layers is typically used in the context of operational avalanche hazard forecasting (Vionnet et al., 2012). In the current version of SVS2, the maximum number was fixed at 20 to test a viable configuration for an eventual operational implementation in the context of the Terrestrial Snow Mass Mission (Derksen et al., 2021); such a configuration needs to balance accuracy and computational efficiency. Similarly, Veyssière et al. (2018) used a maximum number of 20 layers when coupling Crocus with a radiative transfer model to simulate microwave emission modeling.
Additional modifications have been made in Crocus within SVS2 to improve simulation of snowpack physical properties across large spatial extents, in particular across the Canadian territory. They include: (i) a revised snow albedo parameterization that takes into account the local climatology of Light-Absorbing Particles (LAP) deposition on snow (Sect. 2.2.2, Gaillard et al., 2025), (ii) additional parameterizations of snow physical processes to simulate properties of Arctic snowpacks (Sect. 2.2.3, Woolley et al. (2024)) and (iii) a canopy module to simulate snow properties in forested environments (Sect. 2.3). Throughout this paper, “SVS2/Crocus” refers specifically to the Crocus version within SVS2, “SURFEX/Crocus” refers to the version within SURFEX, and “Crocus” alone refers to both versions collectively.
2.2.2 Refined snow albedo parametrization
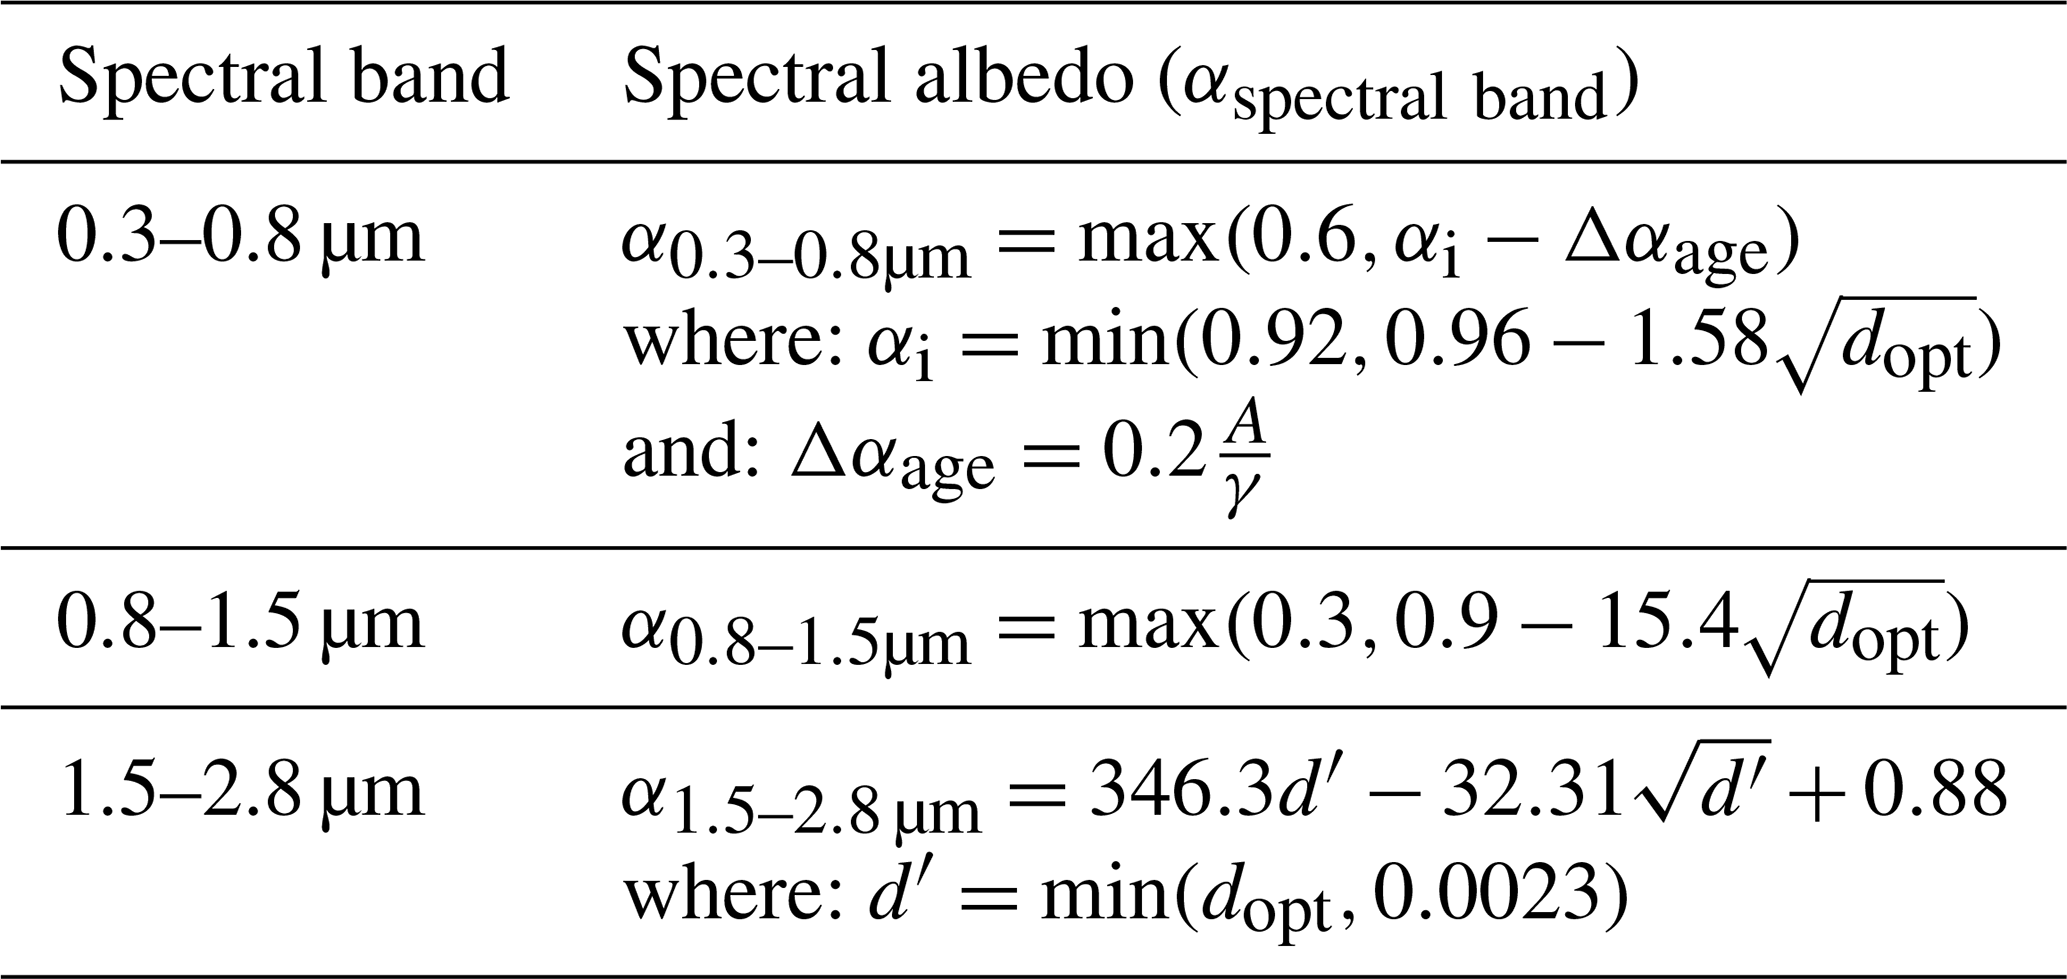
The default snow albedo parameterization in Crocus (Table 1) simulates snow albedo evolution in different large spectral bands: one in the visible (0.3–0.8 µm), and two in the near and shortwave infrared ranges (0.8–1.5 and 1.5–2.8 µm) (Brun et al., 1992; Vionnet et al., 2012). In infrared bands, the spectral albedo depends only on the optical diameter of snow. In the visible band, snow albedo depends on the optical diameter and the amount of LAPs (black carbon, mineral dust) present on the snow surface, which is parameterized by the age of snow and a snow darkening coefficient, γ. This coefficient controls the impact of snow age on the temporal evolution of albedo in the visible band. The default value of γ has been set to 60 d during early developments of Crocus at the Col de Porte experimental site in the French Alps (Brun et al., 1992). Applications of the model to other climates such as Antarctica or the Canadian Arctic, where LAP deposition is significantly lower than in the French Alps, have required calibration of γ (Brun et al., 2011; Woolley et al., 2024).
Table 1Equations representing the snow albedo for the three spectral bands in the default albedo parameterization of Crocus used in SVS2. The parameters are as follows: dopt (m) is the optical diameter of the snow, ρ is the snow density, A (days) is the age of the snow, and γ (days) is the snow darkening coefficient. Adapted from Table 4 in Vionnet et al. (2012). The pressure term present when computing Δαage in SURFEX/Crocus (Vionnet et al., 2012) is not used in SVS2/Crocus as explained in Gaillard et al. (2025).
A local calibration of γ is not possible when applying the model over large domains where deposition of LAP on snow can vary significantly. To overcome this limitation, Gaillard et al. (2025) proposed a new approach for SVS2/Crocus where γ varies in space based on a global climatology of LAP deposition over snow that they developed. Optimized values of γ for multi-year snow albedo simulations with SVS2/Crocus were generated at 10 reference experimental sites spanning a large variety of climates across the world. A regression was then established between these optimal values and the climatological deposition of LAP on snow at the location of the experimental sites. This regression was finally combined with the global climatology to obtain a LAP-informed and spatially variable darkening coefficient for the Crocus albedo parameterization. This methodology of intermediate complexity, implemented in SVS2, considers the spatial variability of LAP deposition in the default snow albedo parametrization without additional computational cost. More details can be found in Gaillard et al. (2025). This updated parameterization improved snow albedo simulations by 10 % at the 10 experimental sites with the largest improvements found in the Arctic (more than 25 %) (Gaillard et al., 2025). The current study represents the first assessment of how this new albedo parameterization affects spatially distributed snowpack simulations (Sect. 4).
Another option for snow albedo calculation, only available in SURFEX/Crocus, relies on the Two-stream Analytical Radiative TransfEr in Snow (TARTES) radiative transfer scheme (Picard and Libois, 2024) and accounts explicitly for the impact of LAP as detailed in Tuzet et al. (2017). This second option is not yet activated in SVS2/Crocus due to a significant additional computational cost (by a factor around 20 for the snow model) and the need for additional atmospheric forcings (LAP deposition fluxes).
2.2.3 Simulation of Arctic snow properties
Crocus was initially developed for avalanche hazard forecasting in alpine terrain (Brun et al., 1992; Durand et al., 1993). Several studies showed that the default version of Crocus does not simulate snowpack properties in Arctic and Subarctic environments well (Domine et al., 2016a; Barrere et al., 2017; Domine et al., 2019; Royer et al., 2021b; Lackner et al., 2022; Woolley et al., 2024), where the Arctic is defined as the area of the Earth with tundra vegetation with the treeline defining the southern limit (Raynolds et al., 2019). In this region, the model fails at simulating the typical vertical profile of snow density (dense wind-slab layer overlaying a layer of lower density made of depth hoar), which negatively impacts simulation of the snow and soil thermal regime in these regions (Barrere et al., 2017; Domine et al., 2019). Using a multi-physics modelling approach, Woolley et al. (2024) have shown that all the physical options available in the default ESCROC ensemble (Lafaysse et al., 2017) are not sufficient to capture the vertical profile of snow density measured at the experimental site of Trail Valley Creek (Northwest Territories, Canada). To overcome this limitation, Woolley et al. (2024) implemented a new set of options in SVS2 to improve the simulation of Arctic snowpack properties based on previous studies (Domine et al., 2016a; Barrere et al., 2017; Gouttevin et al., 2018; Royer et al., 2021b; Lackner et al., 2022). These modifications are referred to as the Arctic version of SVS2/Crocus and described in detail in Woolley et al. (2024). A brief overview is given in the next paragraphs.
The first set of modifications made by Woolley et al. (2024) aims at increasing the compaction of surface snow due to high wind speeds. New parameterizations of snowfall density have been added following Royer et al. (2021b) and Lackner et al. (2022). These parameterizations modify the default parameterization of Vionnet et al. (2012) by increasing the effect of wind speed on falling snow density. Woolley et al. (2024) also adapted the snowdrift scheme of Crocus that simulates wind-packing, the increase in near-surface snow density during drifting and blowing snow events with or without concurrent snowfall (Brun et al., 1997; Vionnet et al., 2012, 2013). This parameterization represents the effect of surface snow fragmentation during wind-induced snow transport and the associated increase in surface snow density (Comola et al., 2017; Sommer et al., 2018). This parameterization has been initially tested in alpine terrain (Vionnet et al., 2013) but evaluations in the Arctic revealed a systematic underestimation of surface density simulated with this approach (Barrere et al., 2017; Royer et al., 2021b; Lackner et al., 2022). Changes to the snowdrift scheme in SVS2/Crocus (Woolley et al., 2024) are based on Royer et al. (2021b) and increase the maximum density of snow impacted by wind and wind-packing rate. When activated, these modifications that increase the compaction of surface snow due to high wind speeds affect simulations over the whole domain (even in regions located outside the Arctic).
The second set of modifications proposed by Woolley et al. (2024) concerns the impact of Arctic vegetation (sedges, shrubs) at the base of the snowpack. In the Arctic version of SVS2/Crocus, snowdrift and blowing snow sublimation schemes are not activated when the total snow height is below the height of Arctic vegetation to simulate that shrubs and other basal vegetation trap wind-blown snow, which limits snow erosion and compaction by wind (Liston et al., 2002; Domine et al., 2016a). The rate of snow compaction in SVS2/Crocus is also reduced below the height of Arctic vegetation (Domine et al., 2016a; Lackner et al., 2022). These two modifications lead to simulation of low density basal snow layers in the presence of Arctic vegetation (Gouttevin et al., 2018; Royer et al., 2021b; Woolley et al., 2024). However, vertical water vapor transport through the snowpack, which contributes to the formation of low-density basal layers in the Arctic (Domine et al., 2019), is not currently included in Crocus. Additional effects of shrubs on winter snow albedo, shortwave vertical irradiance in snow, and the effects of shrub branches on snow metamorphism (Belke-Brea et al., 2020; Domine et al., 2025) are also not simulated by Crocus.
When implementing the effect of Arctic vegetation height in distributed snowpack simulations, Royer et al. (2021b) developed a global map of Arctic vegetation height at 1 km resolution based on the ECOCLIMAP vegetation database (Masson et al., 2003) used in the SURFEX platform (Masson et al., 2013). The Arctic vegetation database of Royer et al. (2021b) includes alpine-tundra regions located for example in the Rocky Mountains in Canada and the United States. Using this vegetation database, effects of basal vegetation are activated in these alpine-tundra regions. To restrict these effects to the Arctic, a new database of Arctic vegetation height has been developed in SVS2 based on the Circumpolar Arctic Vegetation Map (CAVM Raynolds et al., 2019) at 1 km resolution. This new database is described in Sect. S1.1.3. The CAVM covers the Arctic, above the tree line. Elsewhere, the height of Arctic vegetation is set to zero so that modifications of Woolley et al. (2024) associated with presence of basal vegetation are only active above the Arctic treeline.
2.3 Canopy module
SURFEX/Crocus is coupled to the multiple energy budget scheme (MEB, Boone et al., 2017). MEB-Crocus has been used to simulate snow in forested environments (Nousu et al., 2024). However, MEB is strongly tied to the internal SURFEX code so it is not available in the standalone version of Crocus used in SVS2. For this reason and to address limitations of SVS1 in snow simulations in forests (Leonardini et al., 2021), a new canopy scheme was developed for SVS2. The canopy scheme relies on well-established parameterizations (Hedstrom and Pomeroy, 1998; Koivusalo and Kokkonen, 2002; Gouttevin et al., 2015; Mazzotti et al., 2024; Essery et al., 2025) to represent evolution of the canopy energy and mass balance and its sub-canopy influence on shaded ground and/or snow.
2.3.1 Canopy characteristics
High vegetation in SVS2 refers to forest of varying density covered by tree taller than 3 m. This vegetation is described by three canopy structure parameters: (i) canopy height (htop), (ii) canopy closure (Vdens) and (iii) average vegetation area index (VAI) of trees composing the high vegetation. Canopy closure, Vdens, varies between a minimum value of 0.2 (sparse canopy with a canopy coverage of 20 %) and 1 (100 % closed canopy, no gaps). VAI includes leaves, stems, and branches, and is expressed as one-sided area of woody components and leaves per unit ground of closed forest. The product VdensVAI converts VAI per unit ground of closed forest to an effective VAI per unit ground of the high vegetation tile that accounts for canopy closure. The skyview factor of the canopy (SVF) is derived from Vdens and VAI (Essery et al., 2008):
where Ω is a clumping parameter that accounts for leaves being vertically stacked in a canopy (Essery et al., 2008; Musselman et al., 2015). In the current version of SVS2, Ω is taken equal to 0.5 as proposed by Bartlett et al. (2006) for needle-leaf trees.
When applied in point-scale mode, htop and Vdens are provided by the model user and VAI depends on the vegetation type selected by the user (Table S2). For distributed simulations within GEM-Hydro (Gaborit et al., 2017; Vionnet et al., 2020), htop is obtained from the 1 km global dataset of Simard et al. (2011) whereas Vdens is derived from the Global Tree Cover dataset (Hansen et al., 2013) at 30 m grid spacing following the methods described in Sect. S1.1.2. Finally, VAI depends on vegetation types present in the land cover database used as an input for GEM Hydro (Table S2). αvh and ϵvh, the albedo and emissivity of snow-free high vegetation, respectively, also depend on vegetation types as detailed in Table S2.
2.3.2 Canopy energy balance
In SVS2, a single canopy layer that includes leaves, woody parts, and intercepted snow is considered, similar to the one-layer module available in the FSM2 model (Mazzotti et al., 2020; Essery et al., 2025). FSM2 is a reference snowpack model that contains multiple options for representing physical processes in forest canopies. The canopy temperature (Tv, K) in the one-layer module can be determined via:
where Cv is heat capacity of the canopy layer () (Eq. 3), Rnv is net radiation budget of the canopy (W m−2), Hv and LEv are sensible and latent heat fluxes from the canopy toward the upper atmosphere (W m−2), respectively, Lf is the latent heat of fusion (J kg−1), and Φv is the phase change energy of intercepted water on the canopy () (Eq. 15). Details about the numerical solving of Eq. (2) are given in Sect. 2.3.
The heat capacity of the canopy, Cv, is written as:
with Snv the mass of intercepted snow (kg m−2), Cpi is specific heat capacity of ice () and Cvb = 3.6 × 10⁶ VAI is the canopy heat capacity () (Mazzotti et al., 2020; Essery et al., 2025).
Net radiation to the canopy is the sum of net shortwave radiation (SWnet, W m−2) and net longwave radiation (LWnet, W m−2). From Gouttevin et al. (2015), net shortwave radiation absorbed by the canopy includes multiple reflections between the canopy and the surface below the canopy:
with SWin the incoming solar radiation above the canopy (W m−2), αc the canopy albedo, αs the albedo of the surface below the canopy, and σf the absorption factor (). If both bare ground and snow coexist below the canopy, αs is a weighted average of the snow albedo and the albedo of the bare ground using their fraction areas. The canopy albedo accounts for the presence of intercepted snow:
where αnv is the albedo of intercepted snow (set to 0.3 as in Gouttevin et al., 2015) and αvh is the albedo of snow-free high vegetation as defined in Sect. 2.3.1. pnv is the fraction of canopy covered by intercepted snow (Essery et al., 2003):
where is the maximum SWE of intercepted snow by canopy over the high vegetation tile (kg m−2) as defined in Sect. 2.3.4.
Since emissivities of snow, vegetation and soil are very close to unity, the net longwave radiation budget of the canopy can be simplified as in Gouttevin et al. (2015) and Essery et al. (2025). It is written:
where LWin is incoming longwave radiation above the canopy (W m−2), σ the Stefan–Boltzman constant, and LWsurf is longwave radiation emitted by the surface below the canopy (W m−2). If both bare ground and snow coexist below the canopy, LWsurf is a weighted average of the longwave radiation emitted by snow and longwave radiation emitted by the bare ground using their fraction areas.
The latent and sensible heat fluxes (LEv and Hv) are computed between the reference level of meteorological inputs (above the canopy) and the canopy surface as in Gouttevin et al. (2015). As a consequence, the latent heat flux between the canopy and upper atmosphere is determined as follows:
where hv is the Halstead coefficient that partitions total snow-free plant evapotranspiration between evaporation of intercepted water and transpiration via stomata (e.g., Boone et al., 2017) (Eq. 9), ρa is the air density (kg m−3), Rav is aerodynamic resistance between the canopy and atmosphere above the canopy (s m−1) as derived by the surface turbulent scheme of the GEM model (Beljaars and Holtslag, 1991; Delage and Girard, 1992), qsat v is specific humidity at saturation of the canopy layer (kg kg−1), qair is specific humidity of the atmosphere above the canopy (kg kg−1) and Lv and Ls are the latent heat of vaporization and sublimation (J kg−1), respectively.
The Halstead coefficient, hv, is computed as:
where Rs is the stomatal resistance (s m−1) obtained from the SVS photosynthesis module (Husain et al., 2016) and δ is the fraction of intercepted liquid water (Deardorff, 1978) computed as:
where Wwv and are intercepted liquid water and maximum capacity of intercepted liquid water in the canopy over the high vegetation tile (kg m−2), respectively (Sect. 2.3.4).
Total water flux from the canopy to the atmosphere (Ev, , Eq. 11) can be decomposed into the transpiration rate of vegetation (Etr, , Eq. 12), the evaporation rate of intercepted liquid water (Er, , Eq. 13), and sublimation of intercepted snow (Ers, , Eq. 14).
where L is the effective latent heat (J kg−1) as in Boone et al. (2017) (). Etr, Er and Ers are written as:
The term of phase change energy due to melt of intercepted snow or refreezing of intercepted water in canopy is determined following Boone et al. (2017):
where is a constant equal to 5.56 × 10⁻⁶ (Boone et al., 2017) and Tm is the freezing temperature of liquid water (K).
Sensible heat flux between the canopy and atmosphere is determined as followed:
where cp is specific heat of dry air ().
2.3.3 Wind profile and aerodynamic resistances
The canopy modifies the wind profile close to the surface and affects turbulent exchanges between the canopy and atmosphere, and the surface below the canopy and atmosphere. The wind profile is assumed to be logarithmic above the canopy (including stability correction), exponential within the canopy (no stability correction), and again logarithmic below the canopy (no stability correction) as often done in land surface and snow models (e.g., Koivusalo and Kokkonen, 2002; Mahat et al., 2013; Mazzotti et al., 2024; Essery et al., 2025):
where htop is canopy height (m), hbot is canopy base height (set constant at 2 m), Ua is wind speed (m s−1) at the forcing height zU (m) (above the ground, zU>htop), Utop and Ubot are wind speed at the top and bottom of the canopy (m s−1), z0mv is momentum roughness length of the canopy (m) and d is the zero plane displacement height (m). z0mv and d depend on the canopy height following: z0mv = 0.1 htop and d = 0.67 htop. The factor wcan characterizes attenuation of wind speed in the canopy and depends on canopy structure with wcan=βVdensVAI, with β = 0.9 as in Liston and Elder (2006). The Monin–Obukhov length, LMO, and the stability function for momentum, Ψm, are computed by the surface turbulence scheme of the GEM atmospheric model (Beljaars and Holtslag, 1991; Delage and Girard, 1992).
Aerodynamic resistance between the canopy and atmosphere (reference level above the canopy), Rav and resistance between the surface below the canopy and the atmosphere (reference level above the canopy), Rbv, are computed using the diffusivity theory (Koivusalo and Kokkonen, 2002; Mahat et al., 2013; Boone et al., 2017; Essery et al., 2025). In the canopy, eddy diffusivity, Kc, follows the same exponential form as the wind profile:
where K(htop) is the eddy diffusivity at top of the canopy (m2 s−1) and is defined as:
where κ is the von Karman constant (–) and is friction velocity at the top of the canopy (m s−1) (including stability correction):
Rav is obtained by integrating the inverse of the eddy diffusion coefficient over the range from d+z0mv to zT, the height of atmospheric forcing for air temperature and humidity (Koivusalo and Kokkonen, 2002; Essery et al., 2025):
Aerodynamic resistance between the surface below the canopy and the atmosphere, Rbv, is calculated as in Koivusalo and Kokkonen (2002) and Essery et al. (2025):
where Rsurf combines resistance of the lower part of the canopy (hbot to d+z0mv) and resistance between the surface and the canopy bottom (z0 to hbot):
where z0 and z0h are roughness lengths for momentum and heat for the surface below the vegetation (shaded ground or snow).
2.3.4 Mass balance of snow and liquid water in the canopy
Liquid water (Wwv, kg m−2) and snow (Snv, kg m−2) can exist on the canopy. Both quantities are calculated with respect to the total high vegetation tile area. The mass balance of intercepted liquid water follows:
where PR is the rate of liquid precipitation falling above the canopy () and SVF is the sky view factor (Eq. 1), quantifying how much of the precipitation falls directly onto the ground. Φv is the source/sink term associated with melt of intercepted snow or refreezing of intercepted water (Eq. 15, ). A positive value of Φv corresponds to freezing of intercepted water. Finally, Dr is the amount of liquid water exceeding the maximum capacity of intercepted liquid water in the canopy, , that drips below the canopy (). Numerically, Dr is computed as:
where as in Dickinson (1984) and Husain et al. (2016),
The rate of liquid precipitation falling on the surface below the canopy () includes dripping liquid water and rain falling through the canopy:
The mass balance of intercepted snow in the canopy follows:
where Isv is the interception rate of snowfall by the canopy (Eq. 28, ), Ers the sublimation rate of intercepted snow (Eq. 14, ), Φv is the source/sink term associated with the melt of intercepted snow or refreezing of intercepted water (Eq. 15, ) and Usv is the snow unloading rate from the canopy (). Usv follows the simple approach of Mazzotti et al. (2020) with , with Δt the model time step (s) and τ a relaxation time constant (s). This time constant varies with the canopy temperature such that when the canopy temperature is below freezing, this time constant is taken equal to 240 h, otherwise it equals to 48 h.
The amount of snowfall intercepted by the canopy, Isv, is taken from Hedstrom and Pomeroy (1998):
where SR is the snowfall rate () and is the maximum snow holding capacity of the canopy. varies with the air temperature (Ta, °C) as in Andreadis et al. (2009):
where mscap is a coefficient fixed to 5 kg m−2 (Andreadis et al., 2009). The dependency on air temperature of allows the model to capture the increase in snow loading resulting from increased adhesion and cohesion above −3 °C as recommended by Lundquist et al. (2021).
The rate of solid precipitation falling on the surface below the canopy () includes the unloading of snow and snowfall not intercepted by the canopy:
2.3.5 Impact on sub-canopy energy and mass fluxes
The presence of canopy in SVS2 modifies the energy and mass fluxes received by the land surface tiles below the canopy (shaded bare ground and/or snow). For radiative fluxes, longwave and shortwave radiation received at the surface below the canopy can be expressed as:
where LWin is longwave radiation above the canopy (W m−2), SWdir and SWdif are direct and diffuse shortwave radiation above the canopy (W m−2), Tv the canopy temperature (K) of the previous time step due to the sequential approach used in SVS2, τdif is the transmissivity of diffuse radiation through the canopy, which is taken equal to the skyview factor, SVF (Eq. 1), as in Musselman et al. (2015), and τdir is the direct transmissivity of shortwave radiation defined as in Pomeroy and Dion (1996):
where kext is an extinction coefficient taken equal to 0.5 for randomly oriented canopy elements and θ is the solar angle (rad). If separation between direct and diffuse shortwave is not available in the meteorological forcing, it is recomputed in the model following Erbs et al. (1982) and Jonas et al. (2020).
Turbulent fluxes of sensible and latent heat above the surface below high vegetation are computed using air temperature and specific humidity taken at the reference forcing level above the canopy as in Koivusalo and Kokkonen (2002) and Gouttevin et al. (2015). The canopy effect on turbulent heat fluxes is accounted for in the computation of Rbv, the aerodynamic resistance between the surface below the canopy and the reference forcing level above the canopy (Eq. 22). For the snowpack below high vegetation, the wind speed below the canopy, Ubot (Eq. 17), is used in SVS2/Crocus to compute properties of falling snow, wind-induced compaction and mass loss due to blowing snow sublimation. The canopy temperature, Tv, is not used when computing the turbulent fluxes below high vegetation and only affects the incoming longwave radiation below high vegetation (Eq. 31).
Precipitation falling on the surface below the canopy is computed by the canopy mass balance module (Eqs. 26 and 30 in Sect. 2.3.4). Snowfall through the canopy and the snow unloading rate are provided as two distinct input mass fluxes to Crocus. The properties (density, microstructure) of new snow from snowfall are derived from the Crocus parameterization (Vionnet et al., 2012; Lafaysse et al., 2017) whereas the properties of unloaded snow differs from of the properties of snowfall as recommended by Bouchard et al. (2024). SVS2 assumes a fixed density of 200 kg m−3, an optical diameter of 0.2 mm and a sphericity of 0.95 for unloaded snow.
2.3.6 Alternatives to the canopy modules
The canopy energy balance and mass balance modules described in Sects. 2.3.2 and 2.3.4 are activated when meteorological forcings are provided at a given height above the canopy. This option is referred to as the ABV option (“above”) in SVS2 and is used when the model is driven by atmospheric forcing taken from meteorological models, reanalysis, or towers located above the canopy. Two other options have been added in SVS2 to allow the model to be driven by atmospheric forcing collected at meteorological stations that are not always located above the canopy. The first option is the “forest” option (referred to as FOR) when the model is driven by meteorological forcing measured below the canopy. In this case, mass and energy processes associated with the canopy are not simulated as all the atmospheric forcings are valid below the canopy and already account for the effect of the canopy. The second option is the “open to forest” option (referred to as O2F) when the model is driven by meteorological forcing transferred from adjacent open terrain. An example would be when the meteorological forcing is collected at 2 m above the ground in an adjacent clearing. This method is often used in snowpack models (Marsh et al., 2020; Mazzotti et al., 2024; Strasser et al., 2024). In SVS2, this approach is only used for model evaluation at point-scale with meteorological forcing data collected in open terrain (e.g. Rutter et al., 2009; Bonner et al., 2022b).
In the O2F option, the canopy energy balance module is not activated and the model assumes that air temperature and relative humidity close to the surface in the open are equal to those below the canopy. The model also assumes that the canopy temperature, Tv is equal to the air temperature in the open (Rutter et al., 2023). Under these assumptions, shortwave and longwave radiation below the canopy are derived using Eqs. (32) and (31), respectively. Wind speed close to the surface in open terrain is assumed equal to wind speed above the canopy and is transferred to the forcing height below the canopy using the wind profile described in Eq. (17). In the O2F option, stability effects above the canopy cannot be computed and the model assumes a logarithmic wind profile above the canopy. Finally, modified meteorological forcing below the canopy are used to drive the energy and mass balance of shaded bare ground and snowpack below high vegetation.
In the O2F option, the canopy mass balance module is activated and simulates snow interception and associated unloading and sublimation as described in Sect. 2.3.4. However, since the energy balance of the canopy is not calculated, the model cannot derive sublimation of intercepted snow from Eq. (14). As a consequence, sublimation of intercepted snow is estimated following Pomeroy et al. (1998) and Essery et al. (2003) as described in Sect. S1.4 of the Supplement. In the O2F option, the source/sink term associated with melt of intercepted snow or refreezing of intercepted water (Φv in Eqs. 24 and 27) is not considered and the model relies on simple assumptions similar to Mazzotti et al. (2024). When air temperature drops below freezing, the model treats any liquid water on the canopy as frozen, incorporating it into intercepted snow. Conversely, when air temperature rises above freezing, unloaded snow is treated as liquid water. This meltwater first joins the existing reservoir of intercepted liquid water on the canopy, and any excess beyond the canopy's maximum water-holding capacity will eventually drip to the ground.
3.1 Overview
This section describes two simulation strategies used to evaluate SVS2/Crocus performance. First, point-scale simulations were performed to investigate the canopy module and its effects on simulated snowpack properties. These simulations also included comparisons with SVS1 to demonstrate model improvements. Second, spatially distributed simulations covering a domain spanning from southern Quebec to the Canadian Arctic were conducted to evaluate both the revised albedo parameterization in SVS2/Crocus and the Arctic snow parameterizations. Prior to this work, these modifications had been tested only at the point-scale. The distributed simulations provided an opportunity to assess these parameterizations across large spatial scales and diverse snowpack types within the domain. These simulations enabled us to (i) quantify how the albedo parameterization of Gaillard et al. (2025) affects snow melt dynamics throughout the domain and (ii) evaluate the spatial applicability of both the default and Arctic configurations of SVS2/Crocus for estimating vertical profiles of snow properties (SSA and density). Results from the distributed simulations were also compared against reference snow products used as benchmarks.
3.2 Point-scale simulations
3.2.1 Snow Crested Butte
An evaluation of SVS2 in point-scale mode was conducted at Snow Crested Butte (Colorado, USA) between October 2018 and June 2021. Data used for forcing and evaluating the model were quality controlled and are fully presented in Bonner et al. (2022b). Snow Crested Butte has two adjacent meteorological stations, one in a forest and one in a clearing, about 300 m apart. Data from the clearing (collected at ∼ 2 m above the ground) were used to drive the model in both the open and in the forest using the O2F approach. Following Bonner et al. (2022b), a dew point temperature threshold of 0 °C was used to separate total precipitation into liquid or solid precipitation. Snow pits (vertical profiles of snow density, temperature, and grain type) and snow transects (bulk SWE and snow height) were conducted at both locations and were used to evaluate the simulations. Canopy closure was taken equal to 60 % based on the Global Tree Cover dataset (Hansen et al., 2013). For this test case, SVS2/Crocus relied on the default configuration of the model (Lafaysse et al., 2017). The updated snow albedo parameterization of Gaillard et al. (2025) (Sect. 2.2.2) and changes of Woolley et al. (2024) specific to arctic environments (Sect. 2.2.3) were not activated since no impact was expected in this environment. Simulations were also carried out with SVS1 using the configuration detailed in Leonardini et al. (2021).
3.2.2 Additional tests
Additional tests in point-scale mode focused on specific physical processes affecting the snow cover. SVS2 was tested at the Marmot Creek Research Basin, Kananaskis Country (Alberta, Canada) (Fang et al., 2019) to evaluate the impact of the configuration of the canopy module on (i) the quality of the simulations of bulk snowpack properties (SWE and snow height) in a forest stand compared to simulations in an adjacent clearing, and (ii) the estimation of the radiative fluxes below high vegetation. This evaluation is presented in Sect. S3.1. A direct evaluation of snow interception and unloading is also presented in Sect. S3.2.
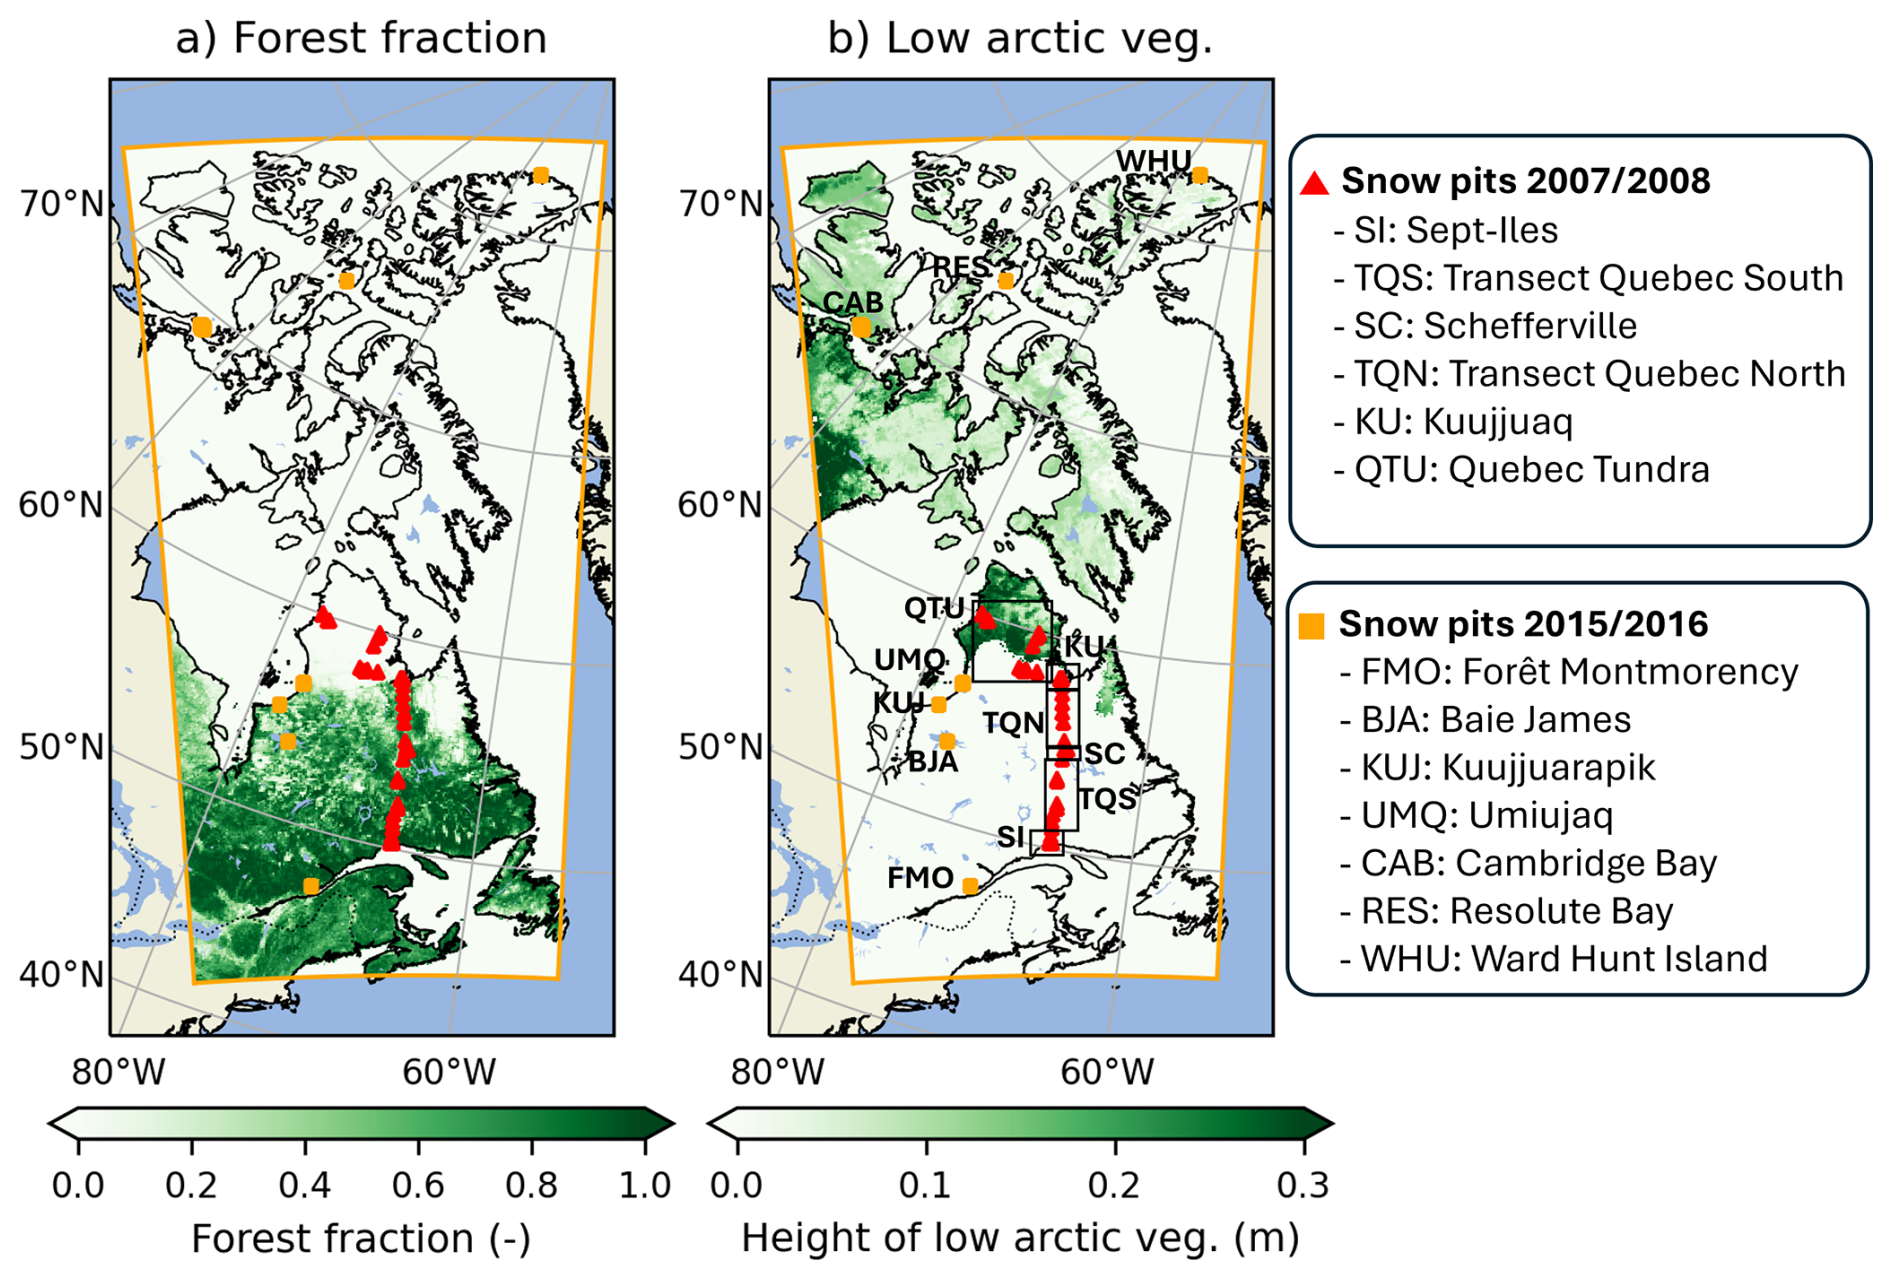
Figure 2Maps of the study domain showing (a) the forest fraction derived from the North American Land Change Monitoring System (NALCMS) dataset and (b) the height of Arctic vegetation. The limits of the simulation domain are shown as thick orange lines on both maps. The locations of the sites where snow pit measurements were collected in 2007/2008 and 2015/2016 are also indicated on both figures.
3.3 Distributed simulations across a latitudinal transect in Eastern Canada
3.3.1 Study domain and period
The ability of SVS2 to simulate large-scale snowpack properties and dynamics was evaluated over a domain that extends from southern Quebec to the North of the Canadian Arctic (43 to 84° N, Fig. 2). This domain corresponds roughly to the latitudinal transect studied by Royer et al. (2021a) when proposing a new classification for northern snowpacks. It includes transitions between several ecozones from boreal forest to subarctic and arctic ecosystems (Fig. 2), and covers three main types of snowpack (Royer et al., 2021a): boreal forest snow (between 47 and 58° N), tundra snow (between 58 and 74° N) and polar desert snow (above 74° N). Two winters have been selected to simulate snowpack evolution over the study domain. The first winter (2007/2008) corresponds to the International Polar Year when snow properties across a large latitudinal spatial extent were measured in Quebec (Langlois et al., 2010; Royer et al., 2021a) (Fig. 2). As no SSA measurements were available in 2007/2008, a second year (2015/2016) is included with vertical profiles of SSA and density for 7 locations across the transect (Fig. 2b) extending from Forêt Montmorency (47.31° N) in southern Quebec up to Ward Hunt (83.09° N) at the northernmost point of the Canadian Arctic (Royer et al., 2021a).
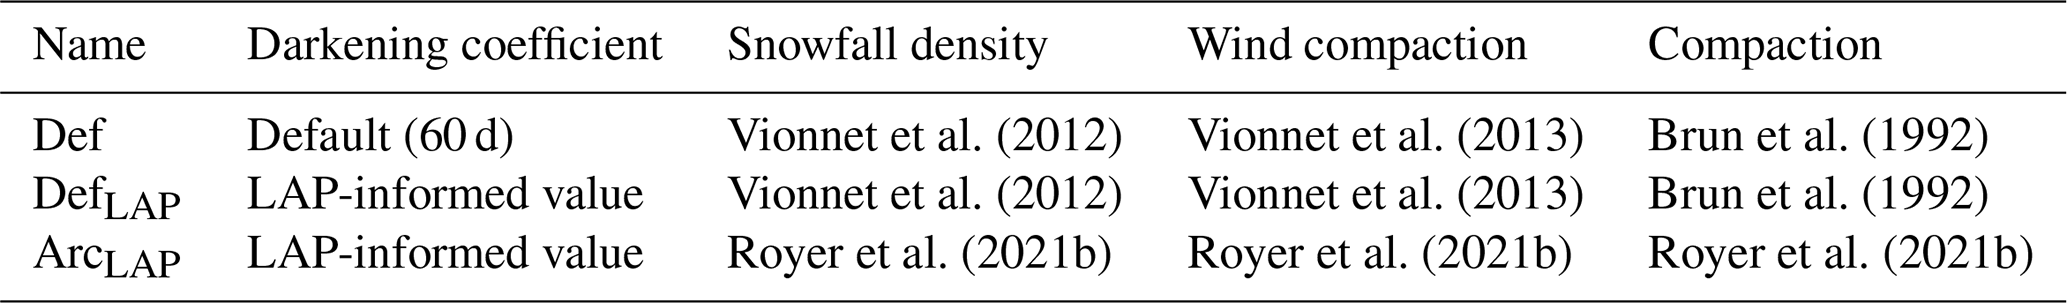
Vionnet et al. (2012)Vionnet et al. (2013)Brun et al. (1992)Vionnet et al. (2012)Vionnet et al. (2013)Brun et al. (1992)Royer et al. (2021b)Royer et al. (2021b)Royer et al. (2021b)Table 2Configurations of SVS2 used for the distributed simulations. The LAP-informed values of the darkening coefficient were obtained from Gaillard et al. (2025).
3.3.2 Model forcing and configurations
SVS2 was used in offline (uncoupled) mode to simulate snow cover evolution. For each winter, snowpack simulations were carried out from 1 September to 31 August over the study domain shown on Fig. 2 at 10 km horizontal grid spacing. The grid is made of 210 by 450 points. Soil properties (sand/clay percentages) were obtained from the Global Soil Dataset for use in Earth System Models (GSDE, Shangguan et al., 2014) at 30 arcsec, whereas information about the land cover (vegetation type/fraction) were derived from the NALCMS dataset at 30 m grid spacing (North American Land Change Monitoring System; http://www.cec.org/north-american-land-change-monitoring-system/, last access: 13 November 2025). The influence of soil organic matter on soil thermal and hydraulic properties (Sect. S1.3.4) was not considered. The initial soil state on 1 September of each winter was taken from a 1 year spin-up of the land surface conditions. Such spin-up duration is short compared to typical spin-up durations (e.g., hundreds of years) used in studies focusing on the thermal regime of the permafrost at high-latitudes (e.g., Elshamy et al., 2020; Ji et al., 2022). In the context of this study, a sensitivity analysis showed that results for seasonal snow (snow physical properties and snow melt out date) remained unchanged when using a 5 year spin-up of the land surface conditions.
SVS2 requires the following atmospheric forcing: air temperature and specific humidity at a known level above the surface, wind speed at a known level above the surface, surface air pressure, surface incoming longwave and total shortwave (direct and diffuse) radiations and solid and liquid precipitation rates. These hourly fields were obtained from the ERA5 global reanalysis (Hersbach et al., 2020). Air temperature/specific humidity and wind speed were taken at the lowest prognostic levels (∼ 30 m). Downscaling of the atmospheric forcing (Bernier et al., 2011) was applied to account for different surface elevations between ERA-5 forcing at a horizontal resolution of 31 km and the SVS2 grid at a horizontal resolution of 10 km. The method of Bernier et al. (2011) modifies air temperature of the ERA-5 forcing using a constant lapse rate, adjusts air pressure and assumes that relative humidity remains unchanged. The specific humidity is finally recomputed to account for elevation differences. Precipitation phase was obtained following the method of Harder and Pomeroy (2013), relying on hydrometeor temperature derived from the downscaled air temperature and humidity. The method of Harder and Pomeroy (2013) has been extensively used when simulating cold-region hydrology across Canada (e.g. Aygün et al., 2022; Leroux et al., 2023; Marsh et al., 2024). A similar downscaling approach is used to produce the atmospheric forcing for the ERA5-Land surface reanalysis at 9 km grid spacing (Muñoz-Sabater et al., 2021). The ABV approach was used for high vegetation meaning that the canopy module in SVS2 was fully activated.
Three configurations of SVS2 were considered and are described in Table 2. Two configurations (Def, DefLAP) were used to first assess the impact of the LAP-informed snow darkening coefficient on snowpack dynamics. An additional configuration (ArcLAP) was then considered to test the capacity of Arctic configuration (Sect. 2.2.3) to simulate snowpack properties (density and SSA) across the latitudinal transect. ArcLAP accounts for wind-induced snow compaction through a modified snowfall density and snowdrift routine and includes effects of basal vegetation that depend on the height of Arctic vegetation (Sect. 2.2.3 and Fig. 2). ArcLAP also includes the LAP-informed snow darkening coefficient. The configuration Def was used for the 1 year spin-up simulations. All simulations include the parameterization of mass loss due to blowing snow sublimation of Gordon et al. (2006) that is recommended for large scale applications of Crocus (Brun et al., 2013). The three configurations use the formulation of Yen (1981) for the snow thermal conductivity.
3.3.3 Evaluation, benchmarking data, and performance metrics
Simulations of internal snowpack properties were evaluated using snow pit data aggregated in Royer et al. (2021a) and collected by different research groups (Langlois et al., 2010; Domine et al., 2018; Lackner et al., 2022). These data consist of vertical profiles of snow density, SSA (for winter 2015/16), snow temperature, and grain type. Only snow density and SSA were considered in this evaluation. A vegetation type (forest or open) was associated with each snow pit. For model evaluation, the simulated profiles of snow density and optical diameter were then extracted at the nearest grid points to each snow pit. Simulated optical diameter, dopt (m), was converted to SSA (m2 kg−1) for the evaluation following:
where ρice is the ice density (kg m−3). The SVS2 simulated snow pit in the open (forest) was considered when the observation was collected in open (forested) terrain. Profiles where the simulated and observed snow heights differed by more than 50 % were not considered to limit the errors associated with site representativeness. For example, snow profiles collected in deep snow drift in the Arctic were not considered since the model configuration cannot reproduce such specific environments. 32 snow pits out of 203 were excluded using this criterion. For the selected profiles, simulated layer thicknesses were uniformly scaled to match the observed snow depth. Both the observed and scaled simulated profiles were then re-sampled onto a common 1 mm vertical grid to enable direct comparison, following the approach of Woolley et al. (2024). This normalization represents the initial step in the evaluation framework proposed by Lehning et al. (2001) and Viallon-Galinier et al. (2020) for comparing simulated and observed snow profiles. Error metrics (bias and root-mean-square error, RMSE) were computed using normalized profiles for the whole snowpack, the top 25 %, and the bottom 25 %.
The snow melt-out date (SMOD) was also used to assess model performance and compare it against reference benchmarks. For winters 2007/08 and 2015/16, the observed SMOD was estimated using the Global Multisensor Automated Snow and Ice Mapping System (GMASI) product (Romanov, 2017). Based on a combination of satellite observations in the visible, infrared, and microwave bands, GMASI provides daily global estimates of snow presence at 0.04∘ resolution. SMOD was computed as in Gascoin et al. (2019) and represents the last date of the longest continuous snow period. For the SVS2 experiments (Table 2), a minimum threshold of 5 cm was applied to the grid-averaged snow heights to determine the presence of snow in a grid cell as in Garnaud et al. (2021). Two snow products were used as additional reference benchmarks to evaluate SVS2 simulation performance (i) the ERA5-Land surface reanalysis (Muñoz-Sabater et al., 2021) at 9 km resolution (referred as ERA5L) and (ii) the ERA5-Crocus dataset (Decharme and Barbu, 2024; Ramos Buarque et al., 2025) that covers the Northern Hemisphere at 25 km resolution (referred as ERA5_CRO). Both datasets use the same atmospheric forcing as SVS2 simulations. ERA5L relies on the EC-Land land surface scheme (Boussetta et al., 2021) while ERA5_CRO uses the SURFEX/Crocus (Vionnet et al., 2012) in the configuration described by Brun et al. (2013). ERA5_CRO relies on the same Crocus configuration as Def of SVS2/Crocus (Table 2) and uses 60 d for the snow darkening coefficient (Sect. 2.2.2). The same snow height threshold of 5 cm was applied to the simulations from ERA5L and ERA5_CRO to determine snow presence and derive associated SMOD. Finally, all SMOD data were interpolated to the 10 km grid of SVS2/Crocus.
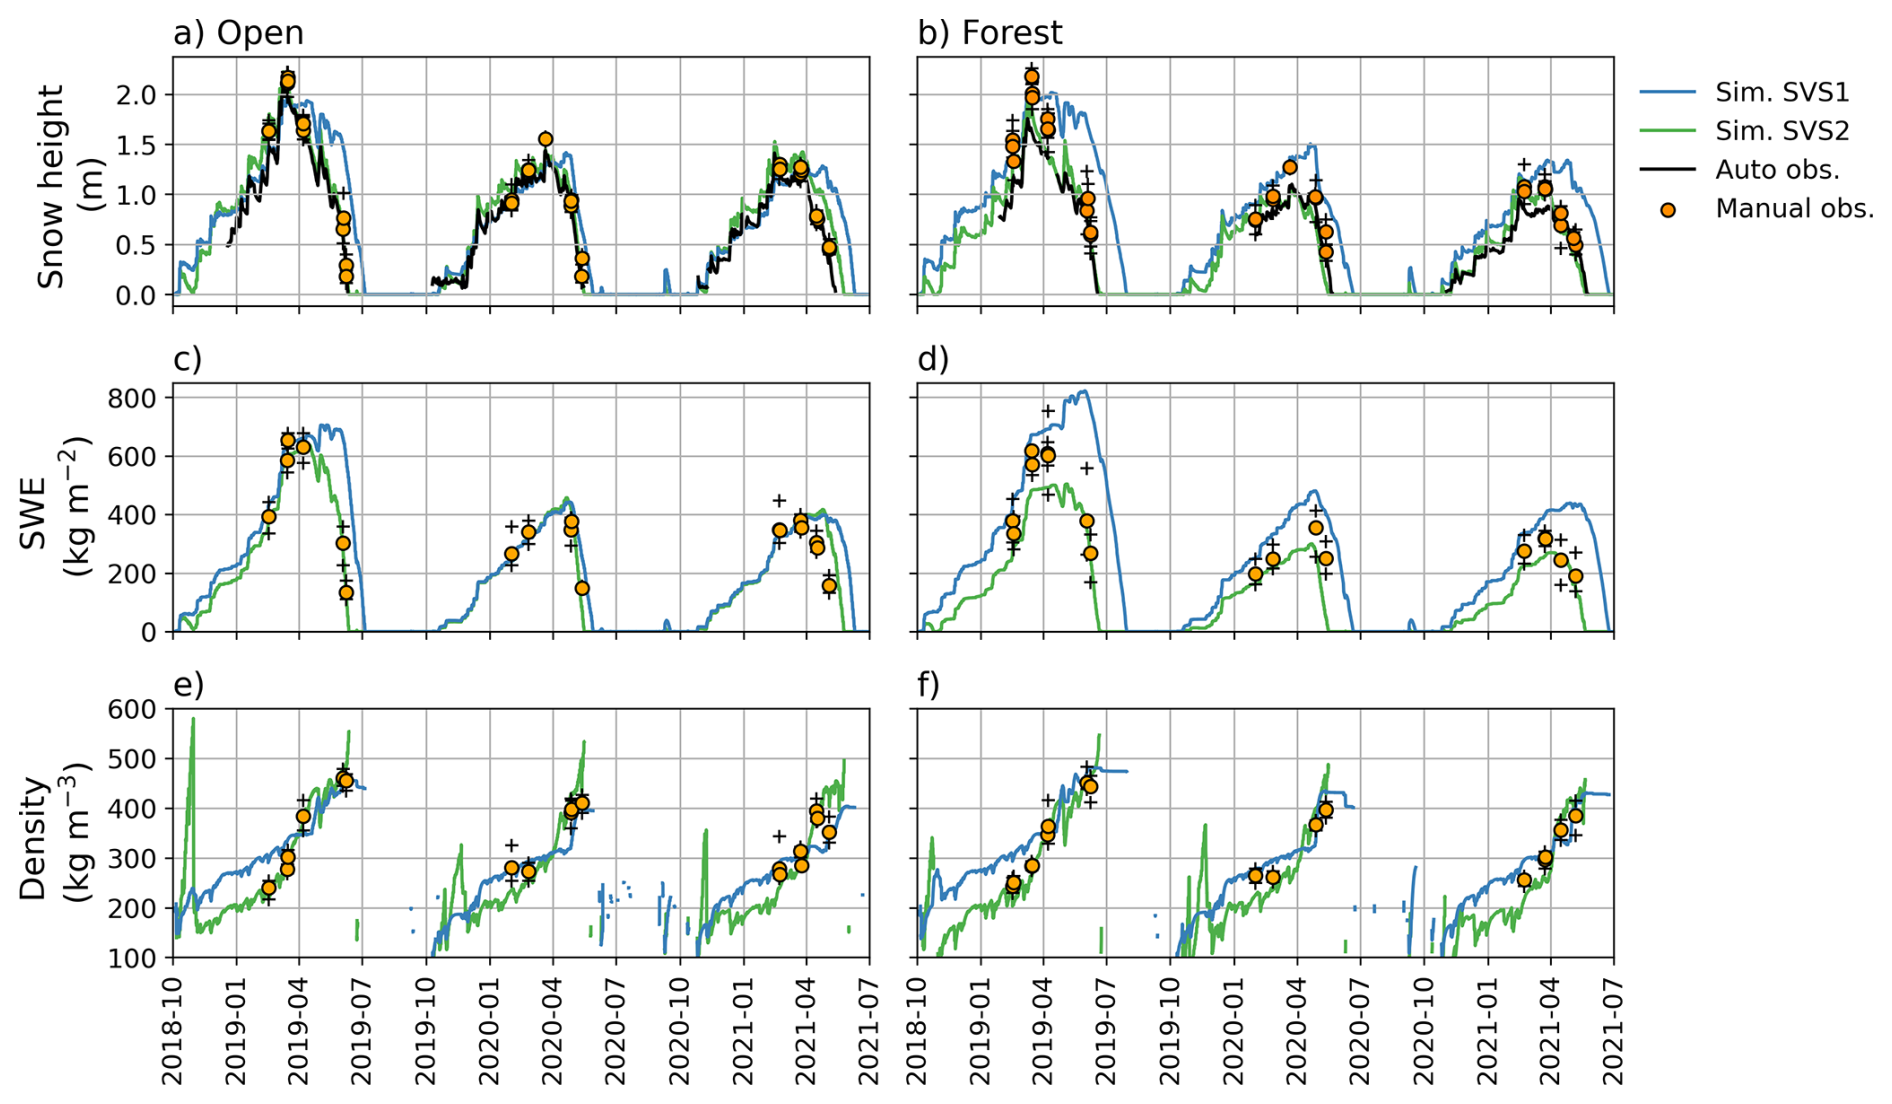
Figure 3Simulated (with SVS1 in blue and SVS2 in green) and observed snow height, SWE, and density between October 2019 and June 2021 at (a, c, and e) the open site and (b, d, and f) the forest site at Snow Crested Butte (USA). The black line in (a, b) represents the snow height measured by automatic sensors at each station, the circles represent the mean measurements and the + signs represent the minimum and maximum measurements.
Table 3Error metrics (Bias and RMSE) for the simulations of bulk snowpack properties (snow depth, SWE and bulk density) with SVS1 and SVS2 at Snow Crested Butte between October 2019 and June 2021. Measurements from automatic stations, snow courses and snow pits have been used to compute the errors metrics. Values in bold represent the best error metric among the two models for each variable and for each location (open and forest).
4.1 Point-scale evaluation at Snow Crested Butte
Figure 3 presents a comparison between observations and simulations with SVS1 and SVS2 of snow height, SWE, and bulk snow density at the open site and below the forest at Snow Crested Butte. SVS2 accurately reproduced the multi-year evolution of bulk snowpack properties with error metrics that are systematically improved compared to SVS1 for the open and forested sites (Table 3). In open terrain, SVS2 simulates more accurately the snow melt dynamics and the date of snow disappearance (Fig. 3a) compared to SVS1. Such limitation of SVS1 has been identified in Leonardini et al. (2021). In the forest, SVS2 simulated a lower peak SWE than in the open due to sublimation of intercepted canopy snow and slightly underestimated observed peak SWE for the three winters (Table 3). On the other hand, SVS1 overestimated peak SWE in the forest due to the absence of snow interception and a tendency to underestimate snow melt (Leonardini et al., 2021). Finally, SVS2 better captured the increase in bulk snow density with time than SVS1 leading to improved error metrics (Table 3).
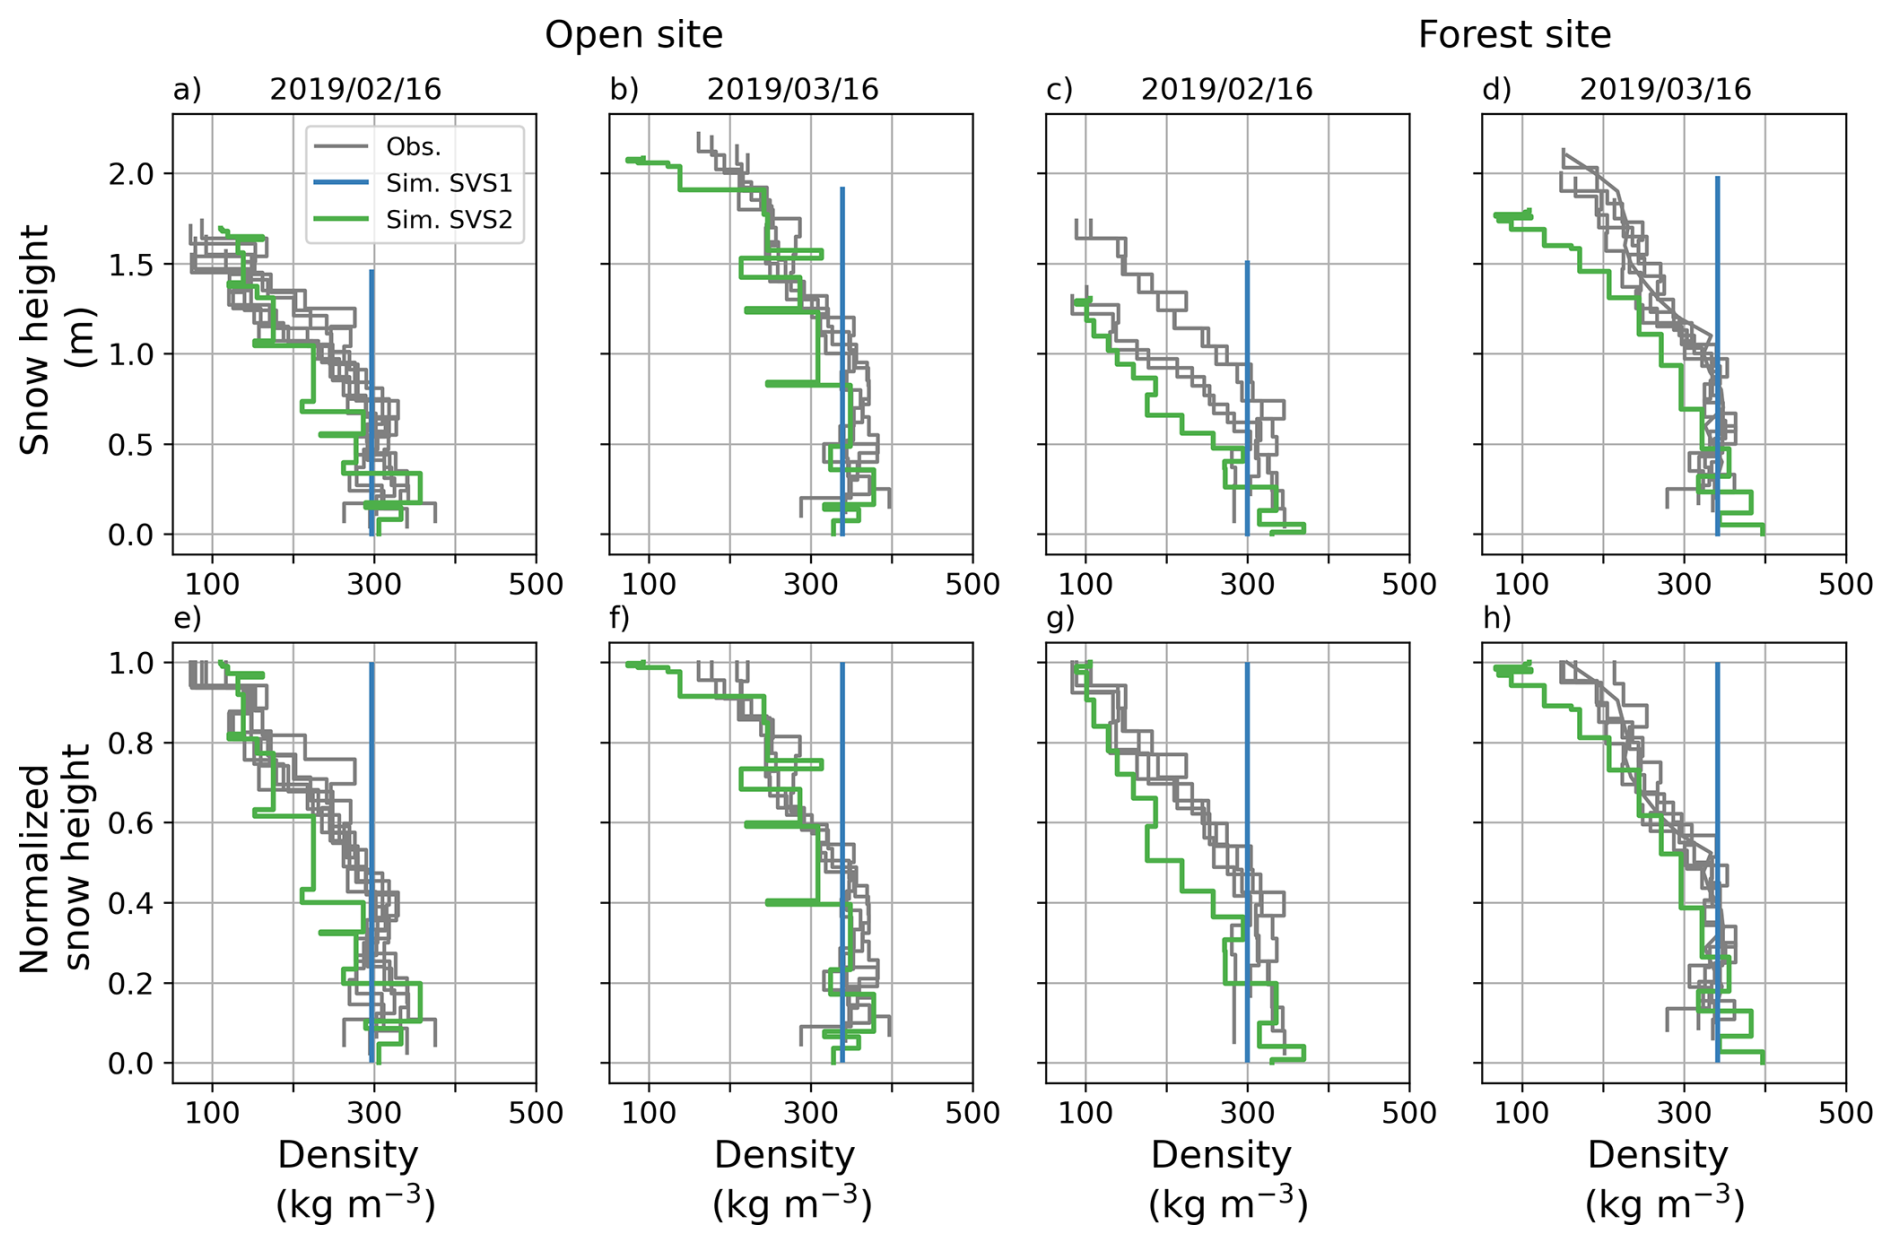
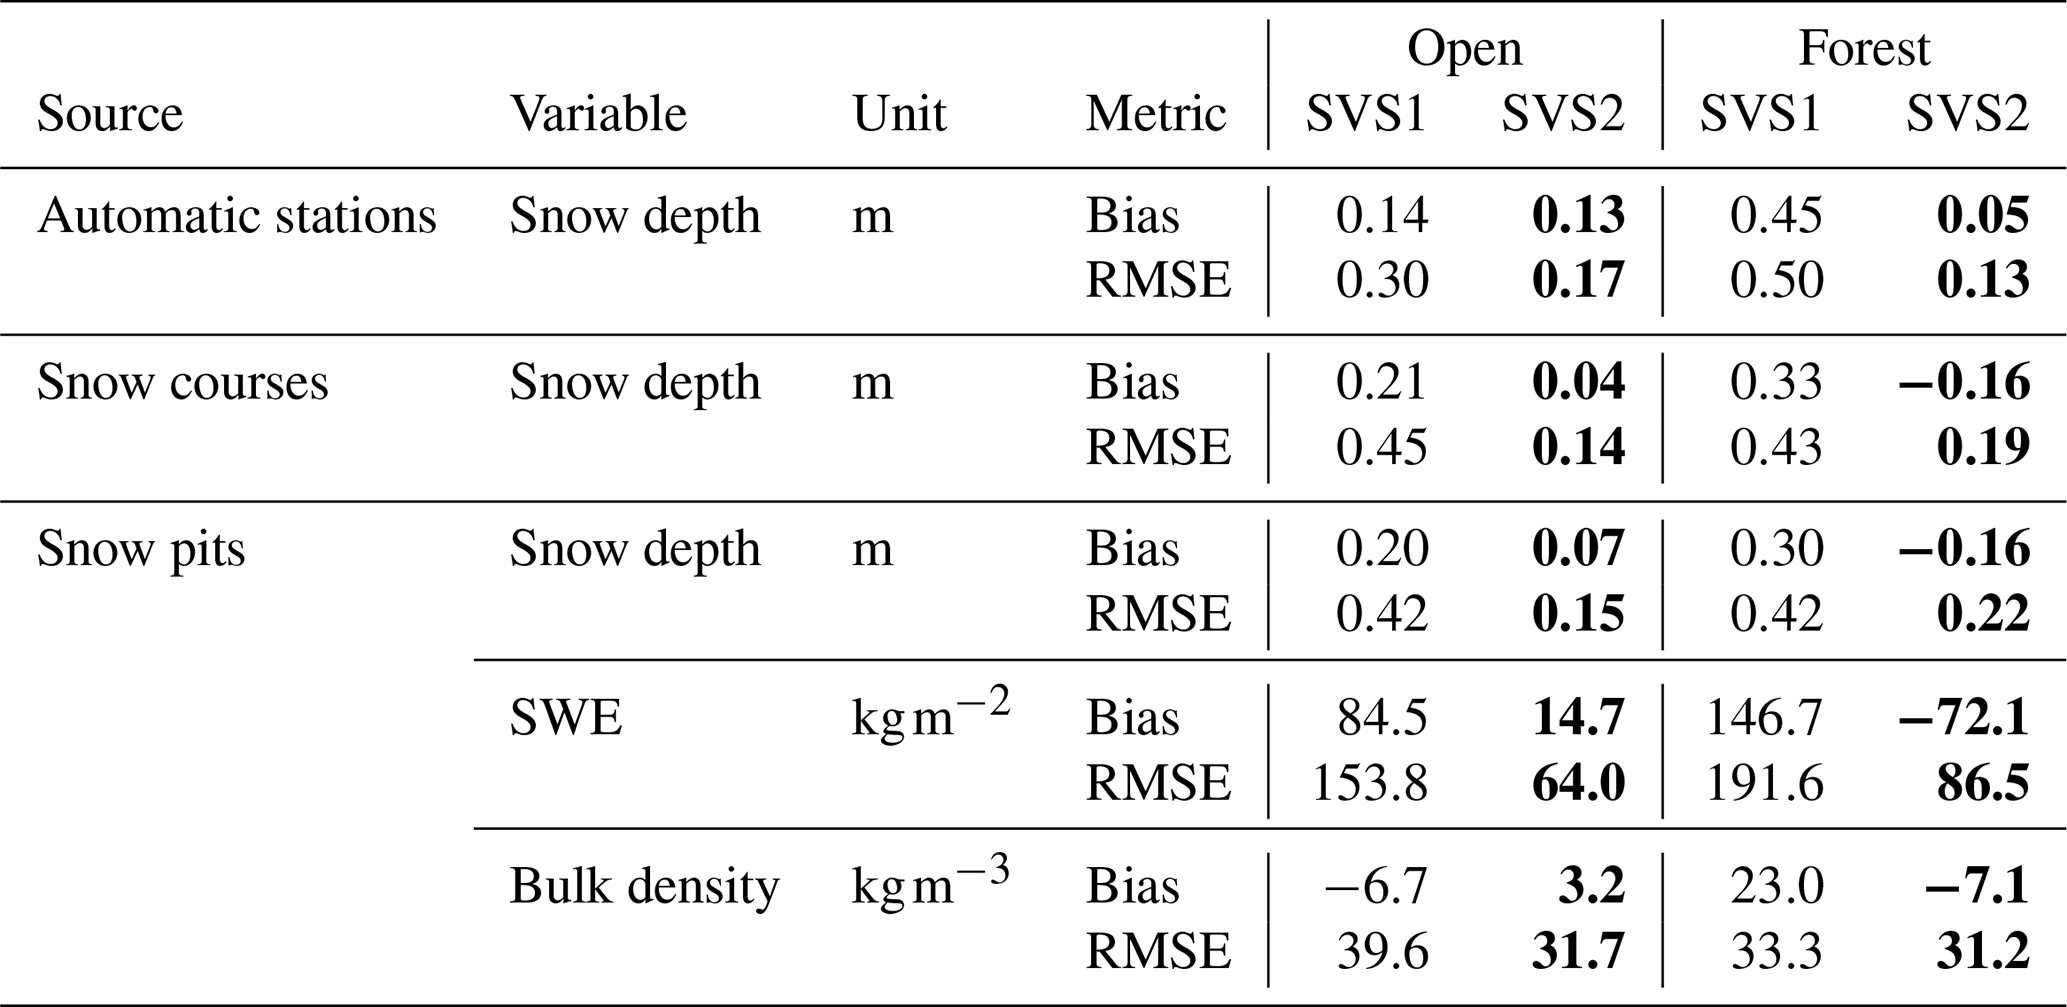
Figure 4Simulated (with SVS1 in blue and SVS2 in green) and observed vertical snow density profiles in (a, b, e, and f) the open site and (c, d, g, and h) the forest site at two different dates during the 2018/19 winter season at Snow Crested Butte. The first row shows raw vertical profiles whereas the second row shows normalized profiles where the thickness of the layers in each observed and simulated profile is normalized by total snow height.
Figure 4 compares the simulated and observed vertical profiles of snow density for two dates of winter 2018/2019. SVS2 performed well in simulating increased snow density with snow depth, a feature that the one-layer scheme in SVS1 could not capture by design. Nonetheless, SVS2 presented an underestimation by ∼ 15 % of snow density in the top third of the snowpack in the forest compared to all the snow pit measurements. This underestimation was less present in open terrain (∼ 6 %). It may be associated with reduction of wind speed in the forest compared to the open site, which tends to reduce the snowfall density as found in Bonner et al. (2022a). Uncertainties also exist in the density of unloaded snow, which has a fixed value of 200 kg m−3 in SVS2/Crocus. Bouchard et al. (2024) have shown how an age-dependent density of unloaded snow can improve simulations of snow density in forested terrain. On the other hand, compared to all the snowpits over the 3 year study period, SVS2 tended to overestimate by ∼ 6 % and ∼ 10 % the density in the bottom third of the snowpack at open and forest sites, respectively.
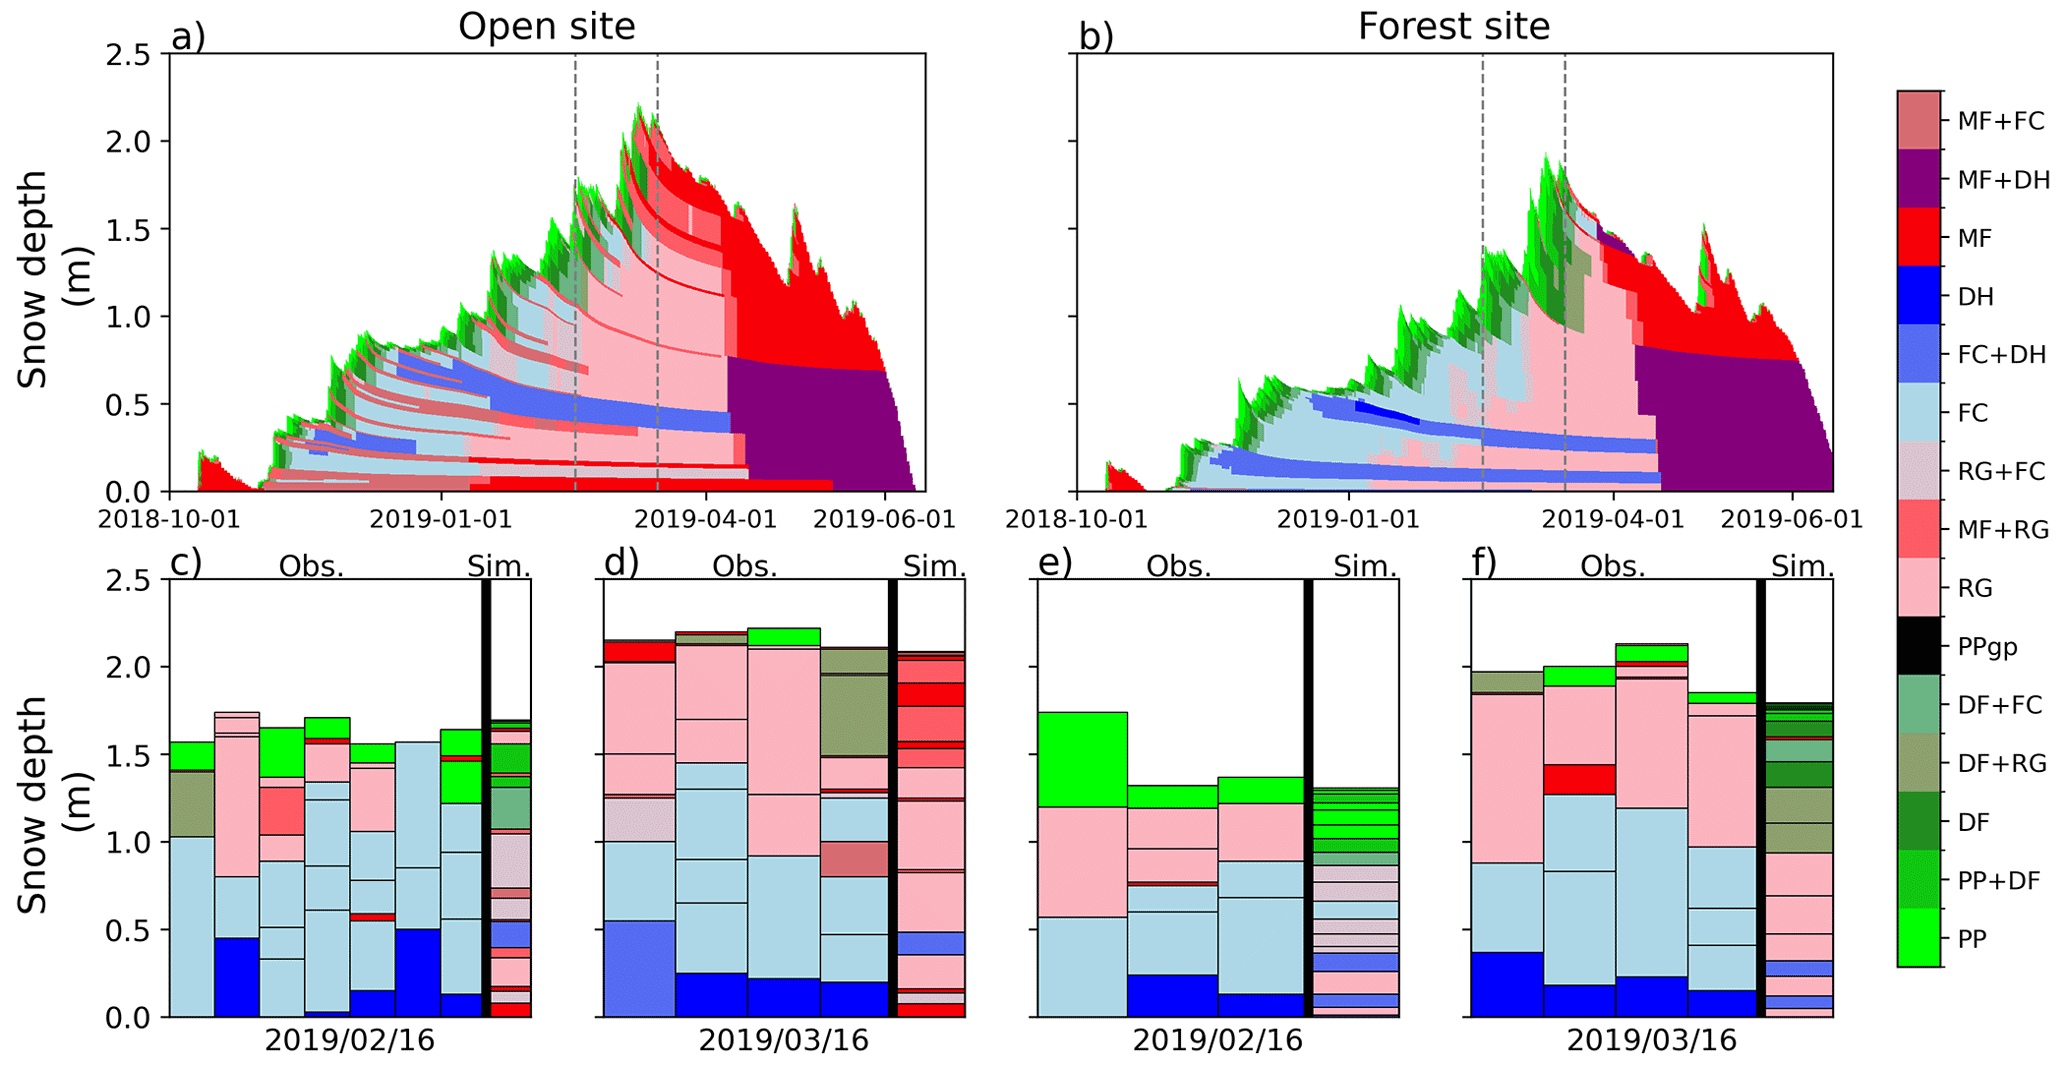
Figure 5(a, b) Simulated snow grain type at the (a) open site and (b) the forest site. (c, d) show the observed vertical layer grain types from the snowpits against the simulation at the open site on 16 February 2019, and 16 March 2019, respectively. (e, f) are the same as (c, d) but for the forest site. The vertical lines in (a, b) represent the times at which the comparison between the snowpits and the simulation are done (c–f). Grain type abbreviations correspond to the international classification for seasonal snow on the ground (Fierz et al., 2009).
Simulated grain type of each layer was qualitatively compared to those from snow pits (Fig. 5). No quantitative comparison was carried out due to uncertainties in the observed snow type and in the snow grain diagnostic from the model (e.g. Viallon-Galinier et al., 2020). Until mid-January, the model simulated a higher prevalence of faceted crystals and depth hoar layers in the forest relative to the open site. These results are consistent with Bouchard et al. (2022) in the humid boreal forest of Eastern Canada. In the open, the simulated snowpack presented several layers made of refrozen melt forms (MF), which were not found in measurements. A more detailed analysis showed that refrozen melt forms were simulated in the open due to several mid-winter melting events that were not simulated in the forest. Comparison with observations in February and March 2019 also showed that observed layers of faceted crystals (faceted crystals, FC, and depth hoar, DH) at the bottom of the snowpack in both the open and the forest were not fully captured by the model that simulated a succession of layers made of rounded grains (RG) and faceted crystals (FC) instead. Finally, in the forest, the model simulated more fresh snow (precipitation particles, PP, and decomposed and fragmented particles, DF) at the top of the snowpack than observed (Fig. 5e and f). This can be potentially explained by the fixed microstructure properties of unloaded snow from the canopy in SVS2 (SSA of 32 m2 kg−1 and sphericity of 0.95). Analogous to the treatment of density, Bouchard et al. (2024) proposed incorporating a dependency on the age of unloaded snow when computing its microstructural characteristics. This approach will be considered in a future version of SVS2.
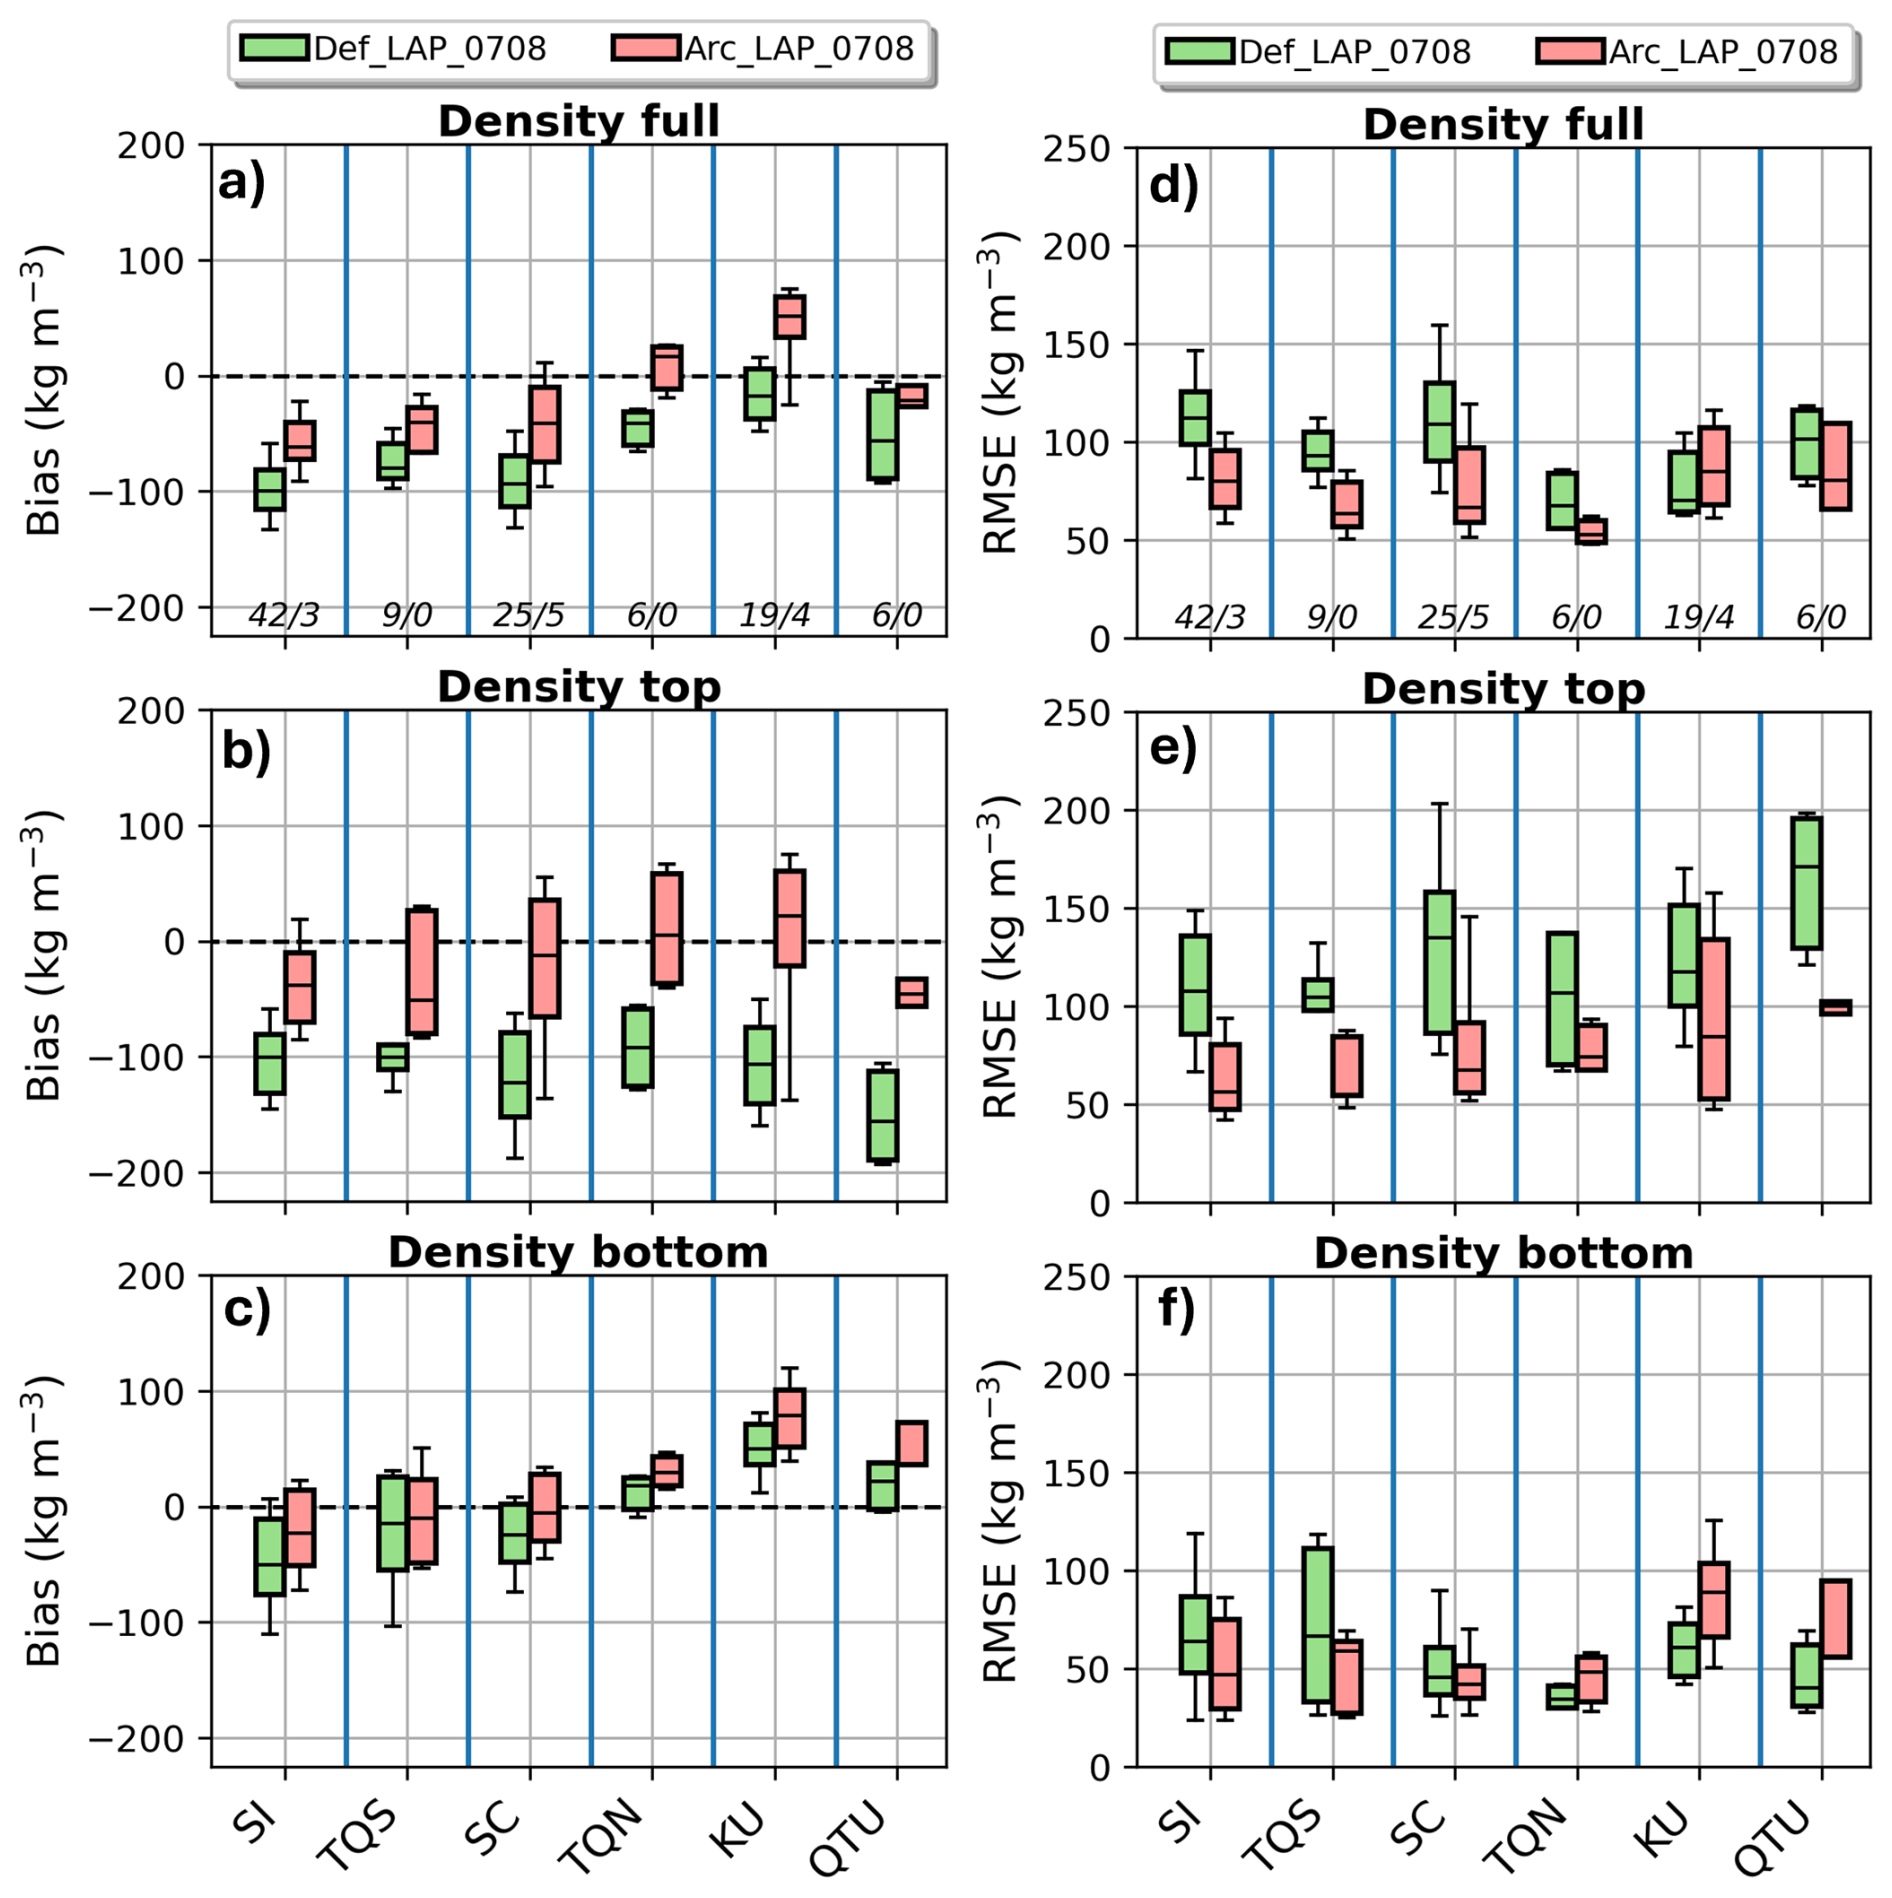
Figure 6Distributions of error metrics (Bias on the left and RMSE on the right) for the simulation of the vertical profile of snow density at different locations across Eastern Canada (Fig. 2) in February 2008. Error metrics are computed for the whole snowpack (a, d), the top 25 % (b, e) and the bottom 25 % (c, f). The numbers in italic at the bottom of a) and d) indicate the number of snow pits considered within each region for model evaluation (open terrain/forested terrain).
4.2 Distributed snowpack simulations across a latitudinal transect in Eastern Canada
4.2.1 Simulations of snowpack density
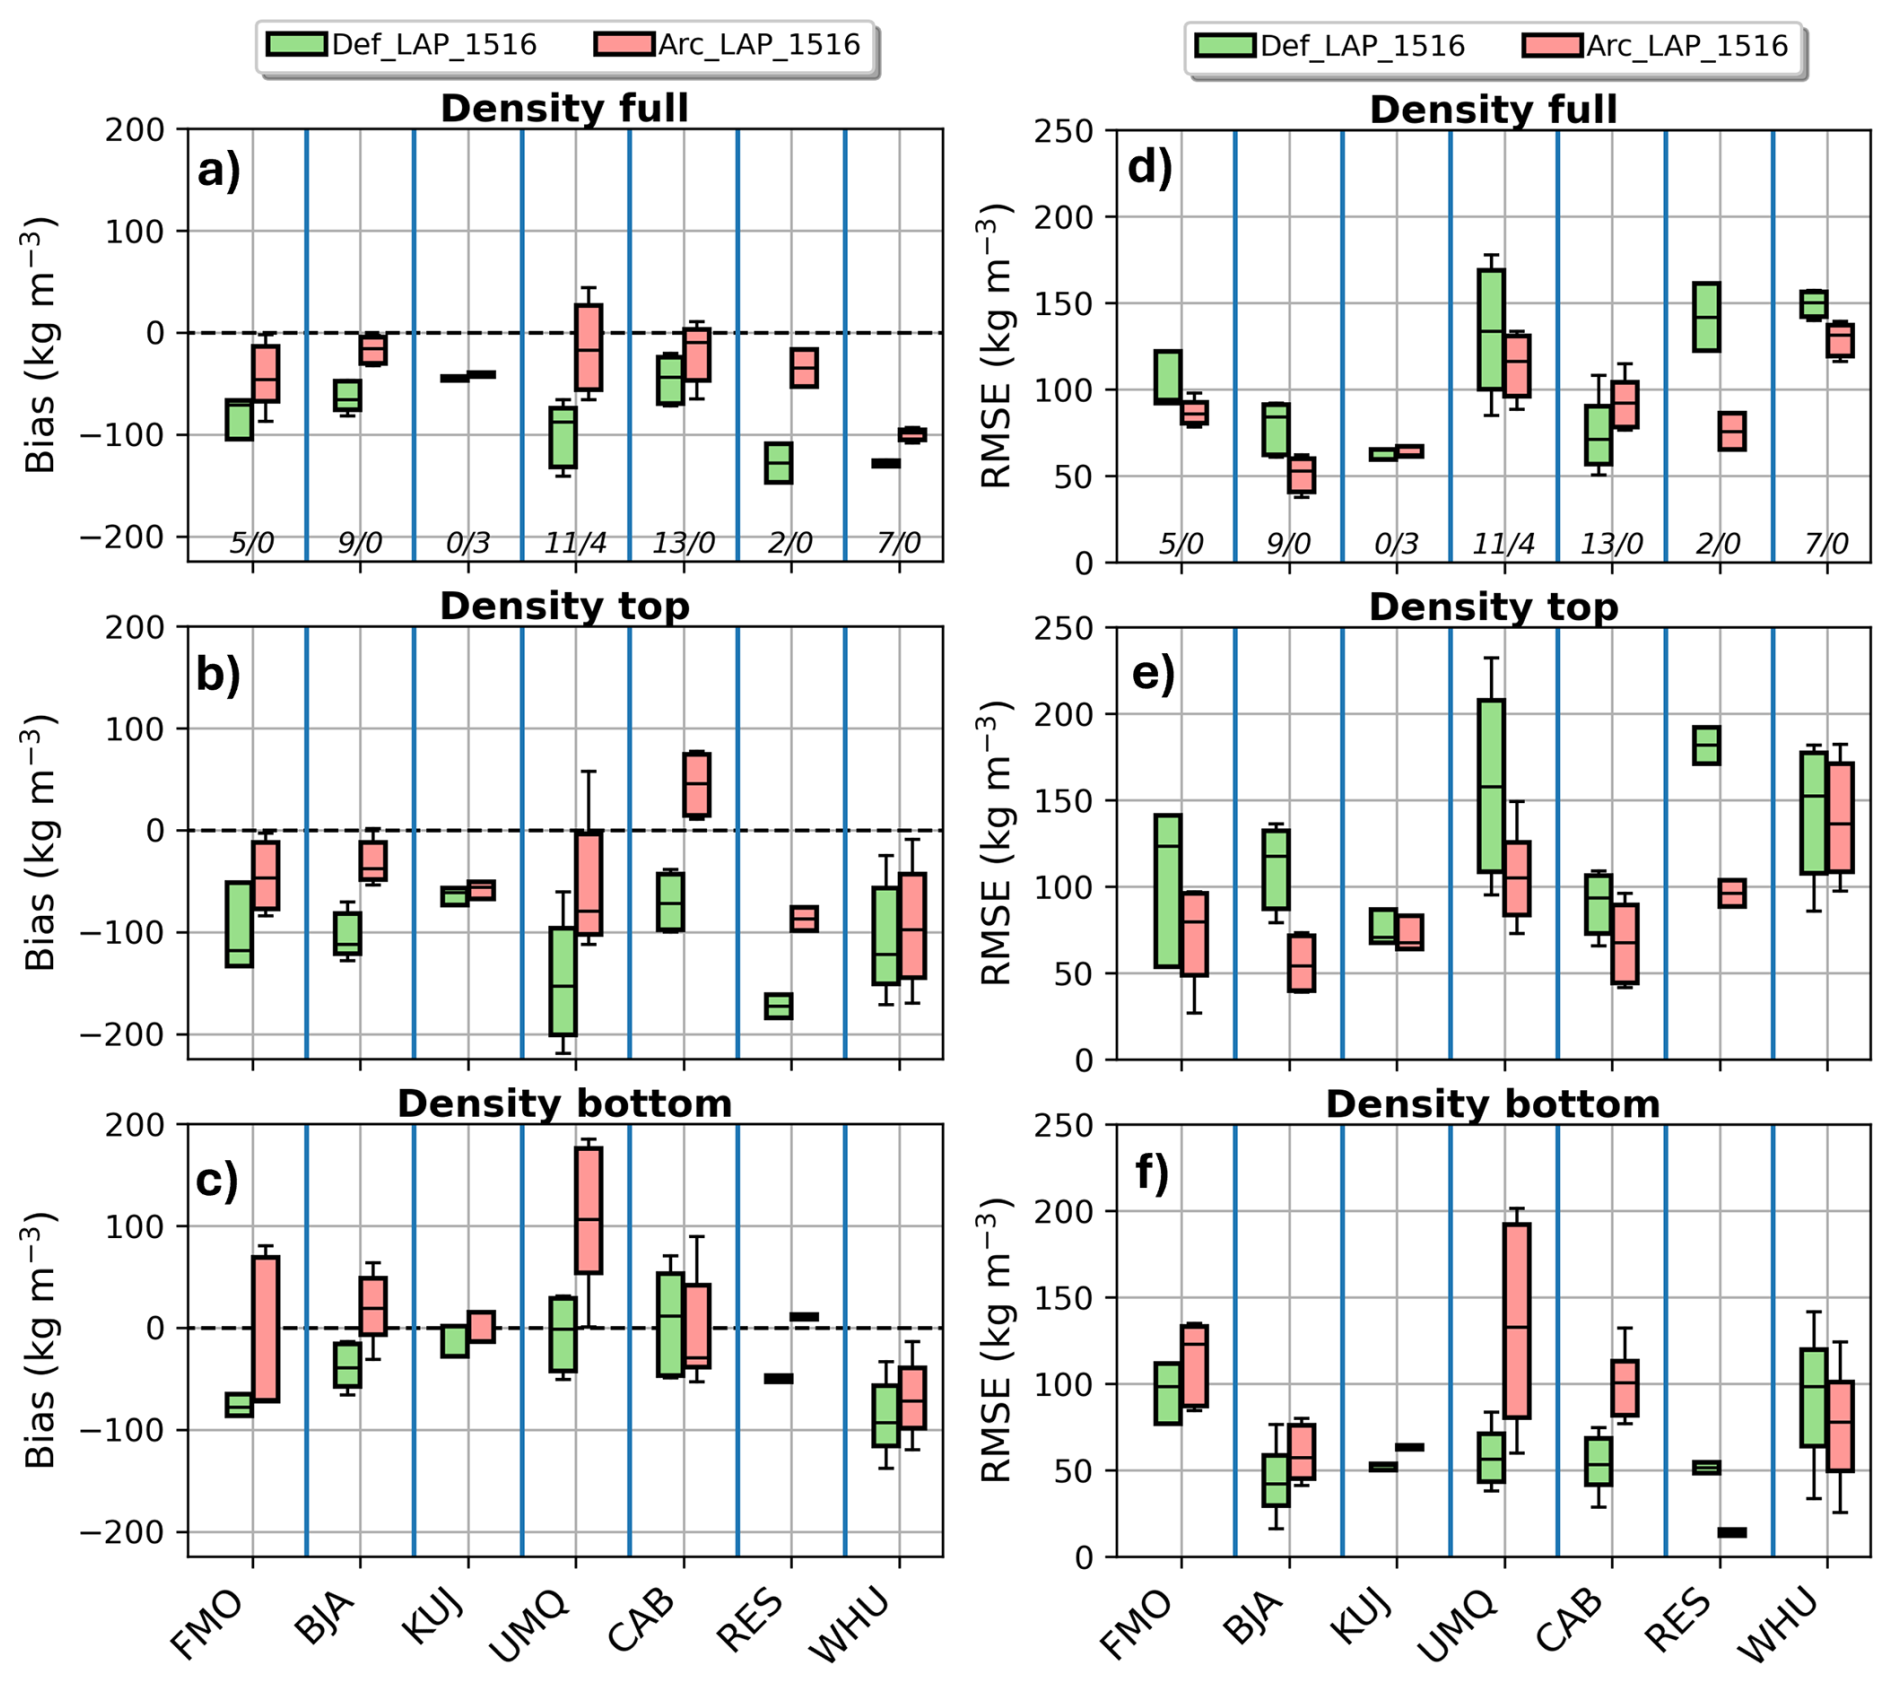
Figures 6 and 7 illustrate the performance of two SVS2/Crocus configurations (DefLAP and ArcLAP) in reproducing vertical snow density profiles for the winters of 2007/08 and 2015/16, respectively. The default configuration (Def) is not shown on these figures since it gave similar results as DefLAP. DefLAP led to a systematic underestimation of the upper snowpack densities for all locations across Quebec for winter 2007/08 (Fig. 6b). The Arctic configuration (ArcLAP) strongly improved model results. It removed most of the negative bias in the density of the upper snowpack and decreased the median RMSE (Fig 6e) for the sub-Arctic locations (KU and QTU) but also for sites located below the treeline (SI, TQS, SC and TQN; Fig. 2). These improvements result from the modifications in the Arctic configuration that increase the compaction of surface snow due to high wind speeds and that are active over the whole simulation domain (Sect. 2.2.3). Similar improvements for sites below the treeline were found at Foret Montmorency (FMO) and Baie James (BJA) in 2015/16 (Fig 7b and d). No improvements were found at Kuujjuarapik (KUJ) in 2015/16 where both configurations underestimated the density of the upper layers. At KUJ, the snow pits were collected in a sparse forested environments where the wind speed was reduced by the presence of the trees (Eq. 17), explaining why the modifications to enhance wind packing in ArcLAP are not as efficient as in open terrain. The ArcLAP configuration enhanced surface snow density simulations (as evidenced by lower median RMSE values) across all sub-Arctic and Arctic sites (UMQ, CAB, RES, and WHU) during winter 2015/16 when compared to the DefLAP experiment. However, notable simulation errors remained in the ArcLAP results for high Arctic locations, including an overestimation of surface snow density at Cambridge Bay (CAB) and significant underestimation at the two polar desert sites (RES and WHU).
The density of upper snow layers at the sub-Arctic and Arctic sites are in agreement with previous findings of Royer et al. (2021b), Lackner et al. (2022), Woolley et al. (2024) and Woolley et al. (2025). These studies have shown that (i) the default version of SVS2/Crocus strongly underestimated the density of surface snow in the Arctic, (ii) modifications in ArcLAP that increase the effects of wind-packing strongly improved the simulated density of upper snow layers, and (iii) the parameterization of below-canopy wind speed in SVS2 inhibits the ability of wind effect modifications to compact surface layers of the snowpack in areas of low canopy density. Transferability of parameterizations across Arctic locations presents significant challenges, as demonstrated by SVS2/Crocus simulation results. At Cambridge Bay (CAB), ArcLAP using the Royer et al. (2021b) parameterization severely overestimated near-surface snow density, consistent with Woolley et al. (2024) at Trail Valley Creek (Northwest Territories, Canada). Polar desert environments (RES and WHU) showed the opposite trend with large density underestimation. Beyond potential ERA5 wind speed biases contributing to these errors, fundamental improvements to wind-packing parameterizations are essential. These enhancements should build on recent advances in measuring wind-induced snow transport impacts on surface snow microstructure (Walter et al., 2024) and incorporate water vapor flux representation in Crocus to capture upper layer density evolution (Domine et al., 2016b, 2018).
In the southern part of the domain (SI, TQS, SC on Fig. 6c and FMO and BJA on Fig. 7c), the DefLAP configuration tended to underestimate basal densities. Contrasting results were obtained in this region with the ArcLAP configuration, which improved results in 2007/08 (Fig. 6f) but led to larger errors in 2015/16 (Fig. 7f). At sub-Arctic sites, DefLAP overestimated basal densities at KU and QTU, (Fig. 6c) and gave accurate estimation at UMQ (Fig. 7c). These sub-Arctic sites are not located in the area of Arctic vegetation (Fig. 2b) used in ArcLAP to activate the reduction of snow compaction for basal snow (Sect. 2.2.3). As a consequence, the basal density is strongly overestimated at these sites in ArcLAP due to overestimated wind-packing. At Cambridge Bay (CAB), located further north in the Arctic, overestimation of basal snow density is not present in ArcLAP because basal compaction is limited by the presence of Arctic vegetation. However, despite this parameterization, the ArcLAP configuration did not improve distributions of RMSE compared to DefLAP at CAB (Fig 7f). This result is consistent with Woolley et al. (2024), who found no quantitative improvement in the simulation of basal snow density with their Arctic ensemble at Trail Valley Creek despite qualitative improvements in the shape of the vertical profile of snow density. Finally, in the polar desert (RES and WHU) where Arctic vegetation is not present (Fig. 2), ArcLAP captures well the basal density at RES but underestimated it at WHU. Crocus would benefit from a representation of the water vapor flux through the snowpack to improve simulations of basal density (Domine et al., 2019) in the Arctic but also at sub-Arctic sites such as Umiujaq (Lackner et al., 2022).
The ArcLAP configuration improved snowpack density simulations at 10 out of 13 evaluation sites in 2007/08 and 2015/16 (Fig. 6d and Fig. 7d), with improvements defined as a lower median RMSE, indicating potential for enhanced snowpack density simulation across large areas of Canada. However, further evaluation is needed in regions such the Western Cordillera and the Prairies that were not covered by the study domain considered in this paper. Evaluation at well monitored sites, e.g. ESM SnowMIP (Menard et al., 2021), are likely to reduce uncertainty associated with meteorological forcing. Remaining improvements are required in wind-packing parameterizations (Walter et al., 2024) and representation of vapor transfer in the snowpack (Domine et al., 2019).
4.2.2 Simulations of specific surface area
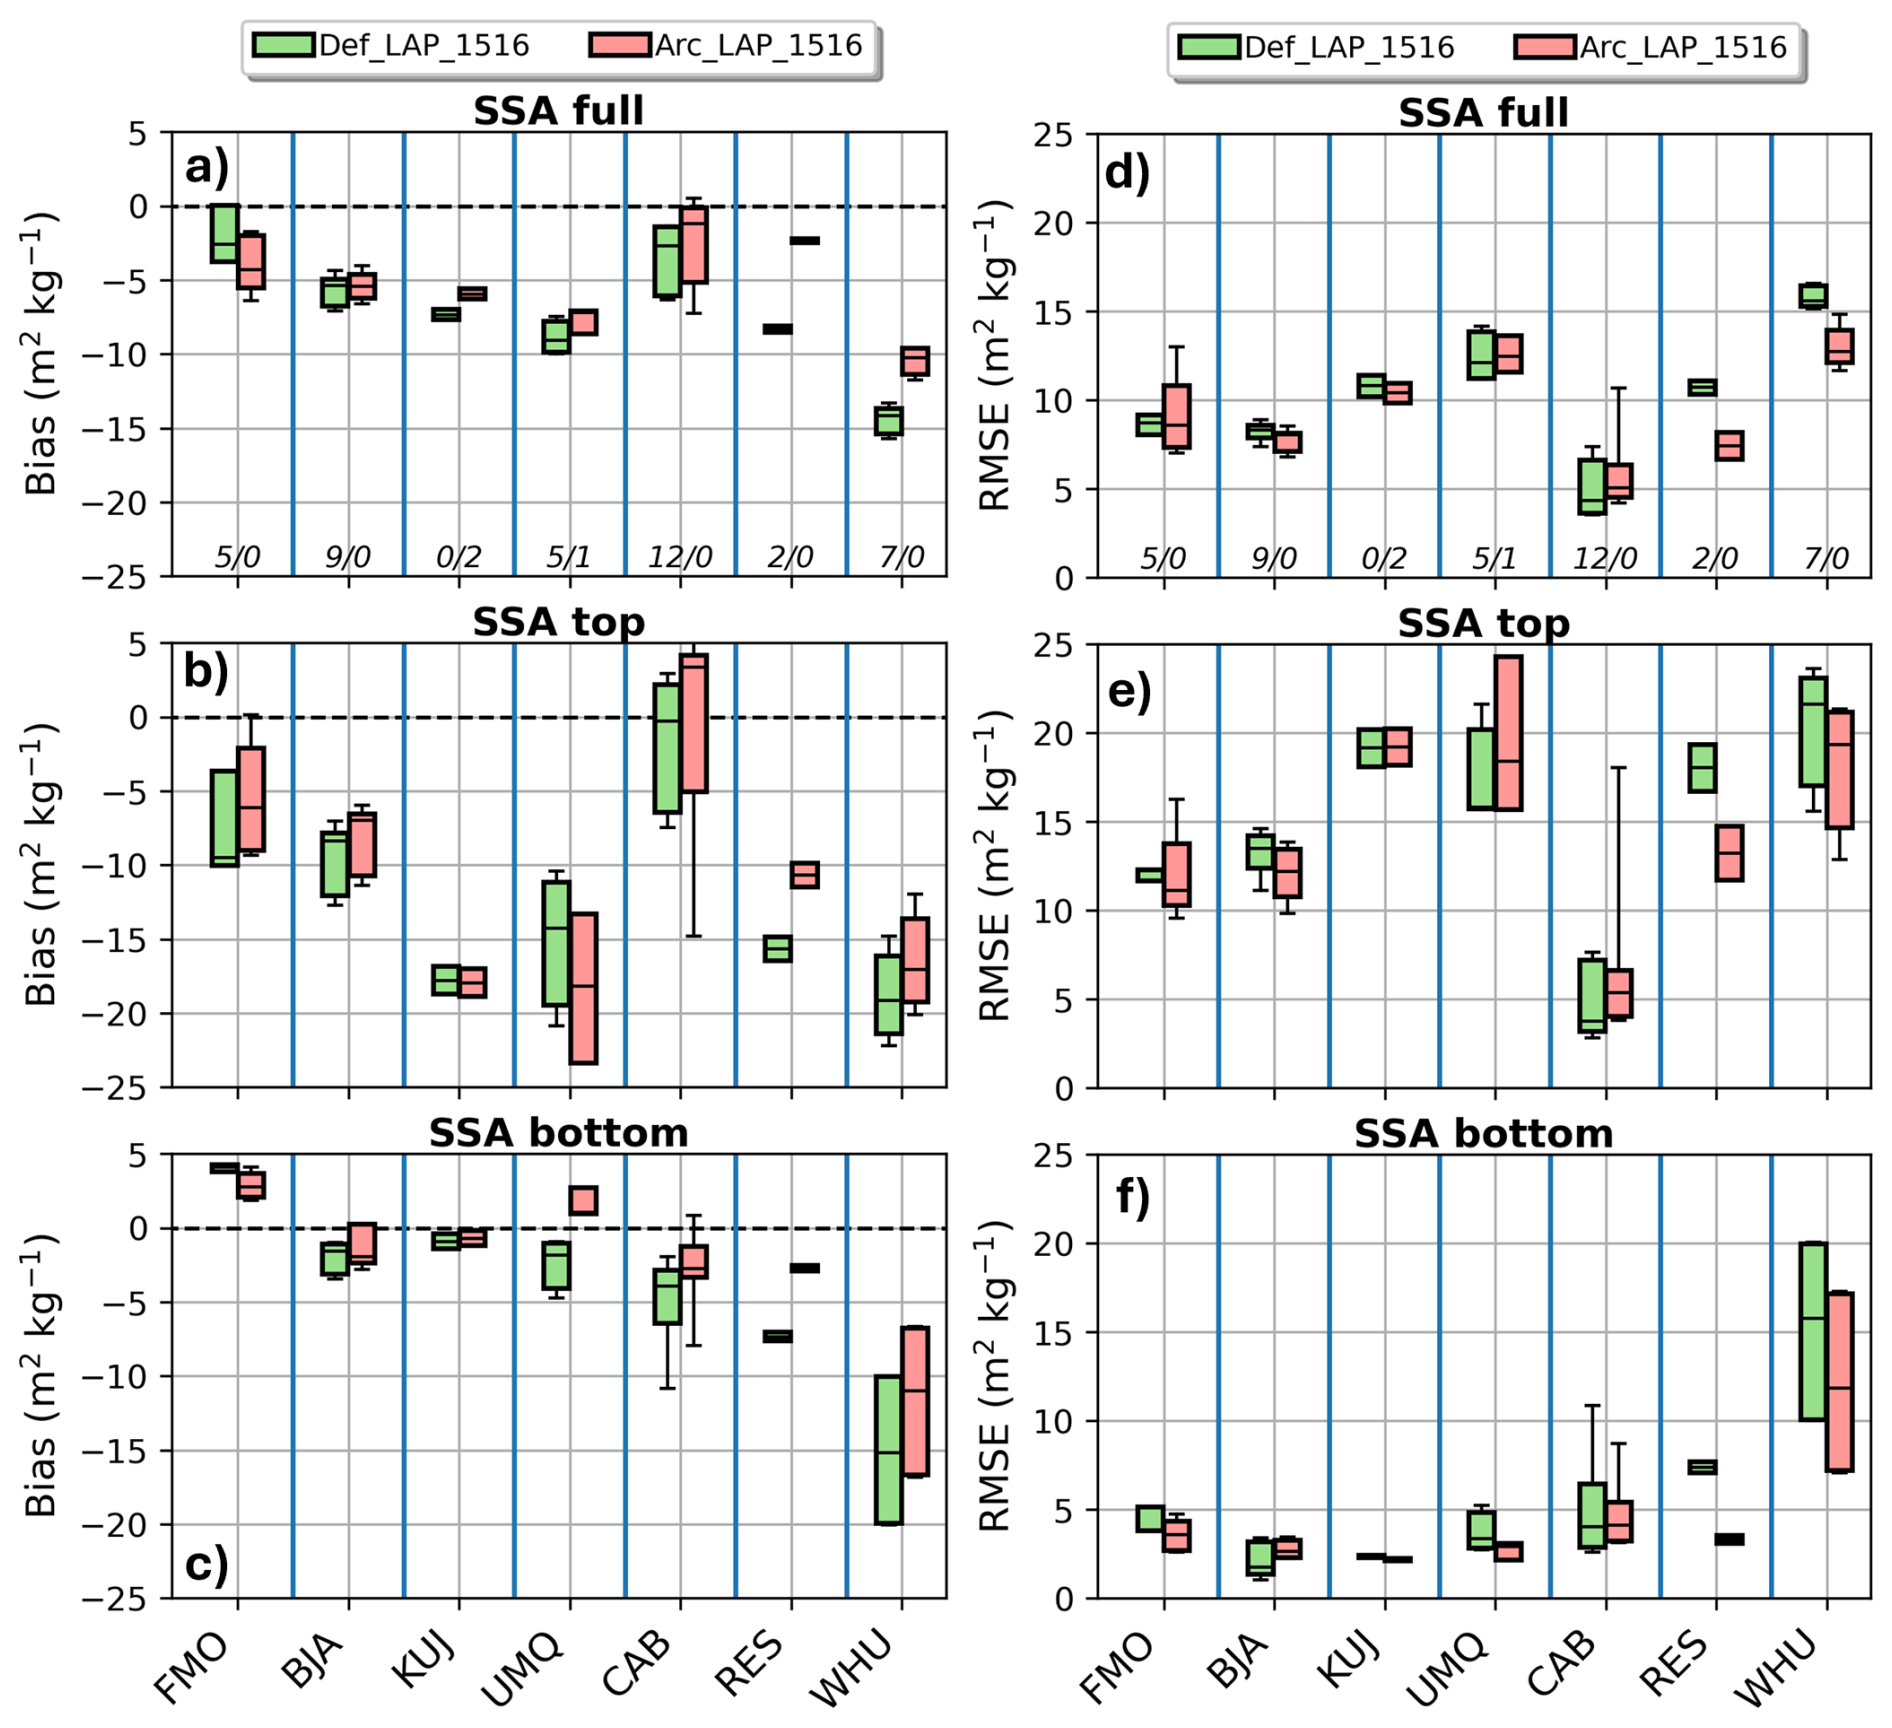
Figure 8 shows evaluation of two configurations of SVS2/Crocus (DefLAP and ArcLAP) to simulate the vertical profile of SSA for winters 2015/2016. Both configurations use the snow metamorphism scheme of Carmagnola et al. (2014) modified by Baron (2023) so that the differences in SSA are explained by differences in temperature gradients in the snowpack, resulting from differences in the snowpack density and associated thermal conductivity. Overall, the two model configurations tend to underestimate the SSA over the full snowpack (Fig. 8a). This underestimation is found in the upper layers of the snowpack (Fig. 8b) and is in agreement with Tuzet et al. (2020), who have shown a tendency of the default configuration of Crocus to underestimate near-surface SSA in alpine terrain. ArcLAP primarily improved SSA simulations in upper layers at polar desert sites (RES and WHU), while performing similarly to DefLAP at other locations. Woolley et al. (2024) also found improvements with the Arctic configuration for simulation of SSA in the wind slab layers at Trail Valley Creek in the Canadian Arctic.
Significant simulation errors occurred in basal snow layer SSA across all three Arctic sites (CAB, RES, and WHU; Fig. 8f). Both default configurations consistently underestimated SSA in these basal layers, which typically consist of depth hoar (Domine et al., 2018; Rutter et al., 2019; Meloche et al., 2022). The DefLAP configuration showed latitude-dependent error increases, with median RMSE rising from 4.1 m2 kg−1 at CAB to 15.8 m2 kg−1 at WHU. While ArcLAP improved performance by reducing median RMSE by 25 % at WHU and 55 % at RES compared to DefLAP, with similar results at CAB, SSA underestimation in basal layers remained problematic. These findings align with Woolley et al. (2024), who reported persistent SSA underestimation in depth hoar layers for both SVS2/Crocus configurations, with only marginal RMSE improvements using the Arctic setup. These results show that the Crocus metamorphism scheme (Brun et al., 1992; Carmagnola et al., 2014) fails to simulate the evolution of depth hoar SSA. Using the parametrization of Marbouty (1980), Crocus simulates geometric growth of depth hoar, causing continuous SSA decrease to unrealistically low values. The scheme cannot distinguish between crystal geometric size of depth hoar and microscopic features that actually controls depth hoar SSA (Taillandier et al., 2007). Improvements in the simulations of the SSA of depth hoar by Crocus are required in the context of SWE retrieval and data assimilation of Ku-band backscatter in Arctic environments since depth hoar strongly scatters the radar signal (King et al., 2018; Rutter et al., 2019; Montpetit et al., 2024; Woolley et al., 2025).
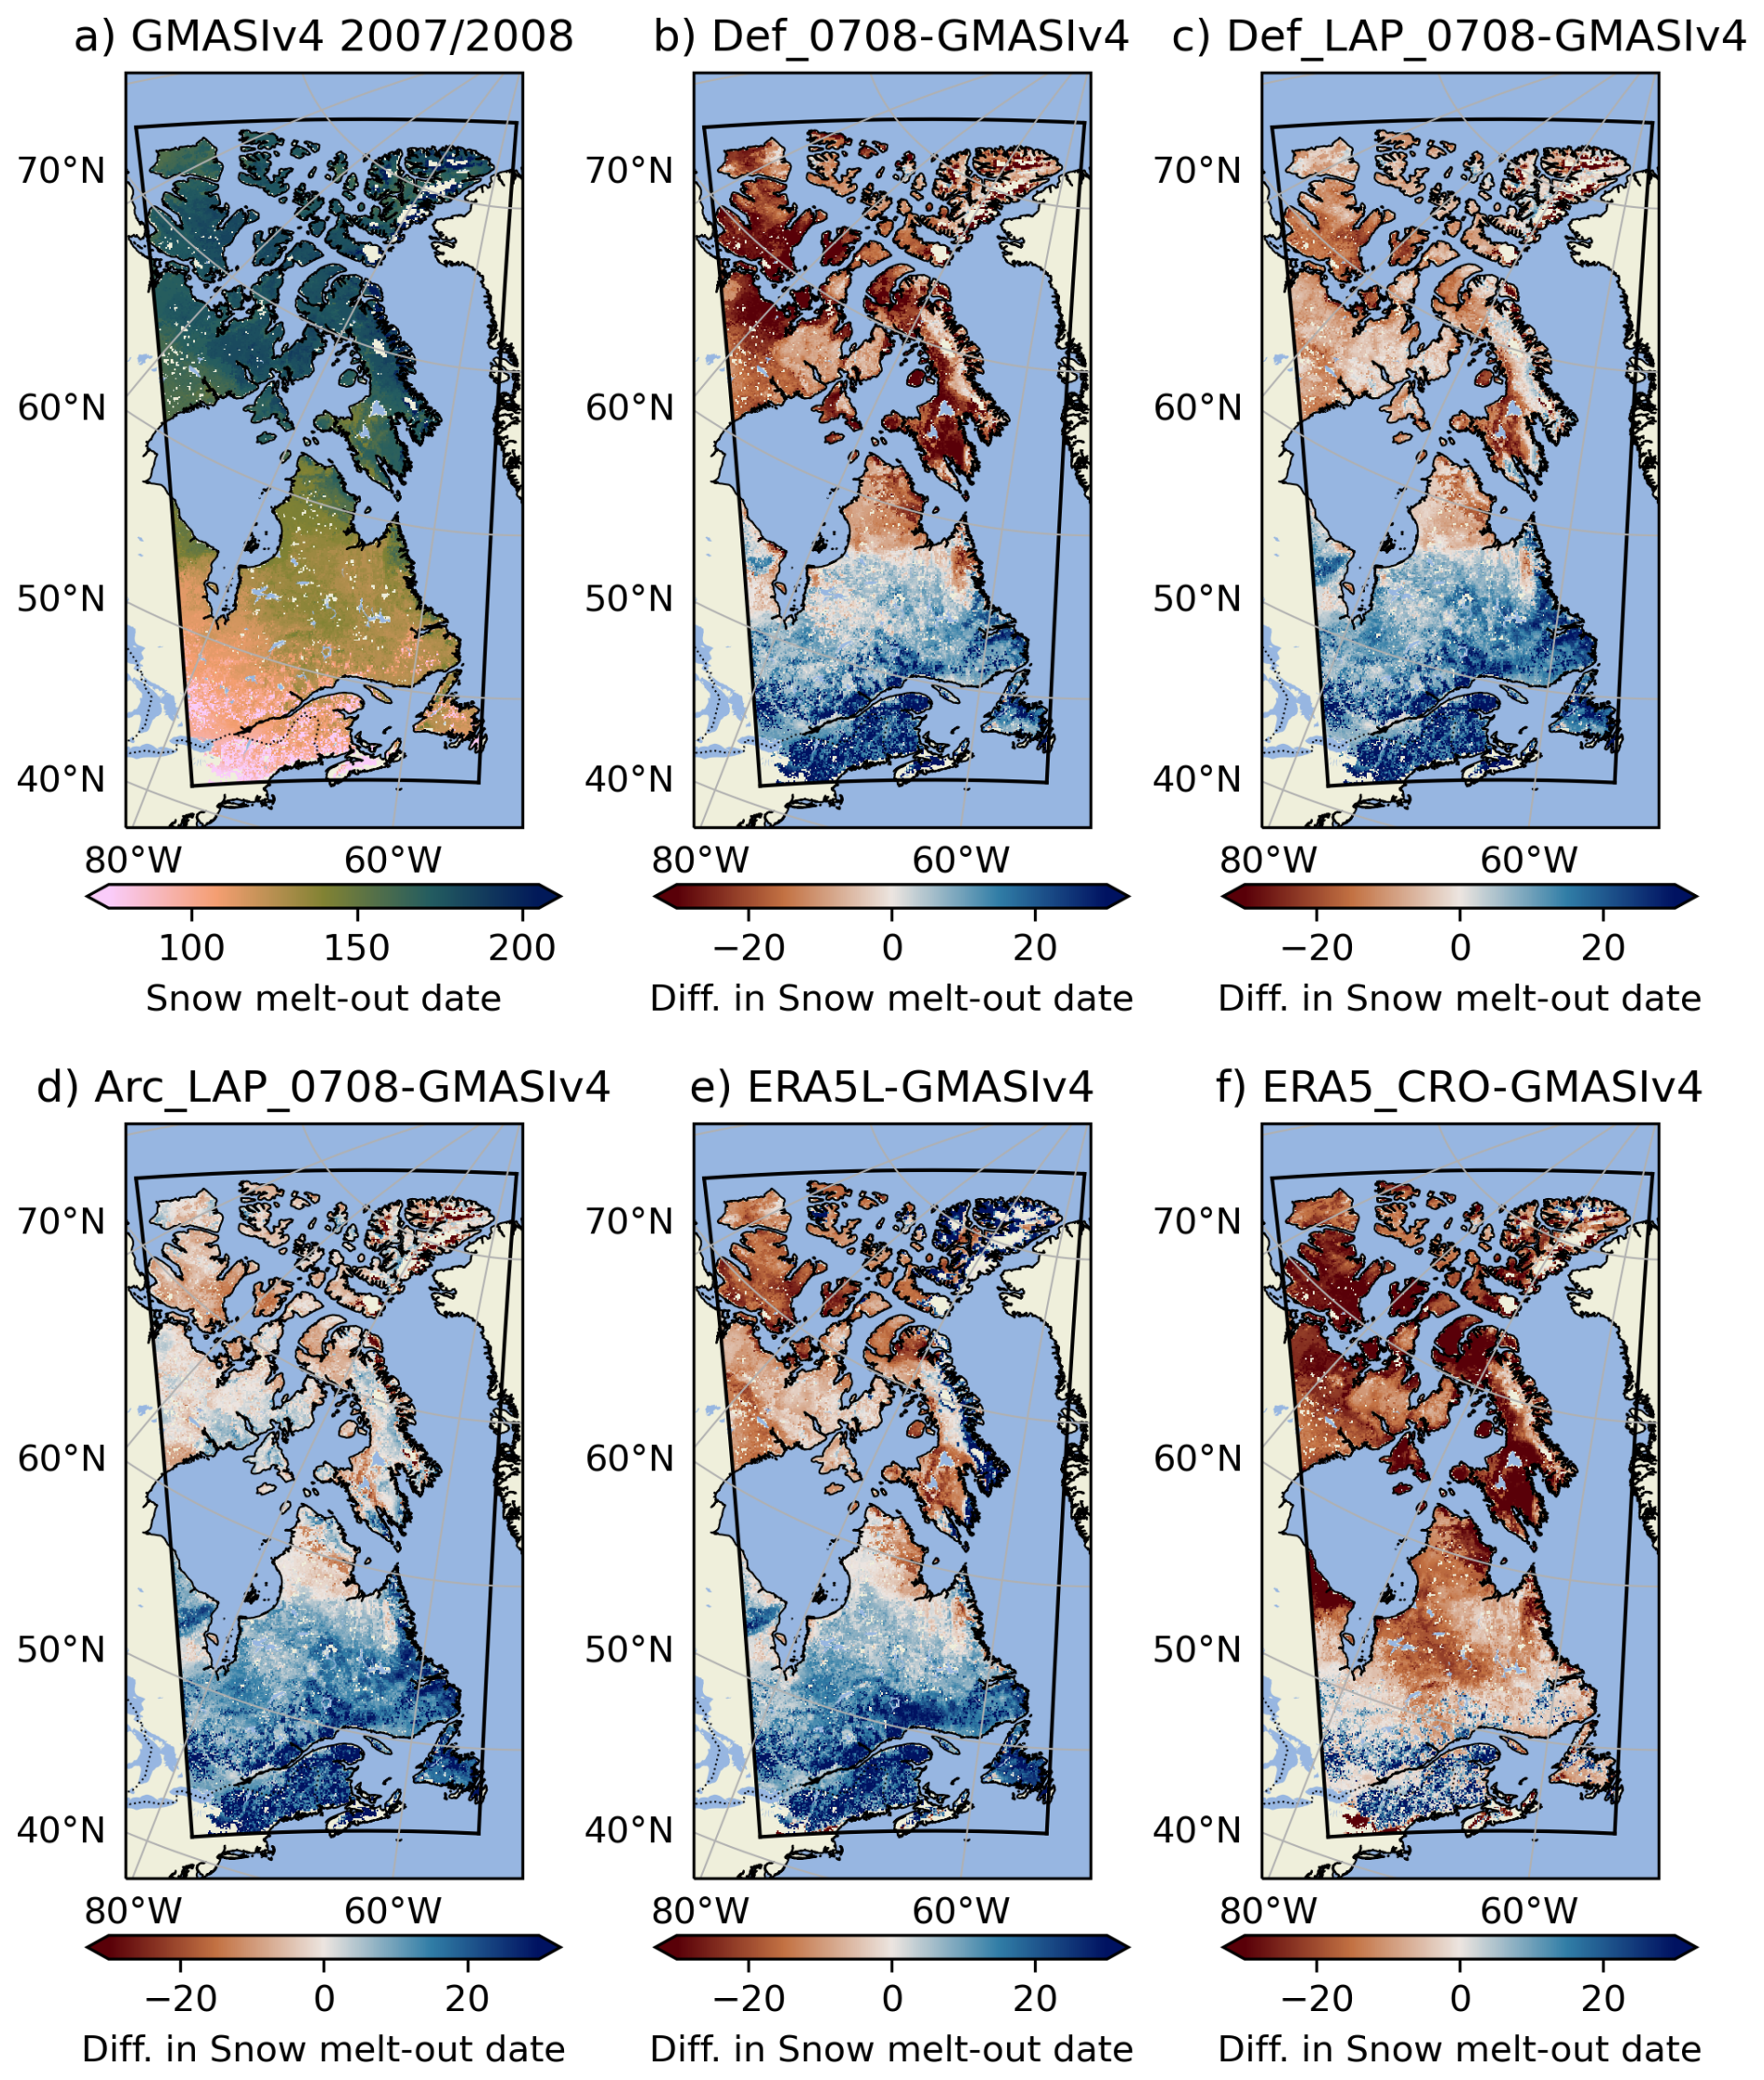
Figure 9(a) Snow melt-out date derived from the GMASI product for winter 2007/2008; (b) Difference of snow melt-out date between the Def configuration of SVS2/Crocus and GMASI; (c) Same as (b) for the DefLAP configuration of SVS2/Crocus, (d) Same as (b) for the ArcLAP configuration of SVS2/Crocus; (e) Same as (b) for ERA5L and (f) Same as (b) for ERA5_CRO. Results over Greenland are not shown since Greenland was masked out from the simulation domain.
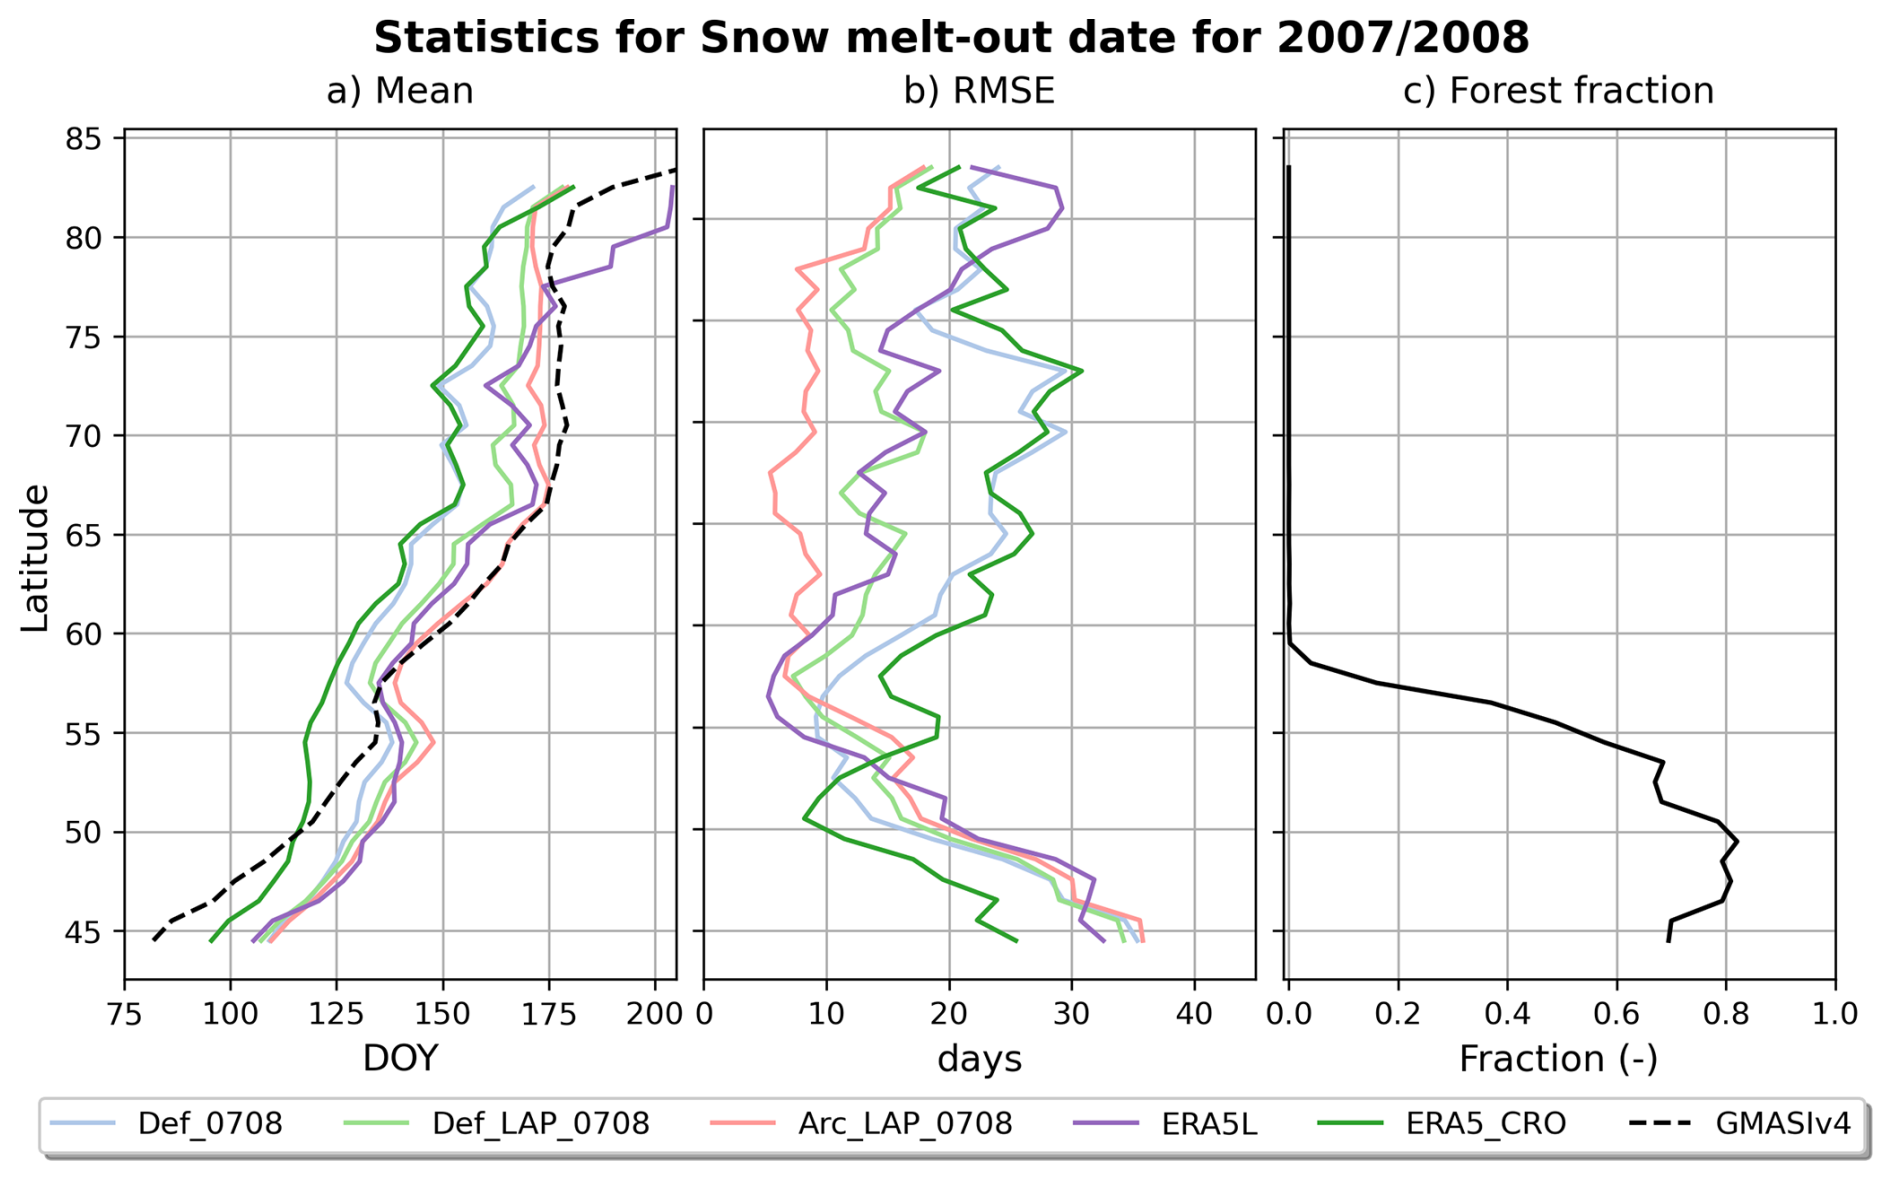
Figure 10(a) Mean snow melt-out data as a function of latitude for different snow products; (b) Mean RMSE as a function of latitude computed using GMASI as the reference and (c) forest fraction as a function of latitude. Points fully covered by water, lake and/or glaciers were removed from the analysis.
4.2.3 Simulation of snow-melt out date
Figure 9a shows the SMOD map derived from GMASI for winter 2007/2008 and Fig. 10a shows how it evolves on average with latitude. SMOD derived from GMASI ranges between 20 March-10 April (Day Of the Year, DOY, 80–100) in the southern part of the domain (south of 47° N) and the average SMOD increases continuously with latitude (Fig. 10a). Above 66° N, the average SMOD exceeds DOY 175 (24 June). Below 55° N, where the fraction of forested pixels is larger than 0.5 (Fig. 10c), the three SVS2/Crocus simulations (Fig. 9b to d) and the ERA5-Land product (ERA5L, Fig. 9e) provide similar results and overestimate the SMOD compared to GMASI. Overestimation can be explained by an underestimation of SMOD by GMASI in this region due to limitations in GMASI for detection of snow on the ground in the boreal forest as explained by Romanov (2016). Below 55° N, ERA5-Crocus (Fig. 9f) simulates a significantly lower SMOD than the SVS2/Crocus experiments and ERA5-Land (Fig. 10a). Lower SMOD is associated with the configuration of SURFEX/Crocus used in ERA5-Crocus dataset (Ramos Buarque et al., 2025) that only simulates snow in open terrain. In contrast, both SVS2 and ERA5-Land simulate snow accumulation beneath high vegetation, which tends to prolong snow cover duration in forested areas relative to adjacent open terrain under the cold climatic conditions of the boreal forest in Eastern Canada (Lundquist et al., 2013). For these reasons (limitations of GMASI in forested terrain and differences in representation of forest between the snow products), quantitative evaluation of the SMOD is only carried out above 55° N where the fraction of forested pixels is lower than 0.5 (Fig. 10c).
Table 4Error metrics (Bias and RMSE in days) compared to GMASI for the SMOD simulations above 55° N for each SVS2/Crocus configuration and for two benchmarks products (ERA5L and ERA5_CRO) for winter 2007/2008 and winter 2015/2016.
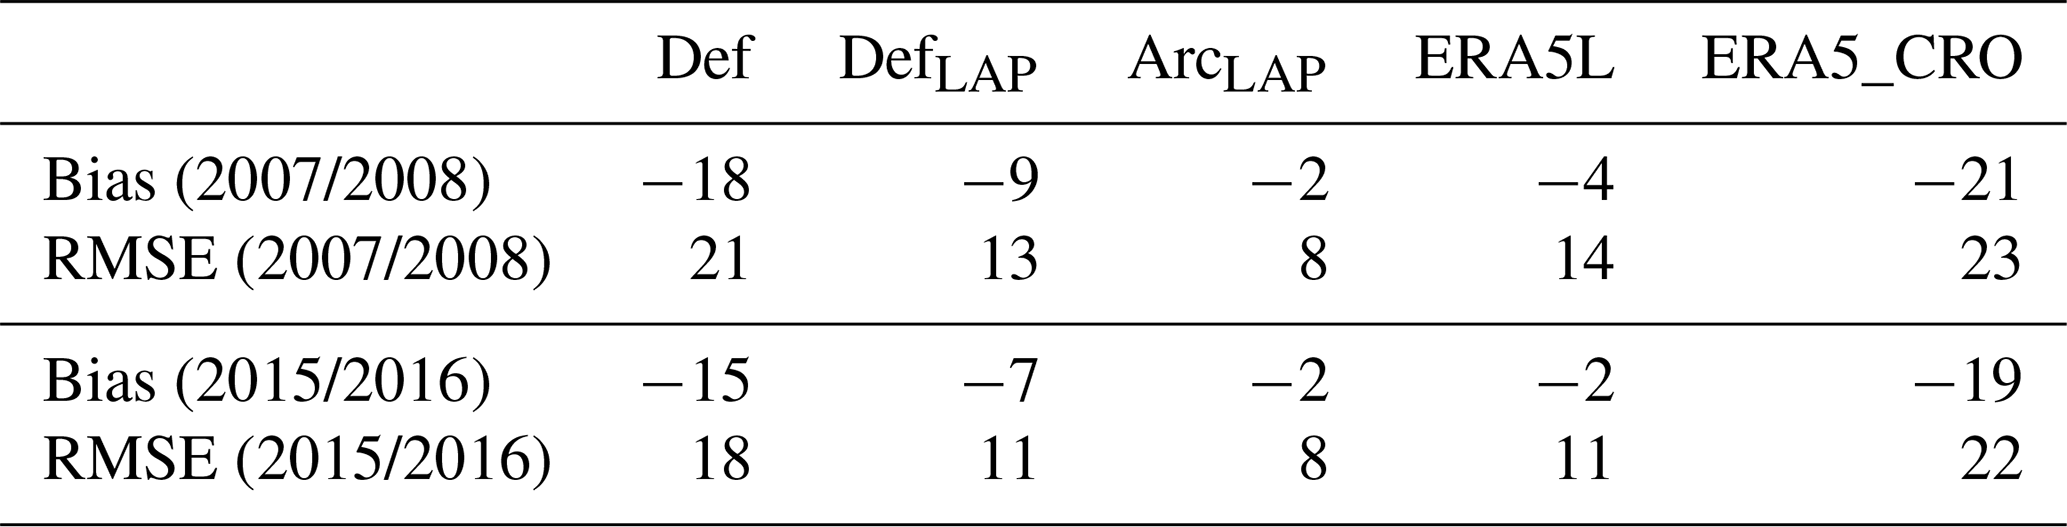
For the SMOD evaluation, mean error metrics (bias and RMSE) compared to GMASI above 55° N were obtained for each model experiment by computing average of the SMOD values by 1° latitude bands (Fig. 10b) weighted by the number of valid grid points withing each band. Results are summarized in Table 4. Above 55° N, the default configuration of SVS2/Crocus (Def) presents a systematic underestimation of the SMOD, meaning that simulated snow cover disappears too early in this configuration (average bias of −18 d above 55° N). ERA5_CRO, which uses the same configuration of Crocus as Def, also presents a strong underestimation (average bias of −21 d above 55° N). Def and ERA5_CRO present similar spatial patterns of SMOD differences with GMASI, with a strong SMOD underestimation found on the western part of Baffin Island and on the southern part of Victoria Island (Fig. 9b and 9e). Therefore, the same Crocus configurations, implemented in two land surface schemes (SVS2 and SURFEX), driven by identical meteorological forcing and run independently, produced highly consistent results in open terrain. This supports the local-scale technical validation of Crocus within SVS2 previously conducted by the authors and highlights the model's low sensitivity to the underlying soil–vegetation scheme and associated databases in open terrain for integrated diagnostics.
The revised albedo parameterization in configuration DefLAP led to a later snow disappearance than Def and strongly improved the performance when compared to GMASI: reduction of 50 % in the negative bias (Fig. 10a) and reduction of 38 % in the RMSE above 55° N (Fig. 10b) compared to Def. Above 55° N, DefLAP uses values of the snow darkening coefficient, γ, larger than 150 d corresponding to an area of low deposition of LAP on snow (Fig. S5b). These values of the snow darkening coefficient are larger than the default value of 60 d used in Def leading to slower rates of decrease of snow albedo in the visible range. Gaillard et al. (2025) has shown how larger values of γ improved simulations of snow albedo in the Canadian Arctic. The results presented in Figs. 9 and 10 show how improvements in the simulation of snow albedo translate into improvements of simulated snow melt dynamics and the associated SMOD. Future enhancements to the SVS2 albedo scheme should consider how Arctic shrubs modify winter surface albedo (Belke-Brea et al., 2020) and alter solar radiation transmission within the snowpack (Domine et al., 2025).
The Arctic configuration of SVS2/Crocus (ArcLAP) further improved the SMOD simulations. Compared to Def (DefLAP) above 55° N, it reduced the negative bias in SMOD by 88 % (78 %) (Table 4 and Fig. 10a) and improved the RMSE by 62 % (38 %) (Table 4 and Fig. 10b). The differences compared to DefLAP were explained by a larger peak SWE above treeline in the Arctic in ArcLAP compared to DefLAP as shown in Fig. 11. Larger peak SWE led to a later snow disappearance in ArcLAP than DefLAP, which improved estimation of SMOD compared to GMASI. The larger peak SWE was associated with lower mass loss due to blowing snow sublimation in ArcLAP caused by denser surface snow (Fig. 6) reducing the occurrence of blowing snow events simulated by SVS2/Crocus. These results illustrate how improvements in simulation of snowpack internal properties can translate into improvements in simulation of the snowpack seasonal evolution. Results for winter 2015/2016 show similar improvements with the Arctic configuration (Table 4 and Figs. S7 and S8).
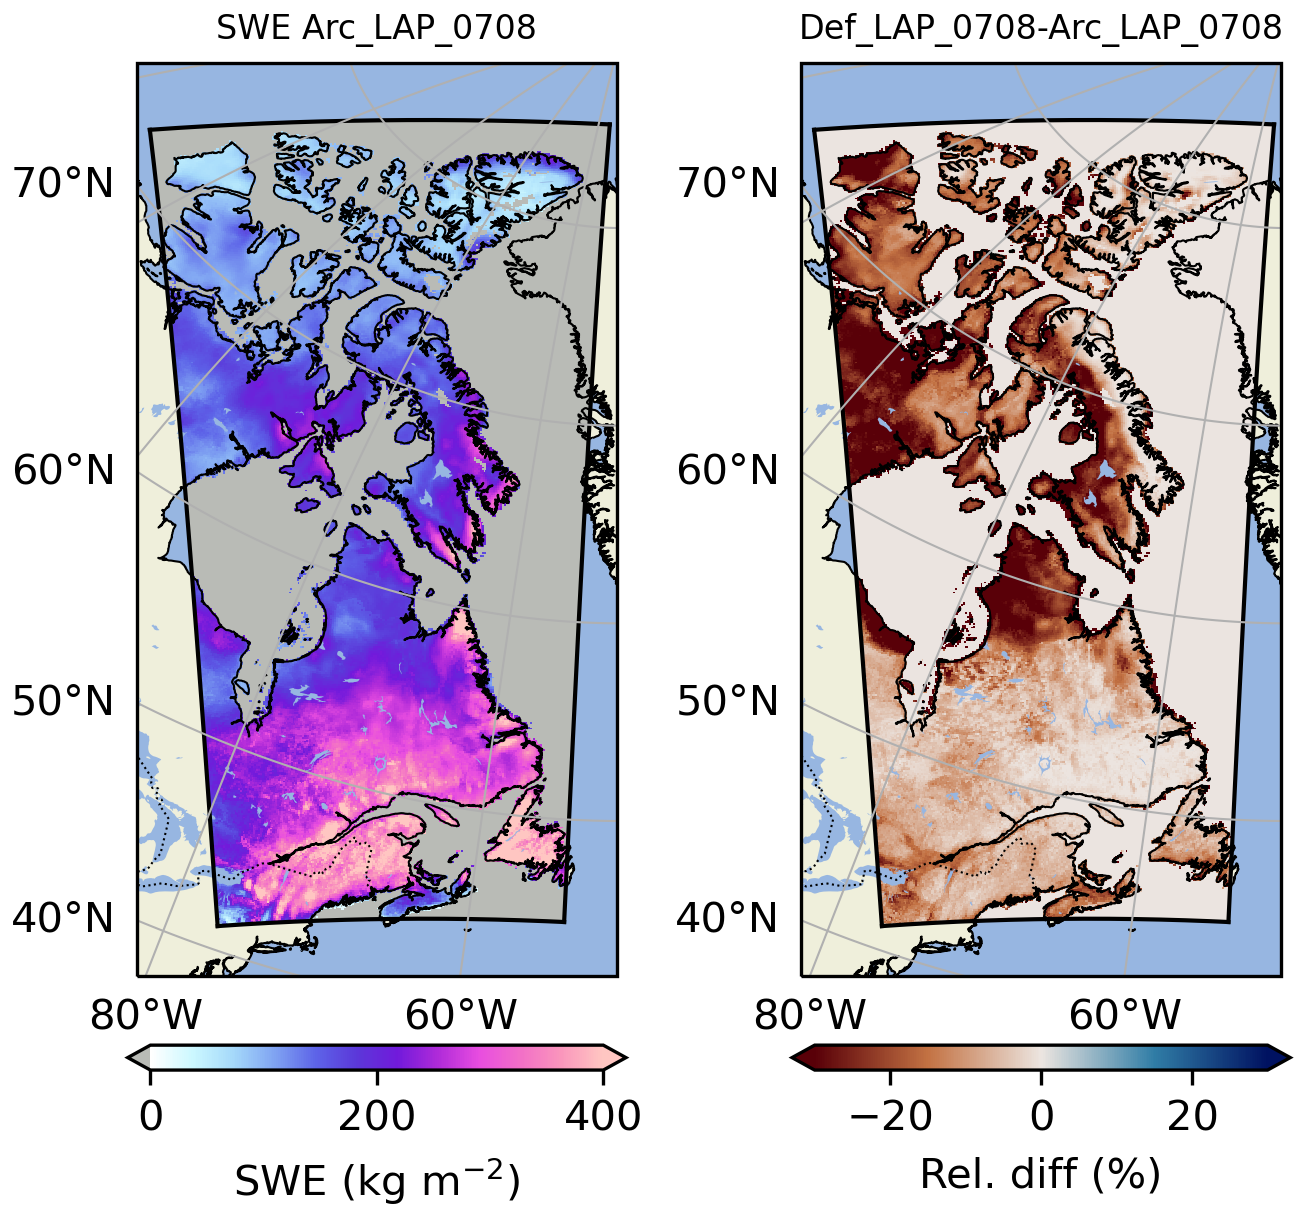
Figure 11(Left) Maximum SWE for winter 2007/2008 simulated by experiment ArcLAP, (Right) Relative difference of maximum SWE between experiments DefLAP and ArcLAP
The configuration ArcLAP strongly improved SMOD simulations compared to two benchmarks products. RMSE was reduced by 41 % (24 %) in 2007/2008 (2015/2016) compared to ERA5L and 64 % (62 %) when compared to ERA5_CRO (Table 4). Mudryk et al. (2024) identified ERA5L and ERA5_CRO as the two top performing products for SWE climatology, variability, and trends in the Northern Hemisphere across mountain and non-mountain regions. Results presented here suggest that ERA5_CRO product could be further improved by including updated parameterizations developed in SVS2/Crocus (revised albedo scheme and new options for the Arctic snowpack). This will be easily achieved in the near future using the externalized version of Crocus that allows efficient sharing of code development between the different LSMs.
This paper presents the Soil Vegetation and Snow version 2.0 (SVS2) land surface scheme, a major upgrade to the existing SVS model (Husain et al., 2016; Alavi et al., 2016; Leonardini et al., 2021) with significant enhancements to snowpack-related processes. SVS2 integrates the externalized version of the Crocus detailed snowpack scheme (Brun et al., 1992; Vionnet et al., 2012; Lafaysse et al., 2017). Within each grid cell, SVS2 distinguishes between snow in open terrain and forested environments (if present) and simulates the snow cover and its internal properties (including snow microstructure) separately. The forested areas simulations benefit from a new canopy module in SVS2. Several innovations were also introduced in SVS2/Crocus: a revised snow albedo parameterization incorporating local climatology of LAP deposition (Gaillard et al., 2025) and new parameterizations for Arctic snowpack properties (Woolley et al., 2024).
Point-scale evaluation at Snow Crested Butte (Colorado, USA) demonstrated SVS2 capability to accurately simulate bulk snowpack properties in both forested terrain and adjacent clearings. Distributed simulations across a latitudinal transect in Eastern Canada showed that Arctic modifications of Royer et al. (2021b) and Woolley et al. (2024) substantially improved near-surface density simulations. The revised albedo scheme, combined with the Arctic configuration, reduced errors in snow melt-out date predictions by more than 50 % for winters 2007/2008 and 2015/2016 compared to the default model version, outperforming two reference products ERA5-Land (Muñoz-Sabater et al., 2021) and ERA5-Crocus (Ramos Buarque et al., 2025). However, simulations of basal layer density in the Arctic showed no quantitative improvement, suggesting the need to incorporate vapor transfer processes (Domine et al., 2019). Low model performances were also found for the specific surface area of basal snow layers.
SVS2/Crocus has demonstrated versatility across diverse snow environments (Vionnet et al., 2022; Leroux et al., 2023; Woolley et al., 2024; Gaillard et al., 2025; Meloche et al., 2024; Woolley et al., 2025). In preparation for the Terrestrial Snow Mass Mission (Derksen et al., 2021), current development efforts focus on coupling SVS2/Crocus with the Snow Microwave Radiative Transfer Model (SMRT, Picard et al., 2018; Meloche et al., 2024), the Multiple Snow Data Assimilation system (Alonso-González et al., 2022) and the Canadian Land Data Assimilation System (Carrera et al., 2015). Future developments will address several key areas: revision of the snow metamorphism scheme to improve simulations of SSA and backscatter when coupled to SMRT; implementation of water vapor flux parameterization in collaboration with the IVORI project (Brondex et al., 2023); and enhancement of the wind-packing parameterization (Walter et al., 2024). These modifications aim to establish a unified model configuration applicable across broad geographic regions, enhancing the scalability of Crocus for large-scale applications within SVS2 and other land surface models. Additionally, optimization of the maximum snow layer count will facilitate integration into operational land surface and river prediction systems (e.g., Durnford et al., 2021).
The SVS 2.0 code used for the point scale applications at Snow Crested Butte is available in a permanent repository: https://doi.org/10.5281/zenodo.14859640 (Vionnet et al., 2025a). The SVS 1.0 code is also available in this repository. The SVS 2.0 code used for the distributed simulations presented in this paper is available from https://doi.org/10.5281/zenodo.16740463 (Vionnet et al., 2025b). Scripts and data to produce the figures in this paper as well as SVS 1.0 and SVS 2.0 configurations files are available from https://doi.org/10.5281/zenodo.16760830 (Vionnet et al., 2025c). This repository also contains the observations used to evaluate the distributed snowpack simulations (snow pit data and GMASI snow cover data). ERA5 atmospheric forcing have been obtained from https://doi.org/10.24381/cds.adbb2d47 (Copernicus Climate Change Service, 2023b) and https://doi.org/10.24381/cds.143582cf (Copernicus Climate Change Service, 2023a) as detailed in Vionnet et al. (2025c). The other freely-available datasets used in this work are: ERA5-Land data: https://doi.org/10.24381/cds.e2161bac (Copernicus Climate Change Service, 2019), ERA5/Crocus dataset: https://doi.org/10.5281/zenodo.10943718 (Decharme and Barbu, 2024), Global map of snow darkening coefficient for the snowpack model Crocus (Gaillard et al., 2024): https://doi.org/10.5281/zenodo.14194990 (Gaillard et al., 2024), Snow Crested Butte dataset: https://doi.org/10.5281/zenodo.6618553 (Bonner et al., 2022c).
The supplement related to this article is available online at https://doi.org/10.5194/gmd-18-9119-2025-supplement.
VV led the development of SVS2, implemented the externalized version of Crocus into SVS2 and ran and evaluated the distributed simulations presented in this paper. NL, VV and GM developed the canopy module in SVS2. NL ran the point-scale simulations at Snow Crested Butte and led the evaluation at this site. MA provided guidance on the SVS scheme and implemented SVS2 in the official physics of the GEM model. MG developed the revised albedo parameterization in SVS2/Crocus. NG developed the solver for soil temperature in SVS2 under the guidance of SB. AR, CD and FD provided the evaluation dataset for density and SSA. GW, NR and AR developed the Arctic configuration of Crocus. ML provided continuous guidance on the externalized version of Crocus. VF, CD and SB provided guidance during all the steps of model development. VV and NL drafted the manuscript and all authors participated in reviewing and editing the paper.
The contact author has declared that none of the authors has any competing interests.
Publisher's note: Copernicus Publications remains neutral with regard to jurisdictional claims made in the text, published maps, institutional affiliations, or any other geographical representation in this paper. While Copernicus Publications makes every effort to include appropriate place names, the final responsibility lies with the authors. Views expressed in the text are those of the authors and do not necessarily reflect the views of the publisher.
The authors would like to thank Vanh Souvanlasy (ECCC) for his help with the preparation of the dataset of high vegetation density. AI tools were used in the preparation of this manuscript for revising text for flow and grammar.
This paper was edited by Dalei Hao and reviewed by two anonymous referees.
Alavi, N., Bélair, S., Fortin, V., Zhang, S., Husain, S. Z., Carrera, M. L., and Abrahamowicz, M.: Warm season evaluation of soil moisture prediction in the Soil, Vegetation, and Snow (SVS) scheme, J. Hydrometeorol., 17, 2315–2332, https://doi.org/10.1175/JHM-D-15-0189.1, 2016. a, b, c
Alonso-González, E., Aalstad, K., Baba, M. W., Revuelto, J., López-Moreno, J. I., Fiddes, J., Essery, R., and Gascoin, S.: The Multiple Snow Data Assimilation System (MuSA v1.0), Geosci. Model Dev., 15, 9127–9155, https://doi.org/10.5194/gmd-15-9127-2022, 2022. a
Andreadis, K. M., Storck, P., and Lettenmaier, D. P.: Modeling snow accumulation and ablation processes in forested environments, Water Resources Research, 45, W05429, https://doi.org/10.1029/2008WR007042, 2009. a, b
Arduini, G., Balsamo, G., Dutra, E., Day, J. J., Sandu, I., Boussetta, S., and Haiden, T.: Impact of a multi-layer snow scheme on near-surface weather forecasts, Journal of Advances in Modeling Earth Systems, 11, 4687–4710, 2019. a, b, c
Armstrong, R. and Brun, E.: Snow and climate: physical processes, surface energy exchange and modeling, Cambridge Univ Press, ISBN 9780521130653, 2008. a, b
Aygün, O., Kinnard, C., Campeau, S., and Pomeroy, J. W.: Landscape and climate conditions influence the hydrological sensitivity to climate change in eastern Canada, Journal of Hydrology, 615, 128595, https://doi.org/10.1016/j.jhydrol.2022.128595, 2022. a
Baron, M.: Modélisation des régimes thermiques du sol dans les milieux ouverts d'altitude des Alpes françaises: influence du transport de neige par le vent et de la végétation, PhD thesis, Université Grenoble Alpes (2020–…), 2023. a, b
Barrere, M., Domine, F., Decharme, B., Morin, S., Vionnet, V., and Lafaysse, M.: Evaluating the performance of coupled snow–soil models in SURFEXv8 to simulate the permafrost thermal regime at a high Arctic site, Geosci. Model Dev., 10, 3461–3479, https://doi.org/10.5194/gmd-10-3461-2017, 2017. a, b, c, d, e, f
Bartelt, P. and Lehning, M.: A physical SNOWPACK model for the Swiss avalanche warning:: Part : numerical model, Cold Regions Science and Technology, 35, 123–145, 2002. a
Bartlett, P. A., MacKay, M. D., and Verseghy, D. L.: Modified snow algorithms in the Canadian land surface scheme: Model runs and sensitivity analysis at three boreal forest stands, Atmosphere-Ocean, 44, 207–222, 2006. a
Bélair, S., Brown, R., Mailhot, J., Bilodeau, B., and Crevier, L.-P.: Operational implementation of the ISBA land surface scheme in the Canadian regional weather forecast model. Part II: Cold season results, Journal of Hydrometeorology, 4, 371–386, 2003. a
Beljaars, A. and Holtslag, A.: Flux parameterization over land surfaces for atmospheric models, J. Appl. Meteorol., 30, 327–341, 1991. a, b
Belke-Brea, M., Domine, F., Barrere, M., Picard, G., and Arnaud, L.: Impact of shrubs on winter surface albedo and snow specific surface area at a low Arctic site: In situ measurements and simulations, Journal of Climate, 33, 597–609, 2020. a, b
Bernier, N. B., Bélair, S., Bilodeau, B., and Tong, L.: Near-surface and land surface forecast system of the Vancouver 2010 Winter Olympic and Paralympic Games, J. Hydrometeorol., 12, 508–530, https://doi.org/10.1175/2011JHM1250.1, 2011. a, b
Blyth, E. M., Arora, V. K., Clark, D. B., Dadson, S. J., De Kauwe, M. G., Lawrence, D. M., Melton, J. R., Pongratz, J., Turton, R. H., Yoshimura, K. and Yuan, H.: Advances in land surface modelling, Current Climate Change Reports, 7, 45–71, 2021. a
Bonner, H. M., Raleigh, M. S., and Small, E. E.: Isolating forest process effects on modelled snowpack density and snow water equivalent, Hydrological Processes, 36, e14475, https://doi.org/10.1002/hyp.14475, 2022a. a
Bonner, H. M., Smyth, E., Raleigh, M. S., and Small, E. E.: A meteorology and snow data set from adjacent forested and meadow sites at Crested Butte, CO, USA, Water Resources Research, 58, e2022WR033006, https://doi.org/10.1029/2022WR033006, 2022b. a, b, c
Bonner, H. M., Smyth, E., Raleigh, M. S., and Small, E. E.: A meteorology and snow dataset from adjacent forested and meadow sites at Crested Butte, CO, USA, Zenodo [data set], https://doi.org/10.5281/zenodo.6618553, 2022c. a
Boone, A. and Etchevers, P.: An intercomparison of three snow schemes of varying complexity coupled to the same land surface model: local-scale evaluation at an Alpine site, J. Hydrometeorol., 2, 374–394, 2001. a, b, c
Boone, A., Masson, V., Meyers, T., and Noilhan, J.: The influence of the inclusion of soil freezing on simulations by a soil–vegetation–atmosphere transfer scheme, J. Appl. Meteorol., 39, 1544–1569, https://doi.org/10.1175/1520-0450(2000)039<1544:TIOTIO>2.0.CO;2, 2000. a, b
Boone, A., Samuelsson, P., Gollvik, S., Napoly, A., Jarlan, L., Brun, E., and Decharme, B.: The interactions between soil–biosphere–atmosphere land surface model with a multi-energy balance (ISBA-MEB) option in SURFEXv8 – Part 1: Model description, Geosci. Model Dev., 10, 843–872, https://doi.org/10.5194/gmd-10-843-2017, 2017. a, b, c, d, e
Bouchard, B., Nadeau, D. F., and Domine, F.: Comparison of snowpack structure in gaps and under the canopy in a humid boreal forest, Hydrological Processes, 36, e14681, https://doi.org/10.1002/hyp.14681, 2022. a
Bouchard, B., Nadeau, D. F., Domine, F., Wever, N., Michel, A., Lehning, M., and Isabelle, P.-E.: Impact of intercepted and sub-canopy snow microstructure on snowpack response to rain-on-snow events under a boreal canopy, The Cryosphere, 18, 2783–2807, https://doi.org/10.5194/tc-18-2783-2024, 2024. a, b, c
Boussetta, S., Balsamo, G., Arduini, G., Dutra, E., McNorton, J., Choulga, M., Agustí-Panareda, A., Beljaars, A., Wedi, N., Munõz-Sabater, J., de Rosnay, P., Sandu I., Hadade, I., Carver., G., Mazzetti, C., Prudhomme, C., Yamazaki, D. and Zsoter, E.: ECLand: The ECMWF land surface modelling system, Atmosphere, 12, 723, https://doi.org/10.3390/atmos12060723, 2021. a, b
Brondex, J., Fourteau, K., Dumont, M., Hagenmuller, P., Calonne, N., Tuzet, F., and Löwe, H.: A finite-element framework to explore the numerical solution of the coupled problem of heat conduction, water vapor diffusion, and settlement in dry snow (IvoriFEM v0.1.0), Geosci. Model Dev., 16, 7075–7106, https://doi.org/10.5194/gmd-16-7075-2023, 2023. a
Brun, E., David, P., Sudul, M., and Brunot, G.: A numerical model to simulate snow cover stratigraphy for operational avalanche forecasting, J. Glaciol., 38, 13–22, https://doi.org/10.1017/S0022143000009552, 1992. a, b, c, d, e, f, g, h, i, j, k, l, m
Brun, E., Martin, E., and Spiridonov, V.: Coupling a multi-layered snow model with a GCM, Ann. Glaciol., 25, 66–72, 1997. a
Brun, E., Six, D., Picard, G., Vionnet, V., Arnaud, L., Bazile, E., Boone, A., Bouchard, A., Genthon, C., Guidard, V., Le Moigne, P., Rabier, F., and Seity, Y.: Snow/atmosphere coupled simulation at Dome C, Antarctica, J. Glaciol., 52, 721–736, 2011. a
Brun, E., Vionnet, V., Boone, A., Decharme, B., Peings, Y., Valette, R., Karbou, F., and Morin, S.: Simulation of northern Eurasian local snow depth, mass, and density using a detailed snowpack model and meteorological reanalyses, Journal of Hydrometeorology, 14, 203–219, 2013. a, b, c
Calonne, N., Flin, F., Morin, S., Lesaffre, B., du Roscoat, S. R., and Geindreau, C.: Numerical and experimental investigations of the effective thermal conductivity of snow, Geophysical research letters, 38, L23501, https://doi.org/10.1029/2011GL049234, 2011. a
Carmagnola, C. M., Morin, S., Lafaysse, M., Domine, F., Lesaffre, B., Lejeune, Y., Picard, G., and Arnaud, L.: Implementation and evaluation of prognostic representations of the optical diameter of snow in the SURFEX/ISBA-Crocus detailed snowpack model, The Cryosphere, 8, 417–437, https://doi.org/10.5194/tc-8-417-2014, 2014. a, b, c, d
Carrera, M. L., Bélair, S., and Bilodeau, B.: The Canadian land data assimilation system (CaLDAS): Description and synthetic evaluation study, Journal of Hydrometeorology, 16, 1293–1314, 2015. a
Comola, F., Kok, J. F., Gaume, J., Paterna, E., and Lehning, M.: Fragmentation of wind-blown snow crystals, Geophysical Research Letters, 44, 4195–4203, 2017. a
Copernicus Climate Change Service (C3S): ERA5-Land hourly data from 1950 to present, Copernicus Climate Change Service (C3S) Climate Data Store (CDS) [data set], https://doi.org/10.24381/cds.e2161bac, 2019. a
Copernicus Climate Change Service (C3S): Complete ERA5 global atmospheric reanalysis, Copernicus Climate Change Service (C3S) Climate Data Store (CDS) [data set], https://doi.org/10.24381/cds.143582cf, 2023a. a
Copernicus Climate Change Service: ERA5 hourly data on single levels from 1940 to present, Copernicus Climate Change Service (C3S) Climate Data Store (CDS) [data set], https://doi.org/10.24381/cds.adbb2d47, 2023b. a
Cristea, N. C., Bennett, A., Nijssen, B., and Lundquist, J. D.: When and where are multiple snow layers important for simulations of snow accumulation and melt?, Water Resources Research, 58, e2020WR028993, https://doi.org/10.1029/2020WR028993, 2022. a
Deardorff, J. W.: Efficient prediction of ground surface temperature and moisture, with inclusion of a layer of vegetation, Journal of Geophysical Research-Oceans, 83, 1889–1903, 1978. a
Decharme, B., and Barbu, A.: Crocus-ERA5 daily snow product over the Northern Hemisphere at 0.25° resolution, Zenodo [data set], https://doi.org/10.5281/zenodo.10943718, 2024. a, b
Decharme, B., Boone, A., Delire, C., and Noilhan, J.: Local evaluation of the Interaction between Soil Biosphere Atmosphere soil multilayer diffusion scheme using four pedotransfer functions, Journal of Geophysical Research-Atmospheres, 116, D20126, https://doi.org/10.1029/2011JD016002, 2011. a
Decharme, B., Brun, E., Boone, A., Delire, C., Le Moigne, P., and Morin, S.: Impacts of snow and organic soils parameterization on northern Eurasian soil temperature profiles simulated by the ISBA land surface model, The Cryosphere, 10, 853–877, https://doi.org/10.5194/tc-10-853-2016, 2016. a
Delage, Y. and Girard, C.: Stability functions correct at the free convection limit and consistent for for both the surface and Ekman layers, Boundary-Layer Meteorology, 58, 19–31, 1992. a, b
Derksen, C., King, J., Belair, S., Garnaud, C., Vionnet, V., Fortin, V., Lemmetyinen, J., Crevier, Y., Plourde, P., Lawrence, B., van Mierlo, H., Burbidge. G. and Siqueira, P.: Development of the terrestrial snow mass mission, in: 2021 IEEE International Geoscience and Remote Sensing Symposium IGARSS, 614–617, https://doi.org/10.1109/IGARSS47720.2021.9553496, 2021. a, b, c, d
Dickinson, R. E.: Modeling evapotranspiration for three-dimensional global climate models, Climate Processes and Climate Sensitivity, 29, 58–72, 1984. a
Domine, F., Salvatori, R., Legagneux, L., Salzano, R., Fily, M., and Casacchia, R.: Correlation between the specific surface area and the short wave infrared (SWIR) reflectance of snow, Cold Regions Science and Technology, 46, 60–68, 2006. a
Domine, F., Barrere, M., and Morin, S.: The growth of shrubs on high Arctic tundra at Bylot Island: impact on snow physical properties and permafrost thermal regime, Biogeosciences, 13, 6471–6486, https://doi.org/10.5194/bg-13-6471-2016, 2016a. a, b, c, d
Domine, F., Barrere, M., and Sarrazin, D.: Seasonal evolution of the effective thermal conductivity of the snow and the soil in high Arctic herb tundra at Bylot Island, Canada, The Cryosphere, 10, 2573–2588, https://doi.org/10.5194/tc-10-2573-2016, 2016b. a, b
Domine, F., Belke-Brea, M., Sarrazin, D., Arnaud, L., Barrere, M., and Poirier, M.: Soil moisture, wind speed and depth hoar formation in the Arctic snowpack, Journal of Glaciology, 64, 990–1002, 2018. a, b, c
Domine, F., Picard, G., Morin, S., Barrere, M., Madore, J.-B., and Langlois, A.: Major issues in simulating some Arctic snowpack properties using current detailed snow physics models: Consequences for the thermal regime and water budget of permafrost, Journal of Advances in Modeling Earth Systems, 11, 34–44, 2019. a, b, c, d, e, f
Domine, F., Quémener, M., Bégin, L., Bouchard, B., Dionne, V., Jerczynski, S., Larouche, R., Lévesque-Desrosiers, F., Philibert, S.-O., Vigneault, M.-A., Picard, G., and Côté, D. C.: Impact of shrub branches on the shortwave vertical irradiance profile in snow, The Cryosphere, 19, 1757–1774, https://doi.org/10.5194/tc-19-1757-2025, 2025. a, b
Douville, H., Royer, J.-F., and Mahfouf, J.-.: A new snow parameterization for the Meteo France climate model. Part 1: Validation in stand-alone experiments, Climate Dynamics, 12, 449–466, 1995. a
Durand, Y., Brun, E., Mérindol, L., Guyomarc'h, G., Lesaffre, B., and Martin, E.: A meteorological estimation of relevant parameters for snow models, Ann. Glaciol., 18, 65–71, https://doi.org/10.3189/S0260305500011277, 1993. a
Durnford, D., Fortin, V., Smith, G., Carrera, M., Deacu, D., Dupont, F., Gaborit, E., Gauthier, N., Garnaud, C., Vionnet, V., Shin, Y. L., Lespinas, F., Bekcic, B. and Keita, S.: Hydrological prediction systems at environment and climate change Canada, in: 101st American Meteorological Society Annual Meeting, AMS, 10183559, https://ams.confex.com/data/abstract/ams/101ANNUAL/Paper_383559_abstract_31107_0.pdf (last access: 24 November 2025), 2021. a, b
Elshamy, M. E., Princz, D., Sapriza-Azuri, G., Abdelhamed, M. S., Pietroniro, A., Wheater, H. S., and Razavi, S.: On the configuration and initialization of a large-scale hydrological land surface model to represent permafrost, Hydrol. Earth Syst. Sci., 24, 349–379, https://doi.org/10.5194/hess-24-349-2020, 2020. a
Erbs, D., Klein, S., and Duffie, J.: Estimation of the diffuse radiation fraction for hourly, daily and monthly-average global radiation, Solar Energy, 28, 293–302, 1982. a
Essery, R., Pomeroy, J., Parviainen, J., and Storck, P.: Sublimation of snow from coniferous forests in a climate model, Journal of Climate, 16, 1855–1864, 2003. a, b
Essery, R., Pomeroy, J., Ellis, C., and Link, T.: Modelling longwave radiation to snow beneath forest canopies using hemispherical photography or linear regression, Hydrological Processes: An International Journal, 22, 2788–2800, 2008. a, b
Essery, R., Morin, S., Lejeune, Y., and Ménard, C.: A comparison of 1701 snow models using observations from an alpine site, Adv. Water Resour., 55, 131–148, 2013. a, b, c
Essery, R., Mazzotti, G., Barr, S., Jonas, T., Quaife, T., and Rutter, N.: A Flexible Snow Model (FSM 2.1.1) including a forest canopy, Geosci. Model Dev., 18, 3583–3605, https://doi.org/10.5194/gmd-18-3583-2025, 2025. a, b, c, d, e, f, g, h
Fang, X., Pomeroy, J. W., DeBeer, C. M., Harder, P., and Siemens, E.: Hydrometeorological data from Marmot Creek Research Basin, Canadian Rockies, Earth Syst. Sci. Data, 11, 455–471, https://doi.org/10.5194/essd-11-455-2019, 2019. a
Fierz, C., Armstrong, R., Durand, Y., Etchevers, P., Greene, E., McClung, D., Nishimura, K., Satyawali, P., and Sokratov, S.: The international classification for seasonal snow on the ground, UNESCO/IHP, 2009. a, b
Fisher, R. A. and Koven, C. D.: Perspectives on the future of land surface models and the challenges of representing complex terrestrial systems, Journal of Advances in Modeling Earth Systems, 12, e2018MS001453, https://doi.org/10.1029/2018MS001453, 2020. a
Flanner, M., Shell, K., Barlage, M., Perovich, D., and Tschudi, M.: Radiative forcing and albedo feedback from the Northern Hemisphere cryosphere between 1979 and 2008, Nature Geoscience, 4, 151–155, https://doi.org/10.1038/NGEO1062, 2011. a
Gaborit, É., Fortin, V., Xu, X., Seglenieks, F., Tolson, B., Fry, L. M., Hunter, T., Anctil, F., and Gronewold, A. D.: A hydrological prediction system based on the SVS land-surface scheme: efficient calibration of GEM-Hydro for streamflow simulation over the Lake Ontario basin, Hydrol. Earth Syst. Sci., 21, 4825–4839, https://doi.org/10.5194/hess-21-4825-2017, 2017. a, b
Gaillard, M., Vionnet, V., Lafaysse, M., Dumont, M., and Ginoux, P.: Improved snow darkening coefficient for large-scale albedo modelling with Crocus, Zenodo [data set], https://doi.org/10.5281/zenodo.14194990, 2024. a
Gaillard, M., Vionnet, V., Lafaysse, M., Dumont, M., and Ginoux, P.: Improving large-scale snow albedo modeling using a climatology of light-absorbing particle deposition, The Cryosphere, 19, 769–792, https://doi.org/10.5194/tc-19-769-2025, 2025. a, b, c, d, e, f, g, h, i, j, k, l, m
Garnaud, C., Vionnet, V., Gaborit, É., Fortin, V., Bilodeau, B., Carrera, M., and Durnford, D.: Improving snow analyses for hydrological forecasting at ECCC using satellite-derived data, Remote Sensing, 13, 5022, https://doi.org/10.3390/rs13245022, 2021. a
Gascoin, S., Grizonnet, M., Bouchet, M., Salgues, G., and Hagolle, O.: Theia Snow collection: high-resolution operational snow cover maps from Sentinel-2 and Landsat-8 data, Earth Syst. Sci. Data, 11, 493–514, https://doi.org/10.5194/essd-11-493-2019, 2019. a
Gordon, M., Simon, K., and Taylor, P.: On snow depth predictions with the Canadian land surface scheme including a parametrization of blowing snow sublimation, Atmosphere-Ocean, 44, 239–255, 2006. a
Gouttevin, I., Lehning, M., Jonas, T., Gustafsson, D., and Mölder, M.: A two-layer canopy model with thermal inertia for an improved snowpack energy balance below needleleaf forest (model SNOWPACK, version 3.2.1, revision 741), Geosci. Model Dev., 8, 2379–2398, https://doi.org/10.5194/gmd-8-2379-2015, 2015. a, b, c, d, e, f
Gouttevin, I., Langer, M., Löwe, H., Boike, J., Proksch, M., and Schneebeli, M.: Observation and modelling of snow at a polygonal tundra permafrost site: spatial variability and thermal implications, The Cryosphere, 12, 3693–3717, https://doi.org/10.5194/tc-12-3693-2018, 2018. a, b, c
Hansen, M. C., Potapov, P. V., Moore, R., Hancher, M., Turubanova, S. A., Tyukavina, A., Thau, D., Stehman, S. V., Goetz, S. J., Loveland, T. R., Kommareddy, A., Egorov, A., Chini, L., Justice, C. O. and Townshend, J. R. G.: High-resolution global maps of 21st-century forest cover change, Science, 342, 850–853, 2013. a, b
Harder, P. and Pomeroy, J.: Estimating precipitation phase using a psychrometric energy balance method, Hydrological Processes, 27, 1901–1914, https://doi.org/10.1002/hyp.9799, 2013. a, b
Hedstrom, N. and Pomeroy, J.: Measurements and modelling of snow interception in the boreal forest, Hydrological Processes, 12, 1611–1625, 1998. a, b
Hersbach, H., Bell, B., Berrisford, P., Hirahara, S., Horányi, A., Muñoz-Sabater, J., Nicolas, J., Peubey, C., Radu, R., Schepers, D., Simmons, A., Soci, C., Abdalla, S., Abellan, X., Balsamo, G., Bechtold, P., Biavati, G., Bidlot, J., Bonavita, M., De Chiara, G., Dahlgren, P., Dee, D., Diamantakis, M., Dragani, R., Flemming, J., Forbes, R., Fuentes, M., Geer, A., Haimberger, L., Healy, S., Hogan, R. J., Hólm, E., Janisková, M., Keeley, S., Laloyaux, P., Lopez, P., Lupu, C., Radnoti, G., de Rosnay, P., Rozum, I., Vamborg, F., Villaume, S. and Thépaut, J.-N.: The ERA5 global reanalysis, Quarterly Journal of the Royal Meteorological Society, 146, 1999–2049, 2020. a
Horton, S. and Jamieson, B.: Modelling hazardous surface hoar layers across western Canada with a coupled weather and snow cover model, Cold Regions Science and Technology, 128, 22–31, 2016. a
Husain, S. Z., Alavi, N., Bélair, S., Carrera, M., Zhang, S., Fortin, V., Abrahamowicz, M., and Gauthier, N.: The multibudget Soil, Vegetation, and Snow (SVS) scheme for land surface parameterization: Offline warm season evaluation, J. Hydrometeorol., 17, 2293–2313, https://doi.org/10.1175/JHM-D-15-0228.1, 2016. a, b, c, d
Immerzeel, W. W., Lutz, A. F., Andrade, M., Bahl, A., Biemans, H., Bolch, T., Hyde, S., Brumby, S., Davies, B., Elmore, A., Emmer, A., Feng, M., Fernández, A., Haritashya, U., Kargel, J. S., Koppes, M., Kraaijenbrink, P. D. A., Kulkarni, A. V., Mayewski, P. A., Nepal, S., Pacheco, P., Painter, T. H., Pellicciotti, F., Rajaram, H., Rupper, S., Sinisalo, A., Shrestha, A. B., Viviroli, D., Wada, Y., Xiao, C., Yao, T. and Baillie, J. E. M.: Importance and vulnerability of the world's water towers, Nature, 577, 364–369, 2020. a
Ji, H., Nan, Z., Hu, J., Zhao, Y., and Zhang, Y.: On the spin-up strategy for spatial modeling of permafrost dynamics: A case study on the Qinghai-Tibet Plateau, Journal of Advances in Modeling Earth Systems, 14, e2021MS002750, https://doi.org/10.1029/2021MS002750, 2022. a
Jonas, T., Webster, C., Mazzotti, G., and Malle, J.: HPEval: A canopy shortwave radiation transmission model using high-resolution hemispherical images, Agricultural and Forest Meteorology, 284, 107903, https://doi.org/10.1016/j.agrformet.2020.107903, 2020. a
King, J., Derksen, C., Toose, P., Langlois, A., Larsen, C., Lemmetyinen, J., Marsh, P., Montpetit, B., Roy, A., Rutter, N. and Sturm, M.: JThe influence of snow microstructure on dual-frequency radar measurements in a tundra environment, Remote Sensing of Environment, 215, 242–254, 2018. a, b
Koivusalo, H. and Kokkonen, T.: Snow processes in a forest clearing and in a coniferous forest, Journal of Hydrology, 262, 145–164, 2002. a, b, c, d, e, f
Lackner, G., Domine, F., Nadeau, D. F., Lafaysse, M., and Dumont, M.: Snow properties at the forest–tundra ecotone: predominance of water vapor fluxes even in deep, moderately cold snowpacks, The Cryosphere, 16, 3357–3373, https://doi.org/10.5194/tc-16-3357-2022, 2022. a, b, c, d, e, f, g, h
Lafaysse, M., Morin, S., Coléou, C., Vernay, M., Serça, D., Besson, F., Willemet, J.-M., Giraud, G., and Durand, Y.: Towards a new chain of models for avalanche hazard forecasting in French mountain ranges, including low altitude mountains, in: Proceedings of International Snow Science Workshop, Grenoble–Chamonix Mont-Blanc, https://arc.lib.montana.edu/snow-science/objects/ISSW13_paper_O1-02.pdf (last access: 24 November 2025), 2013. a
Lafaysse, M., Cluzet, B., Dumont, M., Lejeune, Y., Vionnet, V., and Morin, S.: A multiphysical ensemble system of numerical snow modelling, The Cryosphere, 11, 1173–1198, https://doi.org/10.5194/tc-11-1173-2017, 2017. a, b, c, d, e, f, g, h
Langlois, A., Royer, A., and Goïta, K.: Analysis of simulated and spaceborne passive microwave brightness temperatures using in situ measurements of snow and vegetation properties, Canadian Journal of Remote Sensing, 36, S135–S148, 2010. a, b
Larue, F., Royer, A., De Sève, D., Roy, A., and Cosme, E.: Assimilation of passive microwave AMSR-2 satellite observations in a snowpack evolution model over northeastern Canada, Hydrol. Earth Syst. Sci., 22, 5711–5734, https://doi.org/10.5194/hess-22-5711-2018, 2018. a
Lawrence, D. M., Fisher, R. A., Koven, C. D., Oleson, K. W., Swenson, S. C., Bonan, G., Collier, N., Ghimire, B., van Kampenhout, L., Kennedy, D., Kluzek, E., Lawrence, P. J., Li, F. Li, H., Lombardozzi, D., Riley, W. J., Sacks, W. J., Shi, M., Vertenstein, M., Wieder, W. R., Xu, C., Ali, A. A., Badger, A. M., Bisht, G., van den Broeke, M., Brunke, M. A., Burns, S. P., Buzan, J., Clark, M., Craig, A., Dahlin, K., Drewniak, B., Fisher, J. B., Flanner, M., Fox, A. M., Gentine, P., Hoffman, F., Keppel-Aleks, G., Knox, R., Kumar, S., Lenaerts, J. Leung, L. R., Lipscomb, W. H., Lu, Y., Pandey, A., Pelletier, J. D., Perket, J., Randerson, J. T., Ricciuto, D. M., Sanderson, B. M., Slater, A., Subin, Z. M., Tang, J., Thomas, R. Q., Val Martin, M. and Zeng, X.: JThe Community Land Model version 5: Description of new features, benchmarking, and impact of forcing uncertainty, Journal of Advances in Modeling Earth Systems, 11, 4245–4287, 2019. a
Lehning, M., Fierz, C., and Lundy, C.: An objective snow profile comparison method and its application to SNOWPACK, Cold Regions Science and Technology, 33, 253–261, 2001. a
Leinss, S., Löwe, H., Proksch, M., and Kontu, A.: Modeling the evolution of the structural anisotropy of snow, The Cryosphere, 14, 51–75, https://doi.org/10.5194/tc-14-51-2020, 2020. a
Leonardini, G., Anctil, F., Vionnet, V., Abrahamowicz, M., Nadeau, D. F., and Fortin, V.: Evaluation of the snow cover in the Soil, Vegetation, and Snow (SVS) land surface model, J. Hydrometeorol., 22, 1663–1680, https://doi.org/10.1175/JHM-D-20-0249.1, 2021. a, b, c, d, e, f, g, h
Leroux, N. R., Vionnet, V., and Thériault, J. M.: Performance of precipitation phase partitioning methods and their impact on snowpack evolution in a humid continental climate, Hydrological Processes, 37, e15028, https://doi.org/10.1002/hyp.15028, 2023. a, b, c
Liston, G. and Elder, K.: A meteorological distribution system for high-resolution terrestrial modeling (MicroMet), J. Hydrometeorol., 7, 217–234, 2006. a
Liston, G. E., Mcfadden, J. P., Sturm, M., and Pielke, R. A.: Modelled changes in arctic tundra snow, energy and moisture fluxes due to increased shrubs, Global Change Biology, 8, 17–32, 2002. a
Lundquist, J. D., Dickerson-Lange, S. E., Lutz, J. A., and Cristea, N. C.: Lower forest density enhances snow retention in regions with warmer winters: A global framework developed from plot-scale observations and modeling, Water Resources Research, 49, 6356–6370, 2013. a
Lundquist, J. D., Dickerson-Lange, S., Gutmann, E., Jonas, T., Lumbrazo, C., and Reynolds, D.: Snow interception modelling: Isolated observations have led to many land surface models lacking appropriate temperature sensitivities, Hydrological Processes, 35, e14274, https://doi.org/10.1002/hyp.14274, 2021. a
Mahat, V., Tarboton, D. G., and Molotch, N. P.: Testing above-and below-canopy representations of turbulent fluxes in an energy balance snowmelt model, Water Resources Research, 49, 1107–1122, 2013. a, b
Marbouty, D.: An experimental study of temperature-gradient metamorphism, Journal of Glaciology, 26, 303–312, 1980. a
Marks, D., Domingo, J., Susong, D., Link, T., and Garen, D.: A spatially distributed energy balance snowmelt model for application in mountain basins, Hydrological Processes, 13, 1935–1959, 1999. a
Marsh, C. B., Pomeroy, J. W., and Wheater, H. S.: The Canadian Hydrological Model (CHM) v1.0: a multi-scale, multi-extent, variable-complexity hydrological model – design and overview, Geosci. Model Dev., 13, 225–247, https://doi.org/10.5194/gmd-13-225-2020, 2020. a
Marsh, C. B., Lv, Z., Vionnet, V., Harder, P., Spiteri, R. J., and Pomeroy, J. W.: Snowdrift-permitting simulations of seasonal snowpack processes over large mountain extents, Water Resources Research, 60, e2023WR036948, https://doi.org/10.1029/2023WR036948, 2024. a
Masson, V., Champeaux, J., Chauvin, F., Meriguet, C., and Lacaze, R.: A global database of land surface parameters at 1 km resolution in meteorological and climate models, Journal of Climate, 16, 1261–1282, 2003. a
Masson, V., Le Moigne, P., Martin, E., Faroux, S., Alias, A., Alkama, R., Belamari, S., Barbu, A., Boone, A., Bouyssel, F., Brousseau, P., Brun, E., Calvet, J.-C., Carrer, D., Decharme, B., Delire, C., Donier, S., Essaouini, K., Gibelin, A.-L., Giordani, H., Habets, F., Jidane, M., Kerdraon, G., Kourzeneva, E., Lafaysse, M., Lafont, S., Lebeaupin Brossier, C., Lemonsu, A., Mahfouf, J.-F., Marguinaud, P., Mokhtari, M., Morin, S., Pigeon, G., Salgado, R., Seity, Y., Taillefer, F., Tanguy, G., Tulet, P., Vincendon, B., Vionnet, V., and Voldoire, A.: The SURFEXv7.2 land and ocean surface platform for coupled or offline simulation of earth surface variables and fluxes, Geosci. Model Dev., 6, 929–960, https://doi.org/10.5194/gmd-6-929-2013, 2013. a, b
Mazzotti, G., Essery, R., Moeser, C. D., and Jonas, T.: Resolving small-scale forest snow patterns using an energy balance snow model with a one-layer canopy, Water Resources Research, 56, e2019WR026129, https://doi.org/10.1029/2019WR026129, 2020. a, b, c
Mazzotti, G., Nousu, J.-P., Vionnet, V., Jonas, T., Nheili, R., and Lafaysse, M.: Exploring the potential of forest snow modeling at the tree and snowpack layer scale, The Cryosphere, 18, 4607–4632, https://doi.org/10.5194/tc-18-4607-2024, 2024. a, b, c, d, e
Meloche, J., Langlois, A., Rutter, N., Royer, A., King, J., Walker, B., Marsh, P., and Wilcox, E. J.: Characterizing tundra snow sub-pixel variability to improve brightness temperature estimation in satellite SWE retrievals, The Cryosphere, 16, 87–101, https://doi.org/10.5194/tc-16-87-2022, 2022. a
Meloche, J., Leroux, N. R., Montpetit, B., Vionnet, V., and Derksen, C.: Radar-equivalent snowpack: reducing the number of snow layers while retaining their microwave properties and bulk snow mass, The Cryosphere, 19, 2949–2962, https://doi.org/10.5194/tc-19-2949-2025, 2025. a, b, c
Melton, J. R., Arora, V. K., Wisernig-Cojoc, E., Seiler, C., Fortier, M., Chan, E., and Teckentrup, L.: CLASSIC v1.0: the open-source community successor to the Canadian Land Surface Scheme (CLASS) and the Canadian Terrestrial Ecosystem Model (CTEM) – Part 1: Model framework and site-level performance, Geosci. Model Dev., 13, 2825–2850, https://doi.org/10.5194/gmd-13-2825-2020, 2020. a
Menard, C. B., Essery, R., Krinner, G., Arduini, G., Bartlett, P., Boone, A., Brutel-Vuilmet, C., Burke, E., Cuntz, M., Dai, Y., Decharme, B., Dutra, E., Fang, X., Fierz, C., Gusev, Y., Hagemann, S., Haverd, V., Kim, H., Lafaysse, M., Marke, T., Nasonova, O., Nitta, T., Niwano, M., Pomeroy, J., Schädler, G., Semenov, V. A., Smirnova, T., Strasser, U., Swenson, S., Turkov, D., Wever, N. and Yuan, H.: Scientific and human errors in a snow model intercomparison, Bulletin of the American Meteorological Society, 102, E61–E79, 2021. a, b
Montpetit, B., King, J., Meloche, J., Derksen, C., Siqueira, P., Adam, J. M., Toose, P., Brady, M., Wendleder, A., Vionnet, V., and Leroux, N. R.: Retrieval of snow and soil properties for forward radiative transfer modeling of airborne Ku-band SAR to estimate snow water equivalent: the Trail Valley Creek 2018/19 snow experiment, The Cryosphere, 18, 3857–3874, https://doi.org/10.5194/tc-18-3857-2024, 2024. a
Mudryk, L., Mortimer, C., Derksen, C., Elias Chereque, A., and Kushner, P.: Benchmarking of SWE products based on outcomes of the SnowPEx+ Intercomparison Project, EGUsphere [preprint], https://doi.org/10.5194/egusphere-2023-3014, 2024. a
Muñoz-Sabater, J., Dutra, E., Agustí-Panareda, A., Albergel, C., Arduini, G., Balsamo, G., Boussetta, S., Choulga, M., Harrigan, S., Hersbach, H., Martens, B., Miralles, D. G., Piles, M., Rodríguez-Fernández, N. J., Zsoter, E., Buontempo, C., and Thépaut, J.-N.: ERA5-Land: a state-of-the-art global reanalysis dataset for land applications, Earth Syst. Sci. Data, 13, 4349–4383, https://doi.org/10.5194/essd-13-4349-2021, 2021. a, b, c
Musselman, K. N., Pomeroy, J. W., and Link, T. E.: Variability in shortwave irradiance caused by forest gaps: Measurements, modelling, and implications for snow energetics, Agricultural and Forest Meteorology, 207, 69–82, https://doi.org/10.1016/j.agrformet.2015.03.014, 2015. a, b
Navari, M., Kumar, S., Wang, S., Geiger, J., Mocko, D. M., Arsenault, K. R., and Kemp, E. M.: Enabling advanced snow physics within land surface models through an interoperable model-physics coupling framework, Journal of Advances in Modeling Earth Systems, 16, e2022MS003236, https://doi.org/10.1029/2022MS003236, 2024. a, b
Niu, G.-Y., Yang, Z.-L., Mitchell, K. E., Chen, F., Ek, M. B., Barlage, M., Kumar, A., Manning, K., Niyogi, D., Rosero, E., Tewari, M. and Xia, Y.: The community Noah land surface model with multiparameterization options (Noah-MP): 1. Model description and evaluation with local-scale measurements, Journal of Geophysical Research-Atmospheres, 116, https://doi.org/10.1029/2010JD015139, 2011. a, b
Niwano, M., Aoki, T., Kuchiki, K., Hosaka, M., and Kodama, Y.: Snow Metamorphism and Albedo Process (SMAP) model for climate studies: Model validation using meteorological and snow impurity data measured at Sapporo, Japan, Journal of Geophysical Research-Earth Surface, 117, https://doi.org/10.1029/2011JF002239, 2012. a
Nousu, J.-P., Lafaysse, M., Mazzotti, G., Ala-aho, P., Marttila, H., Cluzet, B., Aurela, M., Lohila, A., Kolari, P., Boone, A., Fructus, M., and Launiainen, S.: Modeling snowpack dynamics and surface energy budget in boreal and subarctic peatlands and forests, The Cryosphere, 18, 231–263, https://doi.org/10.5194/tc-18-231-2024, 2024. a
Overgaard, J., Rosbjerg, D., and Butts, M. B.: Land-surface modelling in hydrological perspective – a review, Biogeosciences, 3, 229–241, https://doi.org/10.5194/bg-3-229-2006, 2006. a
Park, H., Fedorov, A. N., Zheleznyak, M. N., Konstantinov, P. Y., and Walsh, J. E.: Effect of snow cover on pan-Arctic permafrost thermal regimes, Climate Dynamics, 44, 2873–2895, 2015. a
Pflug, J., Liston, G., Nijssen, B., and Lundquist, J.: Testing model representations of snowpack liquid water percolation across multiple climates, Water Resources Research, 55, 4820–4838, 2019. a
Picard, G. and Libois, Q.: Simulation of snow albedo and solar irradiance profile with the Two-streAm Radiative TransfEr in Snow (TARTES) v2.0 model, Geosci. Model Dev., 17, 8927–8953, https://doi.org/10.5194/gmd-17-8927-2024, 2024. a
Picard, G., Sandells, M., and Löwe, H.: SMRT: an active–passive microwave radiative transfer model for snow with multiple microstructure and scattering formulations (v1.0), Geosci. Model Dev., 11, 2763–2788, https://doi.org/10.5194/gmd-11-2763-2018, 2018. a
Picard, G., Löwe, H., Domine, F., Arnaud, L., Larue, F., Favier, V., Le Meur, E., Lefebvre, E., Savarino, J., and Royer, A.: The Microwave Snow Grain Size: A New Concept to Predict Satellite Observations Over Snow-Covered Regions, AGU Advances, 3, e2021AV000630, https://doi.org/10.1029/2021AV000630, 2022. a, b
Pomeroy, J. and Dion, K.: Winter radiation extinction and reflection in a boreal pine canopy: measurements and modelling, Hydrological Processes, 10, 1591–1608, 1996. a
Pomeroy, J., Parviainen, J., Hedstrom, N., and Gray, D.: Coupled modelling of forest snow interception and sublimation, Hydrological Processes, 12, 2317–2337, 1998. a
Pomeroy, J., Brown, T., Fang, X., Shook, K. R., Pradhananga, D., Armstrong, R., Harder, P., Marsh, C., Costa, D., Krogh, S. A., Aubry-Wake, C., Annand, H., Lawford, P., He, Z., Kompanizare, M. and Lopez Moreno, J. L.: The cold regions hydrological modelling platform for hydrological diagnosis and prediction based on process understanding, Journal of Hydrology, 615, 128711, https://doi.org/10.1016/j.jhydrol.2022.128711, 2022. a
Quéno, L., Vionnet, V., Cabot, F., Vrécourt, D., and Dombrowski-Etchevers, I.: Forecasting and modelling ice layer formation on the snowpack due to freezing precipitation in the Pyrenees, Cold Regions Science and Technology, 146, 19–31, https://doi.org/10.1016/j.coldregions.2017.11.007, 2018. a
Ramos Buarque, S., Decharme, B., Barbu, A. L., and Franchisteguy, L.: Insights into the North Hemisphere daily snowpack at high resolution from the new Crocus-ERA5 product, Earth Syst. Sci. Data Discuss. [preprint], https://doi.org/10.5194/essd-2024-451, in review, 2025. a, b, c, d
Raynolds, M. K., Walker, D. A., Balser, A., Bay, C., Campbell, M., Cherosov, M. M., Daniëls, F. J., Eidesen, P. B., Ermokhina, K. A., Frost, G. V., Jedrzejek, B., Jorgenson, M. T., Kennedy, B. E., Kholod, S. S., Lavrinenko, I. A., Lavrinenko, O. V., Magnússon, B., Matveyeva, N. V., Metúsalemsson, S., Nilsen, L., Olthof, I., Pospelov, I. N., and Pospelova, E. B., Pouliot, D., Razzhivin, V., Schaepman-Strub. G., Šibík, J., Telyatnikov, M. Y. and Troeva, E.: A raster version of the Circumpolar Arctic Vegetation Map (CAVM), Remote Sensing of Environment, 232, 111297, https://doi.org/10.1016/j.rse.2019.111297, 2019. a, b
Robledano, A., Picard, G., Dumont, M., Flin, F., Arnaud, L., and Libois, Q.: Unraveling the optical shape of snow, Nature Communications, 14, 3955, https://doi.org/10.1038/s41467-023-39671-3, 2023. a
Romanov, P.: Global 4 km Multisensor Automated Snow/Ice Map (GMASI) Algorithm Theoretical Basis Document, NOAA NESDIS Center for Sattelite Applications and Research, 61 pp., https://www.star.nesdis.noaa.gov/smcd/emb/snow/documents/Global_Auto_Snow-Ice_4km_ATBD.pdf (last access: 14 November 2025), 2016. a
Romanov, P.: Global multisensor automated satellite-based snow and ice mapping system (GMASI) for cryosphere monitoring, Remote Sensing of Environment, 196, 42–55, 2017. a
Royer, A., Domine, F., Roy, A., Langlois, A., Marchand, N., and Davesne, G.: New northern snowpack classification linked to vegetation cover on a latitudinal mega-transect across northeastern Canada, Écoscience, 28, 225–242, 2021a. a, b, c, d, e
Royer, A., Picard, G., Vargel, C., Langlois, A., Gouttevin, I., and Dumont, M.: Improved simulation of arctic circumpolar land area snow properties and soil temperatures, Frontiers in Earth Science, 9, 685140, https://doi.org/10.3389/feart.2021.685140, 2021b. a, b, c, d, e, f, g, h, i, j, k, l, m, n, o
Rutter, N., Essery, R., Pomeroy, J., Altimir, N., Andreadis, K., Baker, I., Barr, A., Bartlett, P., Boone, A., Deng, H., Douville, H., Dutra, E., Elder, K., Ellis, C., Feng, X., Gelfan, A., Goodbody, A., Gusev, Y., Gustafsson, D., Hellström, R., Hirabayashi, Y., Hirota, T., Jonas, T., Koren, V., Kuragina, A., Lettenmaier, D., Li, W. P., Luce, C., Martin, E., Nasonova, O., Pumpanen, J., Pyles, R. D., Samuelsson, P., Sandells, M., Schädler, G., Shmakin, A., Smirnova, T. G., Stähli, M., Stöckli, R., Strasser, U., Su, H., Suzuki, K., Takata, K., Tanaka, K., Thompson, E., Vesala, T., Viterbo, P., Wiltshire, A., Xia, K., Xue, Y. and Yamazaki, T.: Evaluation of forest snow processes models (SnowMIP2), Journal of Geophysical Research-Atmospheres, 114, D06111, https://doi.org/10.1029/2008JD011063, 2009. a
Rutter, N., Sandells, M. J., Derksen, C., King, J., Toose, P., Wake, L., Watts, T., Essery, R., Roy, A., Royer, A., Marsh, P., Larsen, C., and Sturm, M.: Effect of snow microstructure variability on Ku-band radar snow water equivalent retrievals, The Cryosphere, 13, 3045–3059, https://doi.org/10.5194/tc-13-3045-2019, 2019. a, b, c
Rutter, N., Essery, R., Baxter, R., Hancock, S., Horton, M., Huntley, B., Reid, T., and Woodward, J.: Canopy structure and air temperature inversions impact simulation of sub-canopy longwave radiation in snow-covered boreal forests, Journal of Geophysical Research-Atmospheres, 128, e2022JD037980, https://doi.org/10.1029/2022JD037980, 2023. a
Saha, S. K., Sujith, K., Pokhrel, S., Chaudhari, H. S., and Hazra, A.: Effects of multilayer snow scheme on the simulation of snow: Offline Noah and coupled with NCEP CFS v2, Journal of Advances in Modeling Earth Systems, 9, 271–290, 2017. a
Shangguan, W., Dai, Y., Duan, Q., Liu, B., and Yuan, H.: A global soil data set for earth system modeling, Journal of Advances in Modeling Earth Systems, 6, 249–263, https://doi.org/10.1002/2013MS000293, 2014. a
Sharma, V., Gerber, F., and Lehning, M.: Introducing CRYOWRF v1.0: multiscale atmospheric flow simulations with advanced snow cover modelling, Geosci. Model Dev., 16, 719–749, https://doi.org/10.5194/gmd-16-719-2023, 2023. a
Shrestha, P. and Barros, A. P.: Multi-physics data assimilation framework for remotely sensed Snowpacks to improve water prediction, Water Resources Research, 61, e2024WR037885, https://doi.org/10.1029/2024WR037885, 2025. a
Simard, M., Pinto, N., Fisher, J. B., and Baccini, A.: Mapping forest canopy height globally with spaceborne lidar, Journal of Geophysical Research-Biogeosciences, 116, G04021, https://doi.org/10.1029/2011JG001708, 2011. a
Singh, S., Durand, M., Kim, E., and Barros, A. P.: Bayesian physical–statistical retrieval of snow water equivalent and snow depth from X- and Ku-band synthetic aperture radar – demonstration using airborne SnowSAr in SnowEx'17, The Cryosphere, 18, 747–773, https://doi.org/10.5194/tc-18-747-2024, 2024. a
Sommer, C. G., Lehning, M., and Fierz, C.: Wind tunnel experiments: influence of erosion and deposition on wind-packing of new snow, Frontiers in Earth Science, 6, 4, https://doi.org/10.3389/feart.2018.00004, 2018. a
Strasser, U., Warscher, M., Rottler, E., and Hanzer, F.: openAMUNDSEN v1.0: an open-source snow-hydrological model for mountain regions, Geosci. Model Dev., 17, 6775–6797, https://doi.org/10.5194/gmd-17-6775-2024, 2024. a
Sturm, M., Holmgren, J., König, M., and Morris, K.: The thermal conductivity of seasonal snow, Journal of Glaciology, 43, 26–41, 1997. a
Sturm, M., Goldstein, M. A., and Parr, C.: Water and life from snow: A trillion dollar science question, Water Resources Research, 53, 3534–3544, 2017. a
Taillandier, A.-S., Domine, F., Simpson, W. R., Sturm, M., and Douglas, T. A.: Rate of decrease of the specific surface area of dry snow: Isothermal and temperature gradient conditions, Journal of Geophysical Research-Earth Surface, 112, F03003, https://doi.org/10.1029/2006JF000514, 2007. a
Trujillo, E., Molotch, N. P., Goulden, M. L., Kelly, A. E., and Bales, R. C.: Elevation-dependent influence of snow accumulation on forest greening, Nature Geoscience, 5, 705–709, 2012. a
Tsang, L., Durand, M., Derksen, C., Barros, A. P., Kang, D.-H., Lievens, H., Marshall, H.-P., Zhu, J., Johnson, J., King, J., Lemmetyinen, J., Sandells, M., Rutter, N., Siqueira, P., Nolin, A., Osmanoglu, B., Vuyovich, C., Kim, E., Taylor, D., Merkouriadi, I., Brucker, L., Navari, M., Dumont, M., Kelly, R., Kim, R. S., Liao, T.-H., Borah, F., and Xu, X.: Review article: Global monitoring of snow water equivalent using high-frequency radar remote sensing, The Cryosphere, 16, 3531–3573, https://doi.org/10.5194/tc-16-3531-2022, 2022. a
Tuzet, F., Dumont, M., Lafaysse, M., Picard, G., Arnaud, L., Voisin, D., Lejeune, Y., Charrois, L., Nabat, P., and Morin, S.: A multilayer physically based snowpack model simulating direct and indirect radiative impacts of light-absorbing impurities in snow, The Cryosphere, 11, 2633–2653, https://doi.org/10.5194/tc-11-2633-2017, 2017. a
Tuzet, F., Dumont, M., Picard, G., Lamare, M., Voisin, D., Nabat, P., Lafaysse, M., Larue, F., Revuelto, J., and Arnaud, L.: Quantification of the radiative impact of light-absorbing particles during two contrasted snow seasons at Col du Lautaret (2058 m a.s.l., French Alps), The Cryosphere, 14, 4553–4579, https://doi.org/10.5194/tc-14-4553-2020, 2020. a
Veyssière, G., Karbou, F., Morin, S., Lafaysse, M., and Vionnet, V.: Evaluation of sub-kilometric numerical simulations of c-band radar backscatter over the French alps against sentinel-1 observations, Remote Sensing, 11, 8, https://doi.org/10.3390/rs11010008, 2018. a
Viallon-Galinier, L., Hagenmuller, P., and Lafaysse, M.: Forcing and evaluating detailed snow cover models with stratigraphy observations, Cold Regions Science and Technology, 180, 103163, https://doi.org/10.1016/j.coldregions.2020.103163, 2020. a, b
Vionnet, V., Brun, E., Morin, S., Boone, A., Faroux, S., Le Moigne, P., Martin, E., and Willemet, J.-M.: The detailed snowpack scheme Crocus and its implementation in SURFEX v7.2, Geosci. Model Dev., 5, 773–791, https://doi.org/10.5194/gmd-5-773-2012, 2012. a, b, c, d, e, f, g, h, i, j, k, l, m, n, o, p
Vionnet, V., Guyomarc'h, G., Naaim Bouvet, F., Martin, E., Durand, Y., Bellot, H., Bel, C., and Puglièse, P.: Occurrence of blowing snow events at an alpine site over a 10-year period: observations and modelling, Adv. Water Resour., 55, 53–63, 2013. a, b, c, d
Vionnet, V., Fortin, V., Gaborit, E., Roy, G., Abrahamowicz, M., Gasset, N., and Pomeroy, J. W.: Assessing the factors governing the ability to predict late-spring flooding in cold-region mountain basins, Hydrol. Earth Syst. Sci., 24, 2141–2165, https://doi.org/10.5194/hess-24-2141-2020, 2020. a
Vionnet, V., Verville, M., Fortin, V., Brugman, M., Abrahamowicz, M., Lemay, F., Thériault, J., Lafaysse, M., and Milbrandt, J.: Snow level from post-processing of atmospheric model improves snowfall estimate and snowpack prediction in mountains, Water Resources Research, 58, e2021WR031778, https://doi.org/10.1029/2021WR031778, 2022. a, b
Vionnet, V., Leroux, N., Fortin, V., Abrahamowicz, M., Woolley, G., Mazzotti, G., Gaillard, M., Lafaysse, M., Royer, A., Domine, F., Gauthier, N., Rutter, N., Derksen, C., and Belair, S.: Code of the land surface scheme Soil Vegetation and Snow version 2 integrated in the MESH platform, Zenodo [code], https://doi.org/10.5281/zenodo.14859640, 2025a. a
Vionnet, V., Leroux, N., Fortin, V., Abrahamowicz, M., Woolley, G., Mazzotti, G., Gaillard, M., Lafaysse, M., Royer, A., Domine, F., Gauthier, N., Rutter, N., Derksen, C., and Belair, S.: Code of the land surface scheme Soil Vegetation and Snow version 2 integrated in the ECCC Surface Prediction System, Zenodo [code], https://doi.org/10.5281/zenodo.16740463, 2025b. a
Vionnet, V., Leroux, N., Royer, A., Domine, F., Fortin, V., Abrahamowicz, M., Woolley, G., Mazzotti, G., Gaillard, M., Lafaysse, M., G. N., Rutter, N., Derksen, C., and Belair, S.: Scripts and data to produce figures for the SVS2 paper submitted to GMD, Zenodo [data set], https://doi.org/10.5281/zenodo.16760830, 2025c. a
Walter, B., Weigel, H., Wahl, S., and Löwe, H.: Wind tunnel experiments to quantify the effect of aeolian snow transport on the surface snow microstructure, The Cryosphere, 18, 3633–3652, https://doi.org/10.5194/tc-18-3633-2024, 2024. a, b, c
Warren, S. G.: Optical properties of snow, Reviews of Geophysics, 20, 67–89, 1982. a, b
Wever, N., Würzer, S., Fierz, C., and Lehning, M.: Simulating ice layer formation under the presence of preferential flow in layered snowpacks, The Cryosphere, 10, 2731–2744, https://doi.org/10.5194/tc-10-2731-2016, 2016. a
Woolley, G. J., Rutter, N., Wake, L., Vionnet, V., Derksen, C., Essery, R., Marsh, P., Tutton, R., Walker, B., Lafaysse, M., and Pritchard, D.: Multi-physics ensemble modelling of Arctic tundra snowpack properties, The Cryosphere, 18, 5685–5711, https://doi.org/10.5194/tc-18-5685-2024, 2024. a, b, c, d, e, f, g, h, i, j, k, l, m, n, o, p, q, r, s, t, u, v, w, x
Woolley, G. J., Rutter, N., Wake, L., Vionnet, V., Derksen, C., Meloche, J., Montpetit, B., Leroux, N. R., Essery, R., Hould Gosselin, G., and Marsh, P.: Simulating snow properties and Ku-band backscatter across the forest-tundra ecotone, EGUsphere [preprint], https://doi.org/10.5194/egusphere-2025-1498, 2025. a, b, c, d
Yamaguchi, S., Katsushima, T., Sato, A., and Kumakura, T.: Water retention curve of snow with different grain sizes, Cold Regions Science and Technology, 64, 87–93, 2010. a
Yen, Y. C.: Review of thermal properties of snow, ice and sea ice, CRREL Rep., 81–10, https://apps.dtic.mil/sti/tr/pdf/ADA103734.pdf (last access: 18 November 2025), 1981. a, b