the Creative Commons Attribution 4.0 License.
the Creative Commons Attribution 4.0 License.
 | 03 Nov 2025
UFS-RAQMS global atmospheric composition model: TROPOMI CO column assimilation
Maggie Bruckner
R. Bradley Pierce
Allen Lenzen
Glenn Diskin
Joshua P. DiGangi
Martine De Maziere
Nicholas Jones
Maria Makarova
This paper describes a new version of the Real-time Air Quality Modeling System (RAQMS) which uses National Unified Operational Prediction Capability (NUOPC) coupling to combine the RAQMS chemical mechanism with the Global Ensemble Forecasting System with Aerosols (GEFS-Aerosols), the Goddard Chemistry Aerosol Radiation and Transport model (GOCART) aerosol mechanism, and NOAA's Unified Forecast System (UFS) version 9.1 Finite Volume Cubed Sphere (FV3) dynamical core. We also present an application of TROPOMI CO column data assimilation in UFS-RAQMS with the NOAA Grid Point Statistical Interpolation (GSI) three-dimensional variational (3D-Var) analysis system to constrain UFS-RAQMS CO. We validate UFS-RAQMS control and TROPOMI CO data assimilation CO analyses for the period 15 July–30 September 2019 against independent satellite, ground-based, and airborne observations. We show that the largest impacts of the TROPOMI CO data assimilation are in the lower troposphere over Siberia and Indonesia. We find that UFS-RAQMS biomass burning signatures in CO column are not consistent with those in aerosol optical depth (AOD) near the Siberian and Indonesian biomass burning source regions within our control experiment. Assimilation of TROPOMI CO improves the representation of the biomass burning AOD/CO relationship in UFS-RAQMS by increasing the CO column, which suggests that the biomass burning CO emissions from the Blended Global Biomass Burning Emissions Product (GBBEPx) used in UFS-RAQMS are too low for boreal wildfires.
- Article
(11558 KB) - Full-text XML
-
Supplement
(877 KB) - BibTeX
- EndNote


The Real-time Air Quality Modeling System (RAQMS) is a global chemical transport model with full stratospheric and tropospheric chemistry (Pierce et al., 2007, 2009). We have incorporated the RAQMS unified stratosphere/troposphere chemistry, photolysis, and wet and dry deposition modules into NOAA's Unified Forecast System (UFS) to produce a global atmospheric composition assimilation and forecasting system hereafter referred to as UFS-RAQMS. In this study we demonstrate the impact of Tropospheric Monitoring Instrument (TROPOMI) (Veefkind et al., 2012) CO total column data assimilation in UFS-RAQMS utilizing the NOAA Grid Point Statistical Interpolation (GSI) three-dimensional variational (3D-Var) analysis system (Kleist et al., 2009; Wu et al., 2002).
Carbon monoxide (CO) is an important atmospheric trace gas due to both its influence on OH and ozone (O3) chemistry and its use as a pollution transport tracer. The major loss pathway for CO is its reaction with OH (Logan et al., 1981), and this reaction significantly impacts the oxidizing capacity of the atmosphere. CO sources include production during volatile organic compound (VOC) oxidation and direct emission from biomass burning and fossil fuel combustion. Chemical transport models (CTMs) frequently underestimate CO (e.g., Naik et al., 2013; Shindell et al., 2006; Strode et al., 2015). Potential reasons for this include underestimation of anthropogenic and/or biomass burning emissions, overestimation of OH, and underestimation of secondary CO production from VOCs.
Biomass burning emissions inventories have a high uncertainty due to factors including the incomplete knowledge of the spatiotemporal distribution of sources and limitations in capturing variation in fuel and fire behavior characteristics (e.g., Hyer and Reid, 2009; Pan et al., 2020). CTM concentration fields will vary significantly depending on which biomass burning emission inventory is used (e.g., Bian et al., 2007; Pan et al., 2020; Stockwell et al., 2022). Additionally, some biomass burning emissions schemes, including UFS-RAQMS, use emission ratios relative to CO for determining the release of VOCs and other non-CO emissions (e.g., Andreae and Merlet, 2001; Lewis et al., 2013; Binte Shahid et al., 2024; Li et al., 2025). further compounding the effect of poor biomass burning CO emissions on CTM forecast skill for VOC–NOx–O3 chemistry.
Chemical data assimilation (DA) systems can be used to reduce the impacts of emissions uncertainty and model deficiencies in representing sub-grid-scale processes by using atmospheric composition measurements to constrain CTM concentration fields. Chemical DA capabilities have been developed by modifying meteorological DA systems to use chemical concentration measurements. DA methods implemented for chemical DA include optimal interpolation-based methods (e.g., Lamarque et al., 1999; Lamarque and Gille, 2003; Pierce et al., 2007), 3D variational methods (Pagowski et al., 2010), ensemble Kalman filter methods (e.g., Gaubert et al., 2020; Miyazaki et al., 2012), and 4D variational methods (e.g., Inness et al., 2015, 2022). Chemical DA improves the CTM analysis through minimizing the difference between observations and model predictions. Observation datasets with a higher spatial coverage during the assimilation window provide more information about the true atmospheric composition. DA systems have been used to assimilate remote sensing observations of CO from Measurement of Air Pollution from Space (MAPS), Interferometric Monitor for Greenhouse Gases (IMG), Measurements of Pollution in the Troposphere (MOPITT), Infrared Atmospheric Sounding Interferometer (IASI), and TROPOMI (e.g., Barré et al., 2015; Clerbaux et al., 2001; Inness et al., 2015, 2022; Lamarque et al., 1999).
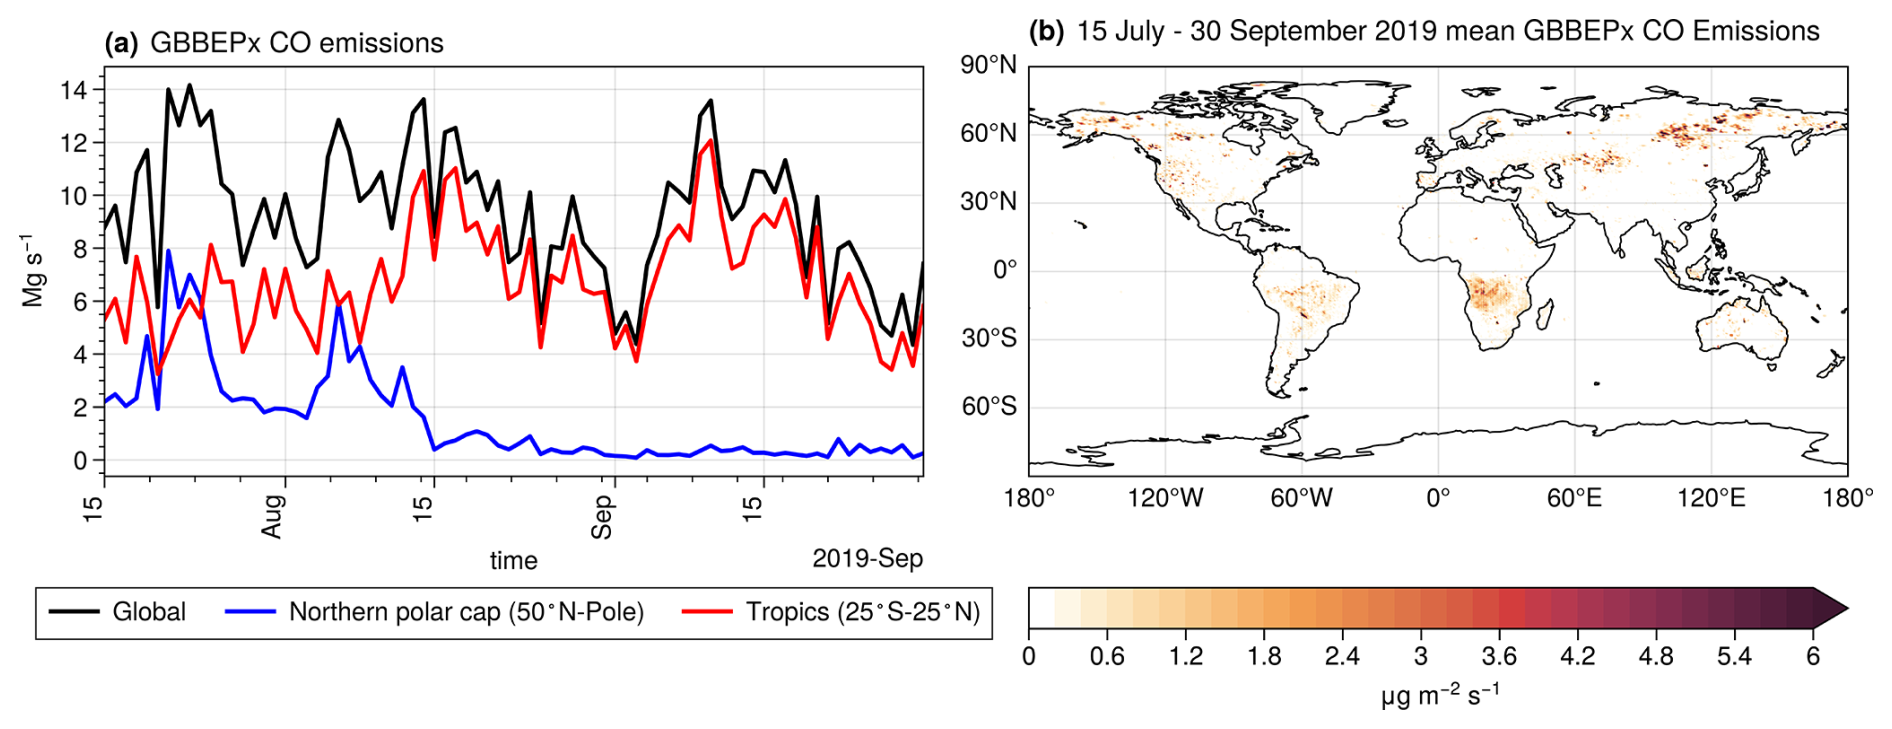
Figure 1GBBEPx emissions during 15 July–30 September 2019. Panel (a) displays time series over selected regions. Panel (b) shows the mean spatial distribution of GBBEPx emissions.
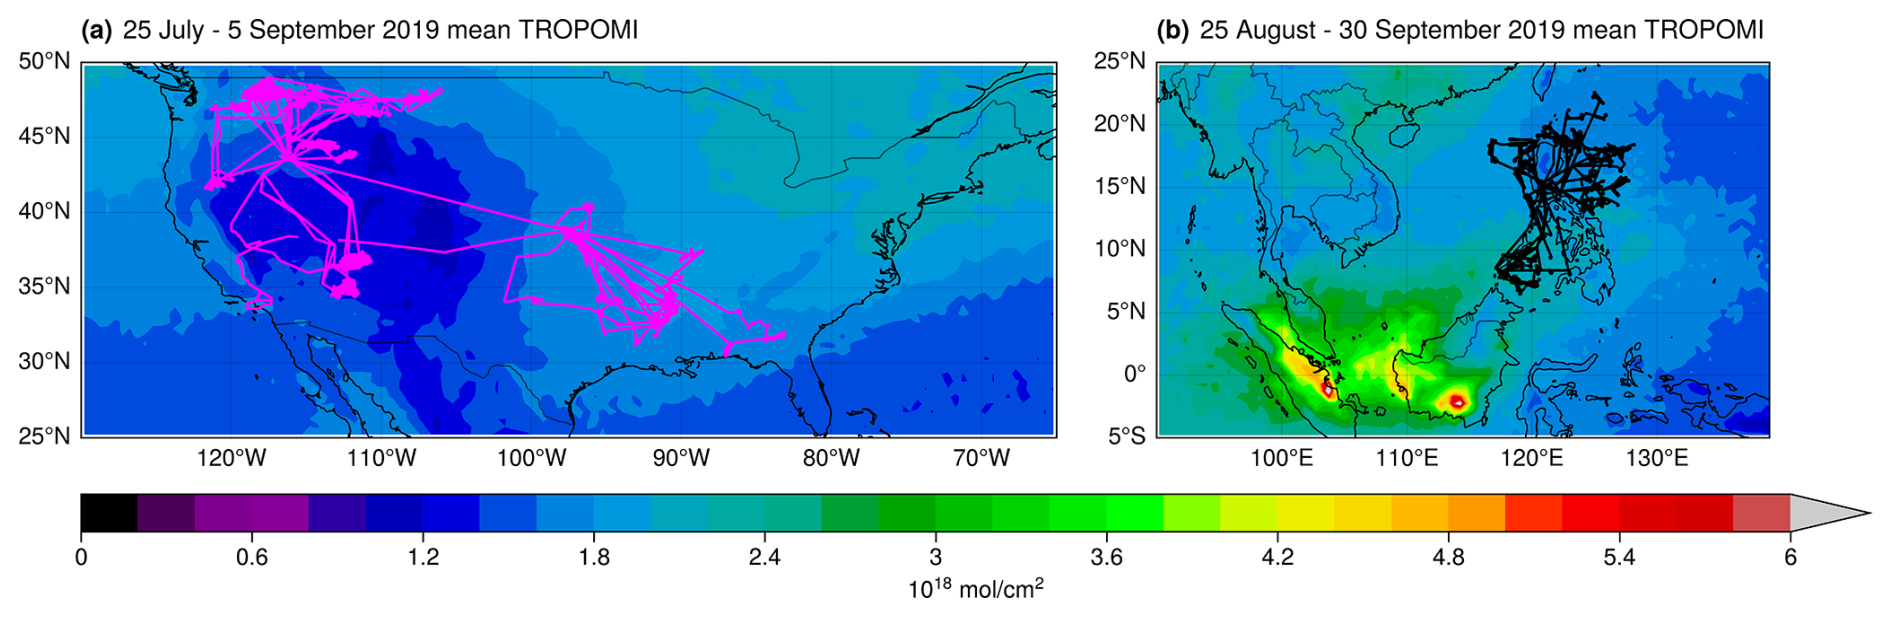
Figure 2Mean TROPOMI CO columns over the US (a) and SE Asia (b). FIREX-AQ DC-8 flight tracks (pink) and CAMP2Ex P-3 (black) flight tracks are shown over the respective campaign domains.
In this study we introduce UFS-RAQMS and apply it to TROPOMI CO DA during July–August–September (JAS) 2019. The application of TROPOMI CO DA provides an observational constraint on model CO concentrations. The previous version of RAQMS utilized the UW hybrid model (Schaack et al., 2004) as the dynamical core and physics parameterizations from the NCAR Community Climate Model (CCM3) (Kiehl et al., 1998). Incorporation of the UFS dynamical core within the new model version updates the physical parameterizations to the suite used to produce operational NOAA forecasts. During JAS the 2019 NASA/NOAA Fire Influence on Regional to Global Environments and Air Quality (FIREX-AQ) field campaign (Warneke et al., 2023) sampled smoke plumes over North America. The NASA Cloud, Aerosol and Monsoon Processes Philippines Experiment (CAMP2Ex) field campaign (Reid et al., 2023) occurred from 25 August–5 October 2019 and sampled smoke over the Maritime Continent. Fire activity in the continental US in 2019 was significantly below average, thought to be the result of higher fuel moisture content (Warneke et al., 2023). Globally, biomass burning emissions typically peak around August–September (van der Werf et al., 2017). The Blended Global Biomass Burning Emissions Product (GBBEPx) calculates daily biomass burning emissions using observations of fire radiative power (FRP) from the Moderate Resolution Imaging Spectroradiometer (MODIS) (Aqua and Terra satellites) and Visible Infrared Imaging Radiometer Suite (VIIRS) (Suomi NPP and NOAA-20 satellites) (Zhang et al., 2019). Siberian wildfire emissions peaked during July and August 2019, and by September global biomass burning emissions were predominantly due to burning in the tropics (Fig. 1). Smoke from the Siberian wildfires was transported over North America, where it impacted tropospheric composition and surface air quality (Johnson et al., 2021). Smoke from drought-enhanced biomass burning in the Maritime Continent contributed to September 2019 having the third-highest aerosol optical depth (AOD) in the MODIS record, behind significant enhancements in 2006 and 2015 (Reid et al., 2023).
This paper is structured as follows. Section 2 describes the UFS-RAQMS model and data assimilation system as well as the method for obtaining the background error covariance statistics. Section 3 shows results from the TROPOMI CO DA experiment and validation with independent observations. Section 4 evaluates the relationship between CO column and AOD for 2 case studies – one over Siberian biomass burning in July and one over Indonesia in September. Conclusions are given in Sect. 5.
UFS-RAQMS is an updated version of the Real-time Air Quality Modeling System (RAQMS) (Pierce et al., 2007) where the RAQMS stratosphere/troposphere chemistry, photolysis, and wet and dry deposition modules are coupled to NOAA's Unified Forecast System (UFS) version 9.1 Finite Volume Cubed Sphere (FV3) dynamical core (Harris and Lin, 2013; Putman and Lin, 2007). The UFS-RAQMS configuration utilized in this study is an extension of the operational NOAA Global Ensemble Forecasting System with Aerosols (GEFS-Aerosols, Bhattacharjee et al., 2023; Zhang et al., 2022). GEFS-Aerosols includes bulk aerosol modules from the Goddard Chemistry Aerosol Radiation and Transport model (GOCART, Chin et al., 2002). The GOCART aerosol module does not predict secondary organic aerosols or include heterogeneous chemistry, so these pathways are not able to change AOD within the UFS-RAQMS modeling system.
The extension is accomplished by coupling RAQMS chemistry, photolysis, and wet and dry deposition modules with the UFS dynamical core through the National Unified Operational Prediction Capability (NUOPC, https://earthsystemmodeling.org/nuopc/, last access: 10 September 2025) layer. The NUOPC layer defines conventions and generic components for building coupled models using the Earth System Modeling Framework (ESMF, https://earthsystemmodeling.org, last access: 10 September 2025). This NUOPC-based coupling allows the GOCART aerosol predictions to impact the RAQMS Fast-J2 (Bian and Prather, 2002) photolysis scheme and also allows the RAQMS OH and H2O2 predictions to impact the GOCART sulfate aerosol formation.
The RAQMS chemistry module utilizes a family approach to reduce the number of species considered in the chemical mechanism, requiring solving of continuity equations for 55 chemical families and constituents and determination of equilibrium concentrations for 86 separate species (Pierce et al., 2007). Non-methane hydrocarbon chemistry in the RAQMS chemistry module follows the lumped-structure Carbon Bond Mechanism Z (CB-Z) (Zaveri and Peters, 1999), which was modified in Pierce et al. (2007) to include an explicit isoprene oxidation scheme. Standard hydrogen oxide (HOx), chlorine oxide (ClOx), bromine oxide (BrOx), and NOx ozone photochemistry (Eckman et al., 1995) is also included.
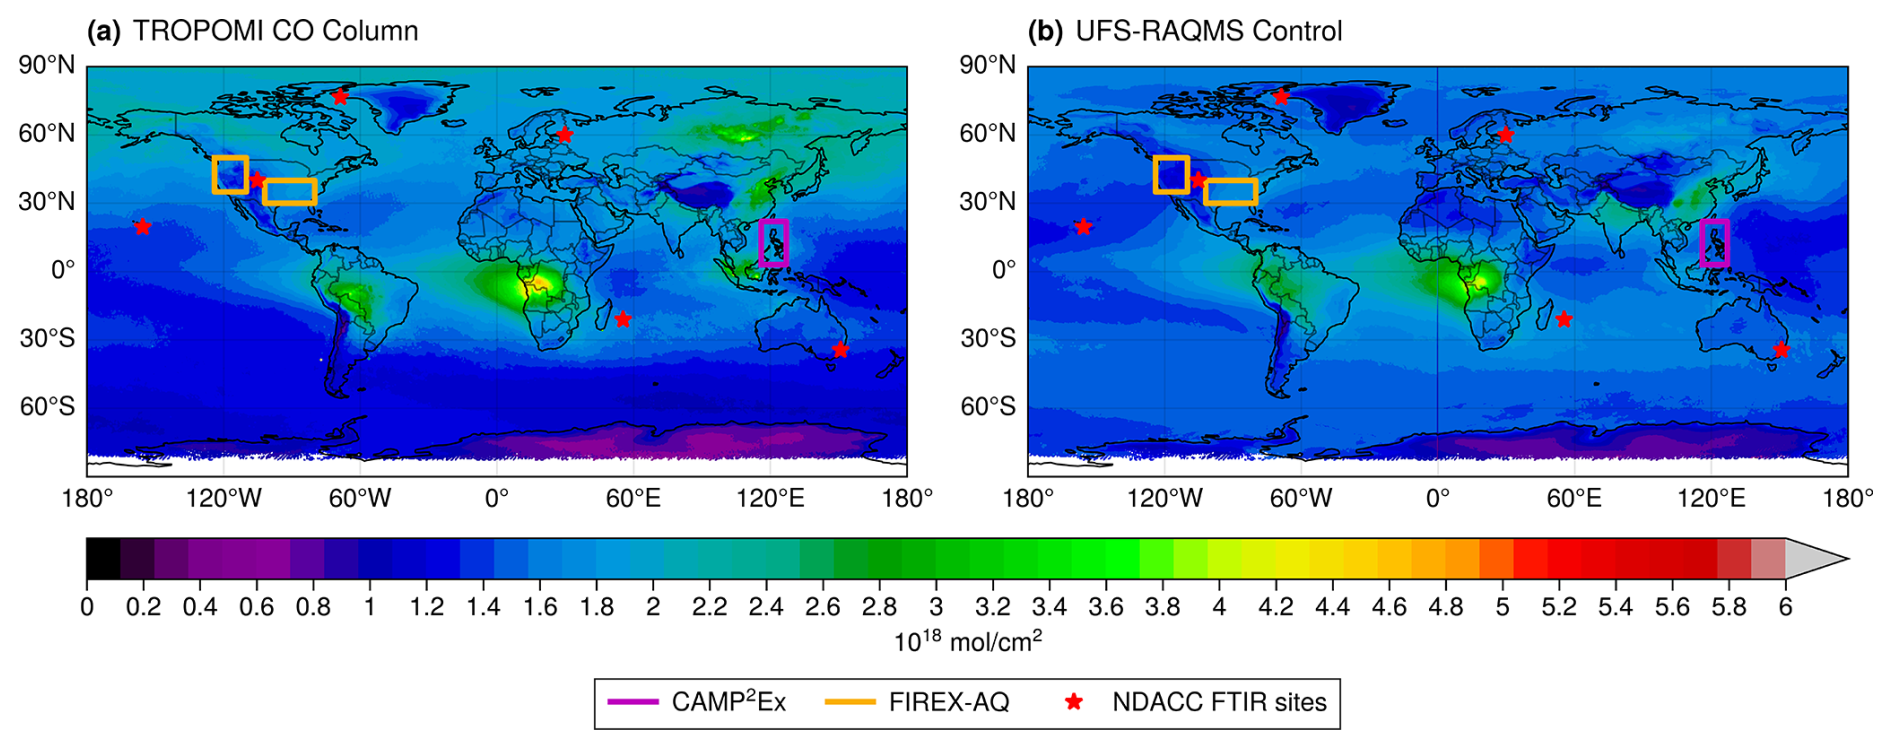
Figure 315 July–30 September 2019 average CO column concentrations for (a) TROPOMI and (b) UFS-RAQMS control. Boxes indicate domains for CAMP2Ex (purple) and FIREX-AQ (yellow) campaigns. NDACC FTIR locations utilized in this study are denoted by red stars.
In this study we conduct UFS-RAQMS retrospective simulations during 15 July through 30 September 2019 at a cubed sphere resolution of 192 (C192, 192×192 grid points within each set of six cubes or approximately 0.5°×0.5° horizontal resolution) with 64 hybrid vertical levels from the surface to upper stratosphere (approximately 0.2 hPa). The UFS-RAQMS atmospheric composition experiments are conducted in “replay” mode, with UFS-RAQMS meteorological fields initialized with Global Data Assimilation System (GDAS, Whitaker et al., 2008) analyses at 6 h intervals followed by UFS-RAQMS forecasts with and without data assimilation cycling. The forecasts without data assimilation are used as the control experiment. Both UFS-RAQMS experiments were initialized on 15 July 2019 at 12:00 Z with 1×1° analyses from RAQMS. The RAQMS analyses used as the chemical initial conditions are constrained by assimilating NASA Moderate Resolution Imaging Spectroradiometer (MODIS) collection 6.1 (C61) AOD on the Terra and Aqua satellites and the NASA Ozone Monitoring Instrument (OMI) TOMS V8 cloud-cleared total column ozone and Microwave Limb Sounder (MLS) version 2 stratospheric ozone profiles with a digital filter analysis system. This approach is based on optimal interpolation but treats the analysis as a digital filtering problem (Oppenheim and Schafer, 1975). Global anthropogenic emissions in UFS-RAQMS are obtained from the Community Emissions Data System (CEDS, McDuffie et al., 2020). Daily global biomass burning CO emissions are specified from GBBEPx (Zhang et al., 2019) and are expanded for other trace gas emissions using species-specific emissions factors from the RAQMS biomass burning scheme (Soja et al., 2004). Fire radiative power (FRP) is used to calculate GBBEPx plume rise (Ahmadov et al., 2017).
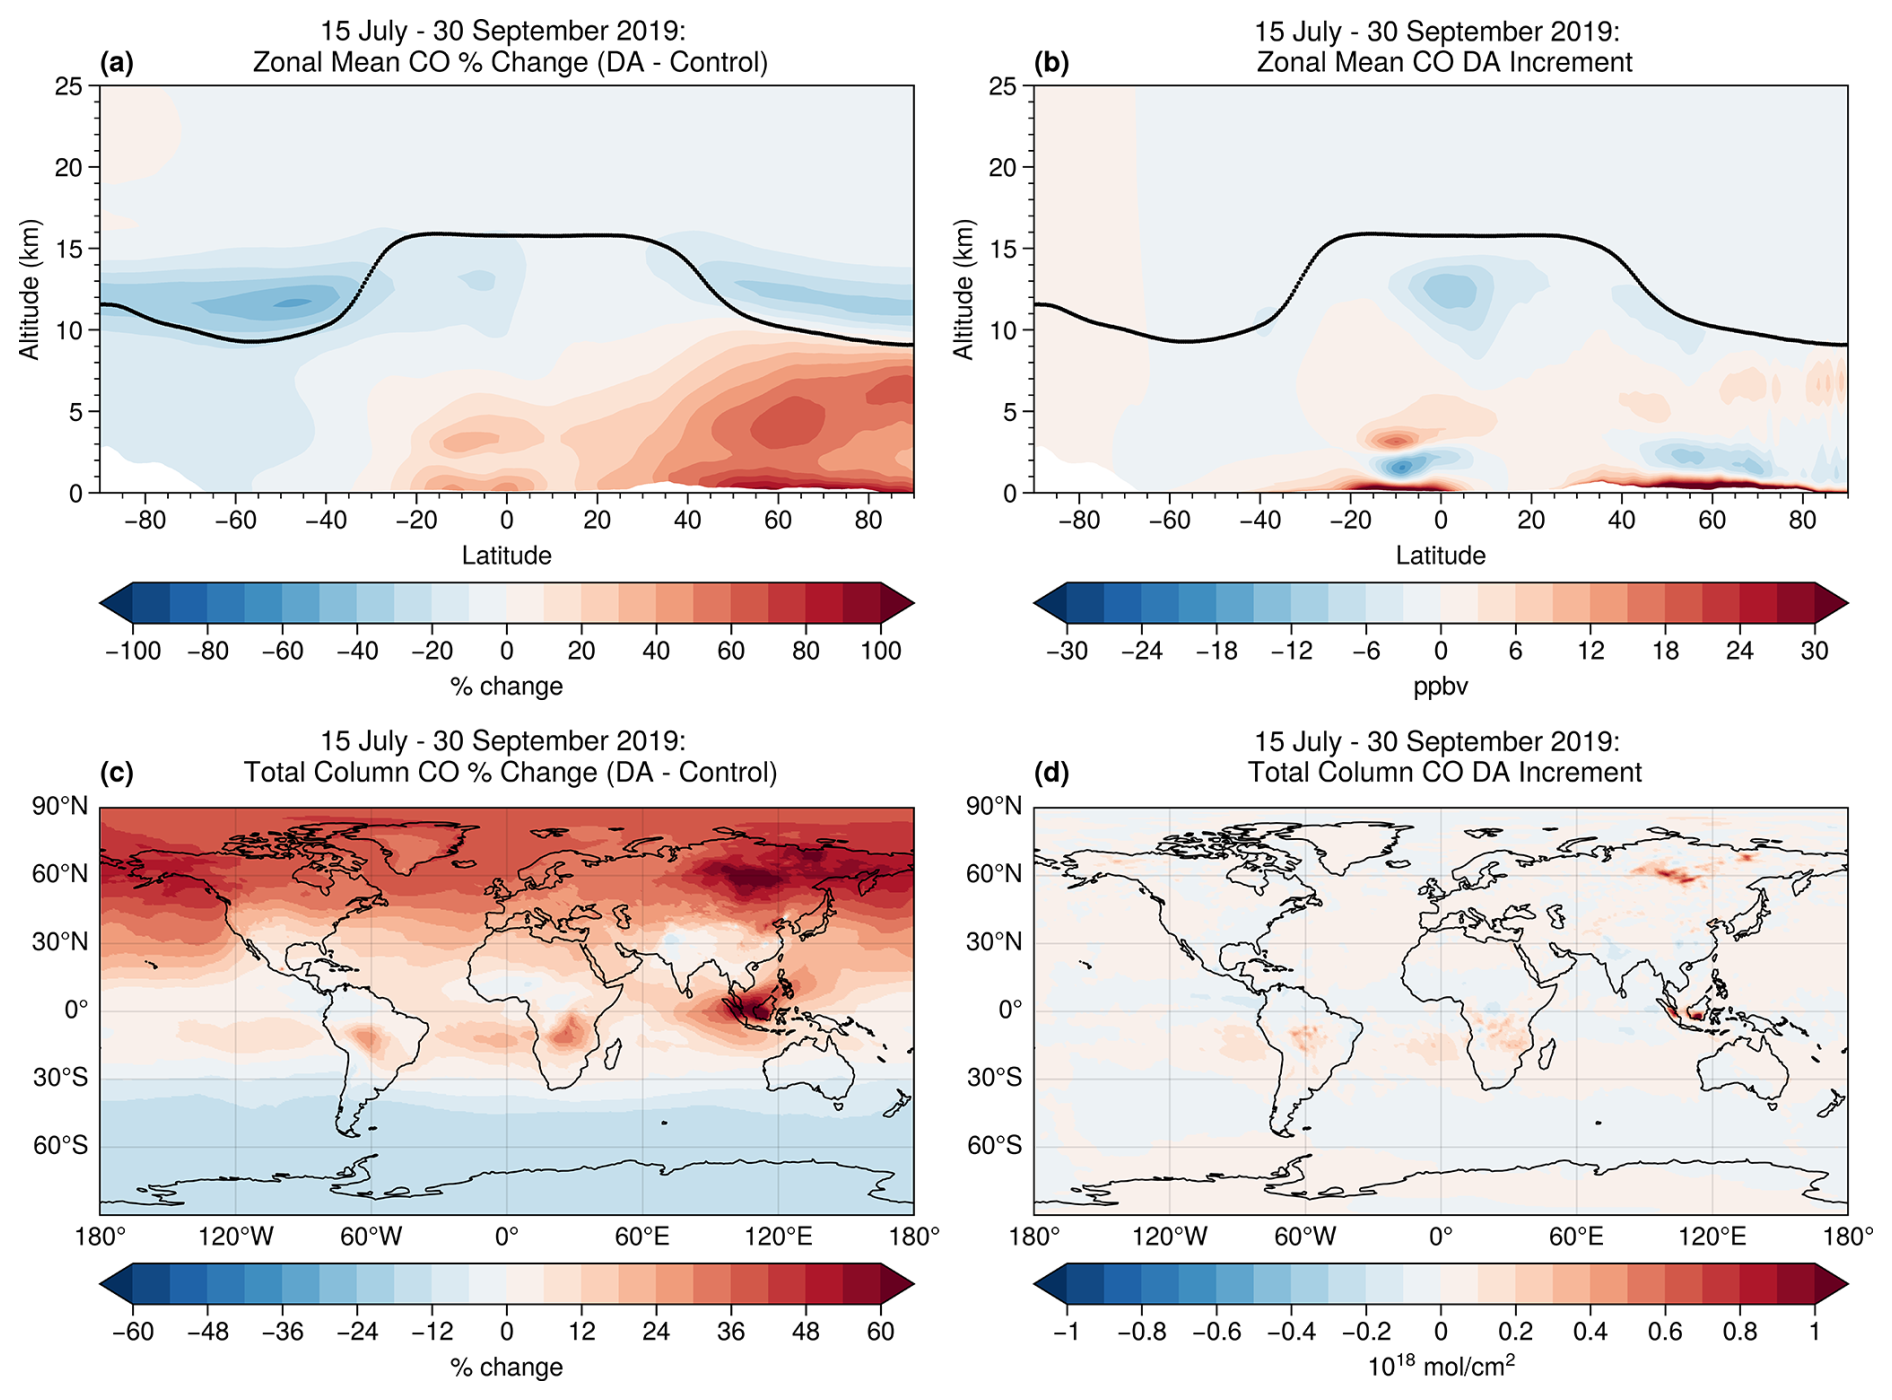
Figure 4Percent difference in zonal mean CO (a) and total column CO (c) between UFS-RAQMS TROPOMI CO DA and control experiments. Average zonal mean (b) and total column (d) TROPOMI CO DA increments.
2.1 GSI 3D-Var
This study uses the operational grid point statistical interpolation (GSI) 3D variational (3D-Var) DA system (Kleist et al., 2009; Wu et al., 2002) to assimilate TROPOMI CO columns. Within this implementation, the UFS-RAQMS 3D CO volume mixing ratio is used as the analysis variable in the minimization procedure. The background error covariance (BEC) statistics for CO are obtained using the National Meteorological Center (NMC) method (Descombes et al., 2015; Parrish and Derber, 1992). The NMC method typically uses differences between 24 h forecasts and 48 h forecasts to estimate BEC statistics. Here, in addition to the standard BEC implementation, we apply the NMC method to a pair of forecasts that have different biomass burning emissions to account for uncertainties in CO emissions. The biomass burning emission BEC statistics are computed from the differences between 100 % GBBEPx CO emissions and 85 % GBBEPx CO emissions UFS-RAQMS CO forecasts.
The biomass burning and forecast BEC statistics are combined in a piecewise linear fashion to create “blended” BEC statistics. We set the blended BEC statistics equal to the standard, forecast-sensitive BEC statistics above model level 25 (approximately 480 hPa). Below model level 15 (approximately 780 hPa), the blended BEC statistics are equal to the biomass burning BEC statistics with an inflation factor of 5 applied to the standard deviation. This inflation factor was tested during the development of assimilation capabilities within the RAQMS Aura Reanalysis (Bruckner et al., 2024). It accounts for the fact that the 20 % emission perturbation used for the emission sensitivity significantly underestimates the true uncertainties in emissions, which can be an order of magnitude for biomass burning emissions (Al-Saadi et al., 2008). The two BEC estimates are linearly blended in approximately the mid-troposphere between model levels 15 and 25. The resulting BEC statistics for forecast, emission, and blended formulations are presented in Fig. S1 in the Supplement.
2.2 TROPOMI CO total column
TROPOMI is a higher-resolution follow-on to the NASA Ozone Monitoring Instrument (OMI) that is currently in orbit on board ESA's polar-orbiting Sentinel-5 precursor satellite that observes in the ultraviolet (UV)–near-infrared (IR) and shortwave IR. We use the v2.4.0 CO total column retrieval with the striping correction applied (Borsdorff et al., 2019). Following recommended quality assurance guidelines (https://sentinel.esa.int/documents/247904/3541451/Sentinel-5P-Carbon-Monoxide-Level-2-Product-Readme-File.pdf, last access: 18 July 2024), we use observations with a quality assurance value 1 (best) over land and 0.7 (okay, but mid-level clouds are present) over ocean. This leads to assimilation of only cloudy data over ocean, as the clear-sky ocean retrieval signal intensity is too weak (Inness et al., 2022).
TROPOMI CO has a spatial resolution of 5.5×3.5 km (7×3.5 km prior to 6 August 2019), which is higher than UFS-RAQMS resolution. Owing to this difference in resolution, multiple TROPOMI observations may fall within a model grid cell during the assimilation window. Unlike other studies that utilize satellite CO “super-observations” (e.g., Gaubert et al., 2020; Inness et al., 2022; Sekiya et al., 2021), we assimilate observations individually. Super-observations reduce the computational cost and representation error as well as smoothing the spatial variability in analysis increments (Sekiya et al., 2021). We opted not to use super-observations due to concerns that this smoothing could lead to underestimates in localized CO column enhancements associated with biomass burning.
Figure 2a shows the mean TROPOMI CO columns over the continental US during the FIREX-AQ field campaign and the NASA DC-8 flight tracks. CO columns over the central and eastern US are ∼2 times higher than over the western US, largely due to higher topography in the western US and thus thinner atmospheric columns. Figure 2b shows the mean TROPOMI CO concentrations over SE Asia during the CAMP2Ex field campaign and the NASA P-3 flight tracks. During CAMP2Ex high CO columns ( mol cm−2) over the islands of Borneo and Sumatra are due to the sustained burning of peatlands (Reid et al., 2023).
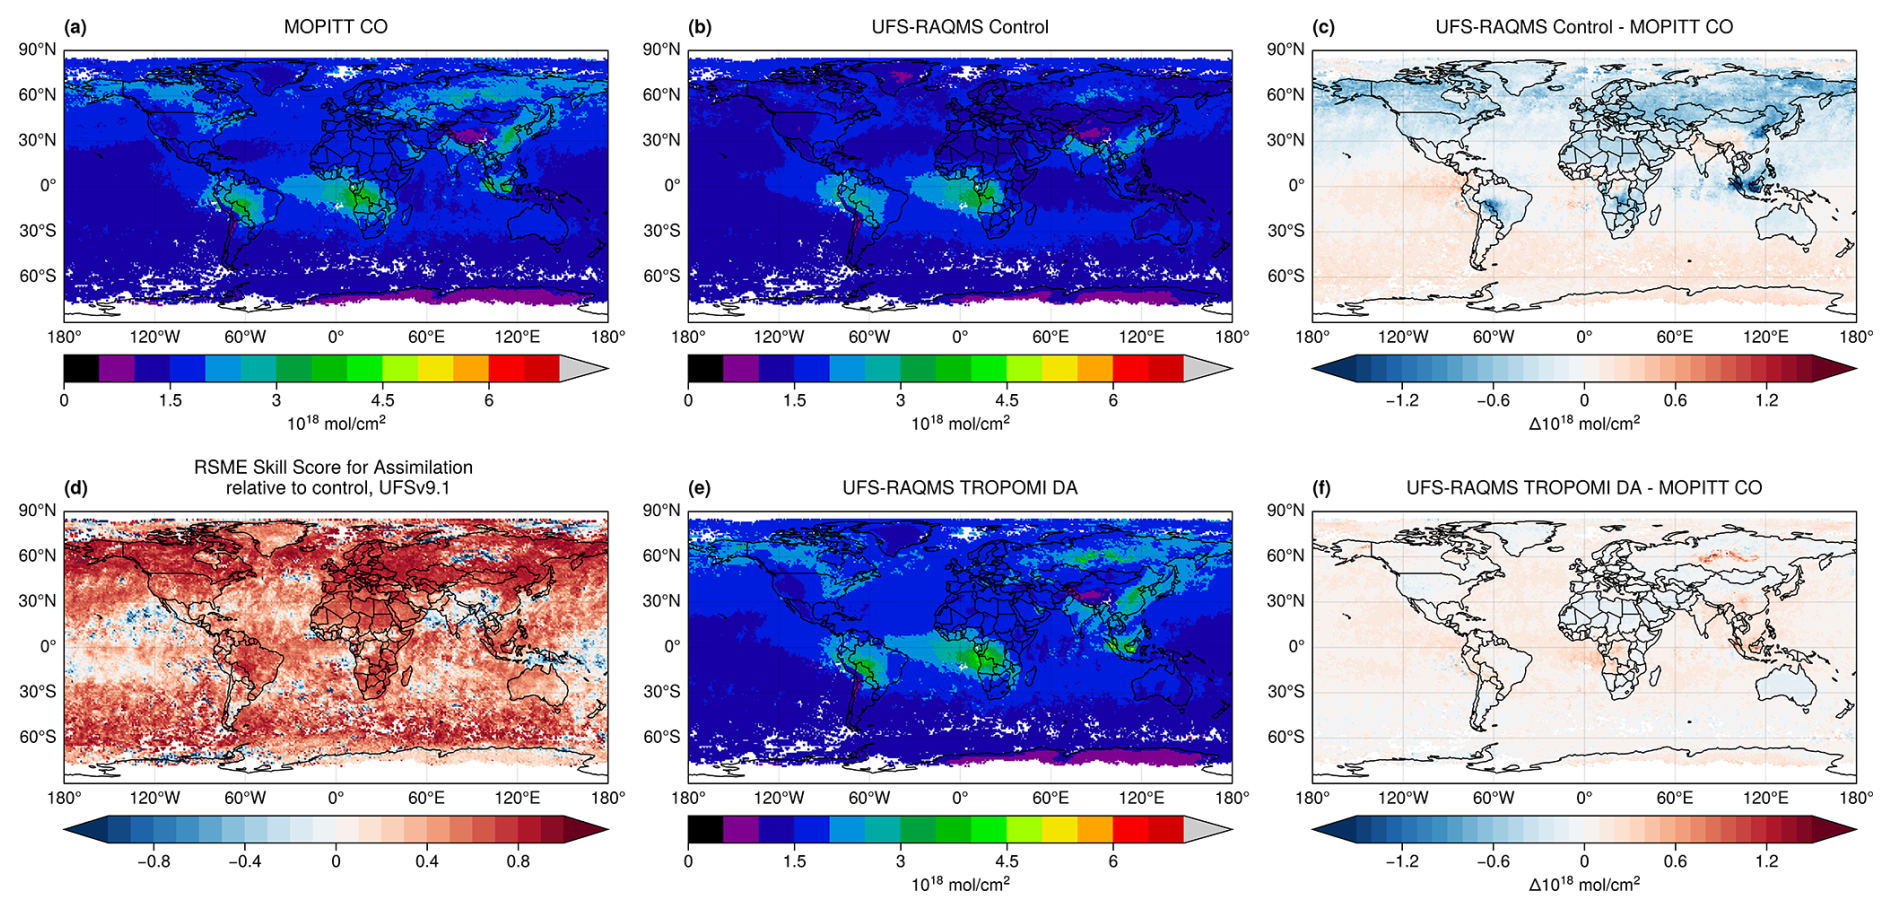
Figure 5Comparison of MOPITT CO column with UFS-RAQMS control and TROPOMI CO DA CO columns. 15 July–30 September 2016 mean CO column for MOPITT (a), UFS-RAQMS control (b), and UFS-RAQMS TROPOMI CO DA (e), with 26 July–24 August 2019 excluded due to MOPITT data outage. The RMSE skill score (d) shows improved agreement with MOPITT in UFS-RAQMS TROPOMI CO DA over UFS-RAQMS control. Mean bias relative to MOPITT for UFS-RAQMS control (c) and UFS-RAQMS TROPOMI CO DA (f).
The UFS-RAQMS control CO columns are lower than the TROPOMI CO column observations in the NH and higher in the SH (Fig. 3). Figure 3 also shows the FIREX-AQ and CAMP2Ex field campaign domains and the locations of Network for the Detection of Atmospheric Composition Change (NDACC) Fourier transform infrared (FTIR) spectrometers used to validate UFS-RAQMS CO profiles. NDACC is a global network consisting of 80 currently active stations providing high-quality observations of atmospheric trace gases and aerosols using ground-based in situ and remote sensing techniques including ozonesondes, FTIR spectrometers, lidar, and UV/visible spectroscopy (De Mazière et al., 2018). The UFS-RAQMS control experiment significantly underpredicts CO columns over central Africa, the Maritime Continent, and Siberian Russia. Figure 1b shows that each of these regions is associated with significant biomass burning during this period.
3.1 Differences in CO between control and DA experiments
To quantify the impact of assimilating TROPOMI CO on UFS-RAQMS analyses, we calculate the average percent change in zonal mean CO and CO total column between the control and TROPOMI CO DA experiments. Figure 4a shows that the assimilation increases tropospheric zonal mean CO north of 20° S and decreases zonal mean CO above the tropopause. Above the tropopause the largest impact of the TROPOMI CO DA on CO is a decrease of 32 %–52 % in the Southern Hemisphere (SH) between 40 and 60° S and 11–13 km. The stratospheric regions with the largest decreases are in the midlatitudes and characterized by a strong vertical gradient in CO that sharpens as a result of the TROPOMI CO DA. This stratospheric percentage change is associated with low CO concentrations. These large stratospheric differences are not a direct consequence of the TROPOMI assimilation, as zonal mean cross sections of the analysis increments (Fig. 4b) illustrate that the DA primarily adjusts CO in the troposphere. Stratospheric CO analysis increments are concentrated near the tropopause and largest in the polar NH. Consequently, these large SH stratospheric CO percentage changes most likely arise from reductions in CO in the tropical upper troposphere through TROPOMI CO DA and then cross-tropopause transport of the lower CO from the tropical upper troposphere into the stratosphere.
The largest increases in zonal mean CO concentrations are between 45 and 80° N below 5 km and in excess of 60 %. Figure 4c shows that the assimilation tends to increase CO total column north of 30° S and decrease CO total column south of 30° S. The largest increases in CO total column are in excess of 60 % and in Siberia and the Maritime Continent, which during this time period experienced significant biomass burning activity.
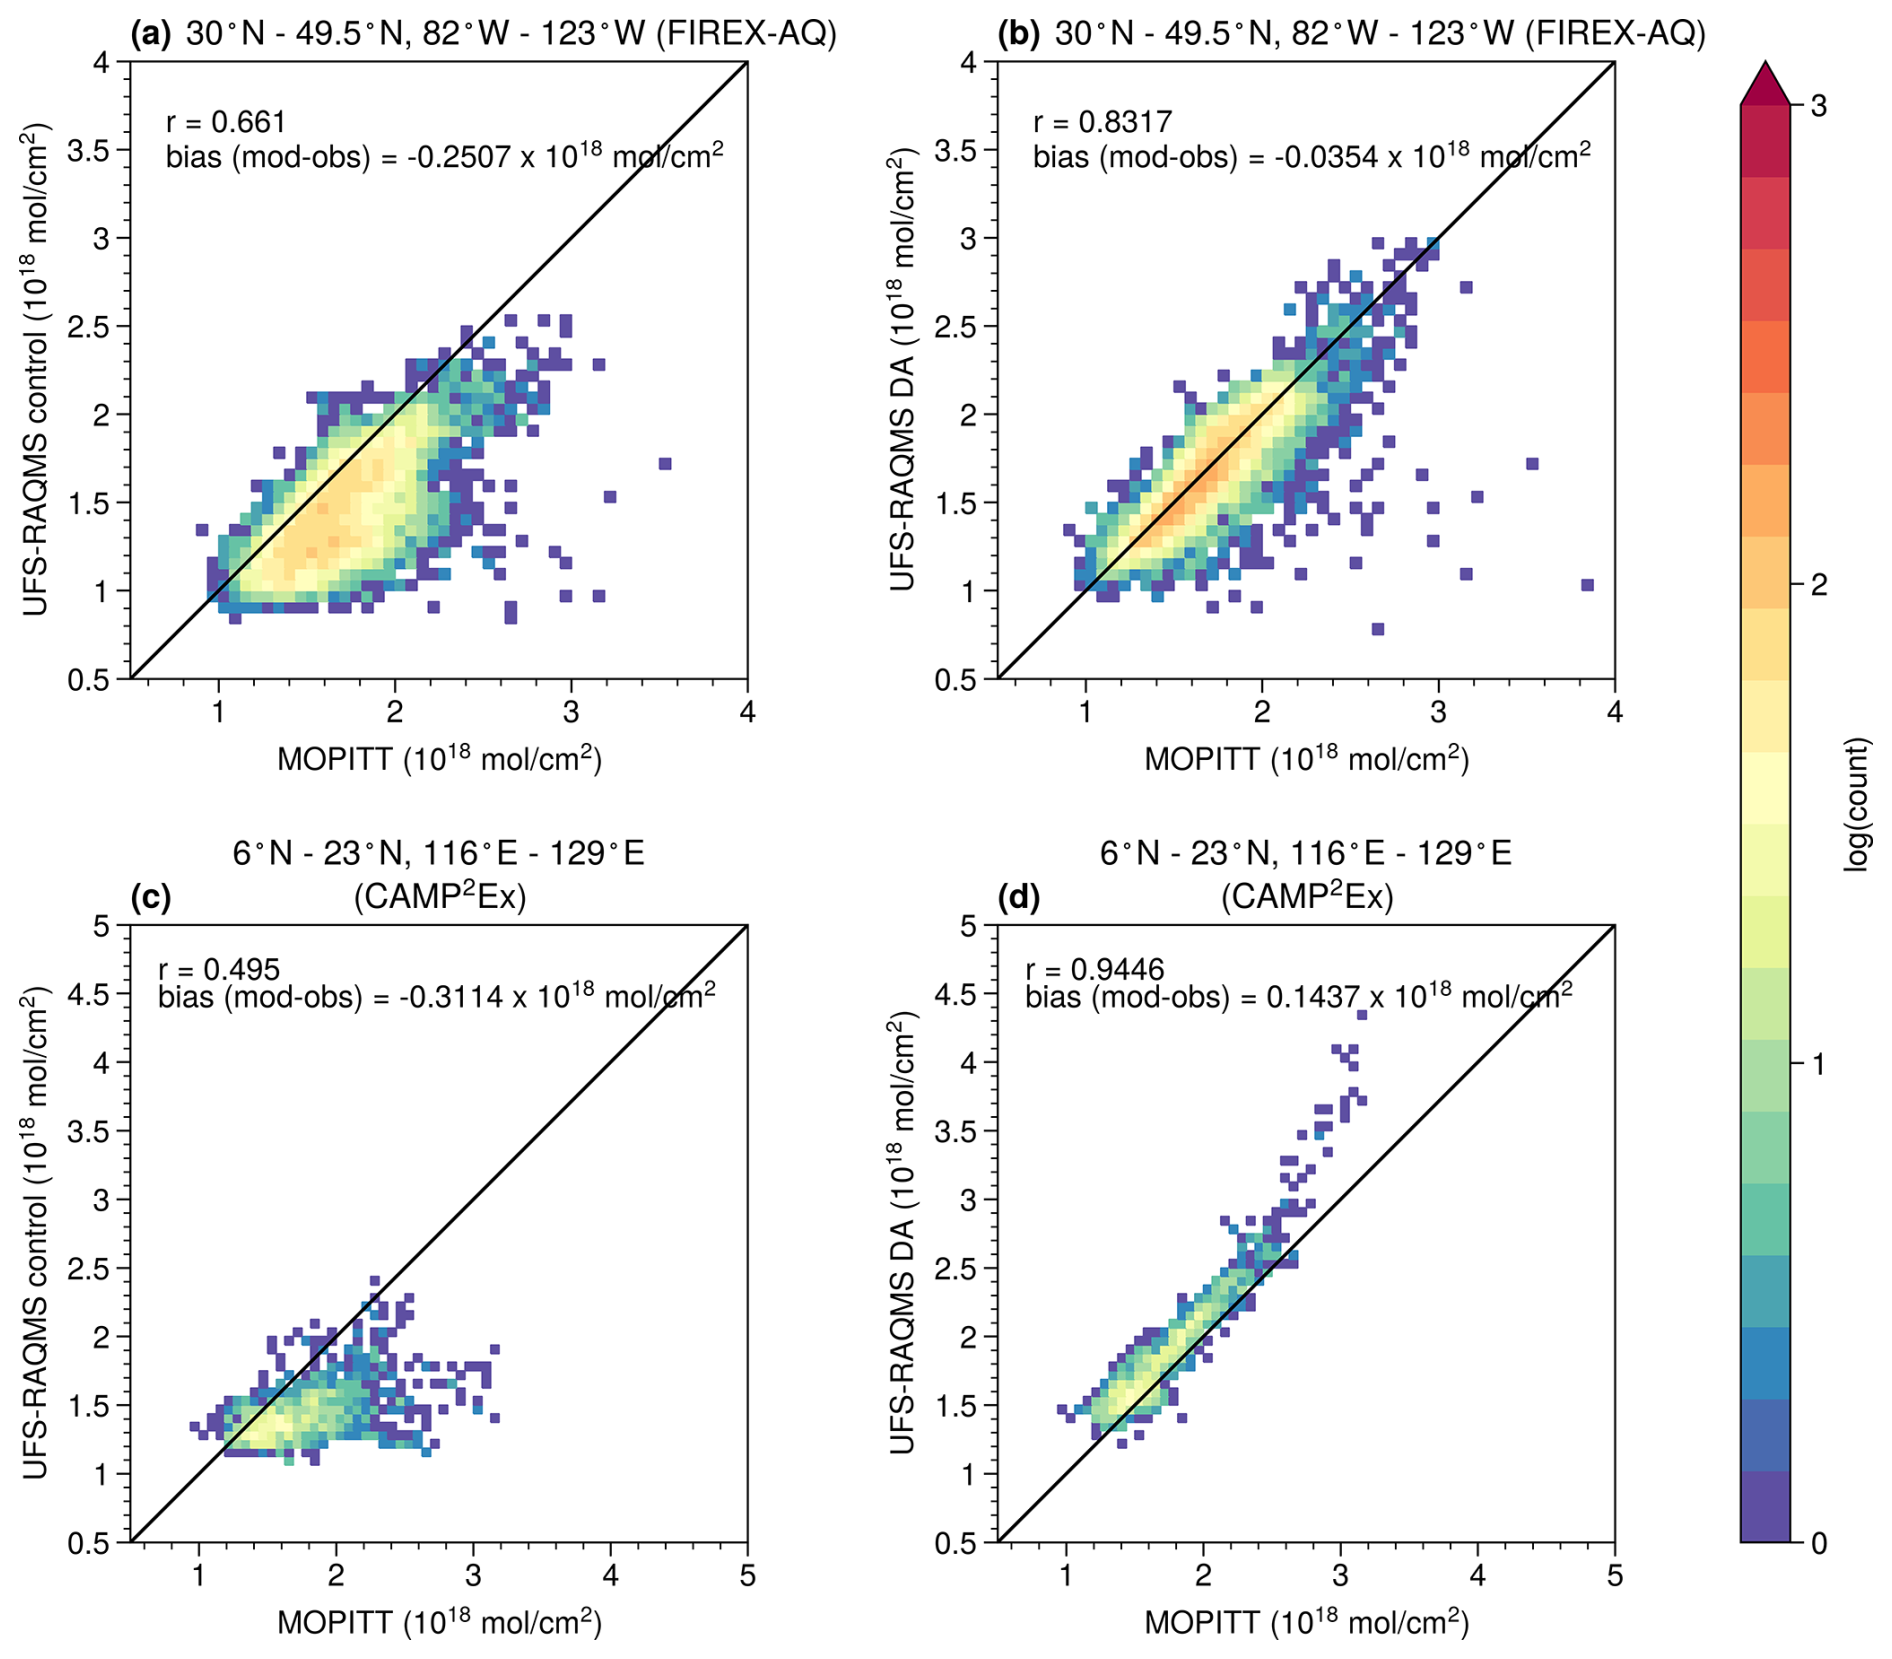
Figure 6Comparisons of MOPITT and UFS-RAQMS CO columns over FIREX-AQ (a, b) and CAMP2Ex (c, d) domains. TROPOMI CO DA increases correlation and decreases bias between UFS-RAQMS and MOPITT.
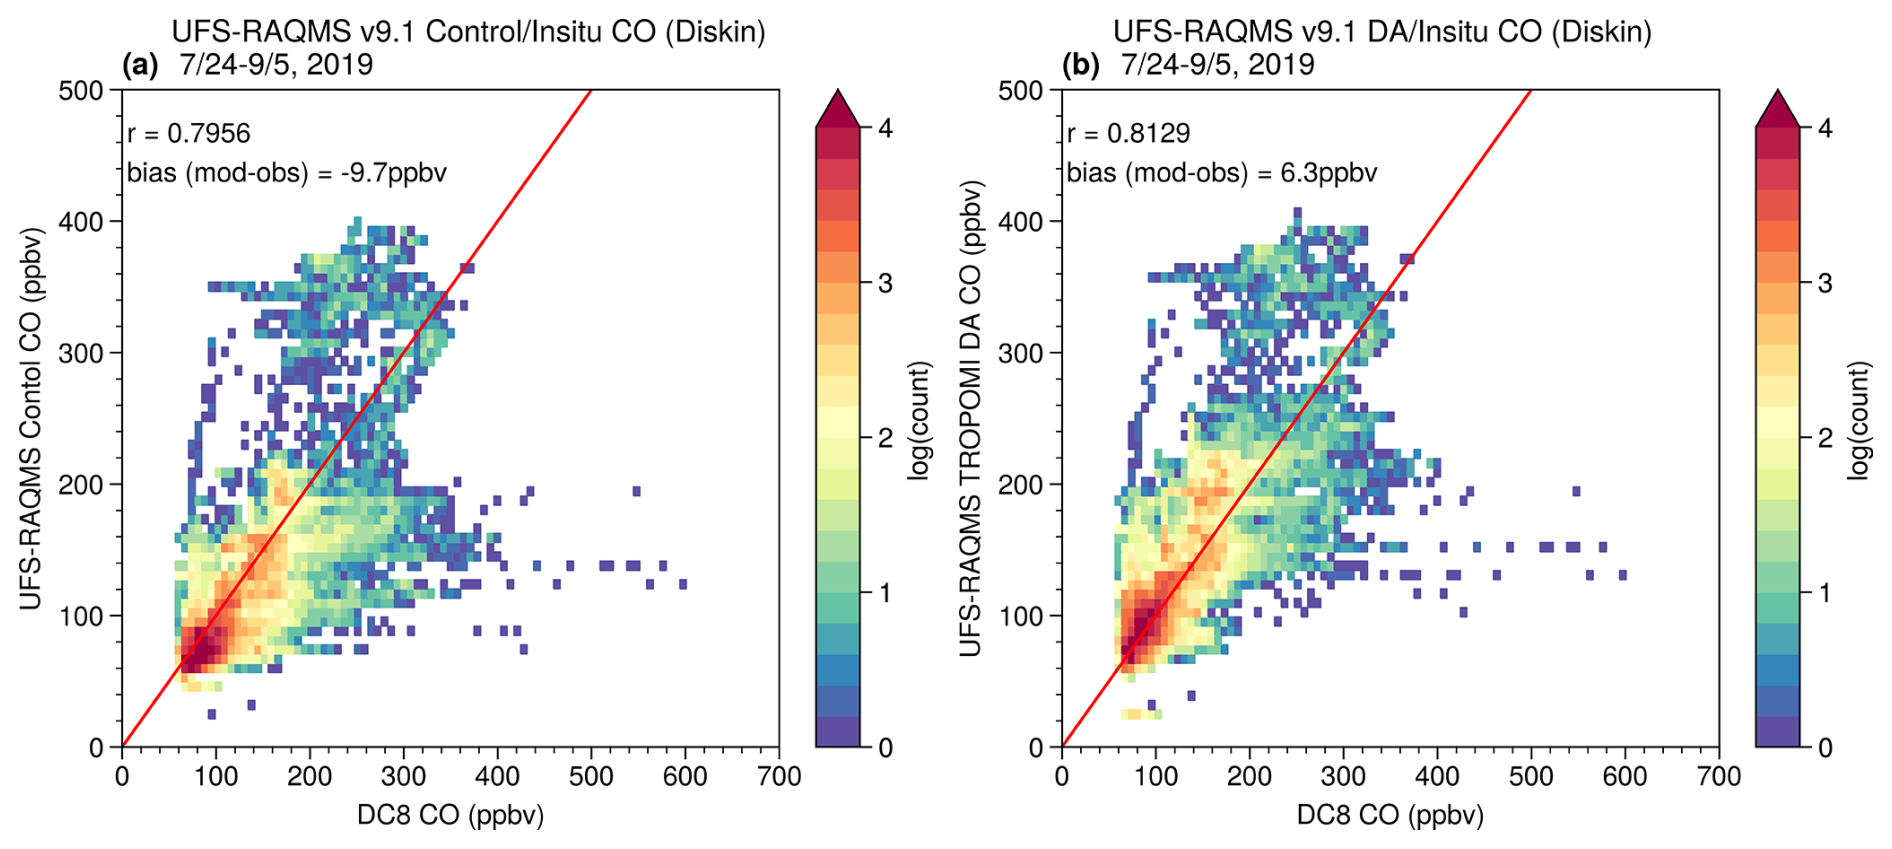
Figure 7Comparison of DC-8 DACOM non-plume CO with (a) UFS-RAQMS control experiment and (b) UFS-RAQMS TROPOMI CO DA experiment.
3.2 Evaluation with independent datasets
We evaluate improvement in UFS-RAQMS CO due to TROPOMI CO DA through validation with independent observations from the Measurements of Pollution in the Troposphere (MOPITT) instrument, the NASA/NOAA FIREX-AQ field campaign, the CAMP2EX field campaign, and NDACC FTIR spectrometers. The control and TROPOMI CO DA experiments are spatially and temporally interpolated to the observation, creating coincident model and observation pairs. For the MOPITT and NDACC comparisons, we apply the observation averaging kernels to the UFS-RAQMS coincident profiles.
3.2.1 MOPITT CO column
We compare UFS-RAQMS total column CO analyses with the MOPITT version 9 Level 3 daily mean CO column product (Deeter et al., 2022). Due to an event upset affecting instrument operation MOPITT data are unavailable for a large portion of the study period (26 July–24 August 2019) (https://www2.acom.ucar.edu/mopitt/status, last access: 10 September 2025). UFS-RAQMS CO is sampled at the 10:30 local overpass time, binned onto the MOPITT Level 3 grid, then linearly interpolated to the MOPITT vertical levels. The MOPITT averaging kernels and a priori are applied to the sampled UFS-RAQMS CO to account for the vertical sensitivity of the MOPITT retrieval. The average daily MOPITT CO column for 15 July–30 September 2019 is shown in Fig. 5a. A root mean square error (RMSE) skill score (Eq. 1) is used to quantify the improvement in the TROPOMI CO DA experiment. The RMSEs for UFS-RAQMS control and UFS-RAQMS TROPOMI CO DA are calculated relative to the MOPITT observations. Negative skill scores indicate that the assimilation degraded the forecast, while positive skill indicates the assimilation increased the accuracy of the forecast. A skill score of 1 indicates that the TROPOMI CO DA experiment captures the CO columns as depicted by MOPITT. A skill score of 0 indicates that the assimilation did not improve the agreement between MOPITT and UFS-RAQMS or that the model has no skill in capturing CO in that region.
For most grid cells the UFS-RAQMS TROPOMI CO DA experiment exhibits improved skill (Fig. 5d). The largest improvements in skill are over Russia, Europe, Alaska, and Canada. Due to the MOPITT data outage, the large Siberian biomass burning events are not captured within the MOPITT observations except for in the first 10 d of the experiment. Therefore, while we are unable to directly verify the increased UFS-RAQMS CO within the Siberian smoke plume during August 2019, we do show that assimilating TROPOMI CO throughout the period significantly improved background CO concentrations in the NH middle and high latitudes. UFS-RAQMS TROPOMI CO DA analyses also show improvement over regions of Africa and the Maritime Continent where there was widespread biomass burning during the analysis period. TROPOMI CO DA results in slight improvements over the Pacific Ocean and negative skill in the eastern tropical Pacific near the coast of Mexico.
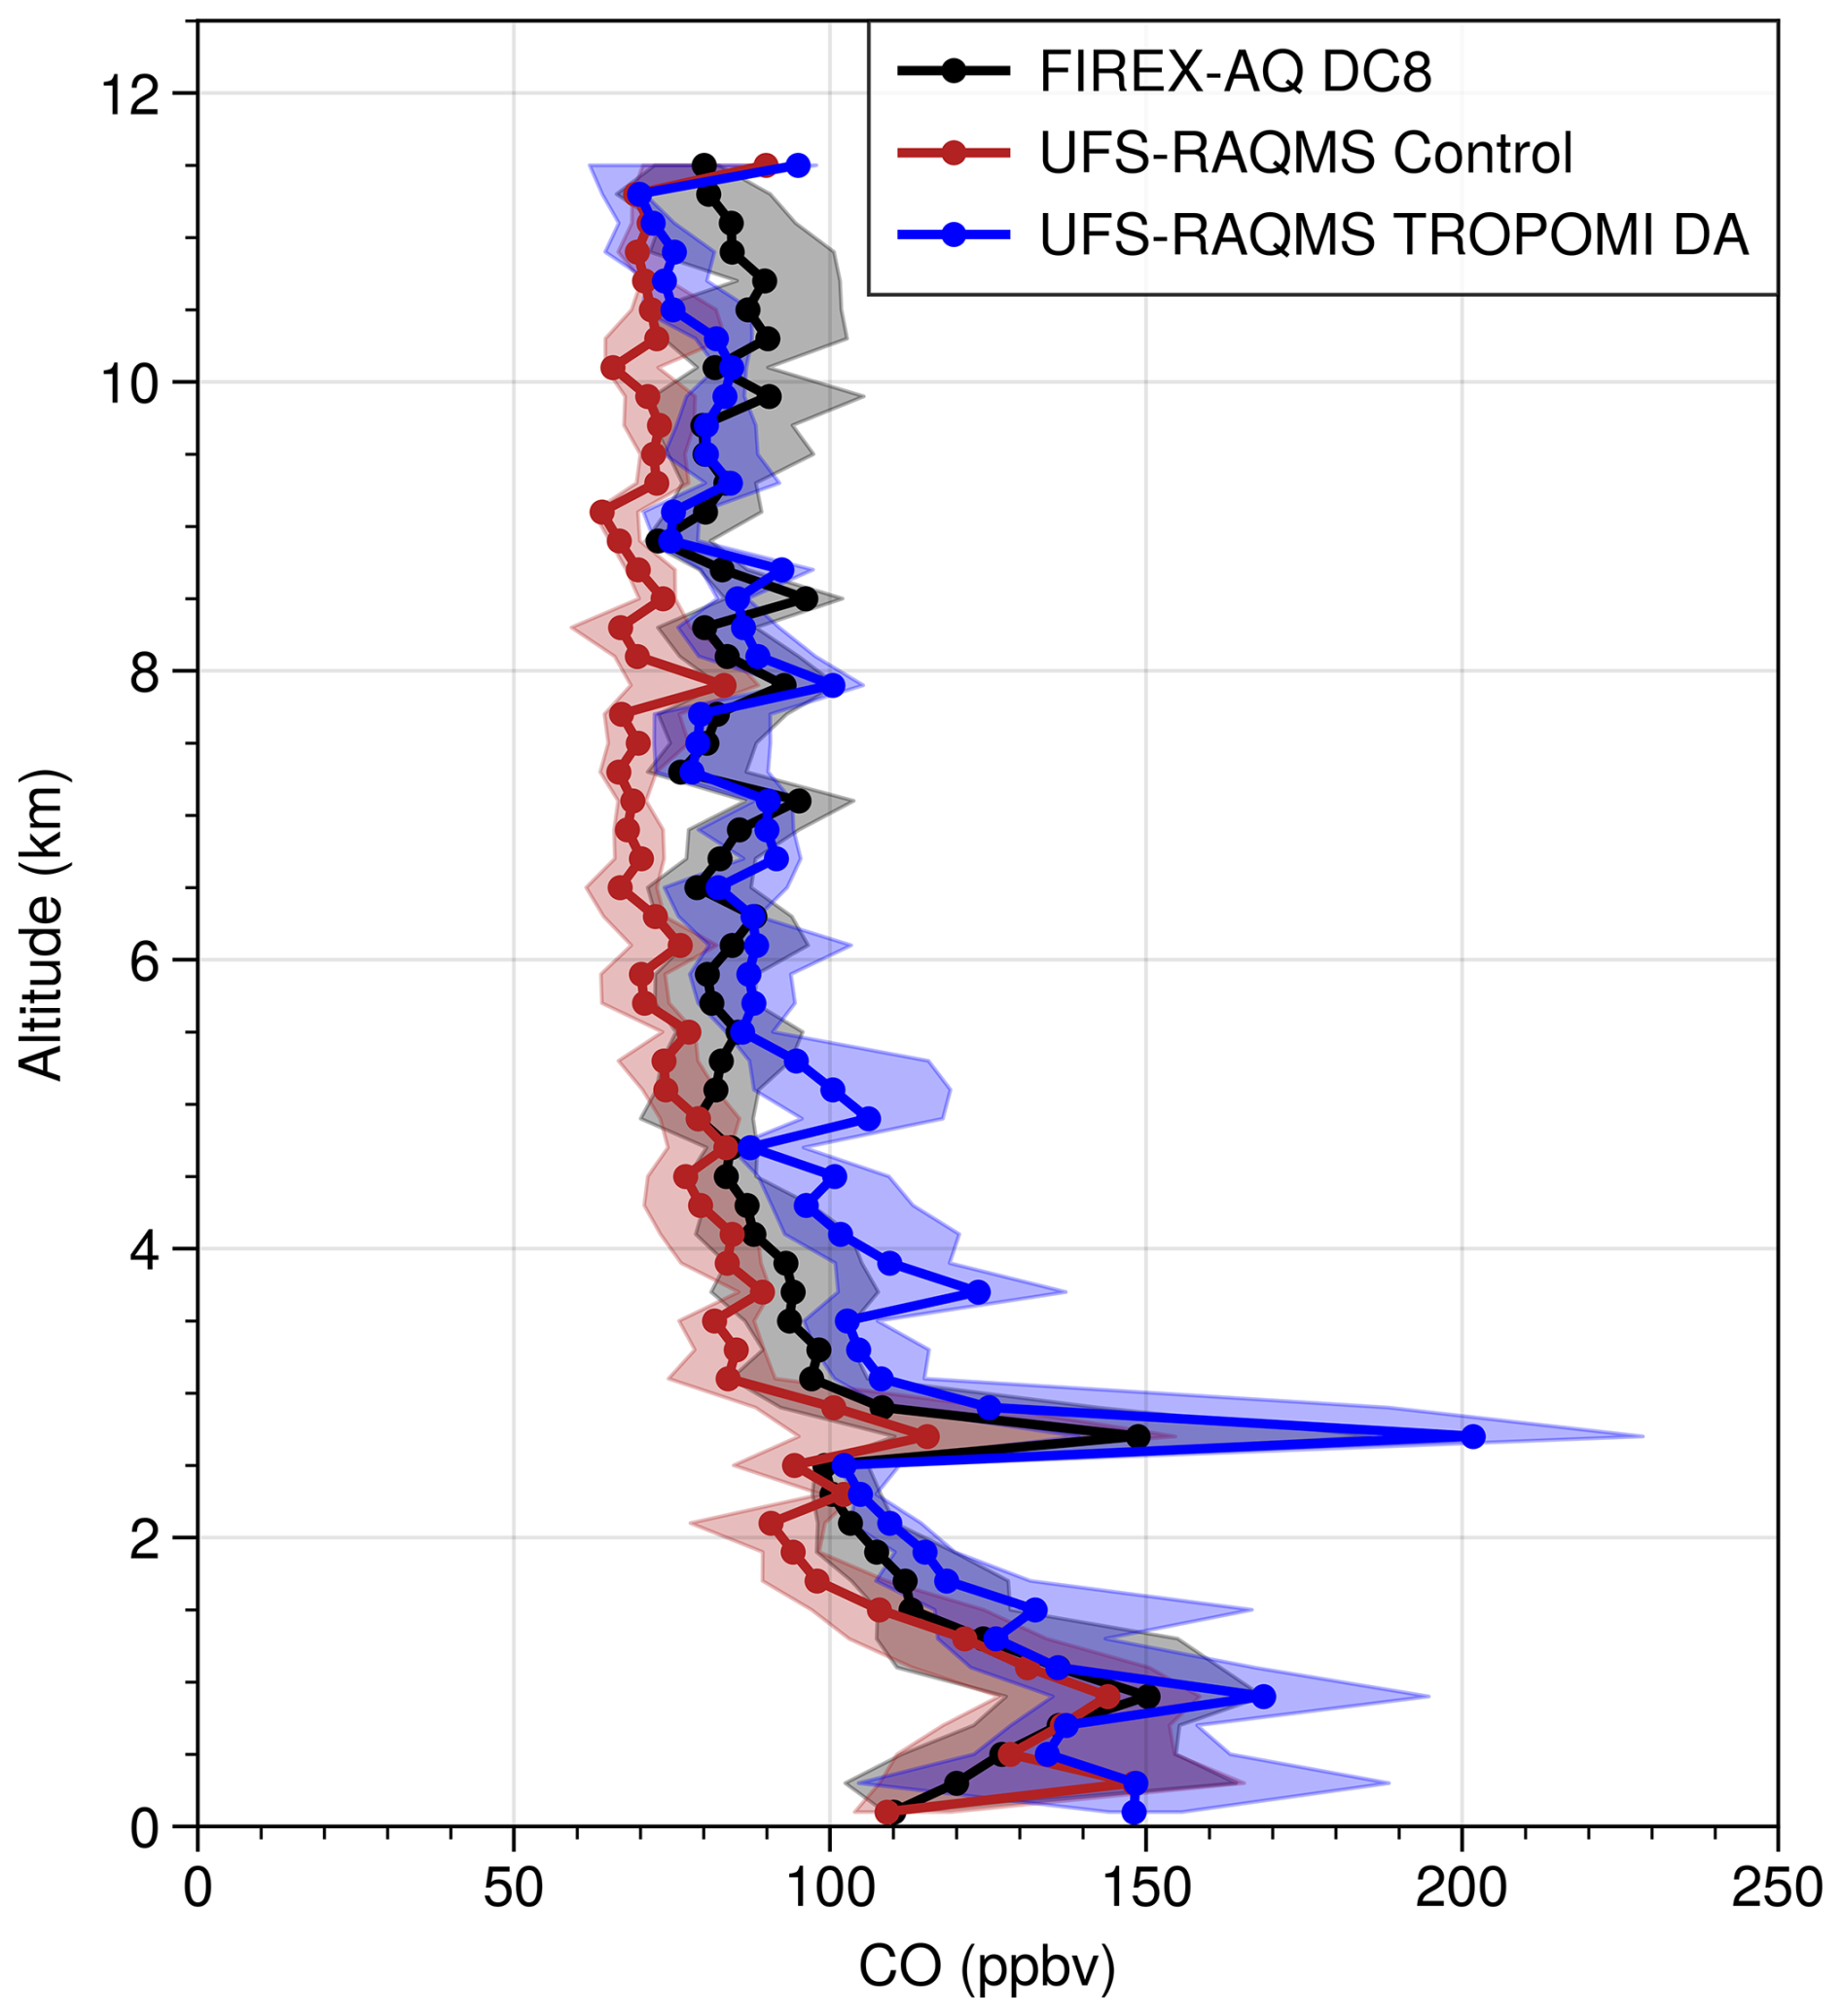
Figure 8Vertical profiles of non-smoke CO during FIREX-AQ for DC-8 DACOM CO (black), UFS-RAQMS control experiment (red), and UFS-RAQMS TROPOMI CO DA experiment (blue).
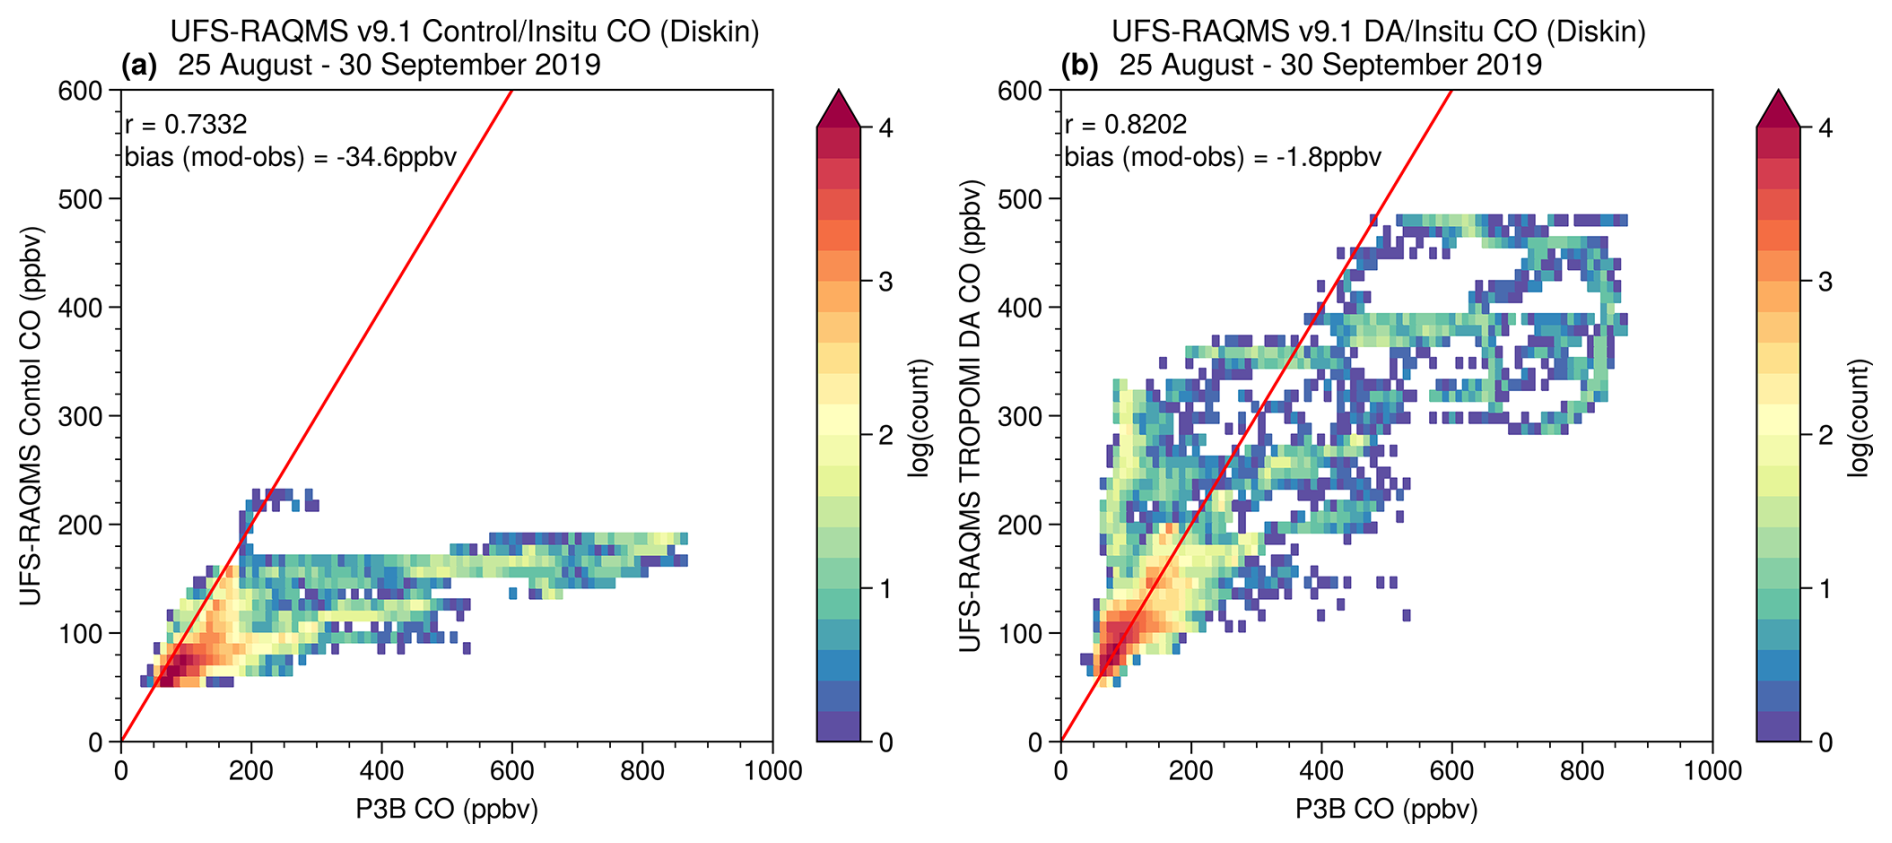
Figure 9Comparison of CAMP2Ex P3-B CO with (a) UFS-RAQMS control experiment and (b) UFS-RAQMS TROPOMI CO DA experiment.
In addition to the RMSE skill score, we compare the daily mean UFS-RAQMS CO column analyses with MOPITT CO columns over the FIREX-AQ and CAMP2Ex field campaign domains in Fig. 6. Correlation and bias are calculated between all observations made from 15 July–30 September 2019 over 30–49.5° N, 82–123° W (Fig. 6a and b) and 6–23° N, 116° E–129° W (Fig. 6c and d). Over the FIREX-AQ domain, TROPOMI CO DA increases correlation of UFS-RAQMS with MOPITT from 0.661 to 0.8317 and decreases the bias from to mol cm−2. Over the CAMP2Ex domain, TROPOMI CO DA increases correlation of UFS-RAQMS with MOPITT from 0.495 to 0.9446 and decreases the bias from to 0.1437×10¹⁸ mol cm−2.
3.2.2 FIREX-AQ in situ measurements
Over the continental US from July–September the Differential Absorption Carbon Monoxide Measurement (DACOM) instrument (Sachse et al., 1991) made measurements on board the NASA DC-8 as part of the FIREX-AQ field campaign. FIREX-AQ sampling of smoke plumes with the DC-8 consisted of multiple perpendicular transects through the plume, with each perpendicular leg sampling smoke emitted around the same time, and the legs starting in the freshest smoke (Warneke et al., 2023). The resulting FIREX-AQ highly detailed measurements capture fine-scale changes in composition in both the cross-plume direction and as the emissions age. In the following comparisons, in-plume measurements are excluded from the analysis as the horizontal resolution of the UFS-RAQMS simulations is not fine enough to capture the observed in-plume enhancements that were measured by the DC-8 close to the western US wildfires and SE US agricultural fires targeted during FIREX-AQ. In-plume and background measurements are separated using the flags provided through the FIREX-AQ data archive, which identify enhancement in CO and black carbon above background (Warneke et al., 2023).
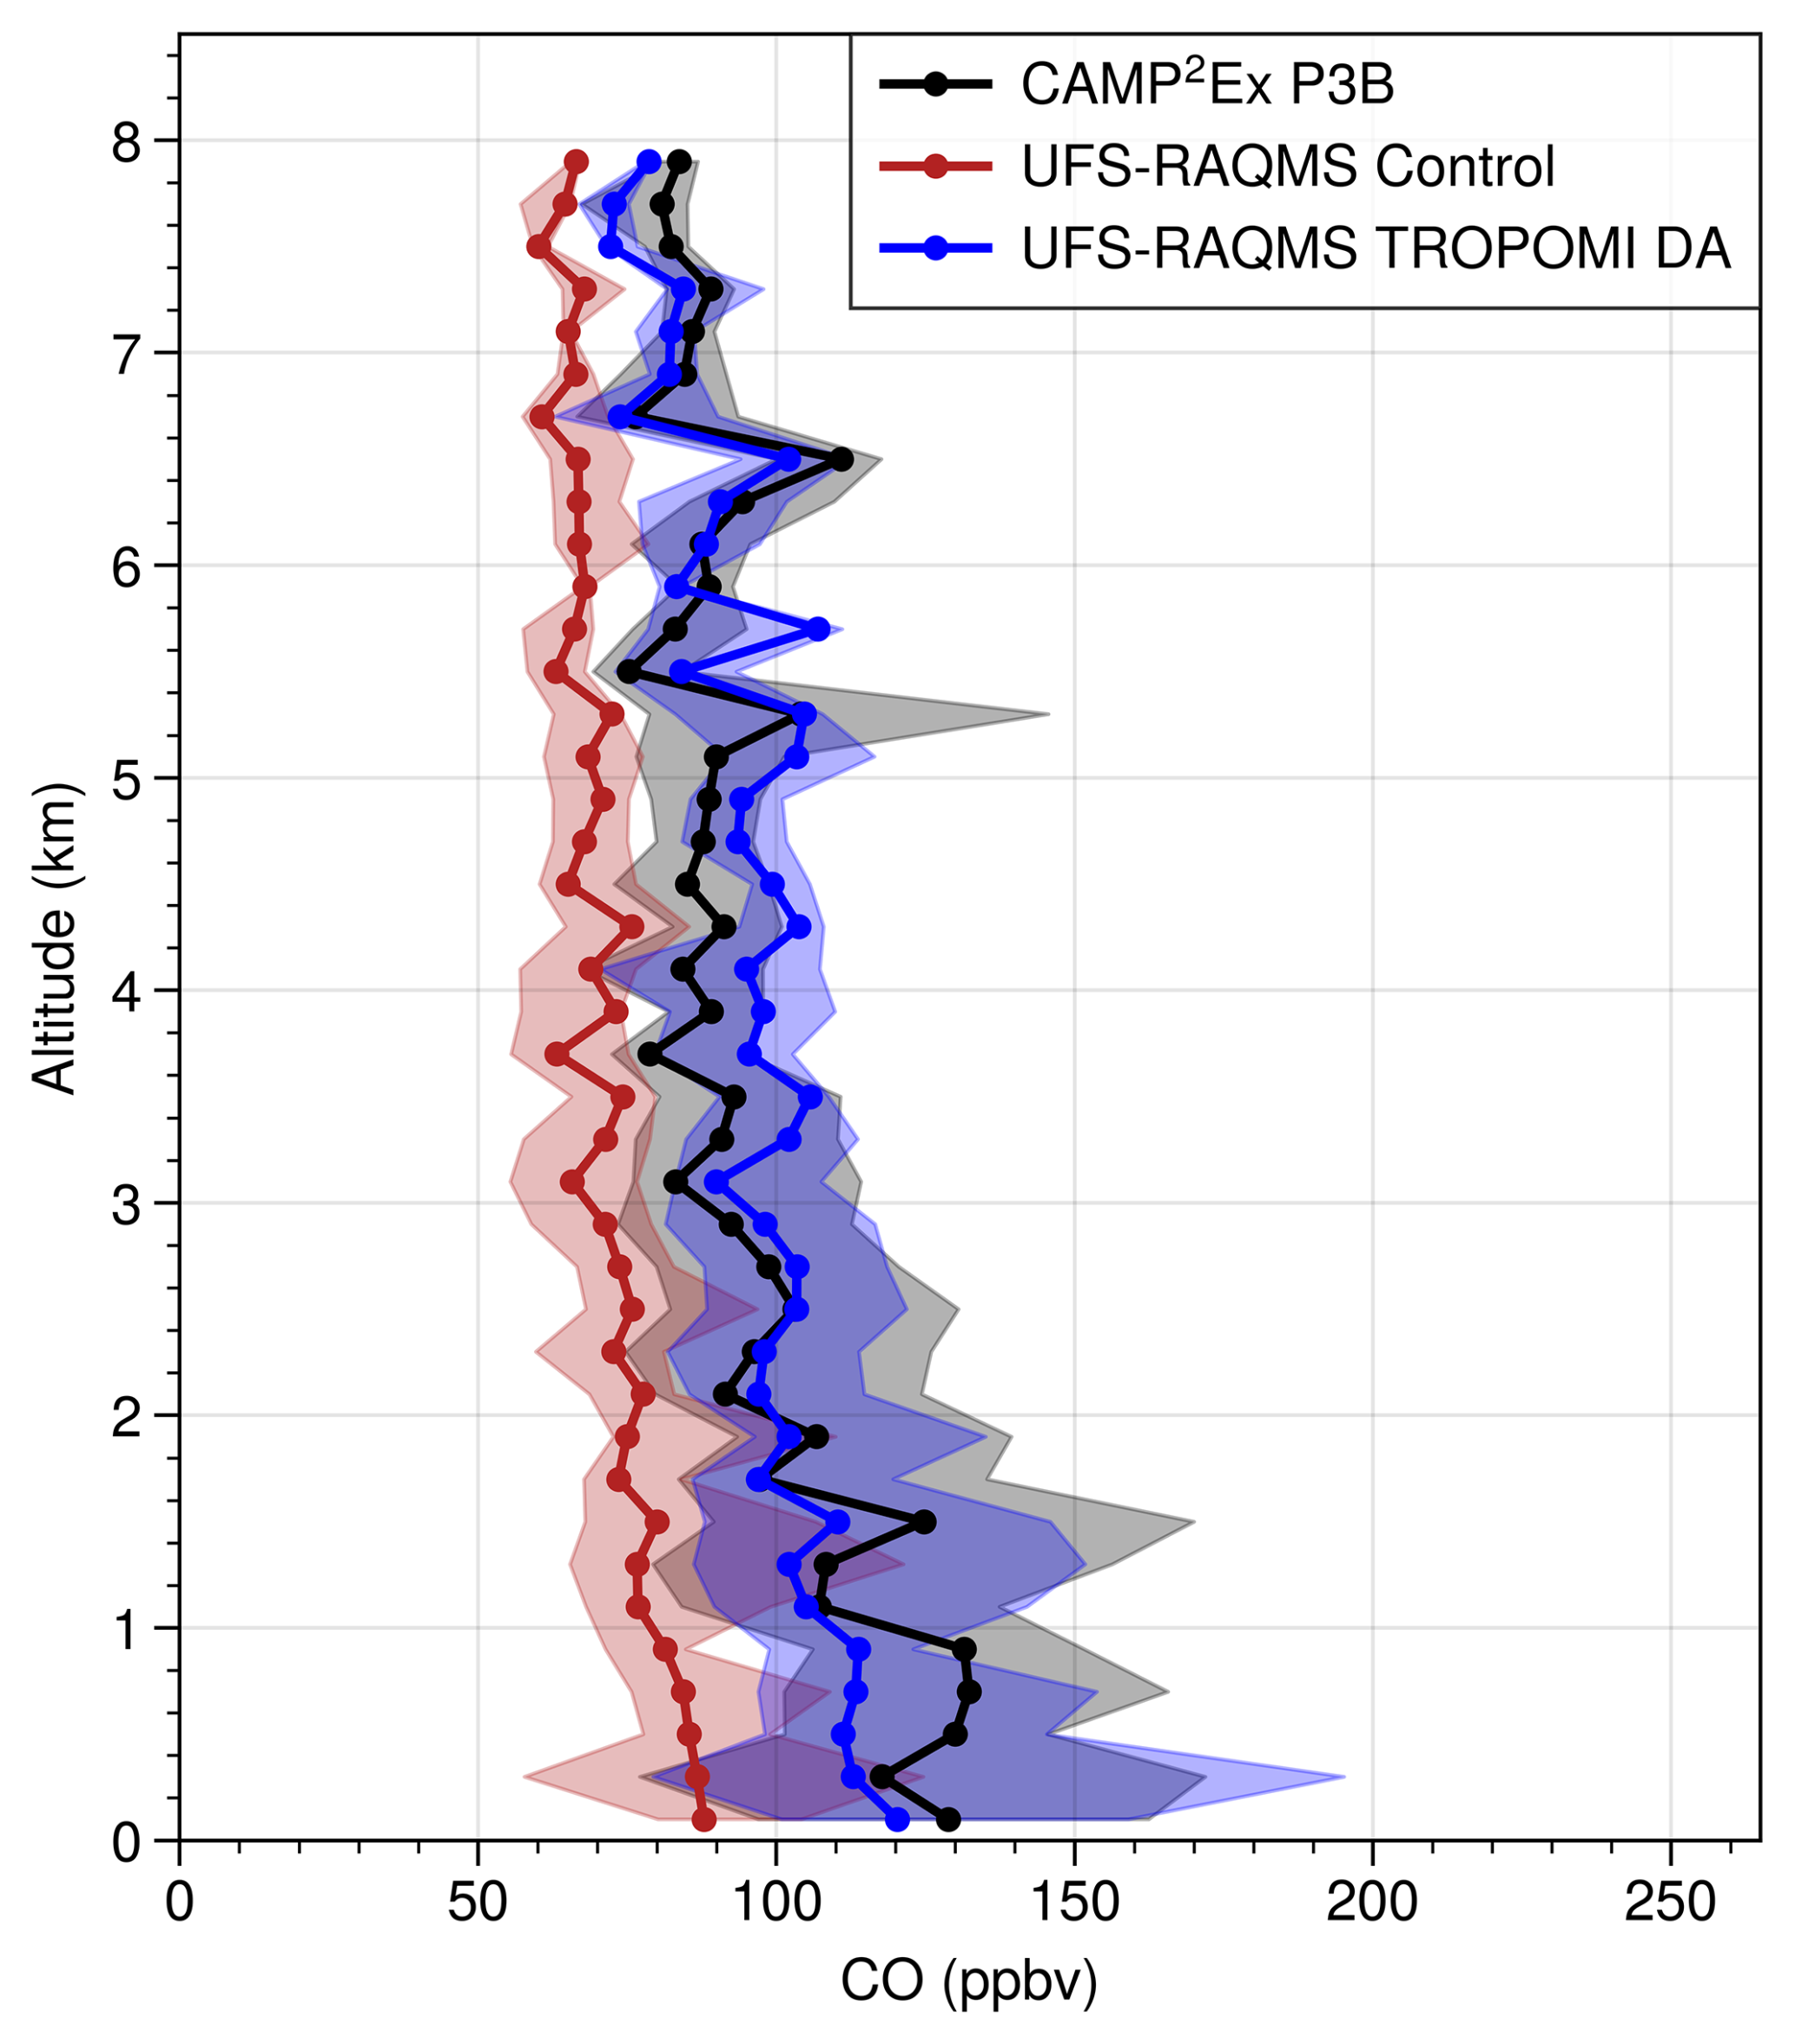
Figure 10Vertical profiles of CO during CAMP2Ex for P-3 CO observation (black), UFS-RAQMS control experiment (red), and UFS-RAQMS TROPOMI CO DA experiment (blue).
Figure 7 shows the comparison between UFS-RAQMS and the DC-8 DACOM CO observations for non-smoke plume observations for all flights during FIREX-AQ. UFS-RAQMS CO is strongly correlated with the observed CO for both the control (0.7956) and the TROPOMI CO DA experiment (0.8129). TROPOMI CO DA improves the average bias from −9.7 to 6.3 ppbv.
Figure 8 shows a comparison of the vertical profiles for the FIREX-AQ DACOM CO non-plume observations and coincident UFS-RAQMS analyses. Following the interpolation of the UFS-RAQMS analyses along the DC-8 flight track and filtering out in-plume observations, the modeled and measured values were binned into 200 m altitude bins. The median (vertical profile) and 25th and 75th (shaded) percentiles of the modeled and observed distributions within each 200 m altitude bin are shown. Below 2 km the control and TROPOMI CO DA experiment profiles are both within the spread for the observed profile. Above 2.5 km the control experiment profile is consistently biased low relative to the observed profile. The TROPOMI CO DA experiment profile is higher than in the control experiment and shows improved agreement with the DC-8 observations.
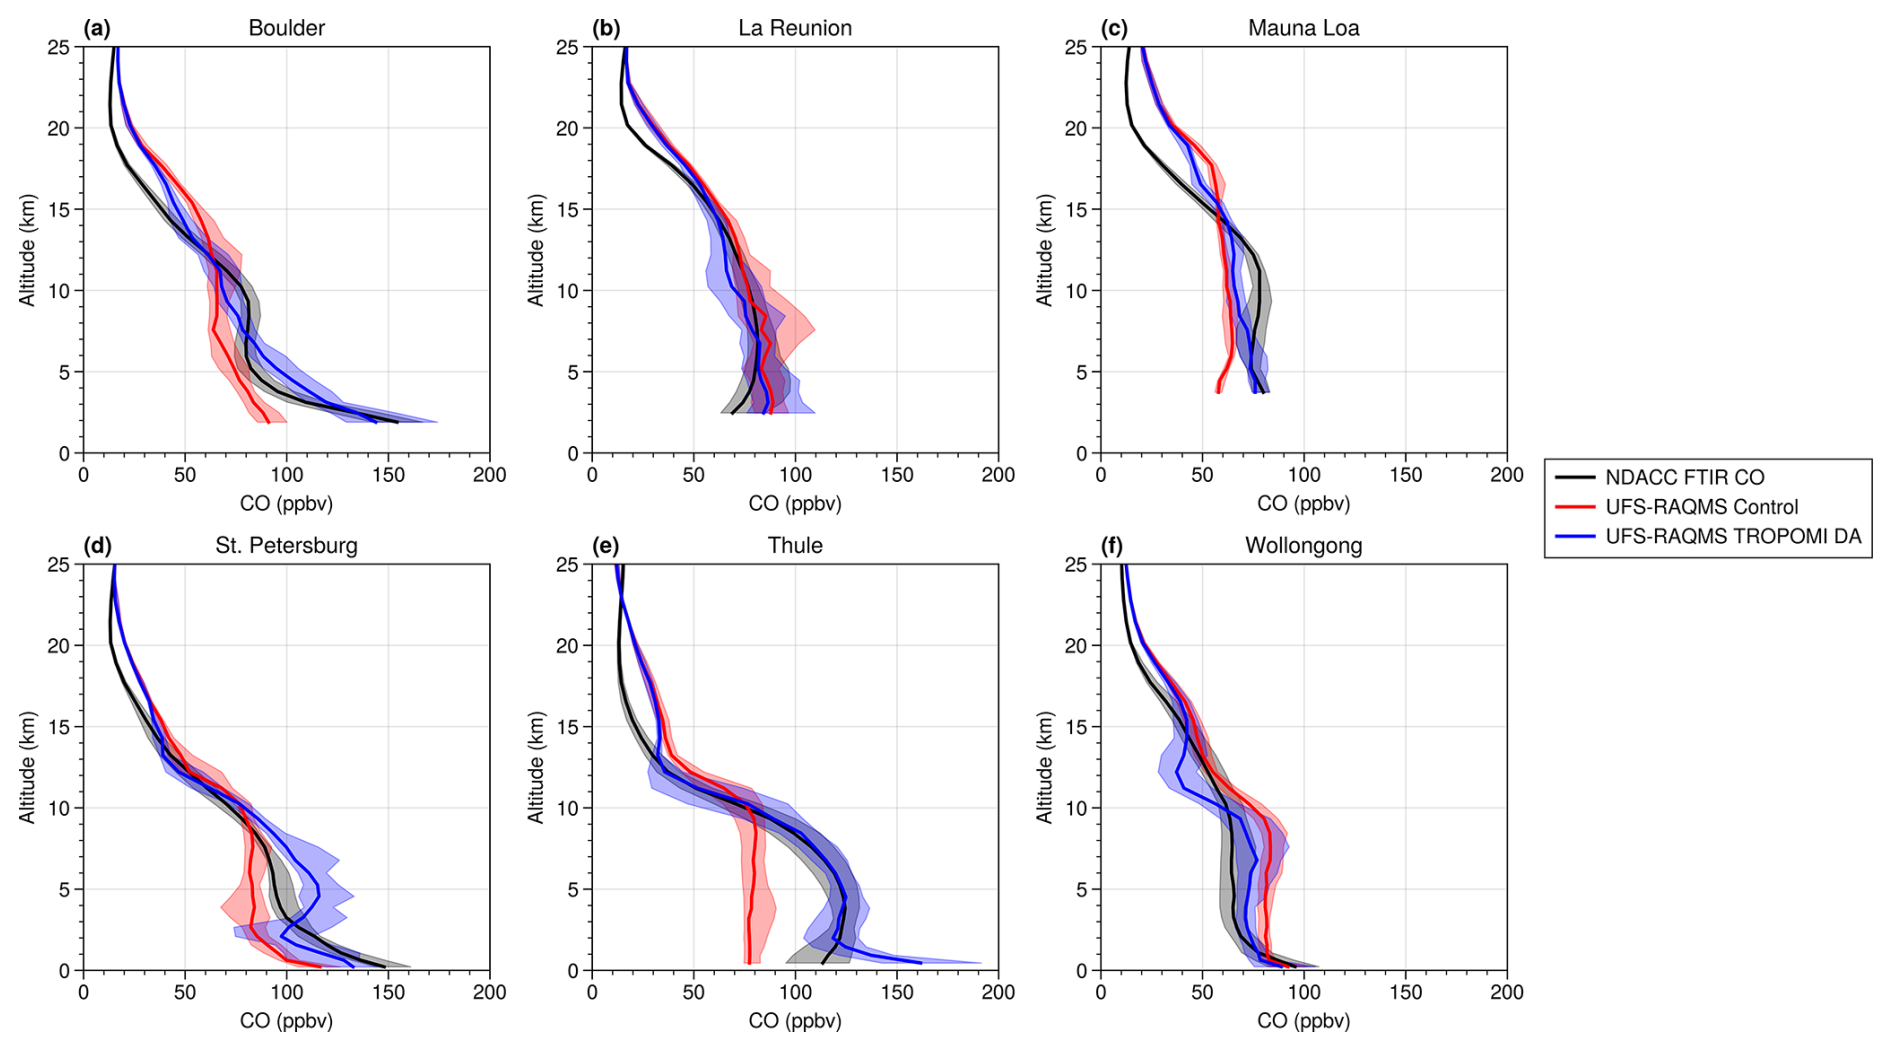
Figure 11Comparison of CO profiles from NDACC FTIR (black), UFS-RAQMS control (red), and UFS-RAQMS DA (blue). Solid lines indicate the median, and shading indicates the 25th–75th percentile.
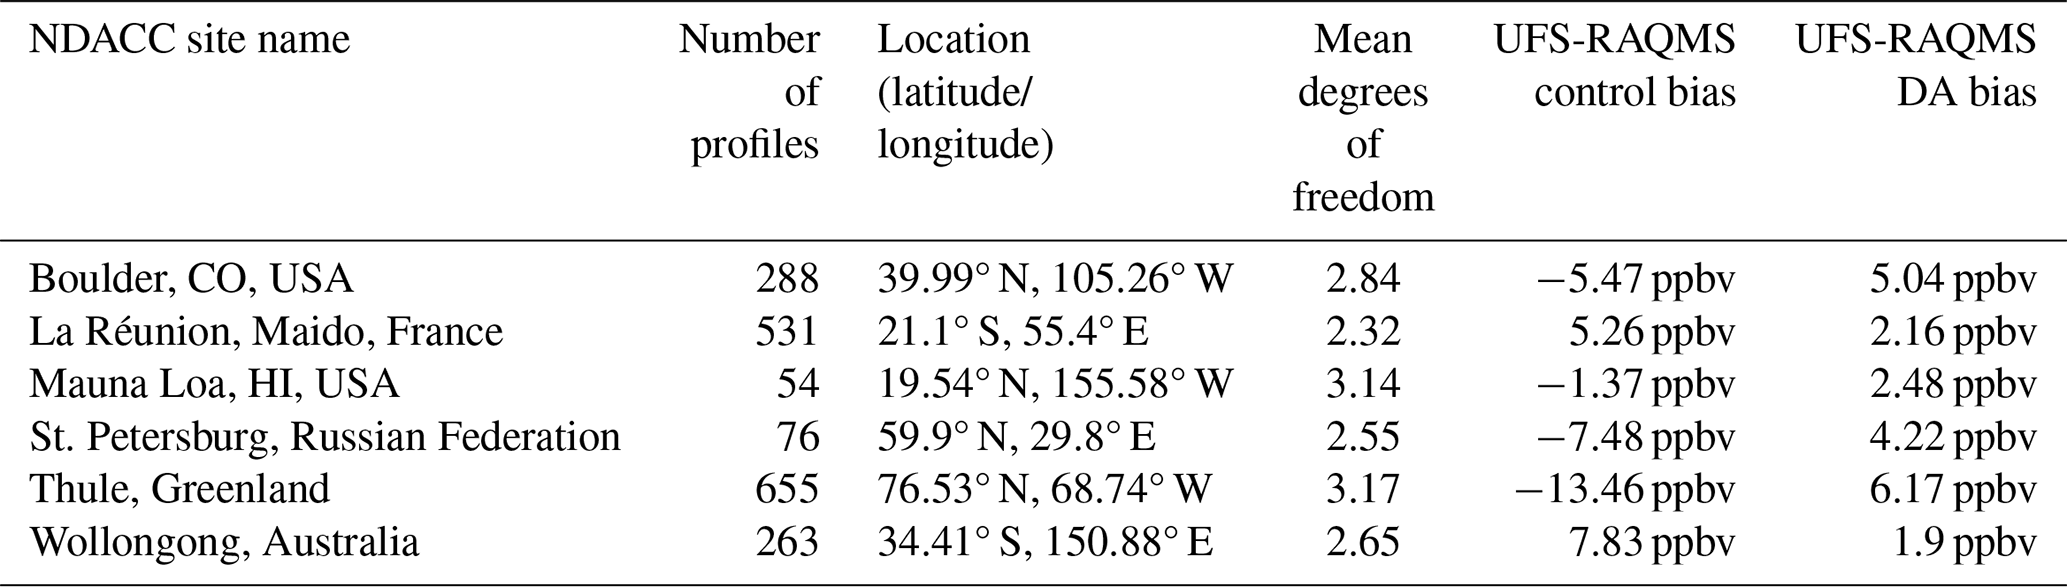
Table 1Location of NDACC FTIR sites used in this study. The number of profiles taken from 15 July–30 September 2019 and average bias below 25 km for the control and TROPOMI DA UFS-RAQMS experiments are included.
3.2.3 CAMP2Ex in situ measurements
The NASA CAMP2Ex field campaign sampled air masses over the Philippines from 25 August–5 October 2019 with the NASA P-3 aircraft to investigate the role of aerosols in the Southeast Asian southeast monsoon (Reid et al., 2023). During the campaign, the region was impacted by significant biomass burning. In situ CO measurements were made by a commercial cavity ring-down spectrometer (G2401-m, PICARRO, Inc.) modified with a custom gas sampling system (DiGangi et al., 2021). UFS-RAQMS analyses are sampled along the P-3 flight track. Since the P-3 did not sample within the fresh biomass burning plumes during CAMP2Ex we did not apply an in-plume filter to the in situ CO measurements. Figure 9 shows the comparison between UFS-RAQMS and the CAMP2Ex P-3 CO measurements. The UFS-RAQMS control experiment has a low bias of −34.6 ppbv relative to the observations and is moderately correlated (0.7332). Assimilating TROPOMI CO decreases the bias in the analysis significantly to −1.8 ppbv and improves the correlation (0.8202).
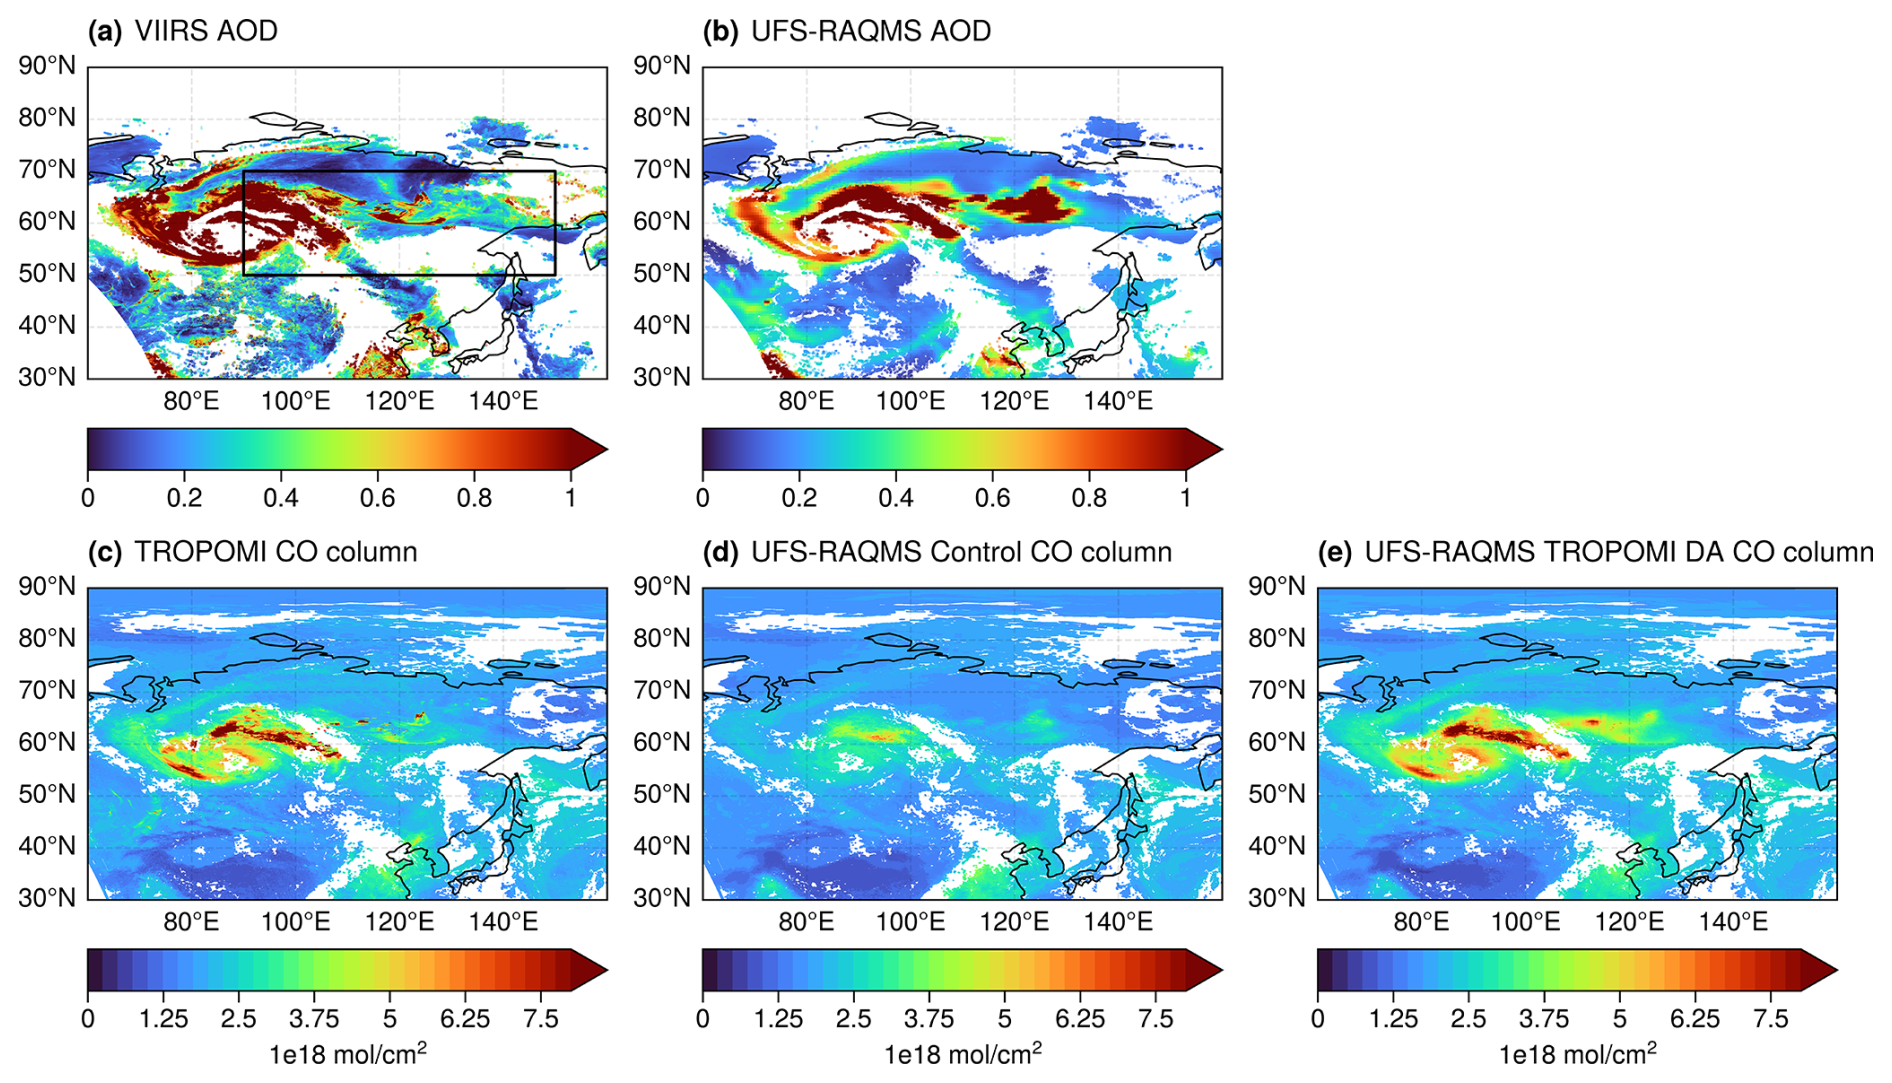
Figure 12The 22 July 2019 AOD and CO columns over Siberia. VIIRS AOD (a), UFS-RAQMS AOD (b), TROPOMI CO column (c), UFS-RAQMS control (d), and TROPOMI CO DA (e) CO column. The black box in panel (a) defines the region 90–150° E, 50–70° N for AOD/CO column relationship analysis.
Figure 10 shows a comparison of the vertical profiles for the CAMP2Ex CO observations and coincident UFS-RAQMS analyses. Following the interpolation of the UFS-RAQMS analyses along the P-3 flight track, the modeled and measured values were binned into 200 m altitude bins. The median (vertical profile) and 25th and 75th (shaded) percentiles of the modeled and observed distributions within each 200 m altitude bin are shown. Below 7 km, the UFS-RAQMS control experiment profile is biased low by ≥20 ppbv (≥20 %) relative to the observed profile. This low bias is largest in the lowest 1.5 km where it exceeds −40 %. The UFS-RAQMS TROPOMI CO DA experiment profile is generally within the 25th–75th percentiles of the CAMP2Ex observations, though between ∼3.5 and 5 km the UFS-RAQMS DA CO profile is biased high and may indicate a slight overcorrection. The lowest 1 km of the profile is still biased low, though it is now only 10 %–20 %.
The comparisons of UFS-RAQMS to the in situ FIREX-AQ and CAMP2Ex observations show that TROPOMI CO DA improves the correlation and bias statistics. This is consistent with the MOPITT statistics over the campaign domains. However, the improvement in the statistics is better for UFS-RAQMS CO columns than for the UFS-RAQMS CO profiles. This is a result of using a total column measurement to constrain the UFS-RAQMS CO analysis. UFS-RAQMS control CO is strongly correlated with the in situ observations, indicating along with the profiles that the vertical structure and temporal variation in CO concentration are reasonably captured in UFS-RAQMS for these regions. The DA system distributes the analysis increment vertically based on model blended BEC statistics and knowledge of observation errors and vertical sensitivities. Over the CAMP2Ex domain this leads to an overestimation of CO at 3–6 km. Over the FIREX-AQ domain this leads to an overestimate of CO below 6 km and underestimates above 10 km. In the UFS-RAQMS TROPOMI CO DA experiment column, the effects of the adjustments compensate for each other.
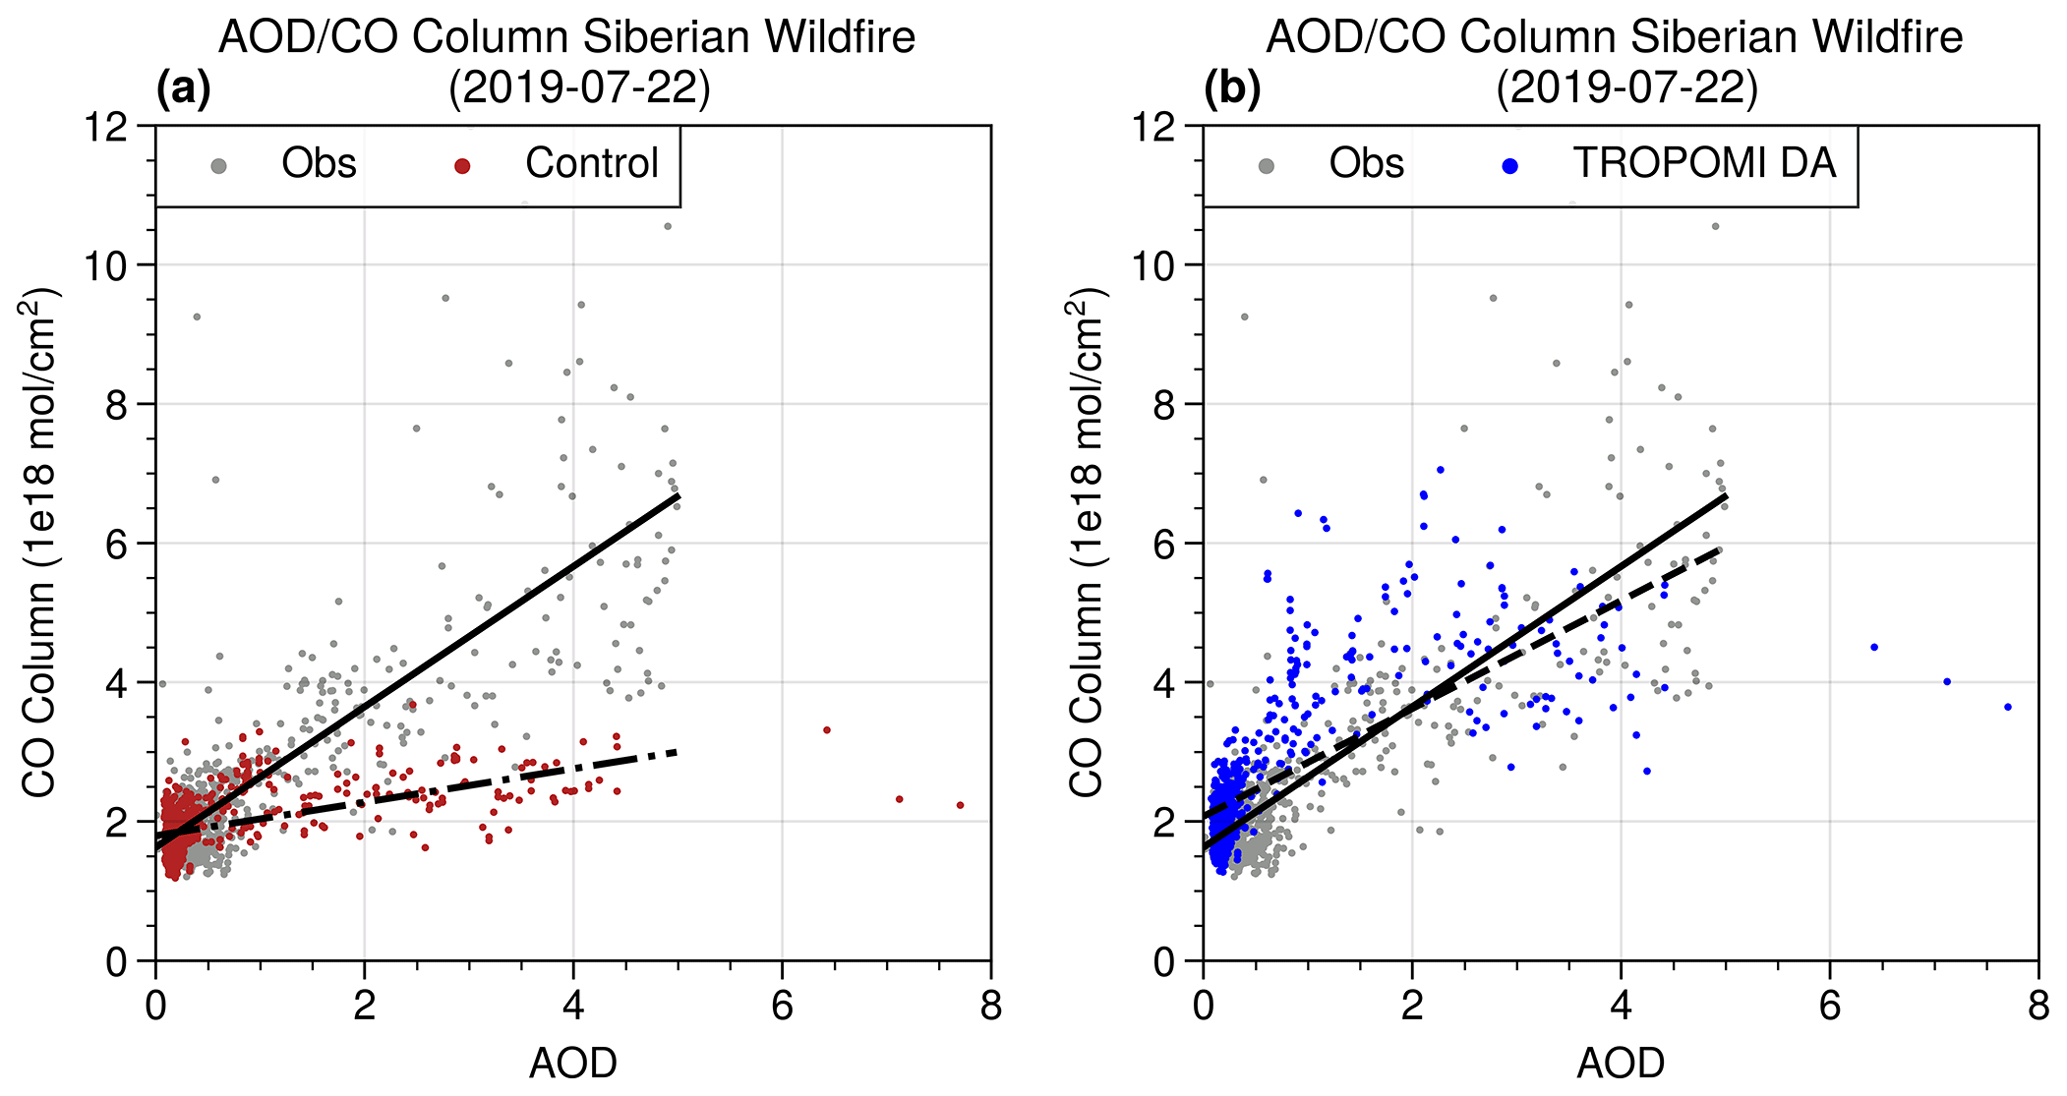
Figure 13Linear relationship between AOD and CO column in Siberian wildfire smoke (90–150° E, 50–70° N) on 22 July 2019. UFS-RAQMS control (a, red) and UFS-RAQMS TROPOMI CO DA (b, blue) AOD/CO relationships are compared to observed VIIRS AOD/TROPOMI CO (gray).
3.2.4 NDACC FTIR
UFS-RAQMS CO profiles are also evaluated with FTIR CO profile observations from six NDACC sites (Table 1). The selected NDACC FTIR spectrometers retrieve volume mixing ratio profiles from solar absorption spectra with optimal estimation using the SFIT4 algorithms (https://wiki.ucar.edu/display/sfit4/, last access: 19 July 2024).
UFS-RAQMS analyses were paired to the NDACC FTIR locations using a nearest-neighbor approach in the horizontal followed by linear interpolation in the time and vertical dimensions. NDACC FTIR averaging kernels and a priori profiles (Figs. S2 and S3) are then applied to the UFS-RAQMS profiles. The degrees of freedom for each site (Table 1) indicate that two to three independent layers can be resolved. Figure 11 shows a comparison of NDACC FTIR CO profiles with UFS-RAQMS. The influence of TROPOMI CO DA on the CO profile is small above 15 km, with both the control and the TROPOMI CO DA experiment generally overestimating CO concentrations in this region. The most significant differences between the control and TROPOMI CO DA experiments occur below 10 km except for at Wollongong where the most significant difference is at 11–12 km (Fig. 11f). The Wollongong site is at 34.41° S, 150.88° E, where the mean impact of the DA is a 20 %–30 % decrease in CO (Sect. 3.1, Fig. 4). At Wollongong, the TROPOMI CO DA reduces the average high bias by 5–15 ppbv from 1–5 km and ∼10 ppbv from 5–10 km but creates a low bias of ∼15–20 ppbv from 10–12 km.
Consistent with the percent change in CO between the control and TROPOMI CO DA experiments at high latitudes in Fig. 4, the Thule profile shows a significant increase in the profile due to the TROPOMI CO DA and results in very good agreement with the observed NDACC profile from 2–13 km. At Thule the near-surface CO concentration is biased high in the TROPOMI CO DA experiment, while it is biased low in the control. This behavior is not apparent at the other sites and may be a consequence of the use of static BEC at these latitudes. Recall that the BEC statistics obtained by this study are a function of latitude and altitude and in the lower troposphere reflect the sensitivity of UFS-RAQMS to biomass burning emissions. Profiles of the analysis increments at NDACC locations on the days that measurements were made (not shown) indicate that the near-surface analysis increment is comparatively large ( ppbv) at Boulder, St. Petersburg, and Thule. For Boulder and St. Petersburg, it appears that the TROPOMI CO DA is able to correct CO for biases in anthropogenic emissions since these sites were not significantly impacted by wildfires.
At the tropical NDACC sites of Mauna Loa and La Réunion changes are small. TROPOMI CO DA slightly decreases UFS-RAQMS CO at La Réunion and increases it below 15 km at Mauna Loa.
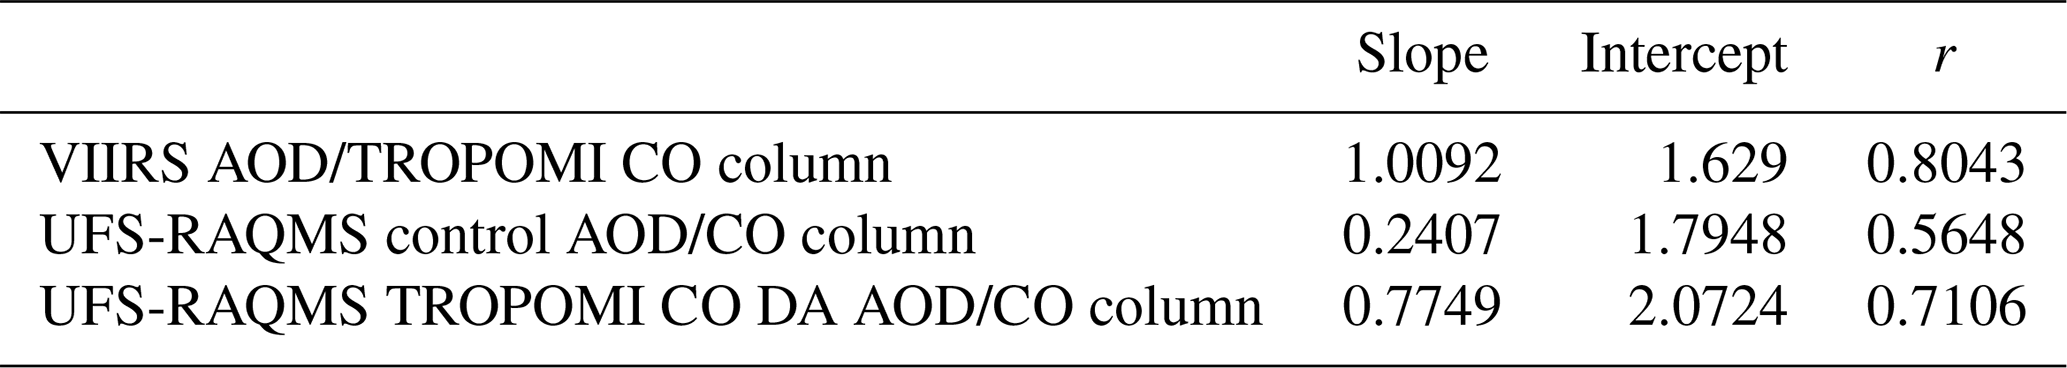
Table 2Linear relationship between AOD and CO in Siberian wildfire smoke (90–150° E, 50–70° N) on 22 July 2019.
A strong relationship between black carbon aerosols and CO has been observed in air masses dominated by biomass burning emissions (e.g., Arellano et al., 2010; Spackman et al., 2008) due to their co-emission during combustion. Similarly, satellite aerosol optical depth (AOD) and CO column observations are strongly correlated over regions where biomass burning is the dominant contributor to fine-mode AOD (e.g., Bian et al., 2010; Edwards et al., 2004, 2006). The correlation in space and time between AOD and CO is stronger in the Southern Hemisphere, while in the NH peak AOD and CO loadings are offset due to the higher anthropogenic pollutant loading (Bian et al., 2010; Buchholz et al., 2021; Edwards et al., 2004). Due to the shorter lifetime of biomass burning aerosols, enhancements in AOD are a strong indicator of biomass burning emissions sources, while CO is a good tracer of downwind impacts of those emissions due to its longer lifetime (e.g., Bian et al., 2010; Buchholz et al., 2021; Edwards et al., 2006). Edwards et al. (2006) also find that the correlation between CO and AOD is strongest during the first few days of a biomass burning event and declines as the local CO concentration becomes less representative of daily emissions.
Here, we evaluate the relationship between AOD and CO over two biomass burning events. VIIRS AOD and TROPOMI CO are used to evaluate how realistic the UFS-RAQMS AOD/CO relationship is. We selected scenes over Siberia and over Indonesia during their respective peaks in biomass burning during the July–September 2019 analysis period. The assimilation of TROPOMI CO did not result in significant changes to UFS-RAQMS AOD. We calculate the largest changes in sulfate AOD and sulfate concentrations on 16 September 2019 to be 5 %–10 % and in air masses with sulfate AOD < 0.2 and low sulfate concentrations where small changes will have an outsized impact. In the regions with higher AOD and sulfate, the difference between the two UFS-RAQMS experiments for this date is <2.5 %.
UFS-RAQMS CO and AOD analyses are interpolated in latitude, longitude, and time to TROPOMI and VIIRS L2 observations, respectively. TROPOMI averaging kernels are applied to UFS-RAQMS CO profiles. UFS-RAQMS speciated aerosol extinction profiles at 532 nm are integrated to obtain AOD. The coincident model and observation data are then binned onto a 0.1×0.1° grid. The anticipated compact relationship between AOD and CO is evaluated for the observations, UFS-RAQMS control, and UFS-RAQMS TROPOMI CO DA.
4.1 Case study: 22 July 2019 Siberian smoke
During July and August 2019 significant wildfire activity occurred in Siberian Russia, with a major cluster in eastern Siberia and a major cluster in central Siberia (Johnson et al., 2021). Wildfire activity peaked in both regions of Siberia between 18 and 26 July. We evaluate the binned AOD and CO column on 22 July 2019 for the region 90–150° E, 50–70° N.
The spatial distributions of AOD and CO over Siberia on 22 July 2019 are shown in Fig. 12 for VIIRS, TROPOMI, the UFS-RAQMS control, and the UFS-RAQMS TROPOMI CO DA experiment. The UFS-RAQMS AOD field is unchanged between the control and TROPOMI CO DA experiments and is thus only shown once. UFS-RAQMS does a very good job of capturing the observed synoptic-scale features but does not capture the fine-scale structure seen in the AOD or CO observations. UFS-RAQMS AOD is slightly overestimated outside of the plume (AOD ≥ 1) and in the plume feature around 60–70° N, 120–130° E. The CO column is significantly underestimated in UFS-RAQMS control. Agreement with the TROPOMI observations is significantly improved in UFS-RAQMS TROPOMI CO DA.
Scatterplots illustrating the relationship between AOD and the CO column in Siberian wildfire smoke are shown in Fig. 13 for the observations (gray), UFS-RAQMS control (red), and UFS-RAQMS TROPOMI CO DA (blue). The linear regressions are summarized in Table 2. VIIRS AOD and the TROPOMI CO column exhibit a compact linear relationship with a slope near 1 and correlation of 0.8043. The UFS-RAQMS control CO column and AOD are moderately correlated (0.5648), and the slope of the linear relationship is 0.2407 as UFS-RAQMS control underestimates the CO column for high AOD. TROPOMI CO DA improves the correlation between AOD and the CO column as well as increasing the slope of the linear relationship. The UFS-RAQMS TROPOMI CO DA AOD/CO column slope is 0.7749 and the correlation is 0.7106. This improved representation of the observed linear relationship and correlation in UFS-RAQMS TROPOMI CO DA is due to the increased CO column within the Siberian wildfire plume.
4.2 Case study: 16 September 2019 Indonesian smoke
During September 2019 wildfire activity over Indonesia contributed to an extreme AOD enhancement in the region. We evaluate the binned AOD and CO column on 16 September 2019 for the region 100–130° E, 15° S–15° N.
The spatial distributions of AOD and CO over Indonesia on 16 September 2019 are shown in Fig. 14 for VIIRS, TROPOMI, the UFS-RAQMS control, and the UFS-RAQMS TROPOMI CO DA experiment. UFS-RAQMS significantly underestimates AOD enhancements in this region, as evident in the Borneo smoke plume and over China. We believe that this is due to underestimates in emissions from peat fires in this region (Yokelson et al., 2022). The CO column is significantly underestimated over the Maritime Continent in UFS-RAQMS control. Agreement with the TROPOMI observations is significantly improved in UFS-RAQMS TROPOMI CO DA.
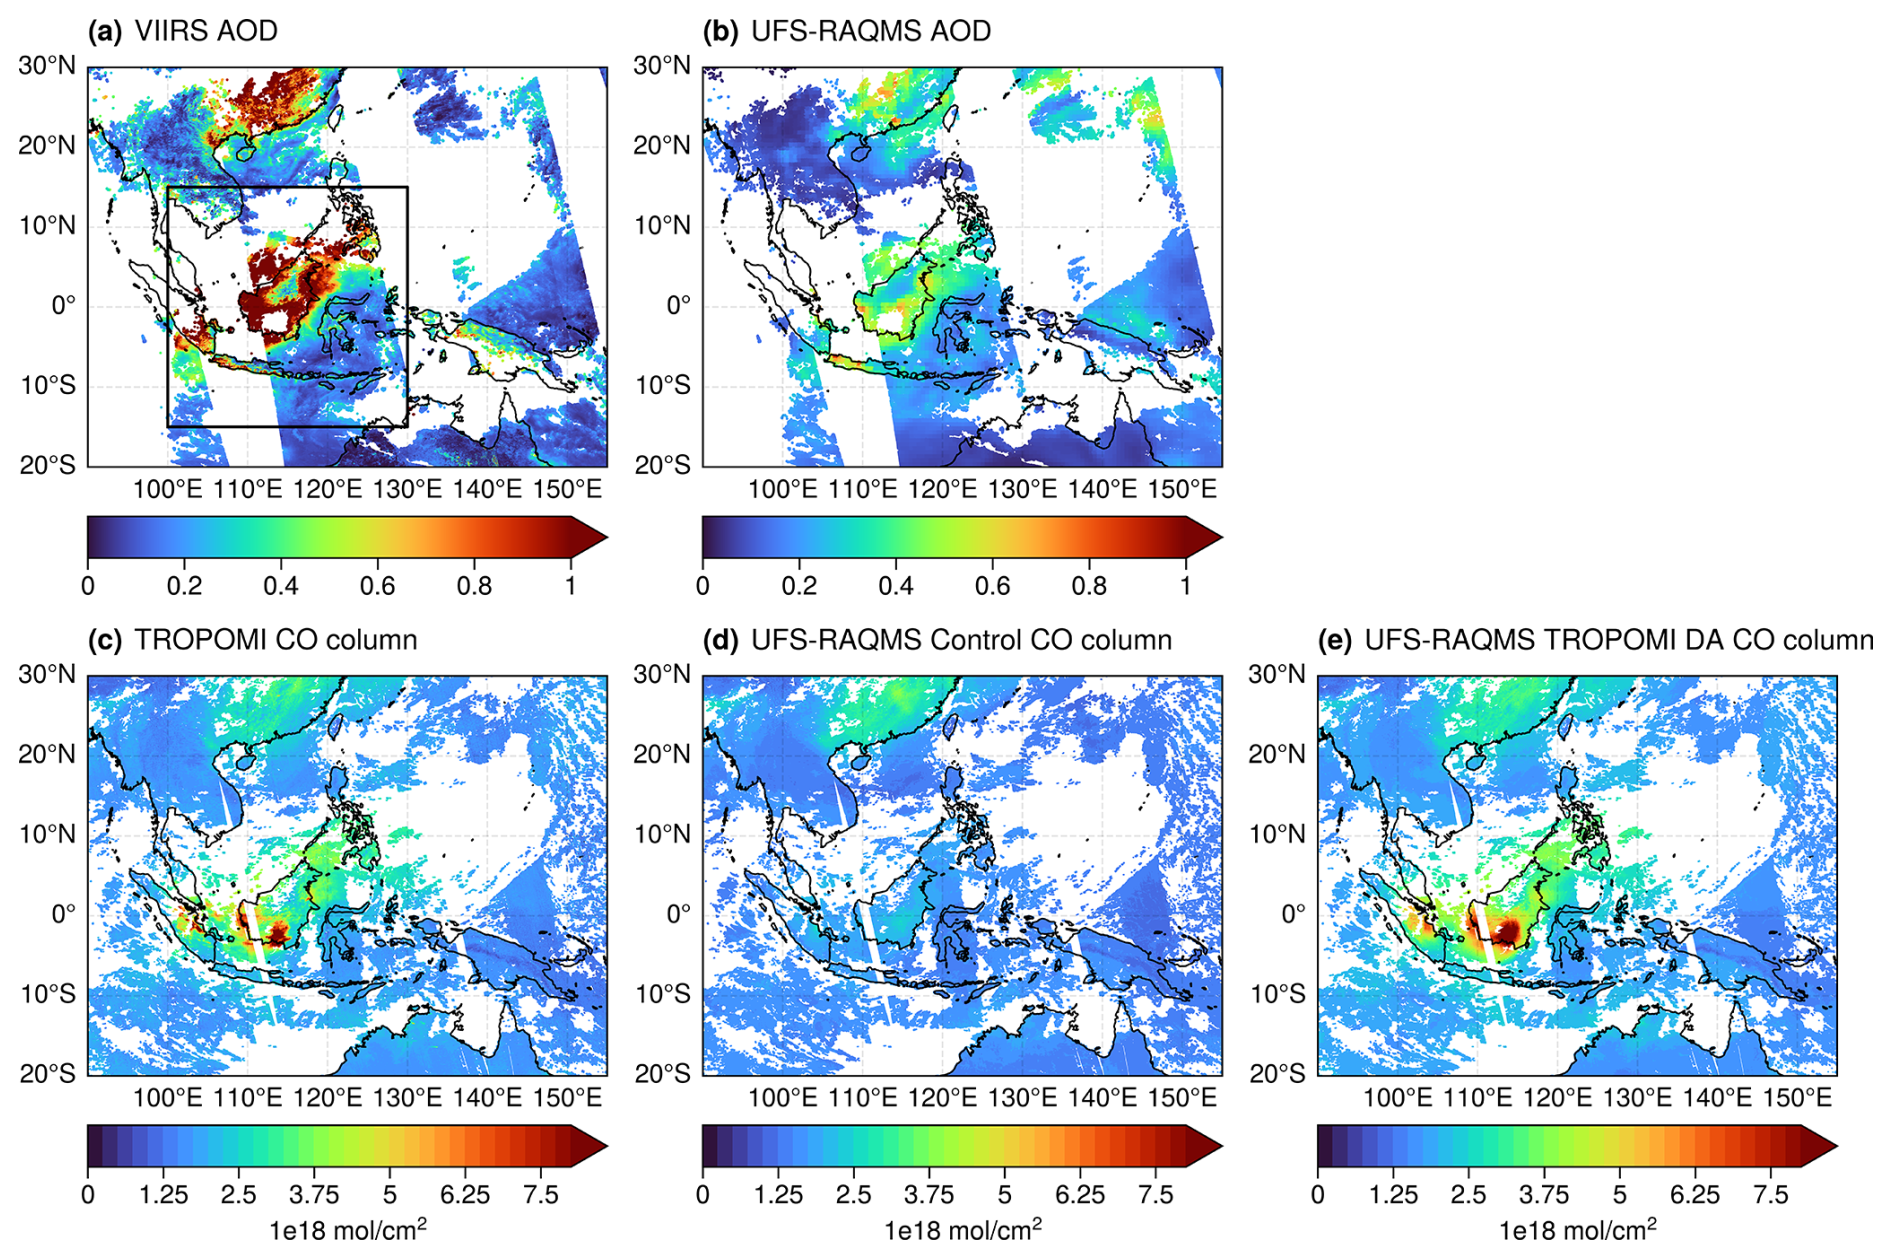
Figure 14The 16 September 2019 AOD and CO columns over SE Asia. VIIRS AOD (a), UFS-RAQMS AOD (b), TROPOMI CO column (c), UFS-RAQMS control (d), and TROPOMI CO DA (e) CO column. The black box in panel (a) defines the region 100–130° E, 15° S–15° N for AOD/CO column relationship analysis.
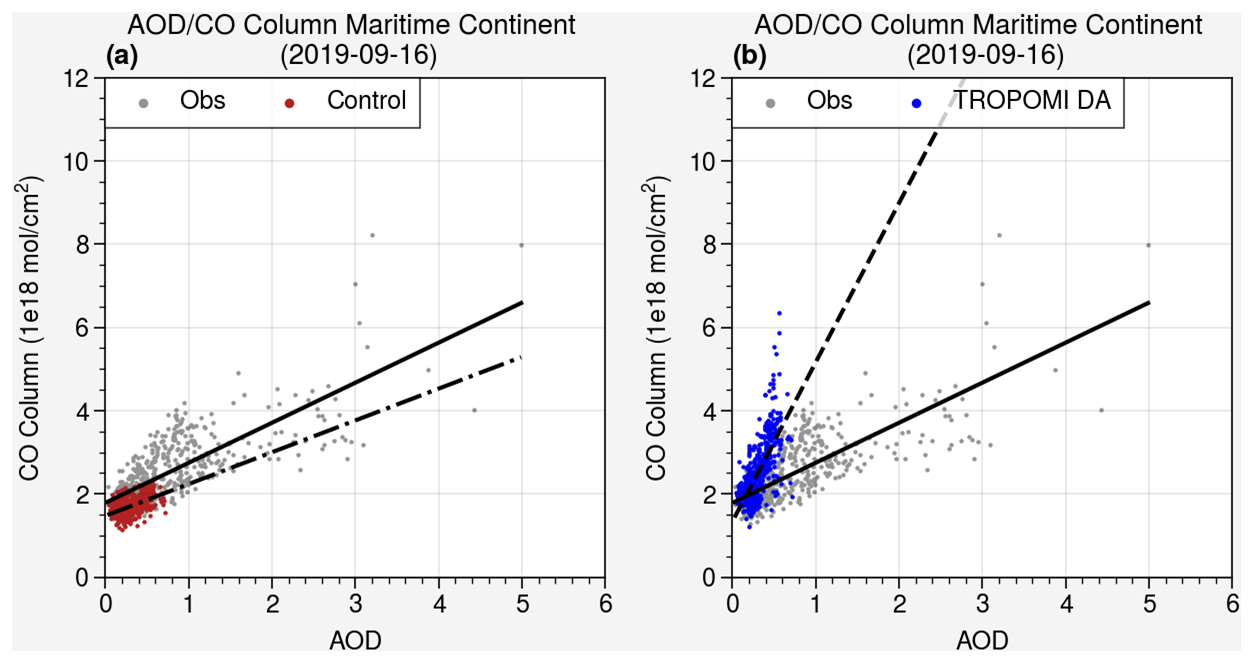
Figure 15Linear relationship between AOD and CO column in Indonesian wildfire smoke (100–130° E, 15° S–15° N) on 16 September 2019. UFS-RAQMS control (a, red) and UFS-RAQMS TROPOMI CO DA (b, blue) AOD/CO relationships are compared to observed VIIRS AOD/TROPOMI CO (gray).
Table 3Linear relationship between AOD and CO column in Indonesian wildfire smoke (100–130° E, 15° S–15° N) on 16 September 2019.
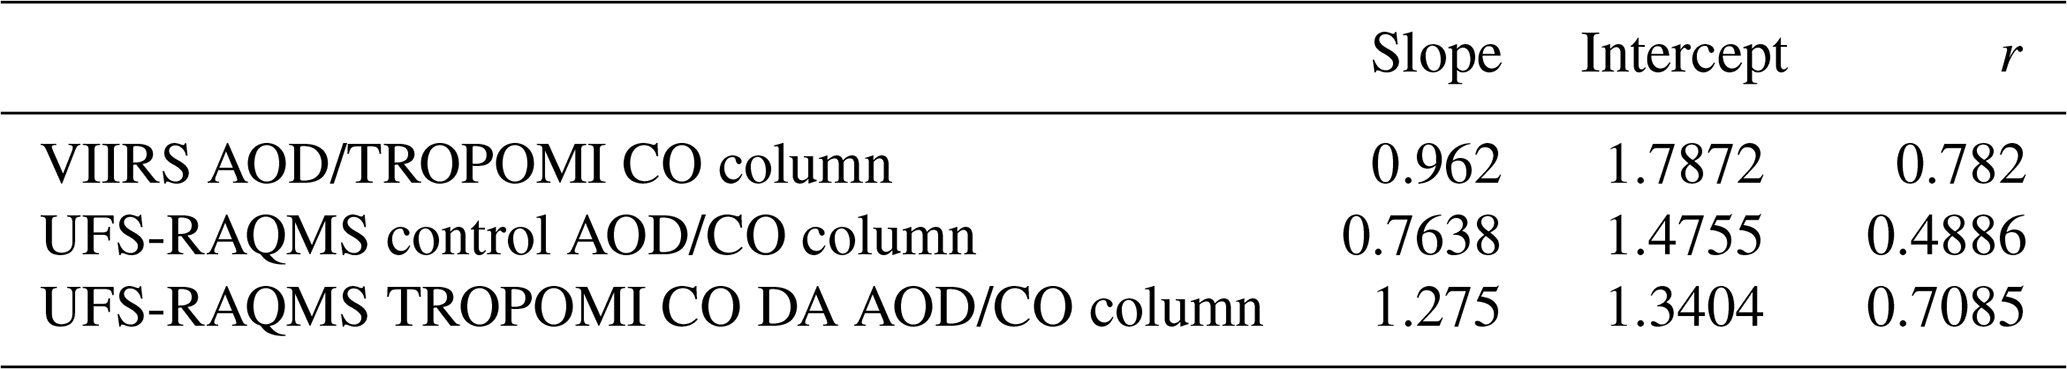
Scatterplots illustrating the relationship between AOD and the CO column in Indonesian wildfire smoke are shown in Fig. 15 for the observations (gray), UFS-RAQMS control (red), and UFS-RAQMS TROPOMI CO DA (blue). The linear regressions are summarized in Table 3. VIIRS AOD and the TROPOMI CO column exhibit a compact linear relationship with a slope near 1 and correlation of 0.782. The UFS-RAQMS control CO column and AOD are moderately correlated (0.4886), and the slope of the linear relationship is 0.7638; however neither the AOD nor CO columns capture the observed high values. TROPOMI CO DA improves the correlation between AOD and the CO column to 0.7085 but due to the low bias in UFS-RAQMS AOD over the region significantly overestimates the slope of the relationship. Assimilation of AOD data could be used to improve agreement with observations in this region.
The UFS-RAQMS control experiment significantly underestimates the CO column relative to MOPITT and TROPOMI CO column observations. Assimilating TROPOMI CO within UFS-RAQMS using the GSI 3D-Var and blended BEC generally resulted in improved UFS-RAQMS CO analyses relative to satellite, ground-based, and airborne observations. Application of TROPOMI CO DA decreases the average RMSE in the CO column relative to MOPITT and improves correlation between UFS-RAQMS and MOPITT within the FIREX-AQ and CAMP2EX domains. TROPOMI CO DA results in an improved CO profile in the free troposphere at most NDACC sites but does increase surface CO biases at high-latitude locations and complexity in the vertical structure at many sites. This is a consequence of using a total column measurement to constrain a profile. Our DA system minimizes the difference between the TROPOMI observations and the UFS-RAQMS first guess. While the CO column is well constrained, as indicated by the good agreement between UFS-RAQMS TROPOMI CO DA CO columns and MOPITT CO columns, the DA system distributes the analysis increment vertically based on model blended BEC statistics and knowledge of observation errors and vertical sensitivities. Our evaluations with NDACC FTIR CO observations and with field campaign observations show that this can lead to an over-adjustment near the surface and only small adjustments at high altitudes.
TROPOMI CO DA has the largest impacts in the lower troposphere over Siberia and Indonesia. Our case studies of the relationship between AOD and CO over these regions show that in UFS-RAQMS biomass burning signatures in the CO column are not consistent with those in AOD near the biomass burning source regions. Assimilating TROPOMI CO improves the representation of the biomass burning AOD/CO relationship. We believe this is an indication that the GBBEPx biomass burning CO emissions in UFS-RAQMS are too low. GBBEPx adds biomass burning emissions from VIIRS to the Quick Fire Emissions Database (QFED) biomass burning emissions estimates from MODIS (Zhang et al., 2019). QFED biomass burning aerosol emissions are scaled with biome-representative scale factors for tropical forests, extratropical forests, savanna, and grasslands that were obtained by calibrating NASA Goddard Earth Observing System Model (GEOS) AOD forecasts with MODIS AOD (Darmenov and da Silva, 2015).
While assimilating CO does compensate for uncertainties in the biomass burning emissions, it does not adjust the biomass burning CO emissions themselves. Since UFS-RAQMS uses emission factors for co-emitted NOx and VOC species that are based on the GBBEPx biomass burning CO emissions, we anticipate similar uncertainties in these co-emitted species. Future efforts should focus on developing capabilities to use TROPOMI CO column measurements to adjust the GBBEPx CO biomass burning emissions within UFS-RAQMS. Similar capabilities have been developed using TROPOMI NO2 retrievals to adjust anthropogenic NOx emissions using offline iterative mass balance approaches (East et al., 2022) and local ensemble transform Kalman filter (LETKF) techniques (Sekiya et al., 2022).
The version of UFS-RAQMS used to produce the results in this paper is archived on Zenodo (https://doi.org/10.5281/zenodo.13910346, Lenzen and Bruckner, 2024a). The version of GSI-RAQMS used to produce the results in this paper is also archived on Zenodo (https://doi.org/10.5281/zenodo.13905858, Lenzen and Bruckner, 2024b).
The FIREX-AQ field campaign data used in this study are publicly available at https://doi.org/10.5067/SUBORBITAL/FIREXAQ2019/DATA001 (NASA, 2023). The CAMP2Ex data used in this study are publicly available at https://doi.org/10.5067/Suborbital/CAMP2EX2018/DATA001 (NASA/LARC/SD/ASDC, 2020).
The NDACC FTIR CO data used in this publication were obtained from James W. Hannigan, Maria V. Makarova, Martine De Mazière, and Nicholas Jones as part of the Network for the Detection of Atmospheric Composition Change (NDACC) and are available through the NDACC website (https://ndacc.larc.nasa.gov/, last access: 10 October 2025).
The supplement related to this article is available online at https://doi.org/10.5194/gmd-18-8109-2025-supplement.
MB and BP conceptualized the study. MB executed the UFS-RAQMS experiments, analyzed the results, and wrote the paper. BP supervised the project and edited the paper. AL developed UFS-RAQMS and the TROPOMI CO data assimilation capability. GD and JD provided the CAMP2Ex and FIREX-AQ CO data. MDM, NJ, and MM provided the NDACC FTIR CO data.
The contact author has declared that none of the authors has any competing interests.
Publisher's note: Copernicus Publications remains neutral with regard to jurisdictional claims made in the text, published maps, institutional affiliations, or any other geographical representation in this paper. While Copernicus Publications makes every effort to include appropriate place names, the final responsibility lies with the authors. Views expressed in the text are those of the authors and do not necessarily reflect the views of the publisher.
Thanks to the colleagues at BIRA-IASB and the Université de La Réunion for supporting the FTIR experiment at La Réunion, as well as to the Belgian funding authorities, and to the European Copernicus program and the Région Réunion, CNRS, and Université de la Réunion for additional financial support.
This research has been supported by the National Oceanic and Atmospheric Administration, National Environmental Satellite, Data, and Information Service (grant no. NA20NES4320003).
This paper was edited by Patrick Jöckel and reviewed by two anonymous referees.
Ahmadov, R., Grell, G., James, E., Csiszar, I., Tsidulko, M., Pierce, B., McKeen, S., Benjamin, S., Alexander, C., Pereira, G., Freitas, S., and Goldberg, M.: Using VIIRS Fire Radiative Power data to simulate biomass burning emissions, plume rise and smoke transport in a real-time air quality modeling system, in: 2017 Ieee International Geoscience and Remote Sensing Symposium (IGARSS), 2806–2808, https://doi.org/10.1109/IGARSS.2017.8127581, 2017.
Al-Saadi, J., Soja, A., Pierce, R., Szykman, J., Wiedinmyer, C., Emmons, L., Kondragunta, S., Zhang, X., Kittaka, C., Schaack, T., and Bowman, K.: Intercomparison of near-real-time biomass burning emissions estimates constrained by satellite fire data, J. Appl. Remote Sens., 2, 021504, https://doi.org/10.1117/1.2948785, 2008.
Andreae, M. O. and Merlet, P.: Emission of trace gases and aerosols from biomass burning, Global Biogeochem. Cy., 15, 955–966, https://doi.org/10.1029/2000gb001382, 2001.
Arellano Jr., A. F., Hess, P. G., Edwards, D. P., and Baumgardner, D.: Constraints on black carbon aerosol distribution from Measurement of Pollution in the Troposphere (MOPITT) CO, Geophys. Res. Lett., 37, https://doi.org/10.1029/2010GL044416, 2010.
Barré, J., Gaubert, B., Arellano, A. F. J., Worden, H. M., Edwards, D. P., Deeter, M. N., Anderson, J. L., Raeder, K., Collins, N., Tilmes, S., Francis, G., Clerbaux, C., Emmons, L. K., Pfister, G. G., Coheur, P.-F., and Hurtmans, D.: Assessing the impacts of assimilating IASI and MOPITT CO retrievals using CESM-CAM-chem and DART, J. Geophys. Res.-Atmos., 120, 10501–10529, https://doi.org/10.1002/2015JD023467, 2015.
Bhattacharjee, P. S., Zhang, L., Baker, B., Pan, L., Montuoro, R., Grell, G. A., and McQueen, J. T.: Evaluation of Aerosol Optical Depth Forecasts from NOAA's Global Aerosol Forecast Model (GEFS-Aerosols), Weather Forecast., 38, 225–249, https://doi.org/10.1175/WAF-D-22-0083.1, 2023.
Bian, H. and Prather, M. J.: Fast-J2: Accurate Simulation of Stratospheric Photolysis in Global Chemical Models, J. Atmos. Chem., 41, 281–296, https://doi.org/10.1023/A:1014980619462, 2002.
Bian, H., Chin, M., Kawa, S. R., Duncan, B., Arellano, A., and Kasibhatla, P.: Sensitivity of global CO simulations to uncertainties in biomass burning sources, J. Geophys. Res.-Atmos., 112, https://doi.org/10.1029/2006JD008376, 2007.
Bian, H., Chin, M., Kawa, S. R., Yu, H., Diehl, T., and Kucsera, T.: Multiscale carbon monoxide and aerosol correlations from satellite measurements and the GOCART model: Implication for emissions and atmospheric evolution, J. Geophys. Res.-Atmos., 115, https://doi.org/10.1029/2009JD012781, 2010.
Binte Shahid, S., Lacey, F. G., Wiedinmyer, C., Yokelson, R. J., and Barsanti, K. C.: NEIVAv1.0: Next-generation Emissions InVentory expansion of Akagi et al. (2011) version 1.0, Geosci. Model Dev., 17, 7679–7711, https://doi.org/10.5194/gmd-17-7679-2024, 2024.
Borsdorff, T., aan de Brugh, J., Schneider, A., Lorente, A., Birk, M., Wagner, G., Kivi, R., Hase, F., Feist, D. G., Sussmann, R., Rettinger, M., Wunch, D., Warneke, T., and Landgraf, J.: Improving the TROPOMI CO data product: Update of the spectroscopic database and destriping of single orbits, Atmos. Meas. Tech., 12, 5443–5455, https://doi.org/10.5194/amt-12-5443-2019, 2019.
Bruckner, M., Pierce, R. B., and Lenzen, A.: Examining ENSO-related variability in tropical tropospheric ozone in the RAQMS-Aura chemical reanalysis, Atmos.Chem. Phys., 24, 10921–10945, https://doi.org/10.5194/acp-24-10921-2024, 2024.
Buchholz, R. R., Worden, H. M., Park, M., Francis, G., Deeter, M. N., Edwards, D. P., Emmons, L. K., Gaubert, B., Gille, J., Martínez-Alonso, S., Tang, W., Kumar, R., Drummond, J. R., Clerbaux, C., George, M., Coheur, P.-F., Hurtmans, D., Bowman, K. W., Luo, M., Payne, V. H., Worden, J. R., Chin, M., Levy, R. C., Warner, J., Wei, Z., and Kulawik, S. S.: Air pollution trends measured from Terra: CO and AOD over industrial, fire-prone, and background regions, Remote Sens. Environ., 256, 112275, https://doi.org/10.1016/j.rse.2020.112275, 2021.
Chin, M., Ginoux, P., Kinne, S., Torres, O., Holben, B. N., Duncan, B. N., Martin, R. V., Logan, J. A., Higurashi, A., and Nakajima, T.: Tropospheric Aerosol Optical Thickness from the GOCART Model and Comparisons with Satellite and Sun Photometer Measurements, Journal of the Atmospheric Sciences, 59, 461–483, https://doi.org/10.1175/1520-0469(2002)059<0461:TAOTFT>2.0.CO;2, 2002.
Clerbaux, C., Hadji-Lazaro, J., Hauglustaine, D., Mégie, G., Khattatov, B., and Lamarque, J.-F.: Assimilation of carbon monoxide measured from satellite in a three-dimensional chemistry-transport model, J. Geophys. Res.-Atmos., 106, 15385–15394, https://doi.org/10.1029/2000JD900682, 2001.
Darmenov, A. and da Silva, A.: The quick fire emissions dataset (QFED): Documentation of versions 2.1, 2.2 and 2.4, in: Technical Report Series on Global Modeling and Data Assimilation, edited by: Koster, R. D., NASA Goddard Space Flight Center, Greenbelt, MD, USA, 212pp., 2015.
Deeter, M., Francis, G., Gille, J., Mao, D., Martínez-Alonso, S., Worden, H., Ziskin, D., Drummond, J., Commane, R., Diskin, G., and McKain, K.: The MOPITT Version 9 CO product: Sampling enhancements and validation, Atmos. Meas. Tech., 15, 2325–2344, https://doi.org/10.5194/amt-15-2325-2022, 2022.
De Mazière, M., Thompson, A. M., Kurylo, M. J., Wild, J. D., Bernhard, G., Blumenstock, T., Braathen, G. O., Hannigan, J. W., Lambert, J.-C., Leblanc, T., McGee, T. J., Nedoluha, G., Petropavlovskikh, I., Seckmeyer, G., Simon, P. C., Steinbrecht, W., and Strahan, S. E.: The Network for the Detection of Atmospheric Composition Change (NDACC): History, status and perspectives, Atmos. Chem. Phys., 18, 4935–4964, https://doi.org/10.5194/acp-18-4935-2018, 2018.
Descombes, G., Auligné, T., Vandenberghe, F., Barker, D. M., and Barré, J.: Generalized background error covariance matrix model (GEN_BE v2.0), Geosci. Model Dev., 8, 669–696, https://doi.org/10.5194/gmd-8-669-2015, 2015.
DiGangi, J. P., Choi, Y., Nowak, J. B., Halliday, H. S., Diskin, G. S., Feng, S., Barkley, Z. R., Lauvaux, T., Pal, S., Davis, K. J., Baier, B. C., and Sweeney, C.: Seasonal Variability in Local Carbon Dioxide Biomass Burning Sources Over Central and Eastern US Using Airborne In Situ Enhancement Ratios, J. Geophys. Res.-Atmos., 126, e2020JD034525, https://doi.org/10.1029/2020JD034525, 2021.
East, J. D., Henderson, B. H., Napelenok, S. L., Koplitz, S. N., Sarwar, G., Gilliam, R., Lenzen, A., Tong, D. Q., Pierce, R. B., and Garcia-Menendez, F.: Inferring and evaluating satellite-based constraints on NOx emissions estimates in air quality simulations, Atmos. Chem. Phys., 22, 15981–16001, https://doi.org/10.5194/acp-22-15981-2022, 2022.
Eckman, R. S., Grose, W. L., Turner, R. E., Blackshear, W. T., Russell III, J. M., Froidevaux, L., Waters, J. W., Kumer, J. B., and Roche, A. E.: Stratospheric trace constituents simulated by a three-dimensional general circulation model: Comparison with UARS data, J. Geophys. Res.-Atmos., 100, 13951–13966, https://doi.org/10.1029/95JD01278, 1995.
Edwards, D. P., Emmons, L. K., Hauglustaine, D. A., Chu, D. A., Gille, J. C., Kaufman, Y. J., Pétron, G., Yurganov, L. N., Giglio, L., Deeter, M. N., Yudin, V., Ziskin, D. C., Warner, J., Lamarque, J.-F., Francis, G. L., Ho, S. P., Mao, D., Chen, J., Grechko, E. I., and Drummond, J. R.: Observations of carbon monoxide and aerosols from the Terra satellite: Northern Hemisphere variability, J. Geophys. Res.-Atmos., 109, https://doi.org/10.1029/2004JD004727, 2004.
Edwards, D. P., Emmons, L. K., Gille, J. C., Chu, A., Attié, J.-L., Giglio, L., Wood, S. W., Haywood, J., Deeter, M. N., Massie, S. T., Ziskin, D. C., and Drummond, J. R.: Satellite-observed pollution from Southern Hemisphere biomass burning, J. Geophys. Res.-Atmos., 111, https://doi.org/10.1029/2005JD006655, 2006.
Gaubert, B., Emmons, L. K., Raeder, K., Tilmes, S., Miyazaki, K., Arellano Jr., A. F., Elguindi, N., Granier, C., Tang, W., Barré, J., Worden, H. M., Buchholz, R. R., Edwards, D. P., Franke, P., Anderson, J. L., Saunois, M., Schroeder, J., Woo, J.-H., Simpson, I. J., Blake, D. R., Meinardi, S., Wennberg, P. O., Crounse, J., Teng, A., Kim, M., Dickerson, R. R., He, H., Ren, X., Pusede, S. E., and Diskin, G. S.: Correcting model biases of CO in East Asia: Impact on oxidant distributions during KORUS-AQ, Atmos. Chem. Phys., 20, 14617–14647, https://doi.org/10.5194/acp-20-14617-2020, 2020.
Harris, L. M. and Lin, S. J.: A two-way nested global-regional dynamical core on the cubed-sphere grid, Mon. Weather Rev., 141, 283–306, https://doi.org/10.1175/MWR-D-11-00201.1, 2013.
Hyer, E. J. and Reid, J. S.: Baseline uncertainties in biomass burning emission models resulting from spatial error in satellite active fire location data, Geophys. Res. Lett., 36, https://doi.org/10.1029/2008GL036767, 2009.
Inness, A., Blechschmidt, A.-M., Bouarar, I., Chabrillat, S., Crepulja, M., Engelen, R. J., Eskes, H., Flemming, J., Gaudel, A., Hendrick, F., Huijnen, V., Jones, L., Kapsomenakis, J., Katragkou, E., Keppens, A., Langerock, B., de Mazière, M., Melas, D., Parrington, M., Peuch, V. H., Razinger, M., Richter, A., Schultz, M. G., Suttie, M., Thouret, V., Vrekoussis, M., Wagner, A., and Zerefos, C.: Data assimilation of satellite-retrieved ozone, carbon monoxide and nitrogen dioxide with ECMWF's Composition-IFS, Atmos. Chem. Phys., 15, 5275–5303, https://doi.org/10.5194/acp-15-5275-2015, 2015.
Inness, A., Aben, I., Ades, M., Borsdorff, T., Flemming, J., Jones, L., Landgraf, J., Langerock, B., Nedelec, P., Parrington, M., and Ribas, R.: Assimilation of S5P/TROPOMI carbon monoxide data with the global CAMS near-real-time system, Atmos. Chem. Phys., 22, 14355–14376, https://doi.org/10.5194/acp-22-14355-2022, 2022.
Johnson, M. S., Strawbridge, K., Knowland, K. E., Keller, C., and Travis, M.: Long-range transport of Siberian biomass burning emissions to North America during FIREX-AQ, Atmos. Environ., 252, 118241, https://doi.org/10.1016/J.ATMOSENV.2021.118241, 2021.
Kiehl, J. T., Hack, J. J., Bonan, G. B., Boville, B. A., Williamson, D. L., and Rasch, P. J.: The National Center for Atmospheric Research Community Climate Model: CCM3, J. Climate, 11, 1131–1149, https://doi.org/10.1175/1520-0442(1998)011<1131:TNCFAR>2.0.CO;2, 1998.
Kleist, D. T., Parrish, D. F., Derber, J. C., Treadon, R., Wu, W.-S., and Lord, S.: Introduction of the GSI into the NCEP Global Data Assimilation System, Weather Forecast, 24, 1691–1705, https://doi.org/10.1175/2009WAF2222201.1, 2009.
Lamarque, J.-F. and Gille, J. C.: Improving the modeling of error variance evolution in the assimilation of chemical species: Application to MOPITT data, Geophys. Res. Lett., 30, https://doi.org/10.1029/2003GL016994, 2003.
Lamarque, J.-F., Khattatov, B. V., Gille, J. C., and Brasseur, G. P.: Assimilation of Measurement of Air Pollution from Space (MAPS) CO in a global three-dimensional model, J. Geophys. Res.-Atmos., 104, 26209–26218, https://doi.org/10.1029/1999JD900807, 1999.
Lenzen, A., and Bruckner, M.: UFS-RAQMS with TROPOMI CO data assimilation [code], Zenodo, https://doi.org/10.5281/zenodo.13910346, 2024a.
Lenzen, A., and Bruckner, M.: GSI-RAQMS [code], Zenodo, https://doi.org/10.5281/zenodo.13905858, 2024b.
Lewis, A. C., Evans, M. J., Hopkins, J. R., Punjabi, S., Read, K. A., Purvis, R. M., Andrews, S. J., Moller, S. J., Carpenter, L. J., Lee, J. D., Rickard, A. R., Palmer, P. I., and Parrington, M.: The influence of biomass burning on the global distribution of selected non-methane organic compounds, Atmos. Chem. Phys., 13, 851–867, https://doi.org/10.5194/acp-13-851-2013, 2013.
Li, W., Tang, B., Campbell, P. C., Tang, Y., Baker, B., Moon, Z., Tong, D., Huang, J., Wang, K., Stajner, I., and Montuoro, R.: Updates and evaluation of NOAA's online-coupled air quality model version 7 (AQMv7) within the Unified Forecast System, Geosci. Model Dev., 18, 1635–1660, https://doi.org/10.5194/gmd-18-1635-2025, 2025.
Logan, J. A., Prather, M. J., Wofsy, S. C., and McElroy, M. B.: Tropospheric chemistry: A global perspective, J. Geophys. Res., 86, 7210–7254, https://doi.org/10.1029/JC086iC08p07210, 1981.
McDuffie, E. E., Smith, S. J., O'Rourke, P., Tibrewal, K., Venkataraman, C., Marais, E. A., Zheng, B., Crippa, M., Brauer, M., and Martin, R. V.: A global anthropogenic emission inventory of atmospheric pollutants from sector- and fuel-specific sources (1970–2017): An application of the Community Emissions Data System (CEDS), Earth Syst. Sci. Data, 12, 3413–3442, https://doi.org/10.5194/essd-12-3413-2020, 2020.
Miyazaki, K., Eskes, H. J., Sudo, K., Takigawa, M., Van Weele, M., and Boersma, K. F.: Simultaneous assimilation of satellite NO2, O3, CO, and HNO3 data for the analysis of tropospheric chemical composition and emissions, Atmos. Chem. Phys., 12, 9545–9579, https://doi.org/10.5194/acp-12-9545-2012, 2012.
Naik, V., Voulgarakis, A., Fiore, A. M., Horowitz, L. W., Lamarque, J.-F., Lin, M., Prather, M. J., Young, P. J., Bergmann, D., Cameron-Smith, P. J., Cionni, I., Collins, W. J., Dalsøren, S. B., Doherty, R., Eyring, V., Faluvegi, G., Folberth, G. A., Josse, B., Lee, Y. H., MacKenzie, I. A., Nagashima, T., van Noije, T. P. C., Plummer, D. A., Righi, M., Rumbold, S. T., Skeie, R., Shindell, D. T., Stevenson, D. S., Strode, S., Sudo, K., Szopa, S., and Zeng, G.: Preindustrial to present-day changes in tropospheric hydroxyl radical and methane lifetime from the Atmospheric Chemistry and Climate Model Intercomparison Project (ACCMIP), Atmos. Chem. Phys., 13, 5277–5298, https://doi.org/10.5194/acp-13-5277-2013, 2013.
NASA/LARC/SD/ASDC: CAMP2Ex P-3 In-Situ Trace Gas Data [data set], https://doi.org/10.5067/SUBORBITAL/CAMP2EX2018/DATA001, 2020.
NASA: FIREX-AQ, NASA [data set], https://doi.org/10.5067/SUBORBITAL/FIREXAQ2019/DATA001, 2023.
Oppenheim, A. V. and Schafer, R. W.: Digital signal processing, Research supported by the Massachusetts Institute of Technology, Bell Telephone Laboratories, and Guggenheim Foundation. Englewood Cliffs, N.J., Prentice-Hall, Inc., 598 p., ISBN 0132146355 1975.
Pagowski, M., Grell, G. A., McKeen, S. A., Peckham, S. E., and Devenyi, D.: Three-dimensional variational data assimilation of ozone and fine particulate matter observations: Some results using the Weather Research and Forecasting-Chemistry model and Grid-point Statistical Interpolation, Q. J. Roy. Meteorol. Soc., 136, 2013–2024, https://doi.org/10.1002/QJ.700, 2010.
Pan, X., Ichoku, C., Chin, M., Bian, H., Darmenov, A., Colarco, P., Ellison, L., Kucsera, T., Da Silva, A., Wang, J., Oda, T., and Cui, G.: Six global biomass burning emission datasets: Intercomparison and application in one global aerosol model, Atmos. Chem. Phys., 20, 969–994, https://doi.org/10.5194/acp-20-969-2020, 2020.
Parrish, D. F. and Derber, J. C.: The National Meteorological Center's Spectral Statistical-Interpolation Analysis System, Mon. Weather Rev., 120, 1747–1763, https://doi.org/10.1175/1520-0493(1992)120<1747:TNMCSS>2.0.CO;2, 1992.
Pierce, R. B., Al‐Saadi, J., Kittaka, C., Schaack, T., Lenzen, A., Bowman, K., Szykman, J., Soja, A., Ryerson, T., Thompson, A. M., Bhartia, P., and Morris, G. A.: Impacts of background ozone production on Houston and Dallas, Texas, air quality during the Second Texas Air Quality Study field mission, Journal of Geophysical Research: Atmospheres, 114, https://doi.org/10.1029/2008JD011337, 2009.
Pierce, R. B., Schaack, T., Al-Saadi, J. A., Fairlie, T. D., Kittaka, C., Lingenfelser, G. S., Natarajan, M., Olson, J. R., Soja, A. J., Zapotocny, T., Lenzen, A., Stobie, J., Johnson, D., Avery, M. A., Sachse, G. W., Thompson, A., Cohen, R., Dibb, J. E., Crawford, J. H., Rault, D. F., Martin, R., Szykman, J., and Fishman, J.: Chemical data assimilation estimates of continental U.S. Ozone and nitrogen budgets during the Intercontinental Chemical Transport Experiment-North America, J. Geophys. Res.-Atmos., 112, https://doi.org/10.1029/2006JD007722, 2007.
Putman, W. M. and Lin, S. J.: Finite-volume transport on various cubed-sphere grids, J. Comput. Phys., 227, 55–78, https://doi.org/10.1016/j.jcp.2007.07.022, 2007.
Reid, J. S., Maring, H. B., Narisma, G. T., Heever, S. van den, Girolamo, L. D., Ferrare, R., Lawson, P., Mace, G. G., Simpas, J. B., Tanelli, S., Ziemba, L., Diedenhoven, B. van, Bruintjes, R., Bucholtz, A., Cairns, B., Cambaliza, M. O., Chen, G., Diskin, G. S., Flynn, J. H., Hostetler, C. A., Holz, R. E., Lang, T. J., Schmidt, K. S., Smith, G., Sorooshian, A., Thompson, E. J., Thornhill, K. L., Trepte, C., Wang, J., Woods, S., Yoon, S., Alexandrov, M., Alvarez, S., Amiot, C. G., Bennett, J. R., Brooks, M., Burton, S. P., Cayanan, E., Chen, H., Collow, A., Crosbie, E., DaSilva, A., DiGangi, J. P., Flagg, D. D., Freeman, S. W., Fu, D., Fukada, E., Hilario, M. R. A., Hong, Y., Hristova-Veleva, S. M., Kuehn, R., Kowch, R. S., Leung, G. R., Loveridge, J., Meyer, K., Miller, R. M., Montes, M. J., Moum, J. N., Nenes, A., Nesbitt, S. W., Norgren, M., Nowottnick, E. P., Rauber, R. M., Reid, E. A., Rutledge, S., Schlosser, J. S., Sekiyama, T. T., Shook, M. A., Sokolowsky, G. A., Stamnes, S. A., Tanaka, T. Y., Wasilewski, A., Xian, P., Xiao, Q., Xu, Z., and Zavaleta, J.: The Coupling Between Tropical Meteorology, Aerosol Lifecycle, Convection, and Radiation during the Cloud, Aerosol and Monsoon Processes Philippines Experiment (CAMP2Ex), B. Am. Meteorol. Soc., 104, E1179–E1205, https://doi.org/10.1175/BAMS-D-21-0285.1, 2023.
Sachse, G. W., Jr, J. E. C., Hill, G. F., Wade, L. O., Burney, L. G., and Ritter, J. A.: Airborne tunable diode laser sensor for high-precision concentration and flux measurements of carbon monoxide and methane, in: Measurement of Atmospheric Gases, SPIE, 157–166, https://doi.org/10.1117/12.46162, 1991.
Schaack, T. K., Zapotocny, T. H., Lenzen, A. J., and Johnson, D. R.: Global Climate Simulation with the University of Wisconsin Global Hybrid Isentropic Coordinate Model, J. Climate, 17, 2998–3016, https://doi.org/10.1175/1520-0442(2004)017<2998:GCSWTU>2.0.CO;2, 2004.
Sekiya, T., Miyazaki, K., Ogochi, K., Sudo, K., Takigawa, M., Eskes, H., and Boersma, K. F.: Impacts of Horizontal Resolution on Global Data Assimilation of Satellite Measurements for Tropospheric Chemistry Analysis, J. Adv. Model. Earth Syst., 13, e2020MS002180, https://doi.org/10.1029/2020MS002180, 2021.
Sekiya, T., Miyazaki, K., Eskes, H., Sudo, K., Takigawa, M., and Kanaya, Y.: A comparison of the impact of TROPOMI and OMI tropospheric NO2 on global chemical data assimilation, Atmos. Meas. Tech., 15, 1703–1728, https://doi.org/10.5194/amt-15-1703-2022, 2022.
Shindell, D. T., Faluvegi, G., Stevenson, D. S., Krol, M. C., Emmons, L. K., Lamarque, J.-F., Pétron, G., Dentener, F. J., Ellingsen, K., Schultz, M. G., Wild, O., Amann, M., Atherton, C. S., Bergmann, D. J., Bey, I., Butler, T., Cofala, J., Collins, W. J., Derwent, R. G., Doherty, R. M., Drevet, J., Eskes, H. J., Fiore, A. M., Gauss, M., Hauglustaine, D. A., Horowitz, L. W., Isaksen, I. S. A., Lawrence, M. G., Montanaro, V., Müller, J.-F., Pitari, G., Prather, M. J., Pyle, J. A., Rast, S., Rodriguez, J. M., Sanderson, M. G., Savage, N. H., Strahan, S. E., Sudo, K., Szopa, S., Unger, N., van Noije, T. P. C., and Zeng, G.: Multimodel simulations of carbon monoxide: Comparison with observations and projected near-future changes, J. Geophys. Res.-Atmos., 111, https://doi.org/10.1029/2006JD007100, 2006.
Soja, A. J., Cofer, W. R., Shugart, H. H., Sukhinin, A. I., Stackhouse, P. W., Mcrae, D. J., and Conard, S. G.: Estimating fire emissions and disparities in boreal Siberia (1998–2002), Journal of Geophysical Research: Atmospheres, 109, https://doi.org/10.1029/2004JD004570, 2004.
Spackman, J. R., Schwarz, J. P., Gao, R. S., Watts, L. A., Thomson, D. S., Fahey, D. W., Holloway, J. S., de Gouw, J. A., Trainer, M., and Ryerson, T. B.: Empirical correlations between black carbon aerosol and carbon monoxide in the lower and middle troposphere, Geophys. Res. Lett., 35, https://doi.org/10.1029/2008GL035237, 2008.
Stockwell, C. E., Bela, M. M., Coggon, M. M., Gkatzelis, G. I., Wiggins, E., Gargulinski, E. M., Shingler, T., Fenn, M., Griffin, D., Holmes, C. D., Ye, X., Saide, P. E., Bourgeois, I., Peischl, J., Womack, C. C., Washenfelder, R. A., Veres, P. R., Neuman, J. A., Gilman, J. B., Lamplugh, A., Schwantes, R. H., McKeen, S. A., Wisthaler, A., Piel, F., Guo, H., Campuzano-Jost, P., Jimenez, J. L., Fried, A., Hanisco, T. F., Huey, L. G., Perring, A., Katich, J. M., Diskin, G. S., Nowak, J. B., Bui, T. P., Halliday, H. S., DiGangi, J. P., Pereira, G., James, E. P., Ahmadov, R., McLinden, C. A., Soja, A. J., Moore, R. H., Hair, J. W., and Warneke, C.: Airborne Emission Rate Measurements Validate Remote Sensing Observations and Emission Inventories of Western U.S. Wildfires, Environ. Sci. Technol., 56, 7564–7577, https://doi.org/10.1021/acs.est.1c07121, 2022.
Strode, S. A., Duncan, B. N., Yegorova, E. A., Kouatchou, J., Ziemke, J. R., and Douglass, A. R.: Implications of carbon monoxide bias for methane lifetime and atmospheric composition in chemistry climate models, Atmos. Chem. Phys., 15, 11789–11805, https://doi.org/10.5194/acp-15-11789-2015, 2015.
van der Werf, G. R., Randerson, J. T., Giglio, L., van Leeuwen, T. T., Chen, Y., Rogers, B. M., Mu, M., van Marle, M. J. E., Morton, D. C., Collatz, G. J., Yokelson, R. J., and Kasibhatla, P. S.: Global fire emissions estimates during 1997–2016, Earth Syst. Sci. Data, 9, 697–720, https://doi.org/10.5194/essd-9-697-2017, 2017.
Veefkind, J. P., Aben, I., McMullan, K., Förster, H., de Vries, J., Otter, G., Claas, J., Eskes, H. J., de Haan, J. F., Kleipool, Q., van Weele, M., Hasekamp, O., Hoogeveen, R., Landgraf, J., Snel, R., Tol, P., Ingmann, P., Voors, R., Kruizinga, B., Vink, R., Visser, H., and Levelt, P. F.: TROPOMI on the ESA Sentinel-5 Precursor: A GMES mission for global observations of the atmospheric composition for climate, air quality and ozone layer applications, Remote Sens. Environ., 120, 70–83, https://doi.org/10.1016/j.rse.2011.09.027, 2012.
Warneke, C., Schwarz, J. P., Dibb, J., Kalashnikova, O., Frost, G., Al-Saad, J., Brown, S. S., Brewer, Wm. A., Soja, A., Seidel, F. C., Washenfelder, R. A., Wiggins, E. B., Moore, R. H., Anderson, B. E., Jordan, C., Yacovitch, T. I., Herndon, S. C., Liu, S., Kuwayama, T., Jaffe, D., Johnston, N., Selimovic, V., Yokelson, R., Giles, D. M., Holben, B. N., Goloub, P., Popovici, I., Trainer, M., Kumar, A., Pierce, R. B., Fahey, D., Roberts, J., Gargulinski, E. M., Peterson, D. A., Ye, X., Thapa, L. H., Saide, P. E., Fite, C. H., Holmes, C. D., Wang, S., Coggon, M. M., Decker, Z. C. J., Stockwell, C. E., Xu, L., Gkatzelis, G., Aikin, K., Lefer, B., Kaspari, J., Griffin, D., Zeng, L., Weber, R., Hastings, M., Chai, J., Wolfe, G. M., Hanisco, T. F., Liao, J., Jost, P. C., Guo, H., Jimenez, J. L., and Crawford, J.: Fire Influence on Regional to Global Environments and Air Quality (FIREX-AQ), J. Geophys. Res.-Atmos., 128, e2022JD037758, https://doi.org/10.1029/2022JD037758, 2023.
Whitaker, J. S., Hamill, T. M., Wei, X., Song, Y., and Toth, Z.: Ensemble Data Assimilation with the NCEP Global Forecast System, Mon. Weather Rev., 136, 463–482, https://doi.org/10.1175/2007mwr2018.1, 2008.
Wu, W.-S., Purser, R., and Parrish, D.: Three-Dimensional Variational Analysis with Spatially Inhomogeneous Covariances, Mon. Weather Rev., 130, https://doi.org/10.1175/1520-0493(2002)130<2905:TDVAWS>2.0.CO;2, 2002.
Yokelson, R. J., Saharjo, B. H., Stockwell, C. E., Putra, E. I., Jayarathne, T., Akbar, A., Albar, I., Blake, D. R., Graham, L. L. B., Kurniawan, A., Meinardi, S., Ningrum, D., Nurhayati, A. D., Saad, A., Sakuntaladewi, N., Setianto, E., Simpson, I. J., Stone, E. A., Sutikno, S., Thomas, A., Ryan, K. C., and Cochrane, M. A.: Tropical peat fire emissions: 2019 field measurements in Sumatra and Borneo and synthesis with previous studies, Atmos. Chem. Phys., 22, 10173–10194, https://doi.org/10.5194/acp-22-10173-2022, 2022.
Zaveri, R. A. and Peters, L. K.: A new lumped structure photochemical mechanism for large-scale applications, J. Geophys. Res.-Atmos., 104, 30387–30415, https://doi.org/10.1029/1999JD900876, 1999.
Zhang, L., Montuoro, R., McKeen, S. A., Baker, B., Bhattacharjee, P. S., Grell, G. A., Henderson, J., Pan, L., Frost, G. J., McQueen, J., Saylor, R., Li, H., Ahmadov, R., Wang, J., Stajner, I., Kondragunta, S., Zhang, X., and Li, F.: Development and evaluation of the Aerosol Forecast Member in the National Center for Environment Prediction (NCEP)'s Global Ensemble Forecast System (GEFS-Aerosols V1), Geosci. Model Dev., 15, 5337–5369, https://doi.org/10.5194/gmd-15-5337-2022, 2022.
Zhang, X., Kondragunta, S., Da Silva, A., Lu, S., Ding, H., Li, F., and Zhu, Y.: The blended global biomass burning emissions product from MODIS and geostationary Satellites (GBBEPx) Version 3.1, http://www.ospo.noaa.gov/Products/land/gbbepx/docs/GBBEPx_ATBD.pdf (last access: 10 October 2025), 2019.
- Abstract
- Introduction
- UFS-RAQMS model
- Impact of TROPOMI CO assimilation on UFS-RAQMS CO
- Consistency in biomass burning CO and aerosol signatures
- Conclusions
- Code availability
- Data availability
- Author contributions
- Competing interests
- Disclaimer
- Acknowledgements
- Financial support
- Review statement
- References
- Supplement