the Creative Commons Attribution 4.0 License.
the Creative Commons Attribution 4.0 License.
 | 14 Oct 2025
A novel model hierarchy isolates the limited effect of supercooled liquid cloud optics on infrared radiation
Jennifer E. Kay
Penny Rowe
Clouds exert strong influences on surface energy budgets and climate projections. Yet, cloud physics are complex and often incompletely represented in models. For example, supercooled liquid cloud optics parameterizations are rarely incorporated into the radiative transfer models used for climate projections. Prior work has shown that incorporating these optics in longwave radiation calculations increases Arctic downwelling longwave fluxes by as much as 1.7 W m−2. Here we examine whether implementing supercooled liquid water optics in climate models for longwave radiation impacts global radiative fluxes and climate. We use a novel methodology that uses a hierarchy of dynamical constraints on the sequence of atmospheric states. In the model experiments with stronger dynamical constraints, we find that the supercooled liquid water optics increase Arctic downwelling longwave by 2.17–3.24 W m−2. In contrast, these optics increased Arctic downwelling longwave radiation by 0.36–0.68 W m−2 with dynamically unconstrained model experiments. While the optics impact was greater within the dynamically constrained models than in dynamically unconstrained models, the dynamically constrained models are also more idealized than the unconstrained models. In summary, we found a signal from supercooled liquid water optics; the influence of these optics for longwave radiation is small compared to the modeled longwave radiation variability. More broadly, this work demonstrates a novel framework for assessing the climate importance of a physics change.
- Article
(4292 KB) - Full-text XML
- BibTeX
- EndNote


Due to complex processes that couple cloud processes with the climate system, cloud radiative effects remain one of the largest sources of climate projection uncertainty (Webb et al., 2017; Sherwood et al., 2020). Clouds affect climate by absorbing and emitting longwave radiation and scattering shortwave radiation. The strength of these cloud radiative effects depends on the cloud properties, including the phase, particle size and number, and geometric thickness. For example, optically thick liquid clouds scatter more shortwave radiation and emit more longwave radiation than optically thin ice clouds. All else being equal, clouds with small particle sizes also scatter more shortwave (Maahn et al., 2021) and emit more downwelling longwave than clouds with large particle sizes (Lubin and Vogelmann, 2006).
In most climate models, translating cloud properties into cloud radiative impacts is accomplished through cloud optics parameterizations. Using an appropriate level of complexity in cloud optics parameterizations is therefore critical to accurately modeling cloud radiative impacts. Due to the computational expense of radiative transfer calculations, choices must be made about what aspects of cloud optics are incorporated. These choices should be re-assessed to include new physics when the impacts on radiation are substantial. Developing tools to assess whether a cloud optics change substantially affects model radiative fluxes is therefore of practical importance to the model development community.
A useful yet underutilized technique for isolating the importance of a cloud optics change for climate is wind nudging. In this technique, model winds are nudged towards prescribed wind values (often from reanalysis) over a set horizontal and vertical domain. A key advantage of prescribing the winds using nudging is that the time evolution of the prescribed and modeled large-scale circulation is synchronized to the prescribed wind time evolution. Typically, winds are nudged above the boundary layer, leaving the boundary layer physics, including the surface fluxes and low clouds, to evolve interdependently. Recent applications show the power of wind nudging for scientific and direct model comparisons with observations. For example, Pithan et al. (2023) compared nudged model runs to observations to inform model microphysical parameterization improvements in the Arctic. Likewise, Kooperman et al. (2012) leveraged the synchronizing of large-scale wind evolution enabled by wind nudging to increase the detectability of an aerosol radiative signal. These studies show that wind nudging is a powerful tool to amplify a radiative signal above chaotic atmospheric noise by constraining the time sequence of the modeled atmospheric circulation.
Based on these previous studies, what knowledge gaps does this study want to address? We identify cloud optics physics that have not been incorporated into the radiation scheme used by many climate models, RRTMG (Clough et al., 2005; Iacono et al., 2008). Specifically, supercooled liquid water (240–273 K) optics are not used in RRTMG. Instead, RRTMG uses liquid water optics at one fixed temperature (298 K). Since the RRTMG optics temperature does not match supercooled liquid cloud temperatures, the RRTMG optics may not represent radiation emitted by supercooled liquid-containing clouds well. For instance, using a high-spectral-resolution line-by-line radiative transfer model applied to case studies in the Arctic, Rowe et al. (2013) found that these supercooled liquid water optics can increase modeled longwave fluxes emitted by thin (liquid water path <10 g m−2) supercooled liquid-containing clouds by up to 1.7 W m−2. One limitation of the Rowe et al. (2013) study is that it only focused on a generalized Arctic case study. Here, we assess if using supercooled liquid water optics for longwave radiation has substantial impacts on radiation globally and over many decades. Indeed, a primary goal of this study is to assess if this cloud optics change should be considered as a candidate for addition to the RRTMG radiative transfer model used by most climate models. While our model simulations include optics changes at all latitudes, our assessment will focus on the Arctic. We focus on the Arctic because it is a cold and dry region where thin supercooled liquid clouds frequently occur in observations (Cesana et al., 2012) and climate model simulations (McIlhattan et al., 2020). Thus, we anticipate that the clouds optics change may have a substantial impact on Arctic longwave fluxes.
A novel aspect of this study is using a hierarchy of models to assess the relevance of this cloud optics change. All models use the same radiation scheme (RRTMG) but vary in the degree to which the atmosphere is dynamically constrained. We anticipate that using this hierarchy of constraint on the modeled atmospheric circulation sequencing will be of value. We expect that the most dynamically constrained models will enable the easiest detection of the optics change. In contrast, dynamically unconstrained models will have more noise from internal climate variability and that noise may make it hard to detect the optics change signal. While this study focuses on one specific cloud optics change, the methods used here are applicable to any model physics change and should therefore be of broad interest to the model development community.
2.1 Supercooled liquid water optics
The cloud optics change we implement improves supercooled liquid water optics relevant for supercooled liquid water. Supercooled liquid water (240–273 K) scatters and absorbs radiation differently than room-temperature water (∼298 K) (Rowe et al., 2020). Figure 1 illustrates the difference in optics by plotting supercooled liquid water and room-temperature water complex refractive indices, which are defined as how a given material scatters and absorbs radiation as a function of wavelength. Optical properties used in our study were derived from these complex refractive indices. For the supercooled liquid water optics, we used complex refractive indices from Rowe et al. (2020) at the temperatures of 240, 253, 263, and 273 K.
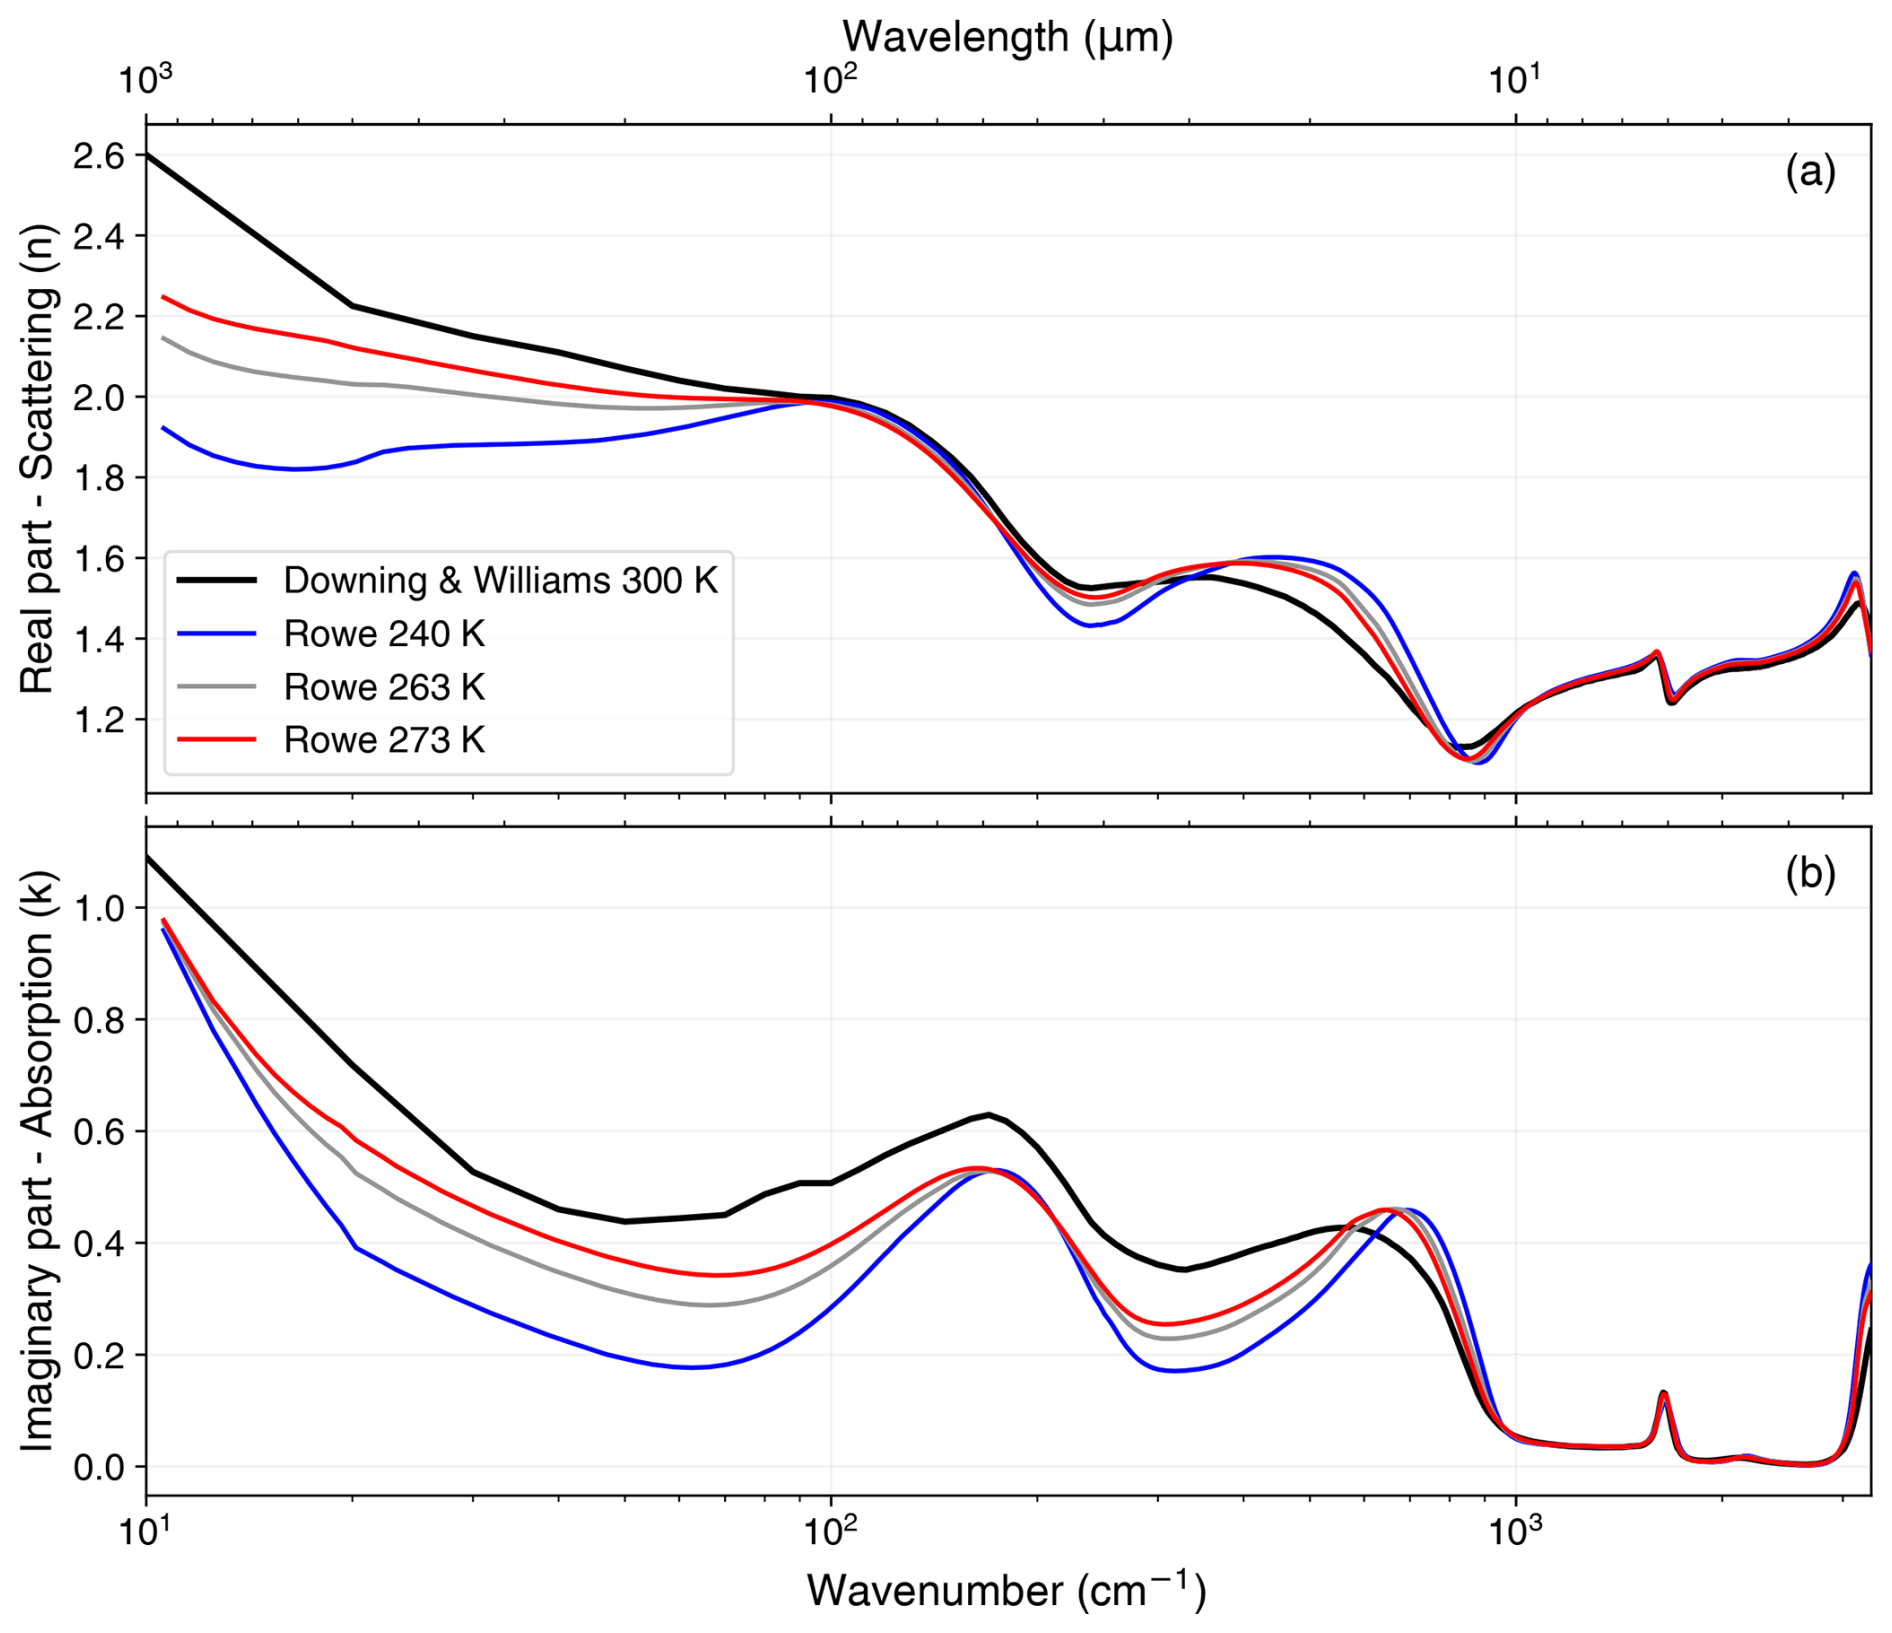
Figure 1Complex refractive index of water with the (a) real part and (b) imaginary part between 10–3000 cm−1 for four complex refractive indices at different temperatures: 240, 263, and 273 K from Rowe et al. (2020) and 300 K from Downing and Williams (1975).
2.2 Model hierarchy
In this work, we evaluate the effect of changing the liquid water optics from room temperature to supercooled on longwave radiation across a range of dynamically constrained models, while keeping the radiation scheme the same. The models in our hierarchy proceed from the most to least dynamically constrained atmosphere.
- 1.
Single-column atmospheric model: a completely constrained model at a single location on a daily timescale
- 2.
Wind-nudged global climate model configurations
- a.
Atmosphere-only (short timescale): a global dynamically constrained model on an annual timescale
- b.
Atmosphere-only (long timescale): a global dynamically constrained model on a decadal timescale
- c.
Fully coupled (short timescale): a global fully coupled dynamically constrained model on an annual timescale
- a.
- 3.
Freely evolving global climate model: an unconstrained global climate model on a decadal timescale
For each model, we compared the longwave radiation produced using room-temperature water optics against longwave radiation produced using supercooled liquid water optics. Then, we evaluated whether the difference in radiation was detectable and statistically significant. Finally, we assessed at what timescales, spatial scales, and degree of dynamical constraint the supercooled liquid water optics mattered. Primarily, we focus on the downwelling longwave flux at the surface (W m−2) to evaluate if the optics changed.
2.3 RRTMG liquid water optics
In order to use our supercooled liquid optics in RRTMG for all models in the hierarchy, we had to reproduce optics files in the same format as in RRTMG. The full description of how we created the optics files can be found in Appendix A. We produced optics files for 240, 253, 263, and 273 K. The default liquid water optics file in RRTMG was based on 298 K water (room temperature) and we used these optics in all of our control experiments. RRTMG only uses the mass absorption coefficient (kabs) in the longwave.
2.4 Single-column atmospheric model
First, we evaluated the impact of supercooled liquid water optics within a completely constrained single-column model. Specifically, we used the Single-Column Atmospheric Model Version 6 (SCAM, Gettelman et al., 2019), a well-documented simpler model available as part of the Community Earth System Model Version 2 (CESM2) (Danabasoglu et al., 2020). SCAM has all of the physics parameterizations from the atmospheric component of CESM2, the Community Atmosphere Model Version 6 (CAM), including the radiation scheme RRTMG (Clough et al., 2005; Iacono et al., 2008). SCAM runs the CAM6 physics, including RRTMG, at a single location and prescribes the dynamics state (Gettelman et al., 2019). We forced all SCAM runs with 17 d of observations (temperature and aerosols) from the Mixed-Phase Arctic Cloud Experiment (MPACE) to simulate an Arctic atmosphere with mixed-phase and supercooled liquid-containing clouds (Harrington and Verlinde, 2005). For our supercooled liquid water optics experiments, we swapped the default file for one of our supercooled liquid water optics files such that any liquid water in the atmosphere has those properties. To swap optics files, we gave SCAM the CAM namelist argument “liqopticsfile”, the file path to a supercooled liquid water optics file. We did this namelist change for all SCAM and CESM2 simulations where we used supercooled liquid water optics. We ran SCAM forced by MPACE with four sets of optics: the control optics and the supercooled liquid water 240, 263, and 273 K optics. We chose these optics sets to mirror the sets we used in the freely evolving and wind-nudged global climate model experiments.
2.5 Wind-nudged global climate model
We used the Community Earth System Model Version 2.2 (CESM2) for all our global climate model runs (Danabasoglu et al., 2020). We selected this model because it is widely used, is well-documented, is publicly available, and has vetted wind nudging capabilities (Kooperman et al., 2012). Previous work has analyzed and exposed important CESM2 Arctic biases, including an overestimation of cloud liquid (McIlhattan et al., 2020) and insufficient late summer Arctic sea ice cover (DuVivier et al., 2020). Understanding these known biases is valuable for the work here. Notably, the overestimation of cloud liquid may amplify any effect of the supercooled liquid water optics. In our model runs, we used a pre-industrial climate to examine the effect of supercooled liquid water optics on the mean state of the Arctic climate. All simulations had a spatial resolution of 1°×1°.
For our first set of CESM2 experiments, we used wind nudging, where the model uses a relaxation tendency term to nudge model values toward target values (Kooperman et al., 2012; Pithan et al., 2023). Nudging is implemented following
where F(x) is the internal tendency without nudging, Fnudge is the nudging term, α is the strength coefficient that is 0 where nudging is not enabled and 1 where nudging is enabled, is the target state at a future target time step, x(t) is the model state at the current model time step, and τ is the relaxation time between the next target time step and the current model time step (Blanchard-Wrigglesworth et al., 2021; Roach and Blanchard-Wrigglesworth, 2022). In our experiments, we nudged the horizontal wind components of CESM2 between 67.5–82.5° N and above 820 hPa. At both the vertical and horizontal nudging boundaries, we applied smoothing. We nudged the model with 6-hourly ERA-Interim reanalysis (ERA-I) data (European Centre for Medium-Range Weather Forecasts, 2009). Nudging the winds constrains the internal variability of the modeled climate system to a specific sequence of atmospheric circulation, which was the ERA-I winds in our experiments. Since all experiments were constrained to the same atmospheric circulation sequence, they were all likely to model the same sequence of clouds.
All of our wind nudging experiments are detailed in Table 1. The first nudging experiment, called F1850_UVnudge1980, was a 1-year 10-member atmosphere-only ensemble with the winds nudged to 1980 values from ERA-I. Second, we assessed the long-term climate impacts of changing the optics by running another atmosphere-only experiment, called F1850_UVnudge1980–2018, with 39 years of wind nudging. We ran three ensemble members to sample the internal variability of the wind-nudged model climate. For this configuration, we nudged with ERA-I data from 1980–2018. We allowed the nudged winds to evolve over time in the F1850_UVnudge1980–2018 experiments to evaluate the effect of the optics for a longer time span in a dynamically constrained atmosphere. Finally, we ran the same 1-year 10-member wind-nudged ensemble with a fully coupled model in a set of simulations called B1850_UVnudge1980. For this configuration, we also ran coupled simulations to evaluate how adding ocean and sea ice feedbacks impacted the signal from the optics change.
Table 1CESM2 experiment list.
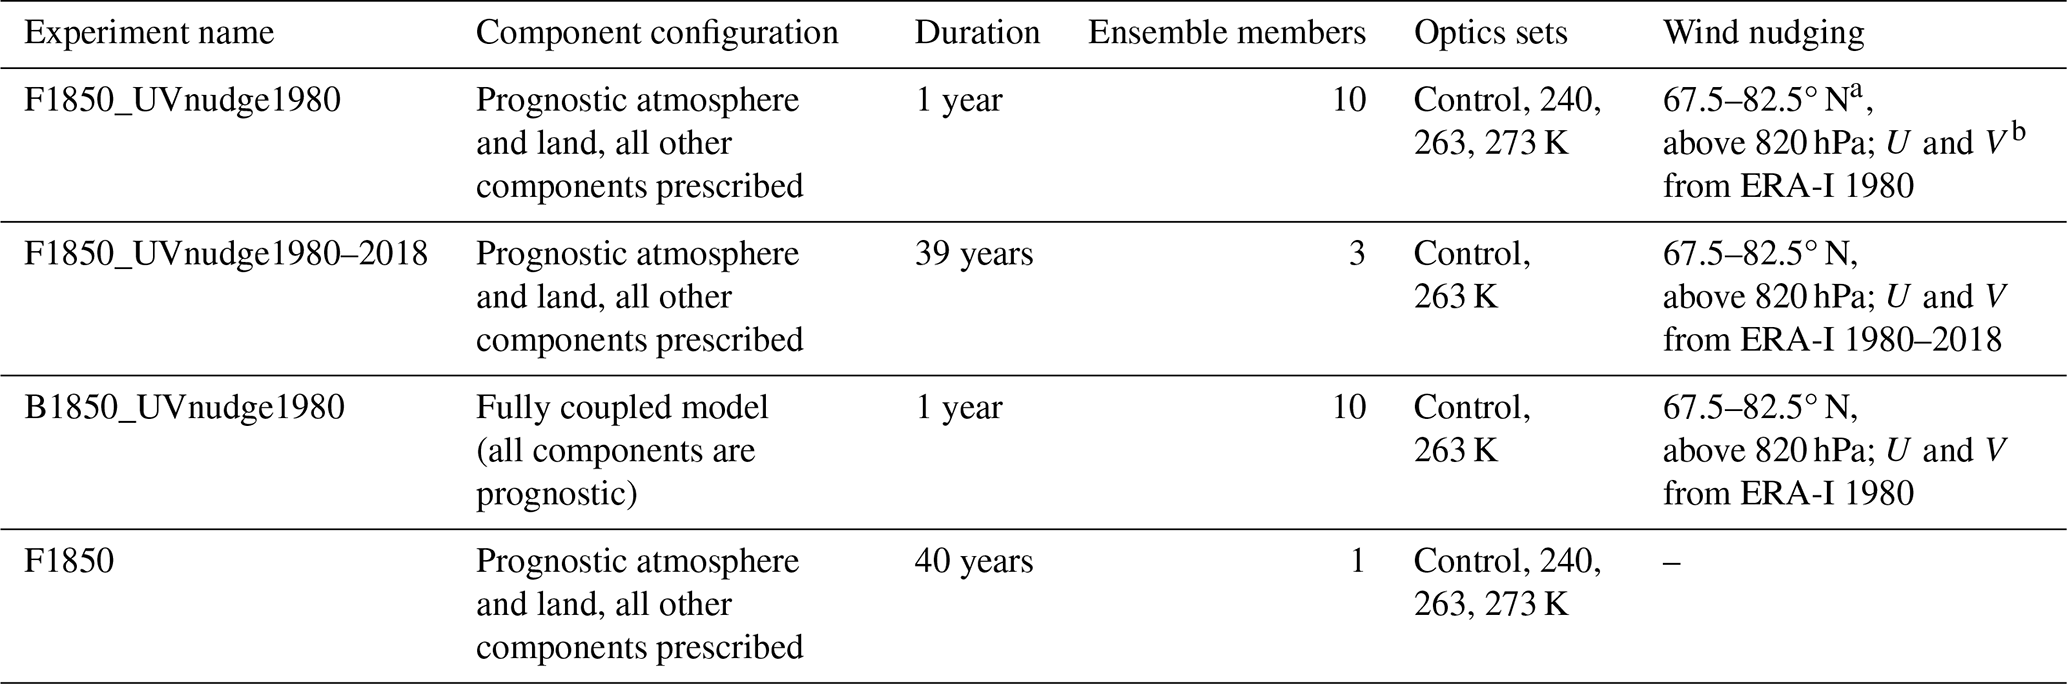
a The nudging window does not cover the entire Arctic (60–90° N), but we conducted nudging window testing that shows little difference in the modeled radiation between the 67.5–82.5° N and the 60–90° N windows. b U and V are the zonal and meridional wind components, respectively.
We used several sets of supercooled liquid water optics in our wind nudging experiments. For the experiment F1850_UVnudge1980, we ran the configuration with the control optics and with the supercooled liquid water 240, 263, and 273 K optics. We chose the 240 and 273 K optics because these temperatures are the outer limits for supercooled liquid water. We also added the 263 K optics set because that temperature was the closest to the average CESM2 cloud temperature in the Arctic. For the B1850_UVnudge1980 and F1850_UVnudge1980–2018 experiments, we ran both of these configurations with the control optics and the supercooled liquid water 263 K optics.
2.6 Freely evolving global climate model
Lastly, we wanted to see the effect of supercooled liquid water optics in a dynamically unconstrained global climate on a large spatial scale and decadal temporal scale. For this set of experiments, we ran four 40-year-long atmosphere-only experiments, where each run had a different set of optics: control, 240, 263, and 273 K (see F1850 experiments in Table 1). In all four simulations, the atmosphere evolves freely, as is the default in most global atmospheric and climate models.
3.1 Single-column atmospheric model Arctic case study
First, we present results from the single-column atmospheric model runs for the Arctic field campaign MPACE held during October 2004. During almost the entire 17 d period, both room-temperature and supercooled liquid water optics produced the same downwelling longwave flux at the surface (Fig. 2). The only notable differences (over 10 W m−2) in downwelling longwave flux between the supercooled liquid water optics and the control (room temperature water) optics simulations occurred on the dates of 7, 10, 11, and 21 October 2004. On these dates, there were differences in cloud fraction and dominant cloud phase between the room-temperature and supercooled liquid water optics SCAM runs. Depending on these cloud type and amount disparities, flux differences were not consistently in one direction for all optics sets on a given date or for one optics set over the entire model run. In summary, the complex evolution of cloud phase between SCAM runs complicated the attribution of differences in flux to changes in the cloud optics.
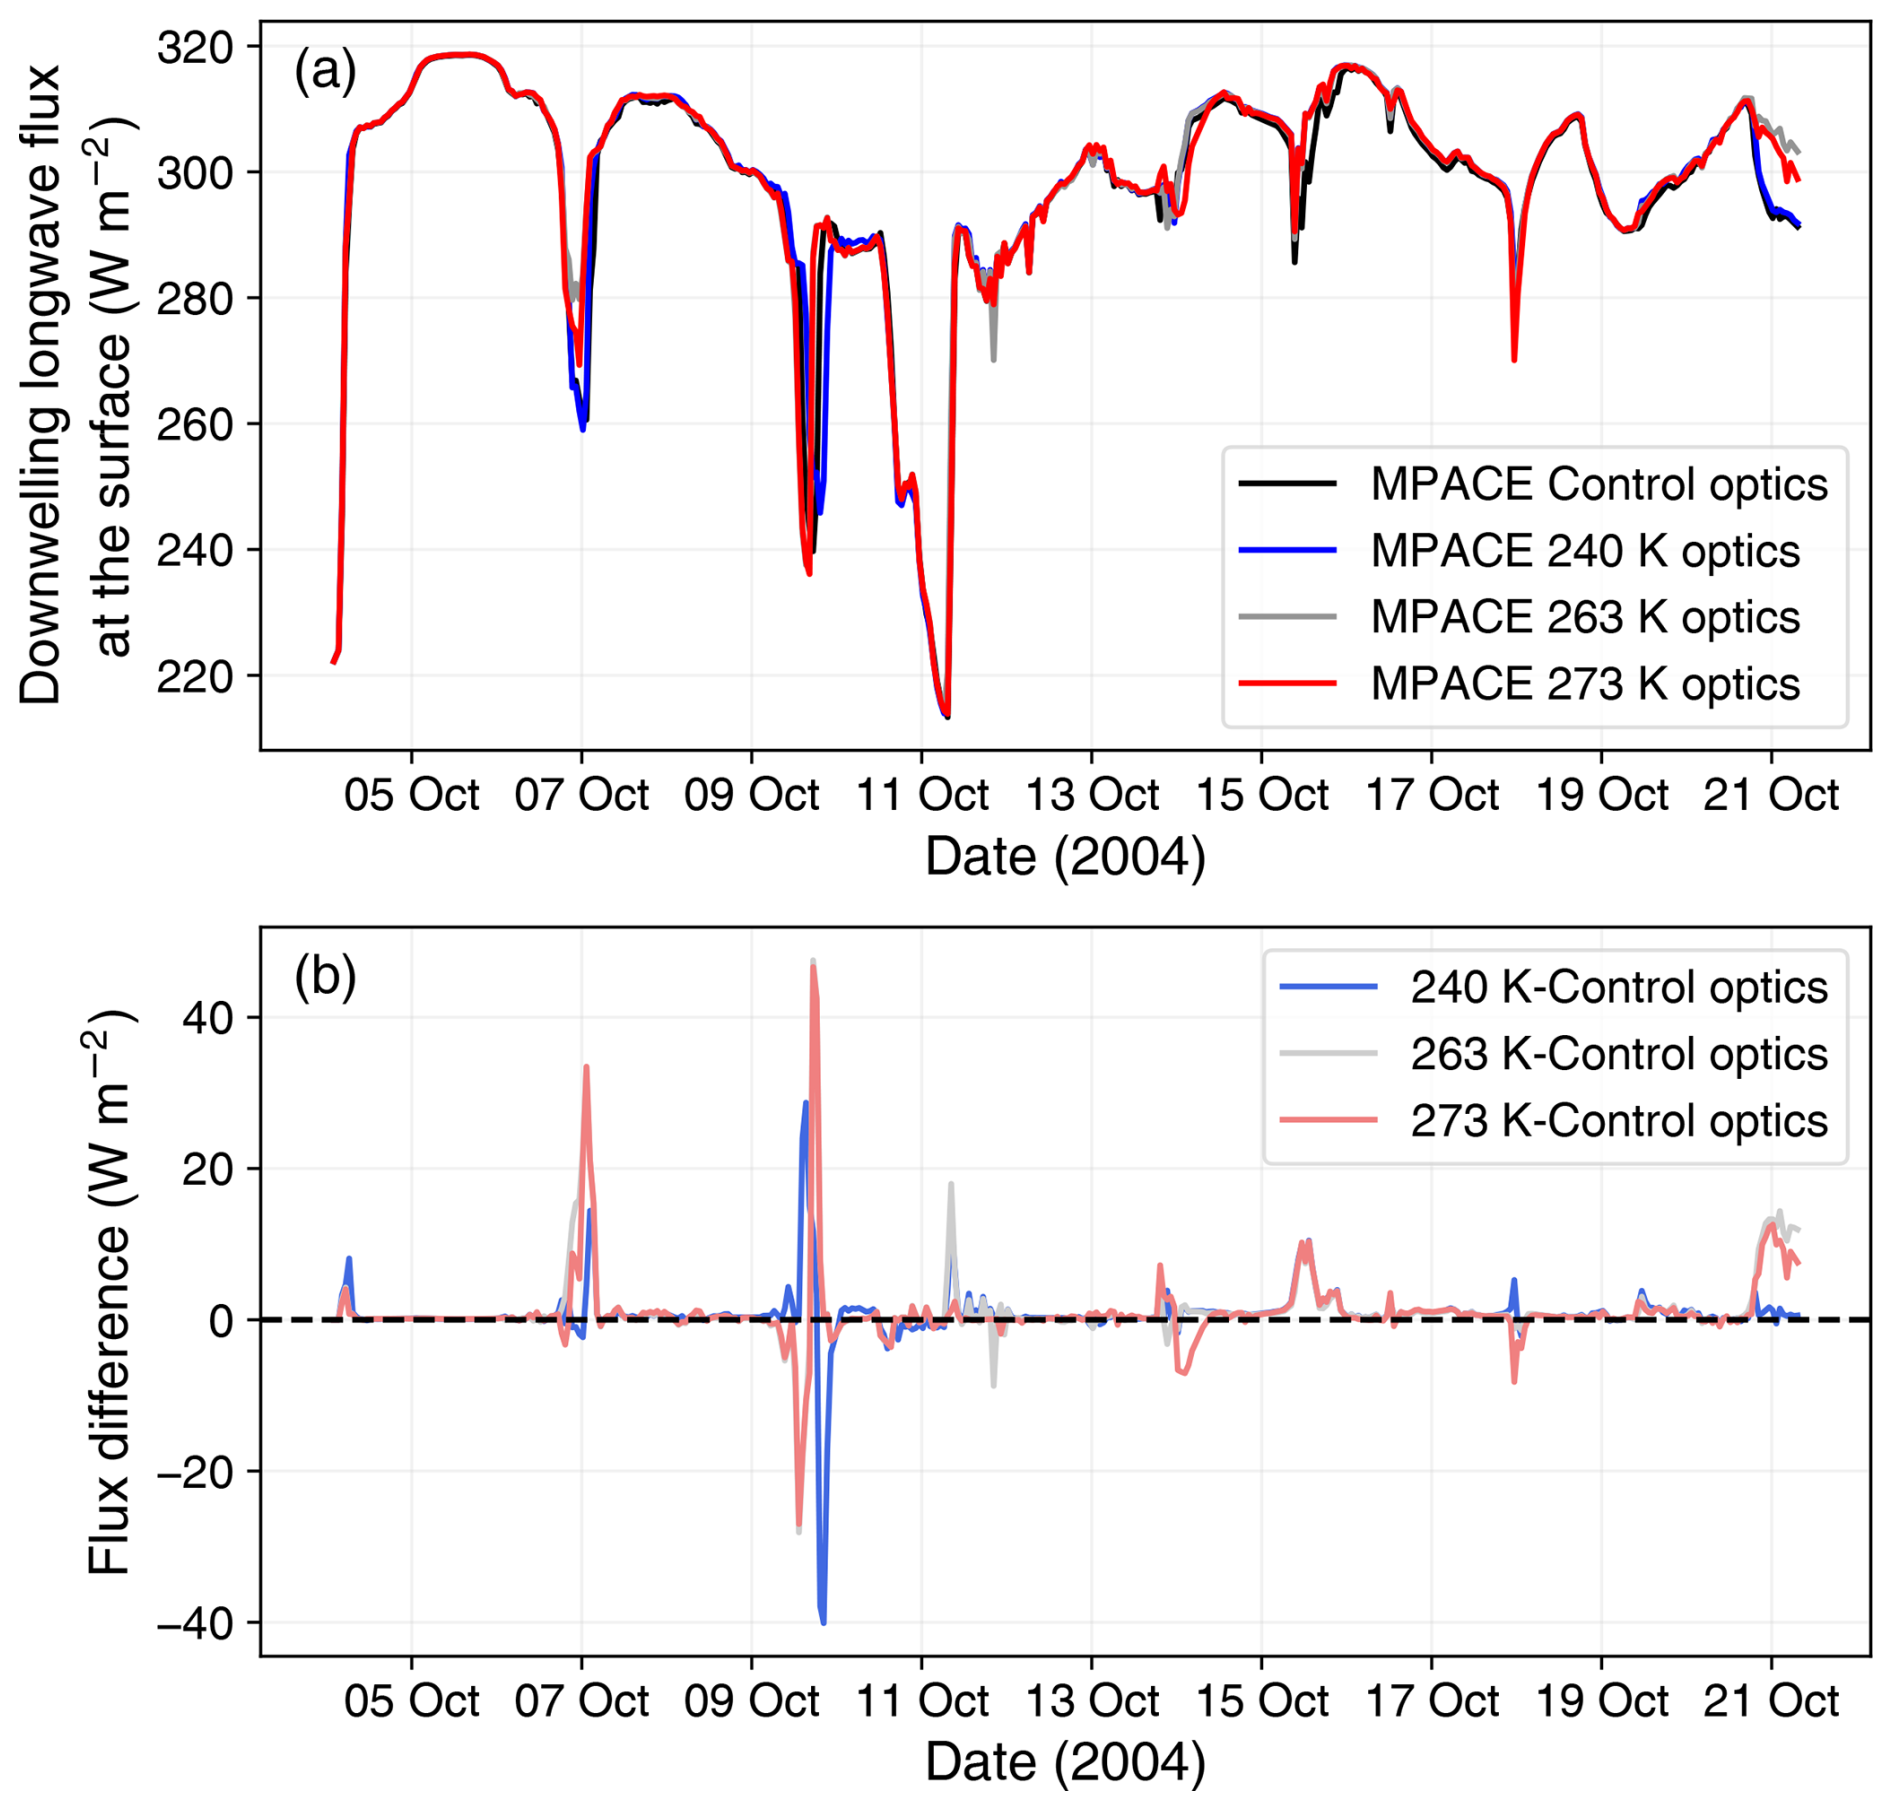
Figure 2(a) Downwelling longwave flux at the surface modeled by SCAM for the MPACE IOP with four different sets of optics: control – 298 K (black), 240 K (blue), 263 K (gray), and 273 K (red). (b) The difference in flux between the control and all three sets of supercooled liquid water optics.
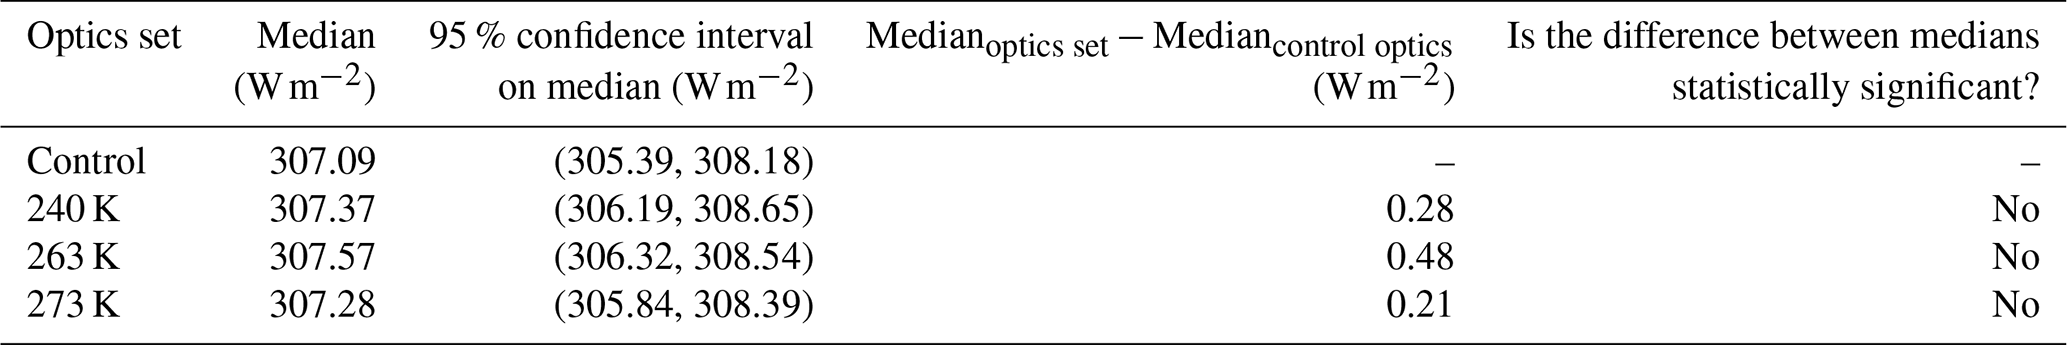
Comparing downwelling longwave flux from room-temperature and supercooled liquid water optics amongst all cloud types yielded unclear results in the SCAM MPACE runs. Therefore, to better isolate the signal, we focused our analysis of the cloud optics change on the cloud type where we anticipated the largest effect: thin supercooled liquid clouds. We isolated the impacts of the supercooled liquid water optics by subsetting the downwelling longwave flux, only including data points when there were low-level supercooled liquid clouds and the atmosphere was optically thin (τ<5). Table 2 describes the results of this subsetting. Notably, the medians of all the subsetted supercooled optics fluxes were larger than the subsetted room-temperature optics fluxes by 0.21–0.48 W m−2. This result showed that the downwelling flux modeled by SCAM for low-level supercooled liquid clouds was larger for the supercooled liquid water optics. However, the differences between the supercooled and room-temperature flux medians were not statistically significant at the 95 % confidence level (Table 2). In short, the SCAM MPACE experiments that were strongly dynamically constrained did not show a significant effect from the supercooled liquid water optics.
Table 2Statistics from subsetted SCAM-MPACE downwelling longwave flux data.
3.2 Wind-nudged global climate model
We next evaluate the impact of supercooled liquid water optics on a wind-nudged atmosphere with an ensemble from the experiment F1850_UVnudge1980 (Table 1). The ensemble mean downwelling longwave flux at the surface from F1850_UVnudge1980 was higher (2.17–3.24 W m−2) in most of the Arctic for the supercooled liquid water optics (Fig. 3). Critically, many flux differences were statistically significant at the 95 % confidence level. In other words, the influence of the supercooled liquid water optics change on longwave radiation was detectable. The flux differences were statistically significant in this experiment because the wind nudging reduced noise caused by different atmospheric circulation sequences and emphasized the signal from the supercooled liquid water optics. The spatial patterns of statistically significant flux differences for the F1850_UVnudge1980 experiments were also mostly consistent between the supercooled liquid water optics sets. This high level of spatial consistency demonstrated that wind nudging reduced atmospheric circulation differences between the model runs.
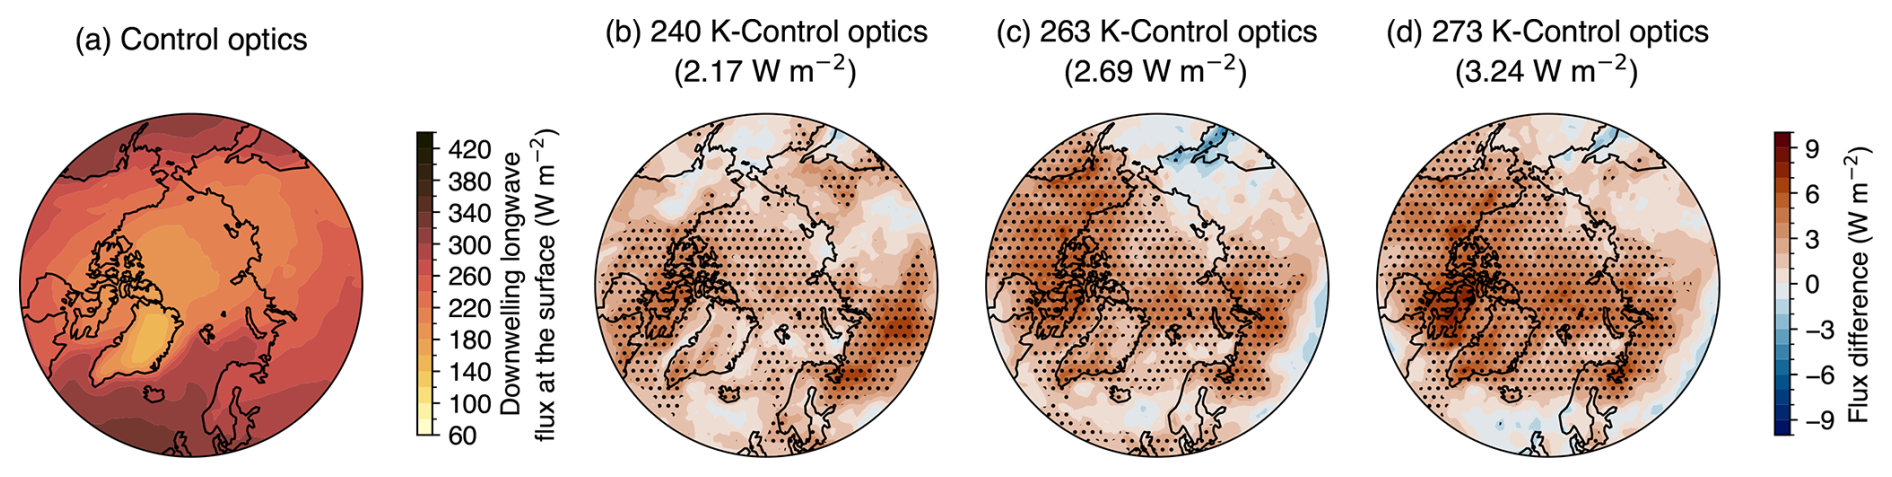
Figure 3(a) The 1-year ensemble mean downwelling longwave flux at the surface from the F1850_UVnudge1980 control run. Flux differences in the 1-year ensemble averages between (b) the 240 K and control optics runs, (c) the 263 K and control optics runs, and (d) the 273 K and control optics runs from F1850_UVnudge1980. In parentheses above panels (b)–(d) is the spatial average of the flux differences over 60–90° N. Stippling indicates that the differences are statistically significant at the 95 % confidence level. The false discovery rate was controlled for using Wilks (2016). The color maps are generated based on work by Crameri et al. (2020).
We detail the influence of supercooled liquid water optics on a decadal timescale with a constrained atmosphere from our F1850_UVnudge1980–2018 experiment. The ensemble mean of the downwelling longwave flux at the surface was higher (0.75 W m−2) in most of the Arctic for the supercooled liquid water optics (Fig. 4). Some of these flux differences were statistically significant. Thus, the supercooled liquid water optics impacted the longwave flux substantially on a decadal scale. However, the area and magnitude of statistically significant flux differences in the F1850_UVnudge1980–2018 ensemble (Fig. 4b) were smaller than the F1850_UVnudge1980 ensemble (Fig. 3c). This decades-long ensemble had fewer ensemble members, and thus a smaller sample size of the model climate's internal variability, and added interannual variability. In summary, the effect of the supercooled liquid water optics was widespread across the Arctic and statistically significant in some places, but the magnitude of the effect on a decadal time was less than 1 W m−2.
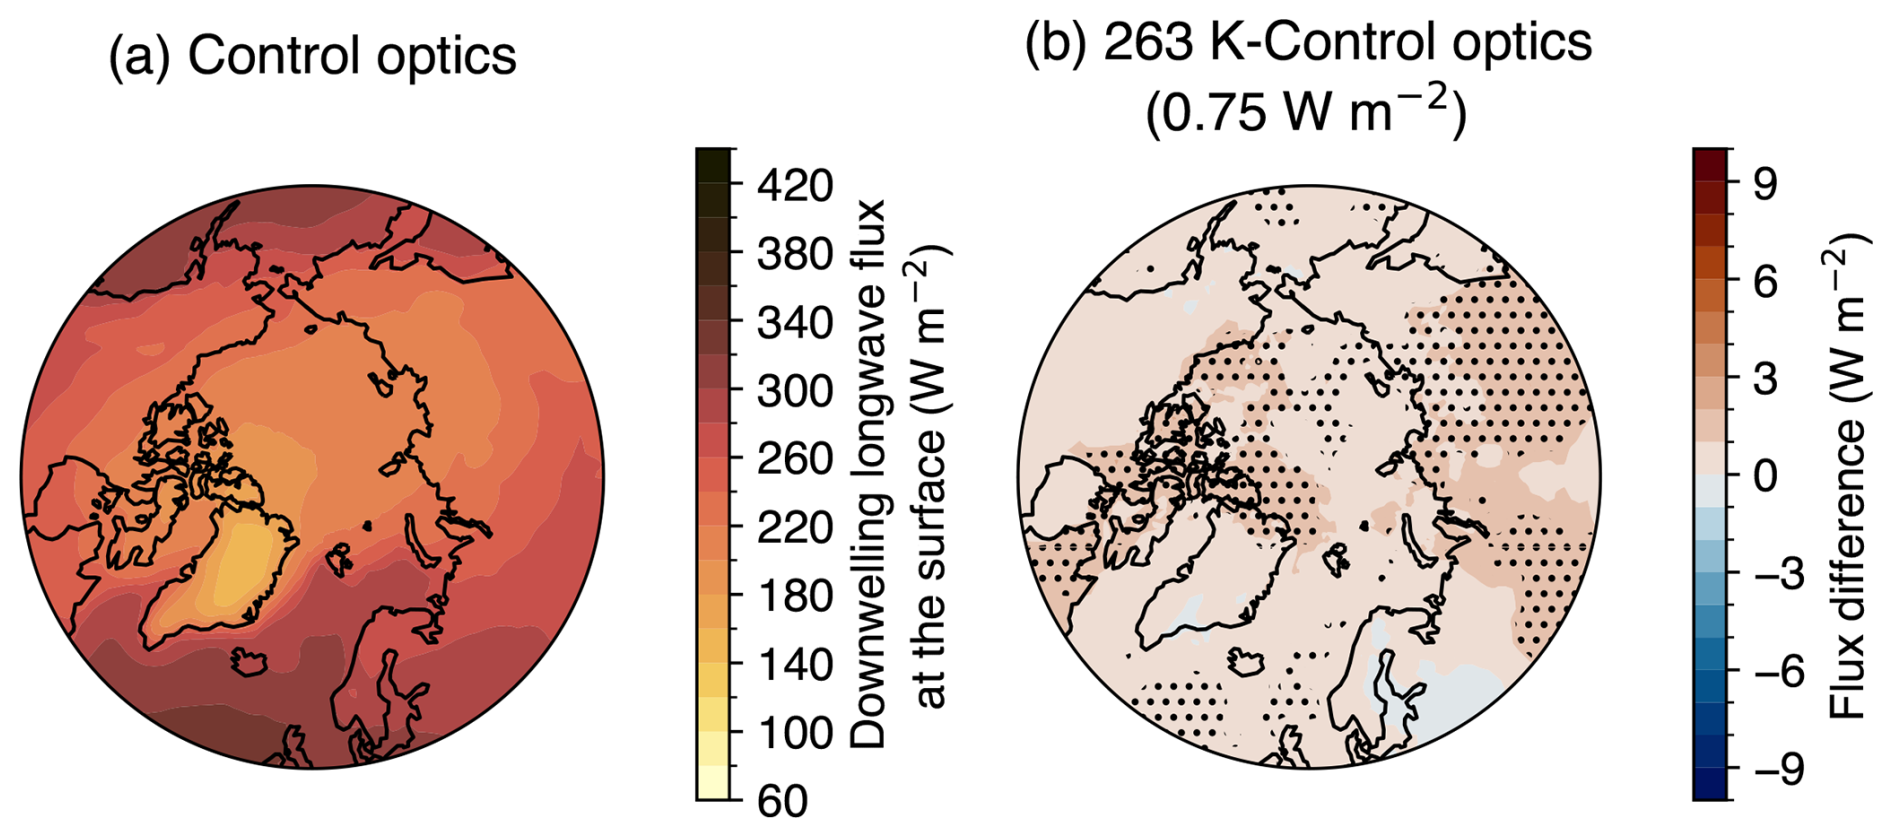
Figure 4(a) The 39-year ensemble mean downwelling longwave flux at the surface from the F1850_UVnudge1980–2018 control run. Flux differences in the 39-year ensemble averages between (b) the 263 K and control optics runs from F1850_UVnudge1980–2018. In parentheses above panel (b) is the spatial average of the flux differences over 60–90° N. Stippling indicates that the differences are statistically significant at the 95 % confidence level. The false discovery rate was controlled for using Wilks (2016). The color maps are generated based on work by Crameri et al. (2020).
To understand the influence of ocean and sea ice coupling, we next describe the results from the coupled and dynamically constrained model ensemble (B1850_UVnudge1980). The ensemble mean of the downwelling longwave flux at the surface was higher (1.29 W m−2) in some of the Arctic for the supercooled liquid water optics (Fig. 5). Surprisingly, no flux differences due to the supercooled liquid water optics were statistically significant. These results demonstrated that enabling coupling to the ocean and sea ice model components reduced the ability to detect a radiation change from the altered cloud optics in spite of the dynamical constraints.
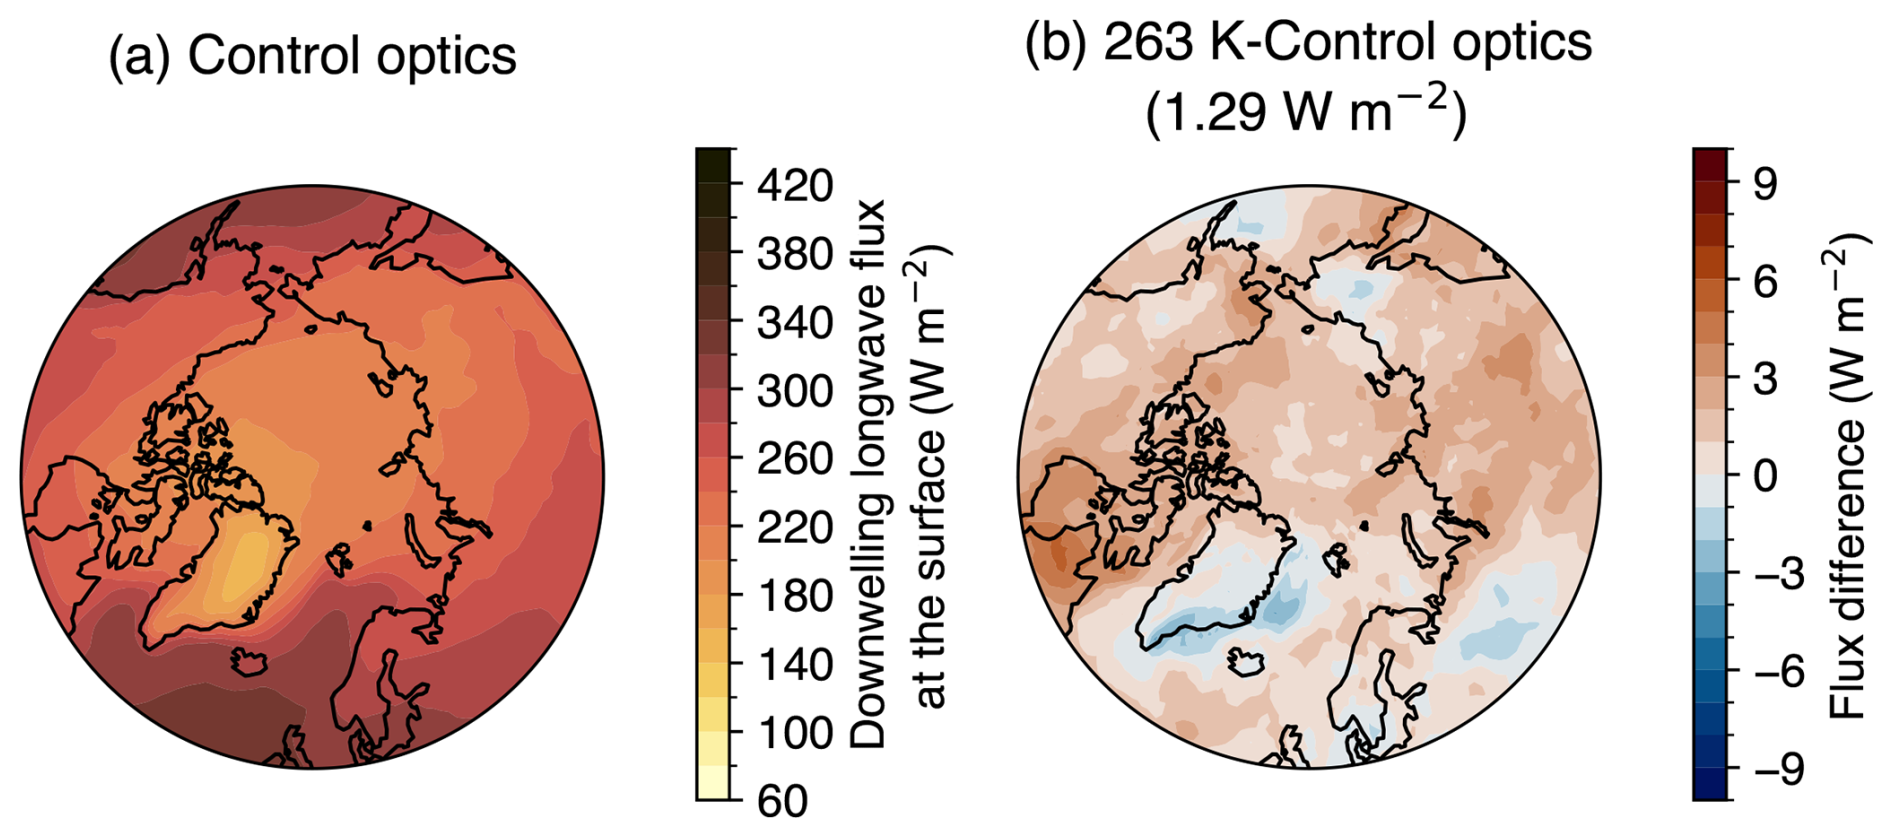
Figure 5(a) The 1-year ensemble mean downwelling longwave flux at the surface from the B1850_UVnudge1980 control run. Flux differences in the 1-year ensemble averages between (b) the 263 K and control optics runs from B1850_UVnudge1980. Stippling indicates that the differences are statistically significant at the 95 % confidence level. The false discovery rate was controlled for using Wilks (2016). The color maps are generated based on work by Crameri et al. (2020).
3.3 Freely evolving global climate model
Having shown that the optics physics change produces slightly more downwelling surface longwave flux in dynamically constrained models, we last describe results from a freely evolving atmosphere model run with no dynamical constraints (F1850). This model run is the default configuration for almost all global atmospheric models. For the F1850 experiment, the average downwelling longwave flux at the surface over the model run-time span (40 years) was higher by 0.36–0.68 W m−2 over most of the Arctic for the supercooled liquid water optics than the room-temperature water optics (Fig. 6). Globally, the supercooled liquid water optics increased the downwelling longwave flux by 0.20–0.27 W m−2. However, all these flux differences were not statistically significant at the 95 % confidence level. We also observed that the total area where supercooled liquid water optics produced more downwelling longwave flux was larger than where the room-temperature water optics produced more, but the spatial pattern of these areas is not consistent between Fig. 6b and c. This spatial inconsistency suggests that differences due to internal climate variability between all three of the F1850 runs complicated our ability to the detect the signal from the supercooled liquid water optics alone over the chaotic atmospheric noise.
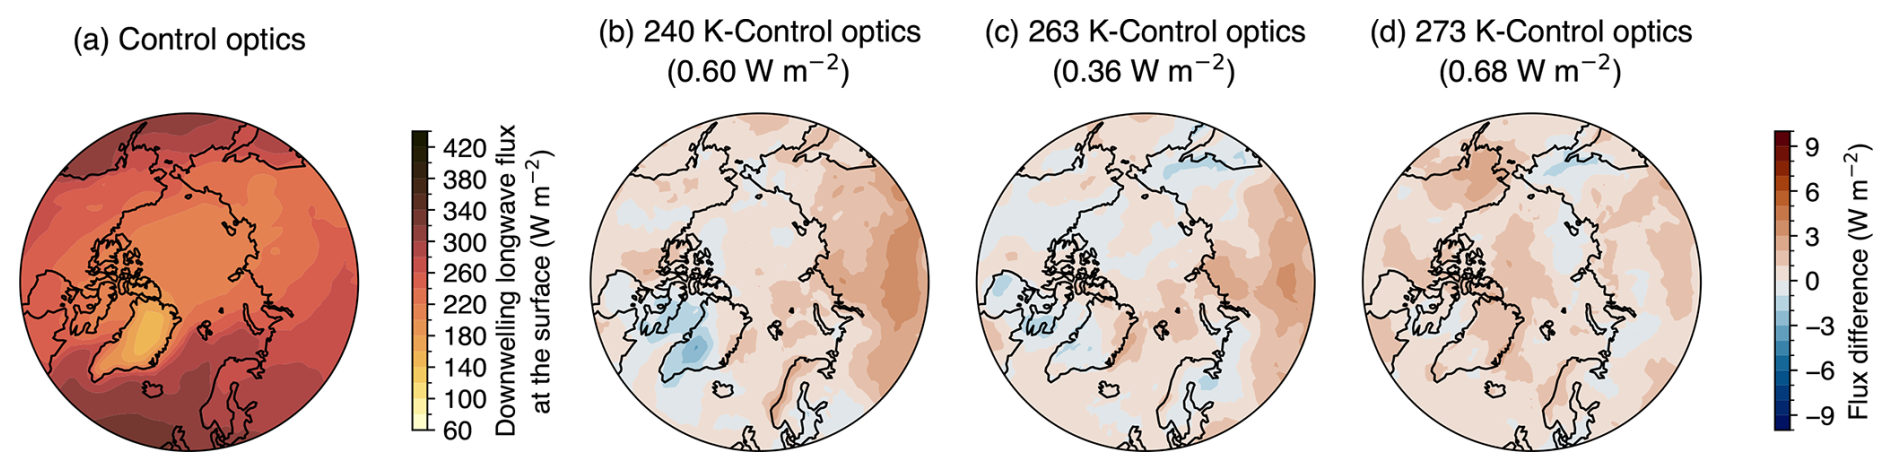
Figure 6(a) The 40-year mean downwelling longwave flux at the surface from the F1850 control run. Flux differences in the 40-year averages between (b) the 240 K and control optics runs, (c) the 263 K and control optics runs, and (d) the 273 K and control optics runs from F1850_UVnudge1980. In parentheses above panels (b)–(d) is the spatial average of the flux differences over 60–90° N. Stippling indicates that the differences are statistically significant at the 95 % confidence level. The false discovery rate was controlled for using Wilks (2016). The color maps are generated based on work by Crameri et al. (2020).
Although the results thus far have focused on downwelling surface longwave radiation, the supercooled liquid water optics that we implemented impact longwave radiation emitted in all directions. Of critical importance, outgoing longwave radiation emitted at the top of the atmosphere (OLR) contributes to the planetary energy balance. Thus, we also assessed the optics impact on OLR from the freely evolving climate model run. We found that the globally averaged OLR changes resulting from the optics changes are small (0.08–0.11 W m−2) and not statistically significant. Thus, this short analysis of the OLR provides additional evidence that the influence of the optics change on the freely evolving model is modest.
Our main conclusion is that the effect of including supercooled liquid water optics is small but non-negligible. While the optics did have an impact on the mean-state Arctic longwave radiation at the range of atmospheric dynamical constraints, their effect in the model experiments closest to the real world and to a typical unconstrained model, the wind-nudged coupled ensemble and freely evolving model run, was minimal and statistically insignificant. We found that the effect of the supercooled liquid water optics was 0.36–3.24 W m−2, which confirmed the results from the Rowe et al. (2013) case study. Our novel model hierarchy worked, taking new physics and case study results and finding a similar size effect on the climate. However, an effect of this magnitude has different implications when considering a case study vs. a global climate model. In the case study results from Rowe et al. (2013, 2022), they concluded that the 1.7 W m−2 effect of these optics mattered when retrieving cloud properties from radiance measurements because retrievals of ice and liquid effective radii, ice fraction, and liquid water path were affected substantially, whereas for the global climate model, an effect of a few W m−2 is within climate variability and thus relatively small. However, the effect of these optics was not negligible and we recommend that model development add these optics to the list of parameterizations to be added to RRTMG.
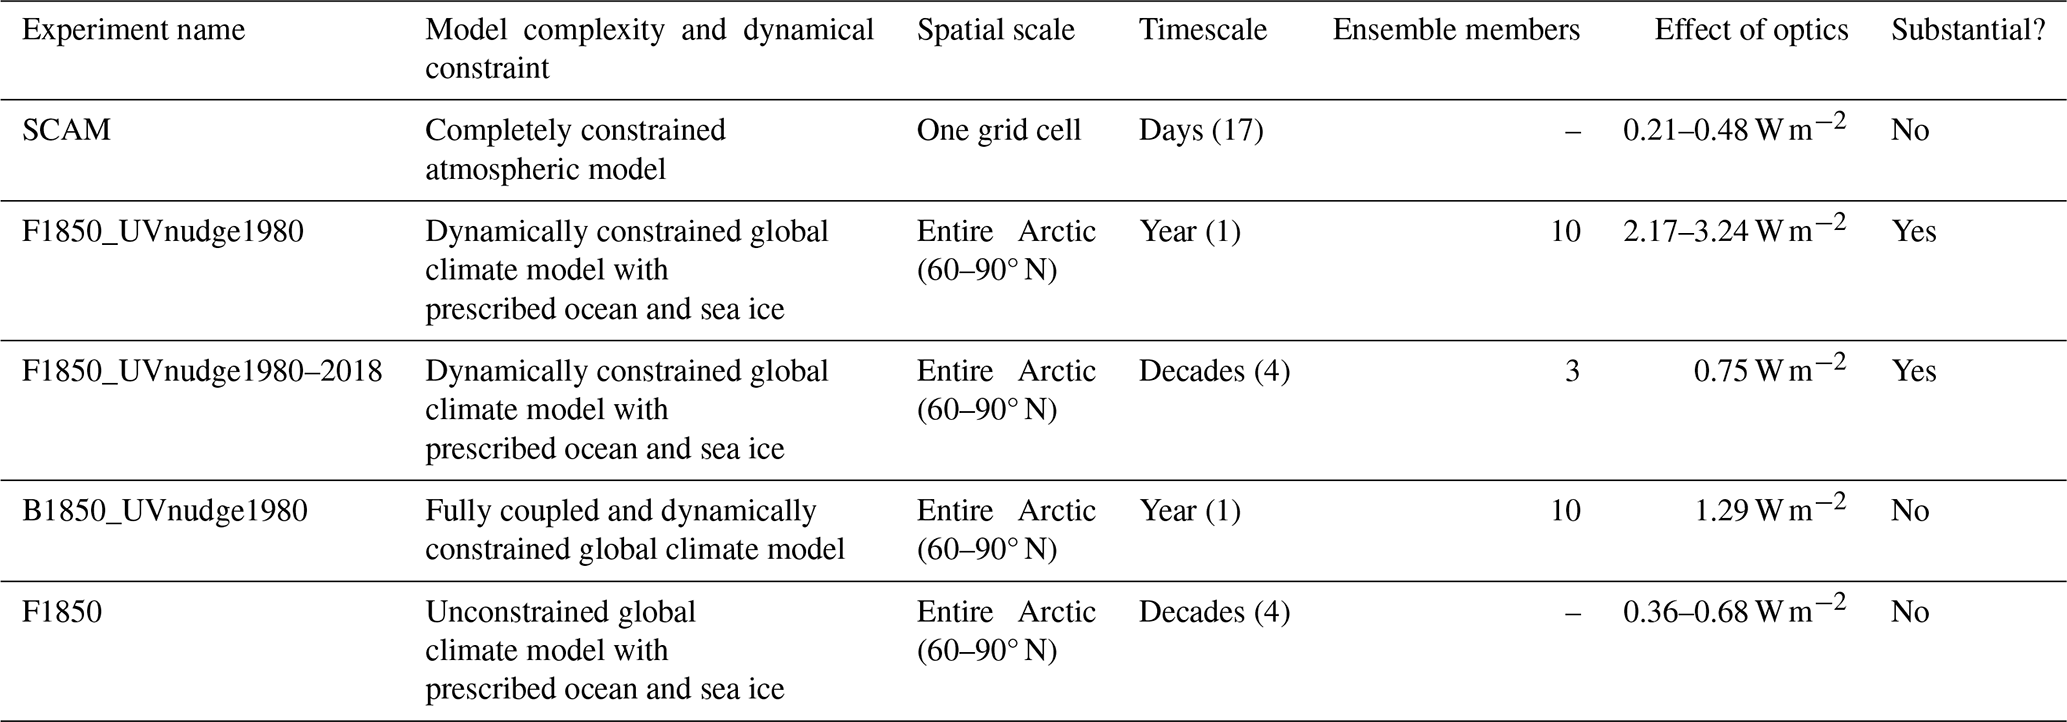
This study has additional value in showing how a model hierarchy can be used to assess the importance of a model physics change. In the first step, the single-column model showed us the effect in a fully constrained atmospheric model at a single location. We found it hard to isolate the effect of the optics in this model because of the short, daily timescale. We also realized that internal variability and dynamical differences related to clouds between model runs might affect our results. The wind nudging step in the hierarchy allowed us to constrain the atmospheric dynamics and amplify the signal in the radiation from the optics change relative to the noise. Lastly, we evaluated the optics change in a freely evolving global climate and found a statistically insignificant impact. The results at this step confirmed our earlier suspicions that unconstrained dynamics might obscure our ability to isolate the effect of the optics. The novel addition of wind nudging in this hierarchy allowed us to constrain the dynamic variability and amplify the signal in the radiation from the optics change to a substantial level. This hierarchy taught us a lot about the impact of our physics change because it told us at what degree of dynamical constraint and timescales and spatial scales the optics had an effect, as summarized in Table 3. As a result, this novel model hierarchy enabled us to make specific conclusions about the effect of the optics and recommendations to the model development community.
Table 3Summary of the effect of supercooled liquid water optics over the entire model hierarchy. The effect of the optics for F1850_UVnudge1980, F1850_UVnudge1980–2018, B1850_UVnudge1980, and F1850 is the regional average over the spatial scale. A range of values in the effect of the optics represents the minimum and maximum effect from multiple optics sets.
There are some limitations and caveats of our study that we want to address. First, it is important to note that large uncertainties remain in the supercooled liquid water optics in climatologically important spectral regions, including below 500 cm−1 and from 1075 to 1575 cm−1 (Rowe et al., 2020). Second, CESM2 CAM6 is known to have optically thick mean-state Arctic clouds (McIlhattan et al., 2020), and we know from the case study results (Rowe et al., 2013) that the effect of the supercooled liquid water optics is greatest for clouds with liquid water paths of 1–10 g m−2, which are optically thin. From this perspective, our study may be underestimating the effect of these optics. To address this, we could rerun steps two and three of our model hierarchy in a model with mean-state optically thinner clouds, such as CESM2 CAM5 (McIlhattan et al., 2017). Yet, models like CAM5 with these thinner clouds underestimate supercooled liquid and overestimate ice in Arctic clouds (Kay et al., 2016). Considering these competing biases and the fact that CAM6's supercooled liquid is more realistic than CAM5's (Gettelman et al., 2020; McIlhattan et al., 2020), CESM2 CAM6 is a reasonable choice for this study. However, our model evaluation was based on performance in the Arctic and with respect to supercooled liquid. Scientists utilizing this hierarchy outside of the Arctic need to consider biases appropriate for their spatial domain and variables when choosing the global climate model for the hierarchy. Third, our conclusions about the impact of supercooled liquid water optics are limited to the models we used. We recommend using our model hierarchy structure to test the effect of these optics in other climate models. For high-resolution spectral radiation models, we recommend consulting Rowe et al. (2013) because they use a comparable model. Finally, fully implementing the supercooled liquid water optics would increase the model computational cost. In our study, we switched out the liquid optics lookup table, which did not change the computational cost. Ideally, the model would match the cloud temperature and optics temperature by interpolating the optics properties. This implementation would involve the model performing that interpolation at every time step and grid cell, increasing the cost of the already costly radiation scheme significantly. One possible compromise to these two implementation approaches would be to find the optics set closest to the cloud temperature and use that lookup table. We expect that this third approach would be easy to implement and nominally increase the radiation scheme's computational cost.
Based on our study results, we have some suggestions for future work regarding both the supercooled liquid water optics and the model hierarchy. First, the Antarctic and Southern Ocean have a high occurrence of supercooled liquid (Gettelman et al., 2020), including optically thin supercooled liquid clouds (Rowe et al., 2022). In addition, the atmosphere of the Antarctic interior is colder and drier than the Arctic, and there is evidence that liquid effective radii are smaller in the Antarctic (Lubin et al., 2020), which could cause the supercooled liquid water optics to have an even larger effect (Rowe et al., 2013). These factors make the Antarctic a prime second location to test the effect of the supercooled liquid water optics, specifically the wind-nudging experiments from the model hierarchy. Furthermore, the effect of the supercooled liquid water optics is also of import for upwelling infrared radiation, which is expected to have a magnitude about twice as large in the tropics as the effect on downwelling infrared radiation in the Arctic for a supercooled liquid cloud at 240 K and typical atmospheres (Rowe et al., 2013). While assessing the Antarctic and the tropical influence of these optics changes would be of regional interest, we want to emphasize that this work found that both the global and Arctic mean impacts on longwave radiation were often modest and not statistically significant. Another avenue for future research is using our novel model hierarchy to evaluate the impact of other potential model physics additions. For example, Meng et al. (2022) developed a new dust particle size distribution for CESM that improved the representation of super-coarse dust. However, their work did not assess the new dust parameterization outside of the dust size distribution, and our model hierarchy could be used to evaluate this parameterization's impact on cloud properties, aerosol optical depth, and aerosol radiative forcing before it is incorporated into CESM. Taking a step back from individual parameterizations, this model hierarchy could even be used to detect changes between different versions of radiation or microphysical schemes.
In this study, we assessed the impact of supercooled liquid water optics on longwave radiation in the Arctic over a hierarchy of models. Our model hierarchy, decreasing in degree of dynamical constraint, included a single-column atmospheric model, several wind-nudged global climate model configurations, and a freely evolving global climate model. We found that the optics had insubstantial effects at 0.21–0.48 W m−2 for the single-column model Arctic case study. In the wind-nudged model ensemble at a year-long timescale, the optics had a substantial 2.17–3.24 W m−2 effect in the Arctic for an atmosphere-only configuration. Extending the wind-nudged ensemble's length to 39 years reduced the effect of the optics to a still substantial 0.75 W m−2. Yet, the wind-nudged fully coupled year-long ensemble found an insubstantial optics effect of 1.29 W m−2. These results demonstrate that constraining the dynamic variability through wind nudging amplified the non-dynamical signal of the supercooled liquid water optics, but adding coupled ocean and sea ice components to the model and making it more realistic reduced the impact of the optics significantly. Finally, for the freely evolving global climate model (CESM2), the optics had a 0.36–0.68 W m−2 effect on a decadal timescale that we deemed insubstantial because of the atmospheric noise within the model. Our first conclusion is that given the magnitude of the optics' effect on longwave radiation at various degrees of dynamical constraint and timescales and spatial scales, the supercooled liquid water optics should eventually be added to radiation parameterizations, but they are not a first priority. Our second conclusion is that the model hierarchy we developed can be used to assess the importance of model physics changes, such as new parameterizations or entire schemes.
The RRTMG radiation scheme in CESM2 and SCAM has 16 longwave bands and 14 shortwave bands, as shown in Tables A1 and A2, respectively. The optics file contains the following variables for both longwave and shortwave bands: mass extinction coefficient (kext), mass absorption coefficient (kabs), mass scattering coefficient (ksca), single-scattering albedo (), asymmetry parameter (g), extinction efficiency (Qext), absorption efficiency (Qabs), and scattering efficiency (Qsca). Each variable has the dimensions μ and λ. These parameters describe the gamma distribution that defined the droplet size distribution (n(D)) as a function of droplet diameter in the following equations:
where N was the droplet number concentration, Deff was the effective droplet diameter, and x was the size parameter. For Eq. (A6), λ represented wavelength, but for Eqs. (A1)–(A5), λ was the droplet size distribution parameter.
We calculated Qext, Qsca, and g as functions of wavenumber with the method outlined in Wiscombe (1979). For the rest of the variables in the file, we used the following equations:
where λ and μ were the parameters for the droplet size distribution and ρw was the density of water. For each longwave and shortwave band, we calculated each variable at the band maximum, midpoint, and minimum. Then, we took the average of those three values and saved that average value to the optics file for that band. In Fig. A1, an example of the new kabs for the 263 K optics is contrasted against the default RRTMG optics at 298 K.
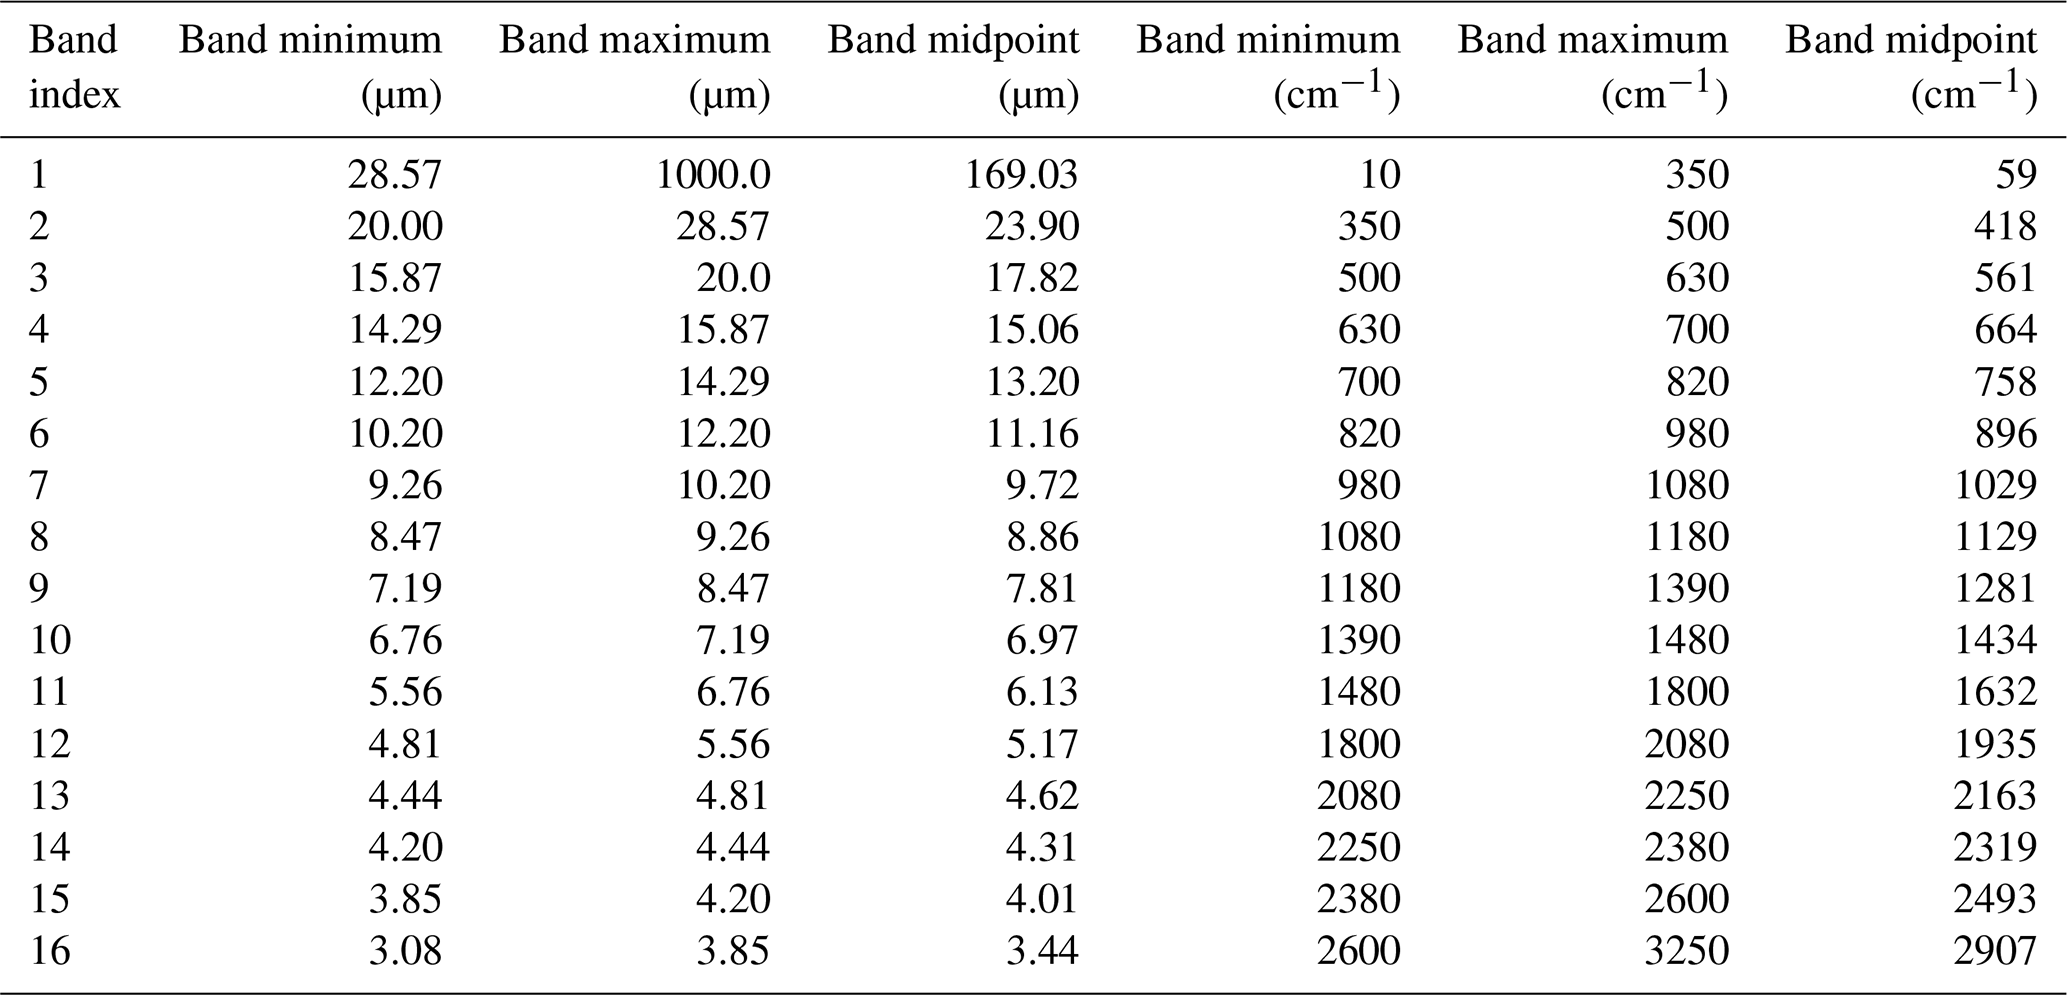
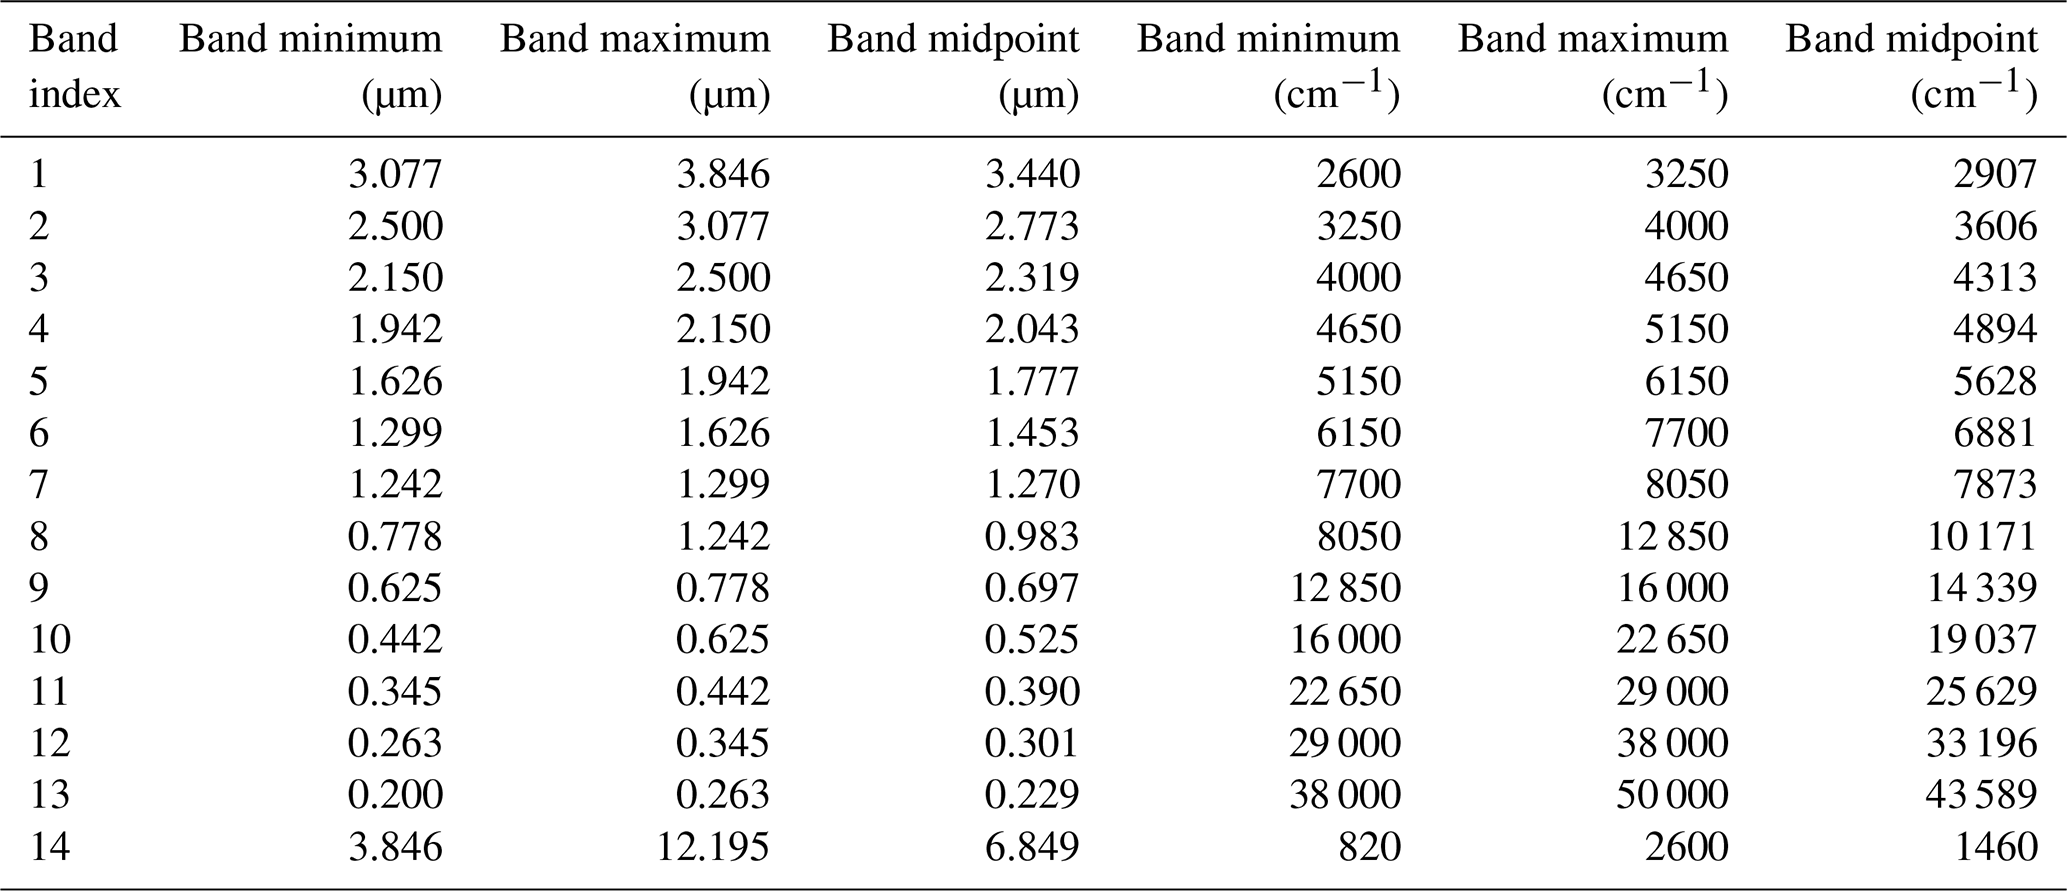
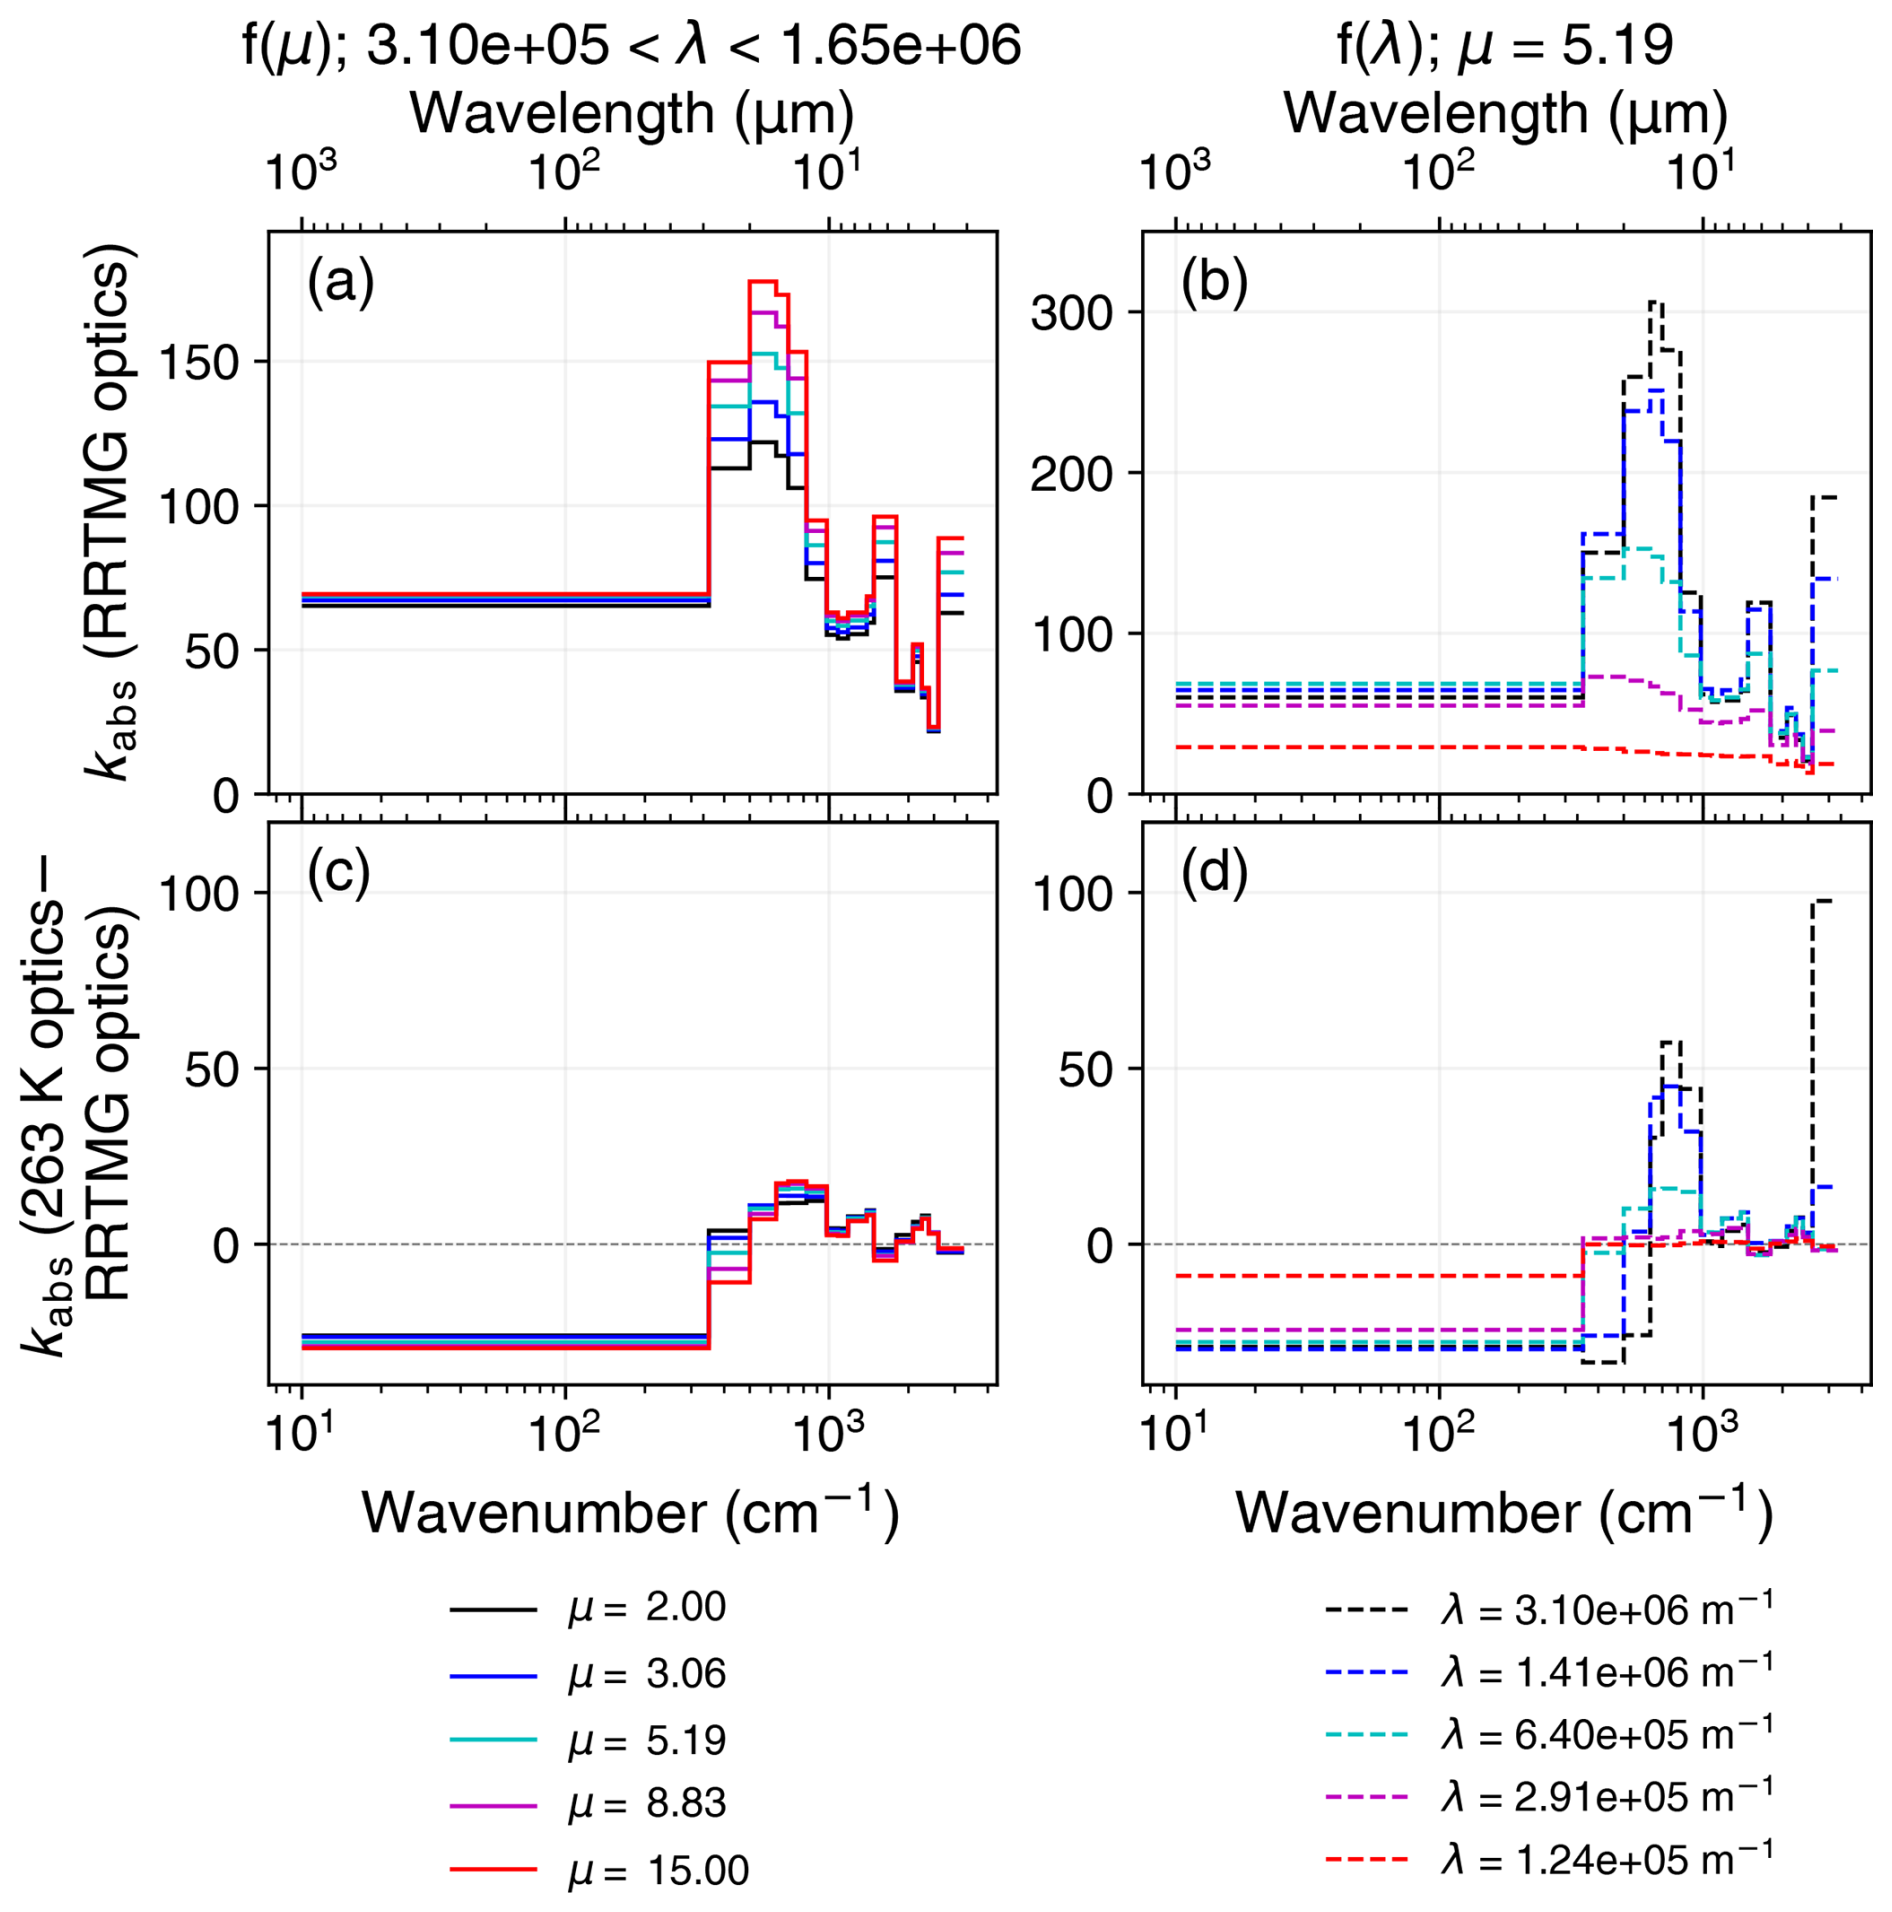
Figure A1The longwave mass absorption coefficient (kabs (m2 kg−1)) graphed for the current RRTMG liquid optical properties (a, b) as a function of wavenumber and wavelength. The difference in longwave mass absorption coefficient between new liquid optical properties calculated from the 263 K complex refractive index (Rowe et al., 2020) and the current RRTMG liquid optical properties (c, d) is also graphed as a function of wavenumber and wavelength. In RRTMG, kabs is a lookup table in terms of the parameters μ and that describe the droplet size distribution where λ is a function of μ. Panels (b) and (d) are the kabs spectra at a fixed μ and five λ values. Panels (a) and (c) are the kabs spectra at five μ values and their corresponding λ.
The supercooled liquid water CRI and optics and the processed SCAM and CESM2 data are available from https://doi.org/10.5281/zenodo.15741756 (Gilbert, 2025a). The code needed to run all of the model hierarchy experiments and the namelists for the SCAM and CESM2 experiments are available from https://doi.org/10.5281/zenodo.16414171 (Gilbert, 2025b). The code needed to create all the figures is available from https://doi.org/10.5281/zenodo.16415183 (Gilbert, 2025c).
AG and JEK designed the experiments and model hierarchy. AG performed the model runs and analysis. JEK and PR provided input on the analysis. AG wrote the paper, with input from all authors.
The contact author has declared that none of the authors has any competing interests.
Publisher's note: Copernicus Publications remains neutral with regard to jurisdictional claims made in the text, published maps, institutional affiliations, or any other geographical representation in this paper. While Copernicus Publications makes every effort to include appropriate place names, the final responsibility lies with the authors.
The authors gratefully acknowledge supercomputing support from the Cheyenne, Derecho, and Casper systems (https://doi.org/10.5065/qx9a-pg09) provided by the NSF NCAR, sponsored by the NSF (Computational and Information Systems Laboratory (CISL), 2022, 2023). Some Cheyenne core hours were provided by the Polar Climate Working Group at the National Center for Atmospheric Research. All authors thank the Polar Climate Working Group for helpful feedback.
Ash Gilbert was funded by the National Science Foundation (NSF) Graduate Research Fellowship (grant no. 2040434), the NSF (grant no. 2233420), and the PREFIRE Mission (NASA grant no. 849K995). Jennifer E. Kay was funded by PREFIRE and the NSF (grant no. 2233420). Penny Rowe was funded by the NSF (grant no. 2127632)
This paper was edited by Nina Crnivec and reviewed by two anonymous referees.
Blanchard-Wrigglesworth, E., Roach, L. A., Donohoe, A., and Ding, Q.: Impact of winds and Southern Ocean SSTs on Antarctic sea ice trends and variability, J. Climate, 34, 949–965, https://doi.org/10.1175/JCLI-D-20-0386.1, 2021. a
Cesana, G., Kay, J. E., Chepfer, H., English, J. M., and de Boer, G.: Ubiquitous low-level liquid-containing Arctic clouds: new observations and climate model constraints from CALIPSO-GOCCP, Geophys. Res. Lett., 39, https://doi.org/10.1029/2012GL053385, 2012. a
Clough, S. A., Shephard, M. W., Mlawer, E. J., Delamere, J. S., Iacono, M. J., Cady-Pereira, K., Boukabara, S., and Brown, P. D.: Atmospheric radiative transfer modeling: a summary of the AER codes, JQSRT, 91, 233–244, https://doi.org/10.1016/j.jqsrt.2004.05.058, 2005. a, b
Computational and Information Systems Laboratory (CISL): Cheyenne: HPE/SGI ICE XA System, https://doi.org/10.5065/D6RX99HX, 2022. a
Computational and Information Systems Laboratory (CISL): Derecho: HPE Cray EX System (University Community Computing), https://doi.org/10.5065/qx9a-pg09, 2023. a
Crameri, F., Shephard, G. E., and Heron, P. J.: The misuse of colour in science communication, Nat. Commun., 11, 5444, https://doi.org/10.1038/s41467-020-19160-7, 2020. a, b, c, d
Danabasoglu, G., Lamarque, J.-F., Bacmeister, J., Bailey, D. A., DuVivier, A. K., Edwards, J., Emmons, L. K., Fasullo, J., Garcia, R., Gettelman, A., Hannay, C., Holland, M. M., Large, W. G., Lauritzen, P. H., Lawrence, D. M., Lenaerts, J. T. M., Lindsay, K., Lipscomb, W. H., Mills, M. J., Neale, R., Oleson, K. W., Otto-Bliesner, B., Phillips, A. S., Sacks, W., Tilmes, S., van Kampenhout, L., Vertenstein, M., Bertini, A., Dennis, J., Deser, C., Fischer, C., Fox-Kemper, B., Kay, J. E., Kinnison, D., Kushner, P. J., Larson, V. E., Long, M. C., Mickelson, S., Moore, J. K., Nienhouse, E., Polvani, L., Rasch, P. J., and Strand, W. G.: The Community Earth System Model Version 2 (CESM2), J. Adv. Model. Earth Sy., 12, e2019MS001916, https://doi.org/10.1029/2019MS001916, 2020. a, b
Downing, H. D. and Williams, D.: Optical constants of water in the infrared, J. Geophys. Res., 80, 1656–1661, https://doi.org/10.1029/JC080i012p01656, 1975. a
DuVivier, A. K., Holland, M. M., Kay, J. E., Tilmes, S., Gettelman, A., and Bailey, D. A.: Arctic and Antarctic sea ice mean state in the Community Earth System Model Version 2 and the influence of atmospheric chemistry, J. Geophys. Res.-Oceans, 125, e2019JC015934, https://doi.org/10.1029/2019JC015934, 2020. a
European Centre for Medium-Range Weather Forecasts: ERA-Interim Project, Research Data Archive at the National Center for Atmospheric Research, Computational and Information Systems Laboratory [data set], https://doi.org/10.5065/D6CR5RD9, 2009. a
Gettelman, A., Truesdale, J. E., Bacmeister, J. T., Caldwell, P. M., Neale, R. B., Bogenschutz, P. A., and Simpson, I. R.: The Single Column Atmosphere Model Version 6 (SCAM6): not a scam but a tool for model evaluation and development, J. Adv. Model. Earth Sy., 11, 1381–1401, https://doi.org/10.1029/2018MS001578, 2019. a, b
Gettelman, A., Bardeen, C. G., McCluskey, C. S., Järvinen, E., Stith, J., Bretherton, C., McFarquhar, G., Twohy, C., D'Alessandro, J., and Wu, W.: Simulating observations of Southern Ocean clouds and implications for climate, J. Geophys. Res.-Atmos., 125, e2020JD032619, https://doi.org/10.1029/2020JD032619, 2020. a, b
Gilbert, A.: A Novel Model Hierarchy Isolates the Limited Effect of Supercooled Liquid Cloud Optics on Infrared Radiation, Zenodo [data set], https://doi.org/10.5281/zenodo.15741756, 2025a. a
Gilbert, A.: GilbertCloud/arctic-cri-scripts: Published version of code and namelists for accepted paper, Zenodo [code], https://doi.org/10.5281/zenodo.16414171, 2025b. a
Gilbert, A.: GilbertCloud/arctic-cri-analysis-plotting: Published version of plotting code for accepted paper, Zenodo [code], https://doi.org/10.5281/zenodo.16415183, 2025c. a
Harrington, J. and Verlinde, J.: Mixed-Phase Arctic Clouds Experiment (M-PACE), Tech. Rep. DOE/SC-ARM-0602, U.S. Dep. Energy, 36 pp., 2005. a
Iacono, M. J., Delamere, J. S., Mlawer, E. J., Shephard, M. W., Clough, S. A., and Collins, W. D.: Radiative forcing by long-lived greenhouse gases: calculations with the AER radiative transfer models, J. Geophys. Res.-Atmos., 113, https://doi.org/10.1029/2008JD009944, 2008. a, b
Kay, J. E., Bourdages, L., Miller, N. B., Morrison, A., Yettella, V., Chepfer, H., and Eaton, B.: Evaluating and improving cloud phase in the Community Atmosphere Model version 5 using spaceborne lidar observations, J. Geophys. Res.-Atmos., 121, 4162–4176, https://doi.org/10.1002/2015JD024699, 2016. a
Kooperman, G. J., Pritchard, M. S., Ghan, S. J., Wang, M., Somerville, R. C. J., and Russell, L. M.: Constraining the influence of natural variability to improve estimates of global aerosol indirect effects in a nudged version of the Community Atmosphere Model 5, J. Geophys. Res.-Atmos., 117, https://doi.org/10.1029/2012JD018588, 2012. a, b, c
Lubin, D. and Vogelmann, A. M.: A climatologically significant aerosol longwave indirect effect in the Arctic, Nature, 439, 453–456, https://doi.org/10.1038/nature04449, 2006. a
Lubin, D., Zhang, D., Silber, I., Scott, R. C., Kalogeras, P., Battaglia, A., Bromwich, D. H., Cadeddu, M., Eloranta, E., Fridlind, A., Frossard, A., Hines, K. M., Kneifel, S., Leaitch, W. R., Lin, W., Nicolas, J., Powers, H., Quinn, P. K., Rowe, P., Russell, L. M., Sharma, S., Verlinde, J., and Vogelmann, A. M.: AWARE: the Atmospheric Radiation Measurement (ARM) West Antarctic radiation experiment, B. Am. Meteorol. Soc., 101, E1069–E1091, https://doi.org/10.1175/BAMS-D-18-0278.1, 2020. a
Maahn, M., Goren, T., Shupe, M. D., and de Boer, G.: Liquid containing clouds at the north slope of Alaska demonstrate sensitivity to local industrial aerosol emissions, Geophys. Res. Lett., 48, e2021GL094307, https://doi.org/10.1029/2021GL094307, 2021. a
McIlhattan, E. A., L'Ecuyer, T. S., and Miller, N. B.: Observational evidence linking Arctic supercooled liquid cloud biases in CESM to snowfall processes, J. Climate, 30, 4477–4495, https://doi.org/10.1175/JCLI-D-16-0666.1, 2017. a
McIlhattan, E. A., Kay, J. E., and L'Ecuyer, T. S.: Arctic clouds and precipitation in the Community Earth System Model Version 2, J. Geophys. Res.-Atmos., 125, e2020JD032521, https://doi.org/10.1029/2020JD032521, 2020. a, b, c, d
Meng, J., Huang, Y., Leung, D. M., Li, L., Adebiyi, A. A., Ryder, C. L., Mahowald, N. M., and Kok, J. F.: Improved parameterization for the size distribution of emitted dust aerosols reduces model underestimation of super coarse dust, Geophys. Res. Lett., 49, e2021GL097287, https://doi.org/10.1029/2021GL097287, 2022. a
Pithan, F., Athanase, M., Dahlke, S., Sánchez-Benítez, A., Shupe, M. D., Sledd, A., Streffing, J., Svensson, G., and Jung, T.: Nudging allows direct evaluation of coupled climate models with in situ observations: a case study from the MOSAiC expedition, Geosci. Model Dev., 16, 1857–1873, https://doi.org/10.5194/gmd-16-1857-2023, 2023. a, b
Roach, L. A. and Blanchard-Wrigglesworth, E.: Observed winds crucial for September Arctic sea ice loss, Geophys. Res. Lett., 49, e2022GL097884, https://doi.org/10.1029/2022GL097884, 2022. a
Rowe, P. M., Neshyba, S., and Walden, V. P.: Radiative consequences of low-temperature infrared refractive indices for supercooled water clouds, Atmos. Chem. Phys., 13, 11925–11933, https://doi.org/10.5194/acp-13-11925-2013, 2013. a, b, c, d, e, f, g, h
Rowe, P. M., Fergoda, M., and Neshyba, S.: Temperature-dependent optical properties of liquid water from 240 to 298 K, J. Geophys. Res.-Atmos., 125, e2020JD032624, https://doi.org/10.1029/2020JD032624, 2020. a, b, c, d, e
Rowe, P. M., Walden, V. P., Brandt, R. E., Town, M. S., Hudson, S. R., and Neshyba, S.: Evaluation of temperature-dependent complex refractive indices of supercooled liquid water using downwelling radiance and in-situ cloud measurements at South Pole, J. Geophys. Res.-Atmos., 127, e2021JD035182, https://doi.org/10.1029/2021JD035182, 2022. a, b
Sherwood, S. C., Webb, M. J., Annan, J. D., Armour, K. C., Forster, P. M., Hargreaves, J. C., Hegerl, G., Klein, S. A., Marvel, K. D., Rohling, E. J., Watanabe, M., Andrews, T., Braconnot, P., Bretherton, C. S., Foster, G. L., Hausfather, Z., von der Heydt, A. S., Knutti, R., Mauritsen, T., Norris, J. R., Proistosescu, C., Rugenstein, M., Schmidt, G. A., Tokarska, K. B., and Zelinka, M. D.: An assessment of Earth's climate sensitivity using multiple lines of evidence, Rev. Geophys., 58, e2019RG000678, https://doi.org/10.1029/2019RG000678, 2020. a
Webb, M. J., Andrews, T., Bodas-Salcedo, A., Bony, S., Bretherton, C. S., Chadwick, R., Chepfer, H., Douville, H., Good, P., Kay, J. E., Klein, S. A., Marchand, R., Medeiros, B., Siebesma, A. P., Skinner, C. B., Stevens, B., Tselioudis, G., Tsushima, Y., and Watanabe, M.: The Cloud Feedback Model Intercomparison Project (CFMIP) contribution to CMIP6, Geosci. Model Dev., 10, 359–384, https://doi.org/10.5194/gmd-10-359-2017, 2017. a
Wilks, D. S.: “The stippling shows statistically significant grid points”: how research results are routinely overstated and overinterpreted, and what to do about It, B. Am. Meteorol. Soc., 97, 2263–2273, https://doi.org/10.1175/BAMS-D-15-00267.1, 2016. a, b, c, d
Wiscombe, W. J.: Mie Scattering Calculations: Advances in Technique and Fast, Vector-speed Computer Codes, Tech. Rep. NCAR/TN-140+STR, UCAR, https://doi.org/10.5065/D6ZP4414, 98 pp., 1979. a