the Creative Commons Attribution 4.0 License.
the Creative Commons Attribution 4.0 License.
 | 07 Feb 2025
WRF-Chem simulations of snow nitrate and other physicochemical properties in northern China
Xueyin Ruan
Shanna Yue
Jing Wang
Chun Zhao
Snow is a key component of the cryosphere and has significant impacts on surface energy balance, hydrology, atmospheric circulation, etc. In addition, numerous studies have indicated that snow impurities, especially nitrate, are sensitive to sunlight and can be photolyzed to emit reactive species including NO2 and HONO, which serve as precursors of O3 and radicals and disturb the overlying atmospheric chemistry. This makes snow a reservoir of reactive species, and this reservoir is particularly important in remote and pristine regions with limited anthropogenic emissions. The magnitude of snow chemical emissions is also influenced by snow physical properties, including snow depth, density, and concentrations of light-absorbing impurities (e.g., black carbon (BC) and dust). Exploring and elucidating the emissions and atmospheric consequences of the snow-sourced reactive species require a global or regional model with a snow module. Here, we parameterized atmospheric nitrate deposition and its distributions in snow using a regional chemical transport model, i.e., WRF-Chem (Weather Research and Forecasting Model coupled with Chemistry), and evaluated the performance of WRF-Chem in simulating snow cover; snow depth; and BC, dust, and nitrate concentrations with field observations in northern China, which is one of the regions with a dense and prolonged snow cover. In general, the model-simulated spatial variability in nitrate mass concentrations in the top snow layer (hereafter NITS) is consistent with observations. Simulated NITS values in northeast China from December 2017 to March 2018 had a maximum range of 7.11–16.58 µg g−1, minimum range of 0.06–0.21 µg g−1, and 4-month average of 2.72 ± 1.34 µg g−1. In comparison, observed values showed a maximum range of 9.35–33.43 µg g−1, minimum range of 0.09–0.51 µg g−1, and average of 3.74 ± 5.42 µg g−1. The model results show an underestimation especially in regions closes to large cities in northeastern China, most likely due to the underestimation of NOx emissions in these regions. Additionally, nitrate deposition, snowpack accumulation processes, and challenges in capturing fine-scale emission variability may also contribute to the bias. These results illustrate the ability of WRF-Chem to simulate snow properties including concentrations of reservoir species in northern China, and in the future, we will incorporate snow nitrate photolysis in the model, exploring the emissions of snow NOx from nitrate photolysis and the impacts on local and regional atmospheric chemistry and air pollutant transformations.
- Article
(7976 KB) - Full-text XML
-
Supplement
(1003 KB) - BibTeX
- EndNote


Through the effects on surface albedo and energy balance, snow cover has an important impact on Earth's climate system (Flanner et al., 2011). In particular, the snow's depth, grain size, and impurities can affect its albedo, which in turn significantly influences surface warming as a result of the swift feedback on snow structure, snow sublimation rates, and snow melt rates (He et al., 2018; Picard et al., 2012). What is more, snow is also significant in atmospheric chemistry. Under appropriate conditions (e.g., illuminated by sunlight), photolysis of snow impurities can lead to the release of reactive species, including nitrogen oxides (NO + NO2 = NOx) and reactive halogens, to the overlying atmosphere, disturbing atmospheric chemistry (Dominé and Shepson, 2002; Grannas et al., 2007; Zatko et al., 2016a). Improving the understanding of the spatiotemporal variations in snow physical and chemical properties is thus important for assessing the effects of snow cover on climate and the atmospheric environment.
As one of the major chemicals in snow, nitrate is perhaps one of the most important reactive species. In particular, snow nitrate is active under sunlight, and its photolysis results in emissions of NOx and also HONO into the boundary atmosphere (Chu and Anastasio, 2003; Zatko et al., 2013; Chen et al., 2019; Barbero et al., 2021). In pristine regions with snow cover, long-range-transported atmospheric nitrate deposited and preserved in snow could serve as a potentially important secondary source of NOx, which is important for the local production of O3 and OH radicals (Bouwman, 1998; Hall and Matson, 1999; Li et al., 2015; Logan, 1983; Nelson et al., 2023). The latter are important for atmospheric reactivity or, more specifically, the so-called atmospheric oxidation capacity. Previous studies have investigated the photolysis of snow nitrate in polar regions. For example, when considering the emissions of NOx from snow nitrate photolysis, there is a potential doubling of O3 levels and significant increases of 5 to 6 times in the level of OH in the overlying atmosphere in Greenland and Antarctica (Zatko et al., 2016a). In addition to polar regions, Zatko et al. (2016b) investigated the effects of snowpack emissions on local atmospheric chemistry in a North American site located at midlatitudes but with extensive snowfall in winter. They also found significant emissions of NOx from snow, although the contribution to the local NOx budget was relatively small given that extensive anthropogenic emissions persist at the studied site, originating from traffic related to oil and natural gas extraction activities. At another midlatitude site, Kalamazoo, Michigan, Chen et al. (2019) observed up to 44 % higher HONO levels in a snowy urban environment than in other regions without snow. The high HONO concentration is in part due to snow nitrate photolysis, and the subsequent photolysis of HONO produces OH, which serves as another important OH source in addition to the common O3 photolysis channel.
Northern China is renowned as one of the regions with the densest winter snow cover, boasting a broad extent of snow coverage that can reach 85 % (Zou et al., 2022). Moreover, the duration of snow cover is notably extensive, with certain frigid areas experiencing snow coverage for as long as 120–140 d yr−1 (Wang and Chen, 2022). Compared to those in polar regions, the snow in this region has higher nitrate concentrations, i.e., 0.1–30 µg g−1, ∼ 3 orders of magnitude higher than those in polar regions (0.1–200 ng g−1) (An et al., 2022; Legrand and Mayewski, 1997; Wendl et al., 2015; Zhang et al., 2013; Jiang et al., 2021) and can receive more actinic fluxes. These conditions may facilitate snow nitrate photolysis, making it a potentially important source of NOx and HONO, which are limited from other sources in winter due to low human and bacterial activities in snow-covered regions. In addition, the prevailing northern wind in winter would transport snow-sourced NOx and/or the subsequent enhanced atmospheric O3 and other species to downwind regions, including the North China Plain (NCP), where severe haze and O3 pollution occur frequently in winter. However, whether snow emission can influence atmospheric chemistry and air quality in downwind regions remains to be investigated further.
Moreover, quantifying the snow emissions of reactive species and the impacts on the overlying atmosphere as well as downwind regions requires an atmospheric chemical transport model with snow modules that can simulate snow physical and chemical properties, including snow cover, snow depth, and snow impurities (e.g., black carbon (BC), dust, and nitrate concentrations), and also be able to calculate the radiative transfer of actinic flux in snow, the associated snow photochemistry, and the emissions of reactive species into the overlying atmosphere. Zatko et al. (2016a) have added a NO photolysis parameterization to a global chemical transport model, which is the Goddard Earth Observing System (GEOS) Chemistry (GEOS-Chem) model. However, as an offline model, GEOS-Chem uses archived meteorological fields, which generally have coarse resolutions, and errors can be caused by regional or smaller-scale simulations (Yu et al., 2018); moreover, GEOS-Chem cannot simulate meteorological–chemical interactions, which may be important for modeling or forecasting snow cover changes and their impacts on local and regional climate and atmospheric chemistry. Therefore, we plan to utilize WRF-Chem (Weather Research and Forecasting Model coupled with Chemistry), which is an advanced, online regional chemistry model with a relatively well-developed snow module. However, before doing that, we have to first incorporate snow nitrate simulations into the model, which is currently not included in the snow module, and evaluate the ability of WRF-Chem in simulations of snow physicochemical properties in northern China. Therefore, this study serves as an evaluation of the performance of WRF-Chem simulations of snow coverage and snow physicochemical properties in northern China, with a development in the modeling of snow nitrate concentrations. This is the first step in using the model to investigate the effects of snow cover on local and regional atmospheric chemistry.
2.1 WRF-Chem
We use the version (v3.5.1) of WRF-Chem updated by the University of Science and Technology (USTC) of China in this study. Unlike the version distributed by NCAR to the public, the USTC version includes supplemental functionality, such as the online diagnosis of aerosol-specific radiative forcing and the aerosol–snow albedo effect (Zhao et al., 2014; Zhao et al., 2013a; Du et al., 2020). The aerosol scheme employed is the Model for Simulating Aerosol Interactions and Chemistry (MOSAIC – eight bins) (Zaveri et al., 2008), and the gas-phase chemistry mechanism is the Carbon Bond Mechanism Z (CBM-Z) (Zaveri and Peters, 1999), both of which are used in this iteration of WRF-Chem. The MOSAIC scheme represents aerosol size distributions using eight discrete bins, with each bin covering a specific range of dry aerosol diameters: 0.039–0.078, 0.078–0.156, 0.156–0.312, 0.312–0.625, 0.625–1.25, 1.25–2.5, 2.5–5.0, and 5.0–10.0 µm. The model considers main aerosol components including nitrate (NO), sulfate (SO), chloride (Cl−), ammonium (NH), BC, dust, and sea salt, as well as mineral dust. We note the MOSAIC aerosol scheme used in this study does not include secondary organic aerosols (SOAs), which may affect the production and phase partition of particulate nitrate. When simulating the generation and growth of aerosols, the MOSAIC mechanism takes into account a variety of chemical and physical processes, including but not limited to gas-to-particle conversion, particle nucleation, coagulation, condensation, and evaporation. Additionally, the model considers important processes of aerosol deposition, including both dry and wet deposition processes. These processes are critical for comprehending the behavior and fate of aerosols, including their incorporation in snow. In the model, particle diffusion and gravitational effects are considered to simulate the dry deposition of aerosol (Binkowski and Shankar, 1995). Wet deposition, including rainout, washout, and scavenging processes, is also simulated in the model to accurately represent the removal of aerosols through precipitation following the methodologies outlined by Easter et al. (2004) and Chapman et al. (2009). This research does not explicitly model cloud-ice-borne aerosols. However, it does consider the elimination of aerosols as they undergo freezing within droplets. The removal of aerosols by convection transport and their wet deposition via cumulus clouds are modeled according to the methods described by Zhao et al. (2013b). This study utilizes the Community Land Model (CLM) v4.0 (Lawrence et al., 2011) coupled with the Snow, Ice, and Aerosol Radiative (SNICAR) model (Flanner and Zender, 2005) as an option for the land surface model (Jin and Wen, 2012).
2.2 Snow simulations in WRF-Chem
Snow accumulations on the land surface as well as the physicochemical properties are calculated using the SNICAR model in WRF-Chem. This mode incorporates a layered structure, considering the vertical variability in snow properties and accounting for the heating effects of the underlying ground and its influence on snow characteristics (Flanner et al., 2012; Flanner and Zender, 2005; Flanner et al., 2009, 2007). The theoretical framework of Wiscombe and Warren (1980) and the two-stream, multi-layer radiative scheme proposed by Toon et al. (1989) are employed within SNICAR. It has excellent performance in simulating snow surface albedo, radiative absorption within snow layers, snow impurities, and radiative effects within snow. It was initially utilized by Flanner et al. (2007) to investigate snow aging and aerosol heating in a global climate model. The simulated changes in snow albedo based on specific black carbon (BC) concentrations have been validated through field measurements and laboratory experiments (Brandt et al., 2011; Hadley and Kirchstetter, 2012). In CLM, there are five thermal layers that correspond to the radiative layers defined by SNICAR, enabling the vertical resolution of densification, snow meltwater transport, and thermal processes (Oleson et al., 2010a). For a more comprehensive understanding of the SNICAR model, refer to Flanner and Zender (2005) and Flanner et al. (2012, 2007).
To simulate snow nitrate photolysis and its impacts on overlying atmospheric chemistry, one needs to obtain snow cover, snow depth, and snow physical and chemical properties (including snow density, impurities including BC and dust, and nitrate). Physical properties are used to simulate radiative transfer in snow. While nitrate and other impurities in snow also influence radiative transfer snow, it is especially nitrate in snow that is the source of snow-sourced NOx. Currently, all other components (e.g., BC, dust) but not nitrate have been included in SNICAR and parameterized by Zhao et al. (2014). In this study, we parameterized and included snow nitrate concentration in simulations.
2.2.1 Parameterization of nitrate concentrations in snow
Currently, SNICAR does not include calculations of nitrate concentrations embedded in snow. In principle, concentrations of nitrate within each snow layer are mainly influenced by atmospheric deposition flux and snow accumulations. After deposition, layer combinations and divisions and, in a rare case, meltwater flushing may also take effect. To quantify nitrates in snow, in this study, we parameterized nitrate concentrations in snow by considering the deposition processes of nitrate, including both dry and wet deposition processes. Dry deposition processes (sedimentation and turbulent mix-out) directly contribute to the accumulation of particulate and gaseous nitrate in surface snow. For gaseous nitrate (HNO3), the dry deposition flux (kg m−2 s−1) is calculated using the following equation:
where is the dry deposition velocity of gaseous nitrate (m s−1), is the concentration of gaseous nitrate in the first (i.e., surface) layer of the atmosphere (ppmv), and Dair is the air density in the surface layer (kg m−3). For particulate nitrate, the dry deposition flux is calculated for each aerosol size bin as follows:
where Vno3a_i is the dry deposition velocity of particulate nitrate in each size bin (m s−1), Cno3a_i is the concentration of particulate nitrate in each size bin (µg per kilogram dry air), and Dair is the air density in the surface layer (kg m−3).
For wet deposition, it includes both in-cloud and below-cloud scavenging of gaseous nitrate and particulate nitrate including cloud-borne nitrate. In-cloud scavenging refers to the incorporation of aerosols and gases into cloud droplets as they form within clouds. Below-cloud scavenging (washout) refers to the removal of particulate and gaseous nitrate by falling hydrometeors as they descend below the cloud, where nitrate compounds are captured through mechanisms like Brownian motion, electrostatic forces, collision, and impaction, ultimately leading to their deposition on the snow surface. In this study, we estimate the amount of nitrate wet deposition by calculating the concentration changes in atmospheric total nitrate during in-cloud and below-cloud scavenging processes. For in-cloud scavenging, the concentration of cloud-borne nitrate and gaseous nitrate removed is based on the following equation:
where Cno3-cw is the concentration of cloud-borne nitrate aerosols in cloud, is the concentration of gaseous HNO3 in cloud, and Scalein,cw and Scalein,gas represent the scaling factors for in-cloud scavenging that indicate the amount of nitrate removed in cloud.
For below-cloud scavenging, the removal of nitrate aerosols and gases is represented as
where Cno3a,i is the concentration of nitrate aerosols below the cloud in layer i, and Scale and Scale represent the factors for below-cloud scavenging that indicate the amount of nitrate removed by impaction and interception in each atmospheric layer. In this study, the calculations of the scavenging scales for both in-cloud and below-cloud wet removal of nitrate aerosols and gases are based on the methodologies of Easter et al. (2004) and Chapman et al. (2009).
The total nitrate concentration used for wet deposition calculations is the sum of the concentrations removed during scavenging.
The wet deposition flux (kg m−2 s−1) is then calculated using the following equation:
where Dair,i is the air density in each atmospheric layer, Hair,i is the thickness of the atmospheric layers (m), and dt is the model time step (s). The variable n represents the number of atmospheric layers below the cloud.
After deposition, nitrate is mixed instantly and uniformly in the model surface layer, which never exceeds 3 cm thickness. The nitrate mass concentration in surface snow (MNITS: kg kg−1) was calculated by deposition fluxes of atmospheric nitrate as follows:
where dtime is the land model time step used in SNICAR (s), as distinct from the dt mentioned above used in atmospheric processes, and Wsno is the snow mass in the surface layer (kg m−2). Furthermore, the CLM continuously builds a new surface snow layer when a fresh snowfall event occurs, and nitrate mass concentrations in surface snow are updated as follows:
where ΔF is the cumulative wet and dry deposition of atmospheric nitrate during the entire period between the newly fallen snow and the previous time step, ΔWsno is the newly gained snow mass during the entire period between the newly fallen snow and the previous time step, and Δt is the period spanning the newly fallen snow to the previous time step.
By repeating the above-mentioned processes, a snowpack with initial nitrate concentrations in each layer of the snowpack was simulated.
2.2.2 Potential modification by melting processing after deposition
Previous studies have shown that at midlatitudes, snowmelt occurs occasionally, which will modify the concentrations of impurities (Zhao et al., 2014; Flanner et al., 2007; Eichler et al., 2001). Following similar processes, we considered the potential effects of these processes on snow nitrate concentrations. In particular, the melting of snow can redistribute nitrate (and other species) through the introduction of excess water into the layer beneath when the meltwater surpasses the layer's retention capacity, which is determined by irreducible water saturation and snow porosity. The rate of change in nitrate mass for each layer i, due to its incorporation into meltwater, is directly proportional to the mass mixing ratio with the adjustment of a scavenging factor, which can be described as follows:
where mi represents the total mass of nitrate within layer i, which is affected by the removal efficiency (k) and the water flux leaving the layer (qi). The concentration of nitrate in layer i, denoted as ci, is the proportion of the nitrate mass to the total mass of water in both liquid and solid forms within that layer. The term represents the mass flux of water leaving the layer above (i+1) multiplied by the concentration of nitrate in that layer, accounting for the transfer of nitrate from the upper layer to the current layer. D represents the combined effect of total atmospheric particulate and gaseous nitrate deposition, which is specifically added to the surface layer of the snowpack. In this study, following Flanner et al. (2012) and Zhao et al. (2014), the scavenging ratio (k) for nitrate is assumed to be 0.2. This value is highly uncertain for nitrate and needs to be constrained by future observations (Flanner et al., 2012; Qian et al., 2014; Zhao et al., 2014). However, for this process to be effectively impactful, significant melting would need to occur. During our simulation period, temperatures in northern China were consistently low, primarily below 0 °C, and significant melting did not take place. Therefore, we believe the impact of this assumption is minimal in this context. It is worth noting that the portion of nitrate mass lost through meltwater from the bottom layer of snow is considered to be removed from the snowpack and is not accounted for within the model.
In summary, the nitrate concentrations in each snow layer are determined by factors such as atmospheric deposition rates, the amount of new snowfall, layer combinations and divisions, and meltwater flushing (Oleson et al., 2010b; Flanner et al., 2012; Flanner et al., 2007). When snow layers are combined or divided, nitrate masses are redistributed proportionately, with snow masses conserving nitrate masses within the snow column.
2.3 Numerical experiments
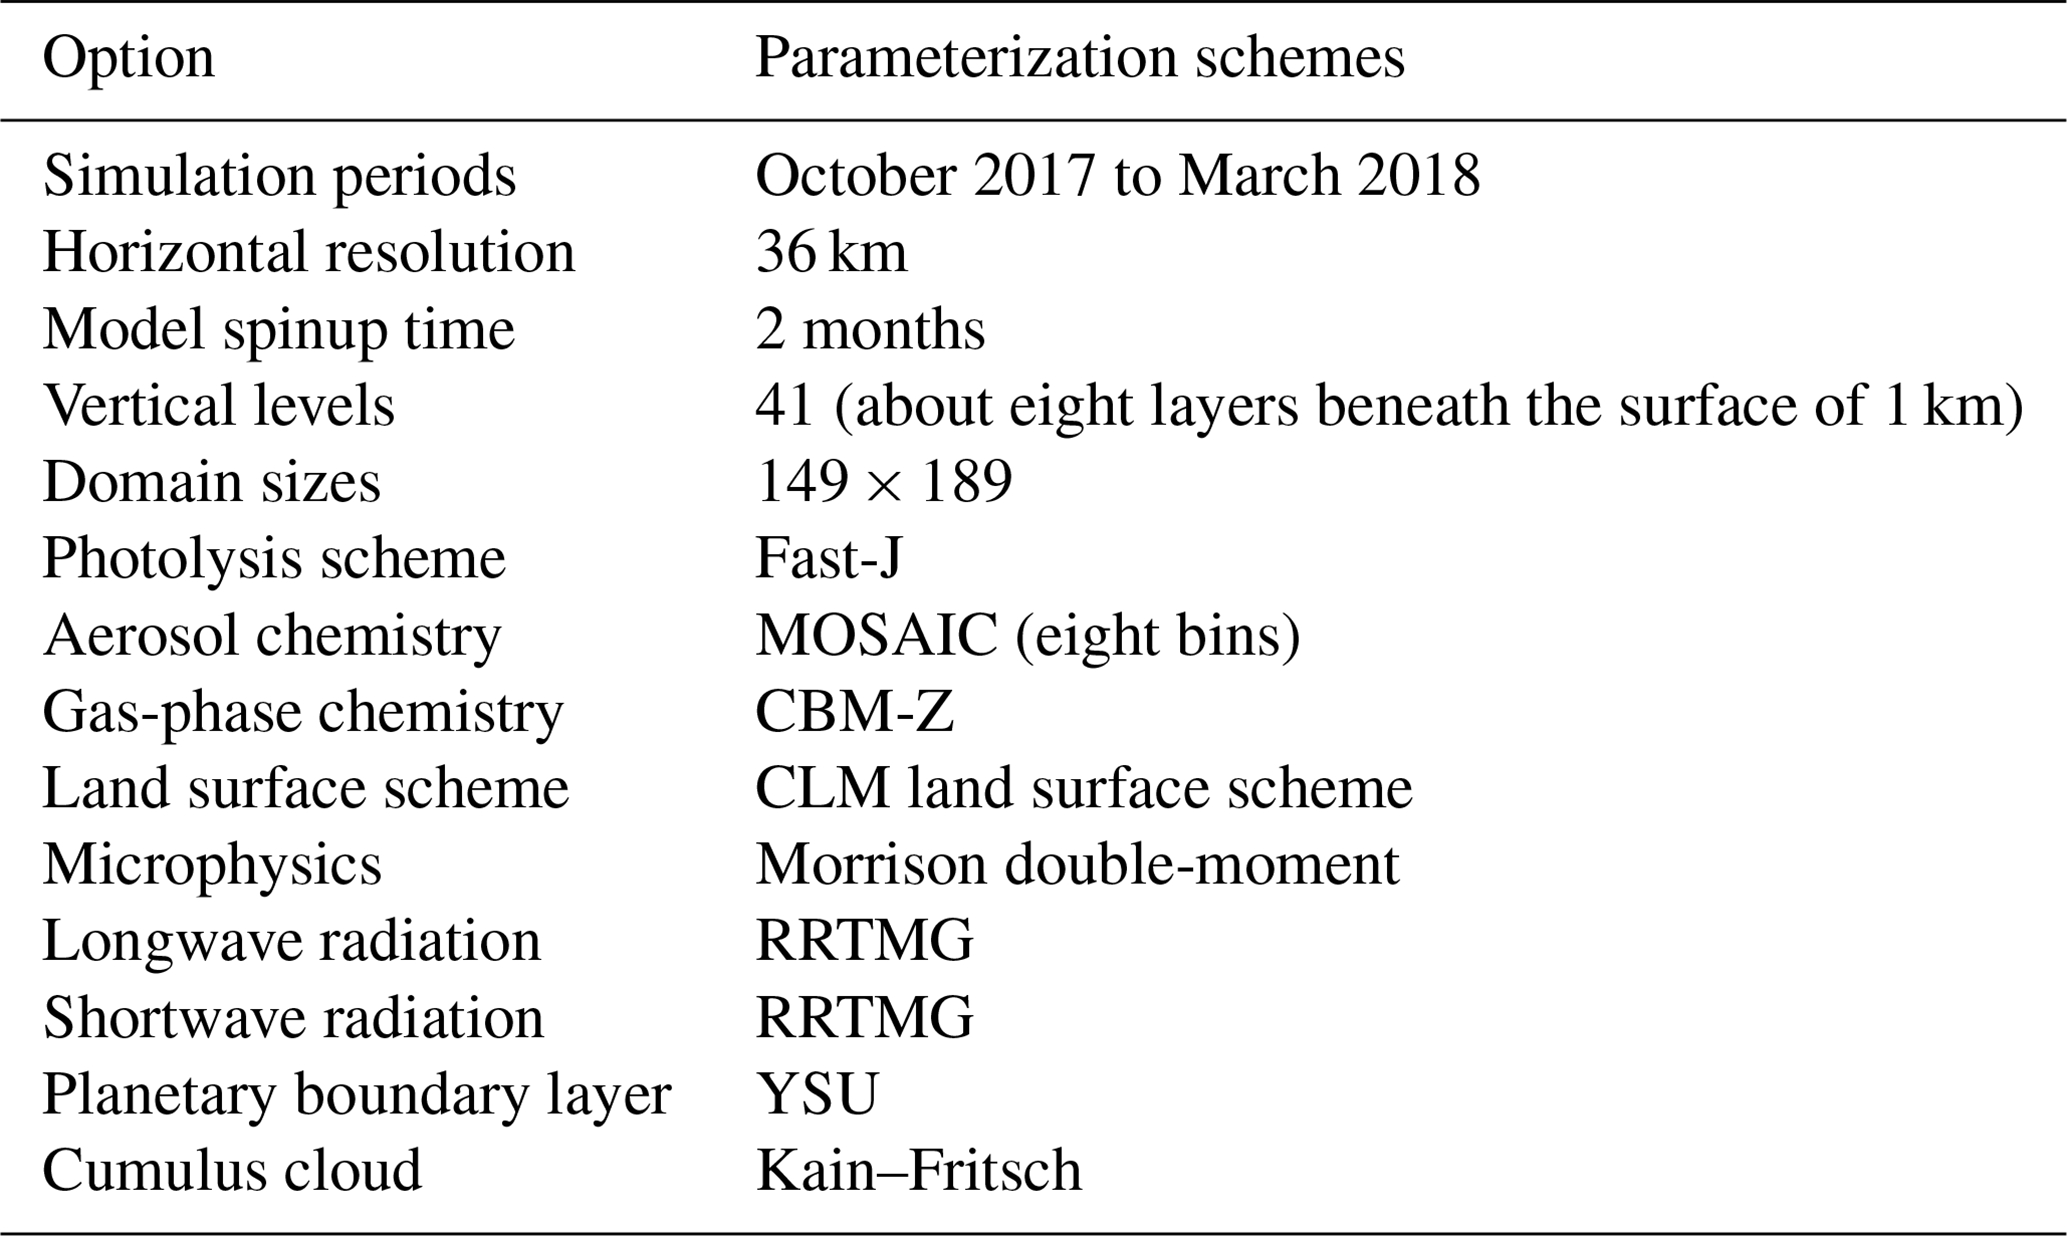
The study employed simulations covering the entire area of China, utilizing a spatial resolution of 36 km × 36 km with a grid composed of 149 × 189 cells, as depicted in Fig. S1 in the Supplement. The simulations run from December 2017 to March 2018 covering the field campaign period, with an additional 2 months modeled before December 2017 as the model spinup. The starting and side boundary conditions for meteorology are drawn from the NCEP Final reanalysis dataset, which provides data at a resolution of 1° horizontally and at 6 h intervals. The specific model setup employed in this research is outlined in Table 1, including the Yonsei University (YSU) planetary boundary layer scheme, the Kain–Fritsch cumulus parameterization scheme, the Morrison two-moment microphysics scheme, the Rapid Radiative Transfer Model (RRTMG) for both longwave and shortwave radiation, and the Community Land Model (CLM) for land surface processes. The YSU scheme was chosen to parameterize the planetary boundary layer processes, while the Kain–Fritsch scheme addresses the representation of convective clouds. The Morrison scheme handles microphysical processes, capturing the characteristics of cloud and precipitation formation. The RRTMG schemes accurately modeled longwave and shortwave radiation interactions. Finally, the CLM scheme accounted for land surface interactions. By integrating these schemes, this study aimed to provide comprehensive simulations and insights into the atmospheric and snow processes and interactions involved during the selected period.
For the purpose of modeling anthropogenic emissions, we utilize the 2015 version of the Multi-resolution Emission Inventory for China (MEIC), which offers a fine resolution of 0.1° × 0.1° (Li et al., 2017a, b). To determine the vertical distribution of dust, we apply the GOCART dust emission scheme developed by Ginoux et al. (2001). Subsequently, the generated dust particles are assigned to numerous size categories within the MOSAIC aerosol scheme, adhering to the scale-invariant fragmentation mechanics for brittle materials as described by Kok (2011). Additional information regarding the integration of the dust emission scheme with the MOSAIC aerosol scheme in WRF-Chem is available in Zhao et al. (2010). Hourly resolved biomass burning emissions, with a 1 km horizontal resolution, are obtained from the Fire Inventory from NCAR (FINN) (Wiedinmyer et al., 2011). Biogenic emissions were calculated using the Model of Emissions of Gases and Aerosols from Nature (MEGAN) v2.0.
2.4 Observations
2.4.1 Datasets of snow and its physicochemical properties
The main dataset for observing and assessing the simulations of snow and its physicochemical properties was obtained from the field study conducted by Che et al. (2022) from December 2017 to March 2018, when snow was collected from more than 200 road trips in both the northeast and northwest regions of China. The observational route in Fig. 1 covers three distinct regions with different climatic zones, underlying surfaces, and elevations. Extensive field observations were conducted to study snow cover characteristics along this route. The sampling points are labeled in Fig. 1 and categorized by region and month. At each site, snow samples were collected. A total of 269 snow samples were collected, and the concentrations of nitrate and calcium and the snow depth were measured.
For further information regarding the measurements conducted during the northern China campaign, additional details are available in Che (2020). During the campaign, snow samples were collected at various depths, yet the concentration of ions was chiefly calculated for the top layer of the snow. Hence, we compare the simulated ion mass content within the uppermost 2 cm of the surface snow layer against the average observational data derived from snow samples collected at depths ranging from 2 to 5 cm.
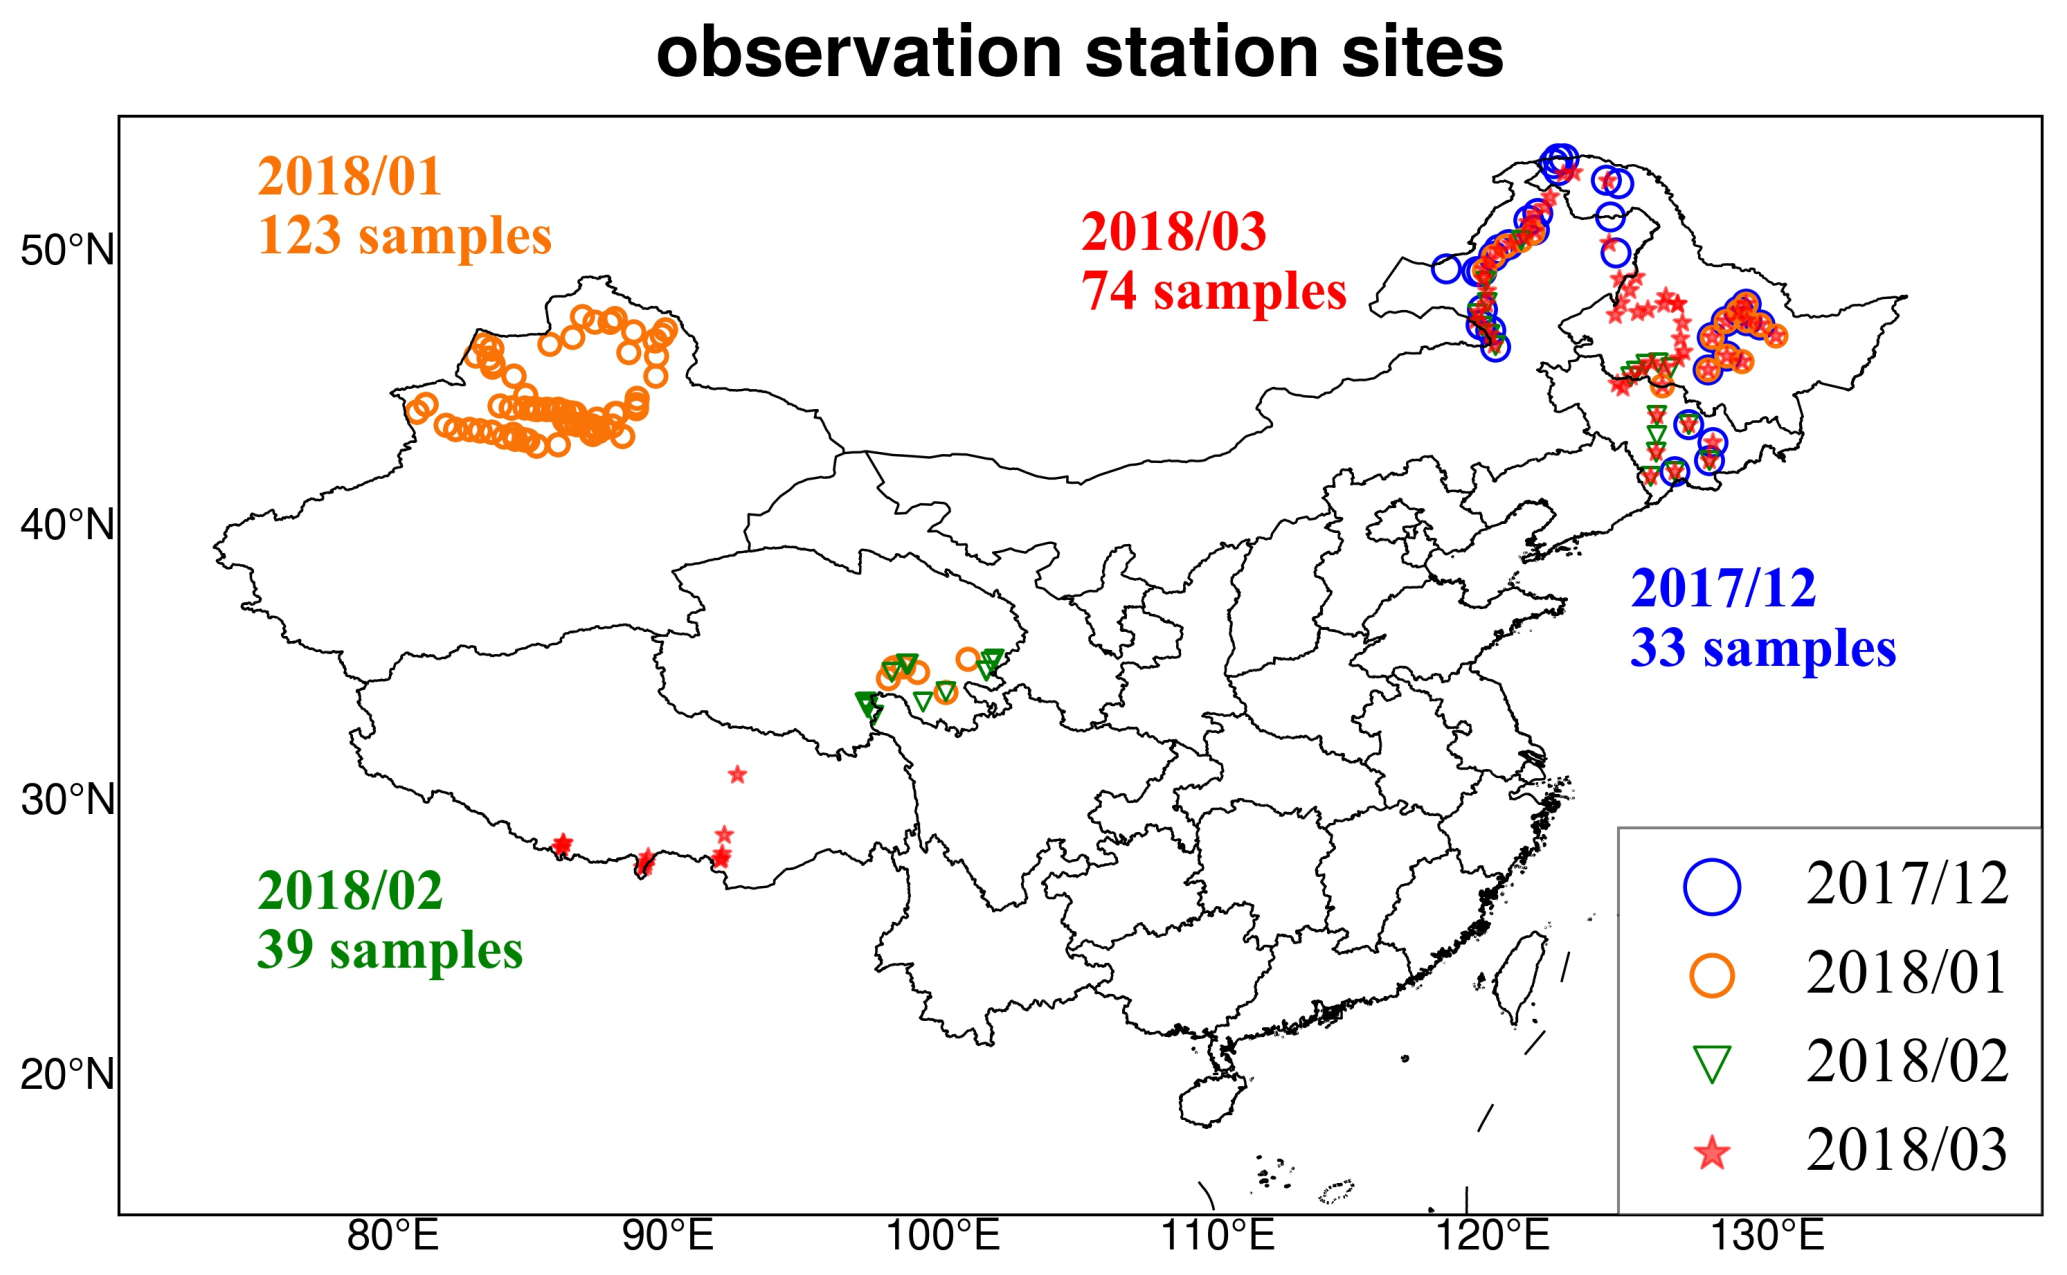
Figure 1Sampling points along the road trip from December 2017 to March 2018 are marked with different colors to represent different months.
2.4.2 MODIS-based snow area product dataset
In addition to field observations of snow impurities and depth, we also collected snow cover data for comparison with the model simulations. For this study, we utilized the daily cloud-free 500 m snow cover dataset over China, compiled by Hao et al. (2022). This dataset is provided as a long-term time series resource, offering fine spatial detail at 500 m × 500 m. More information is available at the home page of the National Cryosphere Desert Data Center of China (http://www.ncdc.ac.cn, last access: 4 May 2024).
2.4.3 Meteorological and air quality data
To evaluate the model's performance concerning surface temperature and rainfall, which are important for snow simulation, we obtained meteorological data on temperature and precipitation from the National Climatic Data Center (NCDC) (https://www.ncdc.noaa.gov/, last access: 4 October 2024). The NCDC has more than 400 ground stations in China, and data have been collected since 1942.
3.1 Meteorological simulations
Two key factors affecting the snow simulation are surface temperature and snow precipitation. Since there are no publicly available observation data for surface snow precipitation, only temperature was compared with observations for model evaluation. Figure 2 displays the 2 m temperature patterns across China simulated by WRF-Chem and observed, with the left panel showing the spatial distribution of temperature and the right panel illustrating the scatter plot comparison between simulation and observation. The background color in the left panel represents the average simulated values from December 2017 to March 2018, while the right panel shows the daily averages from the simulation corresponding to the observation dates at each station. The scatter plot also distinguishes between regions, with orange dots representing northern China and blue dots representing southern China. Daily 2 m temperature data from December 2017 to March 2018 at 415 sites in China were sourced from the National Oceanic and Atmospheric Administration (NOAA). Based on the graph, it is evident that the model accurately depicts the spatial patterns and fluctuations in the 2 m temperature, aligning well with the observed data. Furthermore, the simulation accurately represents the notable decrease in the 2 m temperature as latitude increases, ranging from near freezing levels to approximately −30 °C. From the scatter plot on the right, it can be observed that the model generally performs well in simulating the 2 m temperature, closely aligning with the observed data. However, there is a slight underestimation of temperature for southern China and a slight overestimation for northern China. Such systematic biases have also been reported in other studies (Gao, 2020; Gao et al., 2022; Kong et al., 2019; Yu et al., 2011). These discrepancies may be attributed to the complexity of regional climate factors, such as varying land surface characteristics, boundary layer processes, and the challenges of accurately simulating localized weather phenomena like cold fronts or temperature inversions in certain regions. Furthermore, differences in the representation of terrain and vegetation between the model and reality could contribute to these systematic errors, particularly in regions with complex topography (Gutowski et al., 2020).
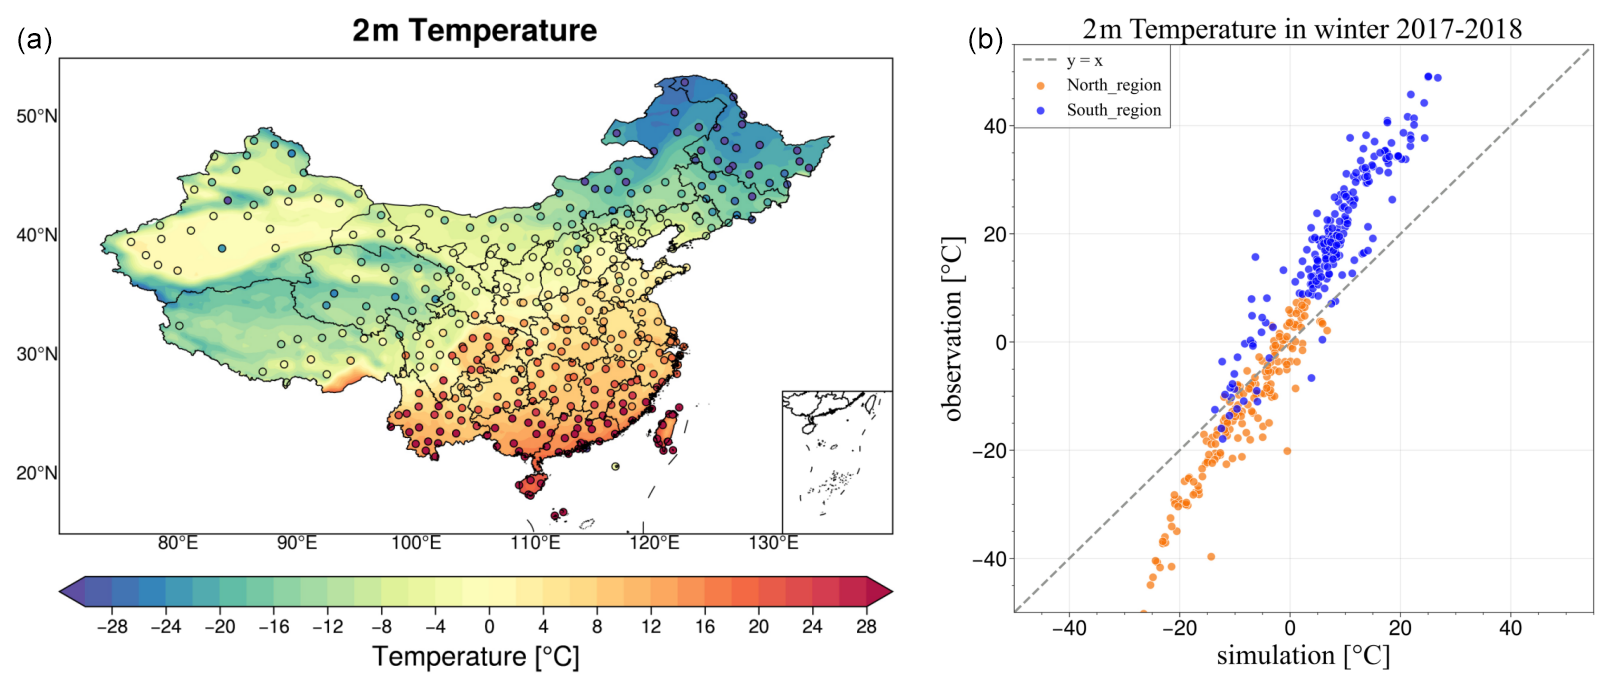
Figure 2Spatial distribution of 2 m temperature observed and simulated by WRF-Chem over China averaged from December 2017 to March 2018. (a) The background color represents the average simulated value. (b) Simulated values are the daily averages corresponding to the observation dates at each station.
3.2 Snowpack simulations
3.2.1 Spatial distributions of snow cover
Before analyzing the patterns of light-absorbing impurities in snow, it is crucial to assess the simulated snow cover produced by WRF-Chem. Figure 3 shows the spatial patterns of snow cover (the percentage of land area with snow at each grid cell) from the WRF-Chem simulation (first column), MODIS-based observational data (second column), and the difference between the two (third column) from December 2017 to March 2018, providing the average results for each month. The MODIS data have been averaged to the 36 km WRF grid for a fairer comparison. The third column shows the difference map, calculated as the WRF-Chem simulation minus the MODIS observations, highlighting areas where the model either overestimates or underestimates snow cover. Here, snow cover is defined as the snow fraction [0–1], which represents the percentage of land area with snow at each grid point. Both simulations and observations indicate that snow cover is concentrated primarily in China's northeastern, northwestern, and Qinghai–Tibetan Plateau regions. The distribution of snow cover generally follows the temperature pattern. Areas with lower temperatures tend to have greater snow cover. The highest snow cover percentage, up to 90 %, is observed in the northeastern region. Both the observations and simulations reveal snow accumulations in central China in January 2018. The difference between the simulation and MODIS data in the third column reveals systematic biases. In particular, WRF-Chem tends to overestimate snow cover in parts of northern China, especially in regions with complex terrain or higher altitudes. This overestimation could be attributed to the model's potential oversensitivity to cold temperatures or its overestimation of snowfall in these colder regions. Complex terrain can also challenge the model's ability to accurately simulate microclimatic conditions, leading to discrepancies in snow cover estimates. Conversely, in southern and central China, the model underestimates snow cover, likely due to limitations in how WRF-Chem handles snow accumulation and melting in warmer areas. Overall, the model appears to reasonably capture the stable snow cover in most of the regions of interest, though some discrepancies remain related to small-scale surface features caused by terrain, with most biases staying within 30 %.
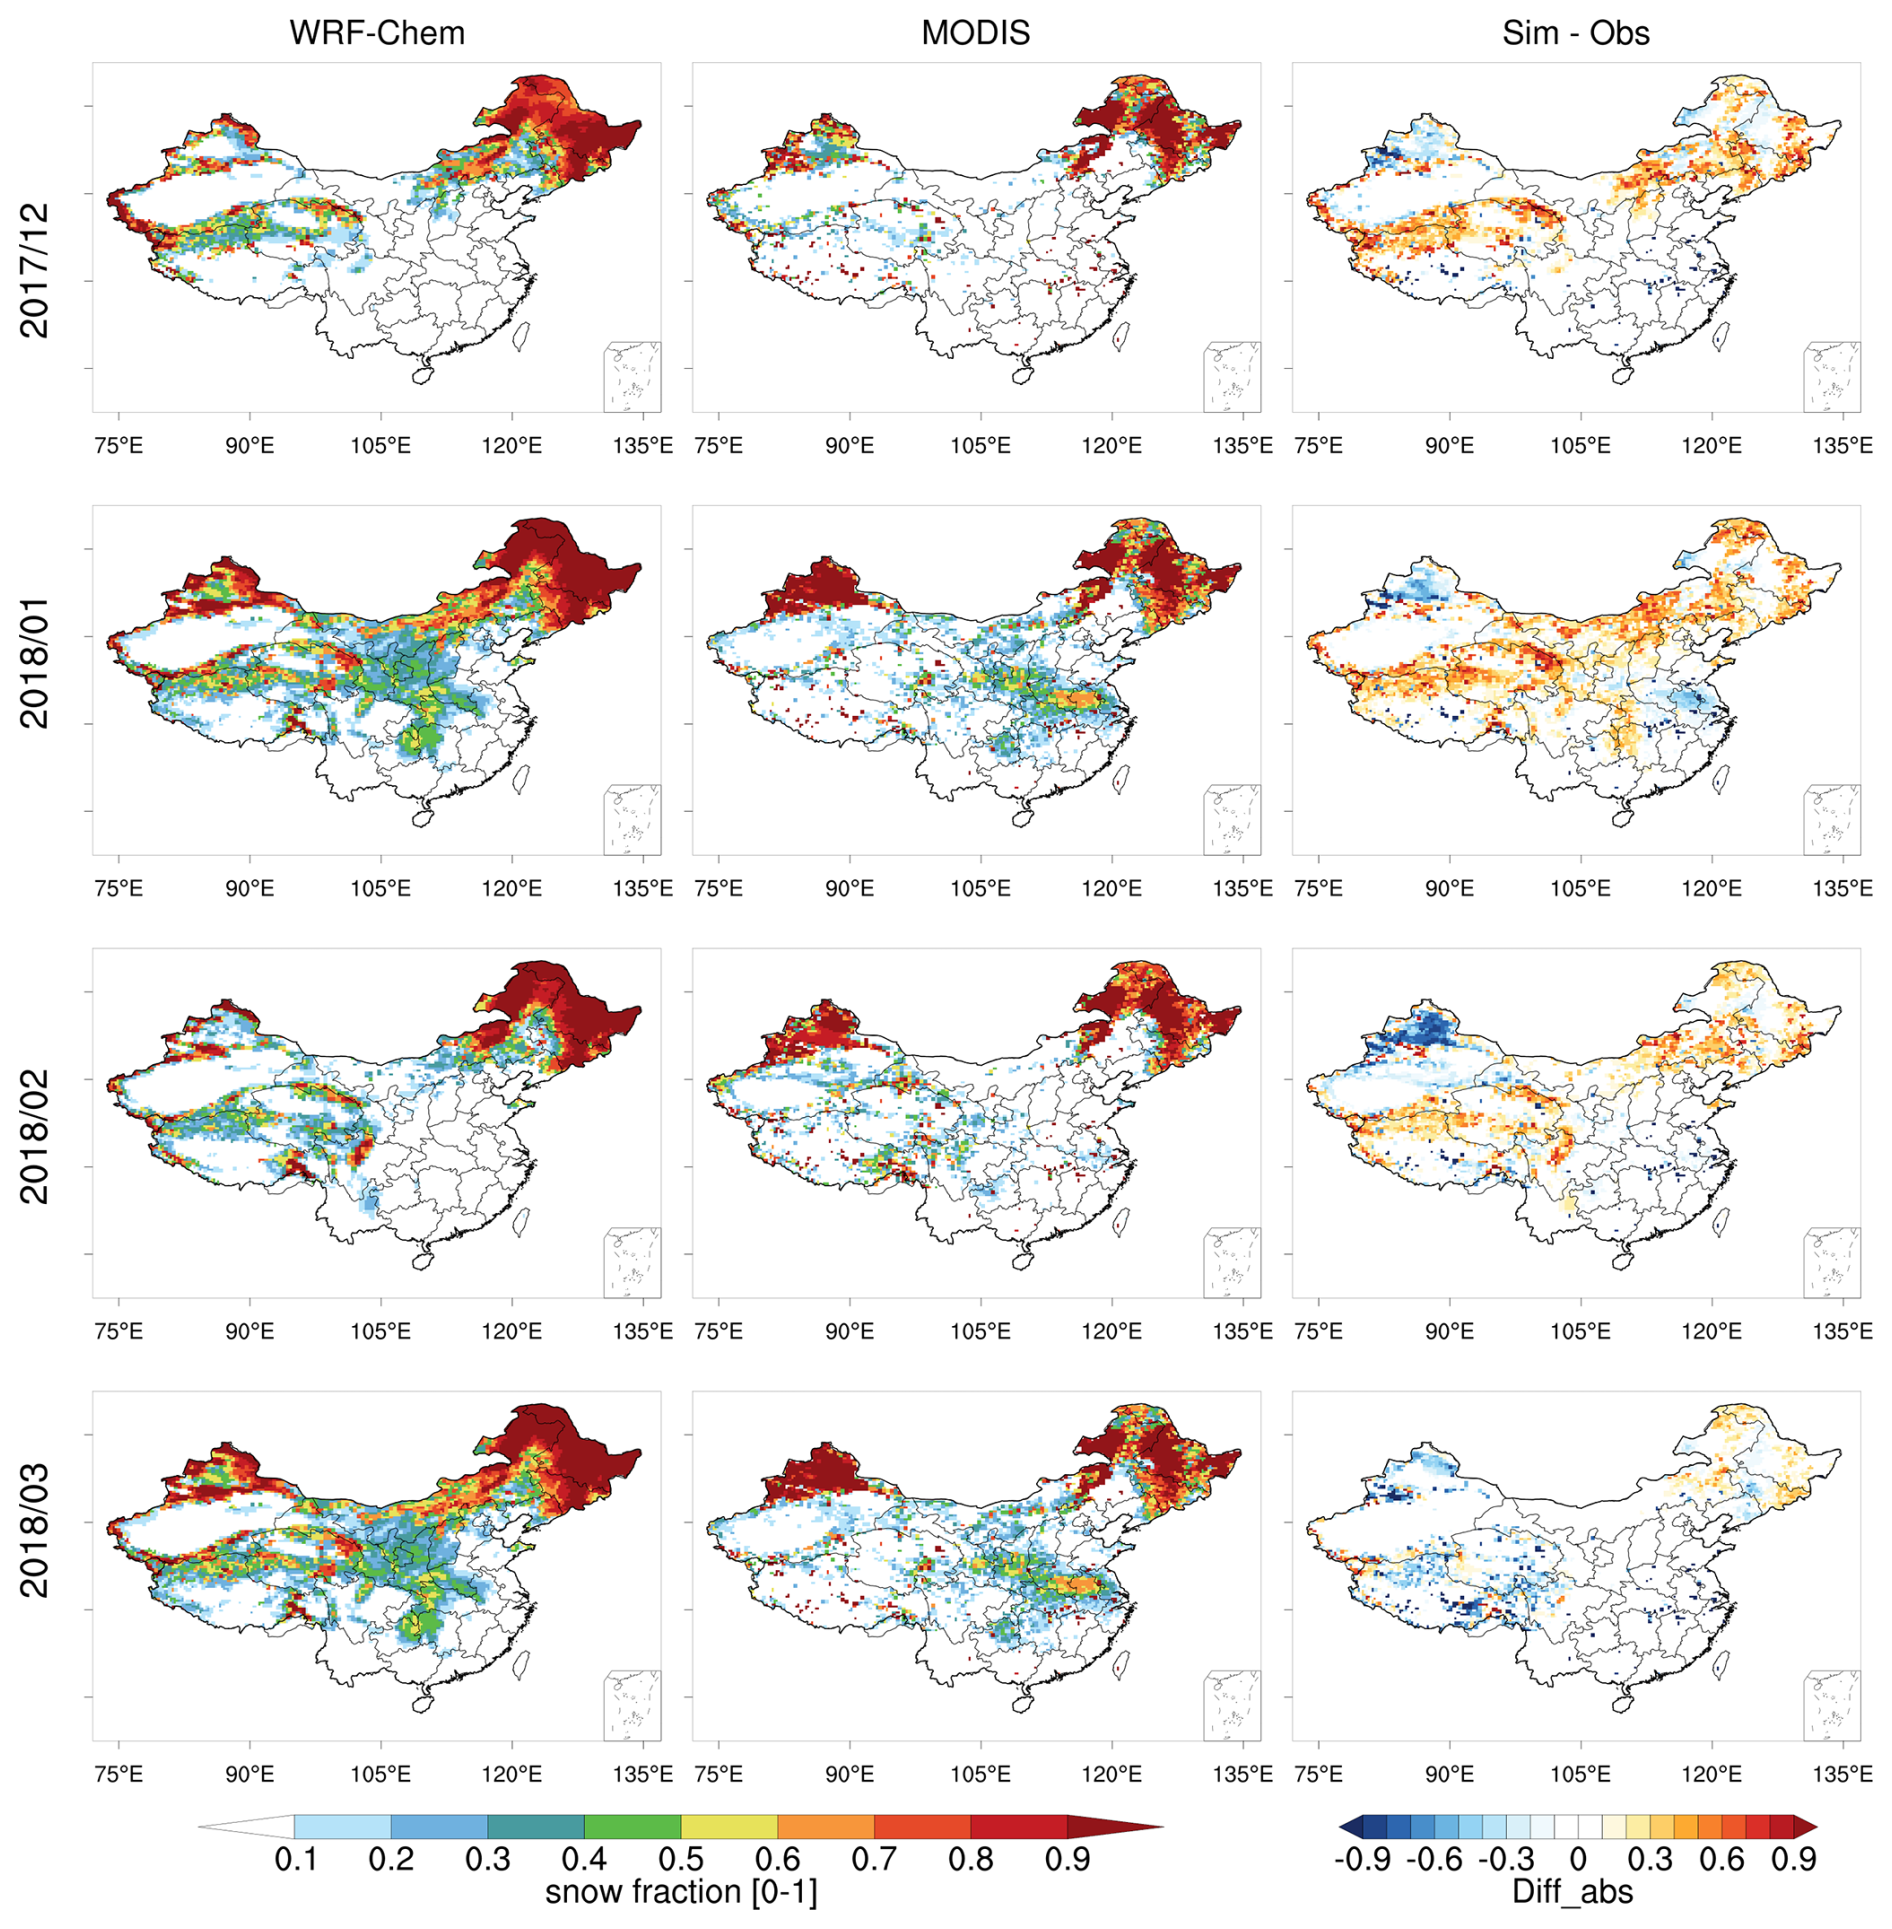
Figure 3Spatial distribution of snow cover simulated by WRF-Chem and observed from MODIS-based data across China from December 2017 to March 2018. The data presented are monthly averages, and the third column shows the difference calculated as the simulation minus the observation.
3.2.2 Snow depth
Figure 4 illustrates the simulated snow depth from December 2017 to March 2018 along with the observations from the field campaign integrated into each panel. The background color in the figures represents the monthly average of the simulation results, while the plotted dots indicate the observed data for that month. In general, the simulation and observation results exhibit consistency in terms of spatial distributions and magnitudes, both of which indicate that snow depth is deeper in a northerly direction. In particular, among the 4 months, January 2018 had the highest number of observations, distributed across the northeastern, northwestern, and Tibetan Plateau regions of China. The observed data for the other 3 months are primarily concentrated in the northeastern region of China. Detailed comparison maps for specific regions can also be found in Fig. 4. Over time, the snow cover in the northeastern region exhibits dynamic variations (I, III, V, and VII in Fig. 4). From December 2017 to March 2018, there was a gradual increase in snow depth each month, reaching its maximum in March 2018. In January 2018, in the northeastern region, the model captured the spatial variations in the observed snow depths well, with excellent agreement in both high- and low-value areas (VII in Fig. 4). In March 2018, extensive observational data were collected, primarily focused on the western Greater Khingan mountains and the northeast China Plain in northeast China. From the panel, we can observe that the overall simulation performance is quite satisfactory, as it effectively captures the spatial variations in snow depth. The simulation successfully reproduced high snowfall values around the Hulunbuir area, located in the Inner Mongolia Autonomous Region, reaching up to 29 cm. The March snow variations are clearly visible in the figure, with snow depths reaching more than 20 cm in both the western Greater Khingan mountains and the northeast China Plain. In addition, we extracted the simulated values corresponding to the observations at each station and plotted them in a scatter plot (Fig. 11a). From the results, most of the simulated snow depths align reasonably well with the observations, though underestimation is evident in some areas, particularly in regions with lower snow depths.
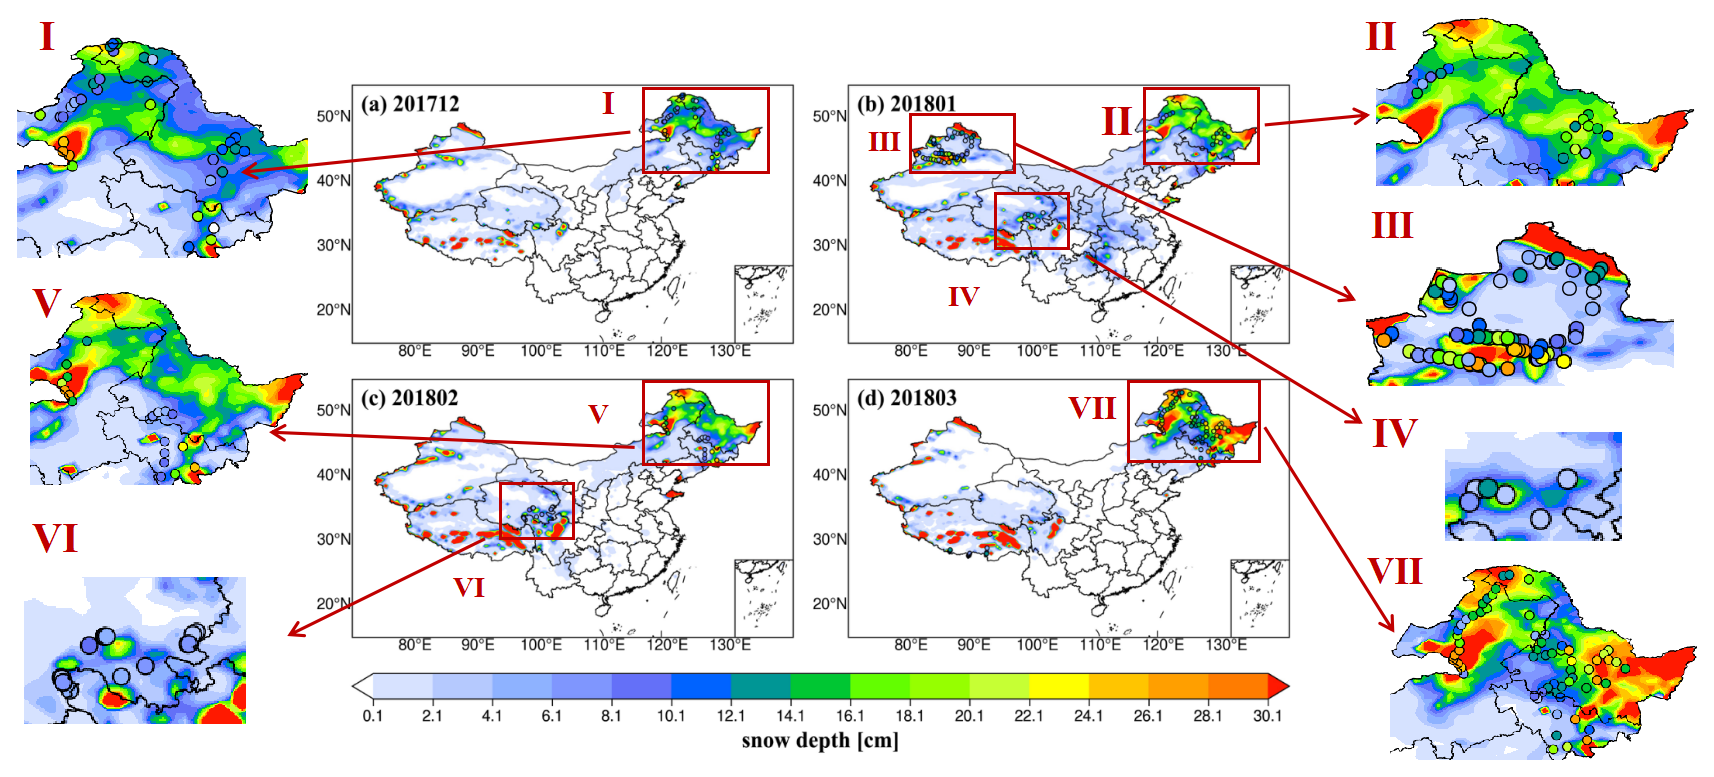
Figure 4Spatial distribution of snow depth (cm) observed and simulated by WRF-Chem across China from December 2017 to March 2018. Note that the background color in each figure represents the monthly average of the simulation results, while all the observations for each month are embedded in each panel.
3.3 Modeling of dust and BC concentrations in snow
3.3.1 Spatiotemporal variability of dust in snow
Figure 5 illustrates the pattern of dust concentration (mg g−1) in the top snow layer (DSTS) simulated by WRF-Chem. Additionally, in the absence of direct dust measurement data, we have graphed the concentration of the dust tracer calcium ions in the top layer of snow simulated by WRF-Chem together with the field campaign observations for each month (Fig. 6). From the figure, it is clear that there are significant differences between the dust distributions in each month. For example, in December 2017, the dust is mainly concentrated in the northwestern part of China, while in January 2018, it spreads to other parts of the northwest and northeast. In February 2018, the dust seems to be more evenly distributed across northern China, and in March 2018, it is mainly found in the northeastern part of China. These variations are associated with the distribution of snow cover in each month. Overall, dust is primarily distributed across northwest China, Mongolia, and Liaoning Province, corresponding to the distribution of dust sources (see Fig. S2). In regions near a dust source, DSTS is highest (>3 mg g−1). Far away from the source region, DSTS gradually decreases. In northeast and central China, the concentration decreases to approximately 10 µg g−1, and at the further northern boundaries, the concentrations can even drop as low as ∼ 100 ng g−1.
The modeled calcium ion content in the snow was calculated based on the proportion of calcium carbonate in the GOCART dust emission mechanism used in WRF-Chem, where calcium is assumed to constitute 0.4 % of the total dust mass and carbonate (CO) accounts for 0.6 % (Ginoux et al., 2001; Kok et al., 2014a, b). However, as our research area is northern China, particularly the northwest and Loess Plateau, which is a major source area for dust, these default proportions are not representative of the real values as suggested by observations conducted in these regions, which indicates the mass fraction of calcium in dust ranges from 7 % to 12 % in northern China (Zhang et al., 2003). Therefore, we used the average observed fraction of 9.5 % to calculate the modeled calcium concentrations in this study. Field-observed values of calcium ion concentration in the top layer of snow (CAS) are indicated by dots superimposed in Fig. 6. The simulated CAS values closely match the observations, effectively capturing the spatial variation and magnitude of the CAS. The simulation shows the highest CAS, exceeding 10 µg g−1, across northwest China (40–50° N, 90–100° E) in January 2018, when the DSTS is also the highest (Fig. 5b). Moreover, the high CAS values simulated during this month align well with the actual measurements recorded, accurately capturing the overall spatial variations. CAS and DSTS exhibit similar distribution patterns and are primarily concentrated in the northern and northwestern regions of China, such as Inner Mongolia and Liaoning Province. These areas are characterized by arid and semiarid climatic conditions and desert landscapes, increasing susceptibility to the dispersal of dust particles. In addition, we extracted the simulated values corresponding to the observations at each station and plotted them in a scatter plot (Fig. 11b). From the results, the simulated snow calcium ion concentrations generally fall within the same order of magnitude as the observations.
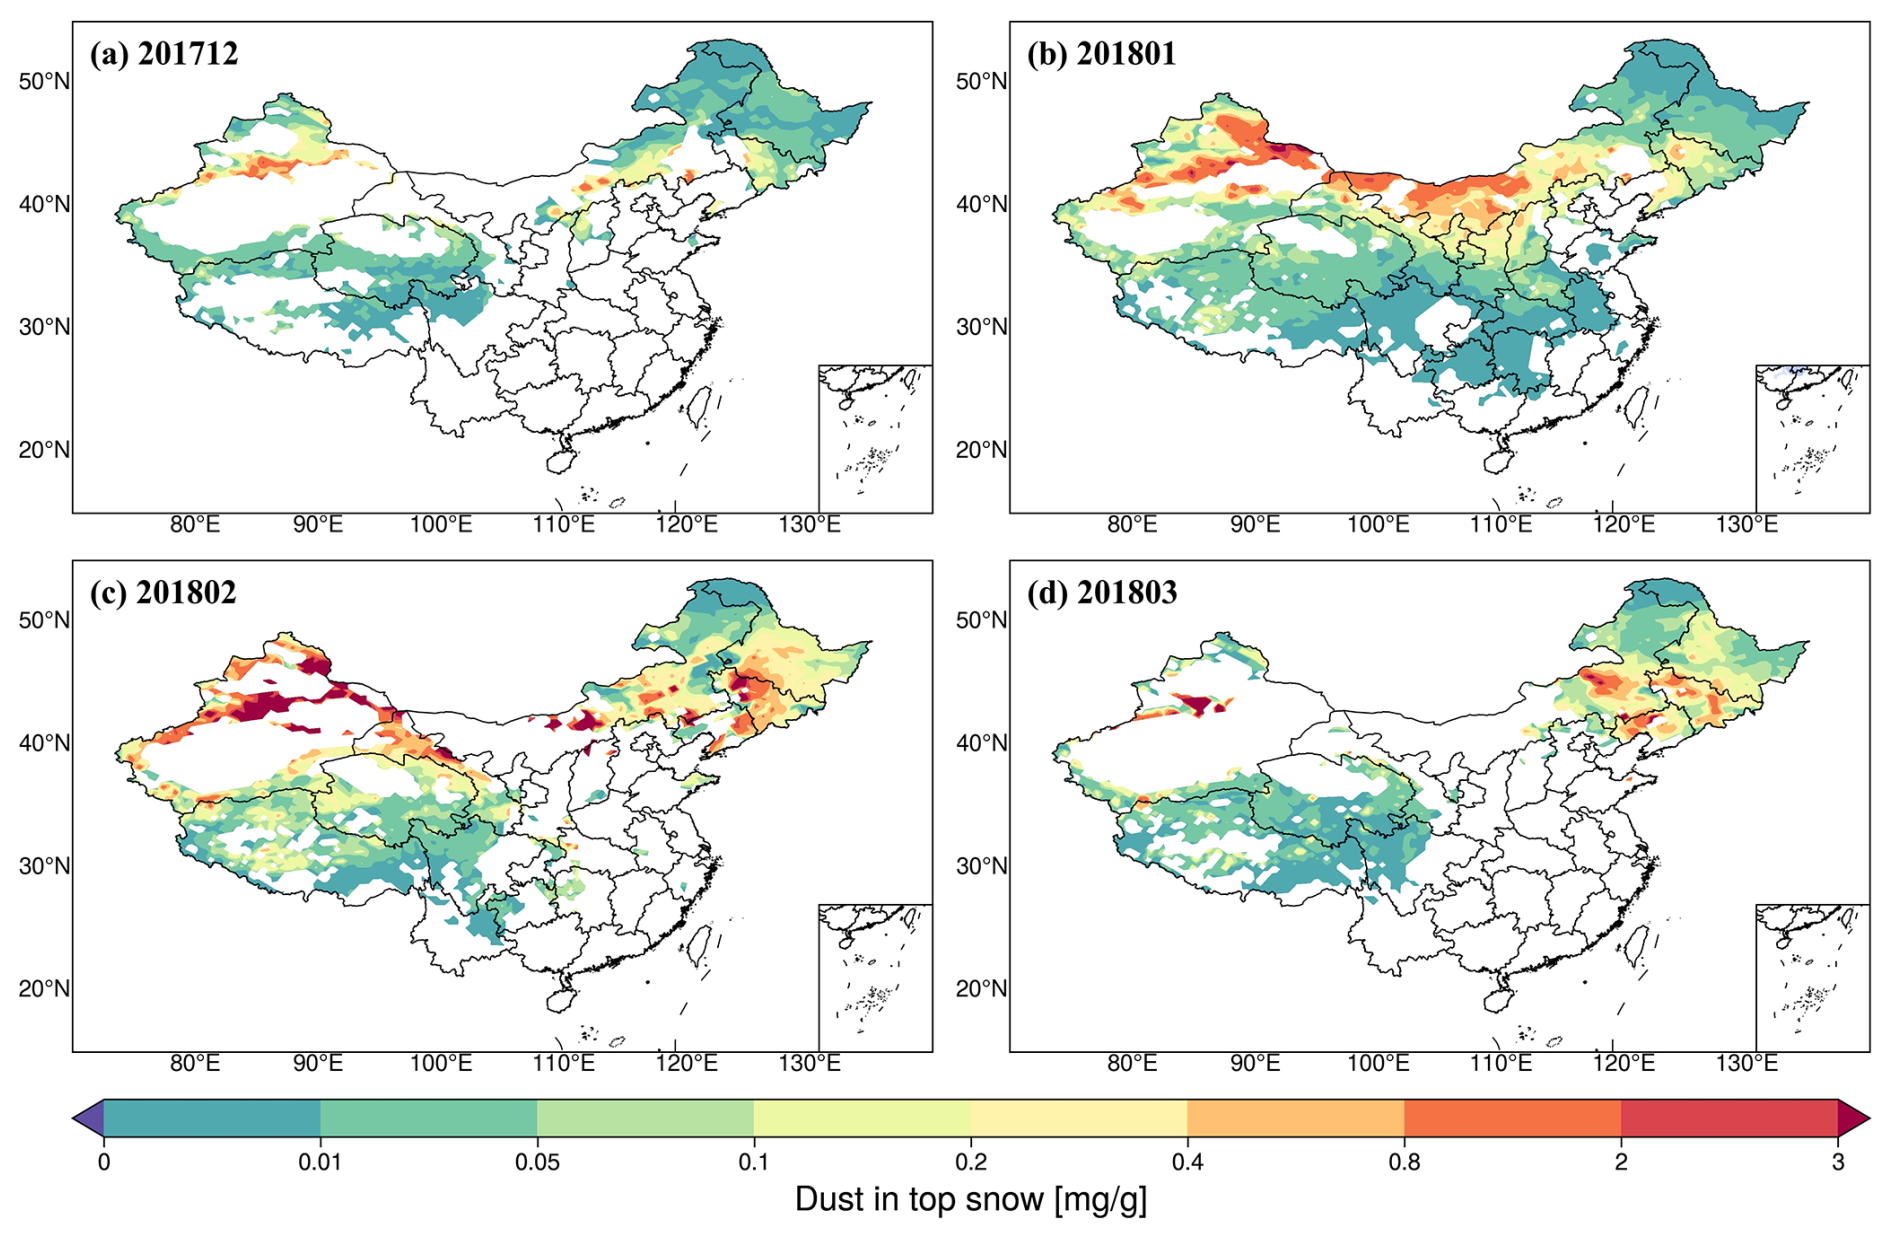
Figure 5Spatial distribution of dust concentrations (mg g−1) in the top snow layer simulated by WRF-Chem across China from December 2017 to March 2018 (a–d).
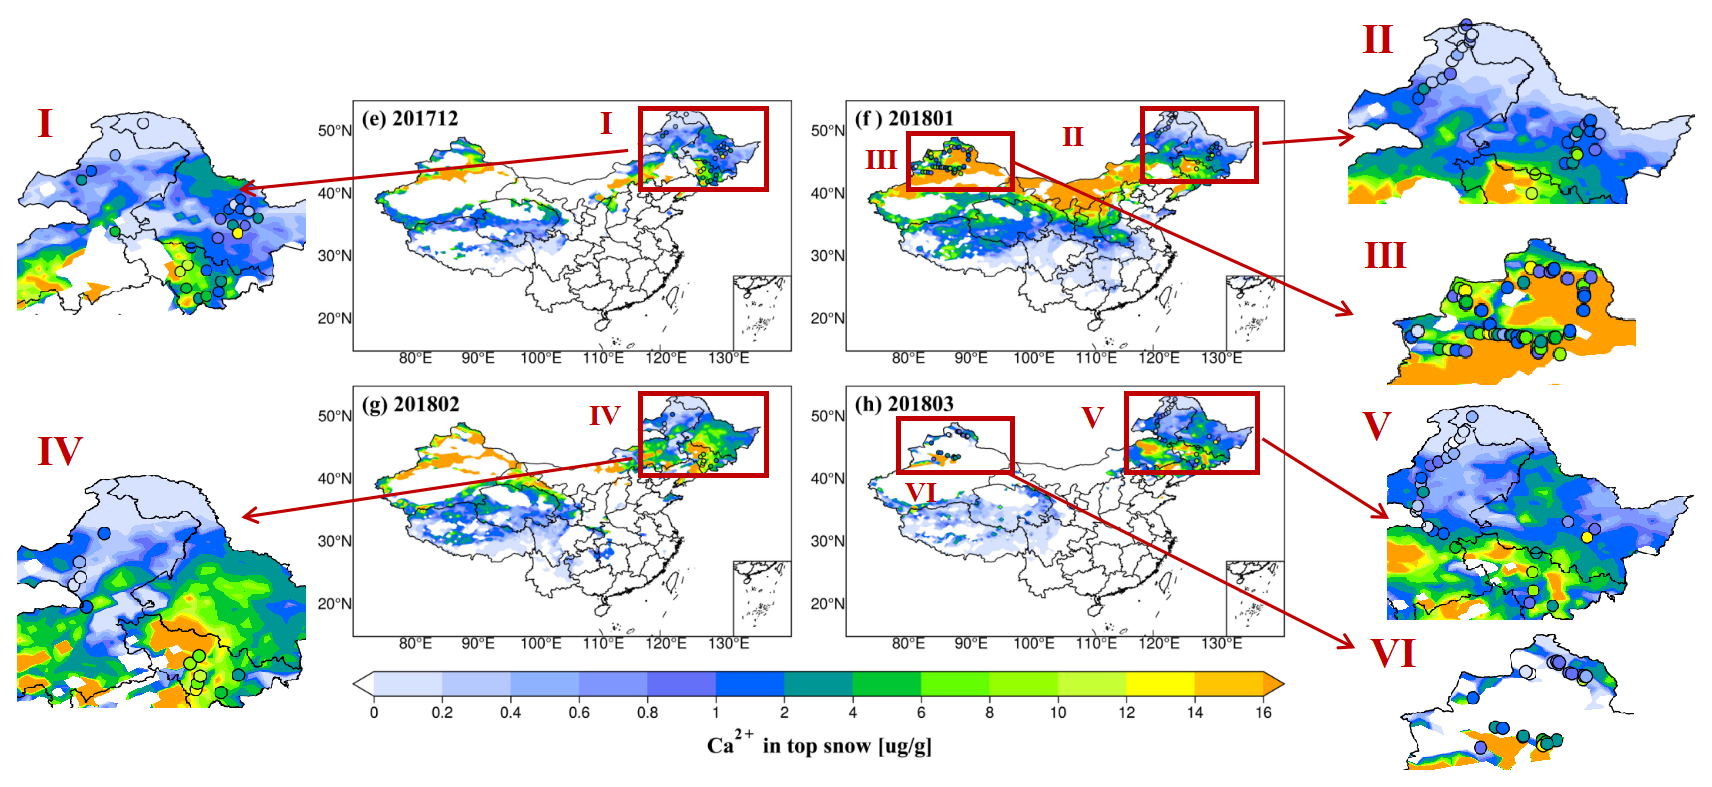
Figure 6Spatial distribution of calcium ion concentrations (µg g−1) in the top snow layer simulated by WRF-Chem, with field campaign observations embedded at specific locations for each month (e–h) across China from December 2017 to March 2018.
3.3.2 Spatiotemporal variability of BC in snow
Figure 7 displays the modeled black carbon (BC) concentration distributions across space in the top layer of snow across China from December 2017 to March 2018, simulated by WRF-Chem. We do not have BC observations during the simulation period, but there were observations in other winters for the same regions. We compared our simulations with those observations, and the results show that both the magnitude and the spatial patterns of our simulated BC concentrations are consistent with the observed values reported in the literature (Zhao et al., 2014). In addition, Zhao et al. (2014) also used the same model and framework to simulate BC concentrations during the observational period. Their study showed reasonable agreement with a median model-to-observation ratio of 1.03. In the vicinity of approximately 40° N and 125° E in northeast China, as depicted in Fig. 7, the highest concentration of BC in the top snow layer (BCS) reaches more than 6000 ng g−1. This region is characterized by significant snow cover and depth, as illustrated in Figs. 4 and 5. Far away from northeast China, the BCS decreases and drops to less than 50 ng g−1 towards the northwest border of China. This finding aligns with the results of Zhao et al. (2014), who reported high BCS values in areas of dense industrial activity and reduced levels (30–50 ng g−1) at more northerly latitudes in the northern reaches of China, around 51° N. The large spatial and temporal variations in BCS are influenced in part by the changes in snow conditions (Fig. 4) and BC content as represented in the model. During the initial accumulation of snow, the mass of BC within the snow is significantly less than the mass of the snow itself, leading to the lowest recorded BCS. As the snow begins to melt, BCS continues to rise primarily due to melt enrichment, where melting snow concentrates BC near the snow surface (Doherty et al., 2013). This effect is further enhanced by dry deposition until the snow completely melts. Note that in January 2018, a high concentration of BC was simulated in central China, which was due to the low snow accumulation at that time (i.e., low snowfall but high BC emissions led to high snow BC content).
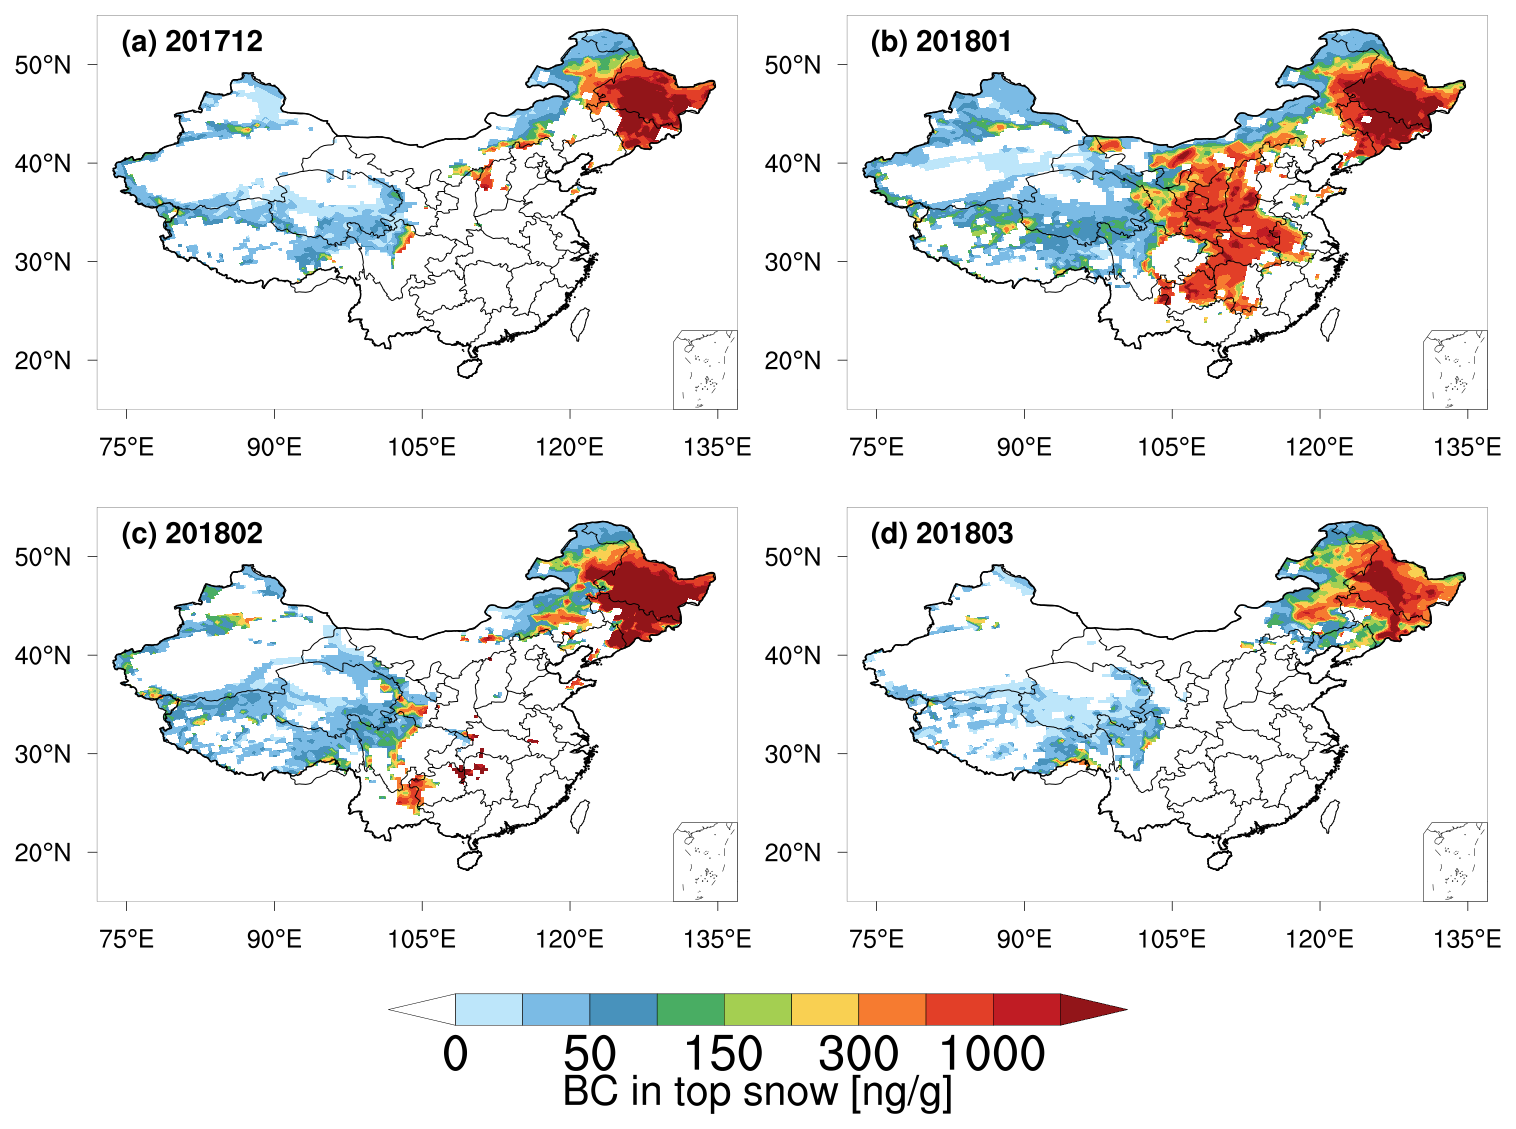
Figure 7Spatial distribution of BC concentration (ng g−1) in the top snow layer simulated by WRF-Chem across China from December 2017 to March 2018. Note that the background color in each figure represents the monthly average of the simulation.
3.4 Snow nitrate simulations
3.4.1 Deposition fluxes of nitrate on snow
Snow nitrate concentration was calculated by incorporating dry and wet total nitrate (atmospheric gaseous and particulate nitrate) deposition fluxes into the SNICAR module in WRF-Chem. Therefore, before assessing the concentration of nitrate in the snowpack, it is necessary to evaluate the reasonableness of the model-derived deposition fluxes. The simulated spatial distributions of nitrate deposition via dry and wet processes on snow from December 2017 to March 2018 are shown in Fig. 8. Deposition fluxes only accumulate across snow-covered surfaces, both in space and time. To assess nitrate deposition fluxes in winter in China, we initially compared our simulation results with findings from other simulation studies (Liu et al., 2022a; Ma et al., 2023b; Zhao et al., 2015). Overall, our simulation results exhibit consistency in terms of the spatial distributions and magnitudes of atmospheric nitrate deposition. During the studied period spanning December 2017 to March 2018, the monthly deposition flux of nitrate (including both dry and wet depositions of gaseous and particulate nitrate) in China was approximately 0.17 ± 0.007 (mean ± 1σ) kg N ha−1 per month. Among them, dry deposition contributed approximately 0.07 ± 0.005 kg N ha−1 per month, while wet deposition accounted for 0.09 ± 0.007 kg N ha−1 per month. Wet deposition comprised a slightly greater proportion, constituting 56 % of the total deposition flux. In comparison, Yu et al. (2019) utilized linear regression and kriging interpolation methods drawing upon data from the Nationwide Nitrogen Deposition Monitoring Network (NNDMN), finding that the monthly dry deposition flux of nitrate (including both gaseous and particulate nitrate) over China from 2011 to 2015 was approximately 0.27 ± 0.08 (mean ±1σ) kg N ha−1 per month and wet deposition flux was approximately 0.31 ± 0.23 kg N ha−1 per month. Note that this monthly average considers data from all 12 months and not only the winter. If considering only winter means, the dry and wet deposition fluxes are 0.09 ± 0.03 kg N ha−1 per month and 0.10 ± 0.07 kg N ha−1 per month, respectively, assuming the monthly means are approximately one-third of summer means according to previous seasonal research findings of nitrate deposition (Ma et al., 2023a; Pan et al., 2012). In addition, we found two observation sites in Jilin and Liaoning provinces in northeast China from the NNDMN. At the Jilin site (43.53° N, 124.83° E), in winter months, the simulated monthly dry deposition of nitrate (atmospheric gaseous and particulate nitrate, the same as follows) was 0.07 ± 0.10 kg N ha−1 per month, and wet deposition was 0.16 ± 0.28 kg N ha−1 per month, with ranges of observed values of 0.13 ± 0.03 kg N ha−1 per month for dry deposition and 0.28 ± 0.11 kg N ha−1 per month for wet deposition. At the Liaoning site (38.92° N, 121.58° E), the simulated dry deposition was 0.18 ± 0.17 kg N ha−1 per month, and wet deposition was 0.79 ± 0.32 kg N ha−1 per month, while the observed dry deposition was 0.38 ± 0.18 kg N ha−1 per month, and wet deposition was 0.35 ± 0.18 kg N ha−1 per month. Although at the Liaoning site the modeled wet and dry deposition fluxes are somewhat different from the observations, their sums (i.e., the total deposition fluxes) are close to each other (0.97 ± 0.36 kg N ha−1 per month versus 0.73 ± 0.25 kg N ha−1 per month) within the range of uncertainties.
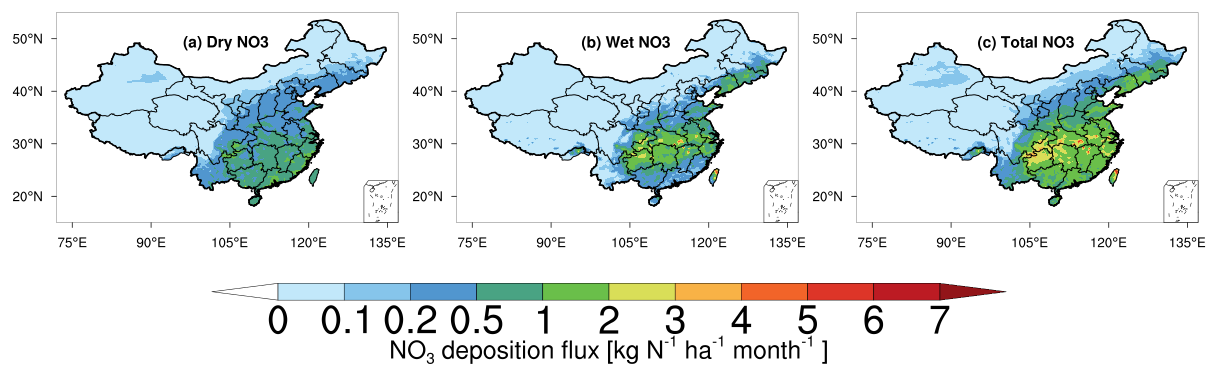
Figure 8Spatial distribution of (a) dry, (b) wet, and (c) total (dry plus wet) deposition fluxes (kg N ha−1 per month) of oxidized nitrogen (atmospheric gaseous plus particulate nitrate) on snow simulated by WRF-Chem in mainland China averaged over December 2017 to March 2018.
3.4.2 Nitrate concentrations and spatial distribution in snow
Figure 9 displays the nitrate concentration distributions across space in the top snow layer simulated by WRF-Chem averaged for December 2017 to March 2018, with the field campaign observations of nitrate concentration in the top snow layer (NITS). Among the 4 months, January 2018 had the highest number of observations, distributed across northeastern and northwestern China. The observed data for the other 3 months are primarily concentrated in the northeastern region of China. During these 4 months, identified patterns of change were consistent with the model simulating the highest NITS (>15 µg g−1) in the region spanning northeast China (40–47° N, 125–132° E), mainly encompassing the provinces of Heilongjiang, Jilin, and Liaoning. In addition, far away from northeast China, the NITS decreases and drop to less than 0.06 µg g−1 at the boundary of northern China. This finding aligns with our field campaign data, revealing elevated NITS levels (1.03–33.43 µg g−1) in areas characterized by heavy industrialization and lower concentrations (0.08–0.4 µg g−1) in the northern regions of China (52° N). From a temporal perspective, there was a significant increase in the simulated NITS in northeastern Jilin Province from December 2017 to March 2018. This difference may be attributed to the monthly increase in simulated nitrate deposition in this region, while snowfall slightly decreased in the northeastern area during the same period.
The road trip during the campaign began in Inner Mongolia, which, compared to northeast China, exhibits relatively lower pollution levels, with most observed NITS values below 1 µg g−1. The cleanest snow samples, with concentrations in the tens of nanograms per gram range, were collected close to China's northern border, while polluted snow was obtained from the industrialized zones of northeast China. The WRF-Chem simulation effectively reproduces the observed notable escalation in NITS toward more polluted sites, from 0.08–0.4 µg g−1 at 51° N to more than 10 µg g−1 at 43° N. Both temporally and spatially, the simulation results generally align with the observations, albeit with some negative biases in relatively clean areas (e.g., Inner Mongolia).
The WRF-Chem-simulated maximum values ranged from 7.11 to 16.58 µg g−1, while the range of the simulated minimum values was between 0.06 and 0.21 µg g−1. The observed maximum values varied between 9.35 and 33.43 µg g−1, with observed minimum values falling within the range of 0.09 to 0.51 µg g−1. In addition to the results described above, we also calculated the overall average values for the 4 months. The simulation results indicate an average concentration of 2.72 ± 1.34 µg g−1, whereas the observed 4-month average concentration is 3.74 ± 5.42 µg g−1. This conclusion aligns well with the results presented with the findings of Xue et al. (2020), who also conducted observations of snowfall in northeastern China from December 2017 to March 2018. Covering the same period and region as ours, their results revealed maximum, minimum, and average nitrate concentrations in snow of 12.25, 0.08, and 3.34 ± 1.00 mg L−1, respectively. Although our simulation shows a certain degree of underestimation at some sites compared to the observational results, the simulated results generally capture both the spatial patterns and magnitudes seen in the data. Regarding this underestimation, as illustrated in Fig. 9, we note that there is a low bias for the NITS in high-pollution areas between December 2017 and January 2018. In particular, in high-pollution regions like Jilin Province, the model exhibited a negative bias, with an average observation-to-simulation ratio of 1.7, corresponding to a normalized mean bias (NMB) of 40.29 %.
In addition, we extracted the simulated values corresponding to the observations at each station and plotted them as a scatter plot (Fig. 11c). The results show that the model generally underestimates the NITS. Typically, such an underestimation of NITS could result from either underestimating the amount of snow or underestimating the flux of nitrate deposition within the snow. However, based on the snow depth simulation results, the snow amount simulation performs better, so snowfall is unlikely to be the main cause of this bias. The most likely reason for this underestimation may be that the modeled atmospheric nitrate concentration is lower than the actual concentration. Consequently, even with the same snowfall amounts, the nitrate deposition would be underestimated. To demonstrate this, we analyzed the observed atmospheric nitrate concentrations from Tracking Air Pollution in China (Geng et al., 2017; Liu et al., 2022b) and compared them with the simulated results. We found that in northern China, where our study area is located, the simulated atmospheric particulate nitrate concentrations were indeed lower than the observed values (Fig. S3). The low simulated nitrate concentrations in northern China may be due to incomplete atmospheric nitrate chemistry in the model. However, in other regions of southern China, such as Anhui (29.45–34.55° N, 114.95–119.55° E) and Fujian (23.65–28.25° N, 115.95–120.45° E), the simulated atmospheric nitrate concentrations closely matched the observations (Fig. S4). Thus, the effect of incomplete atmospheric nitrate chemistry in the model can be excluded in this case. Another possible reason for the low simulated nitrate concentrations in northern China could be the underestimation of NOx emissions in this region. We also compared the observed and modeled atmospheric NO2 concentrations in this region and found that the model indeed underestimated the NO2 concentrations (see Fig. S5). In conclusion, the underestimation of NITS in the model is most likely due to the underestimation of atmospheric nitrate concentrations, which probably originates from the model's underestimate of NOx emissions in this region.
In addition to analyzing the top snow layer, we further evaluated the model's performance by comparing the vertical distribution of nitrate in the snowpack (Fig. 10). Here we selected eight specific sites, and details regarding their locations and sampling information are provided in Table S1. These sites were selected because the depth intervals of observed samples in these sites are closers to the model's depth intervals. In the figure, the depth position of each point represents the midpoint of the observed or simulated depth layers, with simulations represented by stars and observations by circles. As shown in Fig. 10, except sites 4 and 7, the model in general captures the depth variations well. At sites 4 and 7, the observed nitrate concentrations were much higher than other sites, and the model underestimates the observations. This pattern is similar to the model–observation comparisons of surface snow nitrate, which also indicates the model tends to underestimate surface snow nitrate at sites with high observed concentrations.
Given the substantial fluctuations in the temporal patterns of annual snowpack accumulation and the challenges in accurately predicting the occurrence of weather phenomena, aerosol releases, and deposition processes, it is judicious to compare data by utilizing the long-standing averages obtained from both actual and modeled NITS datasets across an extended time span. Additionally, further comparisons were conducted by comparing the averaged model results within the same day with the values observed at each site on the same day. However, these analyses showed no significant alterations (data not presented). The significant temporal fluctuations in NITS may also pose challenges when comparing monthly average values from model simulation results with field observations at particular times, a widely used method across global atmospheric modeling research (Huang et al., 2011; Qian et al., 2014; Zhao et al., 2014). The sample sites within industrial source regions are subject to increasing relative biases, with the model typically underestimating the NITS at these locations. In addition to the uncertainty in the snow accumulation process mentioned above, this difference may also be related to the challenge the model faces in capturing fine-scale variability within grid cells, which tends to be more pronounced in regions with high emissions compared to relatively clean areas.
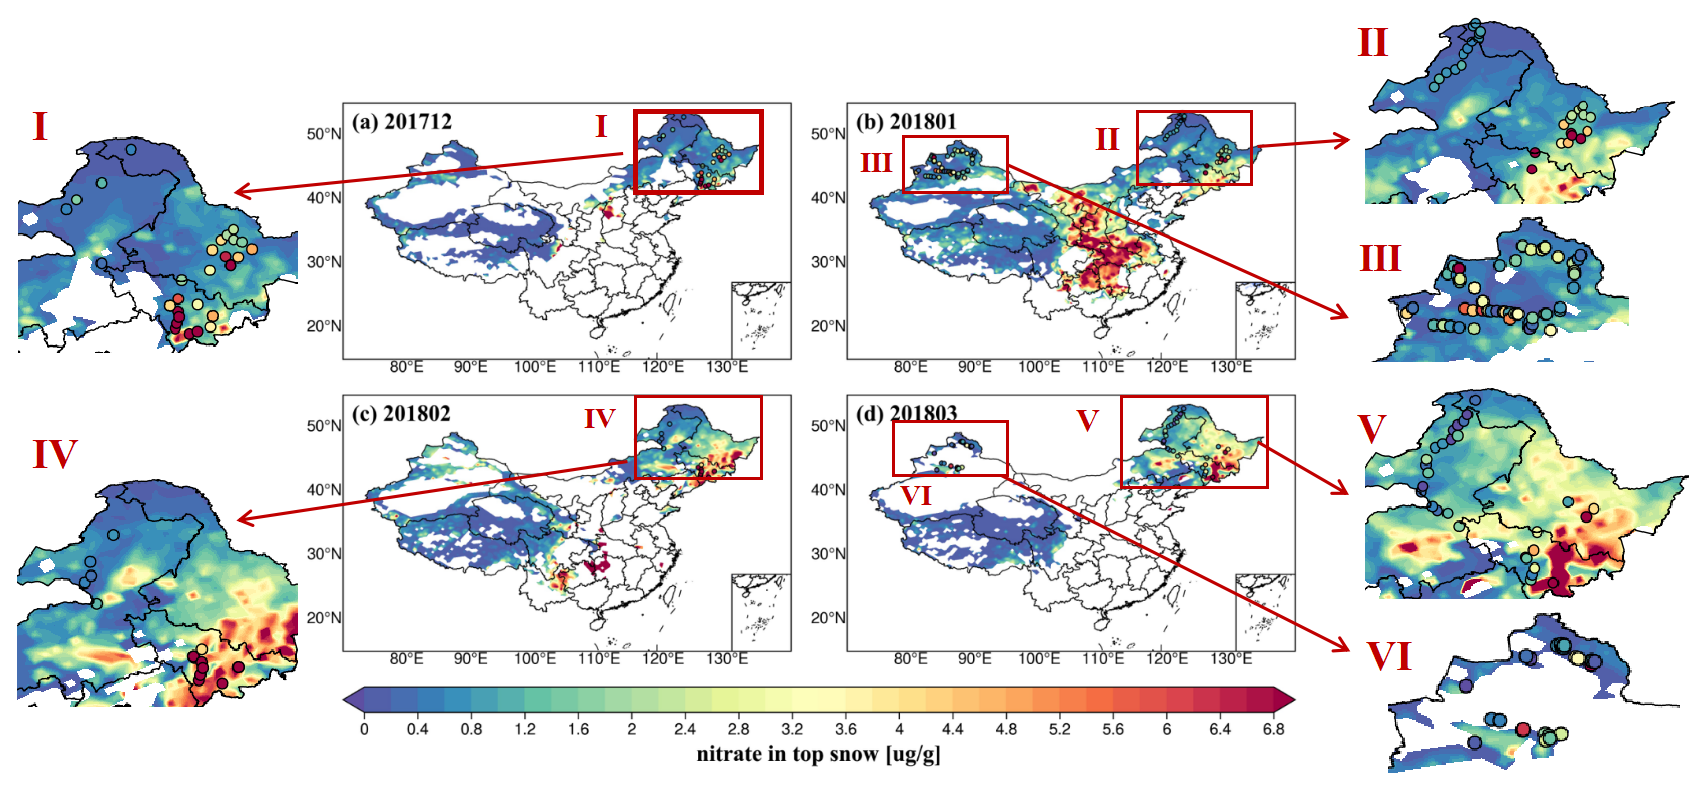
Figure 9Spatial distribution of nitrate concentration in the top snow layer observed and simulated by WRF-Chem across China from December 2017 to March 2018. Note that the background color in each figure represents the monthly average of the simulation results, while all the observations for each month are embedded in each panel.
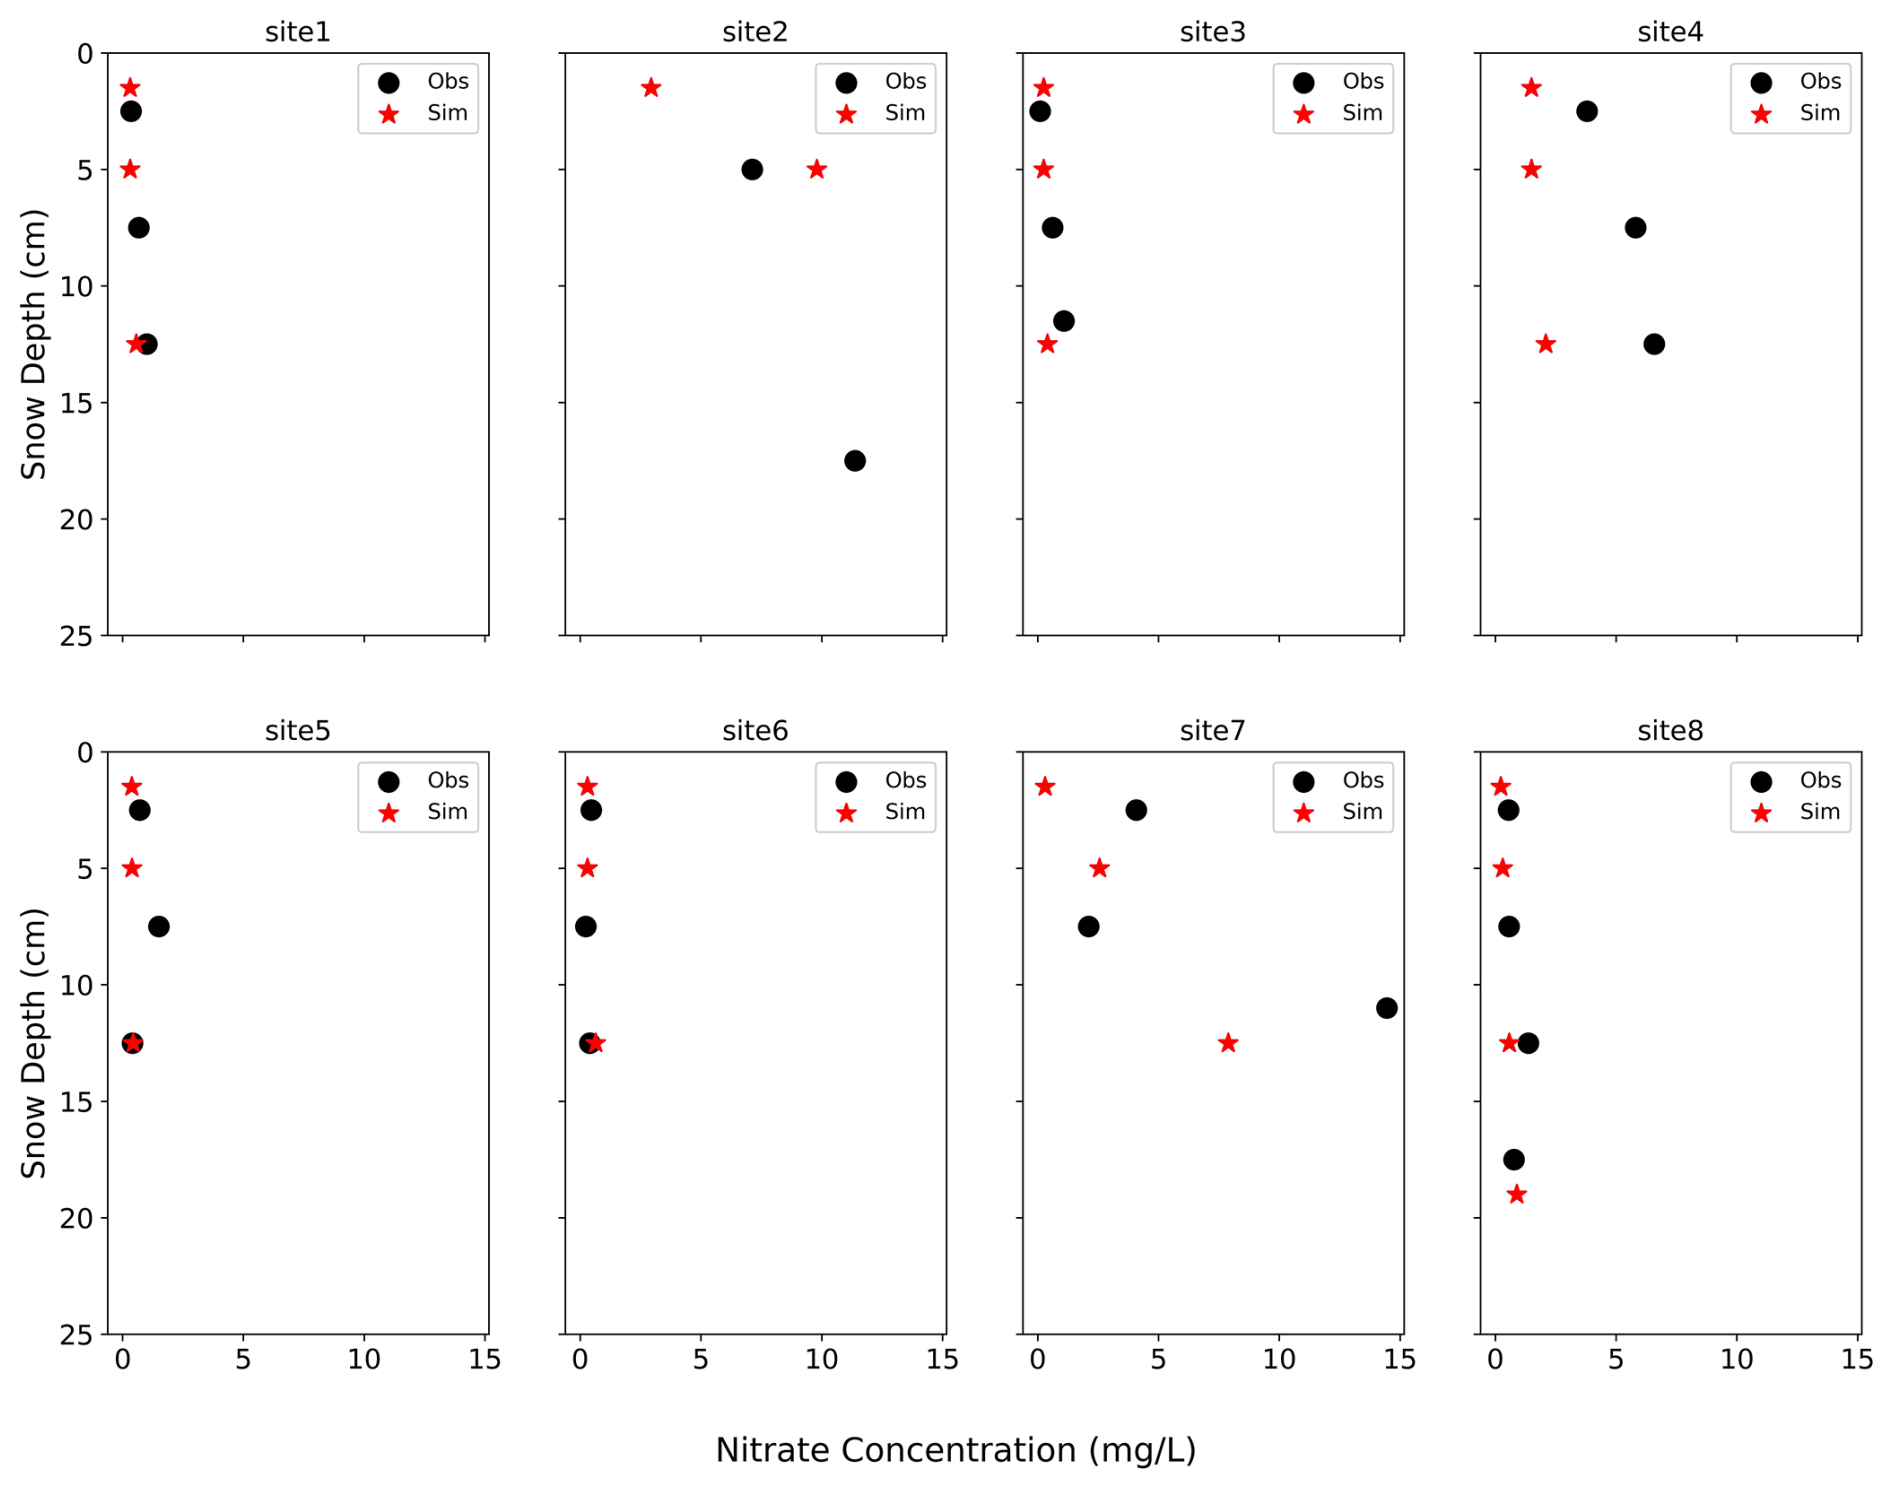
Figure 10Depth profiles of the observed and simulated snow nitrate concentrations (circles for observations, stars for simulations).
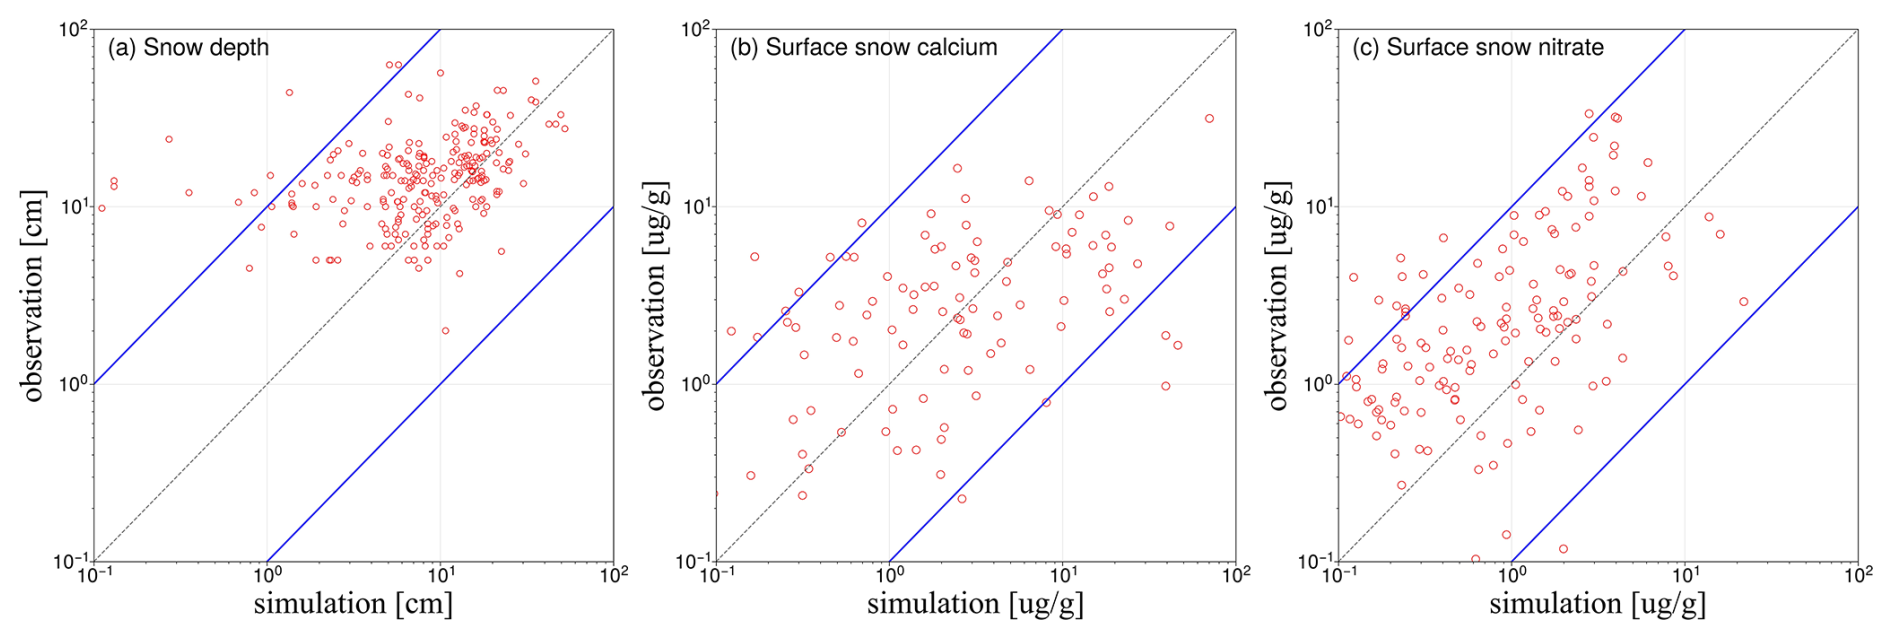
Figure 11Scatter plots of the observations of (a) snow depth (cm), (b) surface snow calcium ion concentrations (µ g−1), and (c) surface snow nitrate concentrations (µ g−1) versus the corresponding WRF-Chem simulations in winter 2017–2018.
In this study, WRF-Chem was used to simulate snow cover, snow depth, and snow impurities including BC, dust, and nitrate concentration in winter 2017–2018 across China. Field observations covering the same regions and periods were used to evaluate the ability of the model. In general, the model captures well the observed magnitude and spatial variations in surface temperature, snow cover, snow properties, and aerosol contents in snow. In particular, we thoroughly evaluated all simulation results with observations. Firstly, the model accurately represented the spatial patterns and magnitudes of snow cover and snow depth. Secondly, the simulation results for the light-absorbing impurities dust were evaluated using observational data for snow calcium ions. For snow BC concentrations, while we lack direct observations during the simulation period, we assessed the model's performance by comparing the results with observations from the same regions during different winters (Zhao et al., 2014). Thirdly, we evaluated the simulation of snow nitrate concentrations through a comparison with observational data. To assess the reasons for the discrepancies between the model and observations, we further discussed the simulation of atmospheric nitrate and its deposition fluxes. Overall, the spatial patterns and concentration levels for snow nitrate were represented well. However, in high-pollution areas such as Jilin Province, the model exhibited larger bias, with an average observation-to-simulation ratio of 1.7, corresponding to a normalized mean bias (NMB) of 40.29 %.
The most likely reason for the discrepancies in NITS between the model and observations is the underestimation of atmospheric nitrate concentrations, which probably originates from the model's underestimate of NOx emissions in this region. Additionally, uncertainties in the deposition processes (Akter et al., 2023; Huang et al., 2015; Lu and Tian, 2014), including dry and wet deposition of nitrate from the atmosphere to the snowpack, could also play a role. Furthermore, post-depositional processes could further contribute to the differences between the model and observations. These processes include snowfall dynamics, snow accumulation, and gas and aerosol scavenging in the snow (An et al., 2022; Flanner et al., 2012; Li et al., 2022; Poschlod and Daloz, 2024; Qian et al., 2014; Zhao et al., 2014), all of which may introduce uncertainties in the simulation of NITS. Another factor contributing to these discrepancies could be the relatively coarse model resolution, as it may not sufficiently capture the heterogeneous spatial distributions of snow and nitrate concentrations, especially when fine-scale variations are significant (Berg et al., 2024; Yu, 2013). Overall, however, the model demonstrates its ability to capture the temporal and spatial variations in snow impurity concentrations including nitrate in northern China. The considerable daily and diurnal fluctuations in simulated NITS emphasize the need for caution when comparing average values derived from the model with observations, as practiced in certain global modeling analyses (Huang et al., 2011; Qian et al., 2014; Zhao et al., 2014).
To ensure the accurate representation of aerosol contents within snow requires the model to effectively simulate the life cycle of aerosols within a snowpack, as highlighted in previous studies by Flanner et al. (2012) and Qian et al. (2014). Furthermore, uncertainties in the SNICAR model parameters must be quantified and constrained through observational data. Additionally, it is crucial for the model to precisely replicate the atmospheric aerosol life cycle, encompassing the faithful representation of atmospheric aerosol levels and the accurate treatment of deposition mechanisms. Improvements in such model parameters and mechanisms would be necessary to further improve the agreement with observations. Moreover, other factors such as atmospheric chemistry mechanisms may also need to be improved to better represent nitrate chemistry, which will be addressed in the next phase of this study.
Given the reasonable agreements between the model and observations, we will further incorporate snow nitrate photolysis and the subsequent emissions of NO2 and/or HONO to the overlying atmosphere, investigating the potential disturbances to local and regional atmospheric chemistry with a focus on the aerosol burden, which is important for atmospheric and snow radiative balances in snow cover regions, and on the potential effects on air quality originating from the winter snow cover to the downwind regions in northern China.
The release version of WRF-Chem can be downloaded from http://www2.mmm.ucar.edu/wrf/users/download/get_source.html (NCAR, 2024). The modified version of WRF-Chem used in this study is archived on Zenodo at https://doi.org/10.5281/zenodo.10586762 (Wang et al., 2024). All the original data and scripts used for data processing in this study can be downloaded from https://doi.org/10.5281/zenodo.10965532 (Wang, 2024).
The supplement related to this article is available online at: https://doi.org/10.5194/gmd-18-651-2025-supplement.
LG conceived the study, and XW conducted the model experiments and analyzed the results under the supervision of LG and CZ. TC, SY, and JW provided the field observational data. XW drafted the manuscript under the supervision of LG. All authors contributed to the discussion and the final version of the manuscript. LG should be contacted as first corresponding author in case of questions.
The contact author has declared that none of the authors has any competing interests.
Publisher's note: Copernicus Publications remains neutral with regard to jurisdictional claims made in the text, published maps, institutional affiliations, or any other geographical representation in this paper. While Copernicus Publications makes every effort to include appropriate place names, the final responsibility lies with the authors. Regarding the maps used in this paper, please note that Figs. 1–9 contain disputed territories.
This research was supported by the advanced computing resources provided by the Supercomputing Center of USTC.
Lei Geng should be contacted as first corresponding author in case of questions.
This research has been supported by the National Nature Science Foundation of China (grant no. W2411030), the Strategic Priority Research Program of the Chinese Academy of Sciences (grant no. XDB 41000000), and the National Key Research and Development Program of China (grant no. 2022YFC3700701). Support was provided by the National Nature Science Foundation of China (grant no. 42125604).
This paper was edited by David Topping and reviewed by two anonymous referees.
Akter, S., Lamancusa, C., Naranjo-Soledad, A., Rumsey, S., Chen, X., and Wagstrom, K.: Regional evaluation and estimates of atmospheric nitrogen deposition for United States hydrologic units and ecoregions, Atmos. Environ., 315, 120149, https://doi.org/10.1016/j.atmosenv.2023.120149, 2023.
An, Y., Xu, J., Liu, Y., Li, X., Zhao, H., and Kang, S.: Concentrations, Compositions, and Deposition Rates of Dissolved Nitrogen in Western China: Insights From Snow Records, Frontiers in Environmental Science, 9, 827456, https://doi.org/10.3389/fenvs.2021.827456, 2022.
Barbero, A., Savarino, J., Grilli, R., Blouzon, C., Picard, G., Frey, M. M., Huang, Y., and Caillon, N.: New Estimation of the NOx Snow-Source on the Antarctic Plateau, J. Geophys. Res.-Atmos., 126, e2021JD035062, https://doi.org/10.1029/2021JD035062, 2021.
Berg, J., Reynolds, D., Quéno, L., Jonas, T., Lehning, M., and Mott, R.: A seasonal snowpack model forced with dynamically downscaled forcing data resolves hydrologically relevant accumulation patterns, Frontiers in Earth Science, 12, 1393260, https://doi.org/10.3389/feart.2024.1393260, 2024.
Binkowski, F. S. and Shankar, U.: The Regional Particulate Matter Model: 1. Model description and preliminary results, J. Geophys. Res.-Atmos., 100, 26191–26209, https://doi.org/10.1029/95JD02093, 1995.
Bouwman, A. F.: Nitrogen oxides and tropical agriculture, Nature, 392, 866–867, https://doi.org/10.1038/31809, 1998.
Brandt, R. E., Warren, S. G., and Clarke, A. D.: A controlled snowmaking experiment testing the relation between black carbon content and reduction of snow albedo, J. Geophys. Res.-Atmos., 116, D08109, https://doi.org/10.1029/2010JD015330, 2011.
Chapman, E. G., Gustafson Jr., W. I., Easter, R. C., Barnard, J. C., Ghan, S. J., Pekour, M. S., and Fast, J. D.: Coupling aerosol-cloud-radiative processes in the WRF-Chem model: Investigating the radiative impact of elevated point sources, Atmos. Chem. Phys., 9, 945–964, https://doi.org/10.5194/acp-9-945-2009, 2009.
Che, T.: Chinese guidelines for snowpack observation in the field[M], Science Press, Beijing, ISBN 9787030651778, 2020.
Che, T., Dai, L., Xiao, L., and Wang, J.: A dataset for in situ snow characteristics in China (2017–2020), China Scientific Data, 7, 3, https://doi.org/10.11922/11-6035.ncdc.2022.0001.zh, 2022.
Chen, Q., Edebeli, J., McNamara, S. M., Kulju, K. D., May, N. W., Bertman, S. B., Thanekar, S., Fuentes, J. D., and Pratt, K. A.: HONO, Particulate Nitrite, and Snow Nitrite at a Midlatitude Urban Site during Wintertime, ACS Earth and Space Chemistry, 3, 811–822, https://doi.org/10.1021/acsearthspacechem.9b00023, 2019.
Chu, L. and Anastasio, C.: Quantum Yields of Hydroxyl Radical and Nitrogen Dioxide from the Photolysis of Nitrate on Ice, J. Phys. Chem. A, 107, 9594–9602, https://doi.org/10.1021/jp0349132, 2003.
Doherty, S. J., Grenfell, T. C., Forsström, S., Hegg, D. L., Brandt, R. E., and Warren, S. G.: Observed vertical redistribution of black carbon and other insoluble light-absorbing particles in melting snow, J. Geophys. Res.-Atmos., 118, 5553–5569, https://doi.org/10.1002/jgrd.50235, 2013.
Dominé, F. and Shepson, P. B.: Air-Snow Interactions and Atmospheric Chemistry, Science, 297, 1506–1510, https://doi.org/10.1126/science.1074610, 2002.
Du, Q., Zhao, C., Zhang, M., Dong, X., Chen, Y., Liu, Z., Hu, Z., Zhang, Q., Li, Y., Yuan, R., and Miao, S.: Modeling diurnal variation of surface PM2.5 concentrations over East China with WRF-Chem: impacts from boundary-layer mixing and anthropogenic emission, Atmos. Chem. Phys., 20, 2839–2863, https://doi.org/10.5194/acp-20-2839-2020, 2020.
Easter, R. C., Ghan, S. J., Zhang, Y., Saylor, R. D., Chapman, E. G., Laulainen, N. S., Abdul-Razzak, H., Leung, L. R., Bian, X., and Zaveri, R. A.: MIRAGE: Model description and evaluation of aerosols and trace gases, J. Geophys. Res.-Atmos., 109, D20210, https://doi.org/10.1029/2004JD004571, 2004.
Eichler, A., Schwikowski, M., and Gäggeler, H. W.: Meltwater-induced relocation of chemical species in Alpine firn, Tellus B, 53, 192–203, https://doi.org/10.1034/j.1600-0889.2001.d01-15.x, 2001.
Flanner, M. G. and Zender, C. S.: Snowpack radiative heating: Influence on Tibetan Plateau climate, Geophys. Res. Lett., 32, L06501, https://doi.org/10.1029/2004GL022076, 2005.
Flanner, M. G., Zender, C. S., Randerson, J. T., and Rasch, P. J.: Present-day climate forcing and response from black carbon in snow, J. Geophys. Res., 112, D11202, https://doi.org/10.1029/2006JD008003, 2007.
Flanner, M. G., Zender, C. S., Hess, P. G., Mahowald, N. M., Painter, T. H., Ramanathan, V., and Rasch, P. J.: Springtime warming and reduced snow cover from carbonaceous particles, Atmos. Chem. Phys., 9, 2481–2497, https://doi.org/10.5194/acp-9-2481-2009, 2009.
Flanner, M. G., Shell, K. M., Barlage, M., Perovich, D. K., and Tschudi, M. A.: Radiative forcing and albedo feedback from the Northern Hemisphere cryosphere between 1979 and 2008, Nat. Geosci., 4, 151–155, https://doi.org/10.1038/ngeo1062, 2011.
Flanner, M. G., Liu, X., Zhou, C., Penner, J. E., and Jiao, C.: Enhanced solar energy absorption by internally-mixed black carbon in snow grains, Atmos. Chem. Phys., 12, 4699–4721, https://doi.org/10.5194/acp-12-4699-2012, 2012.
Gao, S.: Dynamical downscaling of surface air temperature and precipitation using RegCM4 and WRF over China, Clim. Dynam., 55, 1283–1302, https://doi.org/10.1007/s00382-020-05326-y, 2020.
Gao, S., Zhu, S., and Yu, H.: Dynamical downscaling of temperature extremes over China using the WRF model driven by different lateral boundary conditions, Atmos. Res., 278, 106348, https://doi.org/10.1016/j.atmosres.2022.106348, 2022.
Geng, G., Zhang, Q., Tong, D., Li, M., Zheng, Y., Wang, S., and He, K.: Chemical composition of ambient PM2.5 over China and relationship to precursor emissions during 2005–2012, Atmos. Chem. Phys., 17, 9187–9203, https://doi.org/10.5194/acp-17-9187-2017, 2017.
Ginoux, P., Chin, M., Tegen, I., Prospero, J. M., Holben, B., Dubovik, O., and Lin, S.-J.: Sources and distributions of dust aerosols simulated with the GOCART model, J. Geophys. Res.-Atmos., 106, 20255–20273, https://doi.org/10.1029/2000JD000053, 2001.
Grannas, A. M., Jones, A. E., Dibb, J., Ammann, M., Anastasio, C., Beine, H. J., Bergin, M., Bottenheim, J., Boxe, C. S., Carver, G., Chen, G., Crawford, J. H., Dominé, F., Frey, M. M., Guzmán, M. I., Heard, D. E., Helmig, D., Hoffmann, M. R., Honrath, R. E., Huey, L. G., Hutterli, M., Jacobi, H. W., Klán, P., Lefer, B., McConnell, J., Plane, J., Sander, R., Savarino, J., Shepson, P. B., Simpson, W. R., Sodeau, J. R., von Glasow, R., Weller, R., Wolff, E. W., and Zhu, T.: An overview of snow photochemistry: evidence, mechanisms and impacts, Atmos. Chem. Phys., 7, 4329–4373, https://doi.org/10.5194/acp-7-4329-2007, 2007.
Gutowski, W. J., Ullrich, P. A., Hall, A., Leung, L. R., O'Brien, T. A., Patricola, C. M., Arritt, R. W., Bukovsky, M. S., Calvin, K. V., Feng, Z., Jones, A. D., Kooperman, G. J., Monier, E., Pritchard, M. S., Pryor, S. C., Qian, Y., Rhoades, A. M., Roberts, A. F., Sakaguchi, K., Urban, N., and Zarzycki, C.: The Ongoing Need for High-Resolution Regional Climate Models: Process Understanding and Stakeholder Information, B. Am. Meteorol. Soc., 101, E664–E683, https://doi.org/10.1175/bams-d-19-0113.1, 2020.
Hadley, O. L. and Kirchstetter, T. W.: Black-carbon reduction of snow albedo, Nat. Clim. Change, 2, 437–440, https://doi.org/10.1038/nclimate1433, 2012.
Hall, S. J. and Matson, P. A.: Nitrogen oxide emissions after nitrogen additions in tropical forests, Nature, 400, 152–155, https://doi.org/10.1038/22094, 1999.
Hao, X., Huang, G., Zheng, Z., Sun, X., Ji, W., Zhao, H., Wang, J., Li, H., and Wang, X.: Development and validation of a new MODIS snow-cover-extent product over China, Hydrol. Earth Syst. Sci., 26, 1937–1952, https://doi.org/10.5194/hess-26-1937-2022, 2022.
He, C., Liou, K.-N., Takano, Y., Yang, P., Qi, L., and Chen, F.: Impact of Grain Shape and Multiple Black Carbon Internal Mixing on Snow Albedo: Parameterization and Radiative Effect Analysis, J. Geophys. Res.-Atmos., 123, 1253–1268, https://doi.org/10.1002/2017JD027752, 2018.
Huang, J., Fu, Q., Zhang, W., Wang, X., Zhang, R., Ye, H., and Warren, S. G.: Dust and Black Carbon in Seasonal Snow Across Northern China, B. Am. Meteorol. Soc. 92, 175–181, https://doi.org/10.1175/2010BAMS3064.1, 2011.
Huang, Z., Wang, S., Zheng, J., Yuan, Z., Ye, S., and Kang, D.: Modeling inorganic nitrogen deposition in Guangdong province, China, Atmos. Environ., 109, 147–160, https://doi.org/10.1016/j.atmosenv.2015.03.014, 2015.
Jiang, Z., Alexander, B., Savarino, J., Erbland, J., and Geng, L.: Impacts of the photo-driven post-depositional processing on snow nitrate and its isotopes at Summit, Greenland: a model-based study, The Cryosphere, 15, 4207–4220, https://doi.org/10.5194/tc-15-4207-2021, 2021.
Jin, J. and Wen, L.: Evaluation of snowmelt simulation in the Weather Research and Forecasting model, J. Geophys. Res.-Atmos., 117, D10110, https://doi.org/10.1029/2011JD016980, 2012.
Kok, J. F.: A scaling theory for the size distribution of emitted dust aerosols suggests climate models underestimate the size of the global dust cycle, P. Natl. Acad. Sci. USA, 108, 1016–1021, https://doi.org/10.1073/pnas.1014798108, 2011.
Kok, J. F., Albani, S., Mahowald, N. M., and Ward, D. S.: An improved dust emission model – Part 2: Evaluation in the Community Earth System Model, with implications for the use of dust source functions, Atmos. Chem. Phys., 14, 13043–13061, https://doi.org/10.5194/acp-14-13043-2014, 2014a.
Kok, J. F., Mahowald, N. M., Fratini, G., Gillies, J. A., Ishizuka, M., Leys, J. F., Mikami, M., Park, M.-S., Park, S.-U., Van Pelt, R. S., and Zobeck, T. M.: An improved dust emission model – Part 1: Model description and comparison against measurements, Atmos. Chem. Phys., 14, 13023–13041, https://doi.org/10.5194/acp-14-13023-2014, 2014b.
Kong, X., Wang, A., Bi, X., and Wang, D.: Assessment of Temperature Extremes in China Using RegCM4 and WRF, Adv. Atmos. Sci., 36, 363–377, https://doi.org/10.1007/s00376-018-8144-0, 2019.
Lawrence, D. M., Oleson, K. W., Flanner, M. G., Thornton, P. E., Swenson, S. C., Lawrence, P. J., Zeng, X., Yang, Z.-L., Levis, S., Sakaguchi, K., Bonan, G. B., and Slater, A. G.: Parameterization improvements and functional and structural advances in Version 4 of the Community Land Model, J. Adv. Model. Earth Sy., 3, M03001, https://doi.org/10.1029/2011MS00045, 2011.
Legrand, M. and Mayewski, P. A.: Glaciochemistry of polar ice cores: A review, Rev. Geophys., 35, 219–243, https://doi.org/10.1029/96RG03527, 1997.
Li, D., Oganov, A. R., Dong, X., Zhou, X.-F., Zhu, Q., Qian, G., and Dong, H.: Nitrogen oxides under pressure: stability, ionization, polymerization and superconductivity, Scientific Reports, 5, 16311, https://doi.org/10.1038/srep16311, 2015.
Li, M., Zhang, Q., Kurokawa, J.-I., Woo, J.-H., He, K., Lu, Z., Ohara, T., Song, Y., Streets, D. G., Carmichael, G. R., Cheng, Y., Hong, C., Huo, H., Jiang, X., Kang, S., Liu, F., Su, H., and Zheng, B.: MIX: a mosaic Asian anthropogenic emission inventory under the international collaboration framework of the MICS-Asia and HTAP, Atmos. Chem. Phys., 17, 935–963, https://doi.org/10.5194/acp-17-935-2017, 2017a.
Li, Q., Yang, T., and Li, L.: Quantitative assessment of the parameterization sensitivity of the WRF/Noah-MP model of snow dynamics in the Tianshan Mountains, Central Asia, Atmos. Res., 277, 106310, https://doi.org/10.1016/j.atmosres.2022.106310, 2022.
Li, R., Dong, X., Guo, J., Fu, Y., Zhao, C., Wang, Y., and Min, Q.: The implications of dust ice nuclei effect on cloud top temperature in a complex mesoscale convective system, Scientific Reports, 7, 13826, https://doi.org/10.1038/s41598-017-12681-0, 2017b.
Liu, M., Shang, F., Lu, X., Huang, X., Song, Y., Liu, B., Zhang, Q., Liu, X., Cao, J., Xu, T., Wang, T., Xu, Z., Xu, W., Liao, W., Kang, L., Cai, X., Zhang, H., Dai, Y., and Zhu, T.: Unexpected response of nitrogen deposition to nitrogen oxide controls and implications for land carbon sink, Nat. Commun., 13, 3126, https://doi.org/10.1038/s41467-022-30854-y, 2022a.
Liu, S., Geng, G., Xiao, Q., Zheng, Y., Liu, X., Cheng, J., and Zhang, Q.: Tracking Daily Concentrations of PM2.5 Chemical Composition in China since 2000, Environ. Sci. Technol., 56, 16517–16527, https://doi.org/10.1021/acs.est.2c06510, 2022b.
Logan, J. A.: Nitrogen oxides in the troposphere: Global and regional budgets, J. Geophys. Res.-Oceans, 88, 10785–10807, https://doi.org/10.1029/JC088iC15p10785, 1983.
Lu, C. and Tian, H.: Half-century nitrogen deposition increase across China: A gridded time-series data set for regional environmental assessments, Atmos. Environ., 97, 68–74, 2014.
Ma, M., Zheng, B., Xu, W., Cao, J., Zhou, K., and Zhao, Y.: Trend and Interannual Variations of Reactive Nitrogen Deposition in China During 2008–2017 and the Roles of Anthropogenic Emissions and Meteorological Conditions, J. Geophys. Res.-Atmos., 128, e2022JD037489, https://doi.org/10.1029/2022JD037489, 2023a.
Ma, M., Zheng, B., Xu, W., Cao, J., Zhou, K., and Zhao, Y.: Trend and Interannual Variations of Reactive Nitrogen Deposition in China During 2008–2017 and the Roles of Anthropogenic Emissions and Meteorological Conditions, J. Geophys. Res.-Atmos., 128, e2022JD037489, https://doi.org/10.1029/2022JD037489, 2023b.
NCAR – National Center for Atmospheric Research: WRF-Chem Source Code, NCAR [code], http://www2.mmm.ucar.edu/wrf/users/download/get_source.html (last access: 12 October 2024), 2024.
Nelson, B. S., Bryant, D. J., Alam, M. S., Sommariva, R., Bloss, W. J., Newland, M. J., Drysdale, W. S., Vaughan, A. R., Acton, W. J. F., Hewitt, C. N., Crilley, L. R., Swift, S. J., Edwards, P. M., Lewis, A. C., Langford, B., Nemitz, E., Shivani, Gadi, R., Gurjar, B. R., Heard, D. E., Whalley, L. K., Şahin, Ü. A., Beddows, D. C. S., Hopkins, J. R., Lee, J. D., Rickard, A. R., and Hamilton, J. F.: Extreme Concentrations of Nitric Oxide Control Daytime Oxidation and Quench Nocturnal Oxidation Chemistry in Delhi during Highly Polluted Episodes, Environ. Sci. Tech. Let., 10, 520–527, https://doi.org/10.1021/acs.estlett.3c00171, 2023.
Oleson, K., Lawrence, D., B, G., Flanner, M., Kluzek, E., Lawrence, P., Levis, S., Swenson, S., Thornton, E., Feddema, J., Heald, C., Lamarque, J.-F., Niu, G.-Y., Qian, T., Running, S., Sakaguchi, K., Yang, Z.-L., Zeng, X., and Zeng, X.: Technical Description of version 4.0 of the Community Land Model (CLM), National Center for Atmospheric Research, https://doi.org/10.5065/D6FB50WZ, 2010a.
Oleson, K. W., Lawrence, D. M., Bonan, G. B., Flanner, M. G., Kluzek, E., Lawrence, P. J., Levis, S., Swenson, S. C., Thornton, P. E., Dai, A., Decker, M., Dickinson, R., Feddema, J., Heald,, C. L., H., F., Lamarque, J.-F., Mahowald, N., Niu, G.-Y.,, and Qian, T., Randerson, J., Running, S., Sakaguchi, K., Slater, A., Stöckli, R., Wang, A., Yang, Z.-L., Zeng, X., and Zeng, X: Technical Description of version 4.0 of the Community Land Model (CLM), National Center for Atmospheric Research, https://doi.org/10.5065/D6FB50WZ, 2010b.
Pan, Y. P., Wang, Y. S., Tang, G. Q., and Wu, D.: Wet and dry deposition of atmospheric nitrogen at ten sites in Northern China, Atmos. Chem. Phys., 12, 6515–6535, https://doi.org/10.5194/acp-12-6515-2012, 2012.
Picard, G., Domine, F., Krinner, G., Arnaud, L., and Lefebvre, E.: Inhibition of the positive snow-albedo feedback by precipitation in interior Antarctica, Nat. Clim. Change, 2, 795–798, https://doi.org/10.1038/nclimate1590, 2012.
Poschlod, B. and Daloz, A. S.: Snow depth in high-resolution regional climate model simulations over southern Germany – suitable for extremes and impact-related research?, The Cryosphere, 18, 1959–1981, https://doi.org/10.5194/tc-18-1959-2024, 2024.
Qian, Y., Wang, H., Zhang, R., Flanner, M. G., and Rasch, P. J.: A sensitivity study on modeling black carbon in snow and its radiative forcing over the Arctic and Northern China, Environ. Res. Lett., 9, 064001, https://doi.org/10.1088/1748-9326/9/6/064001, 2014.
Toon, O. B., McKay, C. P., Ackerman, T. P., and Santhanam, K.: Rapid calculation of radiative heating rates and photodissociation rates in inhomogeneous multiple scattering atmospheres, J. Geophys. Res.-Atmos., 94, 16287–16301, https://doi.org/10.1029/JD094iD13p16287, 1989.
Wang, X.: The compiled dataset on the physicochemical properties of snow used for evaluation, Zenodo [data set], https://doi.org/10.5281/zenodo.10965532, 2024.
Wang, X. and Chen, R.: Influence of snow cover on soil freeze depth across China, Geoderma, 428, 116195, https://doi.org/10.1016/j.geoderma.2022.11619, 2022.
Wang, X., Che, T., Ruan, X., Yue, S., Wang, J., Chun, Z., and Geng, L.: xwang/wrfchem_ustc3.5: wrfchem_ustc 3.5 including nitrate concentrations in snow, Zenodo [data set], https://doi.org/10.5281/zenodo.10586762, 2024.
Wendl, I. A., Eichler, A., Isaksson, E., Martma, T., and Schwikowski, M.: 800-year ice-core record of nitrogen deposition in Svalbard linked to ocean productivity and biogenic emissions, Atmos. Chem. Phys., 15, 7287–7300, https://doi.org/10.5194/acp-15-7287-2015, 2015.
Wiedinmyer, C., Akagi, S. K., Yokelson, R. J., Emmons, L. K., Al-Saadi, J. A., Orlando, J. J., and Soja, A. J.: The Fire INventory from NCAR (FINN): a high resolution global model to estimate the emissions from open burning, Geosci. Model Dev., 4, 625–641, https://doi.org/10.5194/gmd-4-625-2011, 2011.
Wiscombe, W. J. and Warren, S. G.: A Model for the Spectral Albedo of Snow. I: Pure Snow, J. Atmos. Sci., 37, 2712–2733, https://doi.org/10.1175/1520-0469(1980)037<2712:AMFTSA>2.0.CO;2, 1980.
Xue, H., Chen, W., Li, M., Liu, B., Li, G., and Han, X.: Assessment of major ions and trace elements in snow: A case study across northeastern China, 2017-2018, Chemosphere, 251, 126328, https://doi.org/10.1016/j.chemosphere.2020.126328, 2020.
Yu, E.: High-resolution seasonal snowfall simulation over Northeast China, Chinese Sci. Bull., 58, 1412–1419, https://doi.org/10.1007/s11434-012-5561-9, 2013.
Yu, E., Hui-Jun, W., and Sun, J.: A Quick Report on a Dynamical Downscaling Simulation over China Using the Nested Model, Atmos. Oceanic Sci. Lett., 3, 325–329, https://doi.org/10.1080/16742834.2010.11446886, 2011.
Yu, G., Jia, Y., He, N., Zhu, J., Chen, Z., Wang, Q., Piao, S., Liu, X., He, H., Guo, X., Wen, Z., Li, P., Ding, G., and Goulding, K.: Stabilization of atmospheric nitrogen deposition in China over the past decade, Nat. Geosci., 12, 424–429, https://doi.org/10.1038/s41561-019-0352-4, 2019.
Yu, K., Keller, C. A., Jacob, D. J., Molod, A. M., Eastham, S. D., and Long, M. S.: Errors and improvements in the use of archived meteorological data for chemical transport modeling: an analysis using GEOS-Chem v11-01 driven by GEOS-5 meteorology, Geosci. Model Dev., 11, 305–319, https://doi.org/10.5194/gmd-11-305-2018, 2018.
Zatko, M. C., Grenfell, T. C., Alexander, B., Doherty, S. J., Thomas, J. L., and Yang, X.: The influence of snow grain size and impurities on the vertical profiles of actinic flux and associated NOx emissions on the Antarctic and Greenland ice sheets, Atmos. Chem. Phys., 13, 3547–3567, https://doi.org/10.5194/acp-13-3547-2013, 2013.
Zatko, M., Geng, L., Alexander, B., Sofen, E., and Klein, K.: The impact of snow nitrate photolysis on boundary layer chemistry and the recycling and redistribution of reactive nitrogen across Antarctica and Greenland in a global chemical transport model, Atmos. Chem. Phys., 16, 2819–2842, https://doi.org/10.5194/acp-16-2819-2016, 2016a.
Zatko, M., Erbland, J., Savarino, J., Geng, L., Easley, L., Schauer, A., Bates, T., Quinn, P. K., Light, B., Morison, D., Osthoff, H. D., Lyman, S., Neff, W., Yuan, B., and Alexander, B.: The magnitude of the snow-sourced reactive nitrogen flux to the boundary layer in the Uintah Basin, Utah, USA, Atmos. Chem. Phys., 16, 13837–13851, https://doi.org/10.5194/acp-16-13837-2016, 2016b.
Zaveri, R. A. and Peters, L. K.: A new lumped structure photochemical mechanism for large-scale applications, J. Geophys. Res.-Atmos., 104, 30387–30415, https://doi.org/10.1029/1999JD900876, 1999.
Zaveri, R. A., Easter, R. C., Fast, J. D., and Peters, L. K.: Model for Simulating Aerosol Interactions and Chemistry (MOSAIC), J. Geophys. Res.-Atmos., 113, D13204, https://doi.org/10.1029/2007JD008782, 2008.
Zhang, R., Hegg, D. A., Huang, J., and Fu, Q.: Source attribution of insoluble light-absorbing particles in seasonal snow across northern China, Atmos. Chem. Phys., 13, 6091–6099, https://doi.org/10.5194/acp-13-6091-2013, 2013.
Zhang, X. Y., Gong, S. L., Shen, Z. X., Mei, F. M., Xi, X. X., Liu, L. C., Zhou, Z. J., Wang, D., Wang, Y. Q., and Cheng, Y.: Characterization of soil dust aerosol in China and its transport and distribution during 2001 ACE-Asia: 1. Network observations, J. Geophys. Res.-Atmos., 108, 4261, https://doi.org/10.1029/2002JD002632, 2003.
Zhao, C., Liu, X., Leung, L. R., Johnson, B., McFarlane, S. A., Gustafson Jr., W. I., Fast, J. D., and Easter, R.: The spatial distribution of mineral dust and its shortwave radiative forcing over North Africa: modeling sensitivities to dust emissions and aerosol size treatments, Atmos. Chem. Phys., 10, 8821–8838, https://doi.org/10.5194/acp-10-8821-2010, 2010.
Zhao, C., Ruby Leung, L., Easter, R., Hand, J., and Avise, J.: Characterization of speciated aerosol direct radiative forcing over California, J. Geophys. Res.-Atmos., 118, 2372–2388, https://doi.org/10.1029/2012JD018364, 2013a.
Zhao, C., Chen, S., Leung, L. R., Qian, Y., Kok, J. F., Zaveri, R. A., and Huang, J.: Uncertainty in modeling dust mass balance and radiative forcing from size parameterization, Atmos. Chem. Phys., 13, 10733–10753, https://doi.org/10.5194/acp-13-10733-2013, 2013b.
Zhao, C., Hu, Z., Qian, Y., Ruby Leung, L., Huang, J., Huang, M., Jin, J., Flanner, M. G., Zhang, R., Wang, H., Yan, H., Lu, Z., and Streets, D. G.: Simulating black carbon and dust and their radiative forcing in seasonal snow: a case study over North China with field campaign measurements, Atmos. Chem. Phys., 14, 11475–11491, https://doi.org/10.5194/acp-14-11475-2014, 2014.
Zhao, Y., Zhang, L., Pan, Y., Wang, Y., Paulot, F., and Henze, D. K.: Atmospheric nitrogen deposition to the northwestern Pacific: seasonal variation and source attribution, Atmos. Chem. Phys., 15, 10905–10924, https://doi.org/10.5194/acp-15-10905-2015, 2015.
Zou, Y., Sun, P., Ma, Z., Lv, Y., and Zhang, Q.: Snow Cover in the Three Stable Snow Cover Areas of China and Spatio-Temporal Patterns of the Future, Remote Sensing, 14, 3098, https://doi.org/10.3390/rs14133098, 2022.