the Creative Commons Attribution 4.0 License.
the Creative Commons Attribution 4.0 License.
 | 17 Sep 2025
Impact of spatial resolution on multi-scenario WRF-ARW simulations driven by the CMIP6 MPI-ESM1-2-HR global model: a focus on precipitation distribution over Italy
Maria Vittoria Struglia
Alessandro Anav
Marta Antonelli
Sandro Calmanti
Franco Catalano
Alessandro Dell'Aquila
Emanuela Pichelli
Giovanna Pisacane
We present the results of downscaling CMIP6 global climate projections to local scales for the Mediterranean and Italian regions, aiming to produce high-resolution climate information for the assessment of climate change signals, with a focus on precipitation extreme events. We performed hindcast (i.e., ERA5-driven) and historical simulations (driven by the MPI-ESM1-2-HR model) to simulate the present (1980–2014) and future (2015–2100) climate under three different emission scenarios (SSP1-2.6, SSP2-4.5, SSP5-8.5).
For each experiment, a double-nesting approach is adopted to dynamically downscale global data to the regional domain of interest, firstly over the Europe (EURO) COordinated Regional climate Downscaling Experiment (CORDEX) domain, at a spatial resolution of 15 km, and then further refined (second nesting) over Italy and the northwestern Mediterranean at a resolution of 5 km, i.e., in the so-called gray zone (5–10 km), close to the convection-permitting (CP) limit. Besides validating the experimental protocol, this work potentially questions the need for climate simulations to always resort to deep convection parameterizations when spatial refinement is increased up to the limit of the CP scale, yet convective processes are still not explicitly resolved. Analyses of air temperature and precipitation are presented, with a focus on the spatial distribution of precipitation, its probability density function, and the statistics of extreme events for both current climate and far-end scenarios. By the end of the century for all the scenarios and seasons there is a projected general warming along with an intensification of the hydrological cycle over most of continental Europe and mean precipitation reduction over the Mediterranean region accompanied, over the Italian Peninsula, by a strong increase in the intensity of extreme precipitation events, particularly relevant for the SSP5-8.5 scenario during autumn.
- Article
(15722 KB) - Full-text XML
-
Supplement
(3959 KB) - BibTeX
- EndNote


In recent years, the availability of increasingly powerful computational resources has pushed regional modeling techniques to finer and finer scales, with demonstrated added value in comparison to the coarser resolution of global models, especially in complex-morphology regions (e.g., Torma et al., 2015).
Climate studies have benefited from such technological advances and regional climate projections have achieved the spatial and temporal resolution needed to assess the local impacts of climate change and climate-related risks and to support adaptation and mitigation policies (Giorgi et al., 2009; Torma et al., 2015; Giorgi et al., 2022). This represents a substantial breakthrough for the Mediterranean region, a climate hotspot characterized by a strongly heterogeneous morphology (a semi-closed basin with high and complex mountainous surroundings), which inherently demands high-resolution analyses. The region is, in fact, critically prone to the impacts of local-scale and severe weather (Rotunno and Houze, 2007; Ducrocq et al., 2014), which can dramatically affect the well-being and the economies of local communities (Rebora et al., 2013; Arrighi and Domeneghetti, 2024).
The agreed protocol for regional climate projection delivery relies on the availability of standardized global climate projections from the international Coupled Model Intercomparison Project, now in its 6th phase (CMIP6, Eyring et al., 2016).
CMIP6 state-of-the-art global projections typically have a nominal horizontal grid resolution that ranges from roughly 38 to 200 km, corresponding to a 3 to 5 times larger effective resolution (Klaver et al., 2020). The necessity to better represent local processes and teleconnections among distant regions (Mahajan et al., 2018), as well as directly providing boundary conditions to high-resolution regional climate models (RCMs) with no need for intermediate nesting (RCMs, Dickinson et al., 1989), has recently prompted very high-resolution (in the range from 120 to 20 km) coordinated global experiments in the CMIP framework (HighResMIP, Haarsma et al., 2016). These efforts have proven to be too demanding in terms of computational and storage resources, so dynamical downscaling via RCMs still constitutes the most viable solution to describe the complex phenomena (Feser et al., 2011) and mesoscale interactions that emerge over complex-morphology regions such as the Mediterranean (Doblas-Reyes et al., 2021).
As a matter of fact, IPCC AR6 acknowledged that regional climate projections now provide increasingly robust and mature information to feed climate services and impact studies at the necessary high resolution (Ranasinghe et al. 2023). RCMs are similar to global climate models (GCMs) in terms of model architecture, but they are applied over limited areas and implemented as a boundary condition problem, with boundary information usually provided by a driving GCM. RCMs can both provide subcontinental climate information and improve process understanding. In analogy to the CMIP initiative, the COordinated Regional climate Downscaling Experiment (CORDEX) (Giorgi et al., 2009; Giorgi and Gutowski, 2015) provides a multi-model ensemble of present climate and future projections for different regions of the planet. Typical resolutions for the CORDEX models range from 50 to 10 km. The CORDEX experiments cover 14 different regions, including the European region (EURO-CORDEX) and the Mediterranean region (MED-CORDEX, Ruti et al., 2016).
While the resolution of RCMs indeed improves the dynamical representation of atmospheric processes, sub-grid processes still need to be parameterized. In particular, convection by cumulus clouds exhibits a continuous energy spectrum across kilometer scales without apparent scale separation (Wyngaard, 2004; Moeng et al., 2010), prompting a sustained effort to further increase resolution in both weather and climate simulations up to an ideal limit that balances model accuracy and computational requirements (Prein et al., 2015). Convection plays a crucial role in vertically redistributing heat and moisture, thus modulating the vertical structure of the atmosphere and its stability and interacting with mesoscale dynamics. It triggers major impact drivers, such as heavy precipitation, windstorms, and floods, whose representation is essential for environmental risk assessments. Nevertheless, its parameterization constitutes a major source of uncertainty in model projections (Foley, 2010; Ban et al., 2014), and bypassing it by explicitly representing all the involved spatial scales, from kilometers to (ideally) tens of meters, is indeed an attractive solution. The added value of resolving the convection-permitting (CP) scale has been demonstrated in terms of both local circulation and land–atmosphere interaction description (Coppola et al., 2020; Lucas-Picher et al., 2021; Ban et al., 2021; Soares et al., 2024; Sangelantoni et al., 2024; Belušić Vozila et al., 2023), as well as the capability of convection-permitting models (CPMs) to improve the representation of precipitation extremes (Pichelli et al., 2021), allowing the investigation of their sensitivity to global warming. In multi-model studies, heavy precipitation events are in fact found to propagate farther and faster at the end of the century in an RCP8.5 warming scenario, with an increase in precipitation volumes, hit area, and severity (Muller et al., 2024; Caillaud et al., 2024). In particular, Fosser et al., (2024) found that the CORDEX-FPSCONV CPM ensemble (Coppola et al., 2020) reduces model uncertainties by more than 50 % compared to lower-resolution models due to the more realistic representation of local dynamical processes.
On the other hand, regional climate simulations typically span several decades and comparatively large domains and can still prove very expensive in terms of computational resources (Fuhrer et al., 2018), even limiting grid spacing at the upper edge of the so-called gray zone. While cloud-scale and updraft statistics only converge for scales of the order of tens of meters (Jeevanjee 2017; Panosetti et al., 2018, 2019) and storm morphology is still resolution-dependent below 1 km (Hanley et al., 2015), it is generally assumed that deep convection at least is permitted for horizontal grid spacing between 1 and 4 km (Weisman et al., 1997; Hohenegger et al., 2008, Kendon et al., 2017; Prein et al., 2015). The gray zone spans the 4–10 km range, where the performance of convection parameterization is critically scale-dependent, scheme assumption violations can potentially be induced, and the optimal resolution at which it is preferable to turn it off needs to be assessed (Vergara-Temprado et al., 2020).
As a matter of fact, high-resolution (6 km) and very high-resolution (2 km) reanalyses over the European region have shown that a grid spacing of 6 km is already sufficient to reproduce precipitation accumulation comparable to point observations, at least for accumulation times larger than 1 h (Wahl et al., 2017), although the higher-resolution dataset improves point-to-point comparison due to the combined effects of data assimilation techniques, grid refinement, and explicit convection. It is, in fact, generally difficult to assess the relative weight of simultaneously implemented improvements in cross-resolution comparisons (Vergara-Temprado et al., 2020).
However, due to the computational effort required to produce climate simulations at convection-permitting scales, compromises have so far been made on both the computational domain and the time length of the simulations (see, for example, the protocol in Coppola et al., 2020). In order to produce sufficiently robust statistics for use in national risk assessment plans, both of these limitations must therefore be overcome. One possible compromise is to venture into the so-called gray zone for the convective schemes. This choice may enable coverage of domains of regional interest and still allow for simulations, whether reference or projections, that are long enough to give some robustness to the statistics of extreme events as well. In any case, one should be cautious in order not to run into ambiguous results due to the use of parameterizations that are not suitable for the scale at which one is working (Prein et al., 2015). These cautions should be extended not only to the parameterization of convection but also to the related ones of microphysics and the planetary boundary layer (Jeworreck et al., 2019). The Weather Research and Forecasting model with the Advanced Research core (AR-WRF, Skamarock and Kemp, 2008) provides a wide suite of parameterizations to choose from, including the scale-aware ones that have proved effective in managing the transition to more resolved scale in many tests (Liu et al., 2011; Jeworreck et al., 2019; Park et al., 2024).
In this context we present results from an evaluation run (ERA5 driven) and from a coherent set of high-resolution multi-scenario climate simulations (present climate, SSP1-2.6, SSP2-4.5, and SSP5-8.5, O'Neill et al., 2016) obtained by applying a double-nesting technique to dynamically downscale the global CMIP6 MPI-ESM1-2-HR projections. The Weather Research and Forecasting model (WRF) is used, first over the EURO-CORDEX domain, at a horizontal spatial resolution of 15 km and then over inner domain at a finer grid covering the whole of Italy and extending to the northwestern Mediterranean at a resolution of 5 km, i.e., within a grid step range in the gray zone for the cumulus representation. Future scenarios continuously extend from the present time to 2100.
The paper is organized as follows. Section 2 presents the model characteristics and describes the protocol adopted, as well as the independent datasets used for the evaluation. Section 3 is dedicated to the evaluation analysis of the reanalysis-driven simulations. Section 4 deals with the results of the scenario simulations; all the codes used to generate the original figures in Sects. 3 and 4 are available (Struglia, 2025). Conclusions are summarized in Sect. 5.
We produce a coherent set of high-resolution multi-scenario climate simulations based on the WRF-ARW version 4.2.2 (Skamarock and Kemp, 2008). The model configuration was chosen partly in accordance with the guidelines provided by the WRF modeling community for the coordinated runs in the context of the EURO-CORDEX CMIP6 protocol. The WRF community adopted these guidelines to perform evaluation and scenario simulations driven by different global climate models and to facilitate the exchange and use of data, also as boundary conditions for higher-resolution models.
We use a double-nested domain strategy to downscale the coarse global CMIP6 data from a regional domain, covering the whole of Europe, to a fine spatial scale domain centered over Italy (as represented in Fig. 1 through orography).
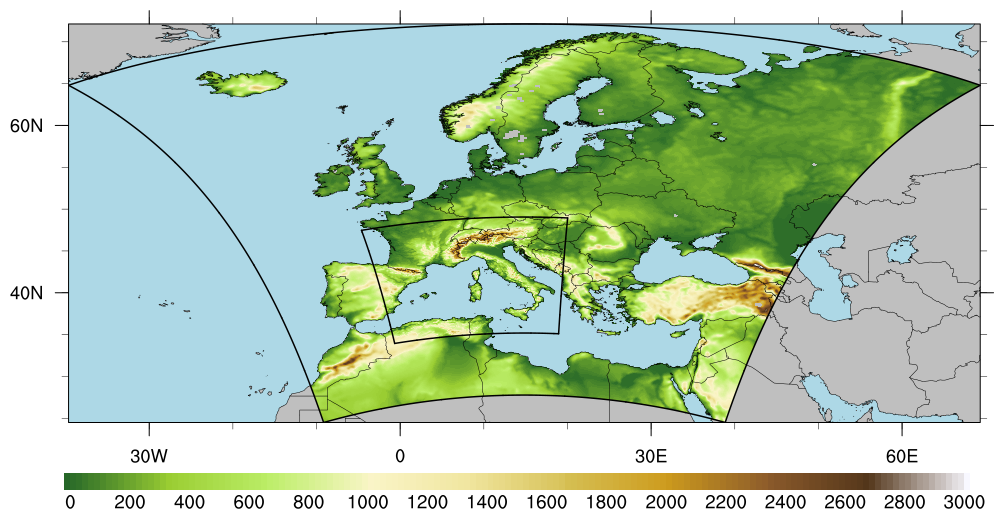
Figure 1Model domains used for the downscaling with the WRF regional model: European domain (D01 – 15 km), national domain (D02 – 5 km). Colors represent the orography of the region.
The double-nesting approach consists of performing regional downscaling of a global simulation through the use of two domains with increasing spatial resolution: the parent simulation, at an intermediate resolution between the global model one and the finest one, provides initial and boundary conditions to the finest-resolution experiment at the innermost level (i.e., child simulation). This approach is widely used to gradually enhance the grid resolution over a region of interest and it is demonstrated to be particularly useful over regions with complex morphology and orography (Im et al., 2006; Ji and Kang, 2013); it is an extension over multiple levels of nesting of the widely used regionalization technique based on dynamical downscaling with a regional climate model (Giorgi et al., 2001; Giorgi, 2019). This approach allows performing a progressive downscaling on a given region, from the original resolution of a global model (of the order of 100 km) to the finer resolutions recommended for regional applications and impact studies, while better dealing with the local forcings and interactions (e.g., complex topography, coastlines, and land use). The use of increasing resolutions allows the system to develop its own dynamics at the intermediate scales that will feed the high-resolution model, as well as to avoid numerical instabilities and unreliable results.
In the current work the parent simulation (D01 in Fig. 1) has a horizontal grid step of 15 km, while the innermost nested domain D02 has a resolution of 5 km. Both domains use a Lambert conformal projection. The resolution of the inner domain falls in the so-called gray zone for the representation of deep convection: this choice enables us to cover relatively wide-sized domains of regional interest and still allows for transient simulations, whether historical or projections, that are long enough to give some robustness to the climate-scale statistics, especially of extreme events. In any case, one should be cautious in order not to run into ambiguous results due to the use of parameterizations that are not suitable for the simulation resolution. In this context, the Weather Research and Forecasting model with the Advanced Research core (WRF-ARW, Skamarock and Kemp, 2008) provides a wide suite of parameterizations, including scale-aware ones that have proved effective in managing the transition to more resolved scale (Liu et al., 2011; Jeworreck et al., 2019; Park et al., 2024). Table 1 summarizes the configuration implemented for the experiments described in this work.
Table 1Main parameterizations adopted for the downscaling with WRF regional model.
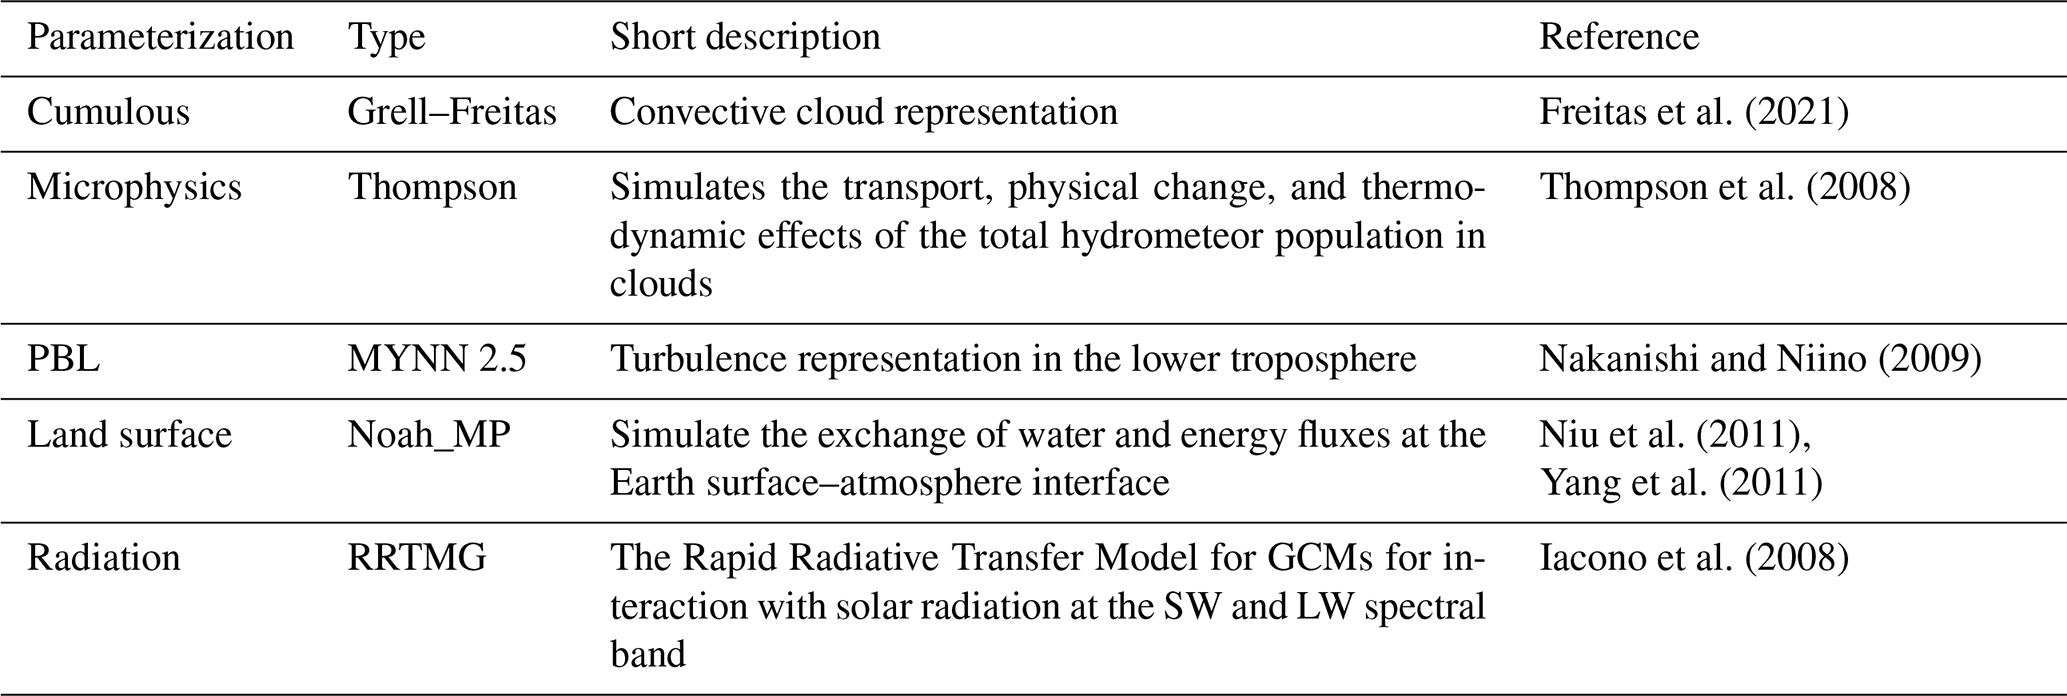
For the representation of deep convection, we have implemented the Grell–Freitas cumulus parameterization (Grell and Freitas, 2014; Freitas et al., 2021) (see Table 1).
Although there is not a universal recipe for the sub-grid physics configuration and the choice may strongly depend on the specific case and region of interest (for a review see, for example, the introduction of Jeworrek et al., 2019), there is consensus in the adoption of a scale-aware parameterization of convection such the Grell–Freitas one (Grell and Freitas, 2014; Freitas et al., 2021; Jeworrek et al., 2019; Park et al., 2024) for experiments dedicated to investigating the benefits of increasing the grid resolution.
To assess the performances of the model in both the regional and fine-spatial-scale domains, a hindcast simulation forced by ERA5 reanalysis (Hersbach et al., 2020) has been produced for the period 1980–2023.
Historical and three future scenario simulations (SSP1-2.6, SSP2-4.5, SSP5-8.5; Eyring et al., 2016; O'Neill et al., 2016) have been produced by downscaling the CMIP6 MPI-ESM1-2-HR (Gutjahr et al., 2019), which has a grid of T127 (0.93° or ∼ 103 km). Among all the available CMIP6 models, in addition to the relatively high spatial resolution, we selected the MPI-ESM1.2-HR as it has a well-balanced radiation budget and its climate sensitivity is explicitly tuned to 3 K (Müller et al., 2018), making this model well suited for prediction and impact studies.
The present climate experiment (historical) covers a period of 35 years, nominally from 1980 to 2014 (overlapping a large part of the hindcast simulation), while future climate simulations span the period 2015–2100.
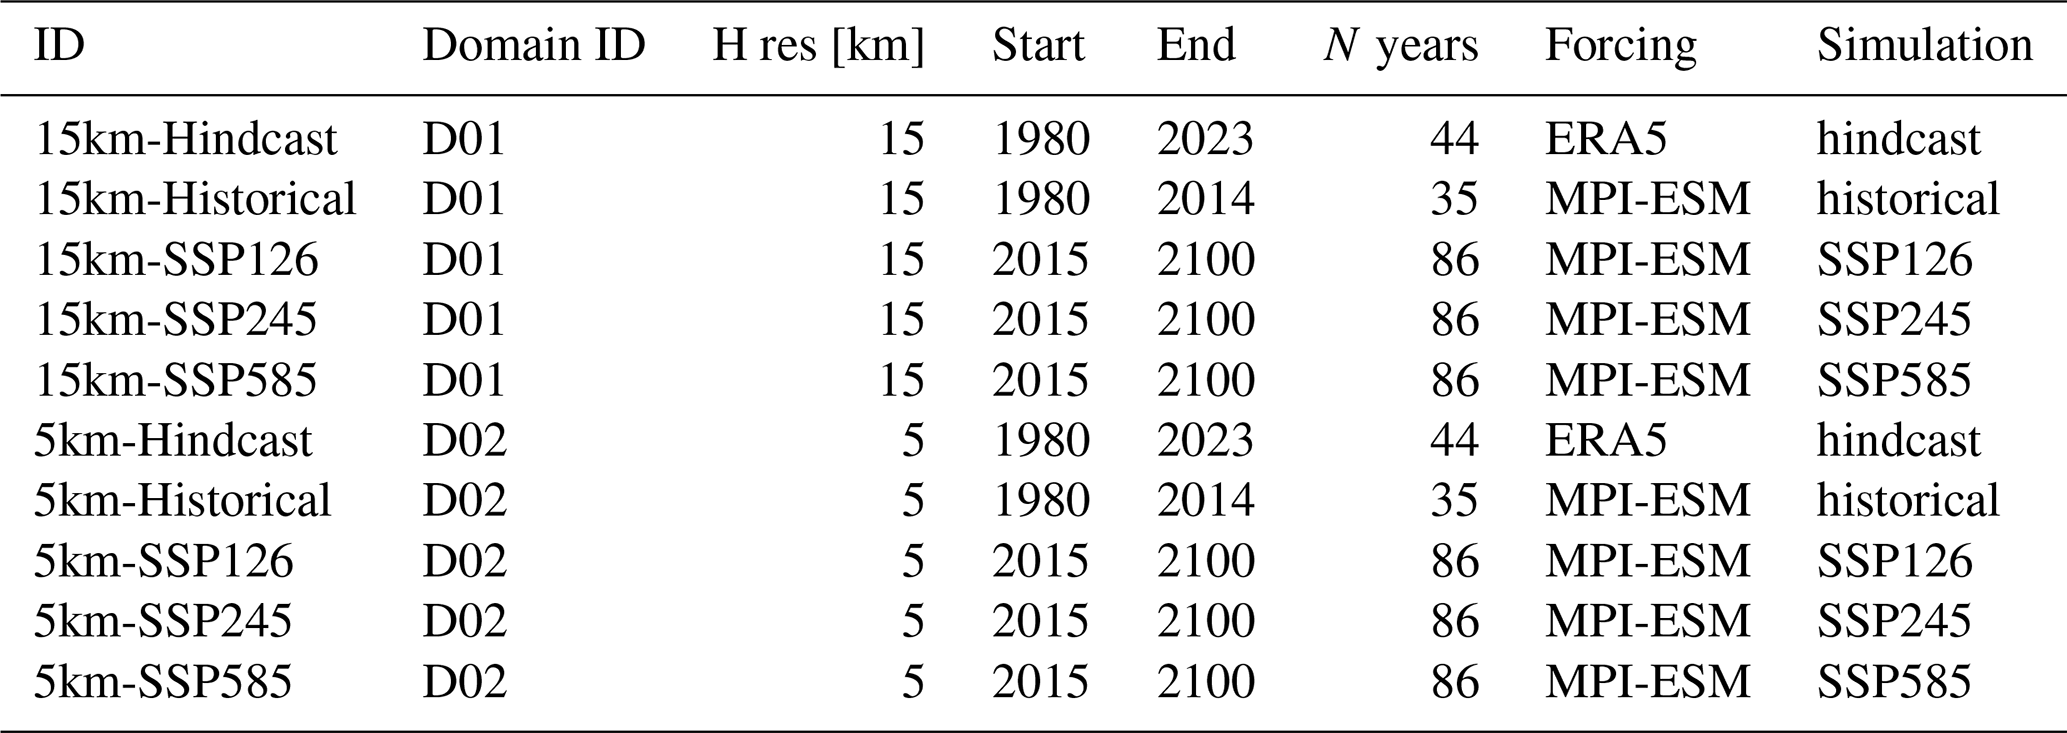
Table 2 synthetically shows the newly produced simulations, providing some details. For each simulation an identification of the experiment has been assigned, and domain, resolution, and length are listed.
Table 2Overview of the newly produced CMIP6 simulations with the RCM, according to the adopted protocol.
For the evaluation we use the following benchmarks: E-OBS (Cornes et al., 2018), which is a daily gridded land-only observational dataset over Europe at 11 km resolution, and the hindcast driving ERA5 reanalysis data (25 km) and two other reanalysis products, namely ERA5-land (11 km, Muñoz-Sabater et al., 2021) and CERRA (5 km, Ridal et al., 2024). The latter is comparable, in terms of its resolution and use of convection parameterization, to our highest-resolution simulation (D02).
In the following subsections, we evaluate the hindcast simulations by analyzing both the climatology and interannual variability of the near-surface temperature (T2m) and of the total daily precipitation (P) and comparing the results with available observational datasets and/or independent reanalysis datasets. These variables are chosen because they affect a wide variety of processes with important implications for natural ecosystems and human society.
Although the hindcast simulations are available for the period 1980–2023, we perform the evaluation over the common period among the different datasets used as benchmarks, i.e., 1984–2014.
3.1 Climatology and interannual variability
In order to quantify the climatological biases of the 15km-Hindcast experiment across its entire domain, we computed the mean seasonal cycles over the PRUDENCE European geographical subregions (Christensen and Christensen 2007), which are commonly used as standard regions for the evaluation of the EURO-CORDEX climate simulations (e.g., Kotlarski et al., 2014): British Islands (BI), Iberian Peninsula (IP), France (FR), Middle Europe (ME), Scandinavia (SC), Alps (AL), Mediterranean (MD), and Eastern Europe (EA). The D01 domain covers all these regions, while only the Alps domain entirely falls within the D02 area. Figures 2 and 3 respectively show the seasonal cycles of temperature and precipitation on each PRUDENCE subdomain for the 15km-Hindcast simulation. The seasonal cycle derived from the ERA5 dataset (driver) is also shown for comparison. Results indicate that the 15km-Hindcast simulation closely follows the driver's seasonal mean curve of T2m and P. In particular, the temperature bias of the downscaled model is within 0.5–1.5 °C over all the subdomains considered on an annual basis, with more evident deviations in winter months. Moreover, the model performs fairly in the Mediterranean domain. Precipitation seasonal cycles show a systematic wet bias with respect to the driver across the whole year over some subregions, like France and the Alps, while in the other subregions (ME and EA) the bias peaks during the warm season. However, such biases are mostly within 1 mm d−1, only exceeded in the JJA season in the Eastern Europe subdomain.
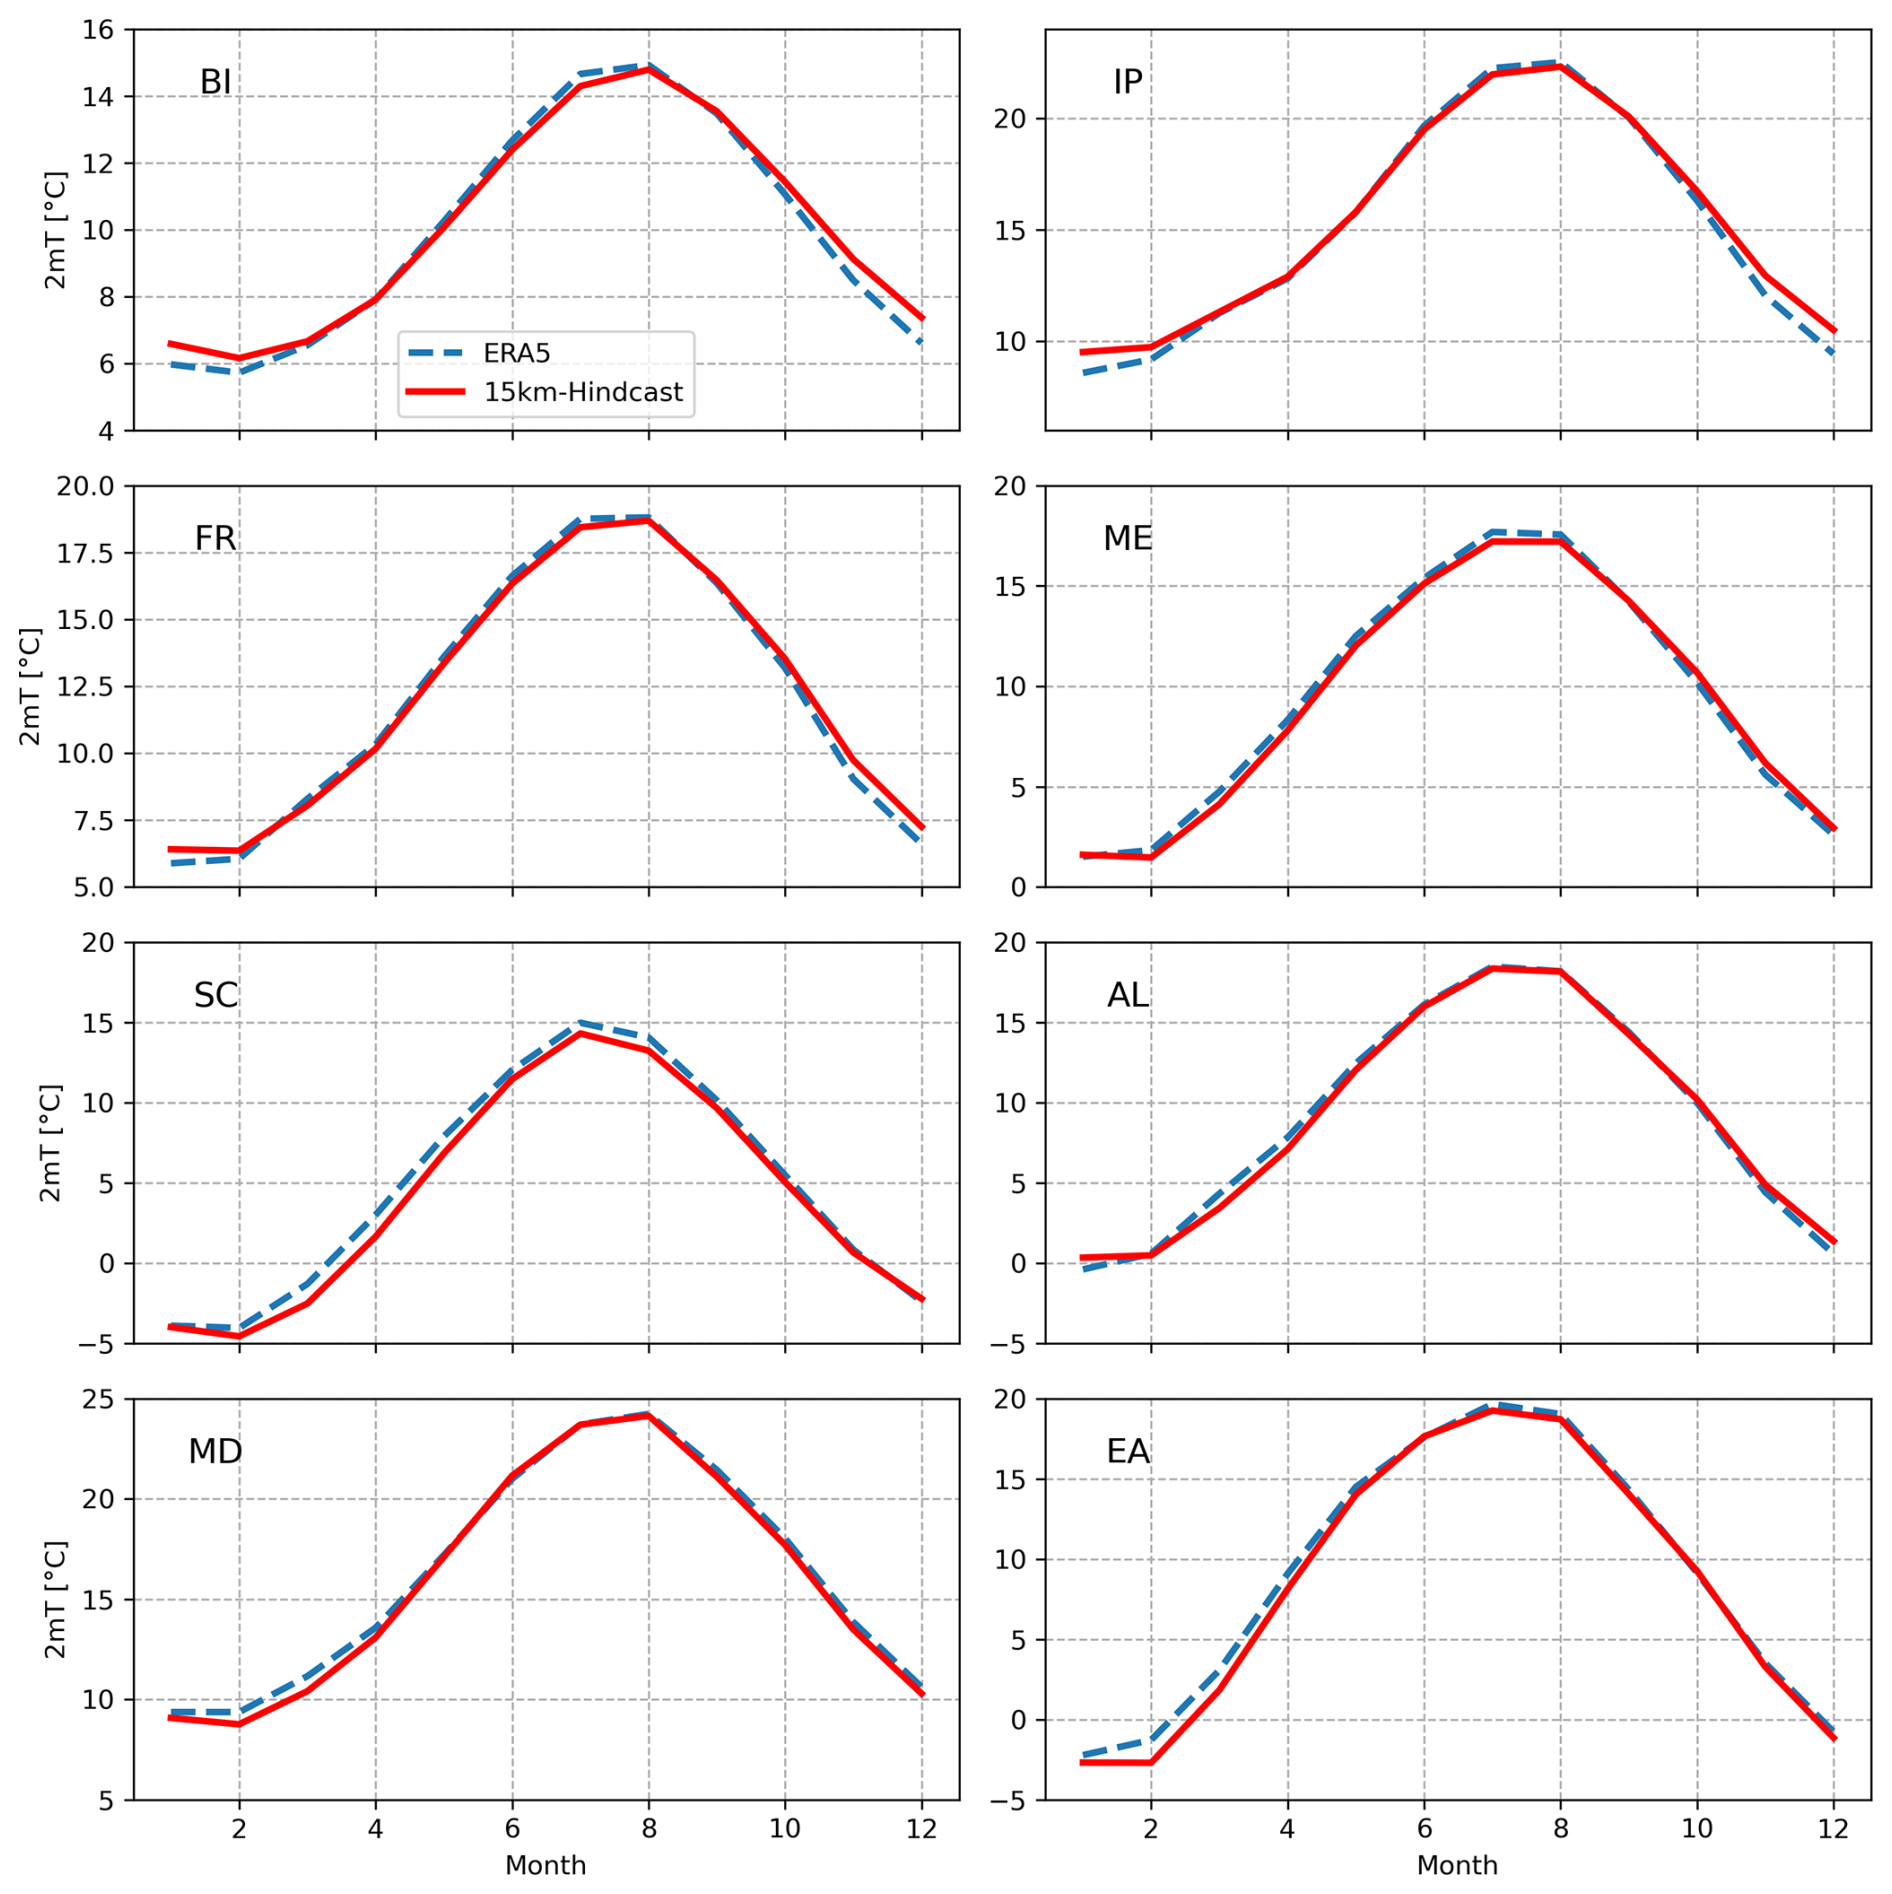
Figure 2Seasonal cycle of the T2m (°C) on the PRUDENCE subdomains: ERA5 reanalyses (blue dashed line) and 15km-Hindcast simulation (red solid line).
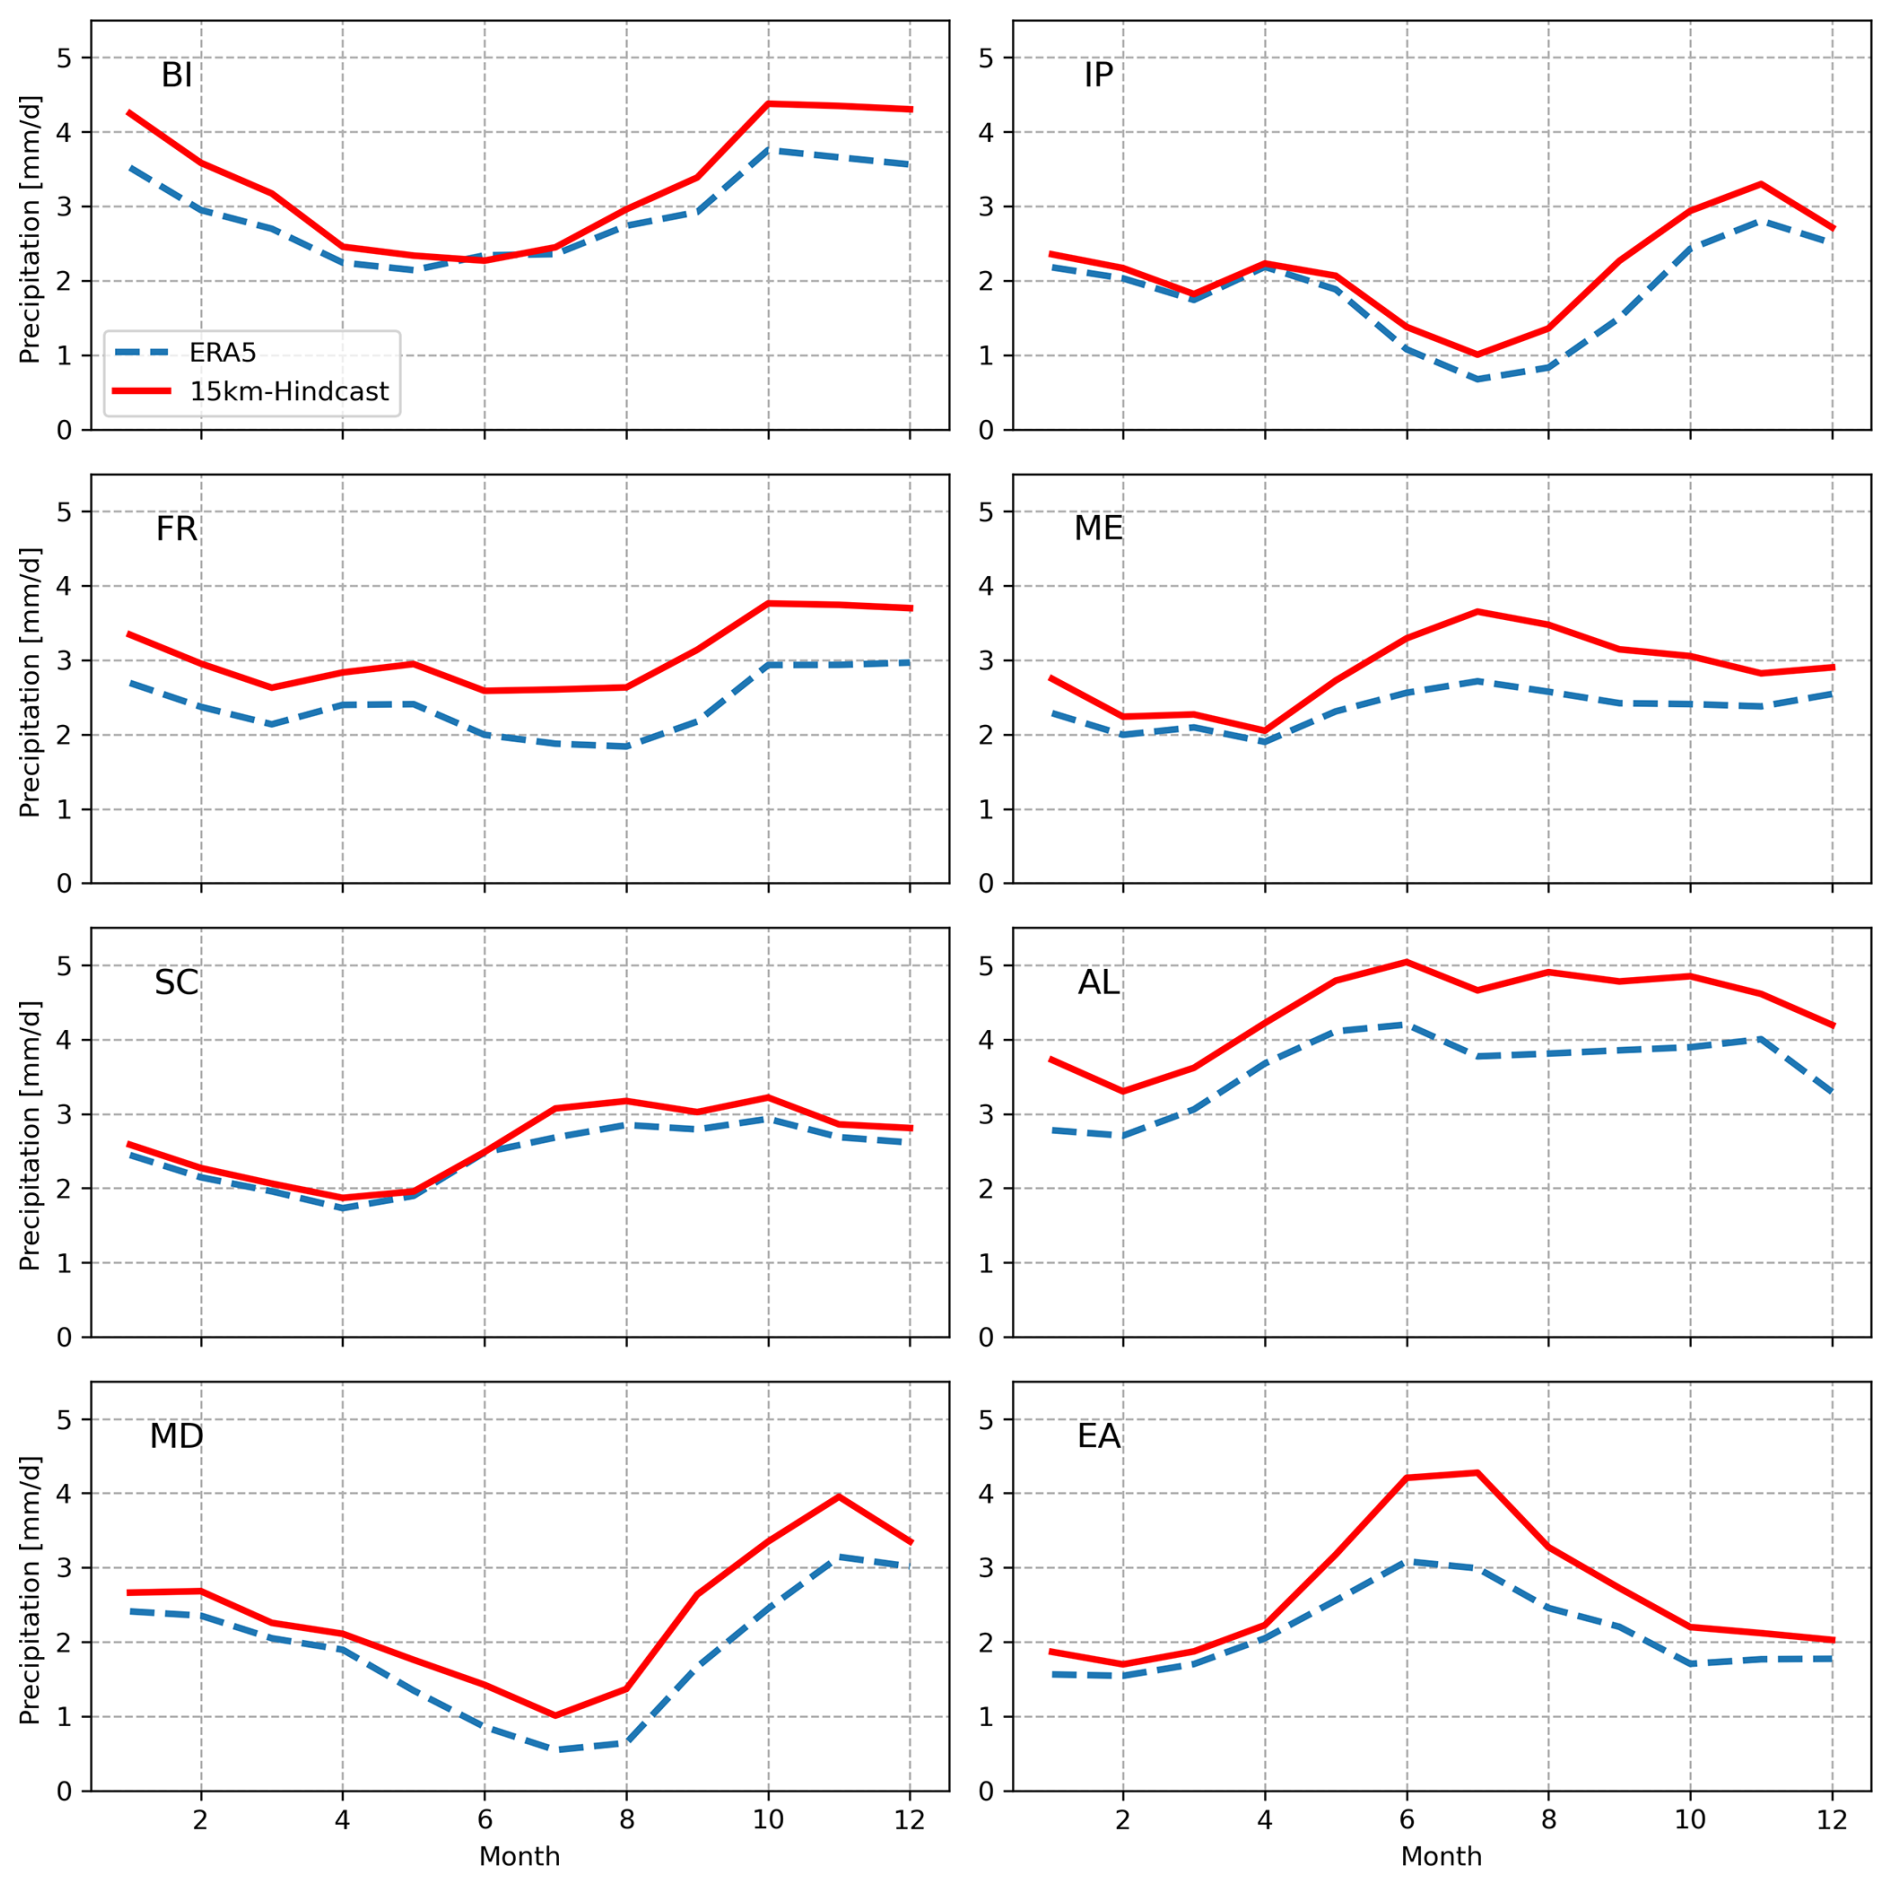
Figure 3Seasonal cycle of the total precipitation P (mm d−1) on the PRUDENCE subdomains: driving ERA5 reanalysis (blue dashed line) and hindcast simulation (15km-Hindcast, red solid line).
To investigate the effect of increasing the resolution, we compute the mean seasonal bias, i.e., the differences of the seasonal means of T2m and P against E-OBS, for the two simulation domains.
All the fields have been re-gridded to the coarsest resolution of 15 km. Figure 4 shows in the first column the seasonal means of T2m and P, derived from the reference observational dataset E-OBS. Data are shown only over land due to the E-OBS availability and over the common area of the D02 domain. The second and third columns represent the model bias of the seasonal average against the observations for the 15km-Hindcast and 5km-Hindcast simulations, respectively.
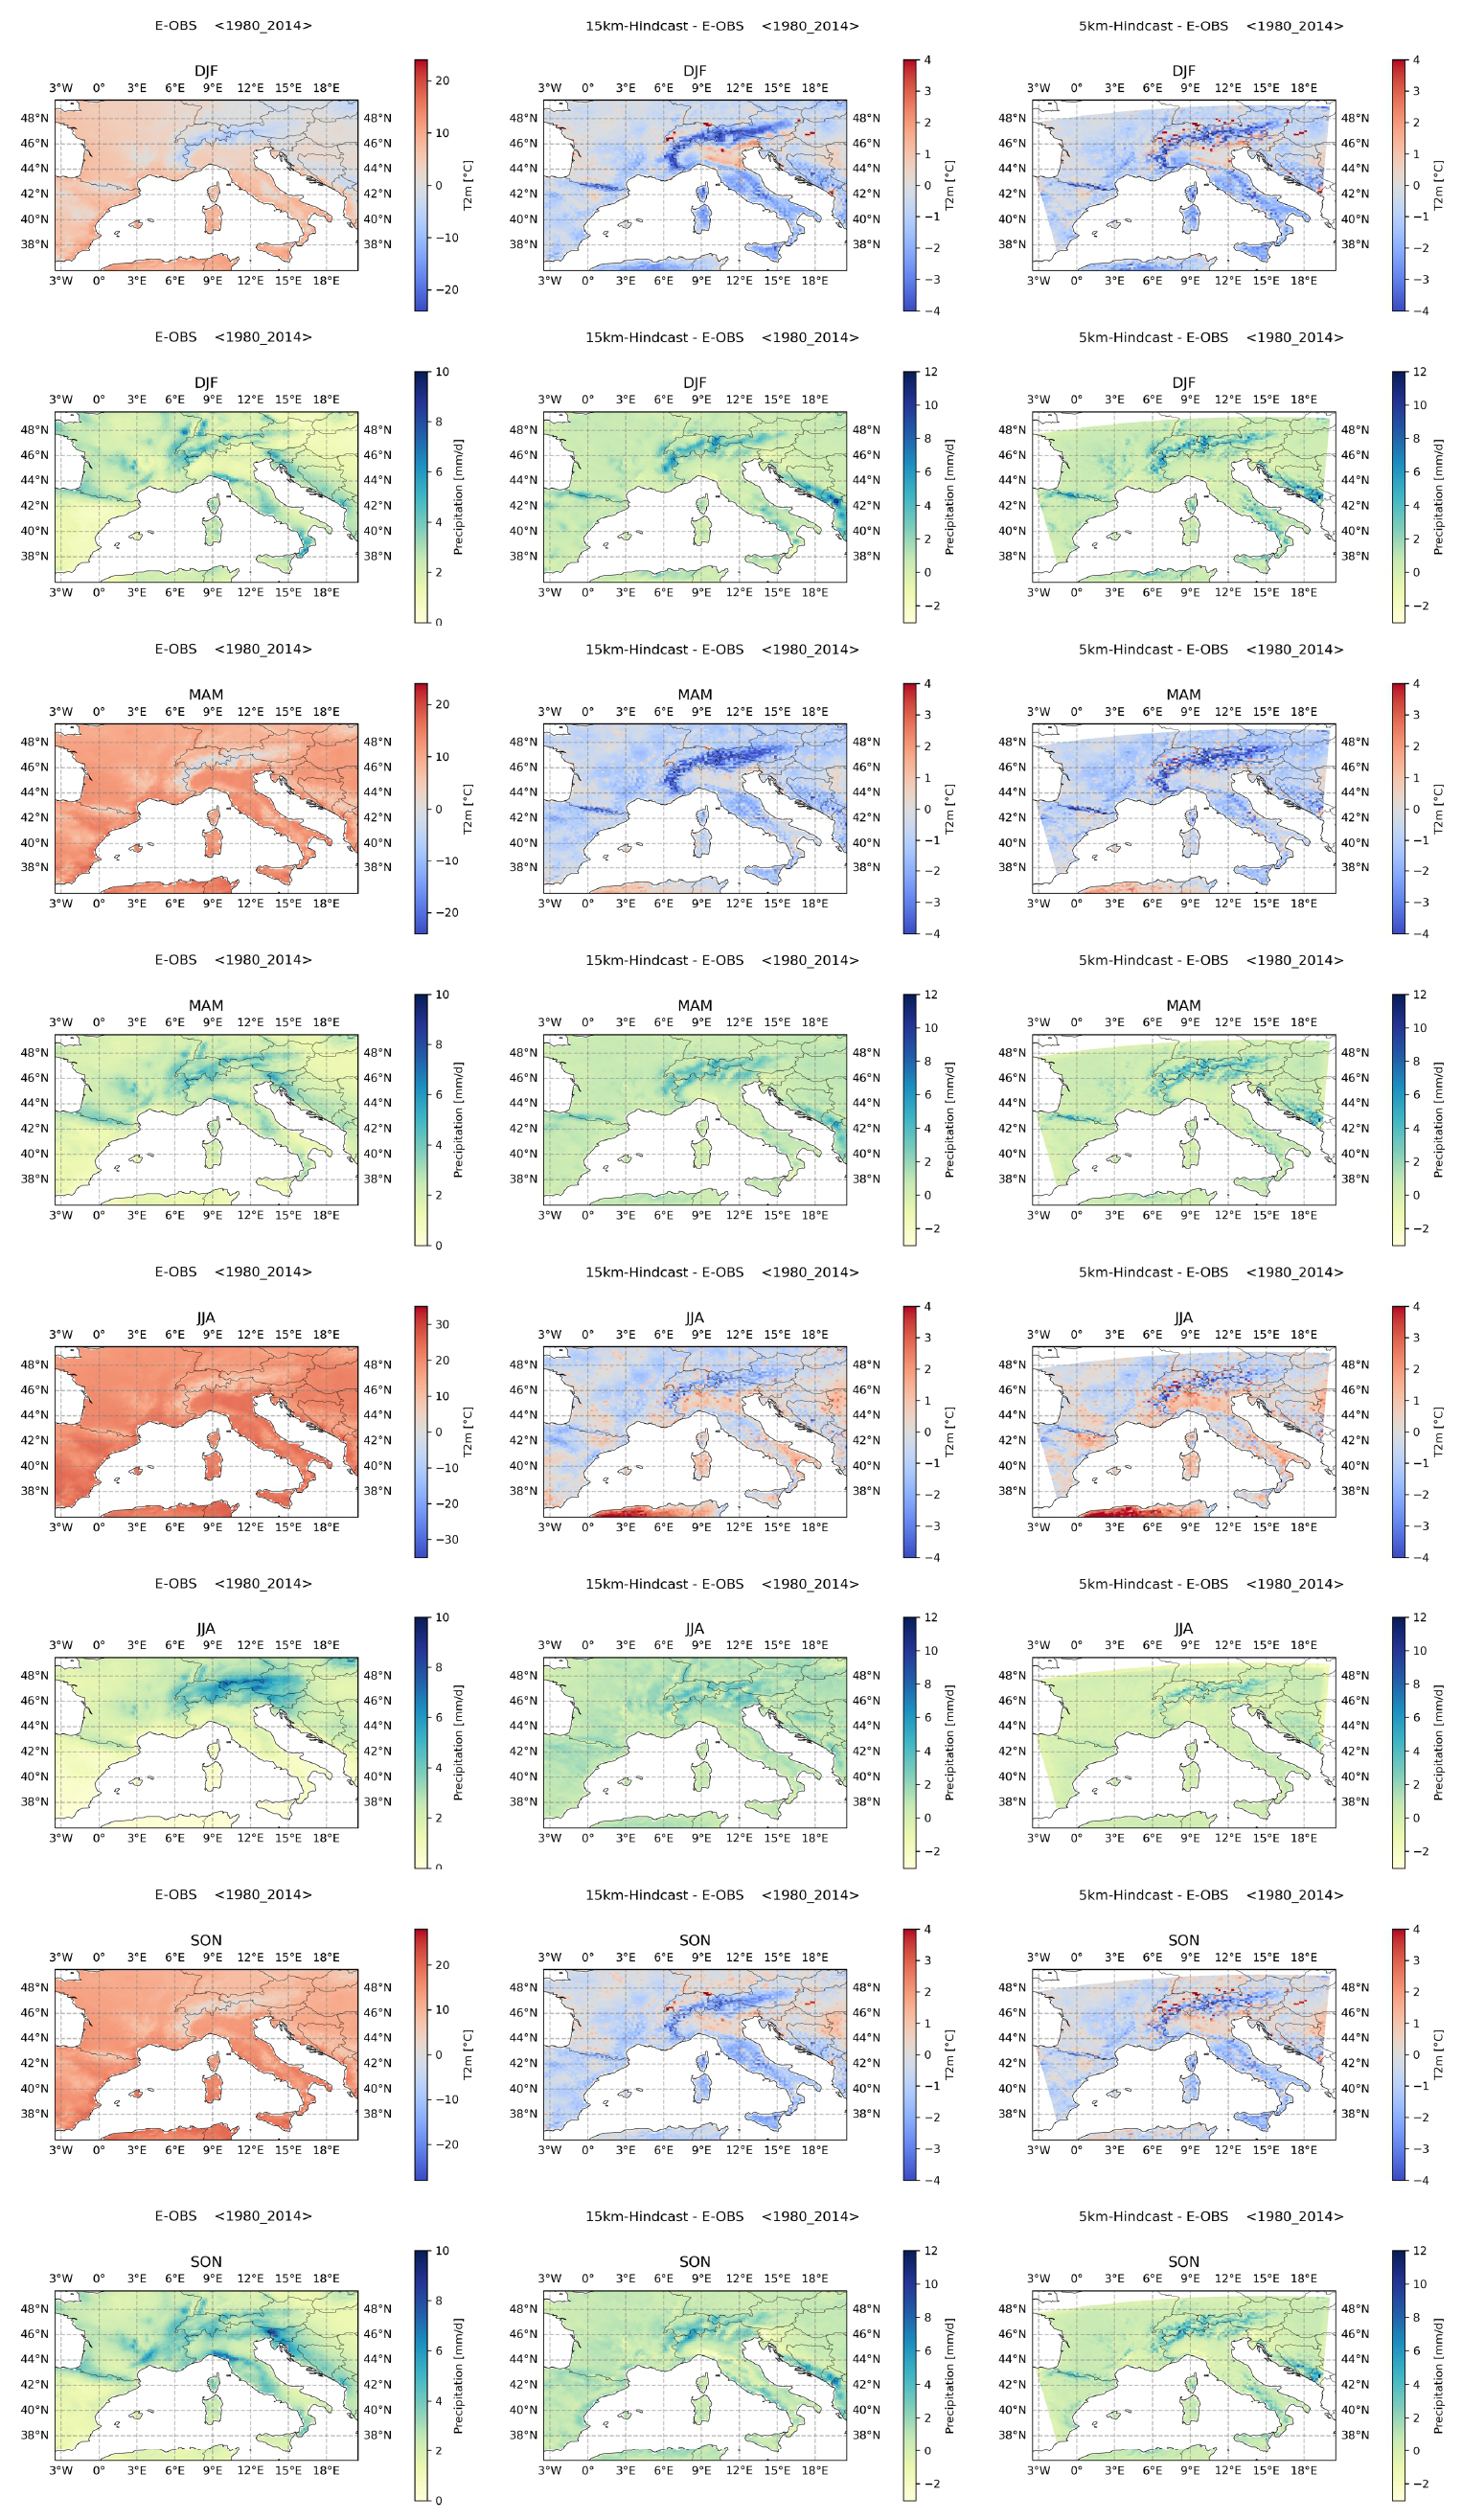
Figure 4Seasonal model bias (second and third columns) with respect to E-OBS (first column) of T and P for the D01 and D02 hindcast experiments. The rows represent DJF, MAM, JJA, and SON seasons.
There is a prevailing cold bias in each season within 2 °C, although greater values are reached in mountainous regions. Conversely, a warm bias is evident over plain regions, especially in the Po Valley (southern flank of the Alps in northern Italy). Increasing the resolution, we observe a slight reduction of the temperature bias.
The improvement is much more evident for the precipitation field, especially in the summer season, when the effects of convective precipitation are expected to be more relevant; the positive bias of 15km-Hindcast with respect to observation is clearly reduced in 5km-Hindcast, showing the added value of the double-nesting procedure with increased resolution. A slight overestimation of P is still evident over the orography across the Alpine region.
Figure 5 shows the precipitation seasonal cycle averaged over the AL subregion for both the downscaling domains against ERA5, E-OBS, and CERRA datasets. Sea points falling in the domain have been masked out. The three reference datasets are quite close to each other over the whole annual cycle, falling within a range that does not exceed 1 mm d−1. The 15km-Hindcast experiment (red line/diamond symbols) has a wet bias with respect to all the reference datasets throughout the year of the order of 1 and 2 mm d−1 compared to ERA5 (arrow symbols) and E-OBS (square symbols), respectively. The 5km-Hindcast curve (orange line/dot symbols) reproduces a better seasonal variability characterized by the two relative maxima during spring and autumn, and it is closer to the observations, especially in summer, clearly reducing the biases compared to its 15km-Hindcast driver within May and October.
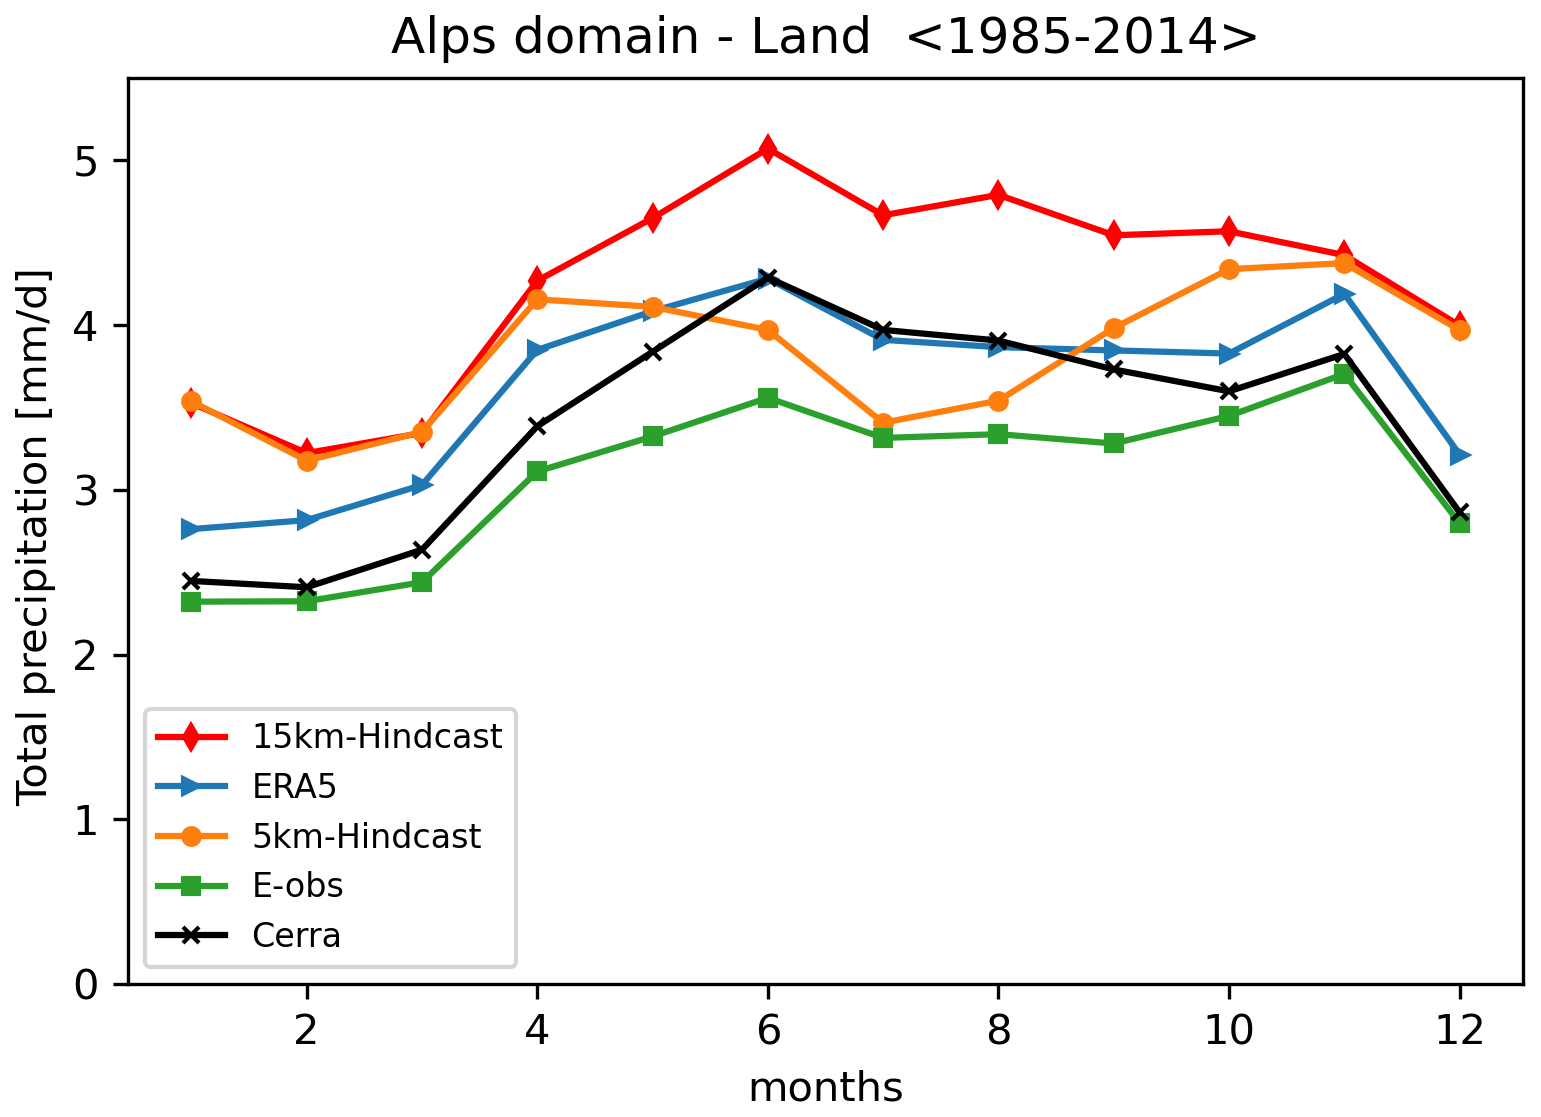
Figure 5Seasonal variability of P over the Alps domain (AL) averaged over land only. Experiments 15km-Hindcast (red/diamonds) and 5km-Hindcast (orange/dots). Reference datasets: ERA5 (blue/arrows), E-OBS (green/squares), and CERRA (black/crosses).
In Fig. 6 we analyze in detail how the two contributions to the total daily precipitation are produced by the schemes of cumulus and microphysics in the hindcast simulations. In the 15km-Hindcast (red), the seasonal cycles of the precipitation parameterized by the convection scheme (solid line) and the component coming from the microphysics scheme (dashed) and explicitly resolved have maxima of the same order of magnitude, although in different seasons, as expected. By comparison with the 5km-Hindcast curves (orange) and keeping in mind the results in Fig. 5, we can speculate that an overestimation of the contribution coming from the cumulus parameterization during summer is the cause of the wet bias in the 15km-Hindcast. On the other hand, the contribution of the convective parameterized precipitation in the 5km-Hindcast (orange solid curve) is 1 order of magnitude lower than the one at coarse resolution for every month of the year, thus signifying that most of the precipitation, either large-scale or convective, is explicitly resolved. This suggests that the model in the gray zone due to the scale-aware behavior implemented in the Grell–Freitas scheme (Freitas et al., 2021) mimics a convection-permitting model, smoothing the transition from sub-grid (cumulus) to resolved scale (microphysics) with increasing resolution (Jeworrek et al., 2019).
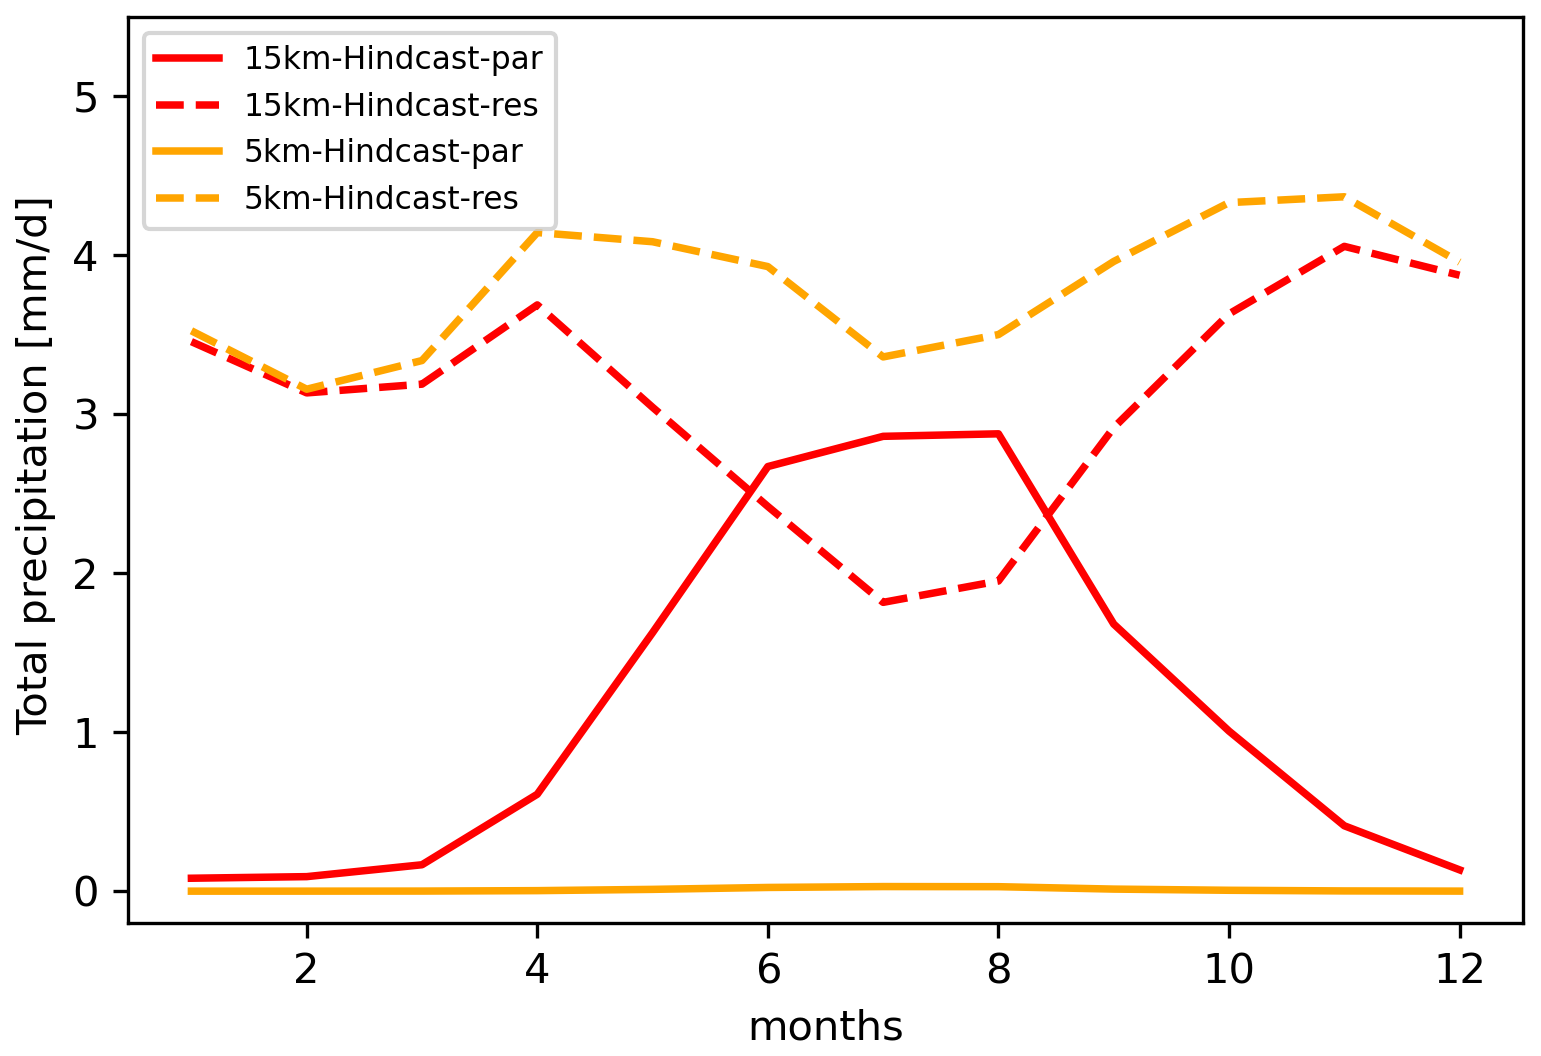
Figure 6Partitioning of the total precipitation among parameterized (par) and resolved (res) ones for the two hindcast experiments.
Figure 7 shows the interannual variability of the daily precipitation over the Alps domain. The other PRUDENCE domains have also been analyzed for the 15km-Hindcast simulation but are not shown for brevity. It is worth noting that the 15km-Hindcast simulation closely follows its driver in terms of T2m with biases within 0.5 °C, more evident over the IP (overestimation) and the SC, MD, and EA subregions (underestimation). Also in terms of precipitation the 15km-Hindcast closely follows ERA5, with only a slight overestimation tendency within 1 mm d−1 for most of the subregions. The highest wet bias is reached in the Alps region (Fig. 7); however, the bias does not exceed 1 mm d−1 along the whole time series with respect to its driver and 2 mm d−1 with respect to the E-OBS dataset. The model bias is considerably reduced in the 5km-Hindcast experiment and mainly attributable to the bias reduction over the spring to fall period discussed for the annual cycle (Fig. 5).
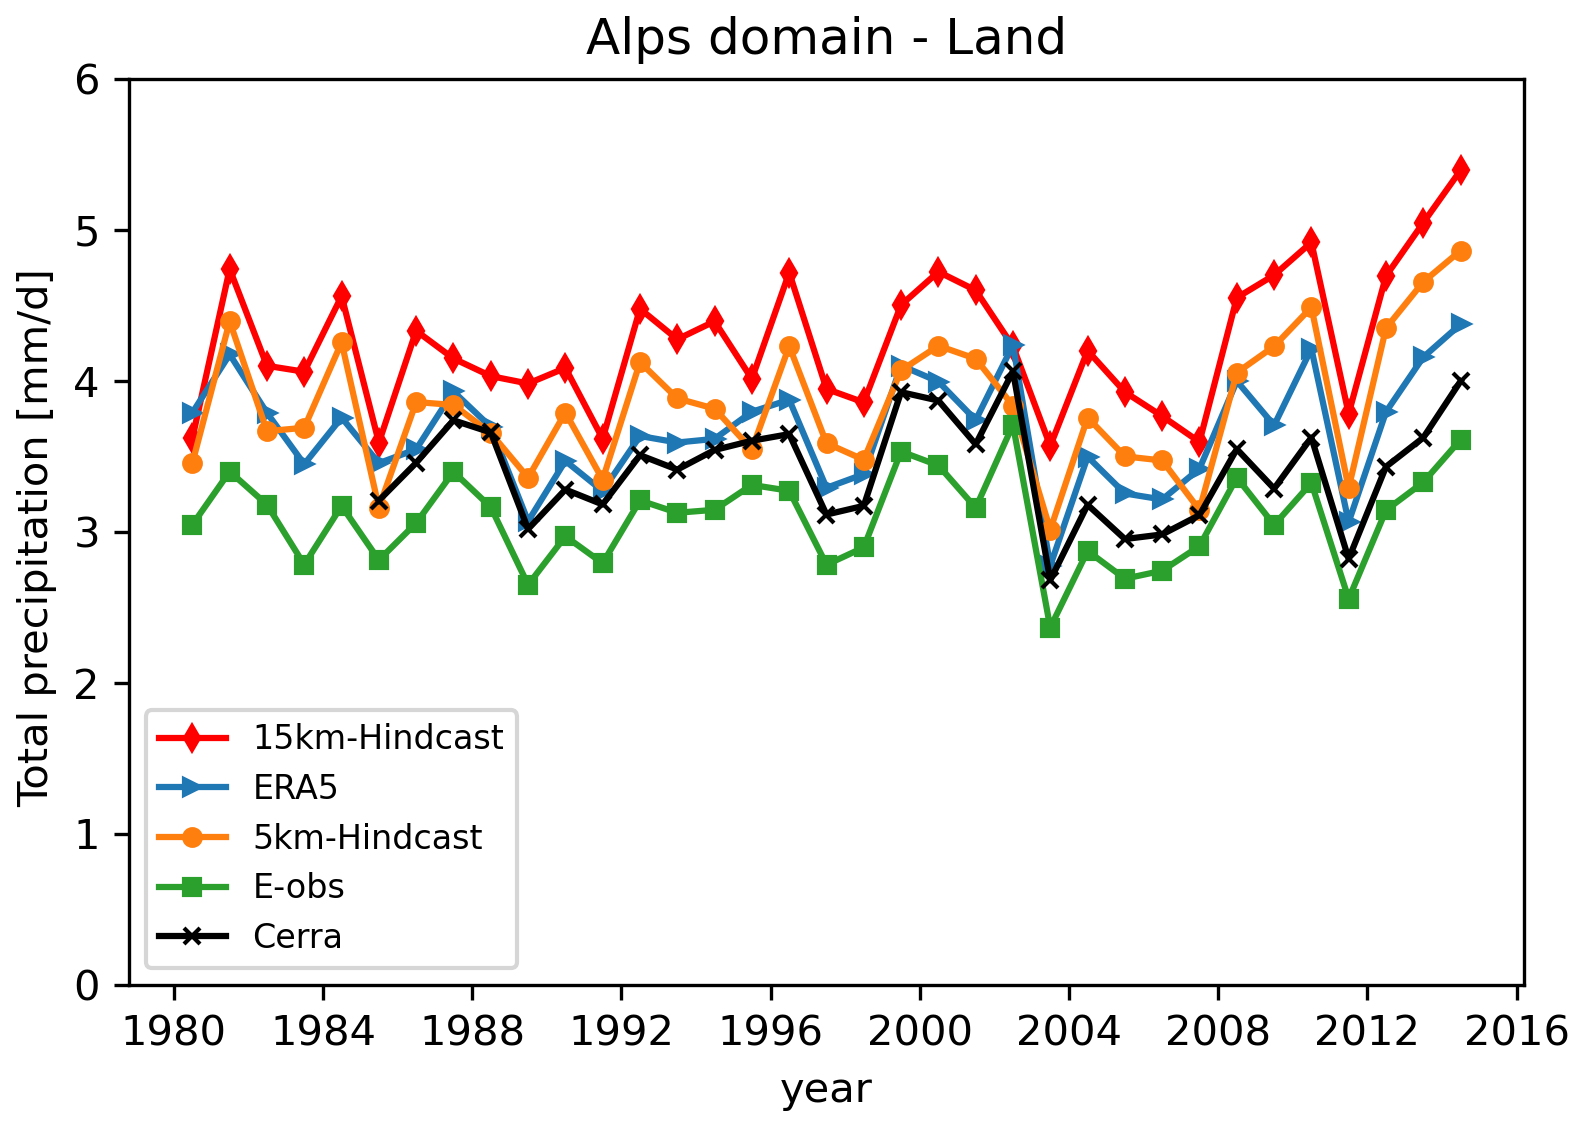
Figure 7Interannual variability of P over the Alps domain (AL) averaged over land only. Experiments 15km-Hindcast (red/diamonds) and 5km-Hindcast (orange/dots). Reference datasets: ERA5 (blue/arrows), E-OBS (green/squares), and CERRA (black/crosses).
3.2 Statistics of extreme events
The Mediterranean is a region particularly prone to heavy precipitation due to the complexity of its morphology, which is reflected in the interactions between the local and large-scale forcings which trigger them. For example, its orography is a key factor for flow modifications that drive the intensity, location, and duration of orographic rain (Rotunno and Houze, 2007); the shape of the Alps favors lee cyclogenesis (Buzzi et al., 2020), which can trigger heavy precipitation over subregions lying at their southern flank (Rotunno and Ferretti, 2001). Moreover, the sea, as a source of moisture, can modulate the intensity of the precipitation, reinforcing the vapor load of low-level jets converging over orography (Buzzi et al., 1998). A fair representation of heavy precipitation is crucial to study their sensitivity to the global warming. The following analysis evaluates the model ability to reproduce the most intense rainfall over Italy.
Figure 8 compares the probability density functions (PDFs) of daily precipitation over Italy for different datasets: ERA5, CERRA, E-OBS, and the two hindcast experiments. The statistics have been computed over the common period of 1984–2014. Data are reported on their original grid, and each event is defined as the daily precipitation at each grid point. The distributions are normalized with the dataset total number of events. For a fair comparison, especially in terms of extreme events, a model simulation should be compared with a benchmark with the closest possible resolution. As already discussed in previous sections, the 15km-Hindcast simulation (red line) overestimates the observations (green line) across the whole PDF and especially at its tail, producing quite large extremes for such a resolution (400 mm d−1), closer to the CERRA dataset which has a much higher resolution. The comparison between the 5km-Hindcast and the CERRA PDFs shows that, although the experiment still overestimates its reference, it slightly reduces their distance in terms of extremes, catching the rarest ones at the tail of the distribution, but overestimating their precipitation. Although less clear in terms of extremes, these results are in line with the indication of an added value of the increased resolution for simulating precipitation.
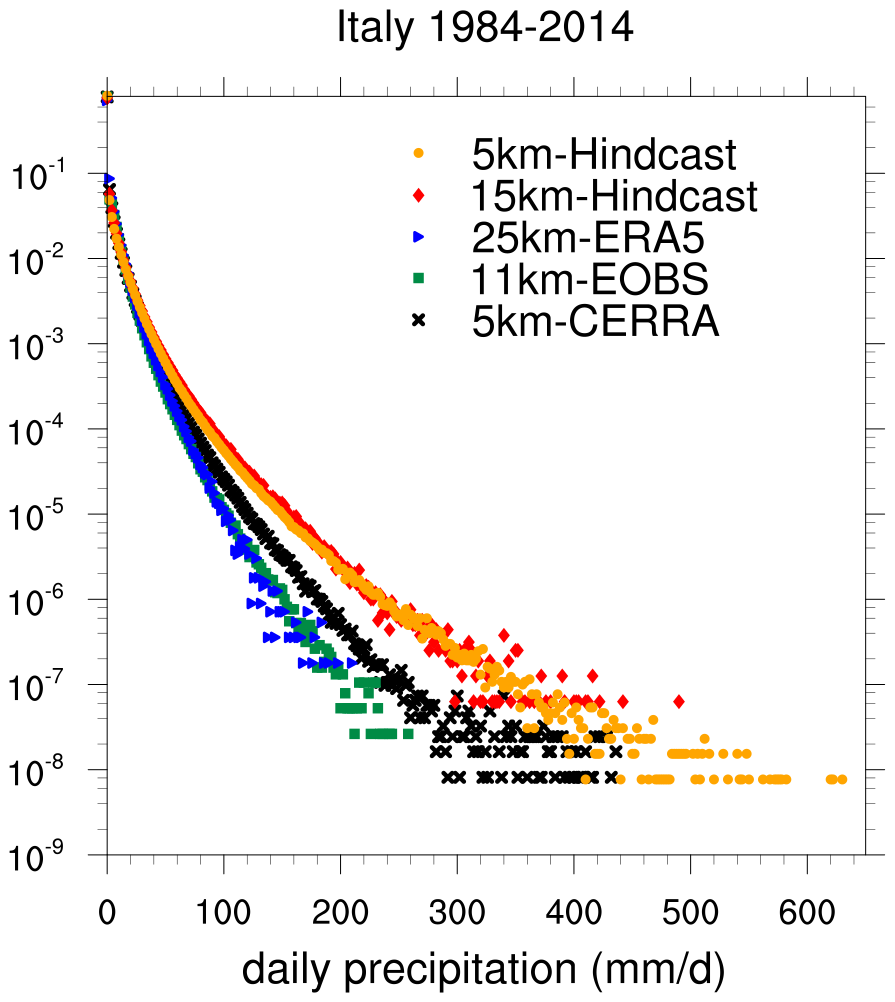
Figure 8Probability density function of the daily precipitation over Italy: ERA5 (arrows), CERRA (crosses), E-OBS (squares), and the experiments 15km-Hindcast (diamonds) and 5km-Hindcast (dots) over the period 1984–2014.
Figure 9 shows more in detail the geographical distribution of the average heavy precipitation represented through the 95th, 97th, and 99th percentile of the two 15km-Hindcast and 5km-Hindcast experiments and of reference datasets.
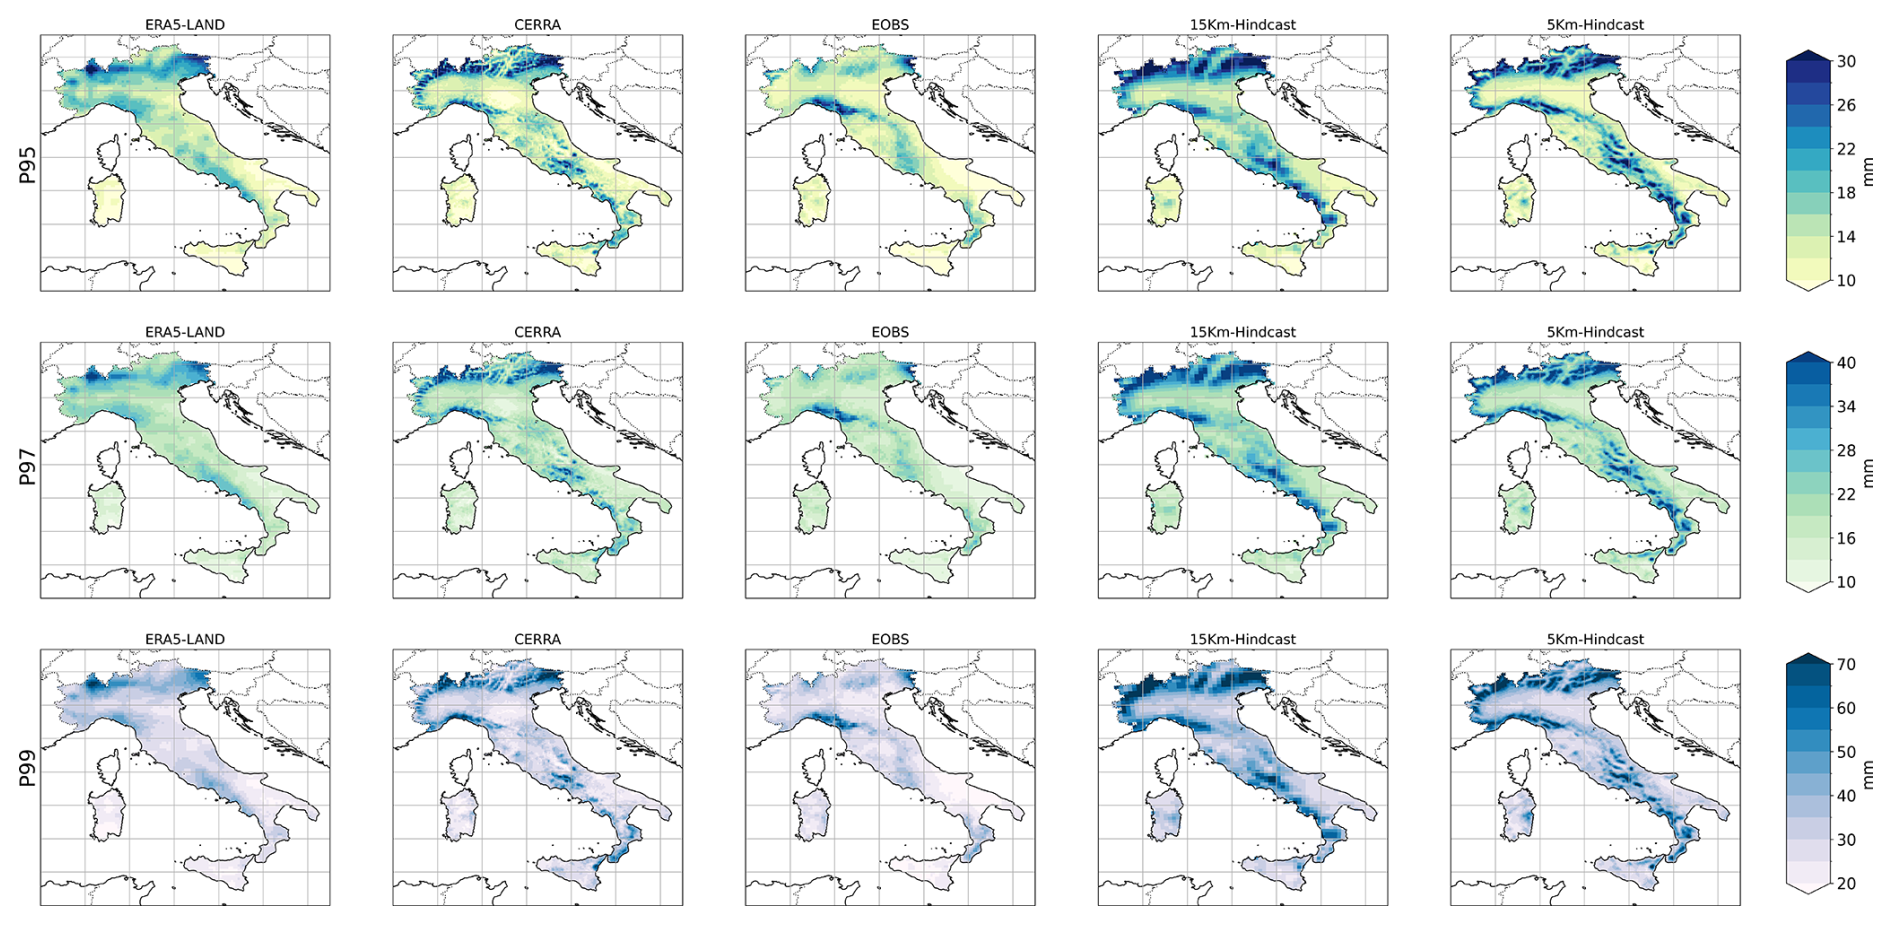
Figure 9Annual P95 (top), P97 (middle), and P99 (bottom) of daily rainfall from ERA5-LAND, CERRA, and E-OBS and the simulations 15km-Hindcast and 5km-Hindcast.
The most severe events are concentrated in the mountain regions: in the Alpine sector reanalysis and experiments give coherent results and overestimate the observations, although the two experiments show some differences. It is worth noting that part of the model bias over orography compared to E-OBS might not be accounted for as an error due to possible underrepresentation of heavy precipitation within the observational dataset due to poor spatial coverage of rain gauges feeding the data and to possible under-catchment issues (La Barbera et al., 2002). In the Ligurian region and northern Apennines, CERRA, E-OBS, and the two experiments have comparable results with respect to spatial distribution and intensity; in the central and meridional regions the overestimation with respect to the reference datasets is more evident for all the considered percentiles.
The simulation protocol includes a historical simulation for each domain. The two experiments 15km-Historical and 5km-Historical, which must be used as a term of reference for future impact assessment, were run with the same configuration as the hindcast one but were forced by the CMIP6 MPI-ESM1-2-HR model. The historical simulation aims to reproduce the main statistics of the current climate. The climate change signal is computed as the average difference between the 2071–2100 and 1985–2014 periods. Figures 10 and 11 show the spread of T2m and P derived from the 15km-Historical experiment over the PRUDENCE domains compared to the driving GCM and to the ERA5 as a term of reference for current climate.
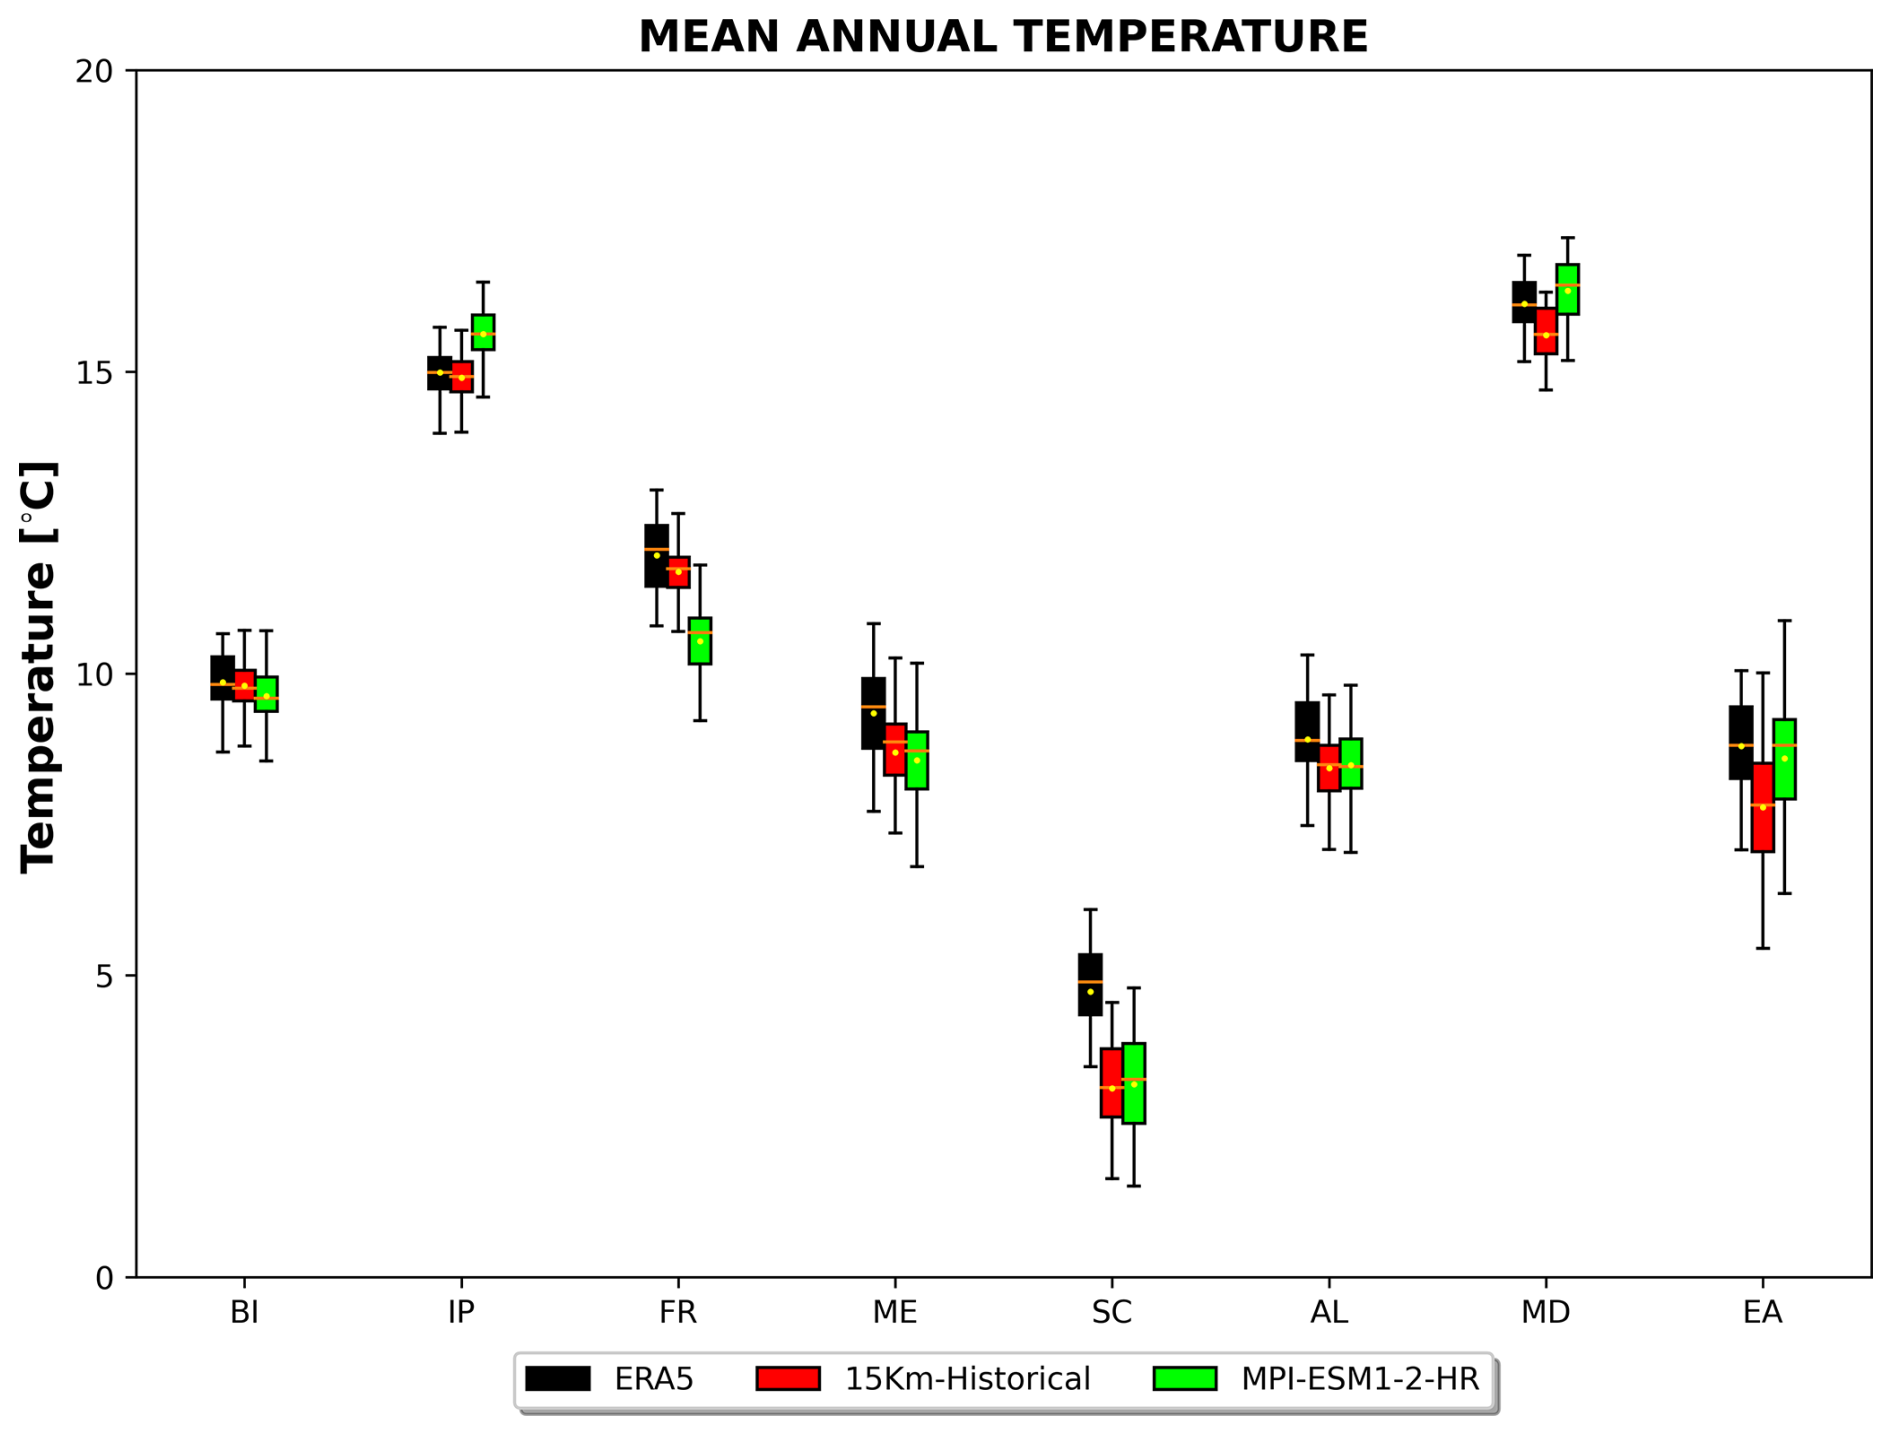
Figure 10Box plot of historical simulation of T2m: mean (yellow points), median (orange lines within the box), and 1st–3rd interquartile range (IQR, color box). The whiskers extend from the box to the farthest data point lying within 1.5× the interquartile range (IQR) from the box. 15km-Historical experiment (red), ERA5 (black), and GCM (green).
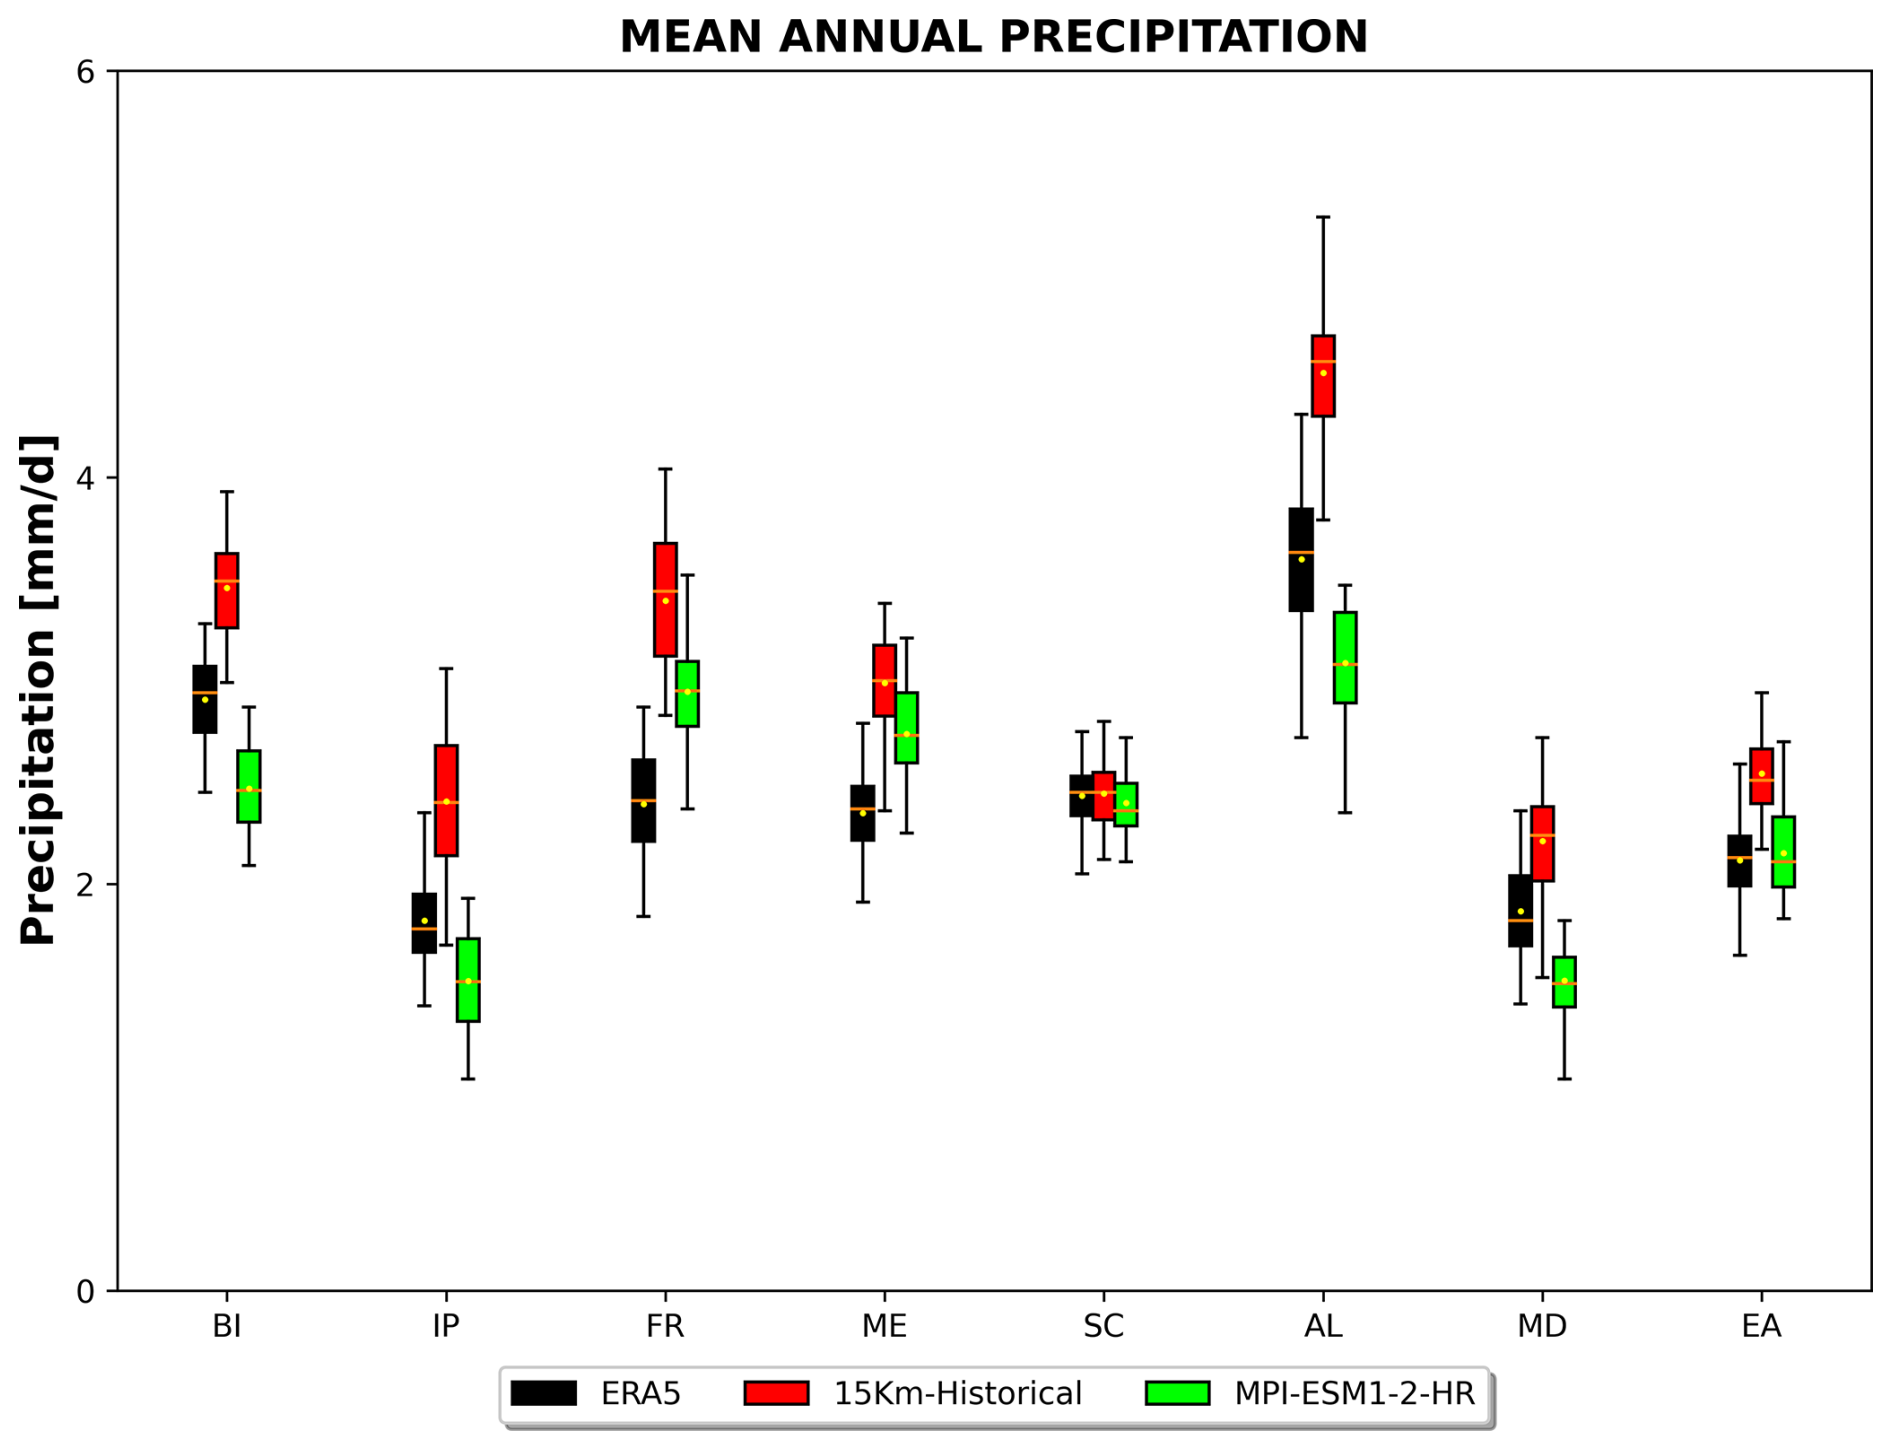
The historical experiment does not show large differences with respect to the results reported in Sect. 3 for the hindcast: the climatological mean of the surface temperature averaged over the domains is generally close to the driver and within its variability, although in some areas it is closer to ERA5 than to the driver (IP, FR). The climatological values are also close to those derived from ERA5 and can be considered fairly representative of current climate temperatures. In terms of precipitation, the global driver is close to the ERA5 dataset, with no definite bias tendency across the domains. The bias is positive in some regions and negative in others but always within 1 mm d−1. The downscaled precipitation field suffers from the same characteristics already analyzed in the hindcast experiments. There is a wet bias in all regions (except the SC domain) that is corrected, analogously to what is shown for the hindcast simulation in Fig. 5, with the double-step nesting at 5 km in the Alps domain (not shown).
Figure 12 shows the 2 m temperature projected climate change in the three scenarios over the D01 domain for the four seasons. A general warming is shown, as expected, for each scenario in the whole region. This is in accordance with analogous regional experiments driven by the same global driver but conducted within the Med-CORDEX protocol with the coupled model ENEA-Reg (Anav et al., 2024), adopting the same version of the atmospheric model but with different parameterizations. Scenario SSP1-2.6 does not display large changes among the seasons, while in SSP2-4.5 and SSP5-8.5 the change signal evidences seasonal differences. In particular, the largest changes are projected in DJF over eastern Europe and JJA in the Mediterranean. Values at all grid points are significant at the 10 % level. The significance has been assessed by a Monte Carlo bootstrap procedure with 1000 repetitions.
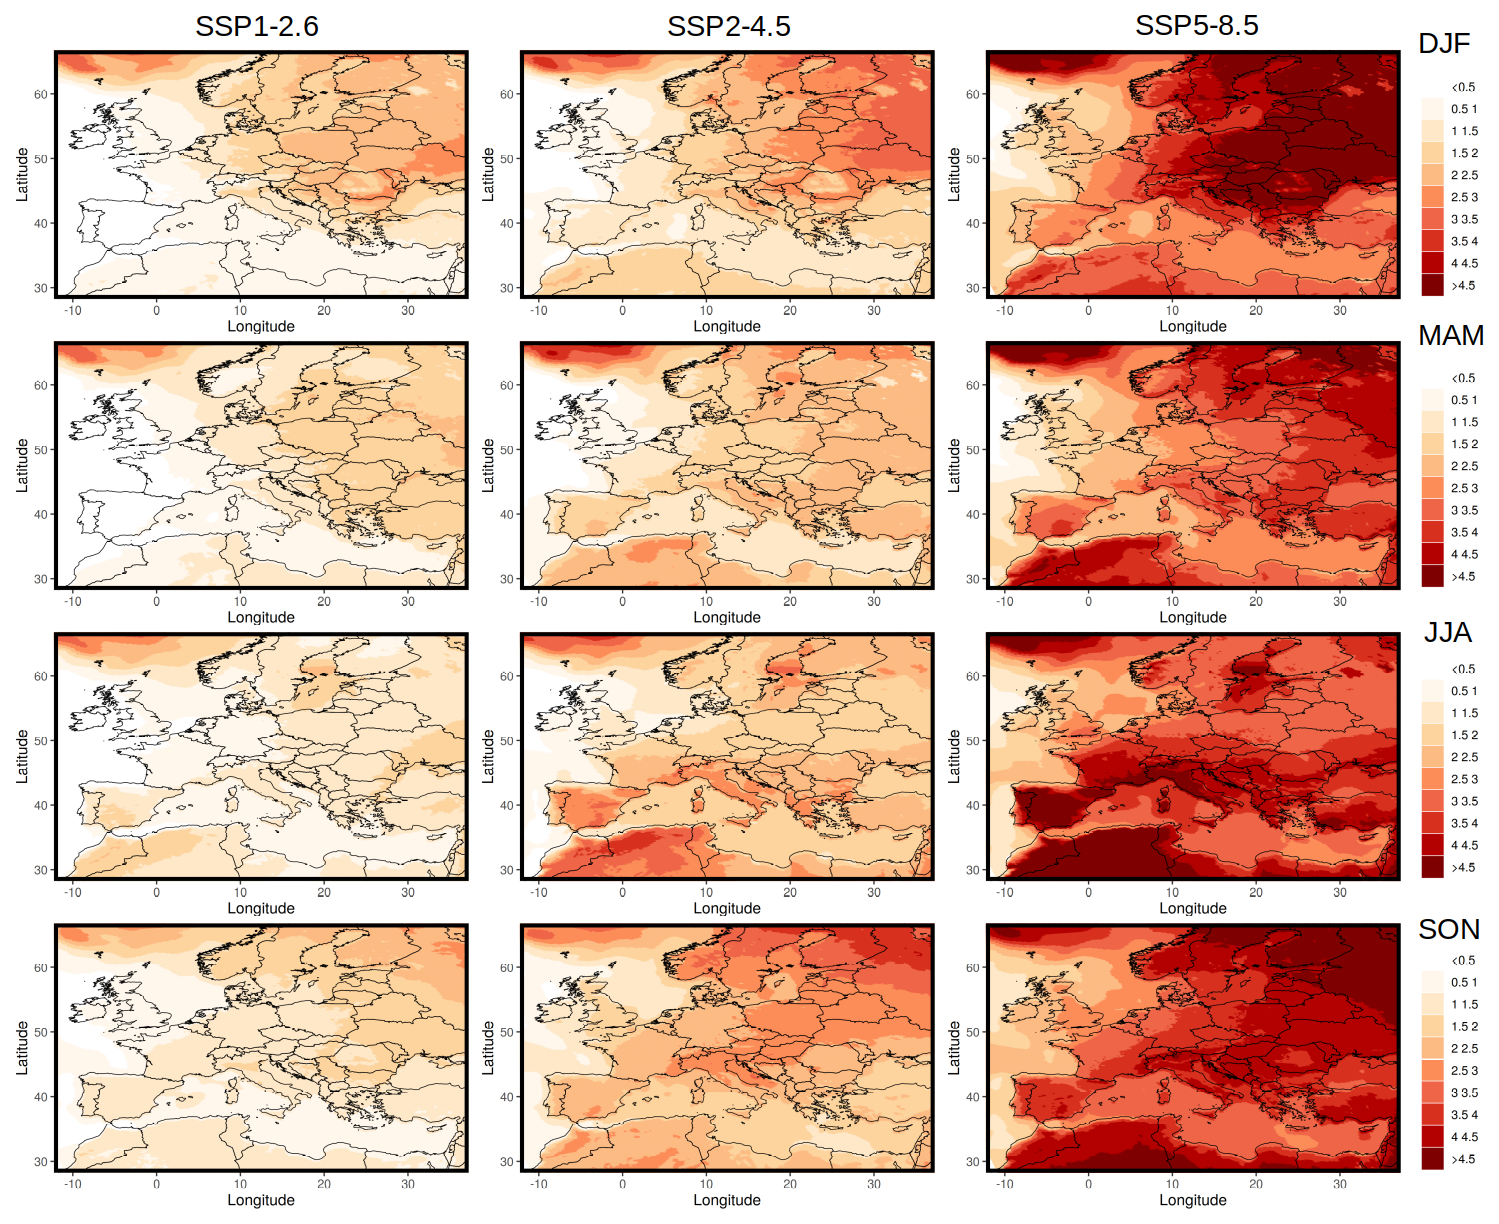
Figure 12Projections of temperature change at the end of the century in the multi-scenario experiments – 15km-SSPs (°C).
Figure 13 shows the projections of precipitation change at the end of the century. Black dots indicate 10 % level significance, assessed by a Monte Carlo bootstrap procedure with 1000 repetitions. Even in the mitigated scenario SSP1-2.6, significant changes are present. For all the scenarios and seasons there is a projected intensification of the hydrological cycle over most of continental Europe and precipitation reduction over the Mediterranean region. In JJA the precipitation reduction also extends to western Europe (Spain and France). Similar results were found in Anav et al. (2024), with local differences likely due to the different configuration of the model (ocean coupling and parameterizations).
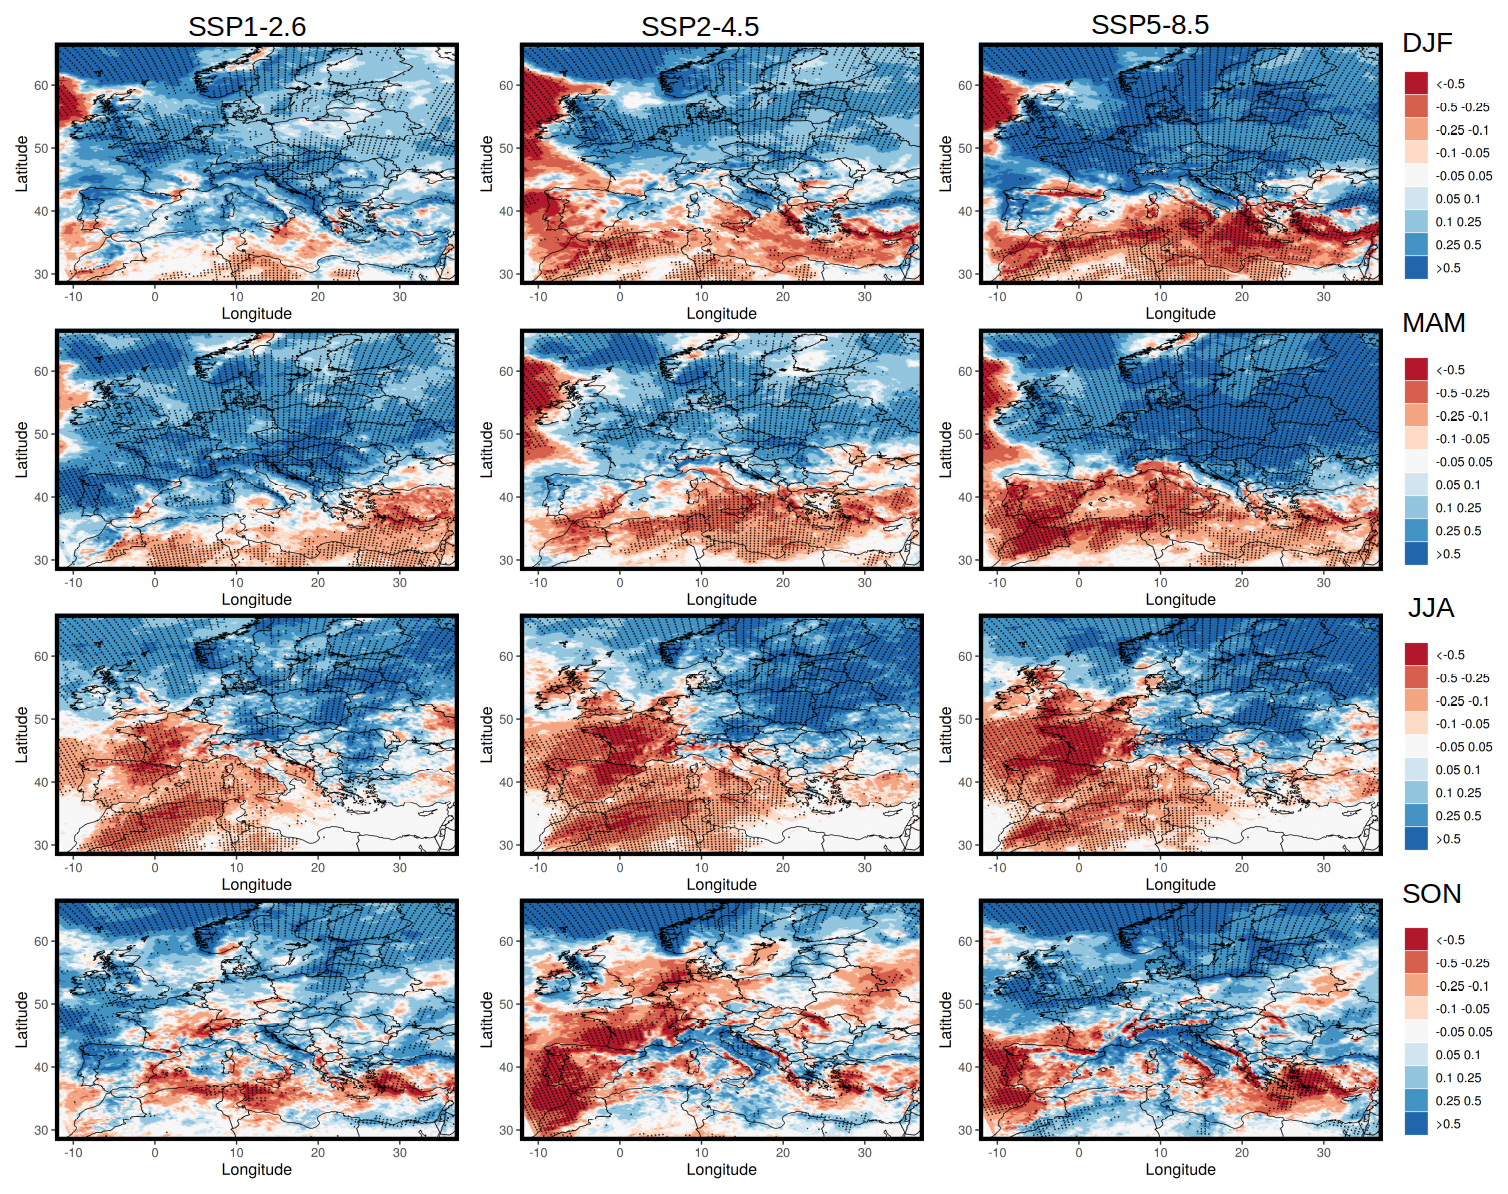
Figure 13Projections of precipitation change at the end of the century in the multi-scenario experiments – 15km-SSPs (mm d−1).
Figures 14 and 15 are analogous to Figs. 12 and 13 but for the D02 domain. The warming over the national territory in 5km-SSP1-2.6 (Fig. 14, left column) is mostly contained within the range 0.5–1 °C across the different seasons. During fall the projected climate change reaches 1.5 °C over Italy and the Tyrrhenian Sea. The 5km-SSP experiments tend to maintain a mean projection of the future warming like that of the coarser domain, although the effect of increased resolution reduces the warming in JJA and SON over most of the peninsula and especially in DJF and MAM in the Po Valley, as can be seen by comparing Figs. 12 and 14. Projected warming is less intense compared to the results of the global forcing (Fig. S1 in the Supplement), especially in JJA and SON. Furthermore, the results at 5 km resolution clearly evidence larger warming over mountainous areas in JJA and SON for SSP2-4.5 and SSP5-8.5, which is not reproduced by the global model.
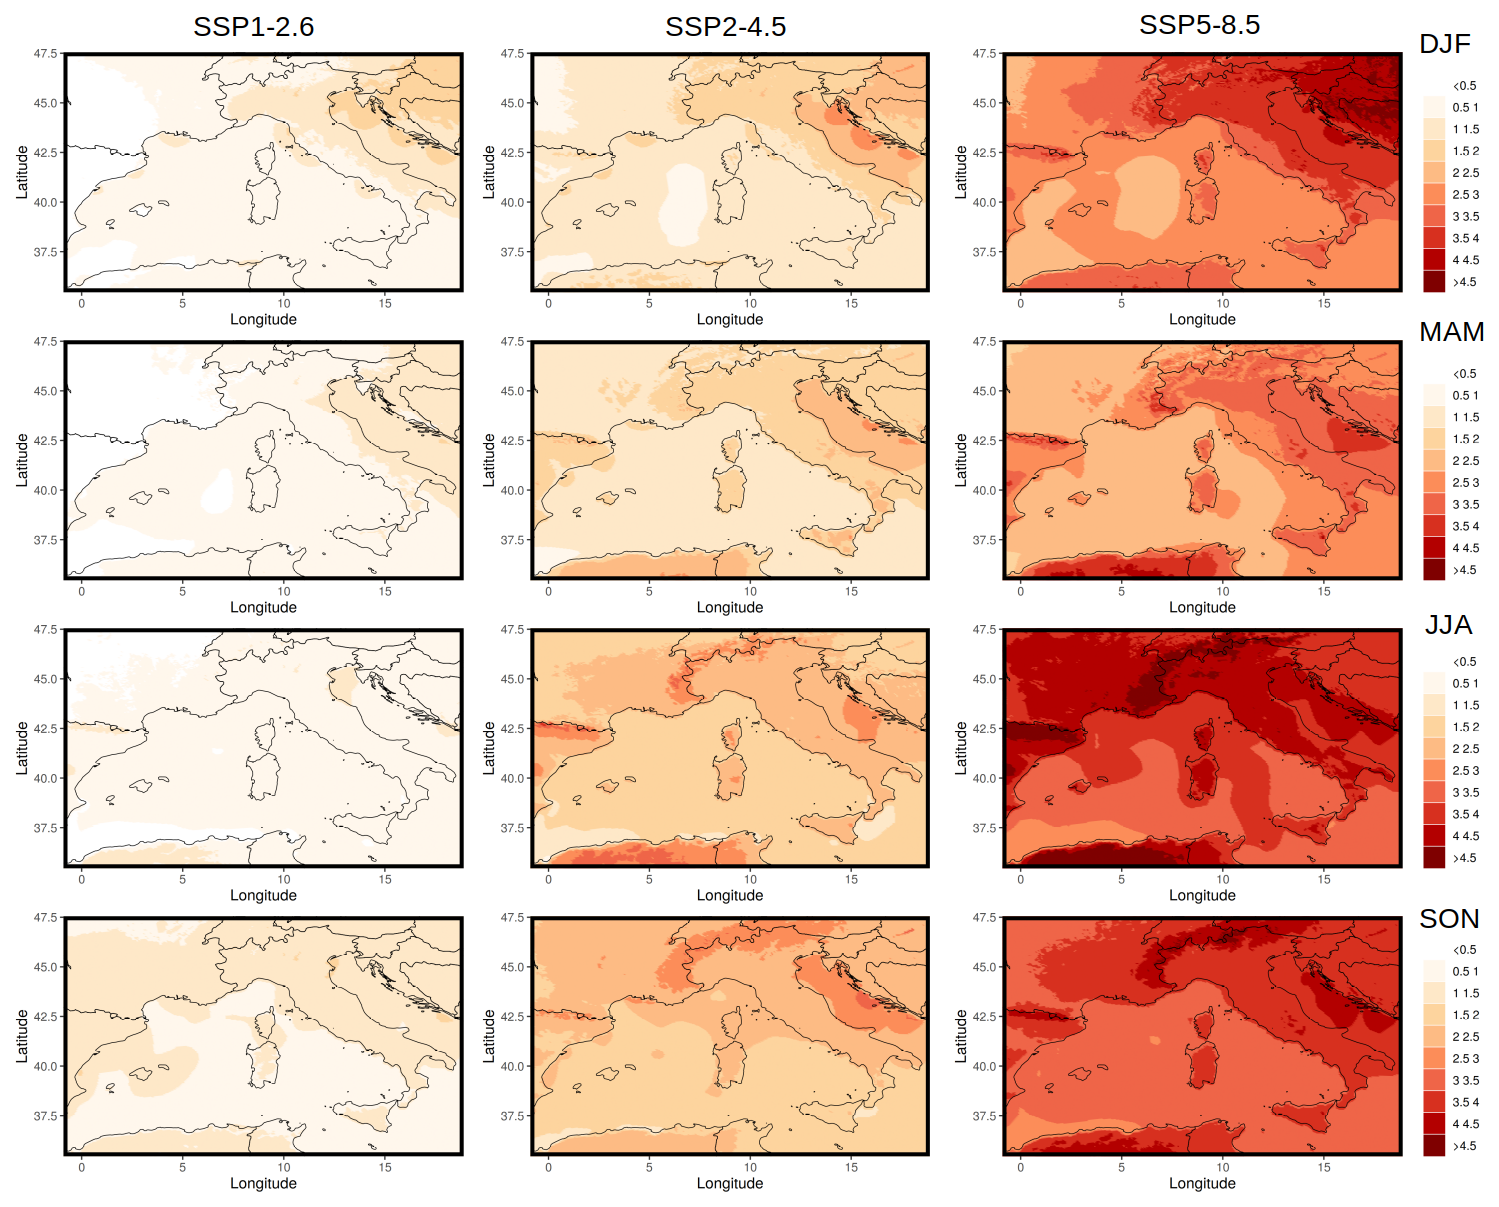
Figure 14Projections of temperature change at the end of the century in the multi-scenario experiments – 5km-SSPs (°C).
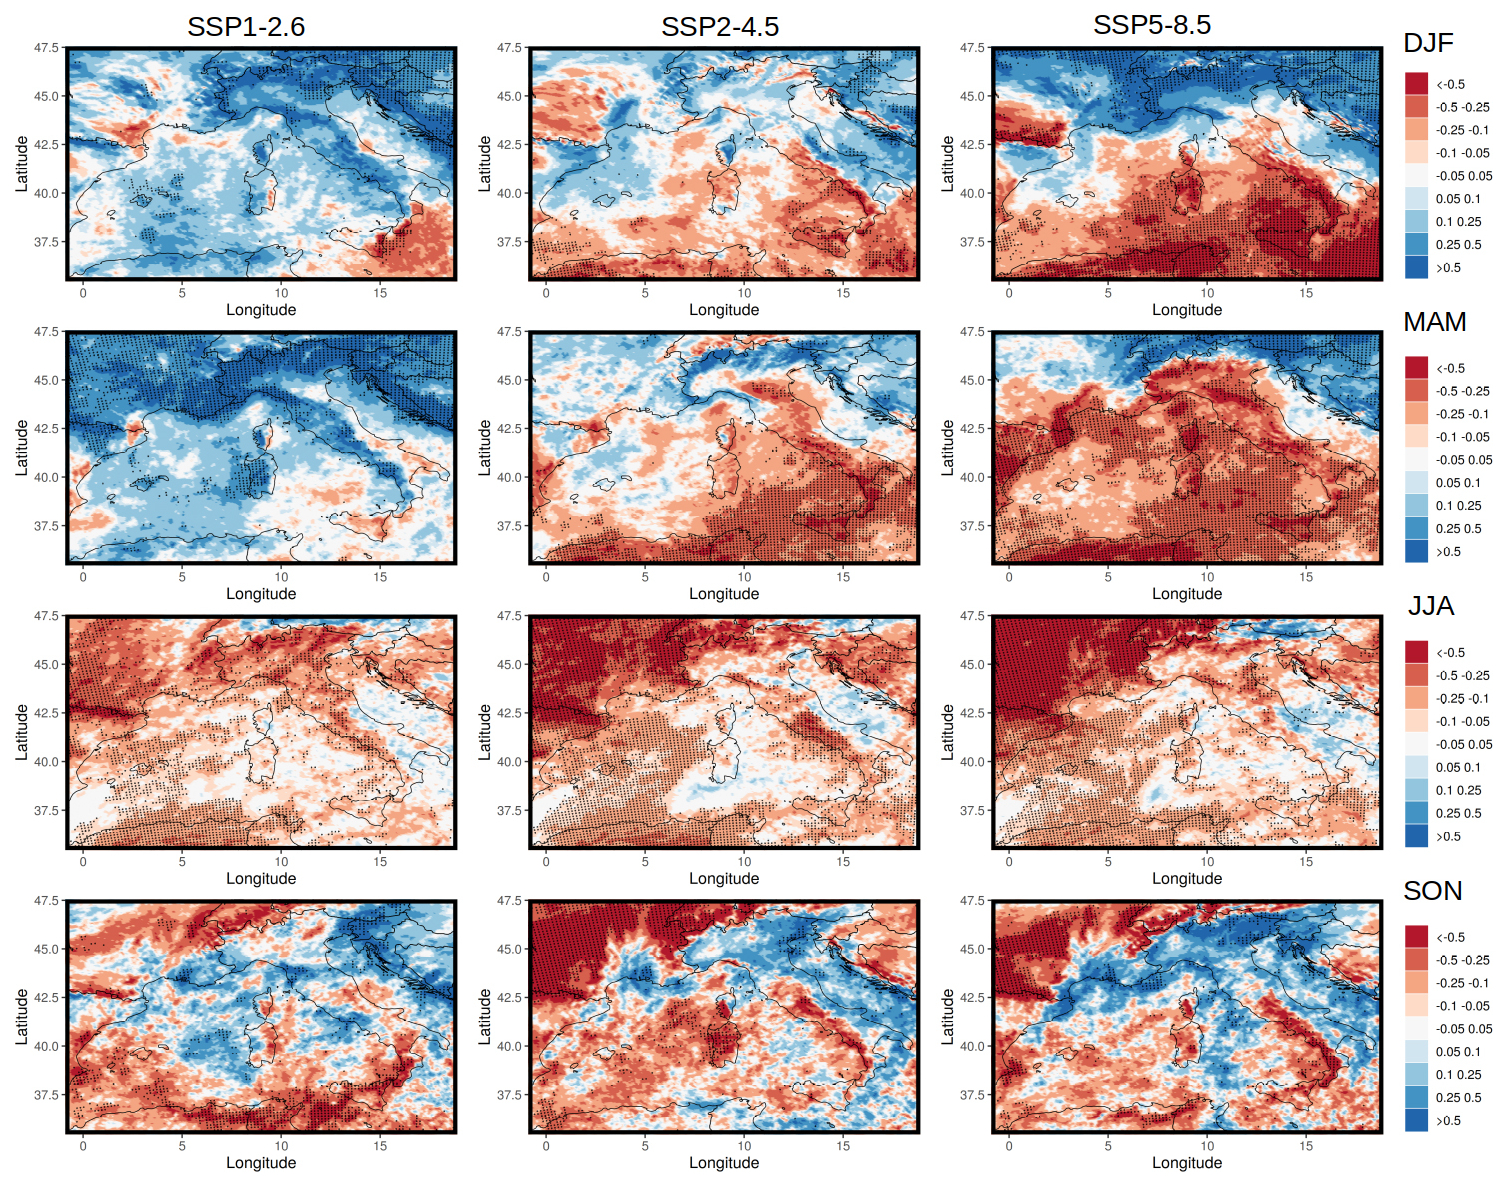
Figure 15Projections of precipitation change at the end of the century in the multi-scenario experiments – 5km-SSPs (mm d−1).
Figure 15 shows the projected climate change in precipitation for the three scenarios, across the seasons. In the 5km-SSP1-2.6 experiment the mean change in the precipitation field over Italy at the end of the century in DJF and MAM is generally positive and exceeds 0.5 mm d−1 in mountain regions, especially in the Alpine sector. This result is in accordance with the results of 15km-SSP1-2.6 in terms of the sign and strength of the signal but more statistically robust.
In the JJA season the 5km-SSP1-2.6 experiment projects a significant reduction in the precipitation field over almost the entire Italian territory. Instead, in the 15km-SSP1-2.6 there is not a clear precipitation change and Italy stands in the transition between two distinct zones with opposite change, i.e., western and eastern Europe.
For the SON season no large differences are evident in the projections between the two different resolutions.
The projected changes of the mean precipitation for the scenarios SSP2-4.5 and SSP5-8.5 are similar across the seasons. The climate becomes generally drier, especially in summer, while in the Alpine region the mean precipitation is expected to increase in winter and fall, thus projecting an increase in the seasonality of the hydrological cycle in this area. Interestingly, the precipitation climate change signal in the downscaled projection is quite different from results by the global driver (Fig. S2) and even of opposite sign over some areas in the shoulder seasons (MAM and SON). In particular, while in these seasons the global model projects an overall drying signal for SSP2-4.5 and SSP5-8.5, the regional model projects a significant increase in mean seasonal precipitation over the Alps and the northeast in MAM and northern Italy in SON. The change in signal at both levels of nesting (15 and 5 km, Figs. 13 and 15) in the fall season across the western Mediterranean coastal areas and over alpine topography, probably due to the improved representation of local interactions (sea–land, orographic forcings), is worth noting.
Climate change is expected to alter the frequency and intensity of extreme precipitation events, which initiate natural hazards such as floods or may trigger landslides. Extreme convective precipitation events are getting more intense and more frequent due to global warming, hitting larger areas and exacerbating their characteristics, especially over the Mediterranean (Pichelli et al., 2021; Muller et al., 2024; Pichelli and the CORDEX-FPSCON Team, 2023; Caillaud et al., 2024). Figure 16 shows the change of the precipitation PDFs at the end of century for the three scenarios. The PDFs computed at the end of the century (2071–2100) are shown in bright colors, while the PDFs computed over the reference period (1984–2014) are shown with the same fading color. In the sustainable scenario (SSP1-2.6) we do not detect significant variations among present and far future projections globally over Italy. However, the SSP2-4.5 and the SSP5-8.5 scenarios project an increase in both the frequency and intensity of extreme events, which are similar between the two resolution runs within the range of 150–300 mm d−1 thresholds, while it is exacerbated, especially in terms of frequency, at 5 km with respect to its 15 km driver at the very end of the tail of the distribution. More detailed information about the changes of extreme events in the far future can be derived from Figs. 17 and 18.
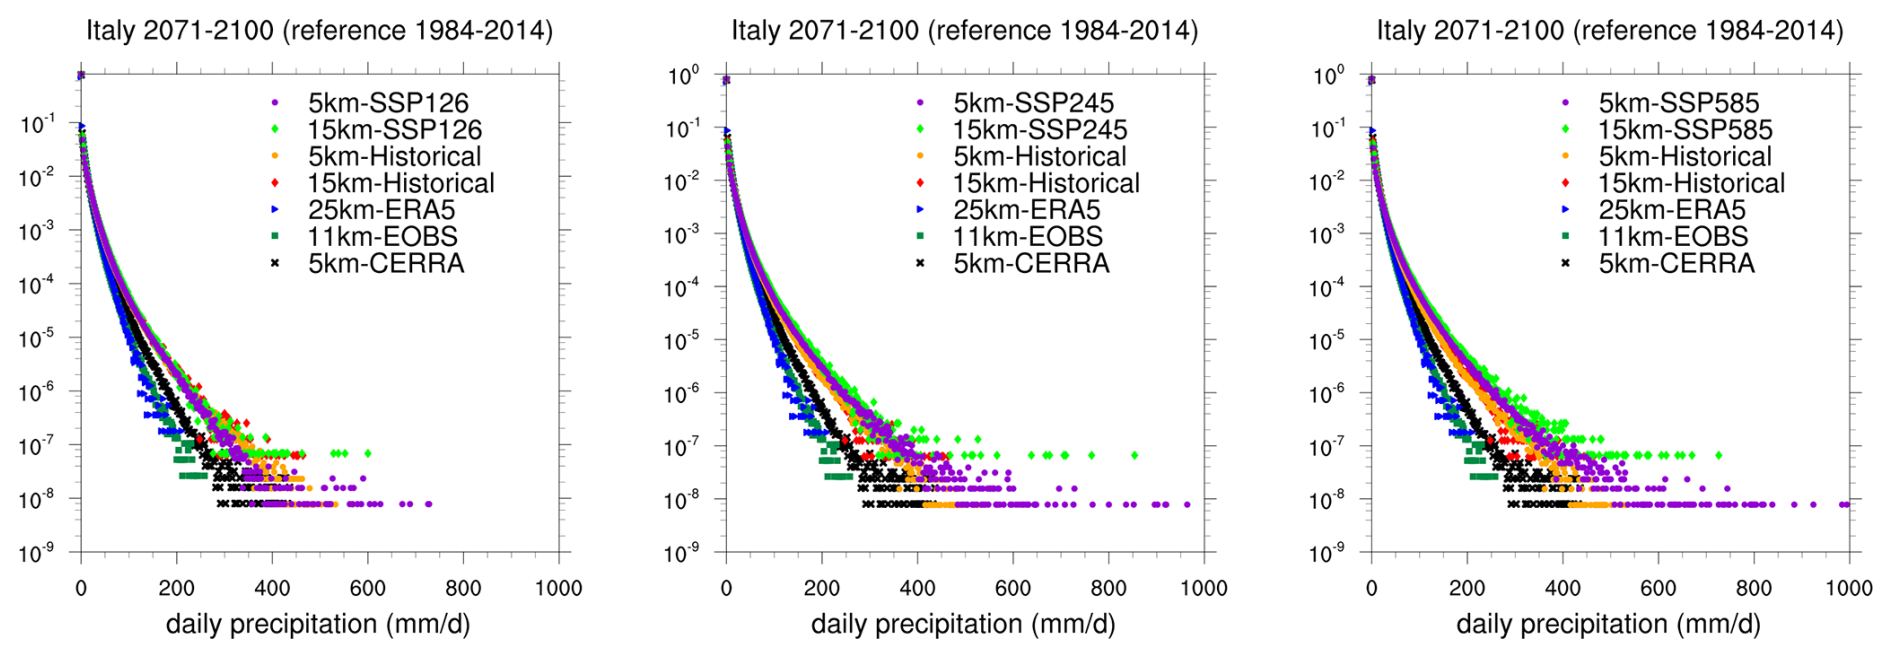
Figure 16Intercomparison of the precipitation distributions at the end of the century (2071–2100) with the historical reference distributions (1985–2014) for the three scenarios: SSP1-2.6, SSP2-4.5, and SSP5-8.5 from left to right.
Figures 17 and 18 show the change at the end of the century of the 99th percentile (P99) of daily precipitation over the Italian territory for the different seasons and for the two experiments, respectively. By using a jackknife method to calculate the P99 values, we reduce the bias of the estimated P99 values (Ferreira, 2024). At the same time, the jackknife methodology provides an estimate of the mean squared error of the P99 values for the scenario and for the reference period, which allows us to perform a Student's t test at the 5 % confidence level showing that the modeled changes in the intensity of extreme events are statistically significant. The jackknife method is applied by dropping half of the original samples before calculating the P99 values and the corresponding difference between the scenario and the reference period. Except for a few grid points corresponding to areas where the difference in P99 is very small, most of the differences shown in Figs. 17 and 18 are statistically significant.
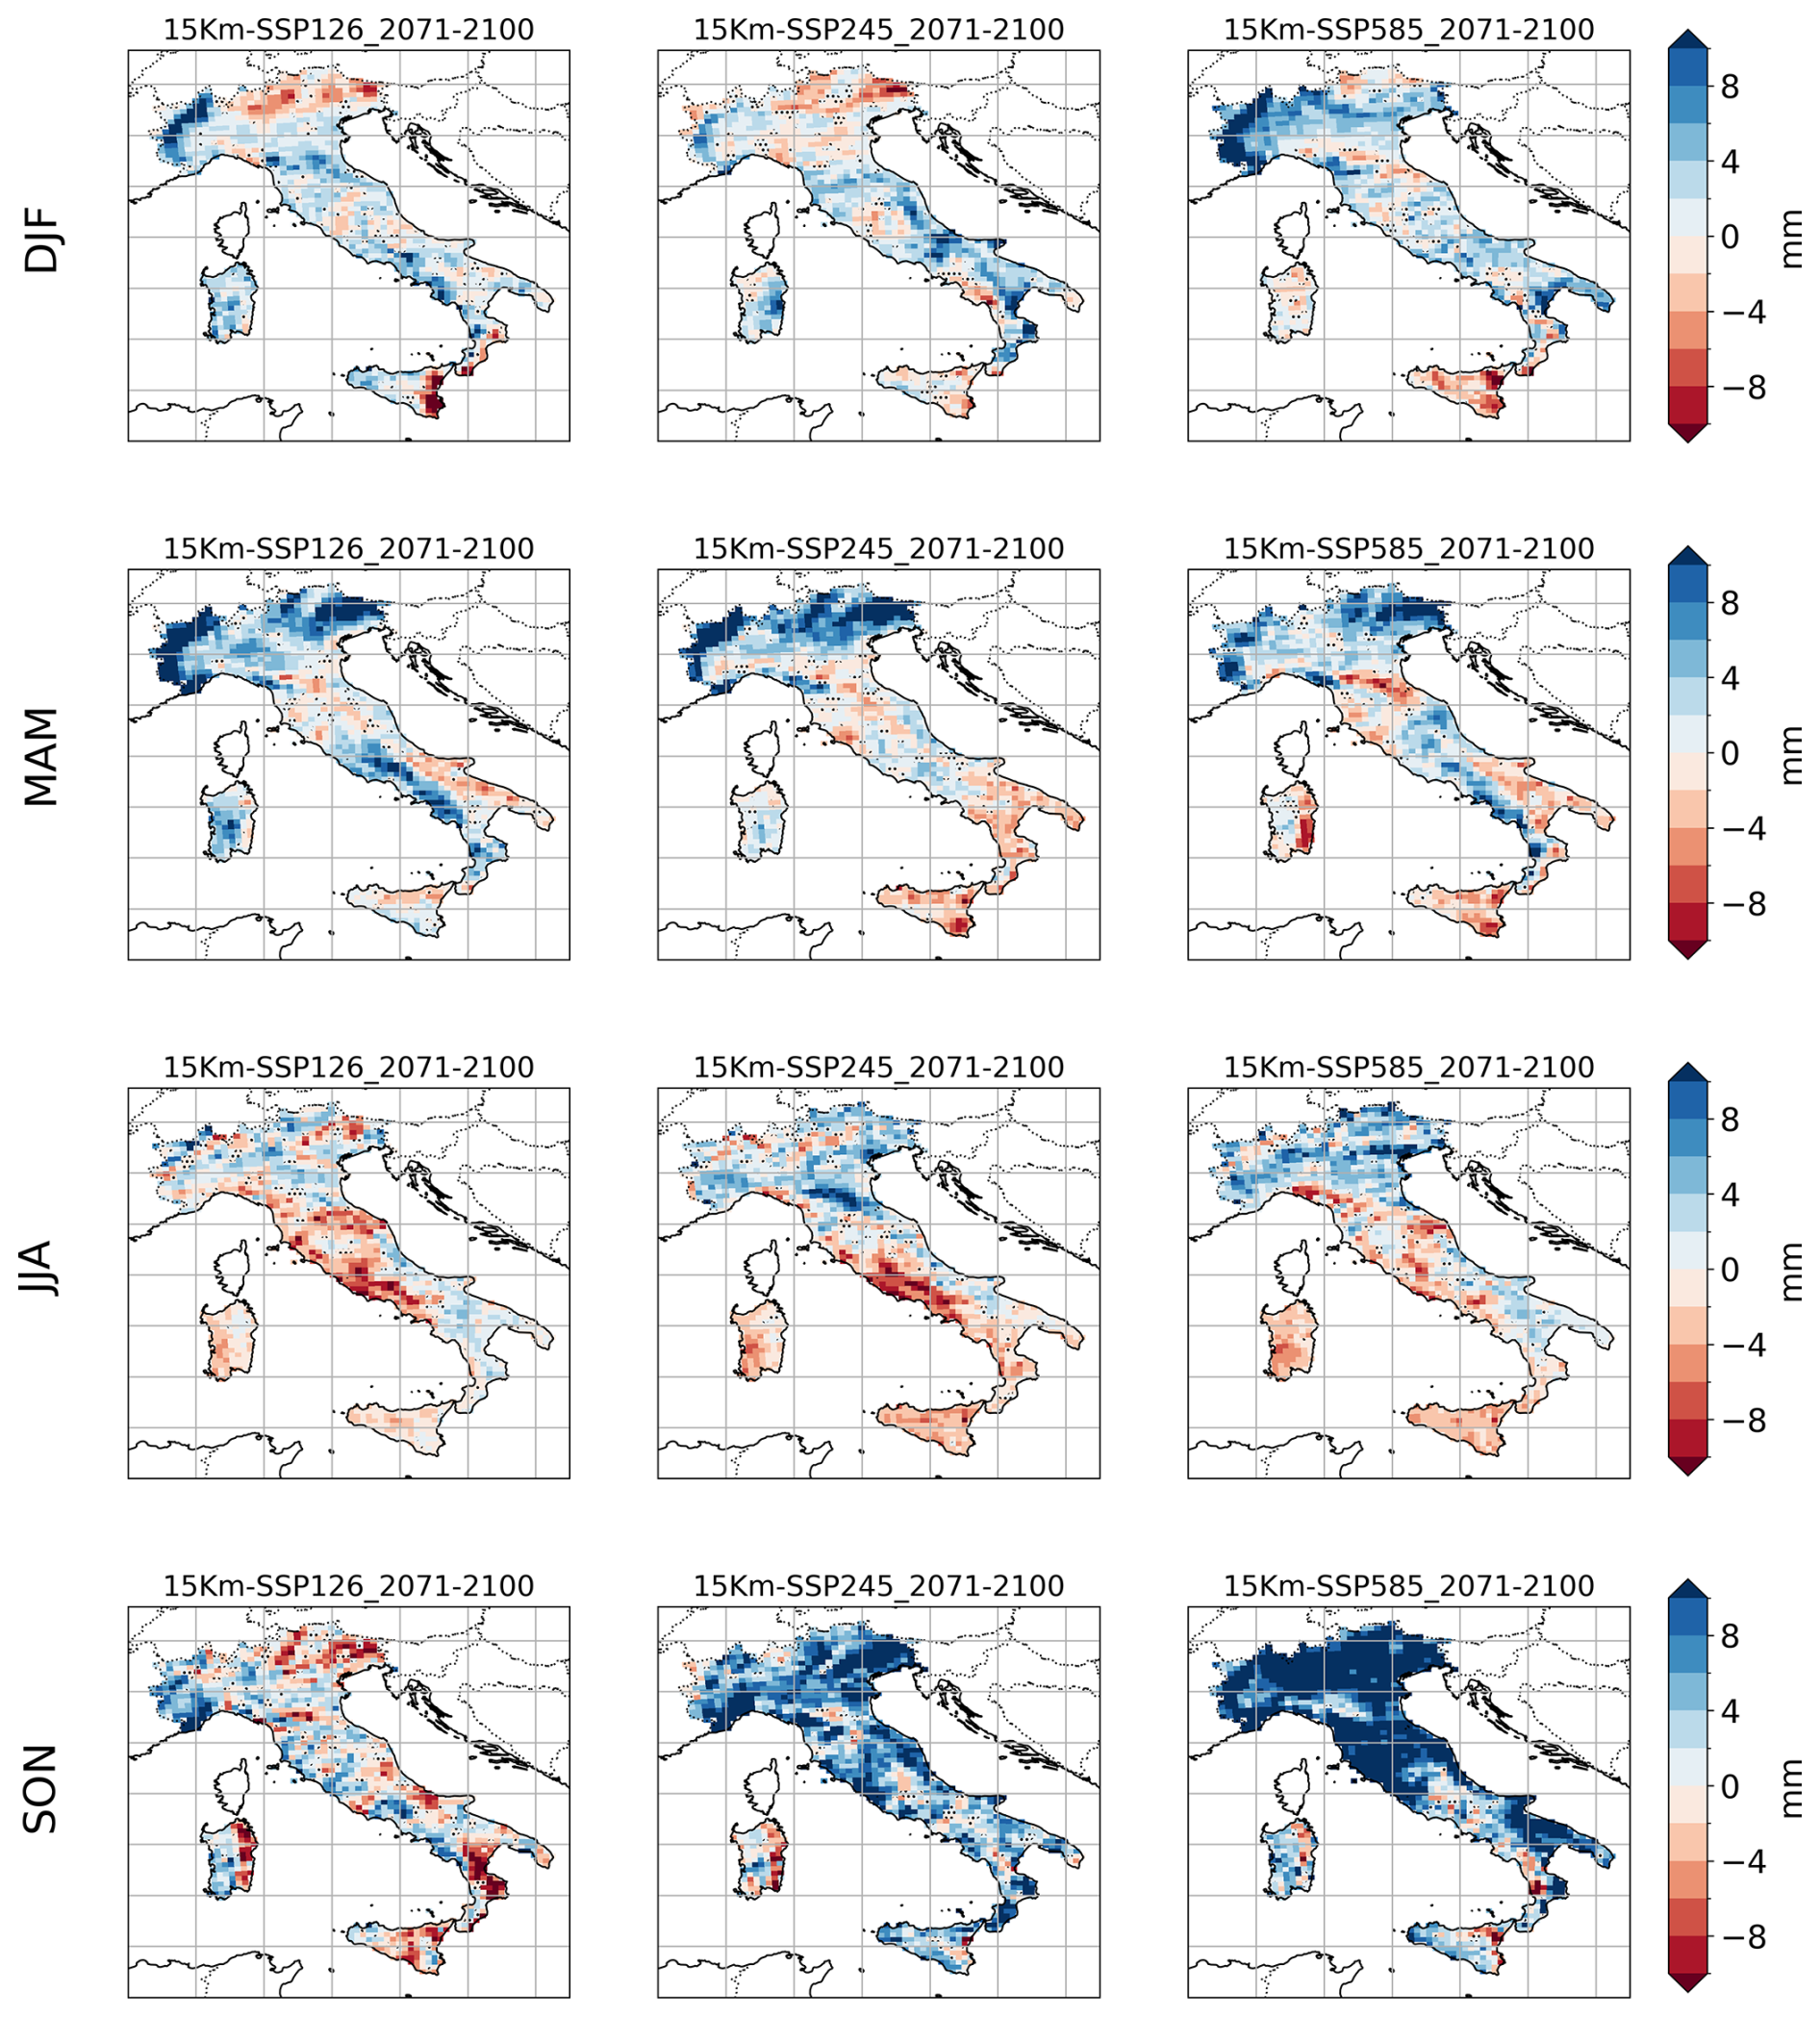
Figure 17Difference between the values of the 99th percentile (P99) of daily rainfall during the period 2071–2100 and the corresponding values computed for the period 1985–2014. The differences are computed for the three scenarios for the model configuration D01. Dotted areas correspond to the grid points where the difference is not statistically significant according to a Student's t test at the 5 % confidence level applied to a synthetic population of P99 values generated with the jackknife method described in Sect. 4.
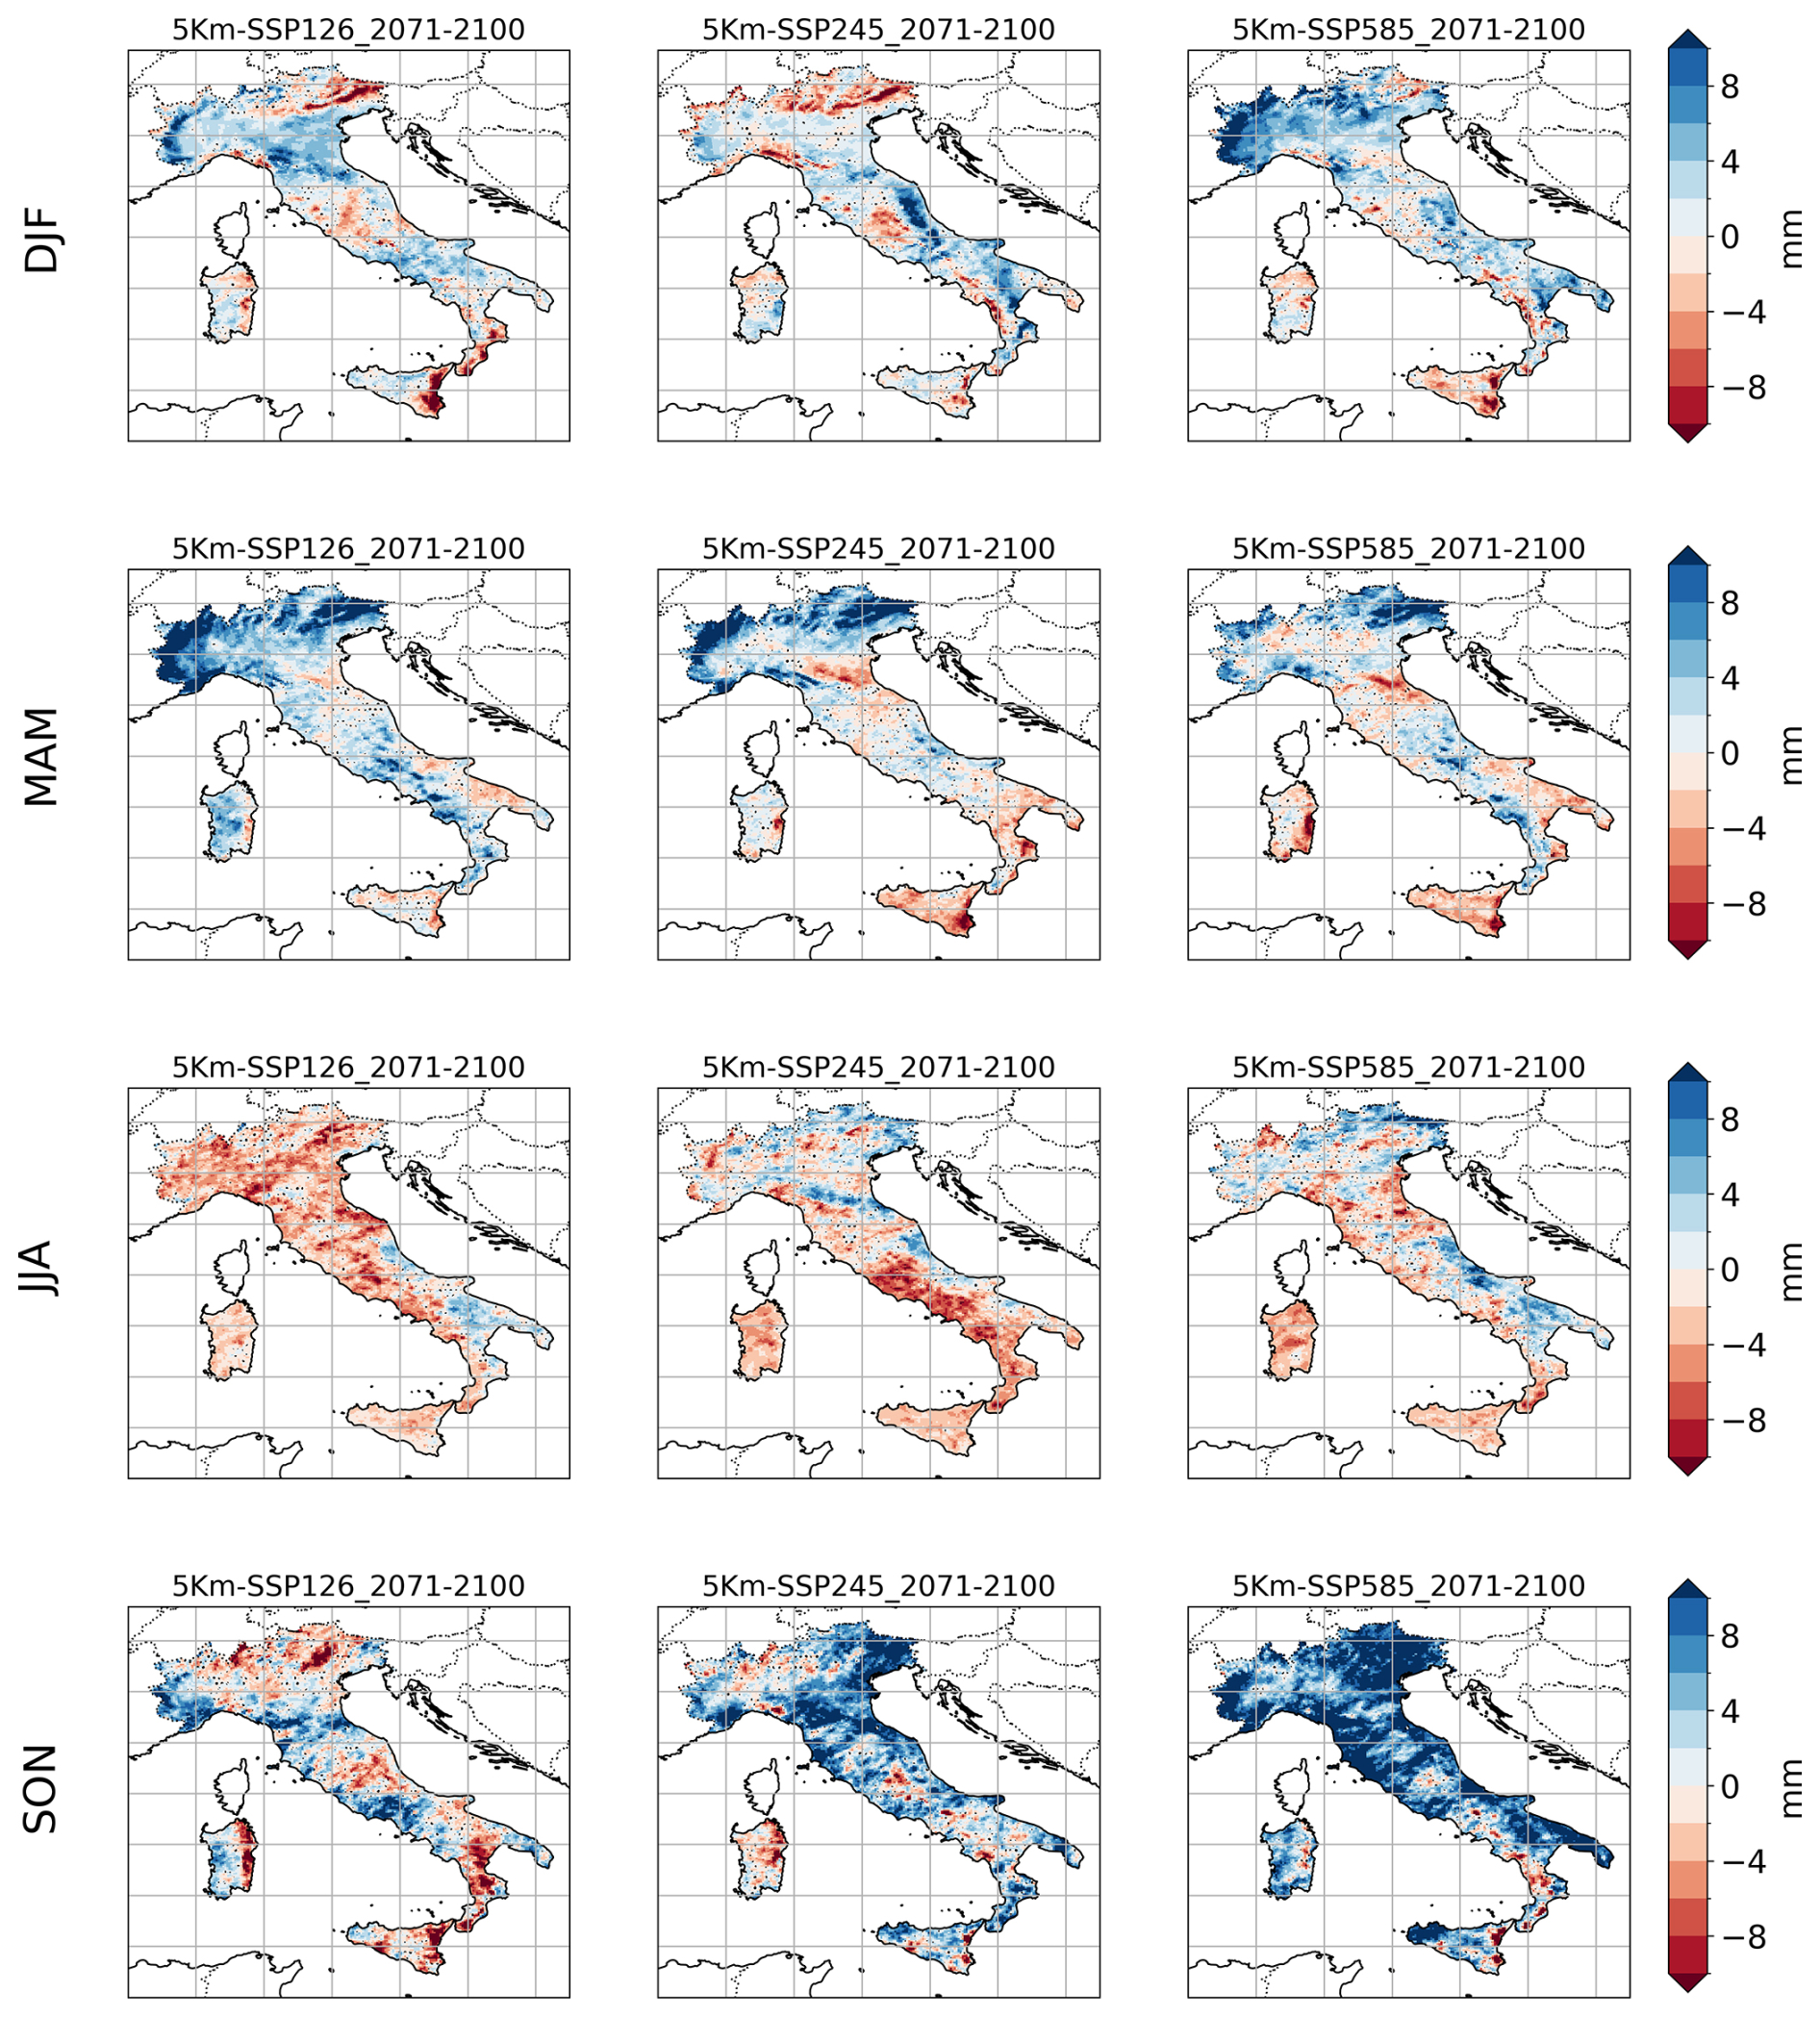
Figure 18Same as Fig. 17 but for the model configuration D02.
There is general agreement in the results of the two experiments, with limited local differences and with an overall reduction in the amplitude of the climate change signal in the higher-resolution experiment.
It is worth noting that it is quite difficult to identify a general consistent trend across the climate scenarios from SSP126 to SSP585, with the exception of the SON season. As an example, the intensity of extreme precipitation along the Tyrrhenian coast of southern Italy increases during DJF in SSP126, while the scenario SSP245 shows a decrease in intensity. On the contrary, SSP585 is similar to SSP126 in this area. During DJF and MAM, the scenarios from SSP126 to SSP585 show a gradual reduction in the intensity of the extremes over the northern part of the Apennines, along the northern coast of the Adriatic Sea.
However, a well-defined seasonal pattern of changes in extreme precipitation can be observed. During DJF, there is an increase in intensity in the western Alpine region and a slight decrease in intensity in the eastern Alps, while the intensity of extreme precipitation decreases in the south, with a particularly marked decrease over the most prominent reliefs in Sicily; a similar pattern occurs during MAM, except for an increase in the intensity of extremes over the entire Alpine region. During JJA, there is a decrease in the intensity of extremes, with a more pronounced signal in the 5 km experiment and over the western coast of the peninsula, along the Tyrrhenian Sea. During SON an increase in the intensity of extreme precipitation is particularly relevant for SSP5-8.5 for most of the area analyzed and for both the D01 and D02 experiments, where an evident increase in the intensity of the P99 events is detectable in correspondence to the increase in scenario severity.
In contrast to the complex spatial patterns observed in experiments D01 and D02, the global climate model MPI-ESM1-2-HR exhibits a more spatially uniform increase in the 99th percentile of daily rainfall (Fig. 19), with no apparent relationship to local orography and considerably larger overall changes. The comparison between Figs. 17–18 and S3 highlights a substantial improvement in the representation of local extreme events achieved through high-resolution downscaling. Notably, as also seen for changes in mean seasonal rainfall (Fig. 15), the accurate depiction of projected changes in local extremes is strongly influenced by the representation of interactions with local orography, which plays a key role in constraining the spatial distribution of intense precipitation events.
A dynamical downscaling strategy, from global model scale to a regional scale within the gray zone (4–10 km) for the representation of convection, has been applied and validated to produce multi-scenario regional climate simulations with the atmospheric model WRF for the Mediterranean region; the finest level of nesting (5 km) is focused over the Italian Peninsula and the western Mediterranean basin, while its intermediate parent domain has a resolution of 15 km over Europe.
The evaluation of the protocol simulation has been carried out through an ERA5-driven experiment. The realization of hindcast runs is of primary importance as it allows testing the ability of the numerical tool to reproduce the current climate and to validate the system against the reanalysis and observational datasets.
In this work, we explore a grid step (5 km) at the lower edge of the gray zone range, usually avoided because at these scales the convection parameterizations should still be turned on due to the convection still being insufficiently resolved with the risk of some parameterization assumptions being potentially violated. We proved that the model in the finer gray zone due to the scale awareness implemented in the Grell–Freitas cumulus scheme mimics a convection-permitting model behavior, smoothing the transition toward the kilometer scale.
Doing so, we are able to cover wide enough domains but save both computational time and storage and to perform scenario simulations long enough to speculate on the impacts of extreme events under climate change conditions.
Especially in terms of the representation of mean precipitation, the 5 km simulations are proven to correct a wet bias present in the intermediate 15 km simulations over most of the Italian Peninsula, revealing the added value of the double-nesting procedure. This feature is also confirmed by analyzing the statistics of extreme rainfall events against reference datasets.
The production of a coherent set of high-resolution multi-scenario (SSP1-2.6, SSP2-4.5, and SSP5-8.5) climate simulations of the last generation of global models (CMIP6) for Italy is by itself a novelty. Although several products are already available at comparable or higher resolutions, they are in some cases limited to the current climate as they are reanalysis or hindcast products (Giordani et al., 2023; Viterbo et al., 2024), while scenario projections are still referenced to CMIP5 drivers and are available either at mid-century or for short time slices (Pichelli et al., 2021; Raffa et al., 2023).
For all the scenarios and seasons there is a projected general warming along with an intensification of the hydrological cycle over most of continental Europe and mean precipitation reduction over the Mediterranean region accompanied, over the Italian Peninsula, by a strong increase in the intensity of extreme precipitation events, particularly relevant for the SSP5-8.5 scenario during autumn.
Finally, let us remark that both the intermediate and high-resolution simulations are potentially usable as boundary conditions for further convection-permitting scale (finer than 4 km) downscaling. This will be the subject of future work, along with the investigation of any possible improvements deriving from increasing the resolution, especially in relation to known issues about the convection representation (early onset, drizzle problem, underrepresentation of extreme intensity precipitation).
Very high-resolution simulations may be planned over limited areas following the needs of impact researchers. Further room for improvement is expected by moving to an explicit simulation of convection, and the comparison with the results obtained in the gray zone will be of particular interest from the perspective of using climate data to produce relevant information in terms of climate indicators for climate services.
The current version of WRF is available from the project website at https://github.com/wrf-model/WRF/tree/v4.2.2 (last access: 21 January 2025) (WRF-ARW DOI https://doi.org/10.5065/D6MK6B4K, WRF, 2025) under the following license.
WRF was developed at the National Center for Atmospheric Research (NCAR), which is operated by the University Corporation for Atmospheric Research (UCAR). NCAR and UCAR make no proprietary claims, either statutory or otherwise, to this version and release of WRF and consider WRF to be in the public domain for use by any person or entity for any purpose without any fee or charge. UCAR requests that any WRF user include this notice on any partial or full copies of WRF. WRF is provided on an “as is” basis and any warranties, either express or implied, including but not limited to implied warranties of non-infringement, originality, merchantability and fitness for a particular purpose, are disclaimed. In no event shall UCAR be liable for any damages, whatsoever, whether direct, indirect, consequential or special, that arise out of or in connection with the access, use or performance of WRF, including infringement actions.
The ERA5 dataset (Hersbach et al., 2020) is freely accessible after registration from the Copernicus Climate Data Store at https://cds.climate.copernicus.eu/datasets (last access: 15 November 2024). The MPI-ESM data are freely available on the Earth System Grid Federation (ESGF). Because of the large volume (> 300 TB), the WRF output data and the scripts used for the visualization in this paper can only be made available upon request.
Codes used to generate the original figures appearing in this study are available through DOI https://doi.org/10.5281/zenodo.15738230 (Struglia, 2025).
The supplement related to this article is available online at https://doi.org/10.5194/gmd-18-6095-2025-supplement.
GP, AD, and AA designed the experiments, and AA carried them out and performed the simulations. AA, MA, EP, SC, and FC performed data curation and formal analysis. MVS conceptualized the work and prepared the paper with contributions from all co-authors.
The contact author has declared that none of the authors has any competing interests.
Publisher’s note: Copernicus Publications remains neutral with regard to jurisdictional claims made in the text, published maps, institutional affiliations, or any other geographical representation in this paper. While Copernicus Publications makes every effort to include appropriate place names, the final responsibility lies with the authors.
We acknowledge the World Climate Research Programme, which, through its Working Group on Coupled Modelling, coordinated and promoted CMIP6. Within this we thank the CMIP6 endorsement of the High-Resolution Model Intercomparison Project (HighResMIP) and Martin Schupfner for providing additional data from the MPI-ESM. The computing resources and the related technical support used for this work have been provided by the CRESCO/ENEA-GRID high-performance computing infrastructure and its staff.
This study was carried out within the following.
Project KNOWING received funding from the European Union's Horizon Europe research and innovation program under grant agreement no. 101056841 funded by the European Union – GA Project 1011056841.
The RETURN Extended Partnership received funding from the European Union Next-GenerationEU (National Recovery and Resilience Plan – NRRP, Mission 4, Component 2, Investment 1.3 – D.D. 1243 2/8/2022, PE0000005).
The ICSC Italian Research Center on High-Performance Computing, Big Data and Quantum Computing received funding from the European Union Next-GenerationEU (National Recovery and Resilience Plan – NRRP, Mission 4, Component 2, Investment 1.4 – D.D: 3138 16/12/2021, CN00000013).
This paper was edited by Stefan Rahimi-Esfarjani and reviewed by two anonymous referees.
Anav, A., Antonelli, M., Calmanti, S., Carillo, A., Catalano, F., Dell'Aquila, A., Iacono, R., Marullo, S., Napolitano, E., Palma, M., Pisacane, G., Sannino, G., and Struglia, M. V.: Dynamical downscaling of CMIP6 scenarios with ENEA-REG: an impact-oriented application for the Med-CORDEX region, Clim. Dynam., 62, 3261–3287, https://doi.org/10.1007/s00382-023-07064-3, 2024.
Arrighi, C. and Domeneghetti, A.: Brief communication: On the environmental impacts of the 2023 floods in Emilia-Romagna (Italy), Nat. Hazards Earth Syst. Sci., 24, 673–679, https://doi.org/10.5194/nhess-24-673-2024, 2024.
Ban, N., Schmidli, J., and Schär, C.: Evaluation of the new convective-resolving regional climate modelling approach in decade-long simulations, J. Geophys. Res-Atmos., 119, 7889–7907, https://doi.org/10.1002/2014JD021478, 2014.
Ban, N., Caillaud, C., Coppola, E., Pichelli, E., Sobolowski, S., Adinolfi, M., Ahrens, B., Alias, A., Anders, I., Bastin, S., Belušić, D., Berthou, S., Brisson, E., Cardoso, R. M., Chan, S. C., Christensen, O. B., Fernández, J., Fita, L., Frisius, T., Gašparac, G., Giorgi, F., Goergen, K., Haugen, J. E., Hodnebrog, Ø., Kartsios, S., Katragkou, E., Kendon, E. J., Keuler, K., Lavin-Gullon, A., Lenderink, G., Leutwyler, D., Lorenz, T., Maraun, D., Mercogliano, P., Milovac, J., Panitz, H.-J., Raffa, M., Reca Remedio, A., Schär, C., Soares, P. M. M., Srnec, L., Steensen, B. M., Stocchi, P., Tolle, M. H., Truhetz, H., Vergara-Temprado, J., de Vries, M. H., Warrach-Sagi, K., Wulfmeyer, V., and Zander, M. J.: The first multi-model ensemble of regional climate simulations at kilometer-scale resolution, part I: evaluation of precipitation, Clim. Dynam., 57, 275–302, https://doi.org/10.1007/s00382-021-05708-w, 2021.
Belušić Vozila, A., Belušić c, D., Prtenjak, M. T., Güttler, I., Bastin, S., Brisson,E., Demory, M.-E., Dobler, A., Feldmann, H., Hodnebrog, Ø., Kartsios, S., Keuler, K., Lorenz, T., Milovac, J., Pichelli, E., Raffa, M., Soares, P. M. M., Tolle, M. H., Truhetz, H., de Vries, M. H., and Warrach-Sagi, K.: Evaluation of the near-surface wind field over the Adriatic region: local wind characteristics in the convection-permitting model ensemble, Clim. Dynam., 62, 4617–4634, https://doi.org/10.1007/s00382-023-06703-z, 2023.
Buzzi, A., Tartaglione, N., and Malguzzi, P.: Numerical simulations of the 1994 Piedmont flood: Role of orography and moist processes, Mon. Weather Rev., 126, 2369–2383, 1998.
Buzzi, A., Davolio, S., and Fantini, M.: Cyclogenesis in the lee of the Alps: a review of theories, B. Atmos. Sci. Technol. 1, 433–457, https://doi.org/10.1007/s42865-020-00021-6, 2020.
Caillaud, C., Somot, S., Douville, H., Alias, A., Bastin, S., Brienen, S., Demory, M., Dobler, A., Feldmann, H., Frisius, T., Goergen, K., Kendon, E. J., Keuler, K., Lenderink, G., Mercogliano, P., Pichelli, E., Soares, P. M. M., Tolle, M. H., and de Vries, H.: Northwestern Mediterranean heavy precipitation events in a warmer climate: robust versus uncertain changes with a large convection-permitting model ensemble, Geophys. Res. Lett., 51, https://doi.org/10.1029/2023GL105143, 2024.
Coppola, E., Sobolowski, S., Pichelli, E., Raffaele, F., Ahrens, B., Anders, I., Ban, N., Bastin, S., Belda, M., Belusic, D., Caldas-Alvarez, A., Cardoso, R. M., Davolio, S., Dobler, A., Fernandez, J., Fita, L., Fumiere, Q., Giorgi, F., Goergen, K., Güttler, I., Halenka, T., Heinzeller, D., Hodnebrog, Ø., Jacob, D., Kartsios, S., Katragkou, E., Kendon, E., Khodayar, S., Kunstmann, H., Knist, S., Lavín-Gullón, A., Lind, P., Lorenz, T., Maraun, D., Marelle, L., van Meijgaard, E., Milovac, J., Myhre, G., Panitz, H.-J., Piazza, M., Raffa, M., Raub, T., Rockel, B., Schär, C., Sieck, K., Soares, P. M. M., Somot, S. Srnec, L., Stocchi, P., Tölle, M. H., Truhetz, H., Vautard, R., de Vries, H., and Warrach-Sagi, K.: A first-of-its-kind multi-model convection permitting ensemble for investigating convective phenomena over Europe and the Mediterranean, Clim. Dynam., 55, 3–34, https://doi.org/10.1007/s00382-018-4521-8, 2020.
Cornes, R., van der Schrier, G., van den Besselaar, E. J. M., and Jones, P.: An Ensemble Version of the E-OBS Temperature and Precipitation Datasets, J. Geophys. Res-Atmos., 123, https://doi.org/10.1029/2017JD028200, 2018.
Dickinson, R. E., Errico, R. M., Giorgi, F., and Bates, G. T.: A regional climate model for the western United States, Climatic Change, 15, 383–422, https://doi.org/10.1007/BF00240465, 1989.
Doblas-Reyes, F., Sörensson, A., Almazroui, M., Dosio, A., Gutowski, W., Haarsma, R., Hamdi, R., Hewitson, B., Kwon, W.-T., Lamptey, B., Maraun, D., Stephenson, T., Takayabu, I., Terray, L., Turner, A., and Zuo, Z.: Linking Global to Regional Climate Change, in: Climate Change 2021: The Physical Science Basis. Contribution of Working Group I to the Sixth Assessment Report of the Intergovernmental Panel on Climate Change, edited by: Masson-Delmotte, V., Zhai, P., Pirani, A., Connors, S., Péan, C., Berger, S., Caud, N., Chen, Y., Goldfarb, L., Gomis, M., Huang, M., Leitzell, K., Lonnoy, E., Matthews, J., Maycock, T., Waterfield, T., Yelekçi, O., Yu, R., and Zhou, B., 1363–1512, Cambridge University Press, Cambridge, United Kingdom and New York, NY, USA, https://doi.org/10.1017/9781009157896.012, 2021.
Ducrocq, V., and coauthors et al.: HyMeX-SOP1: The Field Campaign Dedicated to Heavy Precipitation and Flash Flooding in the Northwestern Mediterranean, B. Am. Meteorol. Soc., 95, 1083–1100, https://doi.org/10.1175/BAMS-D-12-00244.1, 2014.
Eyring, V., Bony, S., Meehl, G. A., Senior, C. A., Stevens, B., Stouffer, R. J., and Taylor, K. E.: Overview of the Coupled Model Intercomparison Project Phase 6 (CMIP6) experimental design and organization, Geosci. Model Dev., 9, 1937–1958, https://doi.org/10.5194/gmd-9-1937-2016, 2016.
Ferreira, M.: Extremal index: estimation and resampling, Comput. Stat., 39, 2703–2720, https://doi.org/10.1007/s00180-023-01406-9, 2024.
Feser, F., Rockel, B., von Storch, H., Winterfeldt, J. and Zahn, M.: Regional Climate Models Add Value to Global Model Data: A Review and Selected Examples. Bull. Amer. Meteor. Soc., 92, 1181–1192, https://doi.org/10.1175/2011BAMS3061.1, 2011.
Foley, A. M.: Uncertainty in regional climate modelling: A review, Prog. Phys. Geogr., 34, 647–670, https://doi.org/10.1177/0309133310375654, 2010.
Fosser, G., Gaetani, M., Kendon, E. J., Adinolfi, M., Ban, N., Belušić, D., Caillaud, C., Careto, J. A. M., Coppola, E., Demory, M. E., de Vries, H., Dobler, A., Feldmann, H., Goergen, K., Lenderink, G., Pichelli, E., Schär, C., Soares, P. M. M., Somot, S., and Tölle, M. H.: Convection-permitting climate models offer more certain extreme rainfall projections, Npj Clim. Atmos. Sci., 7, 51, https://doi.org/10.1038/s41612-024-00600-w, 2024.
Freitas, S. R., Grell, G. A., and Li, H.: The Grell–Freitas (GF) convection parameterization: recent developments, extensions, and applications, Geosci. Model Dev., 14, 5393–5411, https://doi.org/10.5194/gmd-14-5393-2021, 2021.
Fuhrer, O., Chadha, T., Hoefler, T., Kwasniewski, G., Lapillonne, X., Leutwyler, D., Lüthi, D., Osuna, C., Schär, C., Schulthess, T. C., and Vogt, H.: Near-global climate simulation at 1 km resolution: establishing a performance baseline on 4888 GPUs with COSMO 5.0, Geosci. Model Dev., 11, 1665–1681, https://doi.org/10.5194/gmd-11-1665-2018, 2018.
Giordani, A., Cerenzia, I. M. L., Paccagnella, T., and Di Sabatino, S.: SPHERA, a new convection-permitting regional reanalysis over Italy: Improving the description of heavy rainfall, Q. J. RMS, 149, 781–808, https://doi.org/10.1002/qj.4428, 2023.
Giorgi, F.: Thirty years of regional climate modeling: Where are we and where are we going next?, J. Geophys. Res.-Atmos., 124, 5696–5723, https://doi.org/10.1029/2018JD030094, 2019.
Giorgi, F. and Gutowski, W. J.: Regional Dynamical Downscaling and the CORDEX Initiative, Annu. Rev. Environ. Res., 40, 467–490, https://doi.org/10.1146/annurev-environ-102014-021217, 2015.
Giorgi, F., Hewitson, B., Arritt, R., Gutowski, W., Gutowski, W., Knutson, T., and Landsea, C.: Regional climate information – evaluation and projections, chap. 10 of: Climate Change 2001: The Scientific Basis. Contribution of Working Group I to the Third Assessment Report of the Intergovernmental Panel on Climate Change, edited by: Houghton, J. T., Ding, Y., Griggs, D. J., Noguer, M., vad der Linden, P. J., Dai,X., Maskell, K., Johnson, C. A., Cambridge University Press, Cambridge, United Kingdom and New York, NY, USA, 583–638, https://dr.lib.iastate.edu/handle/20.500.12876/38038 (last access: 15 November 2024), 2001.
Giorgi, F., Jones, C., and Asrar, G. R.: Addressing climate information needs at the regional level: the CORDEX framework, WMO Bull., 58, 175–183, 2009.
Giorgi, F., Coppola, E., Jacob, D., Teichmann, C., Abba Omar, S., Ashfaq, M., Ban, N., Bülow, K., Bukovsky, M., Buntemeyer, L., Cavazos, T., Ciarlo`, J., da Rocha, R. P., Das, S., di Sante, F., Evans, J. P., Gao, X., Giuliani, G., Glazer, R. H., Hoffmann, P., Im, E., Langendijk, G., Lierhammer, L., Llopart, M., Mueller, S., Luna-Nino, R., Nogherotto, R., Pichelli, E., Raffaele, F., Reboita, M., Rechid, D., Remedio, A., Remke, T., Sawadogo, W., Sieck, K., Torres-Alavez, J. A., and Weber, T.: The CORDEX-CORE EXP-I Initiative: Description and Highlight Results from the Initial Analysis, B. Am. Meteorol. Soc., 103, E293–E310, https://doi.org/10.1175/BAMS-D-21-0119.1, 2022.
Grell, G. A. and Freitas, S. R.: A scale and aerosol aware stochastic convective parameterization for weather and air quality modeling, Atmos. Chem. Phys., 14, 5233–5250, https://doi.org/10.5194/acp-14-5233-2014, 2014.
Gutjahr, O., Putrasahan, D., Lohmann, K., Jungclaus, J. H., von Storch, J.-S., Brüggemann, N., Haak, H., and Stössel, A.: Max Planck Institute Earth System Model (MPI-ESM1.2) for the High-Resolution Model Intercomparison Project (HighResMIP), Geosci. Model Dev., 12, 3241–3281, https://doi.org/10.5194/gmd-12-3241-2019, 2019.
Haarsma, R. J., Roberts, M. J., Vidale, P. L., Senior, C. A., Bellucci, A., Bao, Q., Chang, P., Corti, S., Fučkar, N. S., Guemas, V., von Hardenberg, J., Hazeleger, W., Kodama, C., Koenigk, T., Leung, L. R., Lu, J., Luo, J.-J., Mao, J., Mizielinski, M. S., Mizuta, R., Nobre, P., Satoh, M., Scoccimarro, E., Semmler, T., Small, J., and von Storch, J.-S.: High Resolution Model Intercomparison Project (HighResMIP v1.0) for CMIP6, Geosci. Model Dev., 9, 4185–4208, https://doi.org/10.5194/gmd-9-4185-2016, 2016.
Hanley, K. E., Plant, R. S., Stein, T. H. M., Hogan, R. J., Nicol, J. C., Lean, H. W., Halliwell, C., and Clark, P. A.: Mixing-length controls on high-resolution simulations of convective storms, Q. J. R. Meteorol. Soc., 141, 272–284, https://doi.org/10.1002/qj.2356,2015
Hersbach, H., Bell, B., Berrisford, P., Hirahara, S., Horányi, A., Muñoz-Sabater, J., Nicolas, J., Peubey C., Radu, R., Schepers, D., Simmons, A., Soci, C, Abdalla, S., Abellan, X, Balsamo, G., Bechtold, P., Biavati, G., Bidlot, J., Bonavita, M., De Chiara, G., Dahlgren, P., Dee, D., Diamantakis, M., Dragani, R., Flemming, J., Forbes, R., Fuentes, M., Geer, A., Haimberger, L., Healy, S., Hogan, R. J., Hólm, E., Janisková, M., Keeley, S., Laloyaux, P., Lopez, P., Lupu, C., Radnoti, G., de Rosnay, P., Rozum, I., Vamborg, F., Villaume, S., and Thépaut, J.-N.: The ERA5 global reanalysis, Q. J. Roy. Meteor. Soc., 146, 1999–2049, https://doi.org/10.1002/qj.3803, 2020.
Hohenegger, C., Brockhaus, P., and Schaer, C.: Towards climate simulations at cloud-resolving scales, Meteorol. Z., 17, 383–394, https://doi.org/10.1127/0941-2948/2008/0303, 2008.
Iacono, M. J., Delamere, J. S., Mlawer, E. J., Shephard, M. W., Clough, S. A., and Collins, W. D.: Radiative forcing by long-lived greenhouse gases: Calculations with the AER radiative transfer models, J. Geophys. Res., 113, D13103, https://doi.org/10.1029/2008JD009944, 2008.
Im, E. S., Park, E. H., Kwon, W. T., and Giorgi, F.: Present climate simulation over Korea with a regional climate model using a one-way double-nested system, Theor. Appl. Climatol., 86, 187–200, https://doi.org/10.1007/s00704-005-0215-3, 2006.
Jeevanjee, N.: Vertical velocity in the gray zone, J. Adv. Model. Earth Sy., 9, 2304–2316, https://doi.org/10.1002/2017MS001059, 2017.
Jeworrek, J., West, G., and Stull, R.: Evaluation of Cumulus and Microphysics Parameterizations in WRF across the Convective Gray Zone, Weather Forecast., 34, 1097–1115, https://doi.org/10.1175/WAF-D-18-0178.1, 2019.
Ji, Z. and Kang, S.: Double-Nested Dynamical Downscaling Experiments over the Tibetan Plateau and Their Projection of Climate Change under Two RCP Scenarios, J. Atmos. Sci., 70, 1278–1290, https://doi.org/10.1175/JAS-D-12-0155.1, 2013.
Kendon, E. J., Ban, N., Roberts,N.M.,Fowler, H. J., Roberts, M. J.,Chan, S. C., Evans, J. P.,Fosser, G., and Wilkinson, J. M.: Do Convection-Permitting Regional Climate Models Improve Projections of Future Precipitation Change?. Bull. Amer. Meteor. Soc., 98, 79–93, https://doi.org/10.1175/BAMS-D-15-0004.1, 2017
Klaver, R., Haarsma, R., Vidale, P. L., and Hazeleger, W.: Effective resolution in high resolution global atmospheric models for climate studies, Atmos. Sci. Lett., 21, https://doi.org/10.1002/asl.952, 2020.
Kotlarski, S., Keuler, K., Christensen, O. B., Colette, A., Déqué, M., Gobiet, A., Goergen, K., Jacob, D., Lüthi, D., van Meijgaard, E., Nikulin, G., Schär, C., Teichmann, C., Vautard, R., Warrach-Sagi, K., and Wulfmeyer, V.: Regional climate modeling on European scales: a joint standard evaluation of the EURO-CORDEX RCM ensemble, Geosci. Model Dev., 7, 1297–1333, https://doi.org/10.5194/gmd-7-1297-2014, 2014.
La Barbera, P., Lanza, L.G., and Stagi, L.: Tipping bucket mechanical errors and their influence on rainfall statistics and extremes, Water Sci. Technol., 45, 1–9, https://doi.org/10.2166/wst.2002.0020, 2002.
Mahajan, S., Evans, K. J., Branstetter, M. L., and Tang, Q.: Model resolution sensitivity of the simulation of North Atlantic Oscillation teleconnections to precipitation extremes, J. Geophys. Res.-Atmos., 123, 11392–11409, https://doi.org/10.1029/2018JD028594, 2018.
Liu, C., Ikeda, K., Thompson, G., Rasmussen, R., and Dudhia, J.: High-Resolution Simulations of Wintertime Precipitation in the Colorado Headwaters Region: Sensitivity to Physics Parameterizations, Mon. Weather Rev., 139, 3533–3553, https://doi.org/10.1175/MWR-D-11-00009.1, 2011.
Lucas-Picher, P., Argüeso, D., Brisson, E., Tramblay, Y., Berg, P., Lemonsu, A., Kotlarski, S., and Caillaud, C.: Convection-permitting modeling with regional climate models: latest developments and next steps, Wires Rev . Clim. Change, 12, e731, https://doi.org/10.1002/wcc.731, 2021.
Moeng, C. H., Sullivan, P., Khairoutdinov, M., and Randall, D.: A mixed scheme for subgrid-scale fluxes in cloud-resolving models, J. Atmos. Sci., 67, 3692–3705, 2010.
Müller, S. K., Pichelli, E., Coppola, E., Berthou, S., Brienen, S., Caillaud, C., Demory, M. E., Dobler, A.Feldmann, H., Mercogliano, P., Tölle, M., and de Vries, H.: The climate change response of alpine-mediterranean heavy precipitation events, Clim. Dynam., 62, 165–186, https://doi.org/10.1007/s00382-023-06901-9, 2024.
Müller, W. A., Jungclaus, J. H., Mauritsen, T., Baehr, J., Bittner, M., Budich, R., Bunzel, F., Esch, M., Ghosh, R., Haak, H., Ilyina, T., Kleine, T., Kornblueh, L., Li, H., Modali, K., Notz, D., Pohlmann, H., Roeckner, E., Stemmler, I., Tian, F., and Marotzke, J.: A higher-resolution version of the Max Planck Institute Earth System Model (MPI-ESM1. 2-HR), J. Adv. Model. Earth Sy., 10, 1383–1413, https://doi.org/10.1029/2017MS001217, 2018.
Muñoz-Sabater, J., Dutra, E., Agustí-Panareda, A., Albergel, C., Arduini, G., Balsamo, G., Boussetta, S., Choulga, M., Harrigan, S., Hersbach, H., Martens, B., Miralles, D. G., Piles, M., Rodríguez-Fernández, N. J., Zsoter, E., Buontempo, C., and Thépaut, J.-N.: ERA5-Land: a state-of-the-art global reanalysis dataset for land applications, Earth Syst. Sci. Data, 13, 4349–4383, https://doi.org/10.5194/essd-13-4349-2021, 2021.
Nakanishi, M. and Niino, H.: Development of an improved turbulence closure model for the atmospheric boundary layer, J. Meteorol. Soc. Jpn., 87, 895–912, https://doi.org/10.2151/jmsj.87.895, 2009.
Niu, G.-Y, Yang, Z.-L., Mitchell, K. E., Chen, F., Ek, M. B., Barlage, M., Kumar, A., Manning, K., Niyogi, D., Rosero, E., Tewari, M., and Xia, Y.: The community Noah land surface model with multi parameterization options (Noah-MP): 1. Model description and evaluation with local-scale measurements, J. Geophys. Res., 116, D12109, https://doi.org/10.1029/2010JD015139, 2011.
O'Neill, B. C., Tebaldi, C., van Vuuren, D. P., Eyring, V., Friedlingstein, P., Hurtt, G., Knutti, R., Kriegler, E., Lamarque, J.-F., Lowe, J., Meehl, G. A., Moss, R., Riahi, K., and Sanderson, B. M.: The Scenario Model Intercomparison Project (ScenarioMIP) for CMIP6, Geosci. Model Dev., 9, 3461–3482, https://doi.org/10.5194/gmd-9-3461-2016, 2016.
Panosetti, D., Schlemmer, L., and Schär, C.: Convergence behavior of idealized convection-resolving simulations of summertime deep moist convection over land, Clim. Dynam., https://doi.org/10.1007/S00382-018-4229-9, 2018.
Panosetti, D., Schlemmer, L., and Schär, C.: Bulk and structural convergence at convection-resolving scales in real-case simulations of summertime moist convection over land, Q. J. Roy. Meteor. Soc., 145, 1427–1443, https://doi.org/10.1002/qj.3502, 2019.
Park, H., Hwang, J., Cha, D.‐H., Lee, M.‐ I., Song, C.‐K., Kim, J.,Park, S-H., and Lee, D-K. : Does a scale‐aware convective parameterization scheme improve the simulation of heavy rainfall events? Journal of Geophysical Research: Atmospheres, 129, e2023JD039407, https://doi.org/10.1029/2023JD039407, 2024.
Pichelli, E. and the CORDEX-FPSCONV Team: Detection of disastrous convective events in the great alpine region and analysis of their sensitivity to the climate change, EGU General Assembly 2023, Vienna, Austria, 24–28 Apr 2023, EGU23-11196, https://doi.org/10.5194/egusphere-egu23-11196, 2023.
Pichelli, E., Coppola, E., Sobolowski, S. Ban, N., Giorgi, F., Stocchi, P., Alias, A., Belušić, D., Berthou, S., Caillaud, C., Cardoso, R. M., Chan, S. C., Christensen, O. B., Dobler, A., de Vries, H., Goergen, K., Kendon, E. J., Keuler, K., Lenderink, G., Lorenz, T., Mishra, A. N., Panitz, H.-J., Schär,C., Soares,P. M. M., Truhetz, H., and Vergara-Temprado, J.: The first multi-model ensemble of regional climate simulations at kilometer-scale resolution part 2: historical and future simulations of precipitation, Clim. Dynam. 56, 3581–3602, https://doi.org/10.1007/s00382-021-05657-4, 2021.
Prein, A. F., Langhans, W., Fosser, G., Ferrone, A., Ban, N., Goergen, K., Keller, M., Tölle, M., Gutjahr, O., Feser, F., Brisson, E., Kollet, S., Schmidli, J., van Lipzig, N. P. M., and Leung, R.: A review on regional convection-permitting climate modeling: Demonstrations, prospects, and challenges, Rev. Geophys., 53, 323–361, https://doi.org/10.1002/2014RG000475, 2015.
Raffa, M., Adinolfi, M., Reder, A., Marras, G.F., Mancini, M., Scipione, G., Santini, M., and Mercogliano, P.: Very High Resolution Projections over Italy under different CMIP5 IPCC scenarios, Sci. Data 10, 238, https://doi.org/10.1038/s41597-023-02144-9, 2023.
Ranasinghe, R., Ruane, A. C., Vautard, R., Arnell, N., Coppola, E., Cruz, F. A., Dessai, S., Islam, A. S., Rahimi, M., Ruiz Carrascal, D., Sillmann, J., Sylla, M. B., Tebaldi, C., Wang, W., and Zaaboul, R.: Intergovernmental Panel on Climate Change (IPCC). Climate Change Information for Regional Impact and for Risk Assessment, in: Climate Change 2021 – The Physical Science Basis: Working Group I Contribution to the Sixth Assessment Report of the Intergovernmental Panel on Climate Change, Cambridge University Press, 1767–1926, https://doi.org/:10.1017/9781009157896.014, 2023.
Rebora, N., Molini, L., Casella, E., Comellas, A., Fiori, E., Pignone, F., Siccardi, F., Silvestro, F., Tanelli, S., and Parodi, A.: Extreme Rainfall in the Mediterranean: What Can We Learn from Observations?, J. Hydrometeorol., 14, 906–922, https://doi.org/10.1175/JHM-D-12-083.1, 2013.
Ridal, M., Bazile, E., Le Moigne, P., Randriamampianina, R., Schimanke, S., Andrae, U., Berggren, L., Brousseau, P., Dahlgren, P., Edvinsson, L., El-Said, A., Glinton, M., HagelinS., Hopsch, S., Isaksson, L.,Medeiros, P., Olsson, E., Unden, P., Wang, Z.Q.: CERRA, the Copernicus European Regional Reanalysis system, Q. J. Roy. Meteor. Soc., 150, 3385–3411, https://doi.org/10.1002/qj.4764, 2024.
Ruti, P. M., Somot, S., Giorgi, F., Dubois, C., Flaounas, E., Obermann, A., Dell'Aquila, A., Pisacane, G., Harzallah, A., Lombardi, E., Ahrens, B., Akhtar, N., Alias, A., Arsouze, T., Aznar, R., Bastin, S., Bartholy, J., Béranger, K., Beuvier, J., Bouffies-Cloché, S., Brauch, J., Cabos, W., Calmanti, S., Calvet, J.-C., Carillo, A., Conte, D., Coppola, E., Djurdjevic, V., Drobinski, P., Elizalde-Arellano, A., Gaertner, M., Galàn, P., Gallardo, C., Gualdi, S., Goncalves, M., Jorba, O., Jordà, G., L'Heveder, B., Lebeaupin-Brossier, C., Li, L., Liguori, G., Lionello, P., Maciàs, D., Nabat, P., Önol, B., Raikovic, B., Ramage, K., Sevault, F., Sannino, G., Struglia, M. V., Sanna, A., Torma, C., and Vervatis, V.: Med-CORDEX Initiative for Mediterranean Climate Studies, B. Am. Meteorol. Soc., 97, 1187–1208, https://doi.org/10.1175/BAMS-D-14-00176.1, 2016.
Rotunno, R. and Ferretti, R.: Mechanisms of intense Alpine rainfall. J. Atmos. Sci., 58, 1732–1749, 2001.
Rotunno, R. and Houze, R. A.: Lessons on orographic precipitation from the Mesoscale Alpine Programme, Q. J. Roy. Meteor. Soc., 133, 811–830, https://doi.org/10.1002/qj.67, 2007.
Sangelantoni, L., Sobolowski, S., Lorenz, T., Hodnebrog, Ø., Cardoso, R. M., Soares, P. M. M., Ferretti, R., Lavín-Gullón, A., Fernandez, J., Goergen, K., Milovac, J., Katragkou, E., Kartsios, S., Coppola, E., Pichelli, E., Adinolfi, M., Mercogliano, P., Berthou, S., de Vries, H., Dobler, A., Belušić, D., Feldmann, H., Tölle, M. H., and Bastin, S.: Investigating the representation of heatwaves from an ensemble of km-scale regional climate simulations within CORDEX-FPS convection, Clim. Dynam., 62, 4635–4671, https://doi.org/10.1007/s00382-023-06769-9, 2024.
Soares, P. M. M., Careto, J. A. M., Cardoso, R. M., Goergen, K., Katragkou, E., Sobolowski, S., Coppola, E., Ban, N., Belušić, D., Berthou, S., Caillaud, C., Dobler, A., Hodnebrog, Ø., Kartsios, S., Lenderink, G., Lorenz, T., Milovac, J., Feldmann, H., Pichelli, E., Truhetz, H., Demory, M. E., de Vries, H., Warrach-Sagi, K., Keuler, K., Raffa, M., Tölle, M., Sieck, K., and Bastin, S.: The added value of km-scale simulations to describe temperature over complex orography: the CORDEX FPS-Convection multi-model ensemble runs over the Alps. Clim. Dynam., 62, 4491–4514, https://doi.org/10.1007/s00382-022-06593-7, 2024.
Skamarock, W. C. and Klemp, J. B.: A time-split nonhydrostatic atmospheric model for weather research and forecasting applications, J. Comput. Phys., 227, 3465–3485, https://doi.org/10.1016/j.jcp.2007.01.037, 2008.
Struglia, M. V.: Codes used to generate the original figures of https://doi.org/10.5194/egusphere-2025-387, Zenodo [code], https://doi.org/10.5281/zenodo.15738230, 2025.
Torma, C., Giorgi, F., and Coppola, E.: Added value of regional climate modeling over areas characterized by complex terrain precipitation over the alps, J. Geophys. Res.-Atmos., 120, 3957–3972, https://doi.org/10.1002/2014JD022781, 2015.
Thompson, G., Field, P. R., Rasmussen, R. M., and Hall, W. D.: Explicit forecasts of winter precipitation using an improved bulk microphysics scheme. Part II: Implementation of a new snow parameterization, Mon Weather Rev., 136, 5095–5115, https://doi.org/10.1175/2008MWR2387.1, 2008.
Vergara-Temprado, J., Ban, N., Panosetti, D., Schlemmer, L., and Schär, C.: Climate Models Permit Convection at Much Coarser Resolutions Than Previously Considered, J. Climate, 33, 1915–1933, https://doi.org/10.1175/JCLI-D-19-0286.1, 2020.
Viterbo, F., Sperati, S., Vitali, B., D'Amico, F., Cavalleri, F., Bonanno, R., and Lacavalla, M.: MERIDA HRES: A new high-resolution reanalysis dataset for Italy. Meteorological Applications, 31, e70011, https://doi.org/10.1002/met.70011, 2024.
Wahl, S., Bollmeyer, C., Crewell, S., Figura, C., Friederichs, P., Hense, A., Keller, J. D., and Ohlwein, C.: A novel convective-scale regional reanalysis COSMO-REA2: Improving the representation of precipitation. Meteorol. Z., 26, 345–361, https://doi.org/10.1127/metz/2017/0824, 2017.
Weisman, M. L., Skamarock, W. C., and Klemp, J. B.: The resolution dependence of explicitly modeled convective systems, Mon. Weather Rev., 125, 527–548, 1997.
WRF-ARW Model: WRF Model Users' Page [code and static/input data], https://doi.org/10.5065/D6MK6B4K, 2025.
Wyngaard, J. C.: Toward numerical modeling in the “Terra incognita”, J. Atmos. Sci., 61, 1816–1826, 2004.
Yang, Z.-L., Niu, G.-Y., Mitchell, K. E., Chen, F., Ek, M. B., Barlage, M., Longuevergne, L., Manning, K., Niyogi, D., Tewari, M., and Xia, Y.: The community Noah land surface model with multi parameterization options (Noah-MP): 2.Evaluation over global river basins, J. Geophys. Res., 116, D12110, https://doi.org/10.1029/2010JD015140, 2011.