the Creative Commons Attribution 4.0 License.
the Creative Commons Attribution 4.0 License.
 | 11 Aug 2025
Spatially varying parameters improve carbon cycle modeling in the Amazon rainforest with ORCHIDEE r8849
Philippe Ciais
Yitong Yao
Daniel Goll
Sebastiaan Luyssaert
Isabel Martínez Cano
Arthur Fendrich
Laurent Li
Hui Yang
Sassan Saatchi
Ricardo Dalagnol
Uncertainty in the dynamics of the Amazon rainforest poses a critical challenge for accurately modeling the global carbon cycle. Current dynamic global vegetation models (DGVMs), which use one or two plant functional types for tropical rainforests, fail to capture observed biomass and mortality gradients in this region, raising concerns about their ability to predict forest responses to global change drivers. Here we assess the importance of spatially varying parameters to resolve ecosystem spatial heterogeneity in the ORCHIDEE (ORganizing Carbon and Hydrology in Dynamic EcosystEms) DGVM. Using satellite observations of tree aboveground biomass (AGB), gross primary productivity (GPP), and biomass mortality rates, we optimized two key parameters: the alpha self-thinning (α), which controls tree mortality induced by light competition, and the nitrogen use efficiency of photosynthesis (η), which regulates GPP. The model incorporating spatially optimized α and η parameters successfully reproduces the spatial variability of AGB (R2 = 0.82), GPP (R2 = 0.79), and biomass mortality rates (R2 = 0.73) when compared to remote sensing observations in intact Amazon rainforests, whereas the model using spatially constant parameters has R2 values lower than 0.04 for all observations. Furthermore, the relationships between the optimized parameters and ecosystem traits, as well as climate variables, were evaluated using random forest regression. We found that wood density emerges as the most important determinant of α, which is in line with existing theory, while water deficit conditions significantly impact η. This study presents an efficient and accurate approach to enhancing the simulation of Amazonian carbon pools and fluxes in DGVMs by assimilating existing observational data, offering valuable insights for future model development and parameterization.
- Article
(3053 KB) - Full-text XML
-
Supplement
(4318 KB) - BibTeX
- EndNote


More than half of the global rainforests are located in the Amazon basin, storing approximately 140 PgC in their living biomass (Pan et al., 2011; Vancutsem et al., 2021). They constitute an important carbon sink in intact forests, but deforestation and forest degradation can turn these areas into a carbon source (Brienen et al., 2015; Gatti et al., 2021). The Amazon rainforest is characterized by high levels of biodiversity, rainfall variability, and soil diversity (Malhi et al., 2004; ter Steege et al., 2006; Flores et al., 2010; Quesada et al., 2010; Castanho et al., 2013). These factors are only partly resolved in dynamic global vegetation models (DGVMs), which are widely used to predict vegetation responses to global environmental changes (Prentice et al., 2007). Therefore, current DGVMs can hardly capture continental-scale carbon fluxes and stock spatial gradients (Johnson et al., 2016), leading to even higher uncertainty in projecting future carbon dynamics in the Amazon rainforests.
The factors driving the spatial variability of carbon fluxes and stocks in the Amazon rainforests are complex and remain largely unresolved (Johnson et al., 2016; Muller-Landau et al., 2021). Field forest plots reveal a clear aboveground biomass (AGB) gradient: higher AGB in the northeast over the Guiana Shield, where nitrogen-fixing, large-seeded legume trees with lower growth rates are dominant, and lower AGB in the drier southwest, where non-legume trees thrive (ter Steege et al., 2006; Malhi et al., 2006; Mitchard et al., 2014). The biomass gradient results from the balance between the spatial variation in woody productivity and carbon losses, mainly through tree mortality. Field observations suggest a strong association between the spatial variation of tree mortality and the gradients of AGB (Malhi et al., 2015; Johnson et al., 2016). In western and southern regions, where natural disturbances are more frequent, dominant species tend to have higher growth rates, lower wood density, and higher mortality rates, supporting the “grow fast, die young” life history strategy, and maintaining stable biomass (Baker et al., 2004; Malhi et al., 2006; Keeling and Phillips, 2007; Esquivel-Muelbert et al., 2020; Brienen et al., 2020). Woody net primary productivity (NPP) is influenced by both climate conditions and soil fertility, particularly total soil phosphorus content, which is higher in the western region. The mortality rate could be driven by the intensity of forest disturbances, particularly windthrow and drought. In the western region, windstorms are the primary cause of tree death, while in the east-central and southern regions, drought is the dominant driver (Esquivel-Muelbert et al., 2020). Soil physical properties including soil depth, soil structure, topography, and anoxic conditions also influence tree mortality (Malhi et al., 2004; Quesada et al., 2012; Sousa et al., 2022; Feng et al., 2023).
Current DGVMs cannot capture the spatial heterogeneity in productivity, biomass, and mortality rates in the Amazon. While most models include detailed photosynthetic modules, they often ignore nutrient constraints on plant growth (e.g., phosphorus; Reed et al., 2015), and they simplify varied life history strategies to a few plant functional types with static parameters (e.g., mortality rates; Johnson et al., 2016). Although an increasing number of models have incorporated phosphorus cycles (Goll et al., 2012; Wang et al., 2010), simplified tree demography (Moorcroft et al., 2001; Rödig et al., 2017; Koven et al., 2020; Naudts et al., 2015), and drought-induced mortality (Yao et al., 2022), their capability to capture these spatial heterogeneities remains limited. More importantly, most models generally use one or two plant functional types (PFTs) with uniform parameters across the entire Amazon forest. Building upon these setups, in DGVMs, variations in biomass carbon pools across different locations are primarily driven by differences in climate forcing and soil properties. However, biomass variability in the Amazon rainforests cannot be fully explained by climate factors alone, and soil properties are inadequately represented in DGVMs due to the coarse resolution and simplified processes (Quesada et al., 2012; Galbraith et al., 2013; Saatchi et al., 2015; Joetzjer et al., 2022). Given the availability of various data for parameter estimations, applying a single set of PFT-specific parameters uniformly across the entire basin is no longer justifiable (Butler et al., 2017).
Several studies have attempted to simulate the spatial variations of biomass and gross primary productivity (GPP) in the Amazon forest by linking different processes or forcing the model with observed parameters. In models that apply a constant tree mortality rate, higher NPP is typically associated with higher biomass (Keeling and Phillips, 2007). Delbart et al. (2010) demonstrated that linking higher tree mortality rates to higher NPP in a DGVM can improve the simulation of spatial biomass variations, but may fail to capture current biomass sinks in pristine tropical forests (Brienen et al., 2015). Castanho et al. (2013) forced another DGVM with an interpolated map of observed woody biomass residence times and correlated maximum carboxylation rate (Vcmax) with a soil total phosphorus map. While this study successfully reproduced site-level woody NPP and AGB, the use of interpolated woody biomass residence times and soil phosphorus data, based on limited observations, remains questionable (Saatchi et al., 2015; He et al., 2023).
The increasing availability of remote sensing data provides wall-to-wall observations of key forest properties such as AGB, GPP, tree height, leaf area index (LAI), and normalized difference vegetation index (NDVI), which all remain underutilized for parameterizing and evaluating models. Rödig et al. (2017) developed an individual-based model, using a remote sensing canopy height map as a constraint, and linked mortality rates to soil clay fraction and precipitation to simulate the spatial gradient of biomass. Ma et al. (2024) incorporated more observations from satellites, including GPP, LAI, AGB, and forest age, and applied a stepwise calibration at the global scale. Despite these advancements, few studies have simultaneously employed multiple remote sensing datasets to optimize their models in the Amazon forest.
In this study, we aim to improve the modeled spatial gradient of biomass, productivity, and mortality across the intact Amazon rainforest in the ORCHIDEE (ORganizing Carbon and Hydrology in Dynamic EcosystEms) model. This model simulates forest demography based on tree cohorts and incorporates tree mortality mechanisms, including self-thinning and drought-induced mortality (Yao et al., 2022). We assessed whether spatial variation in model parameters can improve the ability of the ORCHIDEE model to simultaneously reproduce multiple observed patterns, including AGB, GPP, and biomass mortality rates derived from remote sensing data. Finally, we discuss mechanistic links between environmental factors and spatial gradients in model parameters by exploring the results of an explainable machine-learning method, in order to guide future model developments.
In this study, we describe the optimization of the model parameters for the Amazon forest (plant functional type: tropical broadleaf evergreen tree) using remote sensing data. We first set a baseline model with optimal, but spatially constant, parameters at the Amazon basin scale. Next, we allowed parameters to vary in space with a spatial resolution of 1° × 1°. Finally, we used a random forest model to derive relationships between the potential influencing factors and the optimal spatially varying parameters. This approach enabled us to explain the emerging spatial variations of the parameters across the Amazon basin and prescribe their spatial variability in the model (Fig. 1).
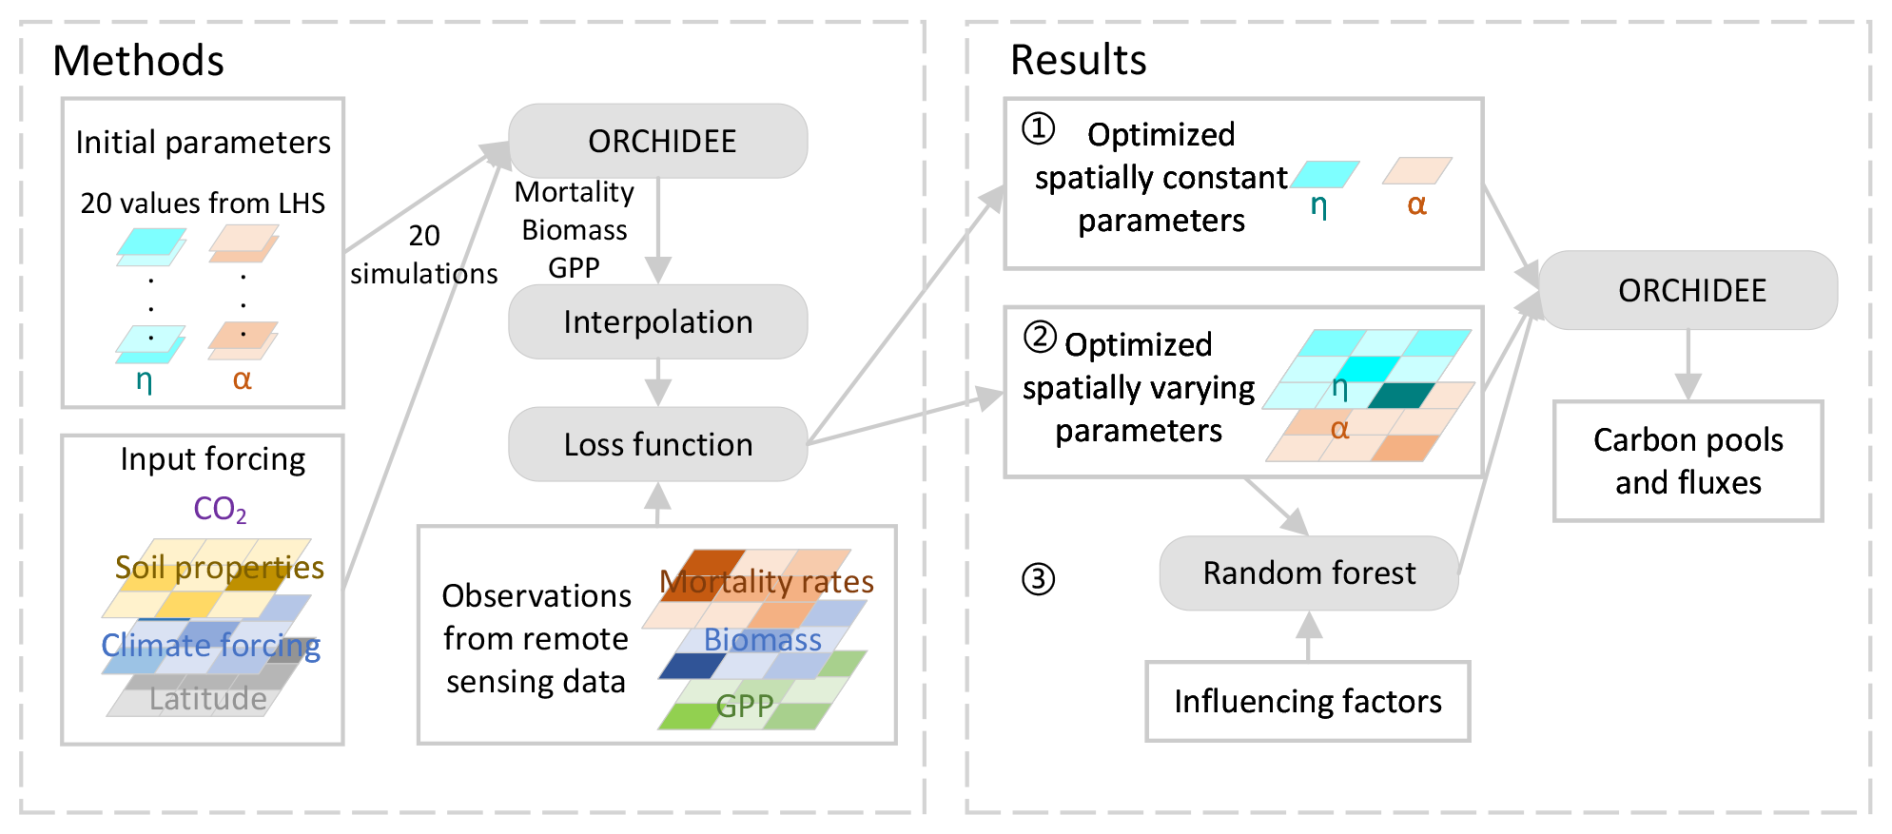
Figure 1Flowchart for the parameter optimization. η: nitrogen use efficiency; α: alpha self-thinning; LHS: Latin hypercube sampling; GPP: gross primary productivity.
2.1 Study area
This study focuses on the Amazon basin (79–43° W, 18° S–10° N), predominantly covered by old-growth, intact tropical evergreen rainforest (Flores et al., 2024). We excluded regions based on the following criteria: (1) areas with mean annual precipitation below 1500 mm and mean annual temperature below 18 °C based on CRUJRA v2.4 from 1901–1920 (Climatic Research Unit and Japanese Reanalysis data; Harris et al., 2020) to keep the focus on the warm and humid tropics; (2) grid cells (1° × 1°) with less than 10 % forest cover, based on forest pixels that are labeled as “undisturbed tropical moist forest” in TMF (tropical moist forest; Vancutsem et al., 2021) to exclude the pixels that were likely to be regrowing or degraded.
2.2 The ORCHIDEE model
ORCHIDEE is a global terrestrial ecosystem model that simulates energy, water, and carbon cycles (Krinner et al., 2005; Naudts et al., 2015; Vuichard et al., 2019). In this study, we used ORCHIDEE r8240 and further incorporated soil–tree–leaves hydraulics and drought-induced tree mortality (Yao et al., 2022). We also adjusted the NPP allocation parameters and forced the model with a spatially explicit wood density map (See Text S1, Table S1 in the Supplement; Chave et al., 2010; Yang et al., 2024a; Chen et al., 2020; Yang et al., 2021). These developments collectively constitute the new ORCHIDEE version r8849.
The input data for the ORCHIDEE model include soil texture and meteorological forcing (air temperature, precipitation, shortwave downward radiation, longwave downward radiation, specific humidity, wind speed, and atmospheric pressure). We used CRUJRA v2.4 with a 6 h temporal resolution as the source of meteorological forcing (Harris et al., 2020). To reduce computational time, we resampled the original CRUJRA data from a resolution of 0.5° × 0.5° to 1° × 1°. Consequently, all results are presented at 1° × 1° resolution. For soil texture data we used the Harmonized World Soils Database version 2.0 (HWSD2; Fig. S1 in the Supplement; FAO and IIASA, 2023), a comprehensive global soil database that includes various national datasets at a resolution of 1 km. In the ORCHIDEE model, soil texture determines the fractions of clay, silt, and sand, with other soil properties derived from a lookup table (Table S2) that controls soil hydraulic conductivity and soil water holding capacity. Soil depth is prescribed as 2 m in the model. Given that more than 99 % forest in our study area is tropical broad-leaved evergreen trees (Harper et al., 2023), we forced the model with only the tropical broad-leaved evergreen trees PFT in each pixel. Here, we provide a summary of the model processes. All the changed parameters are summarized in Table S1.
2.2.1 GPP
In the ORCHIDEE model, GPP is calculated based on the leaf scale model of Farquhar et al. (1980), further simplified by Yin and Struik (2009). The key parameters driving the photosynthesis process are Vcmax (µmol CO2 m−2 s−1) and Jmax (the maximum electron transport rate, µmol CO2 m−2 s−1), with Jmax typically assumed to be proportional to Vcmax. In the ORCHIDEE model, Vcmax is dynamically calculated as follows:
where (gN m−2) is the active nitrogen content in the leaves, Lighti is the fraction of cumulative light transmitted to canopy level i, and LAIi (m2 m−2) is the leaf area index at level i. The ORCHIDEE model utilizes a dynamic three-dimensional canopy structure model to simulate gap probability (Haverd et al., 2012). The crown is divided into n levels (n=10). At each level, the model calculates the leaf volume based on tree crown morphology and density. LAIi is then calculated by leaf mass, specific leaf area (SLA = 0.0153 m2 gC−1), and leaf volume for this layer. The canopy gap is calculated based on LAIi, tree height, tree density, and solar altitude angle. Lighti decreases progressively from 100 % at the top level to the gap fraction at the bottom level. Given the limited observations available to constrain the nitrogen cycle in the Amazon forest and prevailing limitation by geogenic soil nutrients like P or K, we instead prescribe leaf nitrogen concentration for the whole Amazon forest (Sitch et al., 2003). In addition, we deactivate nitrogen controls on ecosystem processes and associated soil–plant feedbacks (Text S2).
2.2.2 Biomass mortality rates
We defined biomass mortality rates as the ratio of biomass loss to the total biomass. The ORCHIDEE model incorporates 20 circumference tree size classes within each forest PFT (Naudts et al., 2015), thus facilitating the representation of annual recruitment of young individual trees, and tree mortality driven by light competition (i.e., self-thinning). Self-thinning-induced tree mortality is calculated as
where Nmax is the maximum number of trees per hectare for a given quadratic mean tree diameter (Dg, cm), and α (cm) and β are the self-thinning parameters. The model calculates the relative density index (RDI) as the ratio of the number of trees to Nmax. When the RDI exceeds an upper threshold (RDIupper), the excess trees are removed through mortality evenly in each circumference class, until the RDI reaches a lower threshold (RDIlower). Both RDIupper and RDIlower are cubic functions of Dg, with user-defined parameters. This self-thinning Eq. (2) indicates that the growth of some trees occurs at the expense of others, which die due to competition for limited resources such as water, light, or nutrients (Yu et al., 2024). The power-law function assumed in the model has been widely observed in the field plots (Enquist and Niklas, 2001; Muller-Landau et al., 2006). Higher values of α and β suggest greater environmental carrying capacity and lower biomass mortality rates. In the model, the default value for β is −0.73, which is close to the average value reported by Yu et al. (2024) for tropical forests. However, the default value for α has not been evaluated and, to our knowledge, no empirical estimates for α have been provided in previous studies. We thus estimate α based on field forest inventory data and find the average value is 1941 cm (Brienen et al., 2015).
The model also incorporates a drought-induced tree mortality module (Yao et al., 2022) to resolve periodic increases in mortality associated with droughts. When drought-induced mortality exceeds the mortality from the self-thinning process, the model assigns the total mortality rate to the drought-induced value; otherwise, it defaults to the self-thinning mortality rate. The drought mortality parameters were calibrated previously for the drought experiments in Caxiuanã National Forest (Yao et al., 2022). Although drought-induced mortality can reduce biomass periodically in addition to self-thinning, AGB and biomass mortality rates are predominantly controlled by α rather than drought-induced mortality at the basin scale during our study period (Text S1.3; Fig. S2). Considering that self-thinning is the dominant and regularly occurring mortality process, we treat self-thinning mortality as background mortality driven by resource competition among trees in this study.
2.2.3 Aboveground biomass
The ORCHIDEE model has nine biomass pools: aboveground sapwood (Sapab), belowground sapwood, aboveground heartwood (Heartab), belowground heartwood, leaves, roots, fruits, labile carbohydrate (Carbolab), and reserved carbohydrate (Carbores). The modeled aboveground biomass is calculated as follows:
2.3 Observational data
We used GPP observations from the GOSIF dataset for data assimilation at the grid scale (Li and Xiao, 2019). GOSIF products estimated GPP using sun-induced chlorophyll fluorescence (SIF) from GOSAT, GOME-2, and OCO-2 at a 0.05° resolution from 2001 to 2022. Given the high uncertainty in GPP estimates, particularly in tropical forests where GPP observations are scarce, we also evaluated other GPP products derived from flux tower upscaling (FLUXCOM_RS and FLUXCOM_RS_METEO) and process-based models (BESSv2 and FORMIND) as part of our sensitivity tests (Jung et al., 2020; Li et al., 2023; Rödig et al., 2019). Across these datasets, the average GPP values for the Amazon basin range from 24.0 to 33.4 MgC ha−1 yr−1. Although GOSIF provides the highest estimation, it appears to be more consistent with observed GPP values (Fig. S3, Marthews et al., 2012; Malhi et al., 2015). We compared GPP products with model outputs from 2001 to 2015 for GOSIF, FLUXCOM_RS, FLUXCOM_RS_METEO, and BESSv2. For FORMIND, the GPP represents average values from 2003 to 2006.
We use the biomass map from Yu et al. (2023) to benchmark AGB in the ORCHIDEE model in 2020 (hereafter, Yu-Biomass). The Yu-Biomass map is based on a large number of lidar-biomass models, field plot data, and L-band radar data, with an original resolution of 100 m. Several other biomass maps are available for this region (Santoro and Cartus, 2024; Avitabile et al., 2016; Baccini et al., 2012). These maps generally incorporate field observation data and multiple remote sensing datasets, including radar backscatter, lidar, and optical indices. Among these maps, Yu-Biomass map shows the highest correlation with independent airborne lidar estimates in the Amazon forest (Longo et al., 2016; Yu et al., 2023). We also validated these datasets using field observations (Mitchard et al., 2014) and found that the Yu-Biomass map captures the biomass gradient more accurately than the others (Fig. S4).
We optimized the modeled biomass mortality rates using biomass mortality data derived from Planet data (Dalagnol et al., 2023, 2021). This dataset estimates forest gaps based on very-high-resolution (about 4–5 m) remote sensing and airborne lidar scanning data processed through deep learning methods. The identified gaps are then converted to biomass mortality estimates. The dataset provides annual biomass mortality data from 2016 to 2019 aggregated at a 1 km resolution. Given that this study focuses on background mortality, to minimize the potential influence of the 2015/16 El Niño drought, we excluded the year 2016 and used the average from 2017 to 2019. Biomass mortality rates were derived by dividing biomass mortality by the total aboveground biomass from Yu-Biomass. We also compared the remote sensing based biomass mortality rates to stem mortality rates from 189 long-term RAINFOR forest plots, with data primarily collected between 1981 and 2010 (Esquivel-Muelbert et al., 2020). This comparison yielded an R2 of 0.39 and an RMSE of 0.53 % (Fig. S5).
2.4 Simulation protocol
We began with a spin-up simulation to bring the vegetation biomass carbon pool to equilibrium, i.e., a linear trend in vegetation carbon over 40 years of <0.03 MgC ha−1 yr−1 for 99 % of pixels. We recycled the climate forcing from CRUJRA from 1901–1920 for 600 years with a constant CO2 concentration of 296.8 ppm (i.e., the CO2 concentration in 1901). The equilibration of the soil biogeochemistry was calculated by an analytical solution (Vuichard et al., 2019). Starting from this equilibrium state, we proceeded with the transient simulation using climate forcing and CO2 concentration data for the period 1901–2020. We did not account for land cover change, as our analysis is limited to undisturbed forests. Model parameters remain unchanged during the spin-up and transient simulations. Each time parameters are modified, we re-run the spin-up from the beginning to maintain consistency. This simulation protocol is widely used in previous model optimization studies (Ma et al., 2024; Peylin et al., 2016).
2.5 Optimization processes
Based on the description of the ORCHIDEE processes in Sect. 2.2, we conducted a sensitivity analysis of various model parameters on AGB, GPP, and biomass mortality rates using a one-at-a-time approach. This method is widely used for sensitivity analysis, where each parameter is varied individually while keeping the others unchanged (Liu et al., 2015). We define VPi (variation percentage, %) as an indicator for the sensitivity of model output variables i (i.e., AGB, GPP, and biomass mortality rates). Following a previous study (Liu et al., 2015), we varied each parameter by ±10 %, and VP is calculated as follows:
where run+10 % and run−10 % are the model results with +10 % and −10 % variations in a given parameter while fixing other parameters, and runref is the reference model result with default parameters. We selected parameters related to self-thinning, photosynthesis, carbon allocation, and turnover rate in the model. AGB and the mortality rate are the most sensitive to β, α, and η, while GPP is most sensitive to η, SLA, and klsmin (Table 1).
Table 1Variation percentage (VP) of AGB, GPP, and mortality rate for different parameters.
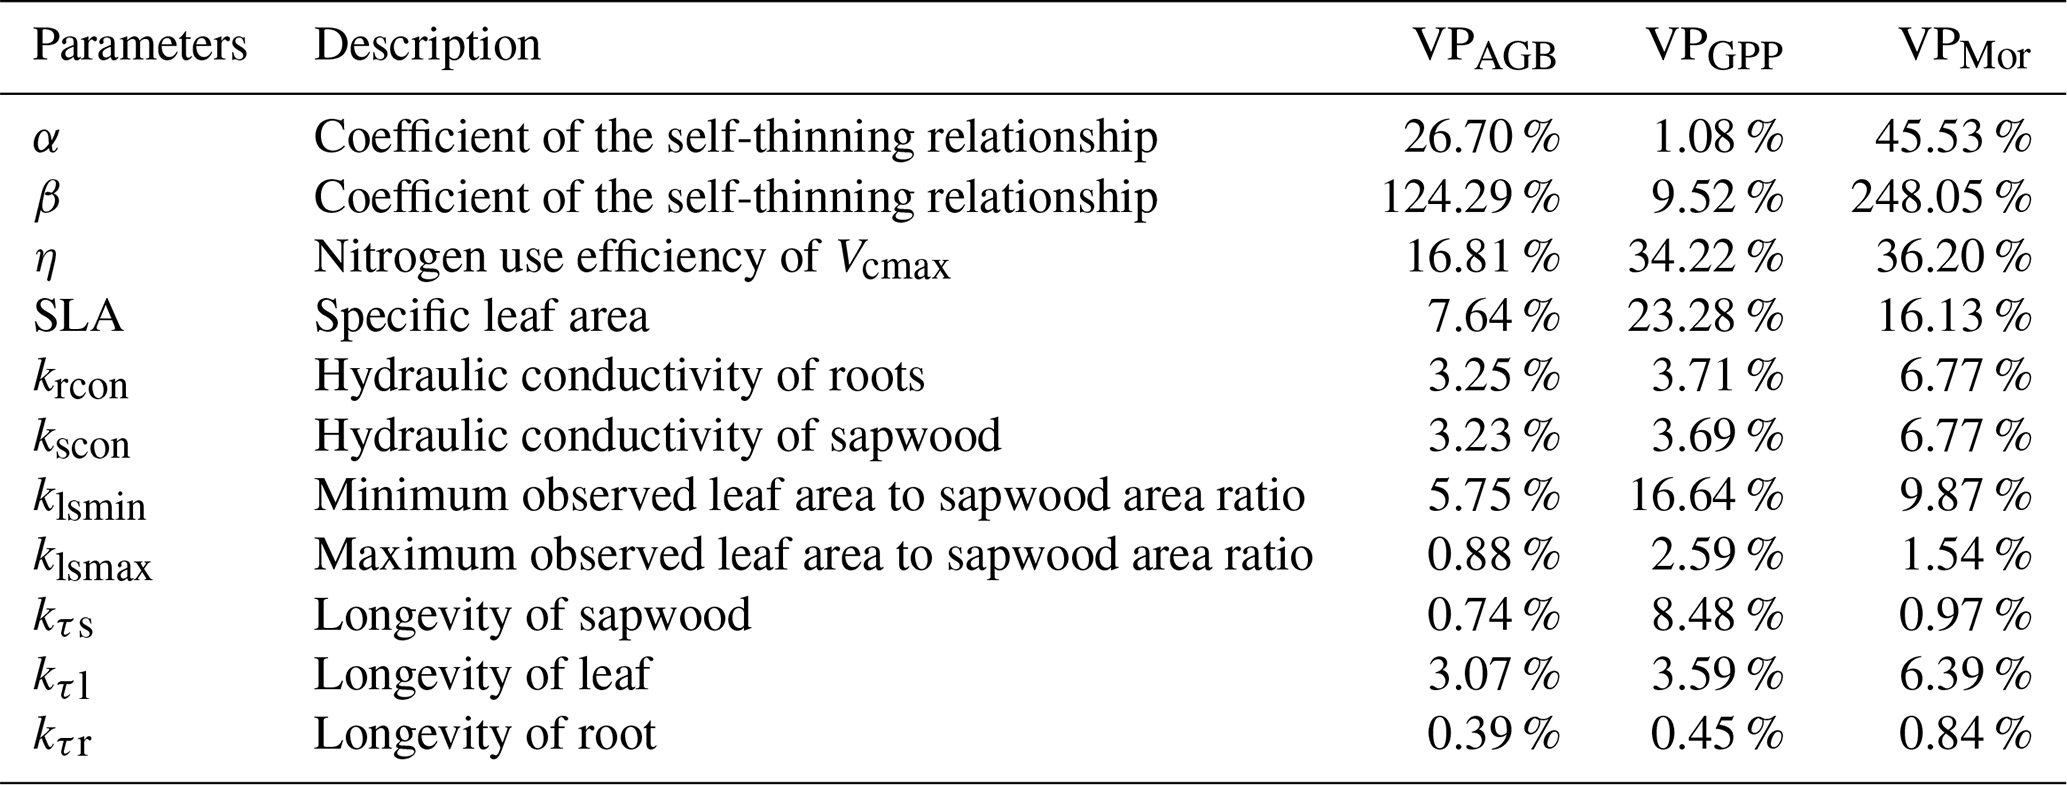
To optimize the model parameters for matching the spatial pattern of GPP, AGB, and biomass mortality rates, we constructed a loss function to optimize two key parameters: α and η. We chose the two parameters for the following reasons. (1) Although β is more sensitive to AGB and mortality rate than α, α has a wider range of values compared to parameter β (Brienen et al., 2015; Yu et al., 2024). Regardless of which parameter is optimized, the observations can be matched. To avoid the issue of equifinality when optimizing both parameters, we chose to adjust α while keeping β fixed at its default value, considering that α is less constrained than β in previous studies (Yu et al., 2024). (2) η has the highest sensitivity to GPP in the model and is found to be highly variable within the moist tropical biome (Kattge et al., 2009; Ellsworth et al., 2022). (3) We did not try to optimize more parameters because the number of optimized parameters should not exceed the number of observations (GPP, AGB, and biomass mortality rates) to avoid the equifinality issue.
We used the Latin hypercube sampling (LHS) method to select the initial parameter values, a technique widely used in model parameterization (McKay et al., 2000; Yan et al., 2023). LHS can subdivide the full parameter space evenly to generate representative parameter values. This procedure ensures an efficient sampling of the parameter distribution with a suitable number of parameter samples, thus avoiding impracticable computational efforts due to numerous model simulations (McKay et al., 2000). The recommended number of sampled points is typically 10 times the number of dimensions (Loeppky et al., 2009). Accordingly, we used 20 samples as the initial parameter values, generated using LHS. The default η value is 14.08 µmolCO2 gN−1 s−1 based on the biome average of trait data for tropical forests on highly weathered soils (Kattge et al., 2009), and the α value is 1941 cm (Brienen et al., 2015). In this study, the initial uniform prior distribution ranges for α and η were set to 1000–2800 cm and 8–18 µmolCO2 gN−1 s−1, respectively, to ensure that all optimized values fell within these boundaries (Fig. S7).
After the initial ORCHIDEE run based on the 20 sets of parameter values, we interpolated the results for GPP, AGB, and biomass mortality rates over the whole domain using quadratic splines (Fig. S8), considering that these variables change monotonically and continuously with α and η. The interpolation achieved R2 values of 0.99, 0.98, and 0.93 for AGB, GPP, and biomass mortality rates, respectively, based on leave-one-out validation, where 19 simulations were used for interpolation and the remaining one for validation.
Next, for each 1° × 1° grid cell, we constructed a quadratic loss function to identify the best estimates of α and η that minimize the loss (Groenendijk et al., 2021), defined as:
where AGBsim(α,η), GPPsim(α,η), and Morsim(α,η) are the AGB, GPP, and biomass mortality rates simulated by ORCHIDEE model after interpolation; AGBobs, GPPobs, and Morobs are the AGB, GPP, and biomass mortality rates from the observations; , , and are the spatial mean AGB, GPP, and biomass mortality rates for the whole basin; and CVAGB, CVGPP, and CVMor are the coefficients of variation for AGB, GPP, and biomass mortality rates from the observations. We used coefficients of variation as the weight to balance different losses from AGB, GPP, and biomass mortality rates at the regional scale. We selected the α and η values that minimized Loss(α,η) for each grid cell and generated spatial maps of both parameters across the entire Amazon region. Then, we re-ran the ORCHIDEE model forced by the α and η spatial maps obtained from the optimization. For comparison, we also performed the same optimization using regional mean AGB, GPP, and biomass mortality rates from both the observations and the simulations to derive spatially constant α and η values across the entire Amazon region as a baseline (Fig. 1).
2.6 Analyze the influencing variables
Previous empirical studies have found that GPP/NPP and mortality rates are influenced by various factors including climate conditions, wood density, water table depth, and soil properties such as soil texture and soil fertility (Malhi et al., 2004; Quesada et al., 2012; Vicca et al., 2012; Castanho et al., 2013; Campioli et al., 2015; Sousa et al., 2022). We thus selected eight variables to explain the spatial distribution of the optimal α and η values (Fig. S9, Table S3). Mean annual temperature (MAT), mean annual precipitation (MAP), and downward shortwave radiation (SWdown) are obtained from CRUJRA v2.4 (Harris et al., 2020). Maximum cumulative water deficit (MCWD) is a proxy for climatic water supply and indicates the intensity of drought. MCWD is calculated as
with t being the month , Pt the precipitation for month t calculated from CRUJRA v2.4, and Et the monthly evapotranspiration, which is fixed at 100 mm (Aragão et al., 2007). MCWD was calculated based on the hydrological year, which begins in May (t=1) and ends in April (t=12) of the following year (Chen et al., 2024). Wood density was sourced from Yang et al. (2024a). Clay fraction from HWSD2 serves as a proxy for soil texture (FAO and IIASA, 2023). Soil total phosphorus content, a key indicator of soil fertility, was derived from Darela-Filho et al. (2024). Water table depth, representing both anoxic conditions and additional water availability beyond precipitation, was obtained from Fan et al. (2013). To avoid multicollinearity, precipitation was excluded from the analysis due to its high correlation with MCWD (Fig. S10).
We used random forest regression to analyze the potential influences of the eight variables on α and η. Random forest regression is a widely used machine learning algorithm that builds multiple decision trees to improve prediction accuracy (Breiman, 2001). We randomly selected 75 % of the data to train the model, leaving the remaining 25 % for validation. The random forest model was optimized with the following parameters for both α and η: ntree = 100, max_depth = 3. We constructed 50 models using different random seeds and averaged their outputs to derive the final results.
SHAP (SHapley Additive exPlanations) values were used to evaluate the contribution of each explanatory variable in the random forest regression (Lundberg et al., 2020). Based on Shapley values in game theory, SHAP values represent the marginal contribution of each variable, considering all possible combinations of feature values (Shapley, 1953). A SHAP value, whether positive or negative, indicates a corresponding positive or negative effect on the model's output. This method offers an interpretable insight into how individual features impact model predictions. We built the random forest model using the Python package “sklearn” and computed SHAP values with the Python package “shap.”
3.1 Simulations with optimal spatially constant parameters
The optimal spatially constant parameter values for α and η are 1898 cm and 12.14 µmolCO2 gN−1 s−1, respectively, to match the AGB, GPP, and biomass mortality rates from observations. Basin-scale averaged values of AGB, GPP, and biomass mortality rates closely aligned with observations (126 ± 7 MgC ha−1, 33 ± 3 MgC ha−1 yr−1, and 2.2 ± 0.2 % vs. 127 ± 29 MgC ha−1, 33 ± 2 MgC ha−1 yr−1, and 2.0 ± 0.6 %, respectively). However, simulations failed to capture spatial heterogeneity, such as the higher biomass in the Guiana Shield or the higher biomass mortality rates in the southeastern Amazon (Fig. 2). The R2 values between the simulated AGB, GPP, and observations data were less than 0.04, and the correlation between simulated biomass mortality rates and observations was even negative (Fig. 3a–c). Climate forcing, wood density, and soil texture had a limited impact on the modeled spatial variation of AGB, resulting in flat gradients of forest AGB and biomass mortality rates. In the ORCHIDEE model, higher MCWD is generally associated with higher GPP (Fig. 3b), but in reality GPP does not vary significantly across the entire Amazon region (Fig. 2b). On the contrary, MCWD has little influence on modeled tree mortality, despite its observed association with higher mortality rates (Fig. 3c). These discrepancies suggest that spatially varying parameters are necessary to better match the modeled AGB, GPP, and mortality rates with observational data.
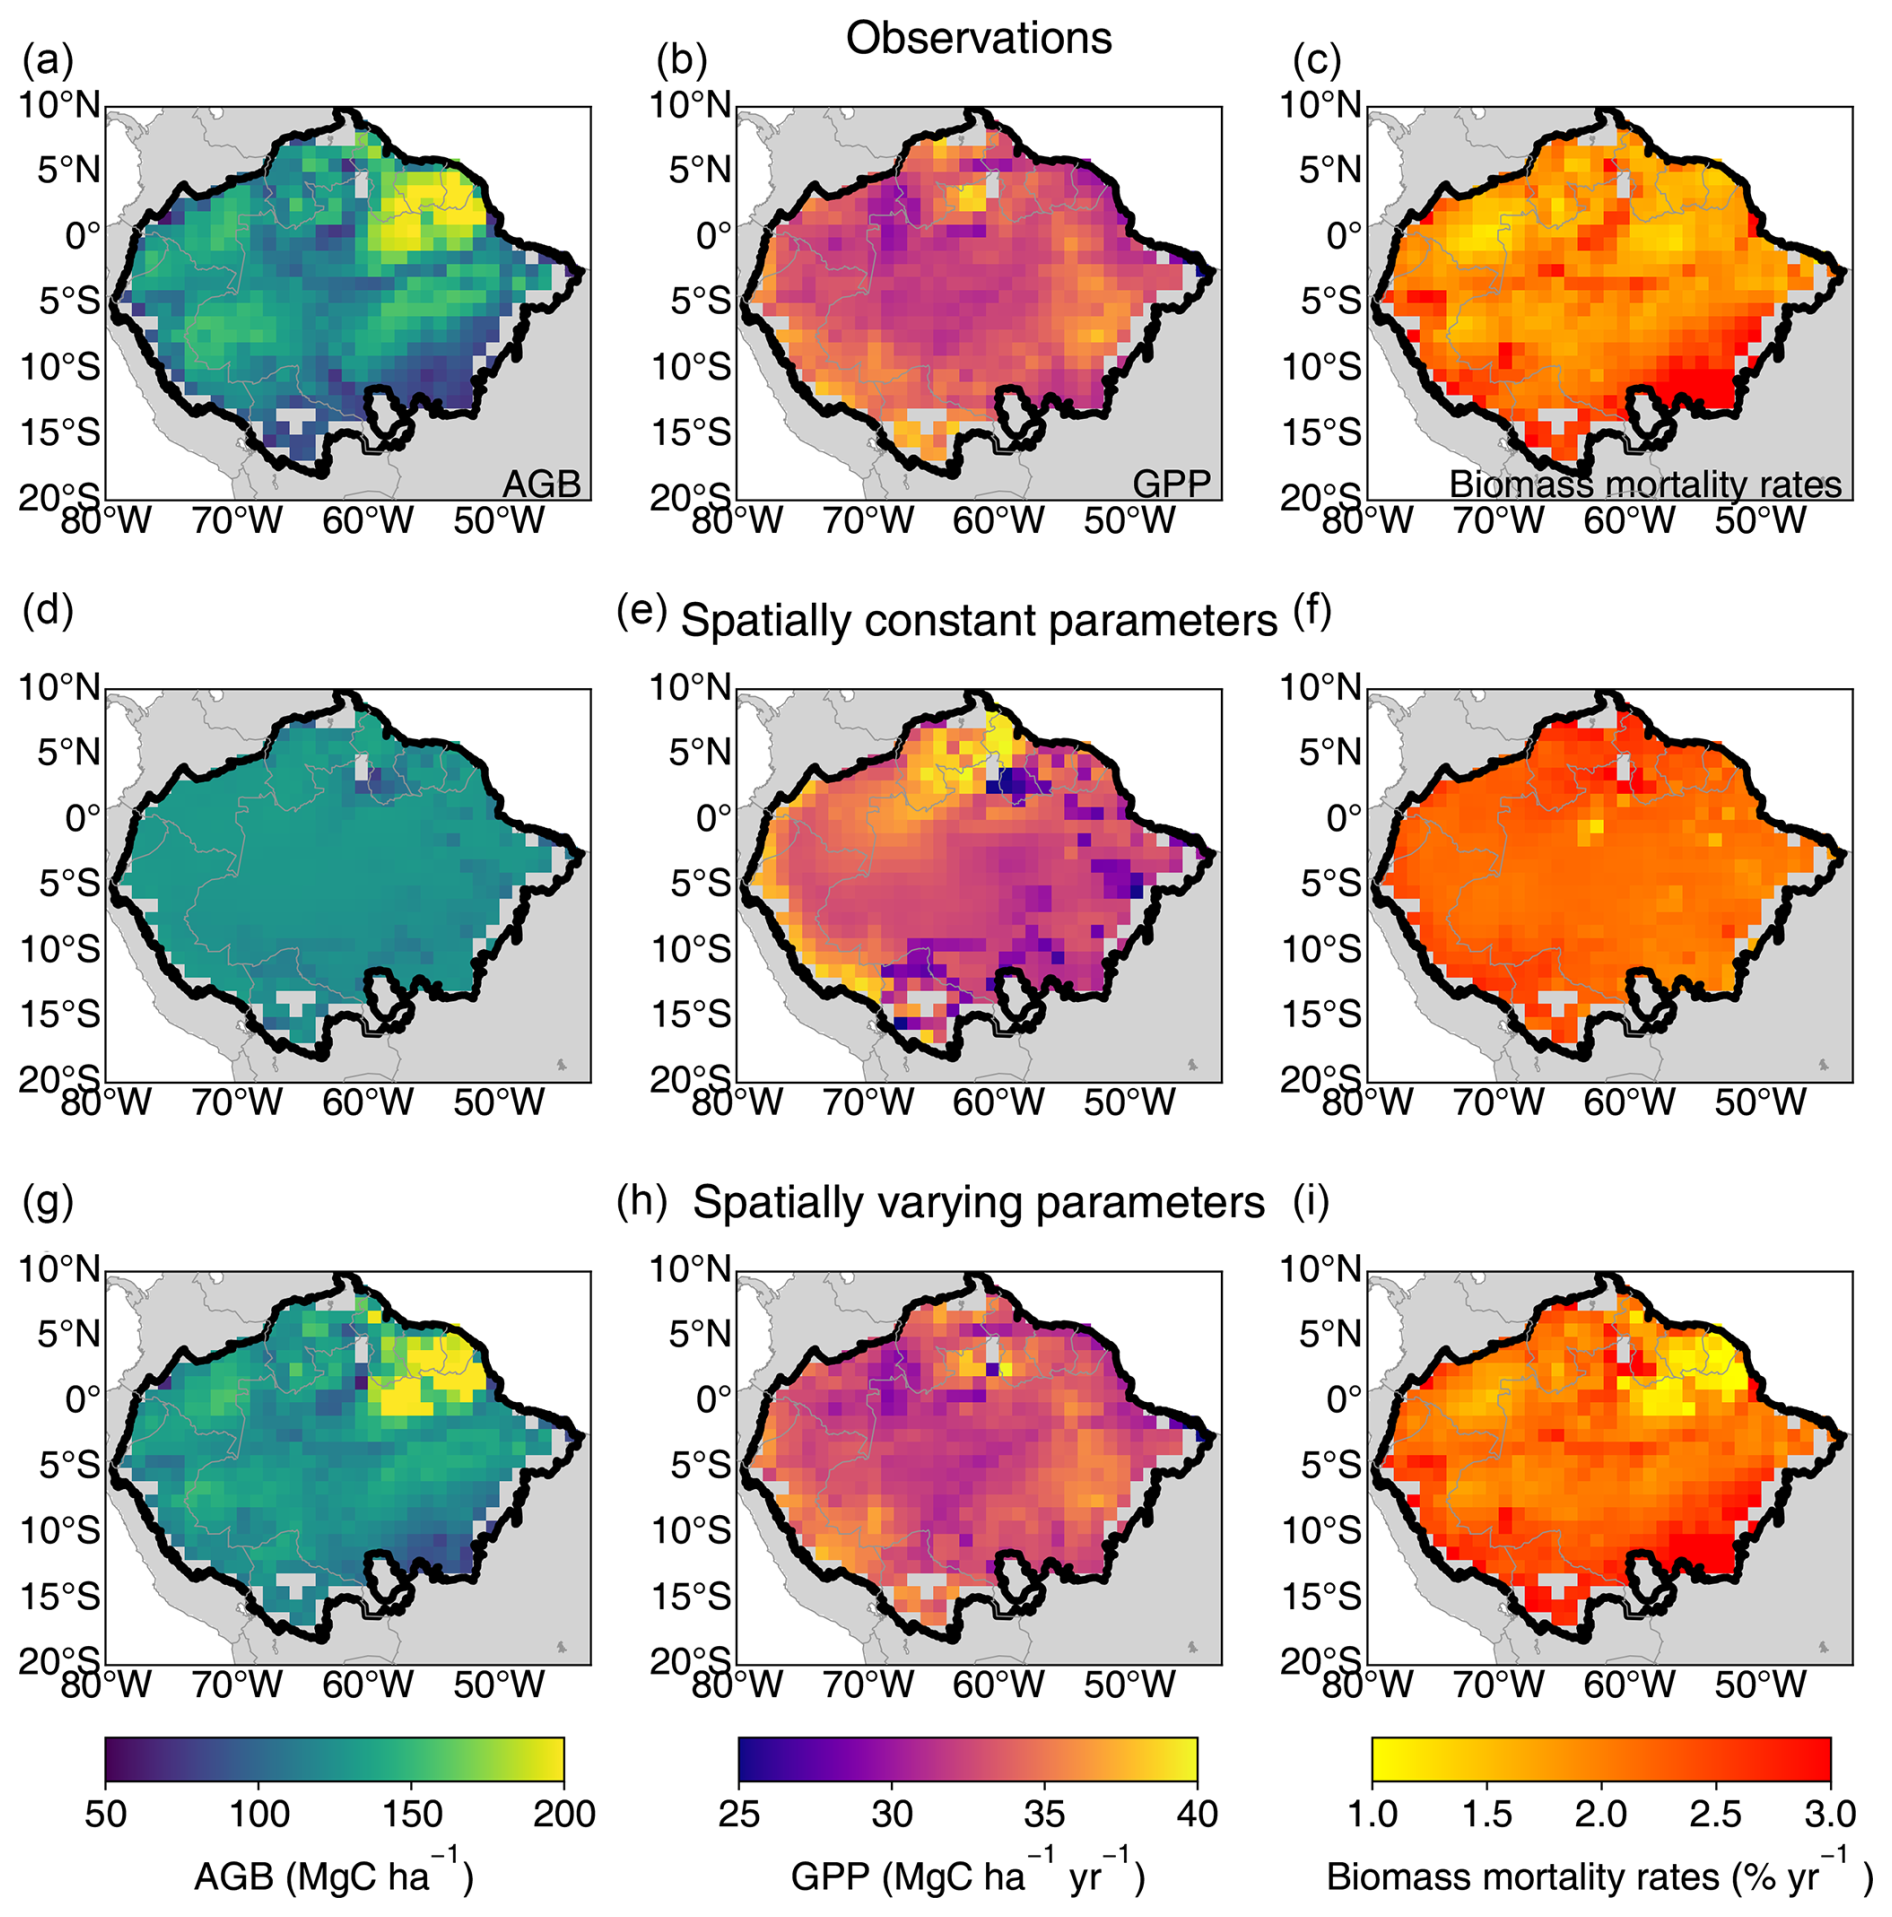
Figure 2Spatial patterns of AGB, GPP, and biomass mortality rates from observations (a–c), from the model with spatially constant parameters (d–f), and from the model with spatially varying parameters (g–i).
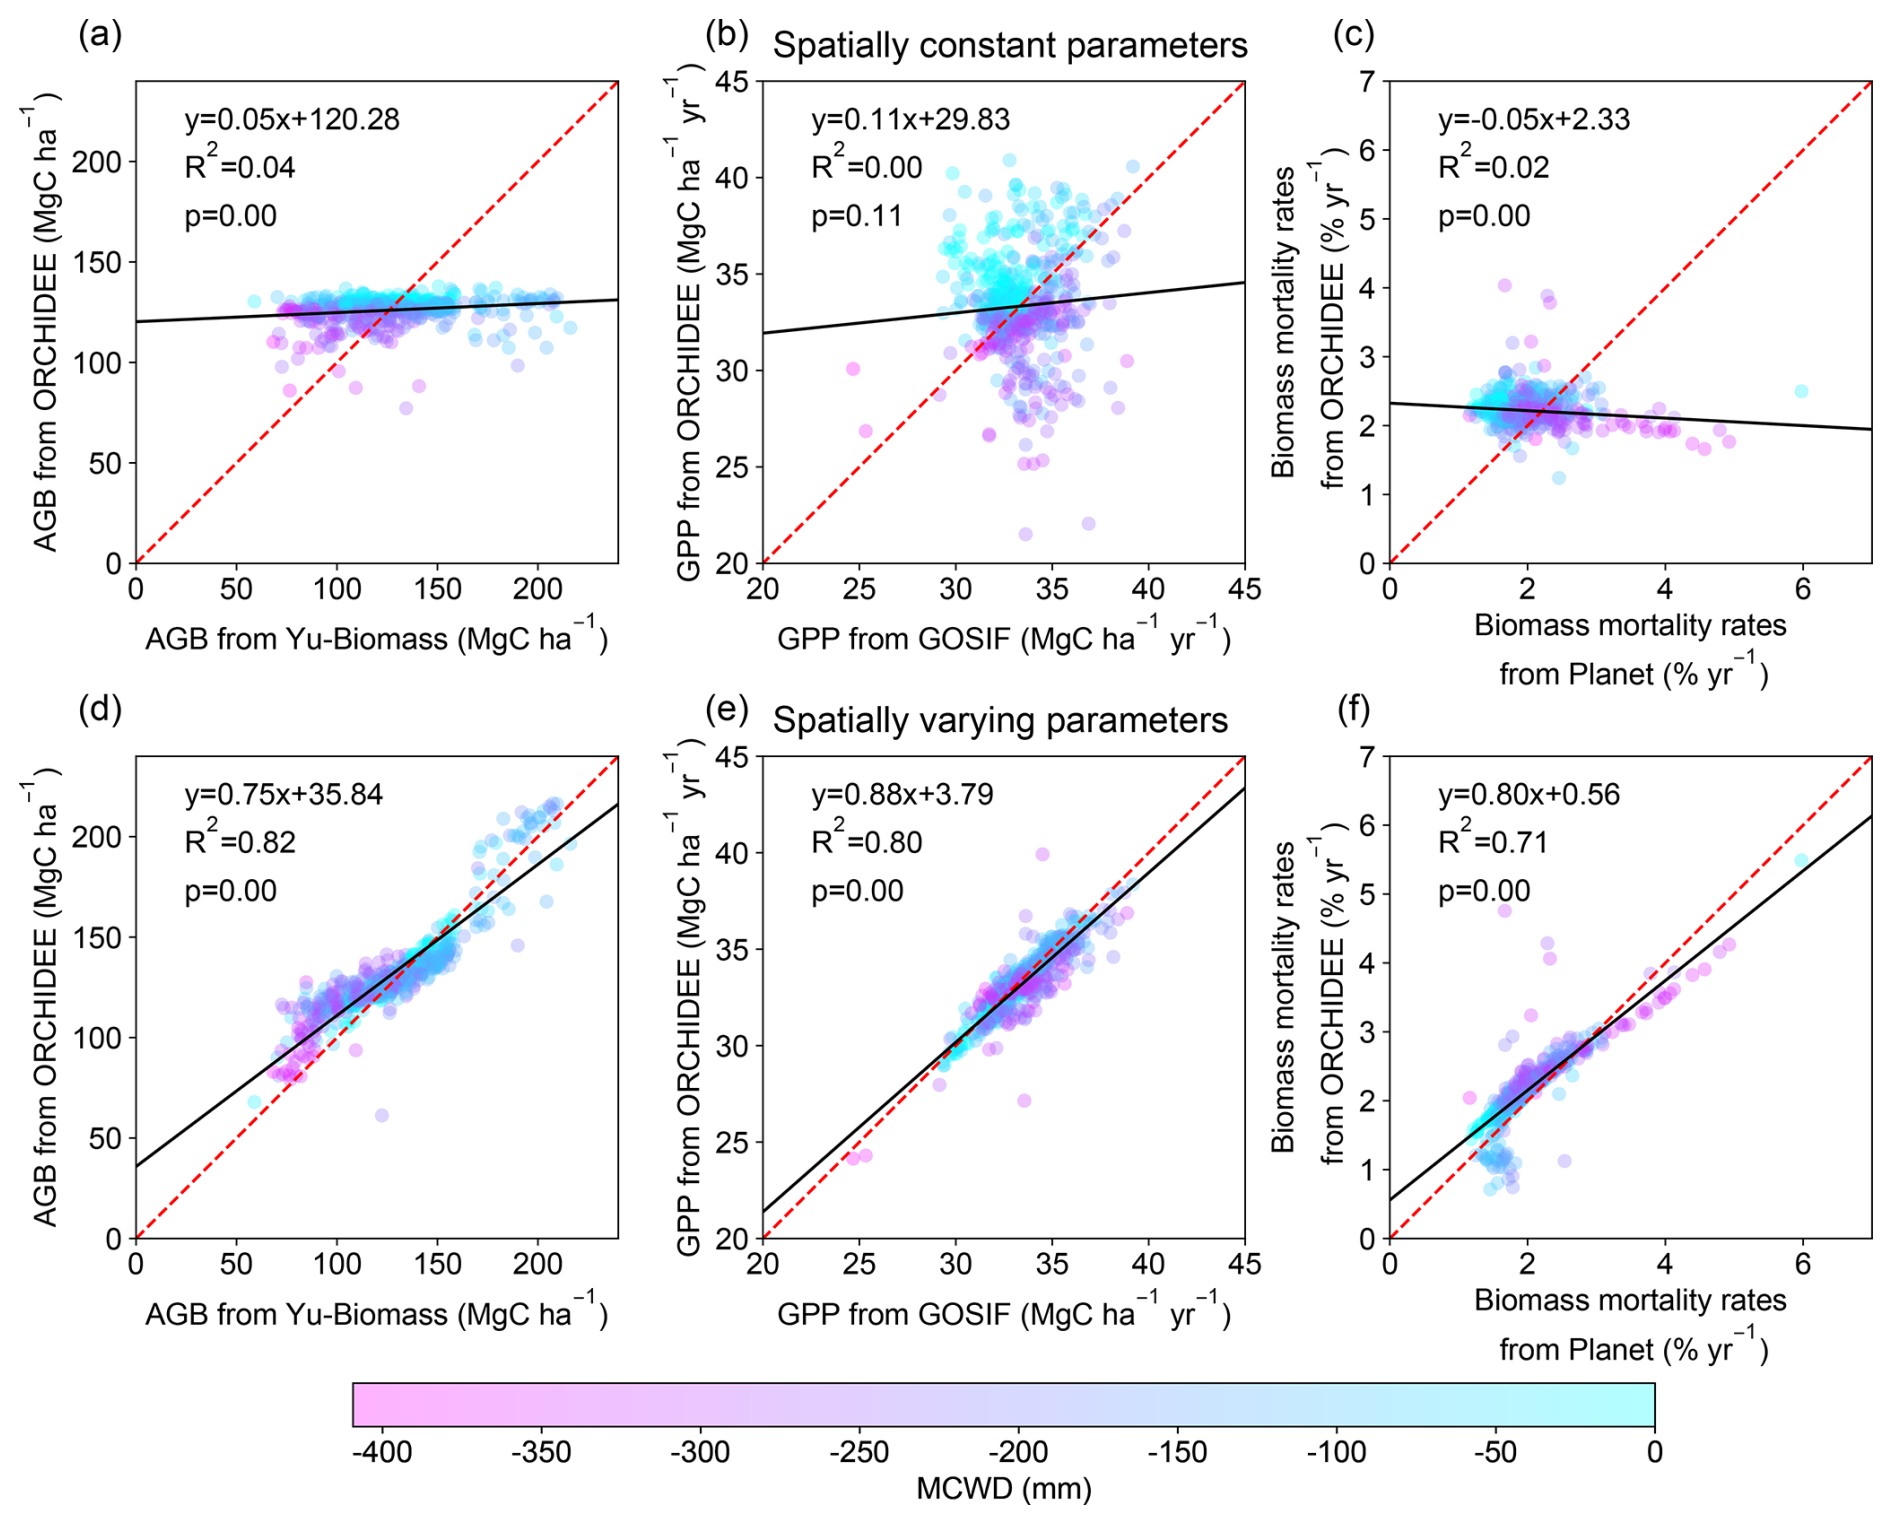
Figure 3Comparison of model-simulated AGB, GPP, and mortality rates with observations. Results from model simulation with spatially constant parameters (a–c) and with spatially varying parameters (d–f). The dashed red line is the 1 : 1 line. The black solid line is the best fit between modeled results and observations. The color of the dots represents the value of MCWD to show its correlation with AGB, GPP, and biomass mortality rates.
3.2 Simulation with optimal spatially varying parameters
The model with optimal spatially varying parameters successfully captured the spatial patterns of AGB, GPP, and mortality rates, including the higher biomass in the Guiana Shield, the lower GPP in the northwestern Amazon, and the higher mortality in the southern Amazon (Fig. 2). The R2 values between the observed data and model-simulated AGB, GPP, and mortality rates improved substantially, increasing from near zero to 0.82, 0.79, and 0.73, respectively (Fig. 3). The spatially varying α values were higher in the northeast and lower in the southeast, while η values were higher in both the northeast and southern regions (Fig. S11).
Optimizing both α and η is necessary. When only α is optimized, the model-simulated AGB and mortality rates improved a lot compared with observations, but GPP shows a weak correlation with observed GPP (R2 = 0.01, Fig. S12a–c). This is mainly because GPP is not sensitive to α (Table 1). Similarly, the VP of η is larger for GPP and biomass mortality rates than AGB (Table 1). Optimizing only η results in no correlation between model-simulated AGB and observed AGB (R2 = 0.0, Fig. S12d–f), although simulated GPP and mortality rates had a stronger correlation with the observations. The spatial pattern of α shows a strong positive correlation with Yu-Biomass and a negative correlation with observed mortality rates. In contrast, η is positively correlated with GOSIF GPP and mortality rate data (Fig. S13).
3.3 Spatial correlation between optimal parameter maps and influencing factors
We further applied explainable machine learning (i.e., random forest regression and SHAP) to find the influence of various factors on the spatial pattern of optimal parameters. The seven variables explained 47 % of the variation in α and 48 % in η on testing data. The Shapley results show non-linear relationships between the optimal parameters and influencing factors, including climatic, plant, and edaphic properties. For example, when MCWD is below −300 mm, α increases sharply with rising MCWD, but once MCWD exceeds −300 mm, its impact on α becomes minimal. Similarly, the negative impact of MCWD on η becomes positive when MCWD falls below −100 mm (Fig. 4b). Clay fraction has a greater impact on η when it exceeds 40 %, particularly in soils classified as clay or silty clay, which accounts for 35 % of all grids (Figs. 4e, S1; Table S2). Wood density shows a strong positive correlation with α when it exceeds 0.61 gC cm−3 (Fig. 4d), while the effect of water table depth on α follows a dome-shaped pattern, where both deep and shallow water table depths reduce α (Fig. 4g). Wood density shows the highest feature importance for α, based on mean absolute SHAP values (Fig. 5a). Additionally, MCWD emerges as the most important feature for η (Fig. 5b).
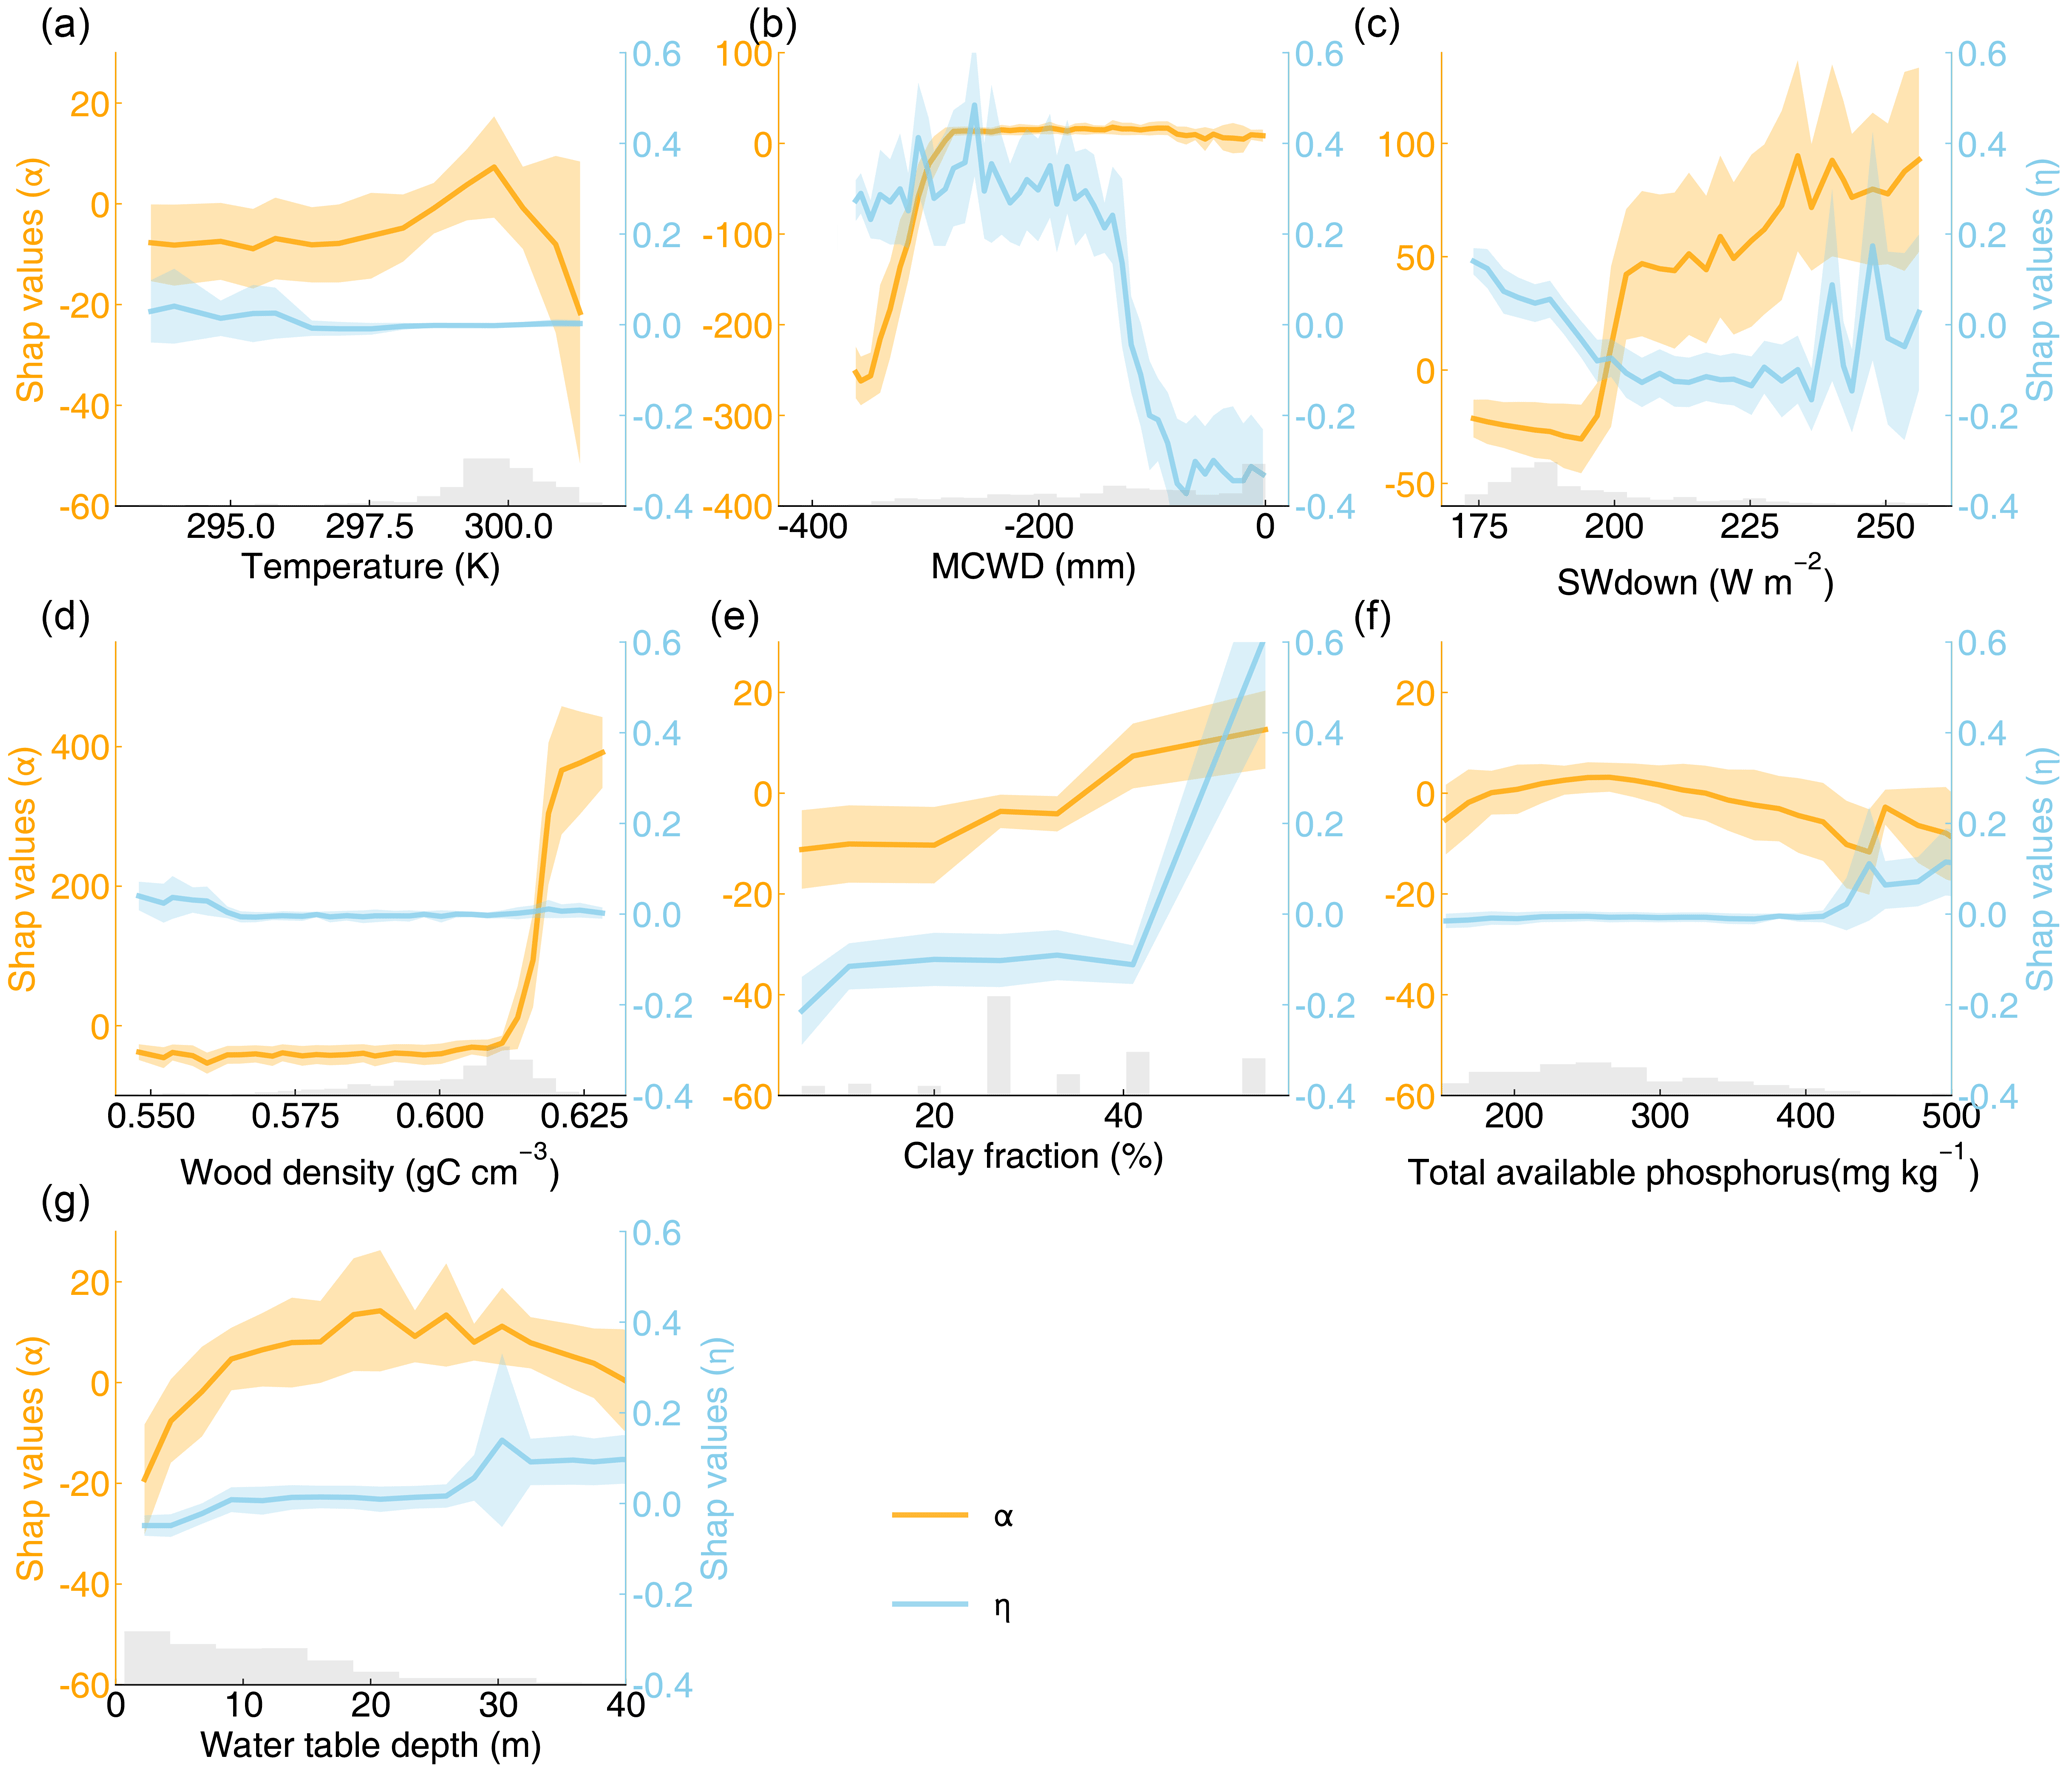
Figure 4SHAP values of α and η for seven explanatory variables: (a) temperature; (b) maximum cumulative water deficit (MCWD); (c) downward shortwave radiation (SWdown); (d) wood density; (e) clay fraction; (f) total available phosphorus; (g) water table depth. The shaded area indicates the standard deviation of SHAP values. The gray bars represent the distributions of explanatory variables.
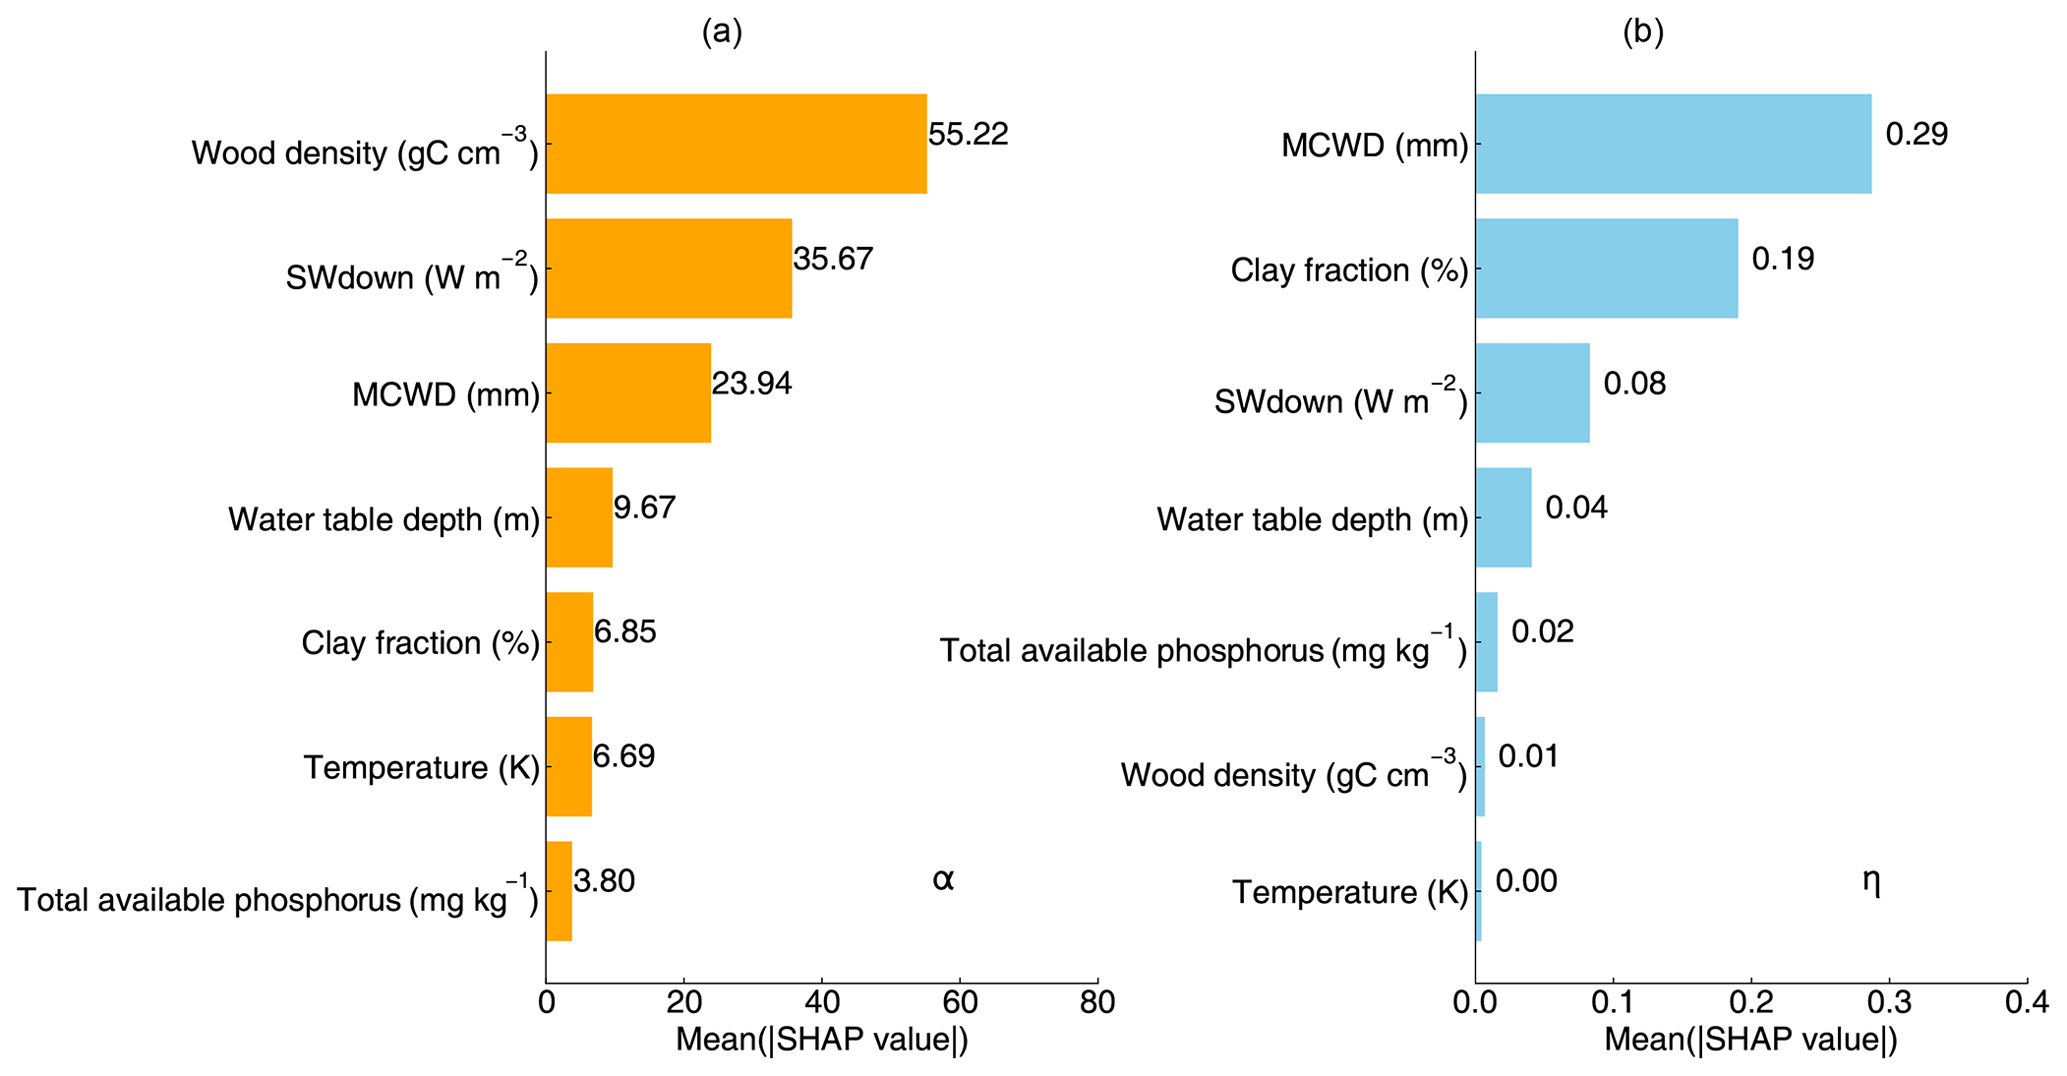
Figure 5Variable importance characterized by the mean SHAP values of seven explanatory variables affecting α (a) and η (b).
4.1 Implications from the inconsistency between model results and observations
By incorporating spatially varying parameters, the simulation shows much better agreement with the observations. However, some grid cells still exhibit underestimation or overestimation of AGB, GPP, or biomass mortality rates (Fig. S14), reflecting trade-offs made during the optimization of the loss function. In the ORCHIDEE model, GPP, biomass, and mortality rates are tightly coupled. The amount of dead woody biomass is determined by both biomass and mortality rates, which should equal the fraction of NPP allocated to wood under an equilibrium state. While carbon use efficiency (CUE = NPP/GPP: 33.7 % ± 1.2 %) and the woody NPP fraction (fNPP: 30.8 ± 1.1 %) do not vary a lot in the model, a grid with low biomass and low mortality rate should exhibit a correspondingly low GPP (Fig. S15). When observations are inconsistent with each other (e.g., low biomass, low biomass mortality rate, but high GPP from observations), optimizing α and η alone is insufficient to accurately simulate AGB, GPP, and biomass mortality rates simultaneously.
There are two potential reasons for the remaining model–observation inconsistency. First, the model may overlook important processes. For instance, the model currently only accounts for woody biomass loss through tree mortality. However, Zuleta et al. (2023) found that 42 % of woody biomass loss occurs due to damage to living trees, such as branch falls, trunk breakage, and wood decay. In the ORCHIDEE model, aboveground woody biomass is divided into two pools: sapwood and heartwood. To improve the accuracy of biomass mortality estimates, a separate biomass pool for branches should be incorporated in future model developments to better account for biomass losses from branches. Besides, while CUE and fNPP fall within observed ranges, the variability of these factors may be underestimated. Some studies suggest that CUE ranges from 23 % to 45 % (Doughty et al., 2018), whereas our model estimates it at 32 % to 42 %. Similarly, the spatial standard deviation of observed fNPP (2.9 %) exceeds that of our modeled results (1.1 %; Yang et al., 2021).
Second, the observational data may contain inherent biases. Mortality rates derived from field observations may be overestimated because field plots are often located near roads and rivers, where disturbances are more frequent (Saatchi et al., 2015). Additionally, satellite AGB may be underestimated in dense forests due to sensor saturation (Yu et al., 2023). GPP data carries the greatest uncertainty, largely due to the limited observations in the Amazon basin. We compared five GPP datasets across the Amazon basin (see Sect. 2.3). While the GOSIF and FLUXCOM_RS datasets show higher GPP in the southwestern Amazon and lower GPP in the central region, the spatial patterns differ across other regions and datasets (Fig. S16). The highest correlation coefficient between the GPP datasets is 0.46, observed between GOSIF and FLUXCOM_RS, while correlations among the other datasets are generally weaker (Fig. S3b).
We conducted sensitivity tests using additional GPP and biomass datasets. Four other GPP datasets were used to optimize the parameters α and η. After optimization, both AGB and GPP showed strong agreement between the model and observations, demonstrating the robustness of our approach (Fig. S17). The linear correlations between the eight influencing factors and the optimal parameters are generally consistent with previous results (Figs. S18, S19), with only a few exceptions. For example, when using GPP data from FLUXCOM_RS+METEO, MCWD and wood density are positively correlated with η, which is different when using GOSIF and other GPP datasets.
4.2 Implications for the ORCHIDEE model from the random forest regression
The uncertainties in simulated carbon stocks and fluxes arise from model structure, parameterization, and forcing data (Bonan and Doney, 2018). During the optimization of α and η, we assumed that all uncertainties stem from parameterization. By analyzing the correlation between the optimal parameters and influencing factors, our results showed great consistency with existing knowledge and highlighted important processes that are either missing or poorly represented in the ORCHIDEE model when simulating the Amazon forest.
For instance, a threshold of −300 mm in MCWD was identified in the partial dependence analysis between α and MCWD. When MCWD drops below −300 mm, further decreases lead to lower α, indicating higher mortality (Fig. 4b). This result aligns with previous findings showing a negative correlation between AGB mortality rates and MCWD only when MCWD is particularly low (Sousa et al., 2022). Although our model incorporates drought-induced tree mortality, the higher tree mortality under lower MCWD conditions is likely underestimated. The dome-shaped relationship between water table depth and α is also in line with earlier studies (Fig. 4g). Shallow water table depths are associated with low biomass, as excessive water can limit oxygen flow to roots, restricting plant growth (Costa et al., 2023). In waterlogged conditions, weakened root systems and reduced soil cohesion increase the risk of tree falls (Ferry et al., 2010). Conversely, deeper water table depths elevate the risk of drought-induced mortality, thereby increasing mortality rates (Chen et al., 2024). However, water table depth is not explicitly represented in our model. We also found that higher wood density is associated with higher α, which is in line with previous findings that forests with higher wood density tend to have lower mortality rates and higher biomass (Fig. 4d; Keeling and Phillips, 2007; Brienen et al., 2020). However, our model does not account for the feedback between wood density and tree mortality rates.
Furthermore, we observed that η increases when MCWD falls below −100 mm. In the model, reduced water availability limits transpiration, leading to a decrease in GPP (Yao et al., 2022). However, the observed GPP exhibits a weak negative correlation with MCWD (Fig. S20). This suggests that grid cells with more negative MCWD require a higher η to simulate higher GPP. Given the unclear mechanisms driving the correlation between MCWD and GPP in the Amazon forest, it remains uncertain whether η should increase as MCWD decreases. We also found that η increases when the clay fraction exceeds 40 %. Although precipitation is distributed evenly across soil types with varying clay fractions, the runoff fraction increases sharply when the clay fraction surpasses 40 % (Fig. S21), due to the very low hydraulic conductivity of clay soils (Table S2). Besides, while available phosphorus is thought to influence woody production (Quesada et al., 2012), total phosphorus does not seem to be a critical factor in explaining the variation in optimal α and η (Fig. 5). In fact, the correlation between total available phosphorus and GPP is quite weak (R2 = 0.05), and the correlations with AGB or mortality rates are even weaker (Fig. S22). This may be due to uncertainties in the GPP data (Figs. S3, S16).
Our random forest model results show that the seven selected variables explained 47 % of the variation in α and 48 % in η on testing data. The limited explanatory power of the random forest model may be attributed to the uncertainties in the current environmental driver datasets. When we re-ran the model using parameters predicted by the random forest regression, it still captured the spatial gradients of carbon pools and fluxes, but with reduced accuracy compared to the optimized results. The modeled AGB, GPP, and mortality rates with spatially varying parameters from the random forest explain 47 %, 25 %, and 22 % of the spatial variation in the observations, respectively (Fig. S23). In the future, by including more relevant and accurate influencing factors, we may be able to enhance the explanatory power of the random forest model and improve ORCHIDEE by using the random forest algorithm to predict parameter variation across space, rather than relying on prescribed parameter maps. Ultimately, linking environmental drivers directly to model parameters in ORCHIDEE could enable a more mechanistic parameterization.
4.3 Strengths of the optimization method
In this study, we significantly improved the simulations of spatial gradients and mean values of AGB, GPP, and biomass mortality rates in the Amazon forest by optimizing two key parameters related to photosynthesis and self-thinning. Our method accounted for parameter variations within a PFT (tropical broad-leaved evergreen trees), an important factor that has largely been overlooked in other models (Butler et al., 2017). Besides, unlike previous studies that optimized numerous parameters simultaneously, our approach provided an efficient parameterization framework by focusing on the sensitive parameters for each pixel. In the future we can incorporate additional observations, such as LAI and tree height, as their accuracy improves. This method is also applicable to other DGVMs. Except for optimizing the parameters, this approach also helps identify the missing or underrepresented processes in the model. We also tried to link the optimal parameters with other plant traits or environmental factors. By doing this, we may eventually improve the model by incorporating relationships between different traits (e.g., linking wood density to α).
4.4 Limitations of this work
Our parameter optimization framework does not aim to optimize temporal variation or long-term trends (see Text S3). Besides, the input datasets used for model calibration carry significant uncertainties. More importantly, even with accurate observation data, our optimized parameter could be incorrect, as the mismatch between model results and observations can arise from the model structure and forcing data (Bonan and Doney, 2018).
In addition to the missing processes mentioned earlier, this version of the ORCHIDEE model also lacks several key processes, such as phosphorus–carbon interactions and species-based functional group diversity (Reed et al., 2015; Sun et al., 2021; Rüger et al., 2020). We ignored the spatial variability of leaf nitrogen content by fixing it uniformly across the Amazon forest. However, Vcmax depends on both η and the leaf ratio, the latter also exhibiting significant variability (Ellsworth et al., 2022).
In the context of climate change, the Amazon forest is increasingly exposed to disturbances such as droughts, fires, and windthrow events (Chen et al., 2024; Flores et al., 2024; Feng et al., 2023). Although the model accounts for drought-induced mortality, it does not include other disturbances like fire, windthrow, and logging in the Amazon basin. In this study, we focused exclusively on intact forests, as defined by TMF data (Vancutsem et al., 2021). Incorporating natural and anthropogenic disturbances into this ORCHIDEE version is underway (Naudts et al., 2015; Yue et al., 2014; Marie et al., 2024; Chen et al., 2018) and might turn out to be essential in future work to fully capture the complexity of ecosystem dynamics across the entire Amazon rainforest.
Our study developed an efficient parameter optimization framework that integrates observation-based data for AGB, GPP, and mortality rates to optimize the spatial variation of parameters in the ORCHIDEE model. By incorporating spatially varying parameters, the model effectively simulates the spatial variation of AGB, GPP, and mortality rates. The spatial patterns of the optimal parameters are generally reasonable, revealing previously underrepresented processes in the model. Given the complexity of the Amazon forest and the practical limits on model complexity, applying spatially varying parameters can help accurately represent its spatial variability.
The ORCHIDEE (r8849) code used in this study is open source and distributed under the CeCILL (CEA CNRS INRIA Logiciel Libre) license. It is deposited at https://doi.org/10.5281/zenodo.15080562 (Zhu, 2025a), with guidance to install and run the model at https://forge.ipsl.jussieu.fr/orchidee/wiki/Documentation/UserGuide (last access: 7 August 2025). The source data and code for Figs. 2–5 are available via Zenodo at https://doi.org/10.5281/zenodo.15023110 (Zhu, 2025b).
Yu-Biomass map data (Yu et al., 2023) is available from https://doi.org/10.5281/zenodo.7583611. GOSIF data (Li and Xiao, 2019) can be downloaded from http://data.globalecology.unh.edu/data/GOSIF_v2/. The wood density map (Yang et al., 2024a) can be downloaded from Global patterns of tree wood density (https://doi.org/10.5281/zenodo.10804643, Yang et al., 2024b). CRUJRA data (Harris et al., 2020) can be downloaded from https://catalogue.ceda.ac.uk/uuid/aed8e269513f446fb1b5d2512bb387ad/ (University of East Anglia Climatic Research Unit and Harris, 2023). HWSD2 data (FAO and IIASA, 2023) can be downloaded from https://data.isric.org/geonetwork/srv/api/records/54aebf11-ec73-4ff8-bf6c-ecff4b0725ea. Soil total phosphorus data (Darela-Filho et al., 2024) can be downloaded from https://doi.org/10.25824/redu/FROESE (Darela-Filho and Lapola, 2023). Water table depth data (Fan et al., 2013) can be downloaded from http://thredds-gfnl.usc.es/thredds/catalog/GLOBALWTDFTP/catalog.html.
The supplement related to this article is available online at https://doi.org/10.5194/gmd-18-4915-2025-supplement.
PC and WL designed the research. LZ performed the analysis and wrote the paper. YY merged the plant hydraulic module in this version. RD provided the biomass mortality data. All authors contributed to commenting on and writing the manuscript.
The contact author has declared that none of the authors has any competing interests.
Publisher's note: Copernicus Publications remains neutral with regard to jurisdictional claims made in the text, published maps, institutional affiliations, or any other geographical representation in this paper. While Copernicus Publications makes every effort to include appropriate place names, the final responsibility lies with the authors.
This study is funded by the National Natural Science Foundation of China (grant nos. 42175169, 72348001) and by the CALIPSO (Carbon Loss In Plants, Soils and Oceans) project, funded through the generosity of Eric and Wendy Schmidt by recommendation of the Schmidt Science program. This study is supported by the Center of High Performance Computing, Tsinghua University.
This paper was edited by Carlos Sierra and reviewed by two anonymous referees.
Aragão, L. E. O. C., Malhi, Y., Roman-Cuesta, R. M., Saatchi, S., Anderson, L. O., and Shimabukuro, Y. E.: Spatial patterns and fire response of recent Amazonian droughts, Geophys. Res. Lett., 34, L07701, https://doi.org/10.1029/2006GL028946, 2007.
Avitabile, V., Herold, M., Heuvelink, G. B. M., Lewis, S. L., Phillips, O. L., Asner, G. P., Armston, J., Ashton, P. S., Banin, L. F., Bayol, N., Berry, N. J., Boeckx, P., de Jong, B. H. J., DeVries, B., Girardin, C. A. J., Kearsley, E., Lindsell, J. A., Lopez-Gonzalez, G., Lucas, R., Malhi, Y., Morel, A., Mitchard, E. T. A., Nagy, L., Qie, L., Quinones, M. J., Ryan, C. M., Ferry, S. J. W., Sunderland, T., Laurin, G. V., Gatti, R. C., Valentini, R., Verbeeck, H., Wijaya, A., Willcock, S., Asthon, P., Banin, L. F., Bayol, N., Berry, N. J., Boeckx, P., de Jong, B. H. J., DeVries, B., Girardin, C. A. J., Kearsley, E., Lindsell, J. A., Lopez-Gonzalez, G., Lucas, R., Malhi, Y., Morel, A., Mitchard, E. T. A., Nagy, L., Qie, L., Quinones, M. J., Ryan, C. M., Slik, F., Sunderland, T., Vaglio Laurin, G., Valentini, R., Verbeeck, H., Wijaya, A., and Willcock, S.: An integrated pan-tropical biomass map using multiple reference datasets, Glob. Change Biol., 22, 1406–1420, https://doi.org/10.1111/gcb.13139, 2016.
Baccini, A., Goetz, S. J., Walker, W. S., Laporte, N. T., Sun, M., Sulla-Menashe, D., Hackler, J., Beck, P. S. A., Dubayah, R., Friedl, M. A., Samanta, S., and Houghton, R. A.: Estimated carbon dioxide emissions from tropical deforestation improved by carbon-density maps, Nat. Clim. Change, 2, 182–185, https://doi.org/10.1038/nclimate1354, 2012.
Baker, T. R., Phillips, O. L., Malhi, Y., Almeida, S., Arroyo, L., Di Fiore, A., Erwin, T., Killeen, T. J., Laurance, S. G., Laurance, W. F., Lewis, S. L., Lloyd, J., Monteagudo, A., Neill, D. A., Patiño, S., Pitman, N. C. A., M. Silva, J. N., and Vásquez Martínez, R.: Variation in wood density determines spatial patterns inAmazonian forest biomass, Glob. Change Biol., 10, 545–562, https://doi.org/10.1111/j.1365-2486.2004.00751.x, 2004.
Bonan, G. B. and Doney, S. C.: Climate, ecosystems, and planetary futures: The challenge to predict life in Earth system models, Science, 359, eaam8328, https://doi.org/10.1126/science.aam8328, 2018.
Breiman, L.: Random Forests, Mach. Learn., 45, 5–32, https://doi.org/10.1023/A:1010933404324, 2001.
Brienen, R. J. W., Phillips, O. L., Feldpausch, T. R., Gloor, E., Baker, T. R., Lloyd, J., Lopez-Gonzalez, G., Monteagudo-Mendoza, A., Malhi, Y., Lewis, S. L., Vásquez Martinez, R., Alexiades, M., Álvarez Dávila, E., Alvarez-Loayza, P., Andrade, A., Aragão, L. E. O. C., Araujo-Murakami, A., Arets, E. J. M. M., Arroyo, L., Aymard C, G. A., Bánki, O. S., Baraloto, C., Barroso, J., Bonal, D., Boot, R. G. A., Camargo, J. L. C., Castilho, C. V., Chama, V., Chao, K. J., Chave, J., Comiskey, J. A., Cornejo Valverde, F., da Costa, L., de Oliveira, E. A., Di Fiore, A., Erwin, T. L., Fauset, S., Forsthofer, M., Galbraith, D. R., Grahame, E. S., Groot, N., Hérault, B., Higuchi, N., Honorio Coronado, E. N., Keeling, H., Killeen, T. J., Laurance, W. F., Laurance, S., Licona, J., Magnussen, W. E., Marimon, B. S., Marimon-Junior, B. H., Mendoza, C., Neill, D. A., Nogueira, E. M., Núñez, P., Pallqui Camacho, N. C., Parada, A., Pardo-Molina, G., Peacock, J., Peña-Claros, M., Pickavance, G. C., Pitman, N. C. A., Poorter, L., Prieto, A., Quesada, C. A., Ramírez, F., Ramírez-Angulo, H., Restrepo, Z., Roopsind, A., Rudas, A., Salomão, R. P., Schwarz, M., Silva, N., Silva-Espejo, J. E., Silveira, M., Stropp, J., Talbot, J., ter Steege, H., Teran-Aguilar, J., Terborgh, J., Thomas-Caesar, R., Toledo, M., Torello-Raventos, M., Umetsu, R. K., van der Heijden, G. M. F., van der Hout, P., Guimarães Vieira, I. C., Vieira, S. A., Vilanova, E., Vos, V. A., and Zagt, R. J.: Long-term decline of the Amazon carbon sink, Nature, 519, 344–348, https://doi.org/10.1038/nature14283, 2015.
Brienen, R. J. W., Caldwell, L., Duchesne, L., Voelker, S., Barichivich, J., Baliva, M., Ceccantini, G., Di Filippo, A., Helama, S., Locosselli, G. M., Lopez, L., Piovesan, G., Schöngart, J., Villalba, R., and Gloor, E.: Forest carbon sink neutralized by pervasive growth-lifespan trade-offs, Nat. Commun., 11, 4241, https://doi.org/10.1038/s41467-020-17966-z, 2020.
Butler, E. E., Datta, A., Flores-Moreno, H., Chen, M., Wythers, K. R., Fazayeli, F., Banerjee, A., Atkin, O. K., Kattge, J., Amiaud, B., Blonder, B., Boenisch, G., Bond-Lamberty, B., Brown, K. A., Byun, C., Campetella, G., Cerabolini, B. E. L., Cornelissen, J. H. C., Craine, J. M., Craven, D., de Vries, F. T., Díaz, S., Domingues, T. F., Forey, E., González-Melo, A., Gross, N., Han, W., Hattingh, W. N., Hickler, T., Jansen, S., Kramer, K., Kraft, N. J. B., Kurokawa, H., Laughlin, D. C., Meir, P., Minden, V., Niinemets, Ü., Onoda, Y., Peñuelas, J., Read, Q., Sack, L., Schamp, B., Soudzilovskaia, N. A., Spasojevic, M. J., Sosinski, E., Thornton, P. E., Valladares, F., van Bodegom, P. M., Williams, M., Wirth, C., and Reich, P. B.: Mapping local and global variability in plant trait distributions, P. Natl. Acad. Sci. USA, 114, E10937–E10946, https://doi.org/10.1073/pnas.1708984114, 2017.
Campioli, M., Vicca, S., Luyssaert, S., Bilcke, J., Ceschia, E., Chapin Iii, F. S., Ciais, P., Fernández-Martínez, M., Malhi, Y., Obersteiner, M., Olefeldt, D., Papale, D., Piao, S. L., Peñuelas, J., Sullivan, P. F., Wang, X., Zenone, T., and Janssens, I. A.: Biomass production efficiency controlled by management in temperate and boreal ecosystems, Nat. Geosci., 8, 843–846, https://doi.org/10.1038/ngeo2553, 2015.
Castanho, A. D. A., Coe, M. T., Costa, M. H., Malhi, Y., Galbraith, D., and Quesada, C. A.: Improving simulated Amazon forest biomass and productivity by including spatial variation in biophysical parameters, Biogeosciences, 10, 2255–2272, https://doi.org/10.5194/bg-10-2255-2013, 2013.
Chave, J., Navarrete, D., Almeida, S., Álvarez, E., Aragão, L. E. O. C., Bonal, D., Châtelet, P., Silva-Espejo, J. E., Goret, J.-Y., von Hildebrand, P., Jiménez, E., Patiño, S., Peñuela, M. C., Phillips, O. L., Stevenson, P., and Malhi, Y.: Regional and seasonal patterns of litterfall in tropical South America, Biogeosciences, 7, 43–55, https://doi.org/10.5194/bg-7-43-2010, 2010.
Chen, S., Stark, S. C., Nobre, A. D., Cuartas, L. A., de Jesus Amore, D., Restrepo-Coupe, N., Smith, M. N., Chitra-Tarak, R., Ko, H., Nelson, B. W., and Saleska, S. R.: Amazon forest biogeography predicts resilience and vulnerability to drought, Nature, 631, 111–117, 10.1038/s41586-024-07568-w, 2024.
Chen, X., Maignan, F., Viovy, N., Bastos, A., Goll, D., Wu, J., Liu, L., Yue, C., Peng, S., Yuan, W., da Conceição, A. C., O'Sullivan, M., and Ciais, P.: Novel Representation of Leaf Phenology Improves Simulation of Amazonian Evergreen Forest Photosynthesis in a Land Surface Model, J. Adv. Model. Earth Sy., 12, e2018MS001565, https://doi.org/10.1029/2018MS001565, 2020.
Chen, Y.-Y., Gardiner, B., Pasztor, F., Blennow, K., Ryder, J., Valade, A., Naudts, K., Otto, J., McGrath, M. J., Planque, C., and Luyssaert, S.: Simulating damage for wind storms in the land surface model ORCHIDEE-CAN (revision 4262), Geosci. Model Dev., 11, 771–791, https://doi.org/10.5194/gmd-11-771-2018, 2018.
Costa, F. R. C., Schietti, J., Stark, S. C., and Smith, M. N.: The other side of tropical forest drought: do shallow water table regions of Amazonia act as large-scale hydrological refugia from drought?, New Phytol., 237, 714–733, https://doi.org/10.1111/nph.17914, 2023.
Dalagnol, R., Wagner, F. H., Galvão, L. S., Streher, A. S., Phillips, O. L., Gloor, E., Pugh, T. A. M., Ometto, J. P. H. B., and Aragão, L. E. O. C.: Large-scale variations in the dynamics of Amazon forest canopy gaps from airborne lidar data and opportunities for tree mortality estimates, Sci. Rep., 11, 1388, https://doi.org/10.1038/s41598-020-80809-w, 2021.
Dalagnol, R., Wagner, F. H., Galvão, L. S., Braga, D., Osborn, F., Sagang, L. B., da Conceição Bispo, P., Payne, M., Silva Junior, C., Favrichon, S., Silgueiro, V., Anderson, L. O., Aragão, L. E. O. e. C. d., Fensholt, R., Brandt, M., Ciais, P., and Saatchi, S.: Mapping tropical forest degradation with deep learning and Planet NICFI data, Remote Sens. Environ., 298, 113798, https://doi.org/10.1016/j.rse.2023.113798, 2023.
Darela-Filho, J. P. and Lapola, D. M.: Reference maps of soil phosphorus for the pan-Amazon region: code and data, Repositório de Dados de Pesquisa da Unicamp, V3 [data set], https://doi.org/10.25824/redu/FROESE, 2023.
Darela-Filho, J. P., Rammig, A., Fleischer, K., Reichert, T., Lugli, L. F., Quesada, C. A., Hurtarte, L. C. C., de Paula, M. D., and Lapola, D. M.: Reference maps of soil phosphorus for the pan-Amazon region, Earth Syst. Sci. Data, 16, 715–729, https://doi.org/10.5194/essd-16-715-2024, 2024.
Delbart, N., Ciais, P., Chave, J., Viovy, N., Malhi, Y., and Le Toan, T.: Mortality as a key driver of the spatial distribution of aboveground biomass in Amazonian forest: results from a dynamic vegetation model, Biogeosciences, 7, 3027–3039, https://doi.org/10.5194/bg-7-3027-2010, 2010.
Doughty, C. E., Goldsmith, G. R., Raab, N., Girardin, C. A. J., Farfan-Amezquita, F., Huaraca-Huasco, W., Silva-Espejo, J. E., Araujo-Murakami, A., da Costa, A. C. L., Rocha, W., Galbraith, D., Meir, P., Metcalfe, D. B., and Malhi, Y.: What controls variation in carbon use efficiency among Amazonian tropical forests?, Biotropica, 50, 16–25, https://doi.org/10.1111/btp.12504, 2018.
Ellsworth, D. S., Crous, K. Y., De Kauwe, M. G., Verryckt, L. T., Goll, D., Zaehle, S., Bloomfield, K. J., Ciais, P., Cernusak, L. A., Domingues, T. F., Dusenge, M. E., Garcia, S., Guerrieri, R., Ishida, F. Y., Janssens, I. A., Kenzo, T., Ichie, T., Medlyn, B. E., Meir, P., Norby, R. J., Reich, P. B., Rowland, L., Santiago, L. S., Sun, Y., Uddling, J., Walker, A. P., Weerasinghe, K. W. L. K., van de Weg, M. J., Zhang, Y.-B., Zhang, J.-L., and Wright, I. J.: Convergence in phosphorus constraints to photosynthesis in forests around the world, Nat. Commun., 13, 5005, https://doi.org/10.1038/s41467-022-32545-0, 2022.
Enquist, B. J. and Niklas, K. J.: Invariant scaling relations across tree-dominated communities, Nature, 410, 655–660, https://doi.org/10.1038/35070500, 2001.
Esquivel-Muelbert, A., Phillips, O. L., Brienen, R. J. W., Fauset, S., Sullivan, M. J. P., Baker, T. R., Chao, K.-J., Feldpausch, T. R., Gloor, E., Higuchi, N., Houwing-Duistermaat, J., Lloyd, J., Liu, H., Malhi, Y., Marimon, B., Marimon Junior, B. H., Monteagudo-Mendoza, A., Poorter, L., Silveira, M., Torre, E. V., Dávila, E. A., del Aguila Pasquel, J., Almeida, E., Loayza, P. A., Andrade, A., Aragão, L. E. O. C., Araujo-Murakami, A., Arets, E., Arroyo, L., Aymard C, G. A., Baisie, M., Baraloto, C., Camargo, P. B., Barroso, J., Blanc, L., Bonal, D., Bongers, F., Boot, R., Brown, F., Burban, B., Camargo, J. L., Castro, W., Moscoso, V. C., Chave, J., Comiskey, J., Valverde, F. C., da Costa, A. L., Cardozo, N. D., Di Fiore, A., Dourdain, A., Erwin, T., Llampazo, G. F., Vieira, I. C. G., Herrera, R., Honorio Coronado, E., Huamantupa-Chuquimaco, I., Jimenez-Rojas, E., Killeen, T., Laurance, S., Laurance, W., Levesley, A., Lewis, S. L., Ladvocat, K. L. L. M., Lopez-Gonzalez, G., Lovejoy, T., Meir, P., Mendoza, C., Morandi, P., Neill, D., Nogueira Lima, A. J., Vargas, P. N., de Oliveira, E. A., Camacho, N. P., Pardo, G., Peacock, J., Peña-Claros, M., Peñuela-Mora, M. C., Pickavance, G., Pipoly, J., Pitman, N., Prieto, A., Pugh, T. A. M., Quesada, C., Ramirez-Angulo, H., de Almeida Reis, S. M., Rejou-Machain, M., Correa, Z. R., Bayona, L. R., Rudas, A., Salomão, R., Serrano, J., Espejo, J. S., Silva, N., Singh, J., Stahl, C., Stropp, J., Swamy, V., Talbot, J., ter Steege, H., Terborgh, J., Thomas, R., Toledo, M., Torres-Lezama, A., Gamarra, L. V., van der Heijden, G., van der Meer, P., van der Hout, P., Martinez, R. V., Vieira, S. A., Cayo, J. V., Vos, V., Zagt, R., Zuidema, P., and Galbraith, D.: Tree mode of death and mortality risk factors across Amazon forests, Nat. Commun., 11, 5515, https://doi.org/10.1038/s41467-020-18996-3, 2020.
Fan, Y., Li, H., and Miguez-Macho, G.: Global Patterns of Groundwater Table Depth, Science, 339, 940–943, https://doi.org/10.1126/science.1229881, 2013 (data available at: http://thredds-gfnl.usc.es/thredds/catalog/GLOBALWTDFTP/catalog.html, last access: 7 August 2025).
FAO and IIASA: Harmonized World Soil Database version 2.0, FAO and IIASA [data set], https://doi.org/10.4060/cc3823en, 2023 (data available at: https://data.isric.org/geonetwork/srv/api/records/54aebf11-ec73-4ff8-bf6c-ecff4b0725ea, last access: 7 August 2025).
Farquhar, G. D., von Caemmerer, S., and Berry, J. A.: A biochemical model of photosynthetic CO2 assimilation in leaves of C3 species, Planta, https://doi.org/10.1007/BF00386231, 1980.
Feng, Y., Negrón-Juárez, R. I., Romps, D. M., and Chambers, J. Q.: Amazon windthrow disturbances are likely to increase with storm frequency under global warming, Nat. Commun., 14, 101, https://doi.org/10.1038/s41467-022-35570-1, 2023.
Ferry, B., Morneau, F., Bontemps, J.-D., Blanc, L., and Freycon, V.: Higher treefall rates on slopes and waterlogged soils result in lower stand biomass and productivity in a tropical rain forest, J. Ecol., 98, 106–116, https://doi.org/10.1111/j.1365-2745.2009.01604.x, 2010.
Flores, B. M., Montoya, E., Sakschewski, B., Nascimento, N., Staal, A., Betts, R. A., Levis, C., Lapola, D. M., Esquível-Muelbert, A., Jakovac, C., Nobre, C. A., Oliveira, R. S., Borma, L. S., Nian, D., Boers, N., Hecht, S. B., ter Steege, H., Arieira, J., Lucas, I. L., Berenguer, E., Marengo, J. A., Gatti, L. V., Mattos, C. R. C., and Hirota, M.: Critical transitions in the Amazon forest system, Nature, 626, 555–564, https://doi.org/10.1038/s41586-023-06970-0, 2024.
Flores, M., Kjeld, N., Riveros, J. C., et al.: WWF's Living Amazon Initiative: a comprehensive approach to conserving the largest rainforest and river system on Earth, WWF, Lima, Peru, October 2010, ISBN 978-2-940443-25-3, https://wwf.panda.org/wwf_news/?196095/LIVING-AMAZON-INITIATIVE-STRATEGY-SUMMMARY (last access: 7 August 2025), 2010.
Galbraith, D., Malhi, Y., Affum-Baffoe, K., Castanho, A. D. A., Doughty, C. E., Fisher, R. A., Lewis, S. L., Peh, K. S. H., Phillips, O. L., Quesada, C. A., Sonké, B., and Lloyd, J.: Residence times of woody biomass in tropical forests, Plant Ecol. Divers., 6, 139–157, https://doi.org/10.1080/17550874.2013.770578, 2013.
Gatti, L. V., Basso, L. S., Miller, J. B., Gloor, M., Gatti Domingues, L., Cassol, H. L. G., Tejada, G., Aragão, L. E. O. C., Nobre, C., Peters, W., Marani, L., Arai, E., Sanches, A. H., Corrêa, S. M., Anderson, L., Von Randow, C., Correia, C. S. C., Crispim, S. P., and Neves, R. A. L.: Amazonia as a carbon source linked to deforestation and climate change, Nature, 595, 388–393, https://doi.org/10.1038/s41586-021-03629-6, 2021.
Goll, D. S., Brovkin, V., Parida, B. R., Reick, C. H., Kattge, J., Reich, P. B., van Bodegom, P. M., and Niinemets, Ü.: Nutrient limitation reduces land carbon uptake in simulations with a model of combined carbon, nitrogen and phosphorus cycling, Biogeosciences, 9, 3547–3569, https://doi.org/10.5194/bg-9-3547-2012, 2012.
Groenendijk, R., Karaoglu, S., Gevers, T., and Mensink, T.: Multi-Loss Weighting with Coefficient of Variations, IEEE Winter Conference on Applications of Computer Vision (WACV), Waikoloa, HI, USA, 1468–1477, https://doi.org/10.1109/WACV48630.2021.00151, 2021.
Harper, K. L., Lamarche, C., Hartley, A., Peylin, P., Ottlé, C., Bastrikov, V., San Martín, R., Bohnenstengel, S. I., Kirches, G., Boettcher, M., Shevchuk, R., Brockmann, C., and Defourny, P.: A 29-year time series of annual 300 m resolution plant-functional-type maps for climate models, Earth Syst. Sci. Data, 15, 1465–1499, https://doi.org/10.5194/essd-15-1465-2023, 2023.
Harris, I., Osborn, T. J., Jones, P., and Lister, D.: Version 4 of the CRU TS monthly high-resolution gridded multivariate climate dataset, Sci. Data, 7, 109, https://doi.org/10.1038/s41597-020-0453-3, 2020.
Haverd, V., Lovell, J. L., Cuntz, M., Jupp, D. L. B., Newnham, G. J., and Sea, W.: The Canopy Semi-analytic Pgap And Radiative Transfer (CanSPART) model: Formulation and application, Agr. Forest Meteorol., 160, 14–35, https://doi.org/10.1016/j.agrformet.2012.01.018, 2012.
He, X., Augusto, L., Goll, D. S., Ringeval, B., Wang, Y.-P., Helfenstein, J., Huang, Y., and Hou, E.: Global patterns and drivers of phosphorus fractions in natural soils, Biogeosciences, 20, 4147–4163, https://doi.org/10.5194/bg-20-4147-2023, 2023.
Joetzjer, E., Maignan, F., Chave, J., Goll, D., Poulter, B., Barichivich, J., Maréchaux, I., Luyssaert, S., Guimberteau, M., Naudts, K., Bonal, D., and Ciais, P.: Effect of tree demography and flexible root water uptake for modeling the carbon and water cycles of Amazonia, Ecol. Model., 469, 109969, https://doi.org/10.1016/j.ecolmodel.2022.109969, 2022.
Johnson, M. O., Galbraith, D., Gloor, M., De Deurwaerder, H., Guimberteau, M., Rammig, A., Thonicke, K., Verbeeck, H., von Randow, C., Monteagudo, A., Phillips, O. L., Brienen, R. J. W., Feldpausch, T. R., Lopez Gonzalez, G., Fauset, S., Quesada, C. A., Christoffersen, B., Ciais, P., Sampaio, G., Kruijt, B., Meir, P., Moorcroft, P., Zhang, K., Alvarez-Davila, E., Alves de Oliveira, A., Amaral, I., Andrade, A., Aragao, L. E. O. C., Araujo-Murakami, A., Arets, E. J. M. M., Arroyo, L., Aymard, G. A., Baraloto, C., Barroso, J., Bonal, D., Boot, R., Camargo, J., Chave, J., Cogollo, A., Cornejo Valverde, F., Lola da Costa, A. C., Di Fiore, A., Ferreira, L., Higuchi, N., Honorio, E. N., Killeen, T. J., Laurance, S. G., Laurance, W. F., Licona, J., Lovejoy, T., Malhi, Y., Marimon, B., Marimon Junior, B. H., Matos, D. C. L., Mendoza, C., Neill, D. A., Pardo, G., Peña-Claros, M., Pitman, N. C. A., Poorter, L., Prieto, A., Ramirez-Angulo, H., Roopsind, A., Rudas, A., Salomao, R. P., Silveira, M., Stropp, J., ter Steege, H., Terborgh, J., Thomas, R., Toledo, M., Torres-Lezama, A., van der Heijden, G. M. F., Vasquez, R., Guimarães Vieira, I. C., Vilanova, E., Vos, V. A., and Baker, T. R.: Variation in stem mortality rates determines patterns of above-ground biomass in Amazonian forests: implications for dynamic global vegetation models, Glob. Change Biol., 22, 3996–4013, https://doi.org/10.1111/gcb.13315, 2016.
Jung, M., Schwalm, C., Migliavacca, M., Walther, S., Camps-Valls, G., Koirala, S., Anthoni, P., Besnard, S., Bodesheim, P., Carvalhais, N., Chevallier, F., Gans, F., Goll, D. S., Haverd, V., Köhler, P., Ichii, K., Jain, A. K., Liu, J., Lombardozzi, D., Nabel, J. E. M. S., Nelson, J. A., O'Sullivan, M., Pallandt, M., Papale, D., Peters, W., Pongratz, J., Rödenbeck, C., Sitch, S., Tramontana, G., Walker, A., Weber, U., and Reichstein, M.: Scaling carbon fluxes from eddy covariance sites to globe: synthesis and evaluation of the FLUXCOM approach, Biogeosciences, 17, 1343–1365, https://doi.org/10.5194/bg-17-1343-2020, 2020.
Kattge, J., Knorr, W., Raddatz, T., and Wirth, C.: Quantifying photosynthetic capacity and its relationship to leaf nitrogen content for global-scale terrestrial biosphere models, Glob. Change Biol., 15, 976–991, https://doi.org/10.1111/j.1365-2486.2008.01744.x, 2009.
Keeling, H. C. and Phillips, O. L.: The global relationship between forest productivity and biomass, Global Ecol. Biogeogr., 16, 618–631, https://doi.org/10.1111/j.1466-8238.2007.00314.x, 2007.
Koven, C. D., Knox, R. G., Fisher, R. A., Chambers, J. Q., Christoffersen, B. O., Davies, S. J., Detto, M., Dietze, M. C., Faybishenko, B., Holm, J., Huang, M., Kovenock, M., Kueppers, L. M., Lemieux, G., Massoud, E., McDowell, N. G., Muller-Landau, H. C., Needham, J. F., Norby, R. J., Powell, T., Rogers, A., Serbin, S. P., Shuman, J. K., Swann, A. L. S., Varadharajan, C., Walker, A. P., Wright, S. J., and Xu, C.: Benchmarking and parameter sensitivity of physiological and vegetation dynamics using the Functionally Assembled Terrestrial Ecosystem Simulator (FATES) at Barro Colorado Island, Panama, Biogeosciences, 17, 3017–3044, https://doi.org/10.5194/bg-17-3017-2020, 2020.
Krinner, G., Viovy, N., de Noblet-Ducoudré, N., Ogée, J., Polcher, J., Friedlingstein, P., Ciais, P., Sitch, S., and Prentice, I. C.: A dynamic global vegetation model for studies of the coupled atmosphere-biosphere system, Global Biogeochem. Cy., 19, GB1015, https://doi.org/10.1029/2003GB002199, 2005.
Li, B., Ryu, Y., Jiang, C., Dechant, B., Liu, J., Yan, Y., and Li, X.: BESSv2.0: A satellite-based and coupled-process model for quantifying long-term global land–atmosphere fluxes, Remote Sens. Environ., 295, 113696, https://doi.org/10.1016/j.rse.2023.113696, 2023.
Li, X. and Xiao, J.: A Global, 0.05-Degree Product of Solar-Induced Chlorophyll Fluorescence Derived from OCO-2, MODIS, and Reanalysis Data, Remote Sens., 11, 517, https://doi.org/10.3390/rs11050517, 2019 (data available at: http://data.globalecology.unh.edu/data/GOSIF_v2/, last access: 7 August 2025).
Liu, M., He, H., Ren, X., Sun, X., Yu, G., Han, S., Wang, H., and Zhou, G.: The effects of constraining variables on parameter optimization in carbon and water flux modeling over different forest ecosystems, Ecol. Model., 303, 30–41, https://doi.org/10.1016/j.ecolmodel.2015.01.027, 2015.
Loeppky, J. L., Sacks, J., and Welch, W. J.: Choosing the Sample Size of a Computer Experiment: A Practical Guide, Technometrics, 51, 366–376, https://doi.org/10.1198/TECH.2009.08040, 2009.
Longo, M., Keller, M., dos-Santos, M. N., Leitold, V., Pinagé, E. R., Baccini, A., Saatchi, S., Nogueira, E. M., Batistella, M., and Morton, D. C.: Aboveground biomass variability across intact and degraded forests in the Brazilian Amazon, Global Biogeochem. Cy., 30, 1639–1660, https://doi.org/10.1002/2016GB005465, 2016.
Lundberg, S. M., Erion, G., Chen, H., DeGrave, A., Prutkin, J. M., Nair, B., Katz, R., Himmelfarb, J., Bansal, N., and Lee, S.-I.: From local explanations to global understanding with explainable AI for trees, Nature Machine Intelligence, 2, 56–67, https://doi.org/10.1038/s42256-019-0138-9, 2020.
Ma, R., Zhang, Y., Ciais, P., Xiao, J., Xu, Y., Goll, D., and Liang, S.: Stepwise Calibration of Age-Dependent Biomass in the Integrated Biosphere Simulator (IBIS) Model, J. Adv. Model. Earth Sy., 16, e2023MS004048, https://doi.org/10.1029/2023MS004048, 2024.
Malhi, Y., Baker, T. R., Phillips, O. L., Almeida, S., Alvarez, E., Arroyo, L., Chave, J., Czimczik, C. I., Fiore, A. D., Higuchi, N., Killeen, T. J., Laurance, S. G., Laurance, W. F., Lewis, S. L., Montoya, L. M. M., Monteagudo, A., Neill, D. A., Vargas, P. N., Patiño, S., Pitman, N. C. A., Quesada, C. A., Salomão, R., Silva, J. N. M., Lezama, A. T., Martínez, R. V., Terborgh, J., Vinceti, B., and Lloyd, J.: The above-ground coarse wood productivity of 104 Neotropical forest plots, Glob. Change Biol., 10, 563–591, https://doi.org/10.1111/j.1529-8817.2003.00778.x, 2004.
Malhi, Y., Wood, D., Baker, T. R., Wright, J., Phillips, O. L., Cochrane, T., Meir, P., Chave, J., Almeida, S., Arroyo, L., Higuchi, N., Killeen, T. J., Laurance, S. G., Laurance, W. F., Lewis, S. L., Monteagudo, A., Neill, D. A., Vargas, P. N., Pitman, N. C. A., Quesada, C. A., SalomÃO, R., Silva, J. N. M., Lezama, A. T., Terborgh, J., MartÍNez, R. V., and Vinceti, B.: The regional variation of aboveground live biomass in old-growth Amazonian forests, Glob. Change Bio., 12, 1107–1138, https://doi.org/10.1111/j.1365-2486.2006.01120.x, 2006.
Malhi, Y., Doughty, C. E., Goldsmith, G. R., Metcalfe, D. B., Girardin, C. A. J., Marthews, T. R., del Aguila-Pasquel, J., Aragão, L. E. O. C., Araujo-Murakami, A., Brando, P., da Costa, A. C. L., Silva-Espejo, J. E., Farfán Amézquita, F., Galbraith, D. R., Quesada, C. A., Rocha, W., Salinas-Revilla, N., Silvério, D., Meir, P., and Phillips, O. L.: The linkages between photosynthesis, productivity, growth and biomass in lowland Amazonian forests, Glob. Change Biol., 21, 2283–2295, https://doi.org/10.1111/gcb.12859, 2015.
Marie, G., Jeong, J., Jactel, H., Petter, G., Cailleret, M., McGrath, M. J., Bastrikov, V., Ghattas, J., Guenet, B., Lansø, A. S., Naudts, K., Valade, A., Yue, C., and Luyssaert, S.: Simulating Ips typographus L. outbreak dynamics and their influence on carbon balance estimates with ORCHIDEE r8627, Geosci. Model Dev., 17, 8023–8047, https://doi.org/10.5194/gmd-17-8023-2024, 2024.
Marthews, T. R., Malhi, Y., Girardin, C. A. J., Silva Espejo, J. E., Aragão, L. E. O. C., Metcalfe, D. B., Rapp, J. M., Mercado, L. M., Fisher, R. A., Galbraith, D. R., Fisher, J. B., Salinas-Revilla, N., Friend, A. D., Restrepo-Coupe, N., and Williams, R. J.: Simulating forest productivity along a neotropical elevational transect: temperature variation and carbon use efficiency, Glob. Change Biol., 18, 2882–2898, https://doi.org/10.1111/j.1365-2486.2012.02728.x, 2012.
McKay, M. D., Beckman, R. J., and Conover, W. J.: A Comparison of Three Methods for Selecting Values of Input Variables in the Analysis of Output From a Computer Code, Technometrics, 42, 55–61, 10.1080/00401706.2000.10485979, 2000.
Mitchard, E. T. A., Feldpausch, T. R., Brienen, R. J. W., Lopez-Gonzalez, G., Monteagudo, A., Baker, T. R., Lewis, S. L., Lloyd, J., Quesada, C. A., Gloor, M., Ter Steege, H., Meir, P., Alvarez, E., Araujo-Murakami, A., Aragão, L. E. O. C., Arroyo, L., Aymard, G., Banki, O., Bonal, D., Brown, S., Brown, F. I., Cerón, C. E., Chama Moscoso, V., Chave, J., Comiskey, J. A., Cornejo, F., Corrales Medina, M., Da Costa, L., Costa, F. R. C., Di Fiore, A., Domingues, T. F., Erwin, T. L., Frederickson, T., Higuchi, N., Honorio Coronado, E. N., Killeen, T. J., Laurance, W. F., Levis, C., Magnusson, W. E., Marimon, B. S., Marimon Junior, B. H., Mendoza Polo, I., Mishra, P., Nascimento, M. T., Neill, D., Núñez Vargas, M. P., Palacios, W. A., Parada, A., Pardo Molina, G., Peña-Claros, M., Pitman, N., Peres, C. A., Poorter, L., Prieto, A., Ramirez-Angulo, H., Restrepo Correa, Z., Roopsind, A., Roucoux, K. H., Rudas, A., Salomão, R. P., Schietti, J., Silveira, M., de Souza, P. F., Steininger, M. K., Stropp, J., Terborgh, J., Thomas, R., Toledo, M., Torres-Lezama, A., van Andel, T. R., van der Heijden, G. M. F., Vieira, I. C. G., Vieira, S., Vilanova-Torre, E., Vos, V. A., Wang, O., Zartman, C. E., Malhi, Y., and Phillips, O. L.: Markedly divergent estimates of Amazon forest carbon density from ground plots and satellites, Global Ecol. Biogeogr., 23, 935–946, https://doi.org/10.1111/geb.12168, 2014.
Moorcroft, P. R., Hurtt, G. C., and Pacala, S. W.: A METHOD FOR SCALING VEGETATION DYNAMICS: THE ECOSYSTEM DEMOGRAPHY MODEL (ED), Ecol. Monogr., 71, 557–586, https://doi.org/10.1890/0012-9615(2001)071[0557:AMFSVD]2.0.CO;2, 2001.
Muller-Landau, H. C., Condit, R. S., Harms, K. E., Marks, C. O., Thomas, S. C., Bunyavejchewin, S., Chuyong, G., Co, L., Davies, S., Foster, R., Gunatilleke, S., Gunatilleke, N., Hart, T., Hubbell, S. P., Itoh, A., Kassim, A. R., Kenfack, D., LaFrankie, J. V., Lagunzad, D., Lee, H. S., Losos, E., Makana, J.-R., Ohkubo, T., Samper, C., Sukumar, R., Sun, I.-F., Nur Supardi, M. N., Tan, S., Thomas, D., Thompson, J., Valencia, R., Vallejo, M. I., Muñoz, G. V., Yamakura, T., Zimmerman, J. K., Dattaraja, H. S., Esufali, S., Hall, P., He, F., Hernandez, C., Kiratiprayoon, S., Suresh, H. S., Wills, C., and Ashton, P.: Comparing tropical forest tree size distributions with the predictions of metabolic ecology and equilibrium models, Ecol. Lett., 9, 589–602, https://doi.org/10.1111/j.1461-0248.2006.00915.x, 2006.
Muller-Landau, H. C., Cushman, K. C., Arroyo, E. E., Martinez Cano, I., Anderson-Teixeira, K. J., and Backiel, B.: Patterns and mechanisms of spatial variation in tropical forest productivity, woody residence time, and biomass, New Phytol., 229, 3065–3087, https://doi.org/10.1111/nph.17084, 2021.
Naudts, K., Ryder, J., McGrath, M. J., Otto, J., Chen, Y., Valade, A., Bellasen, V., Berhongaray, G., Bönisch, G., Campioli, M., Ghattas, J., De Groote, T., Haverd, V., Kattge, J., MacBean, N., Maignan, F., Merilä, P., Penuelas, J., Peylin, P., Pinty, B., Pretzsch, H., Schulze, E. D., Solyga, D., Vuichard, N., Yan, Y., and Luyssaert, S.: A vertically discretised canopy description for ORCHIDEE (SVN r2290) and the modifications to the energy, water and carbon fluxes, Geosci. Model Dev., 8, 2035–2065, https://doi.org/10.5194/gmd-8-2035-2015, 2015.
Pan, Y., Birdsey, R. A., Fang, J., Houghton, R., Kauppi, P. E., Kurz, W. A., Phillips, O. L., Shvidenko, A., Lewis, S. L., Canadell, J. G., Ciais, P., Jackson, R. B., Pacala, S. W., McGuire, A. D., Piao, S., Rautiainen, A., Sitch, S., and Hayes, D.: A Large and Persistent Carbon Sink in the World's Forests, Science, 333, 988–993, https://doi.org/10.1126/science.1201609, 2011.
Peylin, P., Bacour, C., MacBean, N., Leonard, S., Rayner, P., Kuppel, S., Koffi, E., Kane, A., Maignan, F., Chevallier, F., Ciais, P., and Prunet, P.: A new stepwise carbon cycle data assimilation system using multiple data streams to constrain the simulated land surface carbon cycle, Geosci. Model Dev., 9, 3321–3346, https://doi.org/10.5194/gmd-9-3321-2016, 2016.
Prentice, I. C., Bondeau, A., Cramer, W., Harrison, S. P., Hickler, T., Lucht, W., Sitch, S., Smith, B., and Sykes, M. T.: Dynamic Global Vegetation Modeling: Quantifying Terrestrial Ecosystem Responses to Large-Scale Environmental Change, in: Terrestrial Ecosystems in a Changing World, edited by: Canadell, J. G., Pataki, D. E., and Pitelka, L. F., Springer Berlin Heidelberg, Berlin, Heidelberg, 175–192, https://doi.org/10.1007/978-3-540-32730-1_15, 2007.
Quesada, C. A., Lloyd, J., Schwarz, M., Patiño, S., Baker, T. R., Czimczik, C., Fyllas, N. M., Martinelli, L., Nardoto, G. B., Schmerler, J., Santos, A. J. B., Hodnett, M. G., Herrera, R., Luizão, F. J., Arneth, A., Lloyd, G., Dezzeo, N., Hilke, I., Kuhlmann, I., Raessler, M., Brand, W. A., Geilmann, H., Moraes Filho, J. O., Carvalho, F. P., Araujo Filho, R. N., Chaves, J. E., Cruz Junior, O. F., Pimentel, T. P., and Paiva, R.: Variations in chemical and physical properties of Amazon forest soils in relation to their genesis, Biogeosciences, 7, 1515–1541, https://doi.org/10.5194/bg-7-1515-2010, 2010.
Quesada, C. A., Phillips, O. L., Schwarz, M., Czimczik, C. I., Baker, T. R., Patiño, S., Fyllas, N. M., Hodnett, M. G., Herrera, R., Almeida, S., Alvarez Dávila, E., Arneth, A., Arroyo, L., Chao, K. J., Dezzeo, N., Erwin, T., di Fiore, A., Higuchi, N., Honorio Coronado, E., Jimenez, E. M., Killeen, T., Lezama, A. T., Lloyd, G., López-González, G., Luizão, F. J., Malhi, Y., Monteagudo, A., Neill, D. A., Núñez Vargas, P., Paiva, R., Peacock, J., Peñuela, M. C., Peña Cruz, A., Pitman, N., Priante Filho, N., Prieto, A., Ramírez, H., Rudas, A., Salomão, R., Santos, A. J. B., Schmerler, J., Silva, N., Silveira, M., Vásquez, R., Vieira, I., Terborgh, J., and Lloyd, J.: Basin-wide variations in Amazon forest structure and function are mediated by both soils and climate, Biogeosciences, 9, 2203–2246, https://doi.org/10.5194/bg-9-2203-2012, 2012.
Reed, S. C., Yang, X., and Thornton, P. E.: Incorporating phosphorus cycling into global modeling efforts: a worthwhile, tractable endeavor, New Phytol., 208, 324–329, https://doi.org/10.1111/nph.13521, 2015.
Rödig, E., Cuntz, M., Heinke, J., Rammig, A., and Huth, A.: Spatial heterogeneity of biomass and forest structure of the Amazon rain forest: Linking remote sensing, forest modelling and field inventory, Global Ecol. Biogeogr., 26, 1292–1302, https://doi.org/10.1111/geb.12639, 2017.
Rödig, E., Knapp, N., Fischer, R., Bohn, F. J., Dubayah, R., Tang, H., and Huth, A.: From small-scale forest structure to Amazon-wide carbon estimates, Nat. Commun., 10, 5088, https://doi.org/10.1038/s41467-019-13063-y, 2019.
Rüger, N., Condit, R., Dent, D. H., DeWalt, S. J., Hubbell, S. P., Lichstein, J. W., Lopez, O. R., Wirth, C., and Farrior, C. E.: Demographic trade-offs predict tropical forest dynamics, Science, 368, 165–168, https://doi.org/10.1126/science.aaz4797, 2020.
Saatchi, S., Mascaro, J., Xu, L., Keller, M., Yang, Y., Duffy, P., Espírito-Santo, F., Baccini, A., Chambers, J., and Schimel, D.: Seeing the forest beyond the trees, Global Ecol. Biogeogr., 24, 606–610, https://doi.org/10.1111/geb.12256, 2015.
Santoro, M. and Cartus, O.: ESA Biomass Climate Change Initiative (Biomass_cci): Global datasets of forest above-ground biomass for the years 2010, 2015, 2016, 2017, 2018, 2019, 2020 and 2021, v5. NERC EDS Centre for Environmental Data Analysis [data set], https://doi.org/10.5285/5f331c418e9f4935b8eb1b836f8a91b8, 2024.
Shapley, L. S.: A value for n-person games, in: Contributions to the Theory of Games, Vol. 2, edited by: Kuhn, H. W. and Tucker, A. W., Princeton University Press, Princeton, NJ, USA, 307–317, https://doi.org/10.1515/9781400881970-018, 1953.
Sitch, S., Smith, B., Prentice, I. C., Arneth, A., Bondeau, A., Cramer, W., Kaplan, J. O., Levis, S., Lucht, W., Sykes, M. T., Thonicke, K., and Venevsky, S.: Evaluation of ecosystem dynamics, plant geography and terrestrial carbon cycling in the LPJ dynamic global vegetation model, Glob. Change Biol., 9, 161–185, https://doi.org/10.1046/j.1365-2486.2003.00569.x, 2003.
Sousa, T. R., Schietti, J., Ribeiro, I. O., Emílio, T., Fernández, R. H., ter Steege, H., Castilho, C. V., Esquivel-Muelbert, A., Baker, T., Pontes-Lopes, A., Silva, C. V. J., Silveira, J. M., Derroire, G., Castro, W., Mendoza, A. M., Ruschel, A., Prieto, A., Lima, A. J. N., Rudas, A., Araujo-Murakami, A., Gutierrez, A. P., Andrade, A., Roopsind, A., Manzatto, A. G., Di Fiore, A., Torres-Lezama, A., Dourdain, A., Marimon, B., Marimon, B. H., Burban, B., van Ulft, B., Herault, B., Quesada, C., Mendoza, C., Stahl, C., Bonal, D., Galbraith, D., Neill, D., de Oliveira, E. A., Hase, E., Jimenez-Rojas, E., Vilanova, E., Arets, E., Berenguer, E., Alvarez-Davila, E., Honorio Coronado, E. N., Almeida, E., Coelho, F., Valverde, F. C., Elias, F., Brown, F., Bongers, F., Arevalo, F. R., Lopez-Gonzalez, G., van der Heijden, G., Aymard C, G. A., Llampazo, G. F., Pardo, G., Ramírez-Angulo, H., do Amaral, I. L., Vieira, I. C. G., Huamantupa-Chuquimaco, I., Comiskey, J. A., Singh, J., Espejo, J. S., del Aguila-Pasquel, J., Zwerts, J. A., Talbot, J., Terborgh, J., Ferreira, J., Barroso, J. G., Barlow, J., Camargo, J. L., Stropp, J., Peacock, J., Serrano, J., Melgaço, K., Ferreira, L. V., Blanc, L., Poorter, L., Gamarra, L. V., Aragão, L., Arroyo, L., Silveira, M., Peñuela-Mora, M. C., Vargas, M. P. N., Toledo, M., Disney, M., Réjou-Méchain, M., Baisie, M., Kalamandeen, M., Camacho, N. P., Cardozo, N. D., Silva, N., Pitman, N., Higuchi, N., Banki, O., Loayza, P. A., Graça, P. M. L. A., Morandi, P. S., van der Meer, P. J., van der Hout, P., Naisso, P., Camargo, P. B., Salomão, R., Thomas, R., Boot, R., Umetsu, R. K., da Costa Silva, R., Burnham, R., Zagt, R., Martinez, R. V., Brienen, R., Ribeiro, S. C., Lewis, S. L., Vieira, S. A., de Almeida Reis, S. M., Fauset, S., Laurance, S., Feldpausch, T., Erwin, T., Killeen, T., Wortel, V., Moscoso, V. C., Vos, V., Huasco, W. H., Laurance, W., Malhi, Y., Magnusson, W. E., Phillips, O. L., and Costa, F. R. C.: Water table depth modulates productivity and biomass across Amazonian forests, Global Ecol. Biogeogr., 31, 1571–1588, https://doi.org/10.1111/geb.13531, 2022.
Sun, Y., Goll, D. S., Chang, J., Ciais, P., Guenet, B., Helfenstein, J., Huang, Y., Lauerwald, R., Maignan, F., Naipal, V., Wang, Y., Yang, H., and Zhang, H.: Global evaluation of the nutrient-enabled version of the land surface model ORCHIDEE-CNP v1.2 (r5986), Geosci. Model Dev., 14, 1987–2010, https://doi.org/10.5194/gmd-14-1987-2021, 2021.
ter Steege, H., Pitman, N. C. A., Phillips, O. L., Chave, J., Sabatier, D., Duque, A., Molino, J.-F., Prévost, M.-F., Spichiger, R., Castellanos, H., von Hildebrand, P., and Vásquez, R.: Continental-scale patterns of canopy tree composition and function across Amazonia, Nature, 443, 444–447, https://doi.org/10.1038/nature05134, 2006.
University of East Anglia Climatic Research Unit and Harris, I. C.: CRU JRA v2.4: A forcings dataset of gridded land surface blend of Climatic Research Unit (CRU) and Japanese reanalysis (JRA) data; Jan.1901–Dec.2022, NERC EDS Centre for Environmental Data Analysis [data set], https://catalogue.ceda.ac.uk/uuid/aed8e269513f446fb1b5d2512bb387ad (last access: 7 August 2025), 2023.
Vancutsem, C., Achard, F., Pekel, J. F., Vieilledent, G., Carboni, S., Simonetti, D., Gallego, J., Aragão, L. E. O. C., and Nasi, R.: Long-term (1990–2019) monitoring of forest cover changes in the humid tropics, Sci. Adv., 7, eabe1603, https://doi.org/10.1126/sciadv.abe1603, 2021.
Vicca, S., Luyssaert, S., Peñuelas, J., Campioli, M., Chapin Iii, F. S., Ciais, P., Heinemeyer, A., Högberg, P., Kutsch, W. L., Law, B. E., Malhi, Y., Papale, D., Piao, S. L., Reichstein, M., Schulze, E. D., and Janssens, I. A.: Fertile forests produce biomass more efficiently, Ecol. Lett., 15, 520–526, https://doi.org/10.1111/j.1461-0248.2012.01775.x, 2012.
Vuichard, N., Messina, P., Luyssaert, S., Guenet, B., Zaehle, S., Ghattas, J., Bastrikov, V., and Peylin, P.: Accounting for carbon and nitrogen interactions in the global terrestrial ecosystem model ORCHIDEE (trunk version, rev 4999): multi-scale evaluation of gross primary production, Geosci. Model Dev., 12, 4751–4779, https://doi.org/10.5194/gmd-12-4751-2019, 2019.
Wang, Y. P., Law, R. M., and Pak, B.: A global model of carbon, nitrogen and phosphorus cycles for the terrestrial biosphere, Biogeosciences, 7, 2261–2282, https://doi.org/10.5194/bg-7-2261-2010, 2010.
Yan, H., Sun, N., Eldardiry, H., Thurber, T. B., Reed, P. M., Malek, K., Gupta, R., Kennedy, D., Swenson, S. C., Wang, L., Li, D., Vernon, C. R., Burleyson, C. D., and Rice, J. S.: Characterizing uncertainty in Community Land Model version 5 hydrological applications in the United States, Sci. Data, 10, 187, https://doi.org/10.1038/s41597-023-02049-7, 2023.
Yang, H., Ciais, P., Wang, Y., Huang, Y., Wigneron, J.-P., Bastos, A., Chave, J., Chang, J., E. Doughty, C., Fan, L., Goll, D., Joetzjer, E., Li, W., Lucas, R., Quegan, S., Le Toan, T., and Yu, K.: Variations of carbon allocation and turnover time across tropical forests, Global Ecol. Biogeogr., 30, 1271–1285, https://doi.org/10.1111/geb.13302, 2021.
Yang, H., Wang, S., Son, R., Lee, H., Benson, V., Zhang, W., Zhang, Y., Zhang, Y., Kattge, J., Boenisch, G., Schepaschenko, D., Karaszewski, Z., Stereńczak, K., Moreno-Martínez, Á., Nabais, C., Birnbaum, P., Vieilledent, G., Weber, U., and Carvalhais, N.: Global patterns of tree wood density, Glob. Change Biol., 30, e17224, https://doi.org/10.1111/gcb.17224, 2024a.
Yang, H., Wang, S., Son, R., Lee, H., Benson, V., Zhang, W., Zhang, Y., Kattge, J., Boenisch, G., Schepaschenko, D., Karaszewski, Z., Krzysztof, S., Moreno-Martínez, Á., Nabais, C., Birnbaum, P., Vieilledent, G., Weber, U., and Carvalhais, N.: Global patterns of tree wood density (1.0), Zenodo [data set], https://doi.org/10.5281/zenodo.10804643, 2024b.
Yao, Y., Joetzjer, E., Ciais, P., Viovy, N., Cresto Aleina, F., Chave, J., Sack, L., Bartlett, M., Meir, P., Fisher, R., and Luyssaert, S.: Forest fluxes and mortality response to drought: model description (ORCHIDEE-CAN-NHA r7236) and evaluation at the Caxiuanã drought experiment, Geosci. Model Dev., 15, 7809–7833, https://doi.org/10.5194/gmd-15-7809-2022, 2022.
Yin, X. and Struik, P. C.: C3 and C4 photosynthesis models: an overview from the perspective of crop modelling, NJAS-Wagen. J. Life Sc., 57, 27–38, 2009.
Yu, K., Chen, H. Y. H., Gessler, A., Pugh, T. A. M., Searle, E. B., Allen, R. B., Pretzsch, H., Ciais, P., Phillips, O. L., Brienen, R. J. W., Chu, C., Xie, S., and Ballantyne, A. P.: Forest demography and biomass accumulation rates are associated with transient mean tree size vs. density scaling relations, PNAS Nexus, 3, pgae008, https://doi.org/10.1093/pnasnexus/pgae008, 2024.
Yu, Y., Saatchi, S., Yang, Y., Xu, L., and Meyer, V.: Mapping Global Live Woody Vegetation Biomass at Optimum Spatial Resolutions, Zenodo [data set], https://doi.org/10.5281/zenodo.7583611, 2023.
Yue, C., Ciais, P., Cadule, P., Thonicke, K., Archibald, S., Poulter, B., Hao, W. M., Hantson, S., Mouillot, F., Friedlingstein, P., Maignan, F., and Viovy, N.: Modelling the role of fires in the terrestrial carbon balance by incorporating SPITFIRE into the global vegetation model ORCHIDEE – Part 1: simulating historical global burned area and fire regimes, Geosci. Model Dev., 7, 2747–2767, https://doi.org/10.5194/gmd-7-2747-2014, 2014.
Zhu, L.: ORCHIDEE r8849 (Version r8849), Zenodo [code], https://doi.org/10.5281/zenodo.15080562, 2025a.
Zhu, L.: Source code and data for “Spatially varying parameters improve carbon cycle modeling in the Amazon rainforest with ORCHIDEE r8849”, Zenodo [data set, code], https://doi.org/10.5281/zenodo.15023110, 2025b.
Zuleta, D., Arellano, G., McMahon, S. M., Aguilar, S., Bunyavejchewin, S., Castaño, N., Chang-Yang, C.-H., Duque, A., Mitre, D., Nasardin, M., Pérez, R., Sun, I. F., Yao, T. L., Valencia, R., Krishna Moorthy, S. M., Verbeeck, H., and Davies, S. J.: Damage to living trees contributes to almost half of the biomass losses in tropical forests, Glob. Change Biol., 29, 3409–3420, https://doi.org/10.1111/gcb.16687, 2023.