the Creative Commons Attribution 4.0 License.
the Creative Commons Attribution 4.0 License.
 | 25 Apr 2025
Development and evaluation of a new 4DEnVar-based weakly coupled ocean data assimilation system in E3SMv2
Pengfei Shi
Bin Wang
The development, implementation, and evaluation of a new weakly coupled ocean data assimilation (WCODA) system for the fully coupled Energy Exascale Earth System Model version 2 (E3SMv2) utilizing the four-dimensional ensemble variational (4DEnVar) method are presented in this study. The 4DEnVar method, based on the dimension-reduced projection four-dimensional variational (DRP-4DVar) approach, replaces the adjoint model with the ensemble technique, thereby reducing computational demands. Monthly mean ocean temperature and salinity data from the EN4.2.1 reanalysis are integrated into the ocean component of E3SMv2 from 1950 to 2021 with the goal of providing realistic initial conditions for decadal predictions and predictability studies. The performance of the WCODA system is assessed using various metrics, including the reduction rate of the cost function, root mean square error (RMSE) differences, correlation differences, and model biases. Results indicate that the WCODA system effectively assimilates the reanalysis data into the climate model, consistently achieving negative reduction rates of the cost function and notable improvements in RMSE and correlation across various ocean layers and regions. Significant enhancements are observed in the upper ocean layers across the majority of global ocean regions, particularly in the north Atlantic, north Pacific, and Indian Ocean. Model biases in sea surface temperature and salinity are also substantially reduced. For sea surface temperature, cold biases in the north Pacific and north Atlantic are diminished by about 1–2 °C, and warm biases in the Southern Ocean are corrected by approximately 1.5–2.5 °C. In terms of salinity, improvements are observed with bias reductions of about 0.5–1 psu in the north Atlantic and north Pacific and up to 1.5 psu in parts of the Southern Ocean. The ultimate goal of the WCODA system is to advance the predictive capabilities of E3SM for subseasonal to decadal climate predictions, thereby supporting research on strategic energy-sector policies and planning.
- Article
(15643 KB) - Full-text XML
- BibTeX
- EndNote


Climate predictions are essential for understanding and mitigating the impacts of climate variability and change. The accuracy and reliability of climate predictions depends strongly on the initialization of the climate models, which requires realistic and high-quality initial conditions (ICs) for skillful predictions (Dirmeyer et al., 2018). Data assimilation (DA) techniques are important for providing realistic ICs by integrating observational data into the model, thereby enhancing the predictive capabilities of climate models (Tardif et al., 2014). The efficacy of DA techniques has been demonstrated through enhanced predictability on subseasonal to decadal timescales (Zhou et al., 2024).
Numerous studies have focused on the initialization of climate models for decadal predictions (Branstator and Teng, 2012; Polkova et al., 2019). Climate models integrate multiple components, including the atmosphere, ocean, sea ice, and land. For the initialization of climate models in decadal predictions, DA methods can be categorized into uncoupled data assimilation and coupled data assimilation (CDA). In the uncoupled method, DA is performed independently within the uncoupled atmosphere, land, and ocean models rather than in a coupled model. The optimal analyses from these uncoupled models are then integrated together to establish the ICs for the climate model's predictions (Yao et al., 2021). For example, some studies directly utilize existing reanalysis data to initialize climate models for decadal predictions (Yeager et al., 2012; Tian et al., 2021). Nevertheless, the uncoupled DA method may lead to imbalances between different model components, potentially inducing initial shocks and diminishing the reliability of climate predictions (Smith et al., 2015; Zhang et al., 2020). Therefore, there is a growing interest in exploring and developing CDA methods to enhance the coherence and accuracy of the ICs for climate predictions.
Many research groups and institutions are actively engaged in the development and refinement of CDA methods. In CDA, the assimilation process is conducted directly within a coupled model. Compared to uncoupled DA, CDA provides balanced ICs that are more coordinated across multiple components of coupled models (Zhang et al., 2014). Previous studies have demonstrated that CDA enhances interannual climate predictions more effectively than uncoupled DA (Zhang et al., 2005; Shi et al., 2022). CDA techniques are divided into weakly coupled data assimilation (WCDA) and strongly coupled data assimilation (SCDA). In the WCDA system, reanalysis data are assimilated independently within each component of the coupled model. However, through the coupled model integration, reanalysis information from one component is transmitted to other components through interactions across multiple systems (Browne et al., 2019; He et al., 2020a). Sequential DA is distinctly partitioned into two primary stages: the analysis and forecast steps. During the WCDA analysis step, reanalysis information from one component cannot directly influence other components due to the lack of cross-component background error covariances. Nonetheless, the coupled model is employed during the forecast step to transfer reanalysis information from a single component to others through the integration of the coupled system (Laloyaux et al., 2016; Carrassi et al., 2018). The primary distinction between WCDA and uncoupled DA is the use of the coupled model during the forecast step (Zhang et al., 2020). Recent studies have developed WCDA systems that separately assimilate reanalysis data from the atmosphere (Li et al., 2021), land (Shi et al., 2024), and ocean (He et al., 2017) into coupled models. On the other hand, SCDA employs cross-component background error covariances during the analysis step to directly exert an instantaneous impact of reanalysis information from a single component on the state variables of other components, treating all Earth system components as an integrated whole (Sluka et al., 2016). Moreover, SCDA also allows the reanalysis information from a single component to propagate to other components during the forecast step through the coupled model integration (Yoshida and Kalnay, 2018). Therefore, SCDA offers potential benefits, including reduced model drift and enhanced forecast accuracy (Smith et al., 2015). Nevertheless, the development of SCDA presents considerable obstacles, primarily due to the complexity of accurately establishing cross-component background error covariances (Penny and Hamill, 2017). As a result, most existing CDA systems continue to employ the WCDA systems.
This study presents the development and implementation of the weakly coupled ocean data assimilation (WCODA) system for the fully coupled Energy Exascale Earth System Model version 2 (E3SMv2), utilizing the four-dimensional ensemble variational (4DEnVar) method. The 4DEnVar method is based on the dimension-reduced projection four-dimensional variational (DRP-4DVar) approach, notable for its innovative application of 4DVar by replacing the adjoint model with the ensemble approach (Wang et al., 2010). Previous studies have shown that 4DVar-based methods outperform simpler schemes (e.g., nudging or 3DVar) by maintaining dynamical consistency with the model and minimizing initial shocks in the forecasts (Sugiura et al., 2008; Zhang et al., 2020). In the WCODA system, monthly mean ocean temperature and salinity data from the EN4.2.1 reanalysis are incorporated into the ocean component of E3SMv2 to provide realistic ICs for decadal predictions. Although the assimilation process during the analysis step is conducted independently within the ocean component, the fully coupled E3SMv2 model is employed during the forecast step to transmit reanalysis information from the ocean to other components (e.g., atmosphere and land) through multi-component interactions. Consequently, the reanalysis information assimilated into the ocean ICs affects other model components through the integration of the fully coupled model, emphasizing the operation of this system as a WCDA system. The primary objective of this WCODA system is to advance our understanding of the ocean's role in climate predictability. Shi et al. (2024) implemented a weakly coupled land data assimilation in E3SMv2 for isolating the land's role in climate predictability. By improving the accuracy of ICs for both land and ocean, we aim to advance the predictive capabilities of E3SM for decadal predictions, ultimately supporting research on energy-sector policy and planning.
This study presents and evaluates the 4DEnVar-based WCODA system for E3SMv2. Section 2 provides a detailed description of the E3SMv2 model, the ocean reanalysis data, and the framework for implementing the 4DEnVar-based WCODA system. Section 3 evaluates the assimilation performance of the WCODA system. Finally, Sect. 4 provides the conclusions.
2.1 E3SM overview
Developed by the US Department of Energy, the Energy Exascale Earth System Model version 2 (E3SMv2) is a state-of-the-art climate model to advance our understanding of climate variability and its future changes (Leung et al., 2020). E3SMv2 integrates multiple components to simulate the complex interactions within the climate system, encompassing the atmospheric, sea ice, ocean, land, and river transport components. The atmospheric component (EAMv2) represents turbulence, clouds, and aerosol processes (Zhang et al., 2023) and features a nonhydrostatic dynamical core (Taylor et al., 2020). It operates on a dynamic grid with a horizontal resolution of approximately 110 km and includes 72 vertical layers that extend to the stratosphere (Golaz et al., 2022). The sea ice component (MPAS-SI) simulates the formation, evolution, and melting of sea ice, with detailed thermodynamics and dynamics processes (Turner et al., 2022). The ocean component (MPAS-O) is responsible for modeling the physical state and biogeochemical processes of the ocean, including detailed simulations of ocean currents, temperature, and salinity (Reckinger et al., 2015). MPAS-O operates at a horizontal resolution of ∼ 60 km in the mid-latitudes and ∼ 30 km at the Equator and poles, differing from the atmospheric model's resolution of 110 km. It is configured with 60 vertical layers, with finer resolution (∼ 10 m) near the surface and coarser resolution (∼ 200 m) at depth. The vertical mixing scheme employed is the K-profile parameterization, as described by Van Roekel et al. (2018). The land component (ELMv2) encompasses various land surface processes, including biophysical processes, soil processes, and surface hydrology (Golaz et al., 2019). These simulations are crucial for understanding land–atmosphere interactions and their impact on climate variability. Additionally, the river transport component (MOSARTv2) simulates the hydrological dynamics of water flow through river basins, providing insights into freshwater resources, flood risks, and sediment transport (Li et al., 2013). The CPL7 coupler dynamically integrates all five components by regulating the exchange of energy, water, and momentum fluxes between different components (Craig et al., 2012). A comprehensive evaluation of the E3SMv2 model is presented by Golaz et al. (2022).
2.2 Ocean reanalysis dataset
The ocean temperature and salinity data in this study are derived from the EN4.2.1 ocean reanalysis dataset. Produced by the Met Office Hadley Centre, the EN4.2.1 product is developed based on quality-controlled ocean temperature and salinity profiles from four input sources: Argo, ASBO (Arctic Synoptic Basin-Wide Oceanography), GTSPP (Global Temperature and Salinity Profile Programme), and WOD09 (World Ocean Database) (Good et al., 2013). The EN4.2.1 dataset includes observations from a wide range of profiling instruments, such as Argo floats, expendable bathythermographs (XBTs), and mechanical bathythermographs (MBTs) (Chen et al., 2020). According to Good et al. (2013), observations in EN4.2.1 are most abundant in the upper 100 m, with vertical resolution refined to ∼ 1 m in the top 100 m. Spatially, data density is high in regions such as the north Atlantic and western Pacific but decreases significantly in high-latitude and deep-ocean regions. This distribution in data availability influences the assimilation results. Areas with denser observational coverage, such as the upper north Atlantic, are expected to show greater improvements through assimilation, while regions with sparse observations may exhibit limited improvements.
To initialize decadal climate predictions, monthly mean ocean temperature and salinity data from the EN4.2.1 reanalysis are assimilated into the fully coupled E3SMv2 model across all 60 ocean layers from 1950 to 2021. The choice to utilize monthly mean reanalysis data is based on two primary reasons: firstly, data with higher temporal resolution (less than 1 month) might produce unwanted noise, potentially compromising the accuracy of decadal predictions. Secondly, the initialization for decadal predictions requires assimilation cycles spanning several decades, and assimilating complex, real-time observations over such extended periods would be computationally prohibitive. Therefore, in line with most existing studies that use reanalysis data for initializing decadal predictions (Pohlmann et al., 2019; Tian et al., 2021), this study assimilates the monthly mean EN4.2.1 reanalysis through the WCODA system for decadal predictions.
2.3 Implementation of the 4DEnVar-based WCODA system
The 4DEnVar method employed by the WCODA system is derived from the DRP-4DVar assimilation approach. The DRP-4DVar technique addresses the high computational demands of traditional 4DVar by employing an ensemble approach rather than utilizing the adjoint model (Wang et al., 2010). Zhu et al. (2022) demonstrated that the DRP-4DVar method significantly reduces computational time by approximately 50 % compared to traditional 4DVar systems. This advanced method enhances computational efficiency by projecting the high-dimensional state space onto a lower-dimensional subspace defined by an ensemble of historical samples. DRP-4DVar achieves an optimal solution within this sample space by aligning observations with model-generated historical time series over a four-dimensional window (Wang et al., 2010). The DRP-4DVar approach has been effectively implemented across multiple numerical models, demonstrating its accuracy and effectiveness (Zhao et al., 2012; Shi et al., 2021; Zhu et al., 2022). A comprehensive explanation of the DRP-4DVar method is provided by Wang et al. (2010). The DRP-4DVar method has also been implemented in a weakly coupled land data assimilation system in E3SMv2 (Shi et al., 2024).
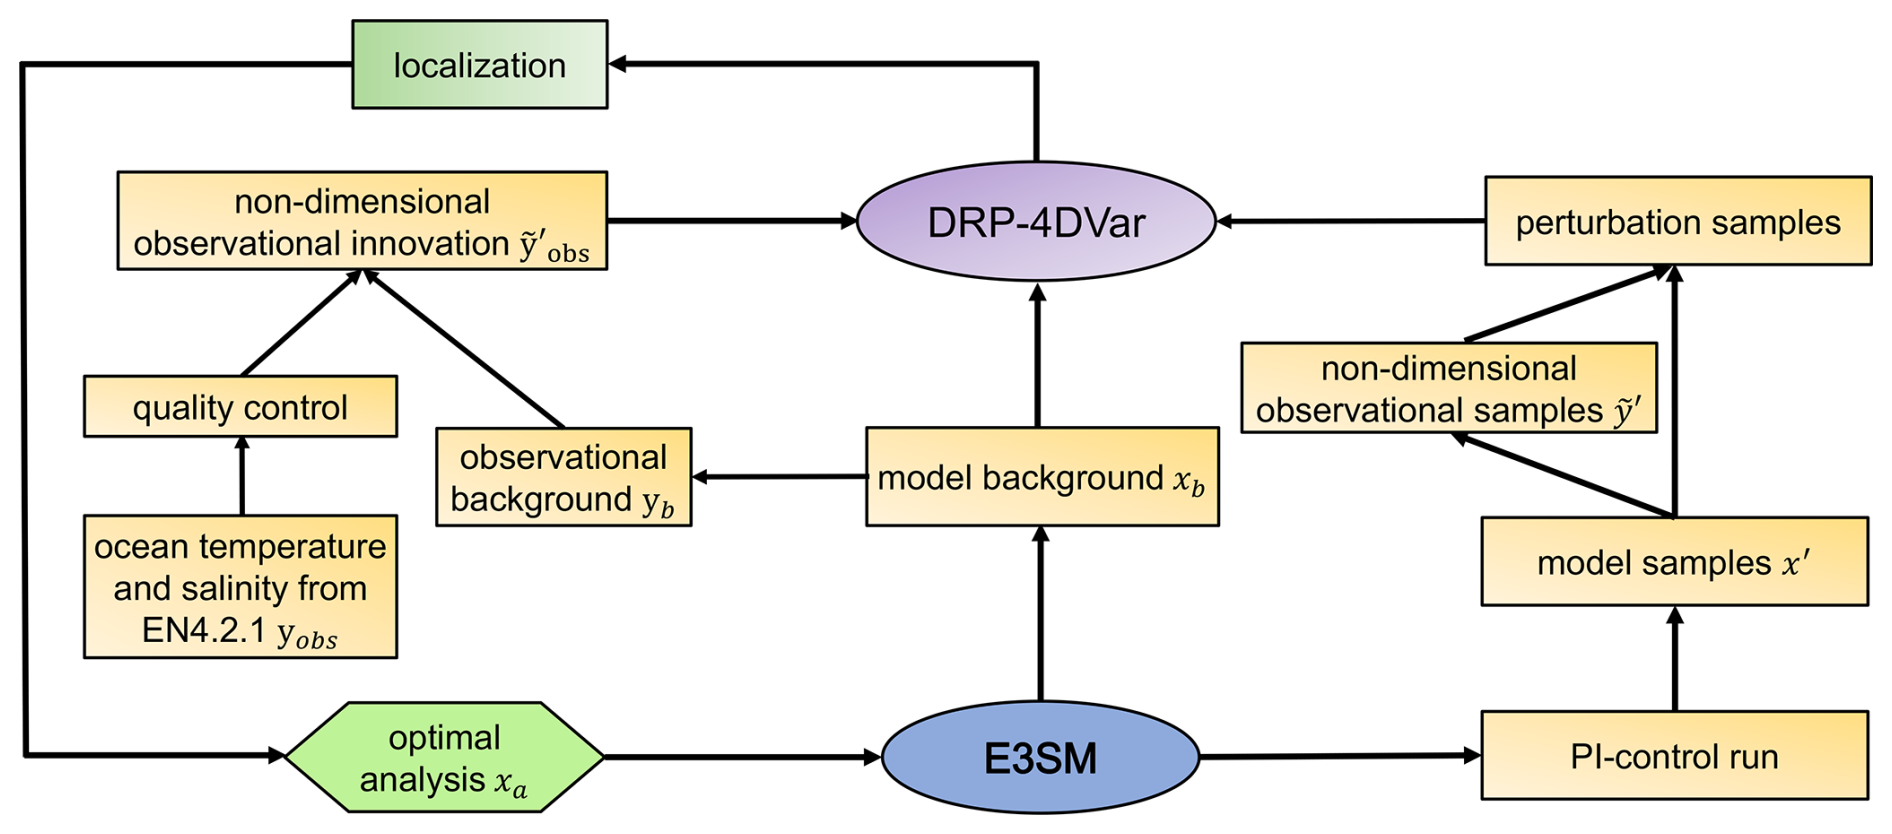
Figure 1Workflow of the 4DEnVar-based WCODA system utilizing the DRP-4DVar method for the E3SM model (modified from Fig. 1 in Shi et al., 2024).

Figure 2Schematic diagram of the DRP-4DVar assimilation process within the 4DEnVar-based WCODA system for E3SM. The model background (xb) includes atmospheric (), land (), ice (), river (), and oceanic () components of the fully coupled E3SMv2. The observational background () is defined by the model outputs of monthly mean ocean temperature () and salinity () using xb as the initial state. The ocean observation () represents the observed monthly mean ocean temperature () and salinity () from the EN4.2.1 reanalysis. The observational innovation () is calculated as the difference between the observed ocean temperature and salinity () and the model's observational background (). denotes the analysis increment. The optimal analysis (xa) encompasses both the optimal analysis of the ocean component () and the background states of other components. This optimal analysis (xa) is used as the initial condition to produce the next month's forecast, transferring ocean reanalysis information to other components.
Figure 1 illustrates the workflow of the 4DEnVar-based WCODA system utilizing the DRP-4DVar approach within the fully coupled E3SMv2 model. The DRP-4DVar algorithm requires three primary inputs: observational innovation (), model background (xb), and perturbation samples. Initially, a fully coupled E3SMv2 simulation is conducted for 1 month to generate both the model background (xb) and the observational background (yb). Specifically, the model background (xb) refers to the monthly initial condition prior to the assimilation, while the observational background (yb) denotes the monthly mean model output. Subsequently, the observational innovation () is calculated as the difference in monthly mean ocean salinity and temperature between the EN4.2.1 reanalysis (yobs) and the monthly mean model output (yb). From 100 years of balanced pre-industrial control (PI control) simulations, 30 sets of monthly mean forecast samples () are selected based on their highest correlations with the observational innovation. More specifically, the monthly mean forecast samples are computed by removing the long-term PI control monthly climatology from the selected PI control monthly mean output, which is then divided by the observational error. Correspondingly, 30 sets of monthly initial condition samples (x′) for the monthly mean forecast samples are derived. The analysis increment is calculated within the perturbation samples, which consist of 30 monthly initial condition samples and their corresponding monthly mean forecast samples. Due to the limited number of samples and to diminish the influence of spurious correlations between distant grid points, the localization procedure is incorporated into the assimilation process (Wang et al., 2018). Finally, the DRP-4DVar algorithm solves for the analysis increment within the sample space, which is then added to the model background (xb) to produce the optimal analysis (xa).
Figure 2 delineates the assimilation process using the DRP-4DVar method within the 4DEnVar-based WCODA system for the fully coupled E3SMv2 model. This assimilation process includes both the analysis and forecast steps through each 1-month assimilation window. In the initial stage, the fully coupled E3SMv2 model employs the model background (xb) as the monthly initial condition to run for 1 month, producing the monthly mean model outputs for ocean temperature and salinity (). During the analysis step, the observational innovation () is computed by comparing the discrepancies between the EN4.2.1 reanalysis () and the model's monthly mean outputs () for ocean temperature and salinity. The DRP-4DVar algorithm then utilizes this observational innovation and the PI control samples to compute the optimal analysis of the ocean component () at the start of the assimilation window. During the subsequent forecast step, the optimal analysis (xa) includes both the optimal ocean analysis () and the background states of other components prior to assimilation. This optimal analysis serves as the new initial condition for the fully coupled E3SMv2 model to run for 1 month to generate the next month's forecast. During this fully coupled model integration, reanalysis information from the ocean component is transmitted to the other model components through interactions across multiple systems. Although the assimilation is directly applied to the ocean component, the use of the initial conditions of all components from the optimal analysis and the fully coupled climate model during the forecast step ensures that the reanalysis information from the optimal ocean analysis influences other components through interactions across multiple systems. Therefore, according to the definition of the WCDA system from previous studies (Carrassi et al., 2018; Zhou et al., 2024), this assimilation system is designated as the WCODA system. Using the same DA approach, Shi et al. (2024) documented the implementation of DRP-4DVar as a weakly coupled land data assimilation system in E3SMv2.
2.4 Experiment design
Two distinct numerical experiments are performed in this study to assess the effectiveness of ocean data assimilation within the 4DEnVar-based WCODA system. (1) The control simulation (CTRL) is a free-running fully coupled integration over a 72-year period from 1950 to 2021, driven exclusively by observed external forcings (e.g., solar radiation and greenhouse gas and aerosol concentrations). The observed external forcings, prescribed according to the CMIP6 protocol (Eyring et al., 2016), directly influence the atmospheric component and subsequently affect other components (e.g., land and ocean) through their coupling with the atmosphere. This free-running simulation allows for unrestricted interactions among the various Earth system components, including the atmosphere, land, and ocean. The CTRL simulation serves as a baseline for evaluating the assimilation effectiveness of the WCODA system. (2) The assimilation experiment (ASSIM) incorporates monthly mean ocean temperature and salinity data from the EN4.2.1 reanalysis into the ocean component of the fully coupled E3SMv2 model across all 60 ocean layers spanning the entire ocean depth. This assimilation is conducted using a 1-month assimilation window, covering the same 72-year period from 1950 to 2021. The assimilation run is initialized directly from the historical run in 1950 using the fully coupled state at the start of the simulation. At the beginning of each monthly assimilation window, the EN4.2.1 reanalysis information is incorporated into the ocean state variables, after which the fully coupled model continues with free integration. During this free integration process, the reanalysis information assimilated into the ocean ICs influences other model components through interactions across multiple systems. The historical external forcings for both the ASSIM and CTRL experiments are derived from the CMIP6 protocol (Eyring et al., 2016).
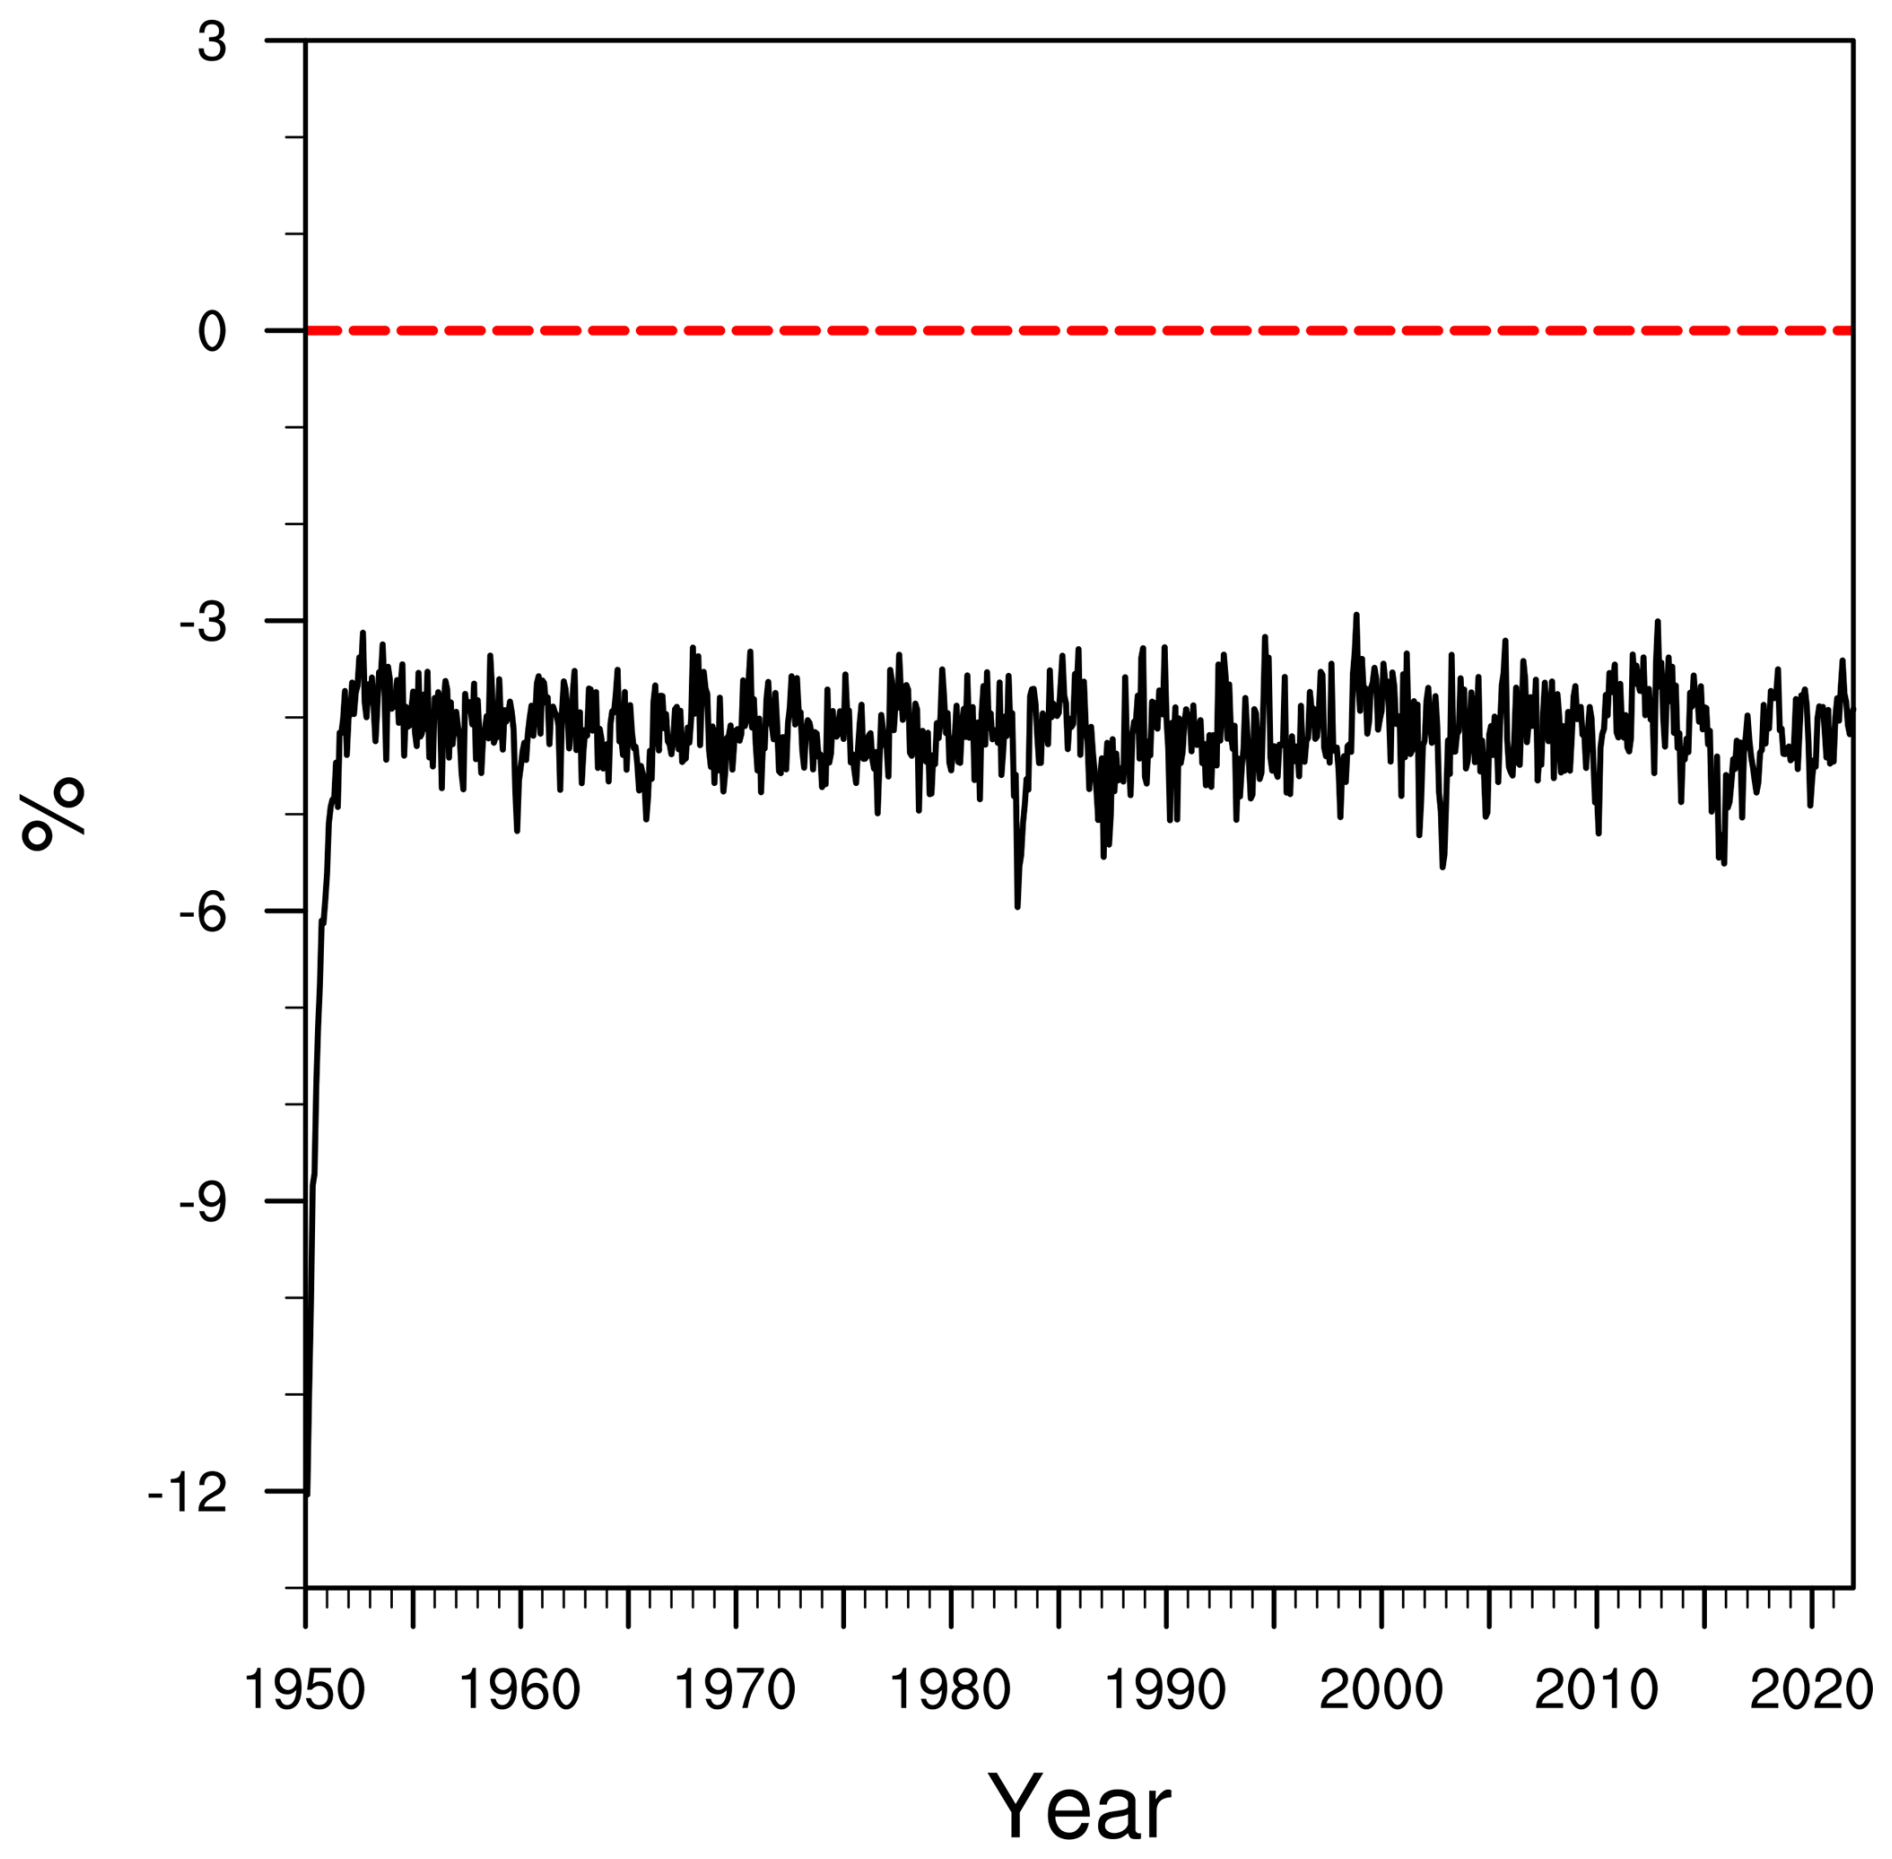
Figure 3Temporal variation of the reduction rate of the cost function (in %) in the WCODA system based on the 4DEnVar method from 1950 to 2021.
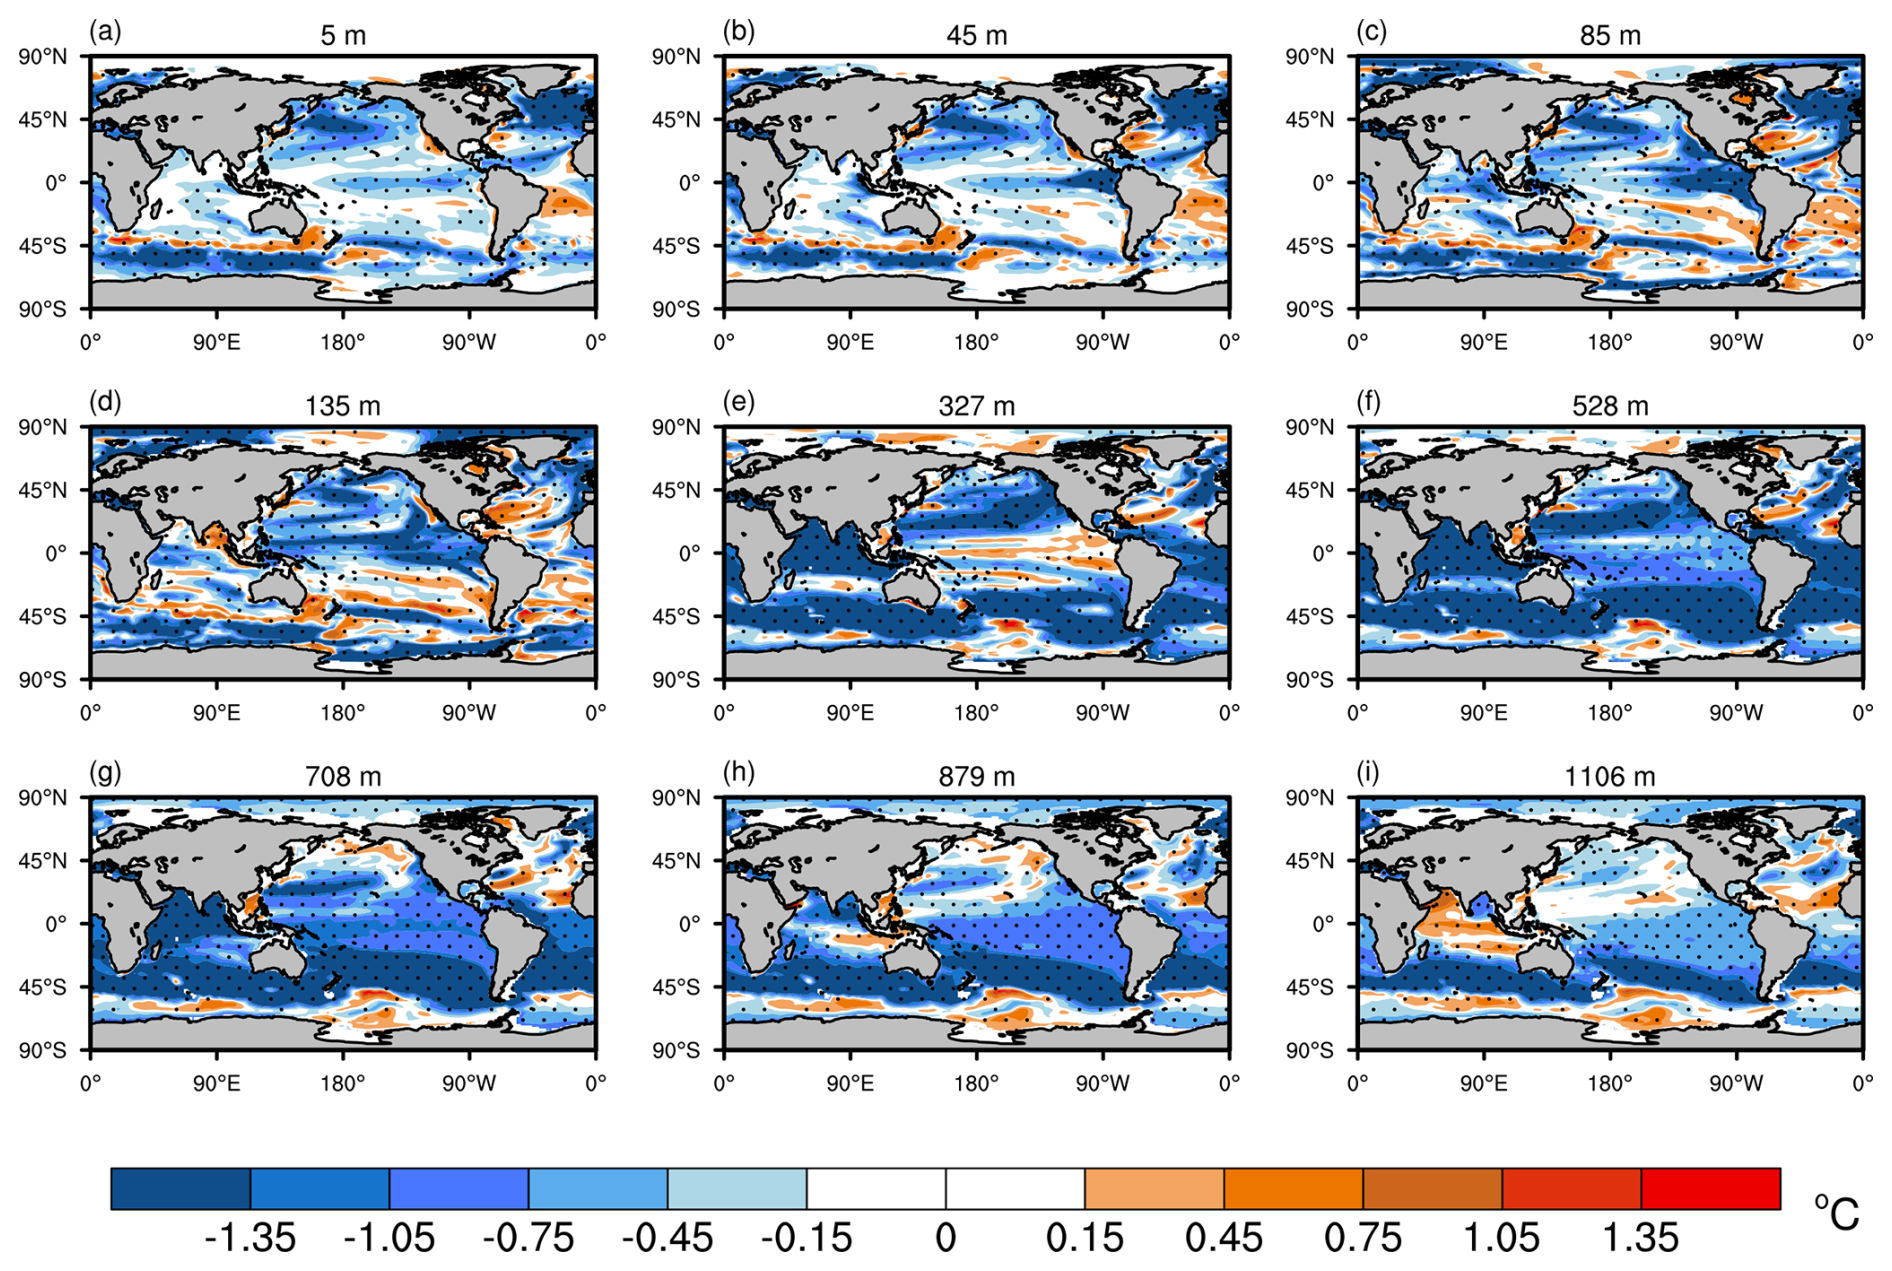
Figure 4Spatial patterns of root mean square error (RMSE) differences in ocean temperature (in °C) between ASSIM and CTRL across nine ocean layers from 1950 to 2021. The RMSE differences are shown for nine different ocean depths: (a) 5 m, (b) 45 m, (c) 85 m, (d) 135 m, (e) 327 m, (f) 528 m, (g) 708 m, (h) 879 m, and (i) 1106 m. Dotted areas represent statistical significance at the 95 % confidence level.
2.5 Assessment criteria
To comprehensively evaluate the effectiveness of the WCODA system, multiple quantitative metrics are employed, including the root mean square error (RMSE), correlation coefficient, and reduction rate of the cost function. The reduction rate of the cost function serves as a fundamental measure to assess the assimilation system's accuracy and is calculated using the formula:
Here, yobs denotes the EN4.2.1 reanalysis, yb represents the pre-assimilation observational background, ya indicates the post-assimilation monthly mean model analyses, and R denotes the observation error covariance matrix. In this study, R is assumed to be diagonal, and its diagonal elements are statistically computed based on the variance of the EN4.2.1 ocean temperature and salinity data. The characteristics of R directly influence the assimilation process, where larger values reduce the relative weight of the EN4.2.1 reanalysis and smaller values increase it. Negative values of the reduction rate of the cost function signify the successful integration of reanalysis data into the model's state variables. To validate the correctness of this assimilation system, the EN4.2.1 reanalysis continues to be utilized as the reference data for evaluation.
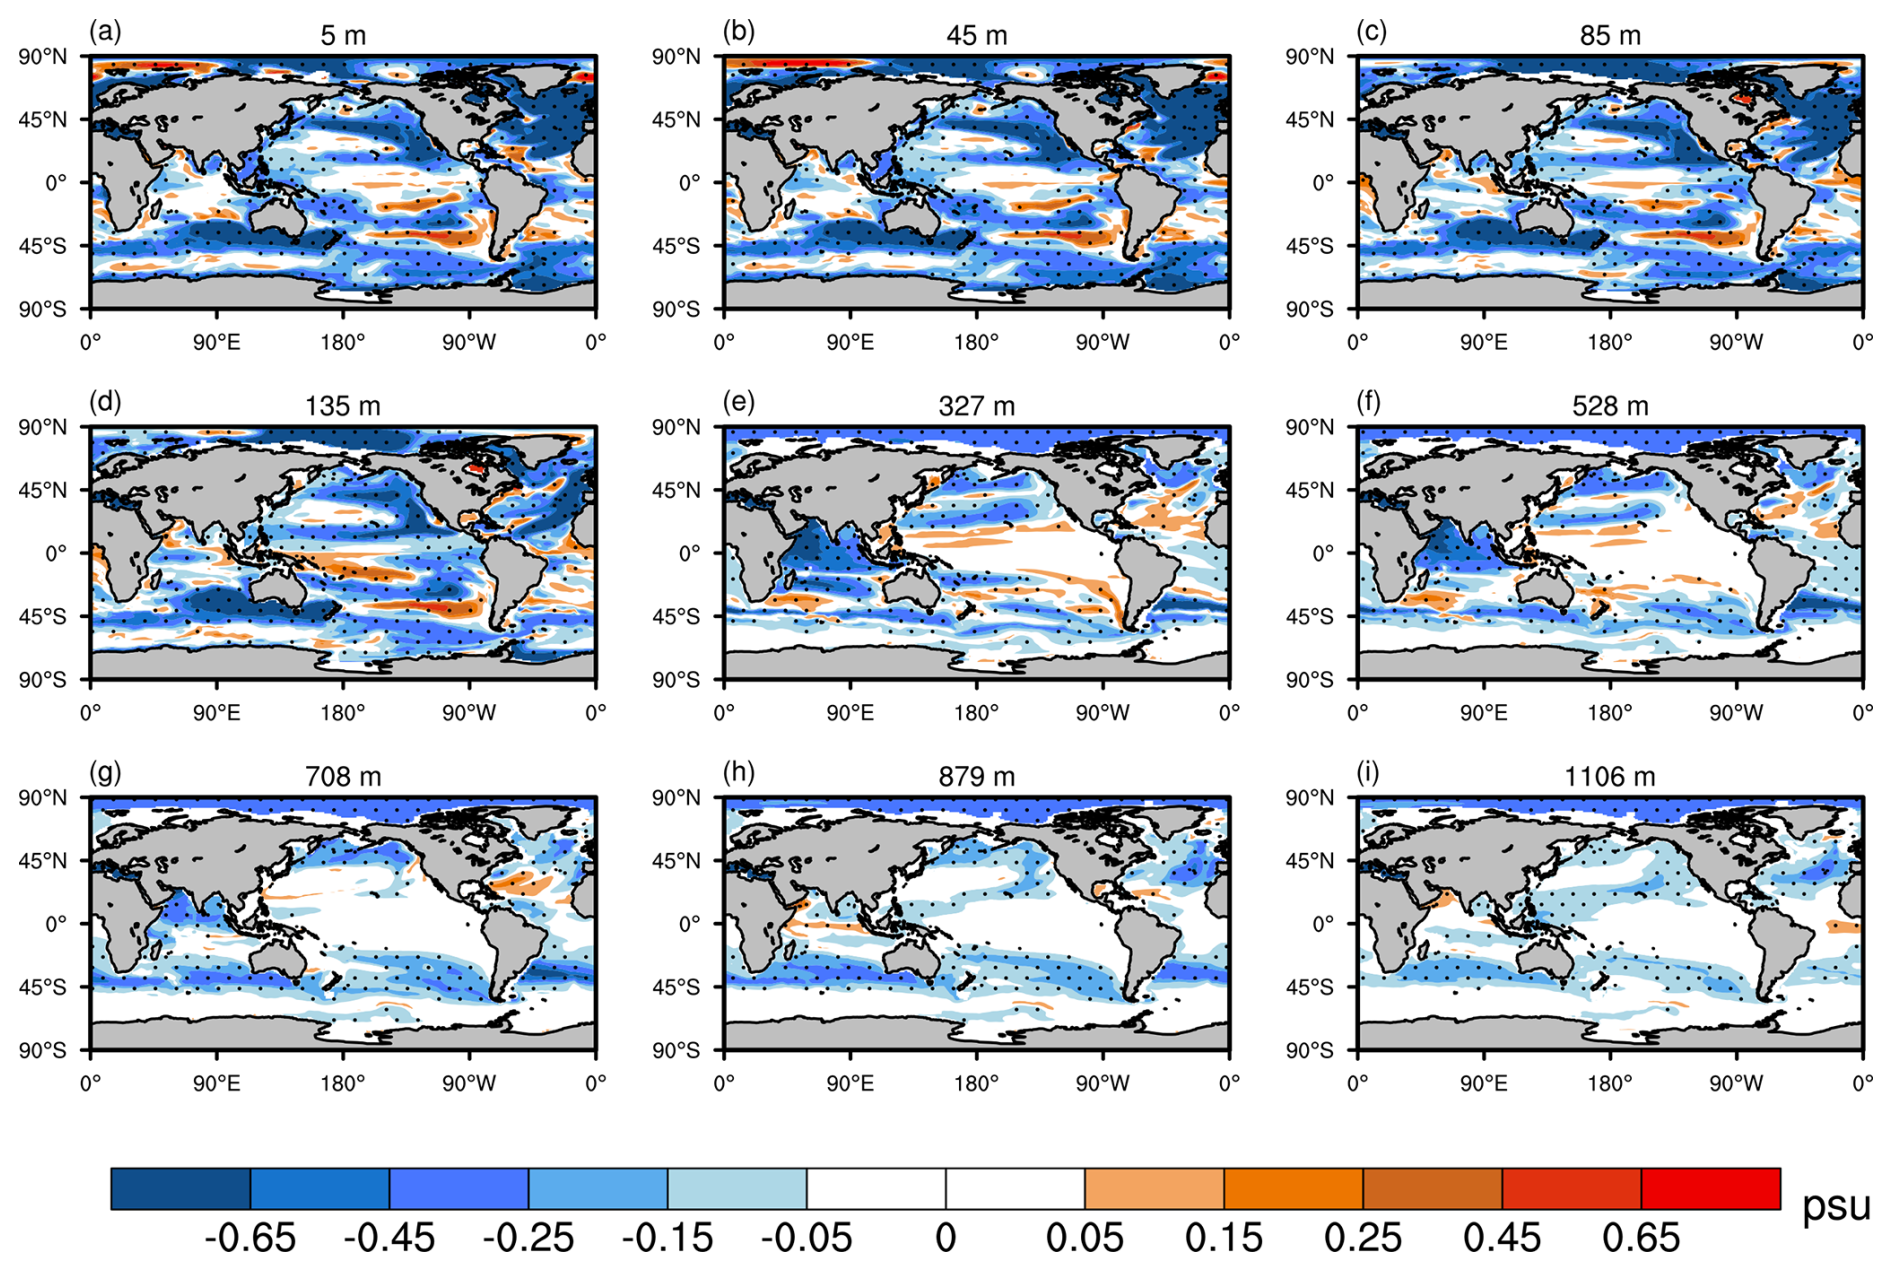
Figure 5Similar to Fig. 4 but for ocean salinity (in psu).
3.1 Reduction rate of the cost function
In Fig. 3, the monthly variation in the reduction rate of the cost function for the 4DEnVar-based WCODA system is presented for the 72-year period from 1950 to 2021. As noted earlier, negative values of the reduction rate of the cost function indicate the successful incorporation of reanalysis data into the coupled model. However, the reduction rate is presented here as positive percentages to represent improvements due to the assimilation. The reduction rate of the cost function reaches 12.03 % in the first month. Over the entire 72-year period from 1950 to 2021, the average monthly reduction rate of the cost function is 4.20 % for all months in ASSIM. This average reduction rate of 4.20 % is comparable to the 4.4 % reduction rate reported by He et al. (2020a), who used a similar 4DEnVar-based assimilation system in a different climate model, further supporting the effectiveness of the 4DEnVar approach. The initial sharp reduction rate of the cost function reflects the rapid adjustments made by the model to align with the reanalysis data. As the assimilation progresses, subsequent iterations refine these adjustments, resulting in a slower rate of reduction. More importantly, the reduction rate of the cost function remains below the zero line in each month of assimilation, indicating consistent improvements due to the assimilation. These findings demonstrate the successful implementation of the WCODA system, confirming that the EN4.2.1 reanalysis data have been effectively integrated into the fully coupled model.
3.2 Performance of RMSE differences
Figure 4 illustrates the RMSE differences in monthly ocean temperature between ASSIM and CTRL from 1950 to 2021 across nine ocean layers. Negative values indicate a reduction in RMSE, signifying improvements due to assimilation, while positive values denote an increase in RMSE, indicating degradations. Overall, the assimilation from the WCODA system leads to marked improvements in ocean temperature simulations across most global regions. Both upper and deeper ocean layers exhibit widespread negative RMSE differences, indicating improvements after assimilation, particularly in the tropical and mid-latitude ocean regions. Notable regions of improvement include the north Atlantic, tropical and north Pacific, and parts of the Southern Ocean. However, increased RMSE values are observed near strong ocean currents and upwelling regions, such as the Gulf Stream, Agulhas Current, and California coast. These regions are characterized by strong horizontal gradients and mesoscale variability, which are not well captured by MPAS-O at relatively coarse resolution and hence present challenges for the assimilation system and likely contribute to diminished performance. In the upper ocean layers, RMSE performance is better during winter compared to summer in some regions, such as the tropical Pacific (Figs. A1 and A2). In the deeper layers, the assimilation still shows notable improvements in regions such as the north Pacific and parts of the Southern Ocean, though with more pronounced degradation observed in the equatorial Atlantic and parts of the Indian Ocean. This degradation in the deeper layers may be attributed to larger observational errors in these regions or the inherent complexity of deeper ocean processes that pose challenges for assimilation (Wunsch and Heimbach, 2007; Balmaseda et al., 2013).
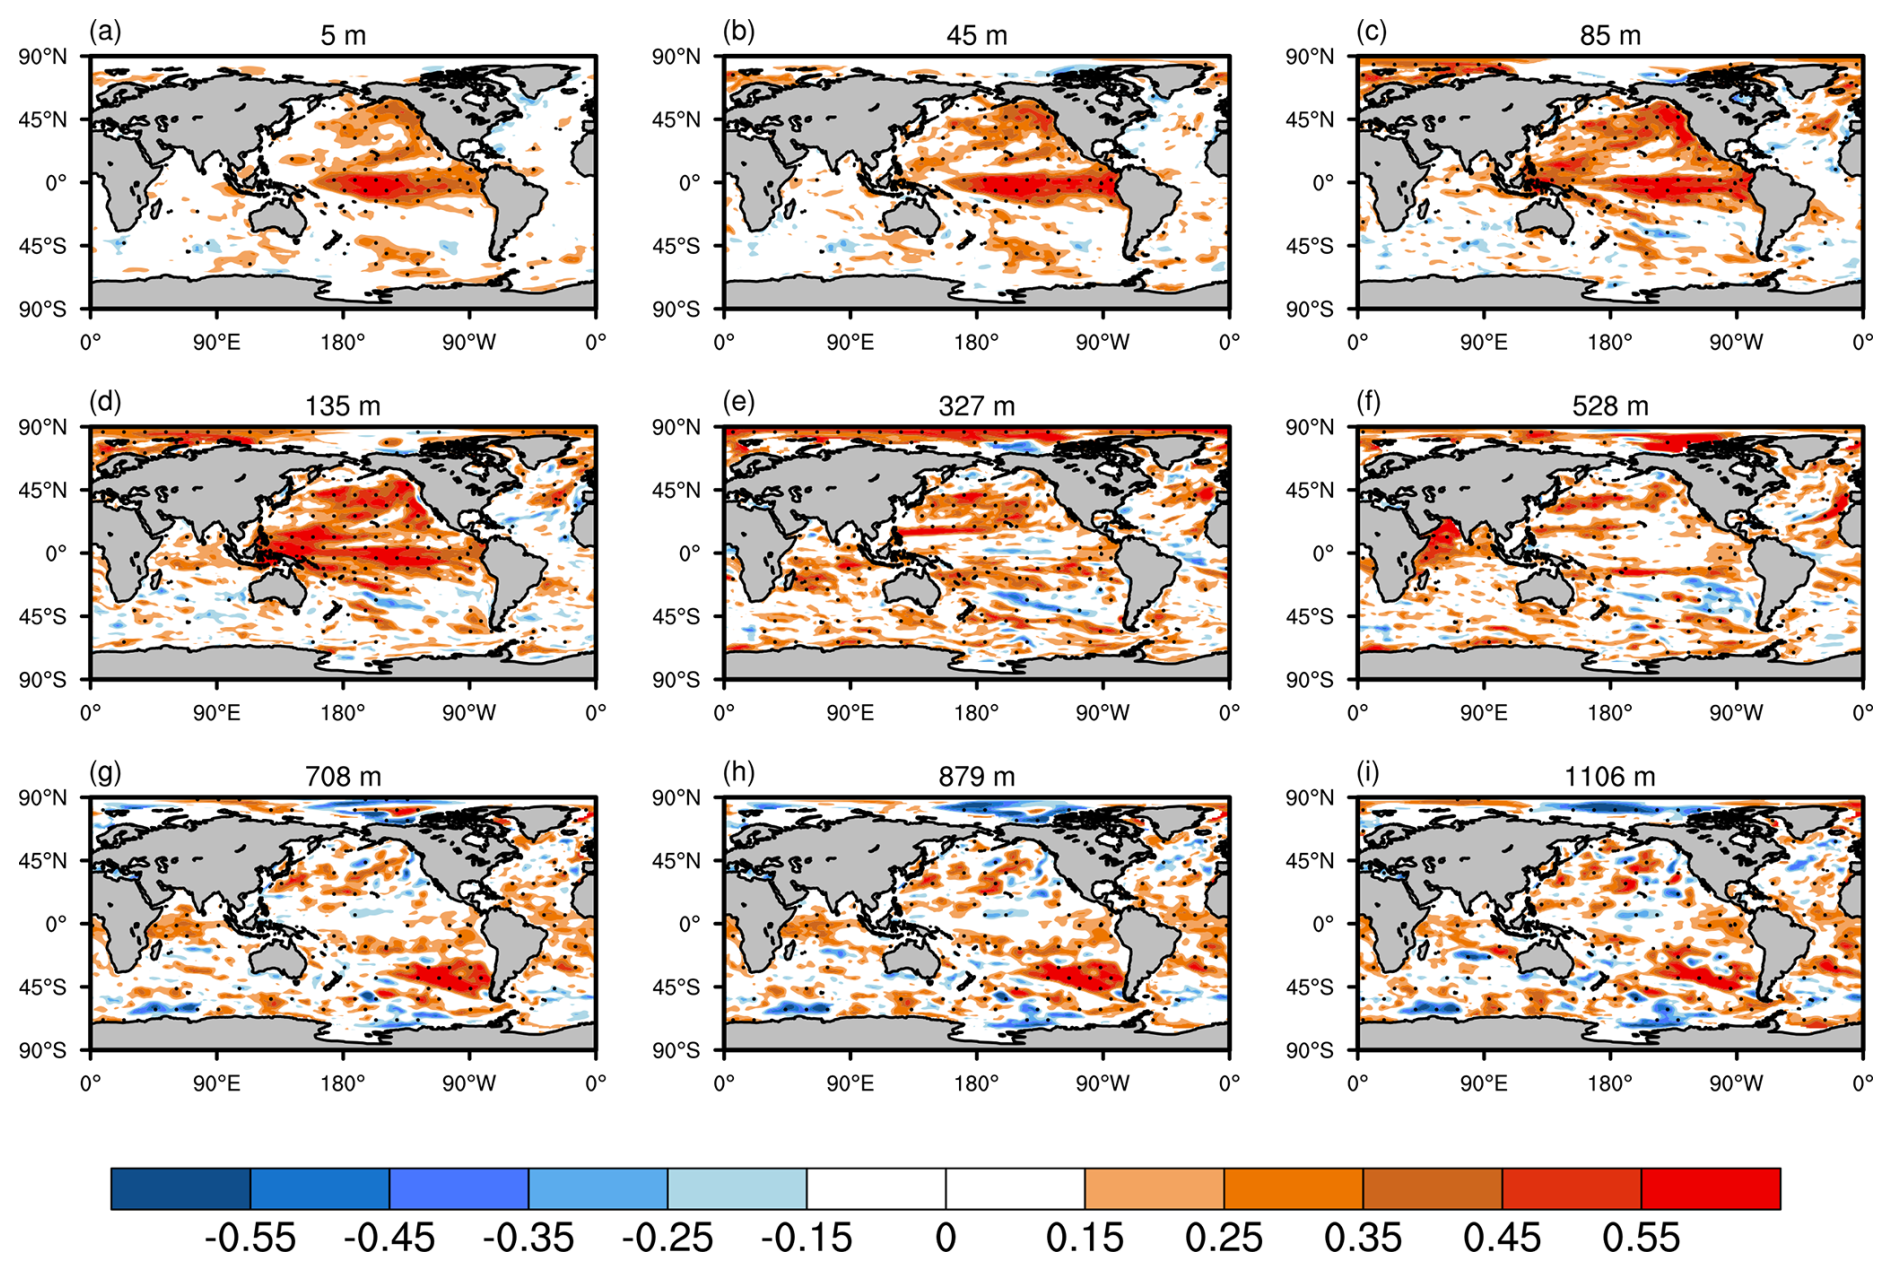
Figure 6Spatial patterns of the differences between ASSIM and CTRL for their correlations of ocean temperature with observations across nine ocean layers. Dotted regions indicate statistical significance at the 95 % confidence level. Panels (a) to (i) represent different ocean depths: (a) 5 m, (b) 45 m, (c) 85 m, (d) 135 m, (e) 327 m, (f) 528 m, (g) 708 m, (h) 879 m, and (i) 1106 m.
The RMSE differences for ocean salinity between ASSIM and CTRL across various ocean layers are presented in Fig. 5. The majority of ocean regions display notable improvements for ocean salinity after assimilation. In the upper ocean layers, significant enhancements are particularly evident in the north Pacific and parts of the north Atlantic. However, certain areas exhibit degradation in RMSE, particularly in parts of the south Pacific. In the deeper layers, the improvements are less extensive but remain evident in regions such as parts of the north Atlantic and north Pacific. However, RMSE degradation becomes notable in the equatorial Atlantic and parts of the Indian Ocean, highlighting the need for further improvements in these regions. The degradation in the deeper ocean layers can be attributed to two main factors: observational data limitations and challenges in representing deep-ocean processes in the model. For the EN4.2.1 reanalysis, the coverage and quality of observations tend to decrease with depth, potentially resulting in greater uncertainties in the deep ocean. This sparse observational coverage limits the constraints that assimilation can impose on the model state. Furthermore, in the E3SMv2 model, the complexity of simulating deep-ocean processes, such as vertical mixing and bottom water formation, may contribute to biases that are difficult to correct through assimilation.
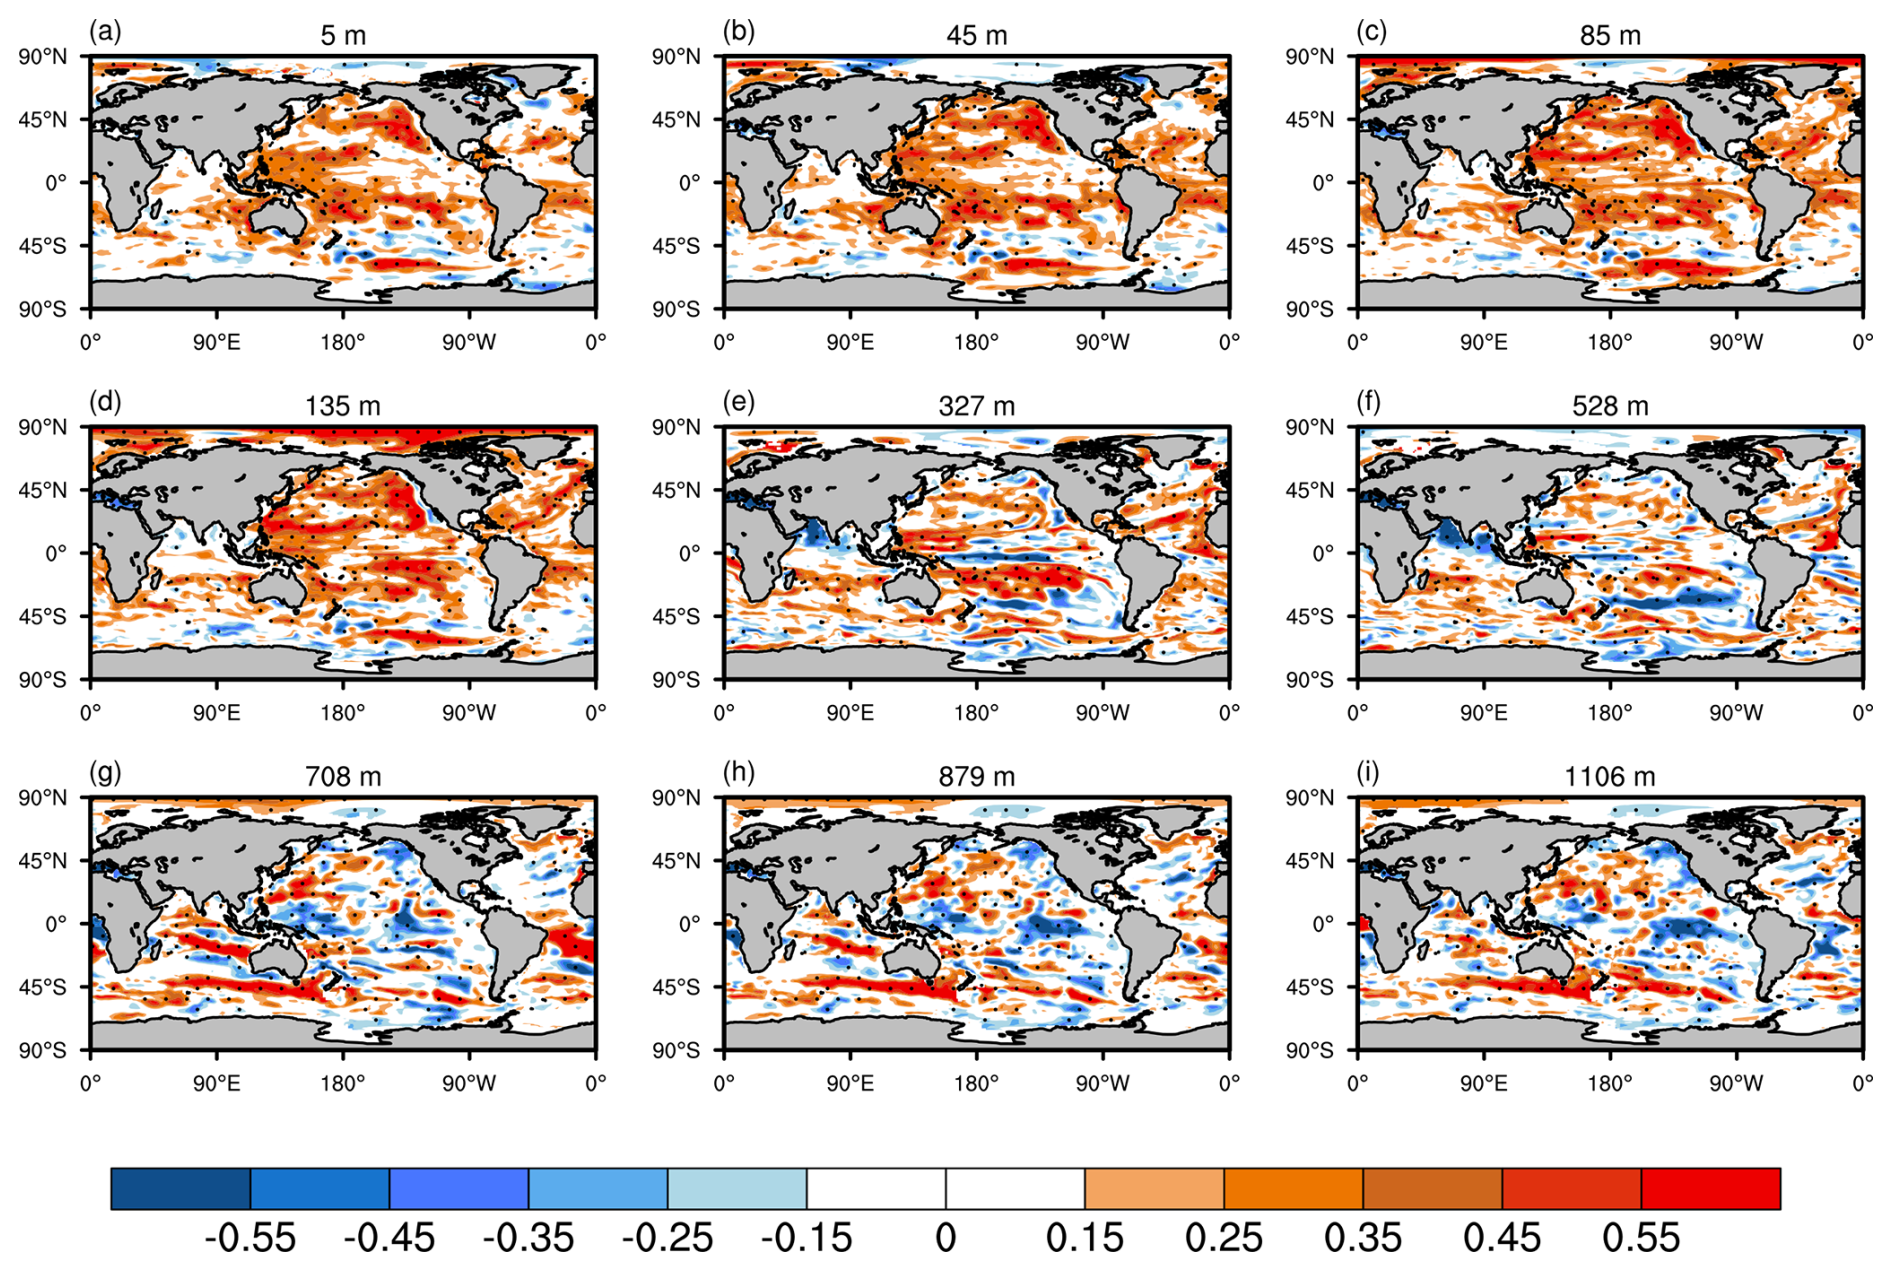
Figure 7Similar to Fig. 6 but for ocean salinity.
3.3 Performance of correlation differences
Figure 6 illustrates the differences between ASSIM and CTRL in their correlations with observed monthly ocean temperature from 1950 to 2021 across nine ocean layers. The seasonal cycle and linear trend have been removed before computing the correlations. Positive values denote an increase in correlation following assimilation, indicating improvements, whereas negative values suggest a decrease in correlation. In the upper ocean layers, the assimilation has led to improved correlations for ocean temperature across many ocean regions. Notably, the equatorial Pacific Ocean exhibits substantial improvements, indicating potential enhancements in modeling phenomena such as the El Niño–Southern Oscillation (ENSO). Further analysis of the winter Niño 3.4 index (Fig. A3) confirms that the assimilation improves the representation of ENSO variability, with the correlation coefficient increasing from 0.06 in CTRL to 0.79 in ASSIM. Moreover, parts of the north Pacific also exhibit noticeable improvements. In the deeper layers, improvements are observed in the western Pacific and parts of the Southern Ocean. However, certain areas exhibit diminished performance, possibly due to sparse observational coverage introducing higher uncertainty into the assimilation process or imbalances between ocean state variables during the assimilation (Edwards et al., 2015; He et al., 2020b). In summary, ASSIM has enhanced ocean temperature simulations by reducing RMSE (Fig. 4) and improving correlation (Fig. 6) across many ocean regions, with notable improvements in the upper ocean layers, including the equatorial Pacific and north Pacific.
The correlation differences for ocean salinity between ASSIM and CTRL across various ocean layers are depicted in Fig. 7. In the upper ocean layers, the majority of global ocean regions exhibit marked improvements for ocean salinity, with positive correlation differences dominating. Noteworthy improvements are evident in the tropical Pacific, north Pacific, and parts of the north Atlantic. In the deeper layers, the improvements in correlation become more localized, primarily concentrated in the western Pacific and parts of the Southern Ocean. Meanwhile, reductions in correlations are observed in parts of the equatorial Pacific and the south Atlantic, indicating the need for further improvements. Overall, ASSIM has improved simulations of ocean salinity by reducing RMSE (Fig. 5) and improving correlation (Fig. 7) in many ocean regions, with notable enhancements in the upper ocean layers, particularly in parts of the north Pacific and the western Pacific.
3.4 Vertical and temporal analysis of RMSE and bias for ocean temperature and salinity
Figure 8 presents the vertical profiles of the globally averaged RMSE of ocean temperature and salinity comparing ASSIM and CTRL. Negative values in the RMSE difference indicate a reduction in the global mean RMSE due to assimilation. For ocean temperature, the RMSE differences are relatively small but become more negative within the upper 85 m of the ocean. As the depth increases beyond 135 m, the RMSE differences become significantly negative, indicating a marked improvement in ocean temperature after assimilation. Unlike temperature, the salinity RMSE differences show substantial deviations in the upper 155 m of the ocean, indicating notable improvements. The RMSE differences gradually decrease as depth increases from 155 to 305 m, but a slight increase is observed between 305 and 1106 m. This suggests that the assimilation of salinity data has a more pronounced effect in the upper ocean than in deeper layers, possibly due to larger observational errors in these layers (Jacobs et al., 2021; Wang et al., 2015). The extended profiles in Fig. A4 indicate that below 1106 m, the RMSE differences between ASSIM and CTRL gradually decrease for both ocean temperature and salinity, suggesting the limited impact of assimilation in the deeper layers. In summary, these results emphasize the capability of the WCODA system to enhance the simulation accuracy for both ocean temperature and salinity.
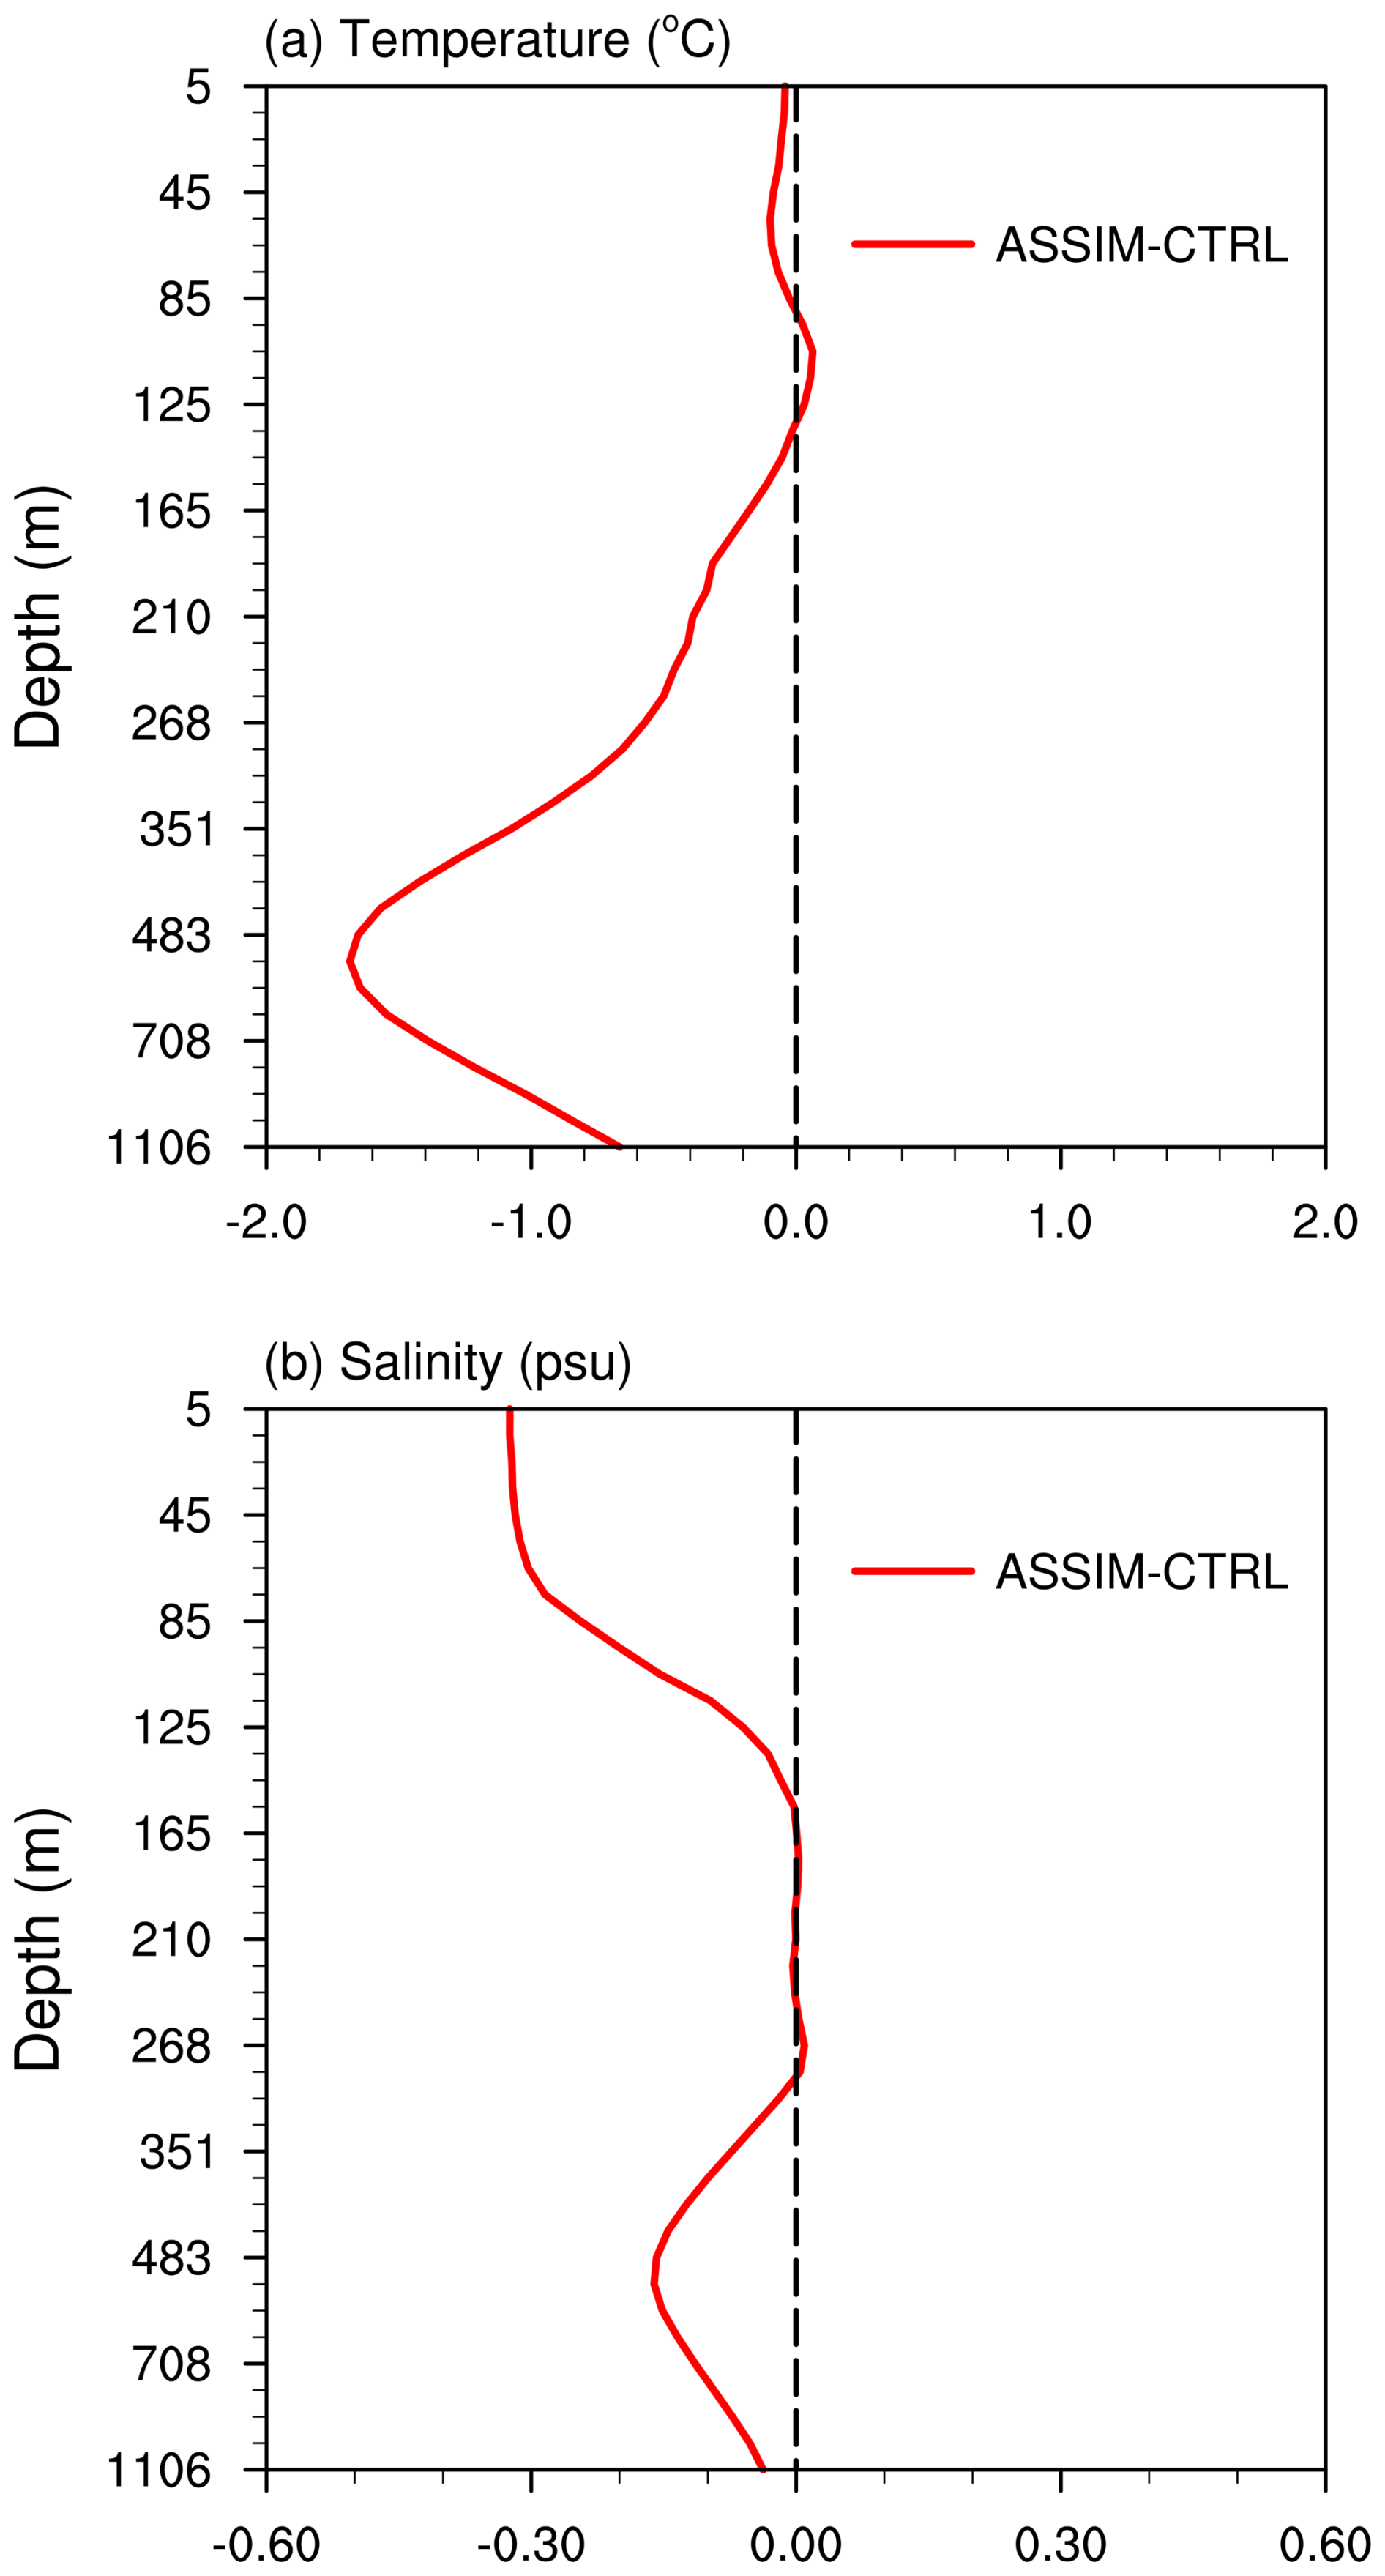
Figure 8Vertical profiles of the globally averaged RMSE differences between ASSIM and CTRL for (a) ocean temperature (in °C) and (b) ocean salinity (in psu) over the period from 1950 to 2021.
The temporal evolutions of the global mean bias and RMSE for vertically averaged ocean temperature and salinity in the top 1000 m are illustrated in Fig. 9. The temperature bias (Fig. 9a) in CTRL is persistently positive, indicating a systematic overestimation of ocean temperature. This overestimation in ocean temperature primarily originates from depths below 300 m (Figs. A5 and A6). In contrast, ASSIM consistently reduces this bias, with values approaching the zero line. Similarly, the temperature RMSE (Fig. 9b) highlights a significant decrease in RMSE for ASSIM compared to CTRL, reflecting a more accurate alignment with observed temperature. For ocean salinity, the salinity bias (Fig. 9c) reveals that CTRL maintains a consistent negative bias, suggesting an underestimation of ocean salinity. This salinity bias in CTRL is already prominent in the upper 300 m (Figs. A5 and A6). However, ASSIM effectively mitigates this bias, bringing the bias values closer to the zero line. Furthermore, the salinity RMSE (Fig. 9d) is notably lower in ASSIM than CTRL, indicating enhanced model performance and a closer match to observed salinity. Notably, it takes approximately 10–15 years for the biases in both temperature and salinity to stabilize near the zero line, reflecting an adjustment period where the assimilation system equilibrates. Overall, ASSIM exhibits superior performance relative to CTRL in reducing bias and RMSE for both ocean temperature and salinity.
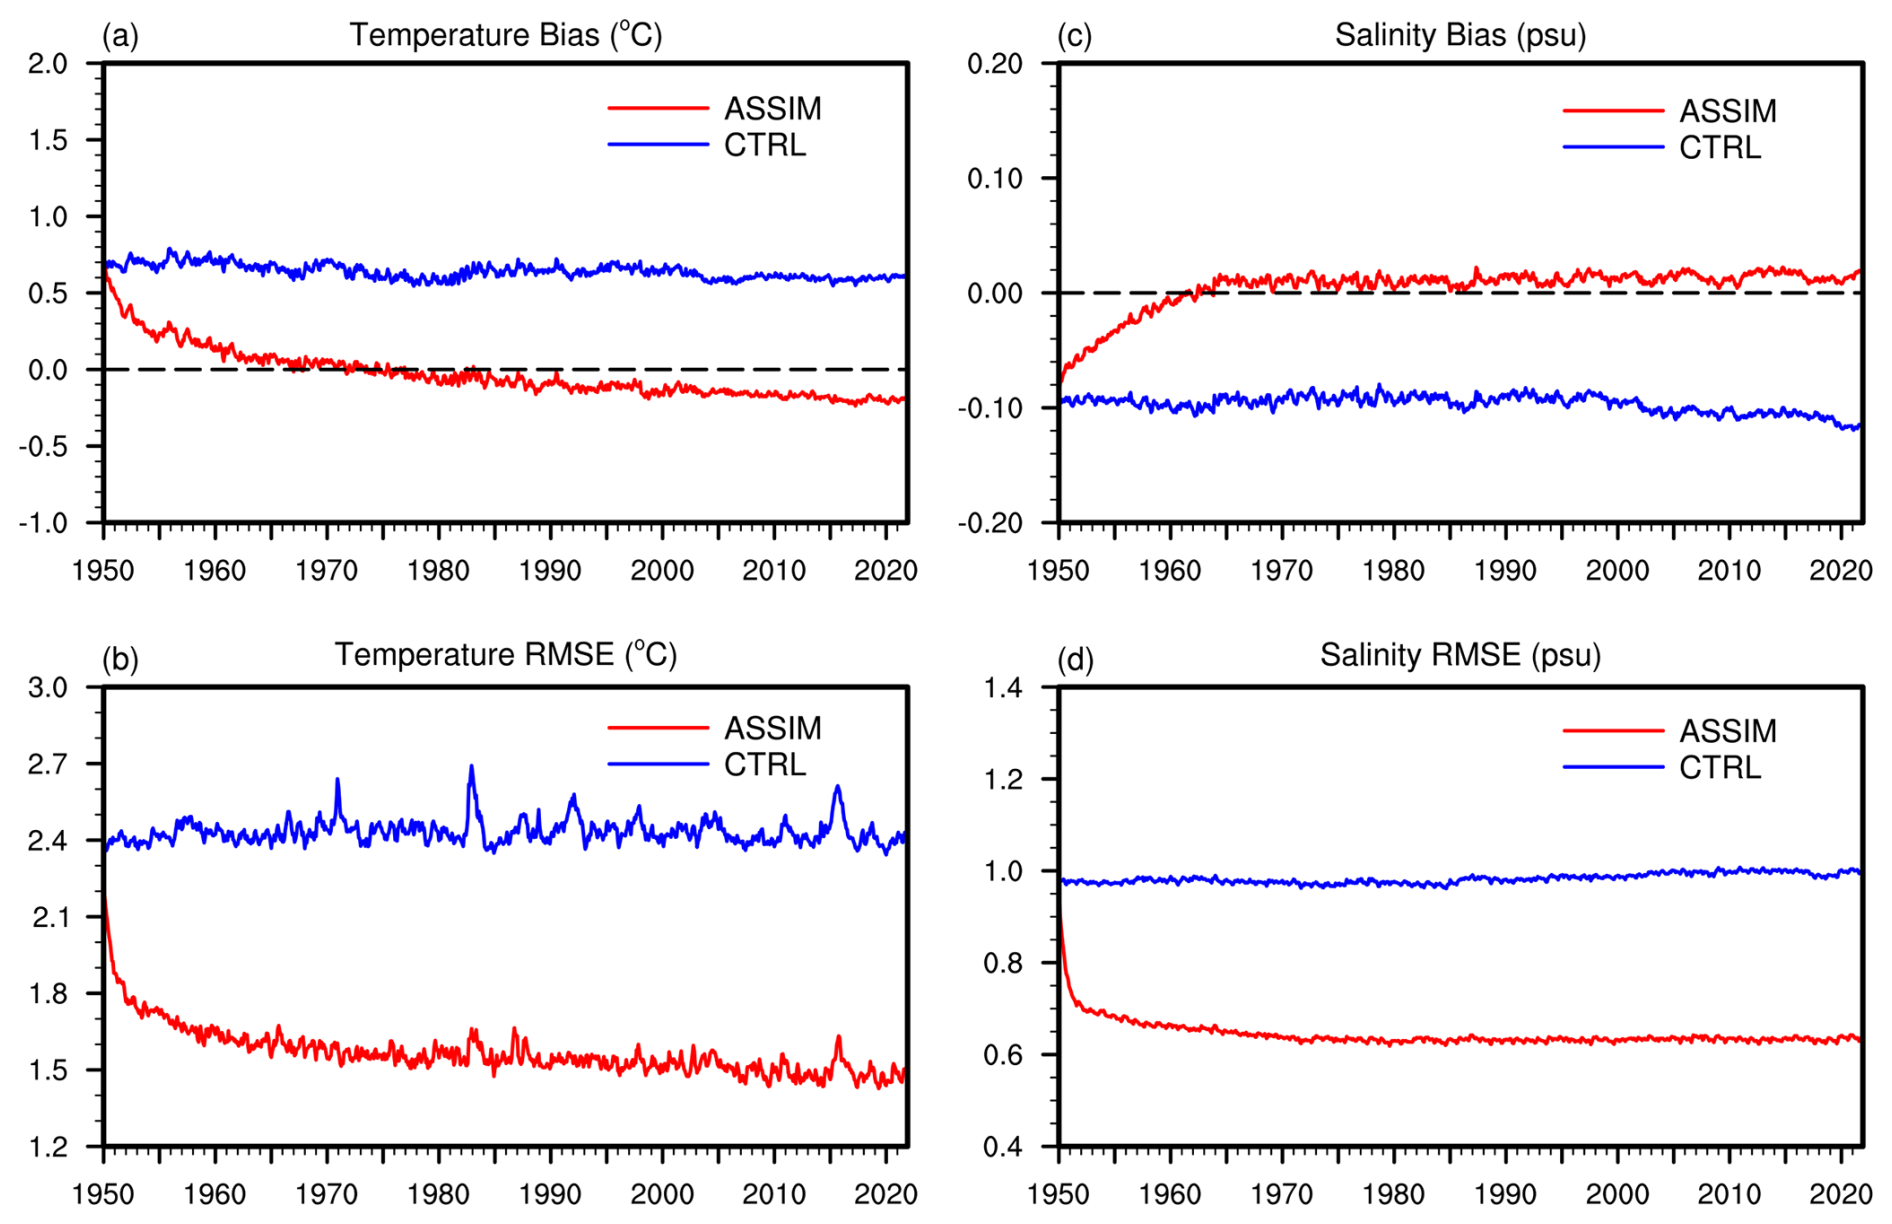
Figure 9Temporal variations in the global mean bias (a, c) and RMSE (b, d) for ocean temperature (in °C) and salinity (in psu) averaged over the upper 1000 m from 1950 to 2021. The red lines represent ASSIM, while the blue lines represent CTRL.
3.5 Climatological mean differences for sea surface temperature and salinity
Figure 10 presents the climatological mean differences between CTRL and observation, as well as between ASSIM and observation, for both sea surface temperature (SST) and salinity (SSS). Pronounced cold biases are evident in the SST difference between CTRL and observation (Fig. 10a), particularly in the tropical and north Pacific, north Atlantic, and parts of the Indian Ocean. Significant warm biases are observed in the Southern Ocean and parts of the south Atlantic. In contrast, these SST biases found in CTRL are substantially reduced by ASSIM (Fig. 10b), with cold biases in the north Pacific and north Atlantic diminished by approximately 1–2 °C and warm biases in the Southern Ocean corrected by about 1.5–2.5 °C. The SSS difference between CTRL and observation highlights a global pattern of salinity biases (Fig. 10c). The CTRL simulation generally underestimates salinity across most global oceans, indicating a widespread lower salinity. This fresh bias is particularly pronounced in the north Atlantic and north Pacific. Notably, in the Mediterranean Sea, CTRL exhibits a large positive salinity bias exceeding 2.5 psu. Compared with CTRL, ASSIM significantly reduces the overall fresh biases in CTRL (Fig. 10d). Notable improvements are observed in the north Atlantic and north Pacific, where salinity biases are reduced by approximately 0.5–1 psu, and in parts of the Southern Ocean, where reductions reach up to 1.5 psu. In summary, ASSIM demonstrates marked improvements in both SST and SSS biases compared to CTRL, emphasizing the importance and effectiveness of the WCODA system in enhancing model accuracy and reliability.
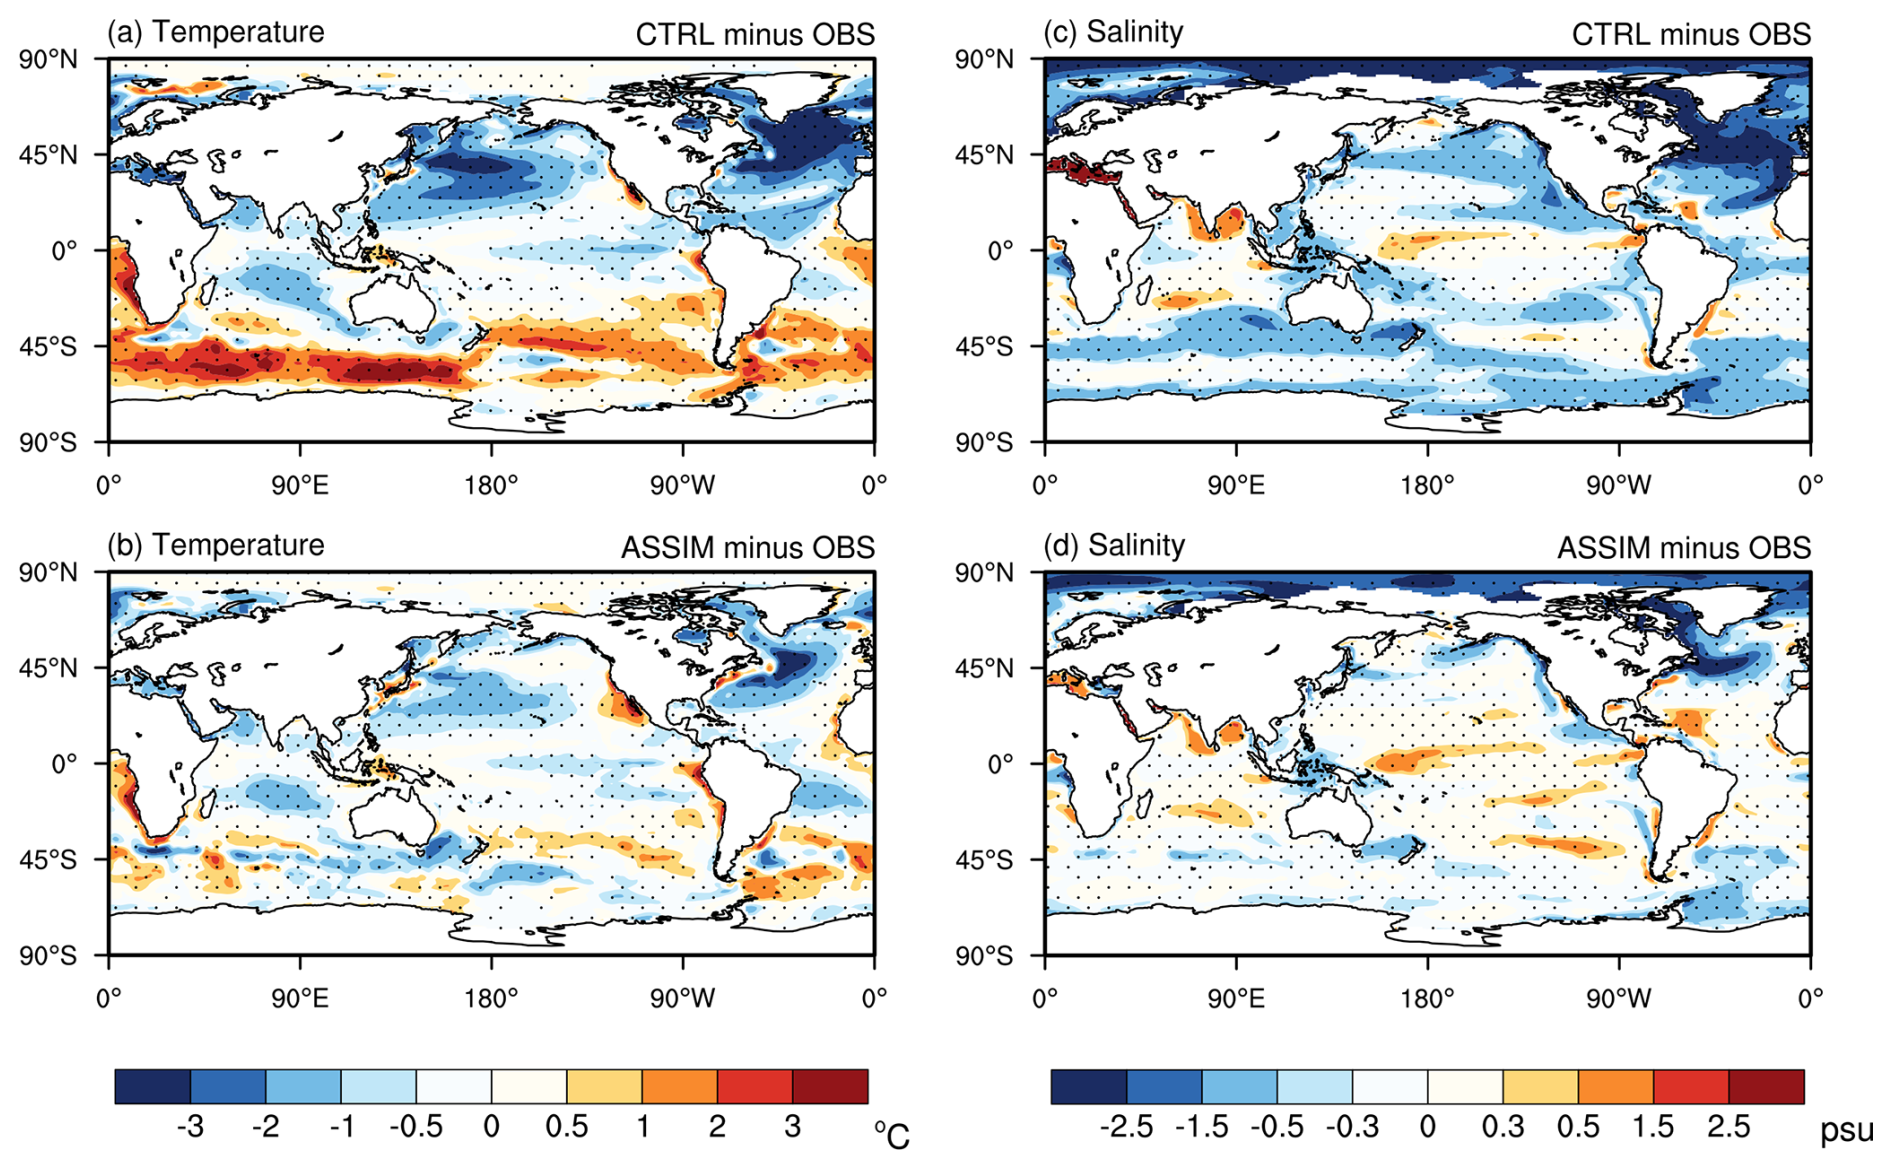
Figure 10Climatological mean differences in sea surface temperature (a, b; in °C) and salinity (c, d; in psu) from 1950 to 2021. Panels (a) and (c) show the differences between CTRL and observation, while (b) and (d) show the differences between ASSIM and observation. Dotted areas indicate regions where the differences are statistically significant at the 95 % confidence level.
This study documents the development and assessment of the new 4DEnVar-based WCODA system in the fully coupled E3SMv2 model, employing the DRP-4DVar method. The DRP-4DVar approach significantly reduces computational demands by replacing the traditional adjoint model with the ensemble technique. As a weakly coupled assimilation system, the WCODA system independently assimilates ocean reanalysis data within the ocean component during the analysis step. However, during the subsequent forecast step, the reanalysis information from the optimal ocean analyses is propagated to other components of the Earth system through interactions across multiple systems, thereby enhancing the coherence of ICs across different components of the climate model.
Monthly mean ocean temperature and salinity data from the EN4.2.1 reanalysis are integrated into the ocean component of E3SMv2 from 1950 to 2021, which can be used to provide realistic ICs for decadal climate predictions. The effectiveness of the WCODA system has been assessed using several metrics, including the reduction rate of the cost function, RMSE differences, correlation differences, and model biases. The reduction rate of the cost function consistently shows negative values in each month over the 72-year period, indicating successful assimilation of the EN4.2.1 reanalysis data into the climate model. Compared to CTRL, ASSIM achieves significant reductions in RMSE and enhancements in correlation in the upper ocean layers, with notable improvements observed in parts of the north Atlantic, north Pacific, and Indian Ocean. ASSIM substantially mitigates model biases for SST and SSS observed in CTRL, particularly reducing cold biases in the north Pacific and north Atlantic by approximately 1–2 °C, correcting warm biases in the Southern Ocean by about 1.5–2.5 °C and significantly increasing salinity estimates to reduce the model fresh biases by approximately 0.5–1 psu in the north Atlantic and north Pacific and up to 1.5 psu in parts of the Southern Ocean.
Despite these advancements, the WCODA system exhibits limitations in certain regions, particularly in the deeper layers of the southern Pacific Ocean and south Atlantic. The reliance on the EN4.2.1 product could pose limitations to the assimilation process due to the sparse salinity observations and potential for static instabilities in data-sparse regions. Reanalysis products such as ORAS5 and GLORYS provide promising alternatives for mitigating these limitations. Future efforts should explore incorporating these reanalysis products into the WCODA system to improve the assimilation performance in challenging areas. Furthermore, expanding the application of the WCODA system to other components of the climate model, such as the atmosphere and sea ice, could enhance overall predictive skill. These developments are essential for providing more accurate and reliable long-term climate predictions, ultimately aiding in the formulation of energy-sector policies and management strategies.
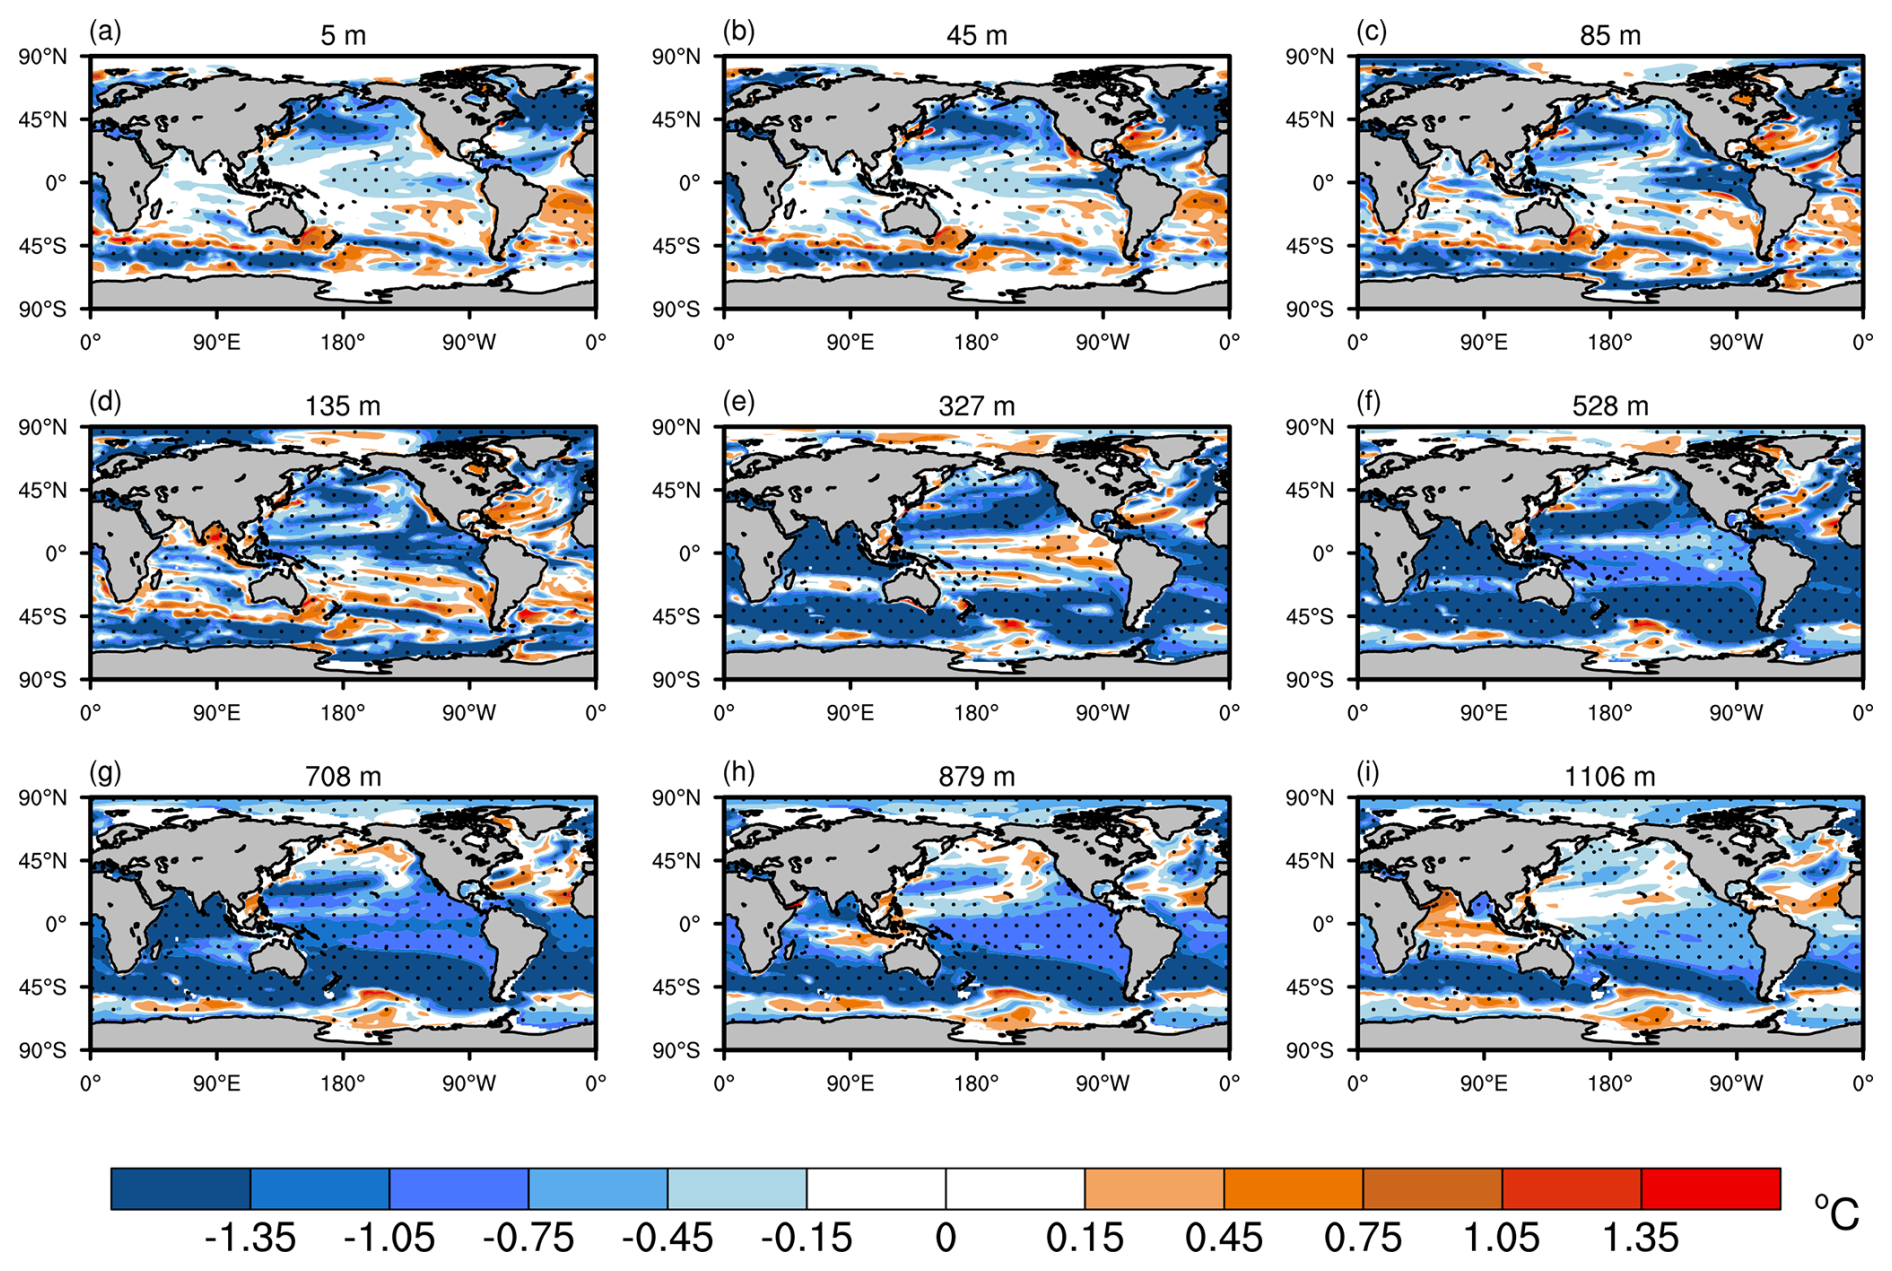
Figure A1Spatial patterns of RMSE differences between ASSIM and CTRL for ocean temperature (in °C) during summer. Results are presented for nine different ocean layers: (a) 5 m, (b) 45 m, (c) 85 m, (d) 135 m, (e) 327 m, (f) 528 m, (g) 708 m, (h) 879 m, and (i) 1106 m. Dotted areas represent statistical significance at the 95 % confidence level.
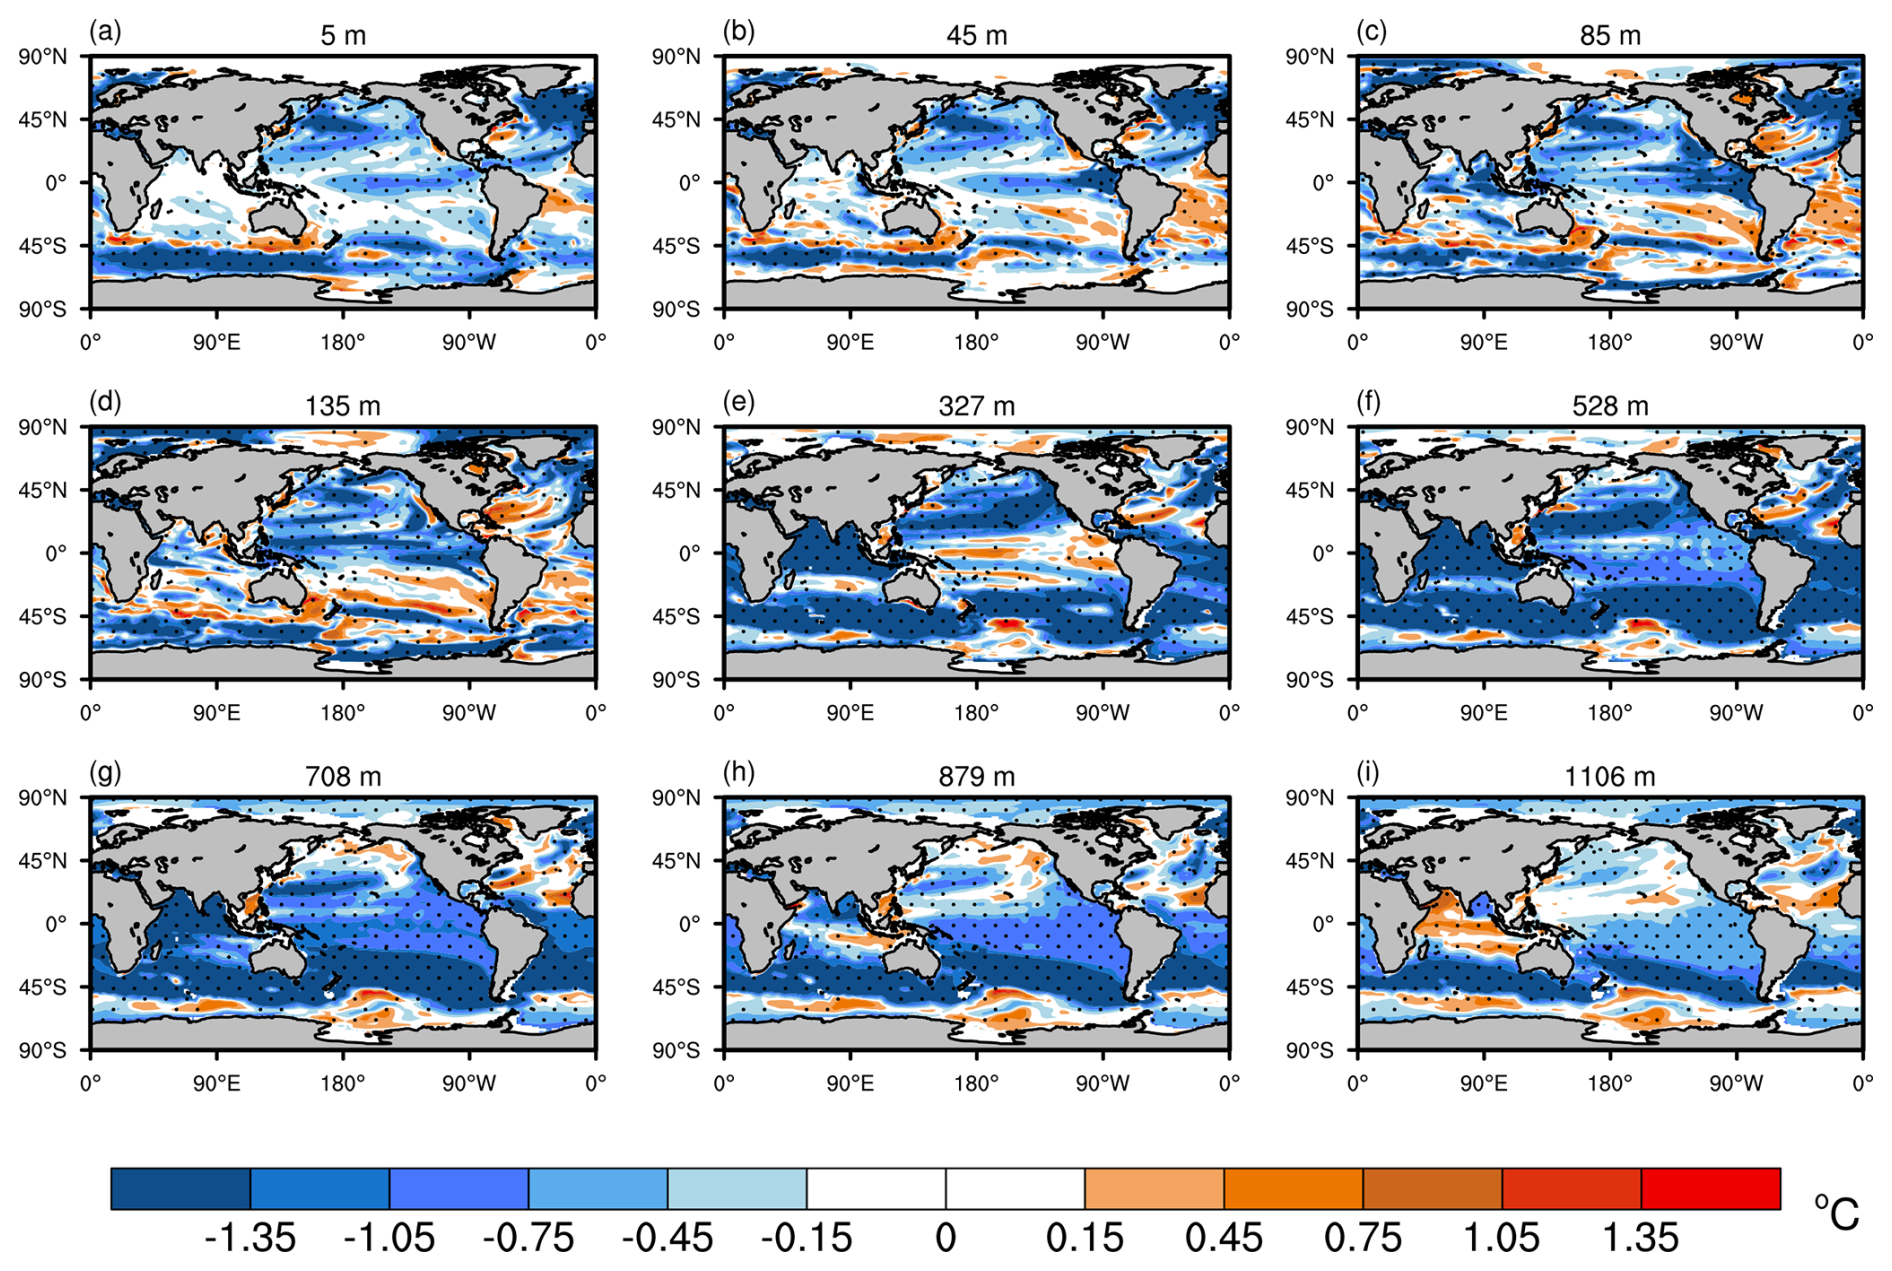
Figure A2Similar to Fig. A1 but during winter.
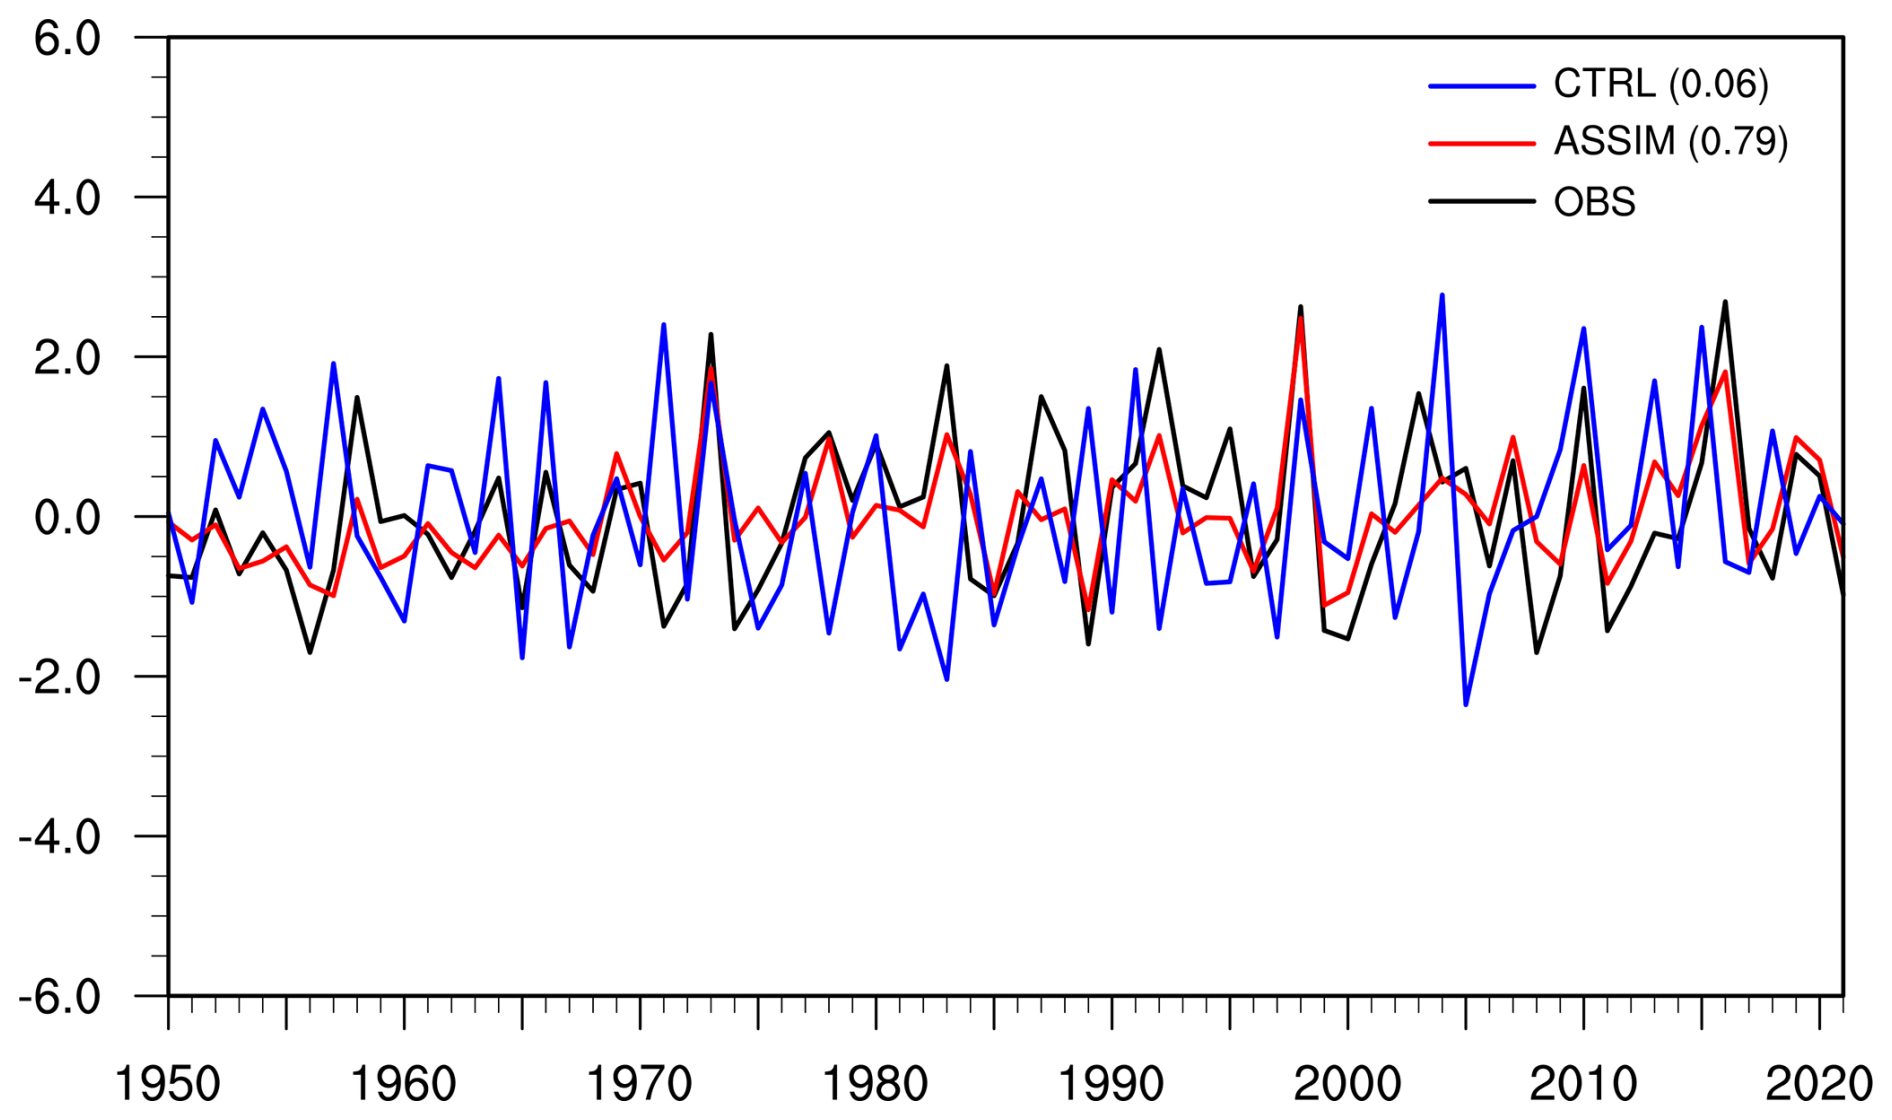
Figure A3Time series of the winter Niño 3.4 index from 1950 to 2021 for the observation (black line), ASSIM (red line), and CTRL (blue line). The correlation of the Niño 3.4 index with the observation in ASSIM and CTRL is also shown.
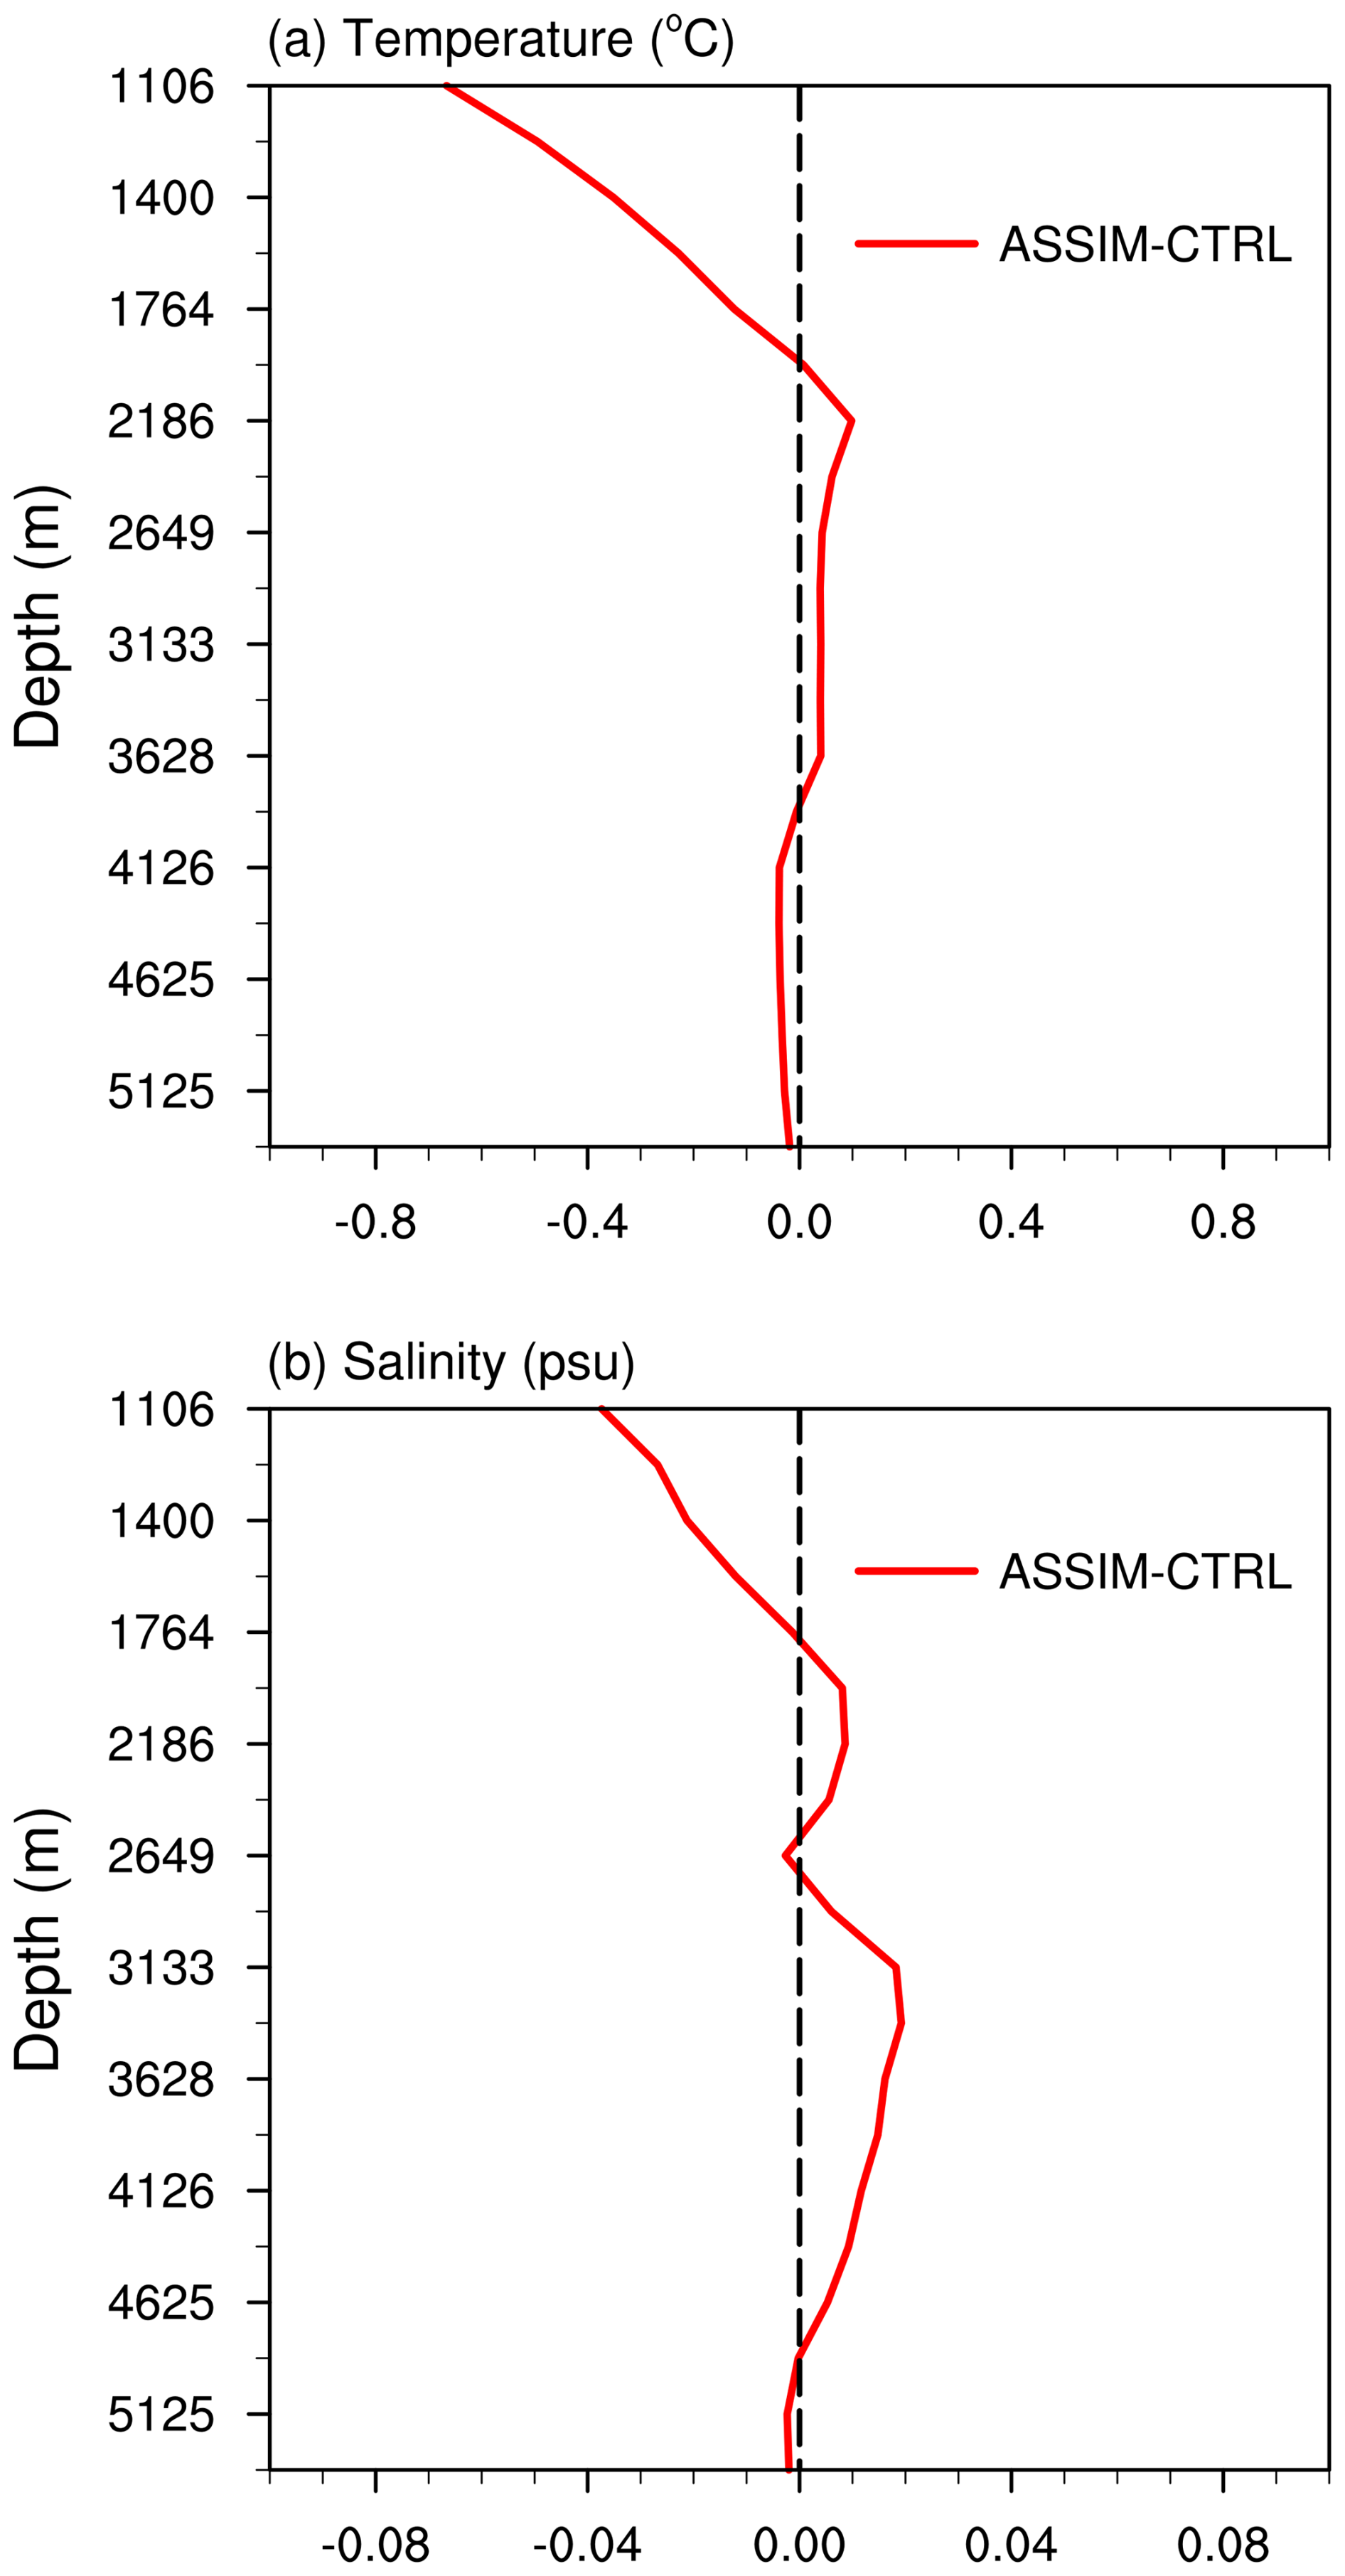
Figure A4Vertical profiles of the globally averaged RMSE differences between ASSIM and CTRL for (a) ocean temperature (in °C) and (b) ocean salinity (in psu) with depths from 1106 to 5375 m.
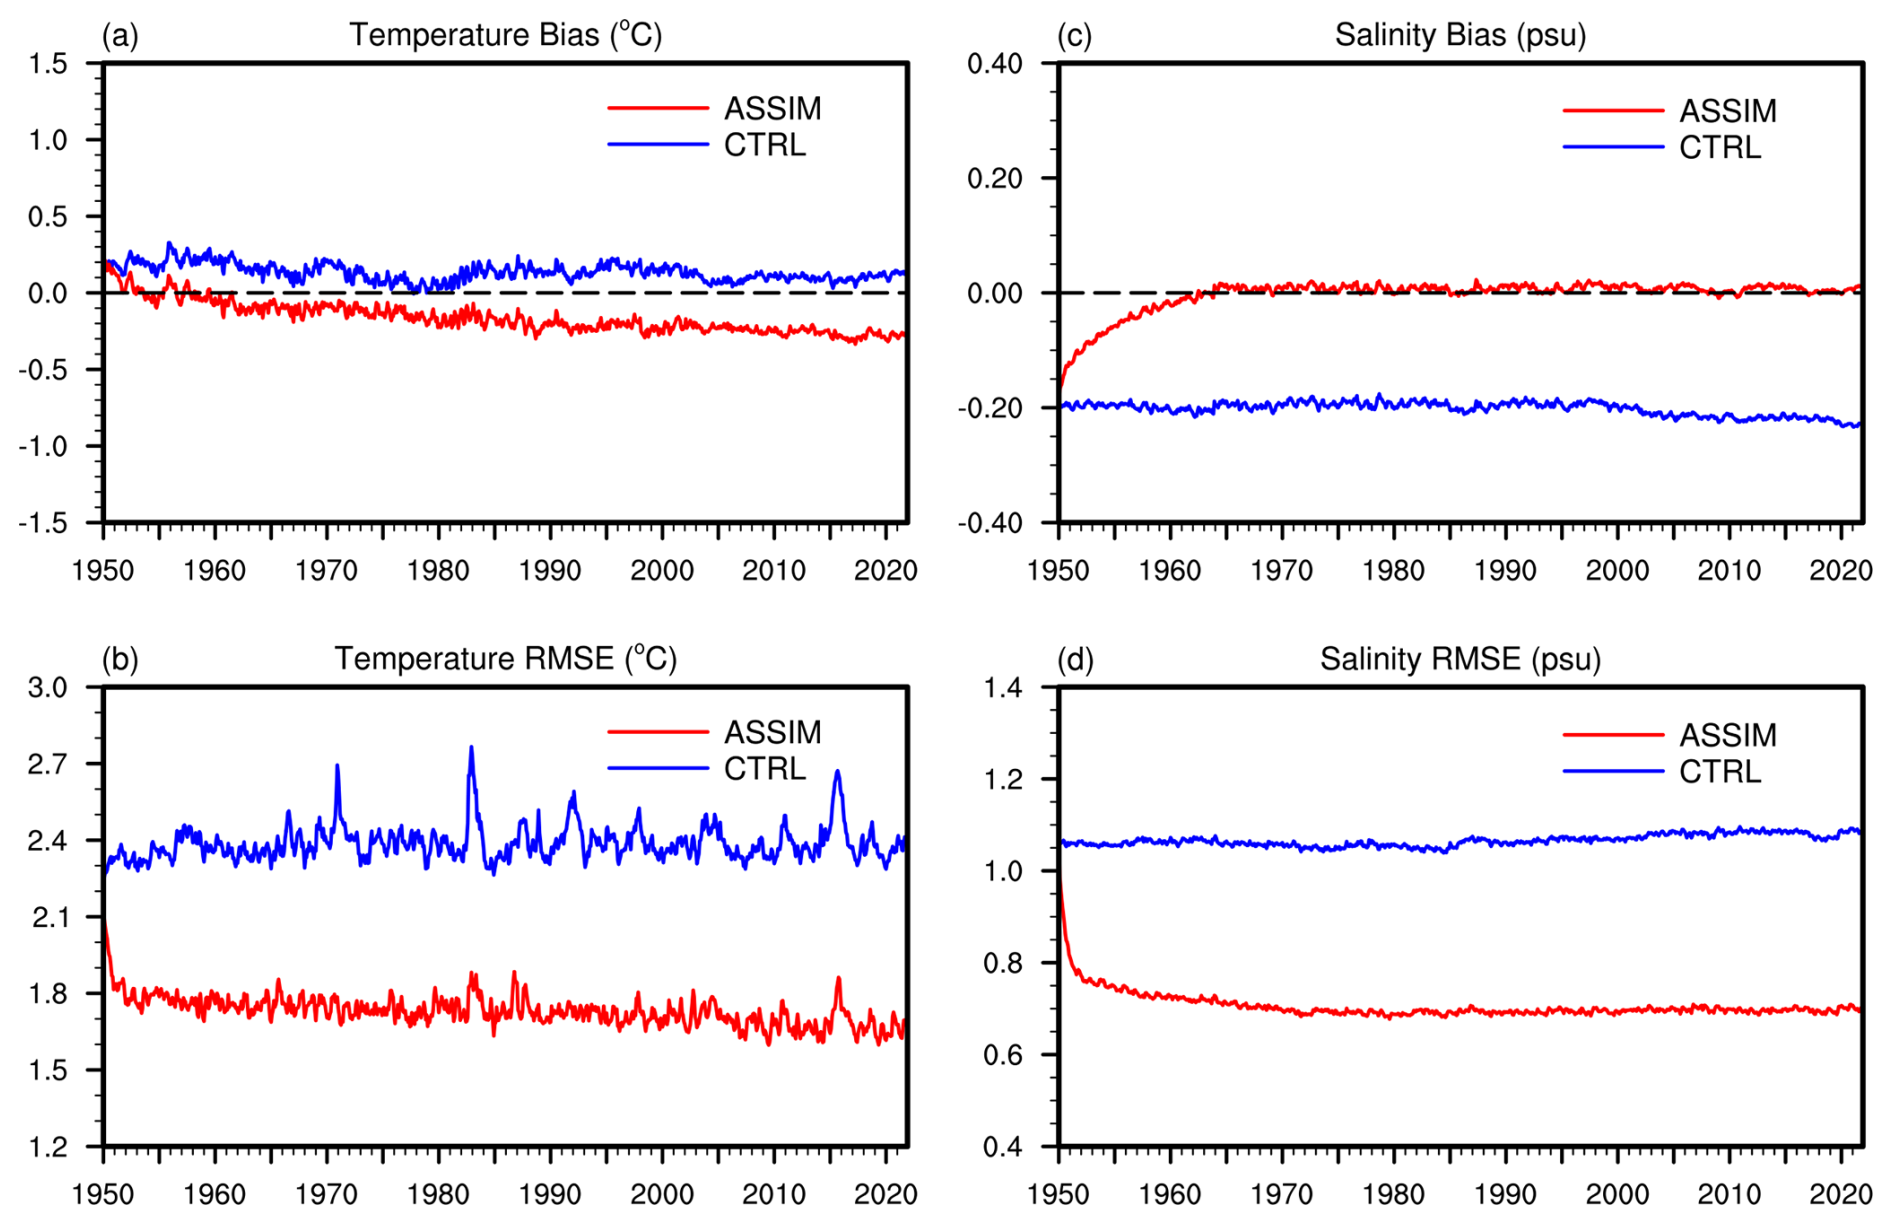
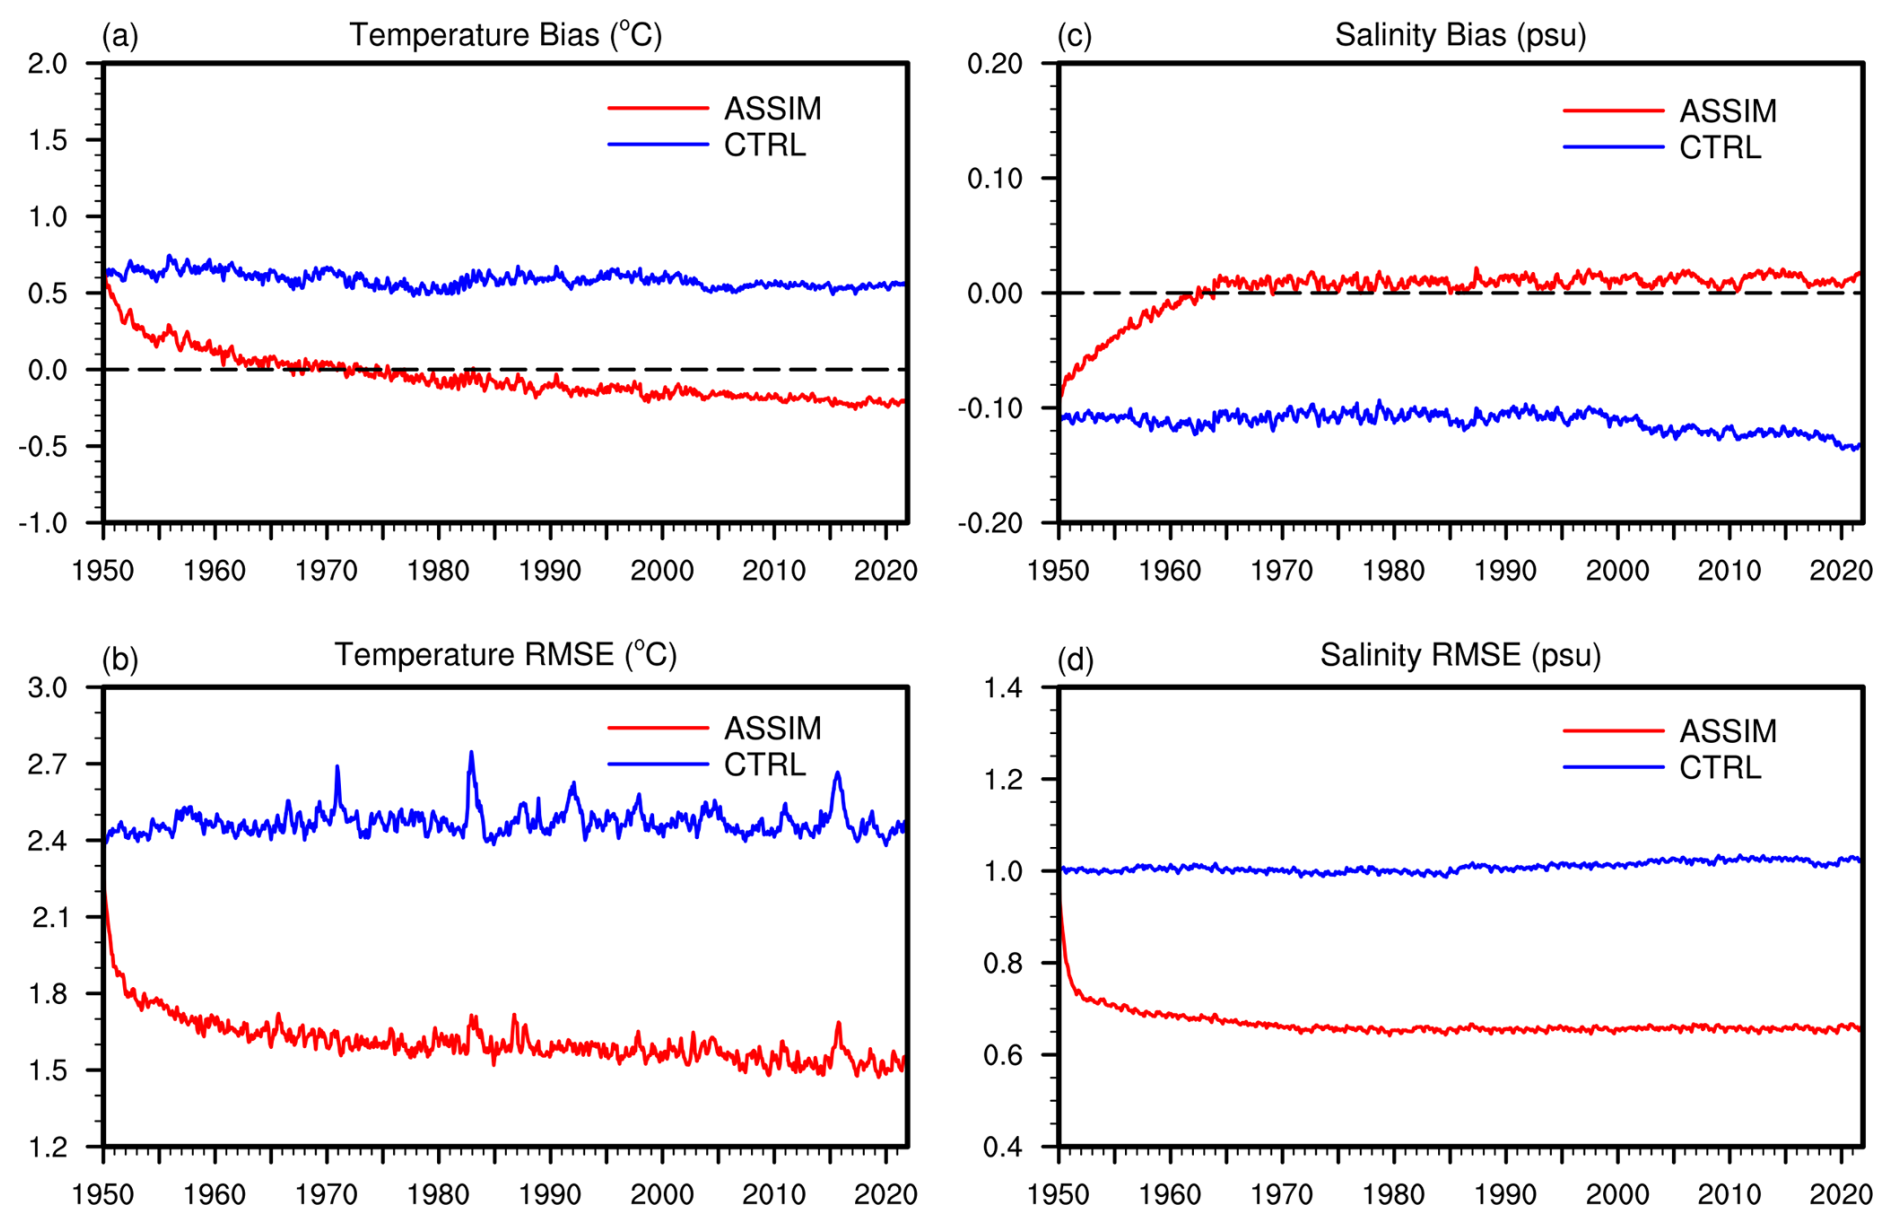
Figure A5Temporal variations in the global mean bias (a, c) and RMSE (b, d) for ocean temperature (in °C) and salinity (in psu) averaged over the upper 300 m. The red lines represent ASSIM, while the blue lines represent CTRL.
The E3SMv2 code is publicly available under an open-source license through the Zenodo repository at https://doi.org/10.5281/zenodo.13259801 (Shi, 2024a). The EN4.2.1 monthly ocean temperature and salinity data are provided by the Met Office Hadley Centre via https://www.metoffice.gov.uk/hadobs/en4/ (Good et al., 2013). The model data generated and analyzed during this study can be accessed on Zenodo at https://doi.org/10.5281/zenodo.13283117 (Shi, 2024b).
PS and LRL designed the experiments. PS developed the ocean assimilation code and conducted the experiments. BW proposed technical advice. PS and LRL analyzed the data. PS and LRL drafted the paper. All authors contributed to the revisions.
The contact author has declared that none of the authors has any competing interests.
Publisher’s note: Copernicus Publications remains neutral with regard to jurisdictional claims made in the text, published maps, institutional affiliations, or any other geographical representation in this paper. While Copernicus Publications makes every effort to include appropriate place names, the final responsibility lies with the authors.
This research was supported by the Office of Science, US Department of Energy Biological and Environmental Research, funded by the Regional and Global Model Analysis program area. This research used computing resources of the National Energy Research Scientific Computing Center, which is supported by the Office of Science of the US Department of Energy under contract no. DE-AC02-05CH1123, and BER Earth and Environmental System Modeling program's Compy computing cluster located at the Pacific Northwest National Laboratory. The Pacific Northwest National Laboratory is operated by Battelle Memorial Institute for the US Department of Energy under contract no. DE-AC05-76RL01830.
This research has been supported by the US Department of Energy Office of Science Biological and Environmental Research through the Water Cycle and Climate Extremes Modeling (WACCEM) scientific focus area supported by the Regional and Global Model Analysis program area.
This paper was edited by Cynthia Whaley and reviewed by two anonymous referees.
Balmaseda, M. A., Trenberth, K. E., and Källén, E.: Distinctive climate signals in reanalysis of global ocean heat content, Geophys. Res. Lett., 40, 1754–1759, https://doi.org/10.1002/grl.50382, 2013.
Branstator, G. and Teng, H.: Potential impact of initialization on decadal predictions as assessed for CMIP5 models, Geophys. Res. Lett., 39, L12703, https://doi.org/10.1029/2012GL051974, 2012.
Browne, P. A., De Rosnay, P., Zuo, H., Bennett, A., and Dawson, A.: Weakly coupled ocean–atmosphere data assimilation in the ECMWF NWP system, Remote Sensing, 11, 234, https://doi.org/10.3390/rs11030234, 2019.
Carrassi, A., Bocquet, M., Bertino, L., and Evensen, G.: Data assimilation in the geosciences: An overview of methods, issues, and perspectives, WIRES Clim. Change, 9, e535, https://doi.org/10.1002/wcc.535, 2018.
Chen, J., Liu, H., Bai, C., Yan, H., Lu, K., Bao, S., and Liu, K.: Identifying climate modes contributing to sea surface salinity decadal variation in the North Pacific Ocean, J. Geophys. Res.-Oceans, 125, e2019JC016011, https://doi.org/10.1029/2019JC016011, 2020.
Craig, A. P., Vertenstein, M., and Jacob, R.: A new flexible coupler for Earth system modeling developed for CCSM4 and CESM1, Int. J. High Perform. C., 26, 31–42, https://doi.org/10.1177/1094342011428141, 2012.
Dirmeyer, P. A., Halder, S., and Bombardi, R.: On the harvest of predictability from land states in a global forecast model, J. Geophys. Res.-Atmos., 123, 111–127, https://doi.org/10.1029/2018JD029103, 2018.
Edwards, C. A., Moore, A. M., Hoteit, I., and Cornuelle, B. D.: Regional ocean data assimilation, Annu. Rev. Mar. Sci., 7, 21–42, https://doi.org/10.1146/annurev-marine-010814-015821, 2015.
Eyring, V., Bony, S., Meehl, G. A., Senior, C. A., Stevens, B., Stouffer, R. J., and Taylor, K. E.: Overview of the Coupled Model Intercomparison Project Phase 6 (CMIP6) experimental design and organization, Geosci. Model Dev., 9, 1937–1958, https://doi.org/10.5194/gmd-9-1937-2016, 2016.
Golaz, J. C., Caldwell, P. M., Van Roekel, L. P., Petersen, M. R., Tang, Q., Wolfe, J. D., Abeshu, G., Anantharaj, V., Asay-Davis, X. S., Bader, D. C., Baldwin, S. A., Bisht, G., Bogenschutz, P. A., Branstetter, M., Brunke, M. A., Brus, S. R., Burrows, S. M., Cameron-Smith, P. J., Donahue, A. S., Deakin, M., Easter, R. C., Evans, K. J., Feng, Y., Flanner, M., Foucar, J. G., Fyke, J. G., Griffin, B. M., Hannay, C., Harrop, B. E., Hoffman, M. J., Hunke, E. C., Jacob, R. L., Jacobsen, D. W., Jeffery, N., Jones, P. W., Keen, N. D., Klein, S. A., Larson, V. E., Leung, L. R., Li, H. Y., Lin, W., Lipscomb, W. H., Ma, P. L., Mahajan, S., Maltrud, M. E., Mametjanov, A., McClean, J. L., McCoy, R. B., Neale, R. B., Price, S. F., Qian, Y., Rasch, P. J., Reeves Eyre, J. E. J., Riley, W. J., Ringler, T. D., Roberts, A. F., Roesler, E. L., Salinger, A. G., Shaheen, Z., Shi, X., Singh, B., Tang, J., Taylor, M. A., Thornton, P. E., Turner, A. K., Veneziani, M., Wan, H., Wang, H., Wang, S., Williams, D. N., Wolfram, P. J., Worley, P. H., Xie, S., Yang, Y., Yoon, J.-H., Zelinka, M. D., Zender, C. S., Zeng, X., Zhang, C., Zhang, K., Zhang, Y., Zheng, X., Zhou, T., and Zhu, Q.: The DOE E3SM Coupled Model Version 1: Overview and Evaluation at Standard Resolution, J. Adv. Model. Earth Sy., 11, 2089–2129, https://doi.org/10.1029/2018MS001603, 2019.
Golaz, J. C., Van Roekel, L. P., Zheng, X., Roberts, A. F., Wolfe, J. D., Lin, W. Y., Bradley, A. M., Tang, Q., Maltrud, M. E., Forsyth, R. M., Zhang, C. Z., Zhou, T., Zhang, K., Zender, C. S., Wu, M. X., Wang, H. L., Turner, A. K., Singh, B., Richter, J. H., Qin, Y., Petersen, M. R., Mametjanov, A., Ma, P., Larson, V. E., Krishna, J., Keen, N. D., Jeffery, N., Hunke, E. C., Hannah, W. M., Guba, O., Griffin, B. M., Feng, Y., Engwirda, D., Vittorio, A. V., Cheng, D., Conlon, L. M., Chen, C., Brunke, M. A., Bisht, G., Benedict, J. J., Asay-Davis, X. S., Zhang, Y. Y., Zhang, M., Zeng, X. B., Xie, S. C., Wolfram, P. J., Vo, T., Veneziani, M., Tesfa, T. K., Sreepathi, S., Salinger, A. G., Jack Reeves Eyre, J. E., Prather, M. J., Mahajan, S., Li, Q., Jones, P. W., Jacob, R. L., Huebler, G. W., Huang, X. L., Hillman, B. R., Harrop, B. E., Foucar, J. G., Fang, Y. L., Comeau, D. S., Caldwell, P. M., Bartoletti, T., Balaguru, K., Taylor, M. A., McCoy, R. B., Leung, L. R., and Bader, D. C.: The DOE E3SM Model version 2: Overview of the physical model and initial model evaluation, J. Adv. Model. Earth Sy., 14, e2022MS003156, https://doi. org/10.1029/2022MS003156, 2022.
Good, S. A., Martin, M. J., and Rayner, N. A.: EN4: Quality controlled ocean temperature and salinity profiles and monthly objective analyses with uncertainty estimates, J. Geophys. Res.-Oceans, 118, 6704–6716, https://doi.org/10.1002/2013JC009067, 2013 (data available at: https://www.metoffice.gov.uk/hadobs/en4/, last access: April 2025).
He, Y., Wang, B., Liu, M., Liu, L., Yu, Y., Liu, J., Li, R., Zhang, C., Xu, S., Huang, W., Liu, Q., Wang, Y., and Li, F.: Reduction of initial shock in decadal predictions using a new initialization strategy, Geophys. Res. Lett., 44, 8538–8547, https://doi.org/10.1002/2017GL074028, 2017.
He, Y., Wang, B., Huang, W., Xu, S., Wang, Y., Liu, L., Li, L., Liu, J., Yu, Y., Lin, Y., Huang, X., and Peng, Y.: A new DRP-4DVar-based coupled data assimilation system for decadal predictions using a fast online localization technique, Clim. Dynam., 54, 3541–3559, https://doi.org/10.1007/s00382-020-05190-w, 2020a.
He, Y., Wang, B., Liu, L., Huang, W., Xu, S., Liu, J., Wang, Y., Li, L., Huang, X., Peng, Y., Lin, Y., and Yu, Y.: A DRP-4DVar-based coupled data assimilation system with a simplified off-line localization technique for decadal predictions, J. Adv. Model. Earth Sy., 12, e2019MS001768, https://doi.org/10.1029/2019MS001768, 2020b.
Jacobs, G., D'Addezio, J. M., Ngodock, H., and Souopgui, I.: Observation and model resolution implications to ocean prediction, Ocean Model., 159, 101760, https://doi.org/10.1016/j.ocemod.2021.101760, 2021.
Laloyaux, P., Balmaseda, M., Dee, D., Mogensen, K., and Janssen, P.: A coupled data assimilation system for climate reanalysis, Q. J. Roy. Meteor. Soc., 142, 65–78, https://doi.org/10.1002/qj.2629, 2016.
Leung, L. R., Bader, D. C., Taylor, M. A., and McCoy, R. B.: An introduction to the E3SM special collection: Goals, science drivers, development, and analysis, J. Adv. Model. Earth Sy., 12, e2019MS001821, https://doi.org/10.1029/2019MS001821, 2020.
Li, F., Wang, B., He, Y., Huang, W., Xu, S., Liu, L., Liu, J. and Li, L.: Important role of North Atlantic air–sea coupling in the interannual predictability of summer precipitation over the eastern Tibetan Plateau, Clim. Dynam., 56, 1433–1448, https://doi.org/10.1007/s00382-020-05542-6, 2021.
Li, H. Y., Wigmosta, M. S., Wu, H., Huang, M., Ke, Y., Coleman, A. M., and Leung, L. R.: A physically based runoff routing model for land surface and Earth system models, J. Hydrometeorol., 14, 808–828, https://doi.org/10.1175/JHM-D-12-015.1, 2013.
Penny, S. G. and Hamill, T. M.: Coupled data assimilation for integrated earth system analysis and prediction, B. Am. Meteorol. Soc., 98, 169–172, https://doi.org/10.1175/BAMS-D-17-0036.1, 2017.
Pohlmann, H., Müller, W. A., Bittner, M., Hettrich, S., Modali, K., Pankatz, K., and Marotzke, J.: Realistic quasi-biennial oscillation variability in historical and decadal hindcast simulations using CMIP6 forcing, Geophys. Res. Lett., 46, 14118–14125, https://doi.org/10.1029/2019GL084878, 2019.
Polkova, I., Köhl, A., and Stammer, D.: Climate-mode initialization for decadal climate predictions, Clim. Dynam., 53, 7097–7111, https://doi.org/10.1007/s00382-019-04975-y, 2019.
Reckinger, S. M., Petersen, M. R., and Reckinger, S. J.: A study of overflow simulations using MPAS-Ocean: Vertical grids, resolution, and viscosity, Ocean Model., 96, 291–313, https://doi.org/10.1016/j.ocemod.2015.09.006, 2015.
Shi, P.: E3SMv2 source codes, Zenodo [code], https://doi.org/10.5281/zenodo.13259801, 2024a.
Shi, P.: Data for the analyses, Zenodo [data set], https://doi.org/10.5281/zenodo.13283117, 2024b.
Shi, P., Lu, H., Leung, L.R., He, Y., Wang, B., Yang, K., Yu, L., Liu, L., Huang, W., Xu, S., Liu, J., Huang, X., Li, L., and Lin, Y.: Significant land contributions to interannual predictability of East Asian summer monsoon rainfall, Earth's Future, 9, e2020EF001762, https://doi.org/10.1029/2020EF001762, 2021.
Shi, P., Wang, B., He, Y., Lu, H., Yang, K., Xu, S. M., Huang, W. Y., Liu, L., Liu, J. J., Li, L. J., and Wang, Y.: Contributions of weakly coupled data assimilation–based land initialization to interannual predictability of summer climate over Europe, J. Climate, 35, 517–535, https://doi.org/10.1175/JCLI-D-20-0506.1, 2022.
Shi, P., Leung, L. R., Wang, B., Zhang, K., Hagos, S. M., and Zhang, S.: The 4DEnVar-based weakly coupled land data assimilation system for E3SM version 2, Geosci. Model Dev., 17, 3025–3040, https://doi.org/10.5194/gmd-17-3025-2024, 2024.
Sluka, T. C., Penny, S. G., Kalnay, E., and Miyoshi, T.: Assimilating atmospheric observations into the ocean using strongly coupled ensemble data assimilation, Geophys. Res. Lett., 43, 752–759, https://doi.org/10.1002/2015GL067238, 2016.
Smith, P. J., Fowler, A. M., and Lawless, A. S.: Exploring strategies for coupled 4D-Var data assimilation using an idealised atmosphere–ocean model, Tellus A, 67, 27025, https://doi.org/10.3402/tellusa.v67.27025, 2015.
Sugiura, N., Awaji, T., Masuda, S., Mochizuki, T., Toyoda, T., Miyama, T., Igarashi, H., and Ishikawa, Y.: Development of a four-dimensional variational coupled data assimilation system for enhanced analysis and prediction of seasonal to interannual climate variations, J. Geophys. Res.-Oceans, 113, C10017, https://doi.org/10.1029/2008JC004741, 2008.
Tardif, R., Hakim, G. J., and Snyder, C.: Coupled atmosphere–ocean data assimilation experiments with a low-order climate model, Clim. Dynam., 43, 1631–1643, https://doi.org/10.1007/s00382-013-1989-0, 2014.
Taylor, M. A., Guba, O., Steyer, A., Ullrich, P. A., Hall, D. M., and Eldred, C.: An energy consistent discretization of the nonhydrostatic equations in primitive variables, J. Adv. Model. Earth Sy., 12, e2019MS001783, https://doi.org/10.1029/2019MS001783, 2020.
Tian, T., Yang, S., Karami, M. P., Massonnet, F., Kruschke, T., and Koenigk, T.: Benefits of sea ice initialization for the interannual-to-decadal climate prediction skill in the Arctic in EC-Earth3, Geosci. Model Dev., 14, 4283–4305, https://doi.org/10.5194/gmd-14-4283-2021, 2021.
Turner, A. K., Lipscomb, W. H., Hunke, E. C., Jacobsen, D. W., Jeffery, N., Engwirda, D., Ringler, T. D., and Wolfe, J. D.: MPAS-Seaice (v1.0.0): sea-ice dynamics on unstructured Voronoi meshes, Geosci. Model Dev., 15, 3721–3751, https://doi.org/10.5194/gmd-15-3721-2022, 2022.
Van Roekel, L., Adcroft, A., Danabasoglu, G., Griffies, S. M., Kauffman, B., Large, W., Levy, M., Reichl, B., Ringler, T., and Schmidt, M.: The KPP boundary layer scheme for the ocean: Revisiting its formulation and benchmarking one-dimensional simulations relative to LES, J. Adv. Model. Earth Sy., 10, 2647–2685, https://doi.org/10.1029/2018MS001336, 2018.
Wang, B., Liu, J., Wang, S., Cheng, W., Liu, J., Liu, C., Xiao, Q., and Kuo, Y. H.: An economical approach to four-dimensional variational data assimilation, Adv. Atmos. Sci., 27, 715–727, https://doi.org/10.1007/s00376-009-9122-3, 2010.
Wang, B., Liu, J., Liu, L., Xu, S., and Huang, W.: An approach to localization for ensemble-based data assimilation, PloS one, 13, e0191088, https://doi.org/10.1371/journal.pone.0191088, 2018.
Wang, T., Geyer, W. R., Engel, P., Jiang, W., and Feng, S.: Mechanisms of tidal oscillatory salt transport in a partially stratified estuary, J. Phys. Oceanogr., 45, 2773–2789, https://doi.org/10.1175/JPO-D-15-0031.1, 2015.
Wunsch, C. and Heimbach, P.: Practical global oceanic state estimation, Physica D, 230, 197–208, https://doi.org/10.1016/j.physd.2006.09.040, 2007.
Yao, J., Vitart, F., Balmaseda, M. A., Wu, T., and Liu, X.: The impact of coupled data assimilation on Madden–Julian Oscillation predictability initialized from coupled satellite-era reanalysis, Mon. Weather Rev., 149, 2897–2912, https://doi.org/10.1175/MWR-D-20-0360.1, 2021.
Yeager, S., Karspeck, A., Danabasoglu, G., Tribbia, J., and Teng, H.: A decadal prediction case study: Late twentieth-century North Atlantic Ocean heat content, J. Climate, 25, 5173–5189, https://doi.org/10.1175/JCLI-D-11-00595.1, 2012.
Yoshida, T. and Kalnay, E.: Correlation-cutoff method for covariance localization in strongly coupled data assimilation, Mon. Weather Rev., 146, 2881–2889, https://doi.org/10.1175/MWR-D-17-0365.1, 2018.
Zhang, M., Xie, S., Liu, X., Zhang, D., Lin, W., Zhang, K., Golaz, J. C., Zheng, X., and Zhang, Y.: Evaluating EAMv2 Simulated High Latitude Clouds Using ARM Measurements in the Northern and Southern Hemispheres, J. Geophys. Res.-Atmos., 128, e2022JD038364, https://doi.org/10.1029/2022JD038364, 2023.
Zhang, S., Harrison, M. J., Wittenberg, A. T., Rosati, A., Anderson, J. L., and Balaji, V.: Initialization of an ENSO forecast system using a parallelized ensemble filter, Mon. Weather Rev., 133, 3176–3201, https://doi.org/10.1175/MWR3024.1, 2005.
Zhang, S., Chang, Y. S., Yang, X., and Rosati, A.: Balanced and coherent climate estimation by combining data with a biased coupled model, J. Climate, 27, 1302–1314, https://doi.org/10.1175/JCLI-D-13-00260.1, 2014.
Zhang, S., Liu, Z., Zhang, X., Wu, X., Han, G., Zhao, Y., Yu, X., Liu, C., Liu, Y., Wu, S., Lu, F., Li, M., and Deng, X.: Coupled data assimilation and parameter estimation in coupled ocean–atmosphere models: a review, Clim. Dynam., 54, 5127–5144, https://doi.org/10.1007/s00382-020-05275-6, 2020.
Zhao, Y., Wang, B., and Liu, J.: A DRP–4DVar data assimilation scheme for typhoon initialization using sea level pressure data, Mon. Weather Rev., 140, 1191–1203, https://doi.org/10.1175/MWR-D-10-05030.1, 2012.
Zhou, W., Li, J., Yan, Z., Shen, Z., Wu, B., Wang, B., Zhang, R., and Li, Z.: Progress and future prospects of decadal prediction and data assimilation: a review, Atmospheric and Oceanic Science Letters, 17, 100441, https://doi.org/10.1016/j.aosl.2023.100441, 2024.
Zhu, S., Wang, B., Zhang, L., Liu, J., Liu, Y., Gong, J., Xu, S., Wang, Y., Huang, W., Liu, L., He, Y., and Wu, X.: A Four-Dimensional Ensemble-Variational (4DEnVar) Data Assimilation System Based on GRAPES-GFS: System Description and Primary Tests, J. Adv. Model. Earth Sy., 14, e2021MS002737, https://doi.org/10.1029/2021MS002737, 2022.