the Creative Commons Attribution 4.0 License.
the Creative Commons Attribution 4.0 License.
 | 23 Apr 2025
Graphical representation of global water models
Hannes Müller Schmied
Simon Newland Gosling
Marlo Garnsworthy
Laura Müller
Camelia-Eliza Telteu
Atiq Kainan Ahmed
Lauren Seaby Andersen
Julien Boulange
Peter Burek
Jinfeng Chang
He Chen
Lukas Gudmundsson
Manolis Grillakis
Luca Guillaumot
Naota Hanasaki
Aristeidis Koutroulis
Rohini Kumar
Guoyong Leng
Junguo Liu
Xingcai Liu
Inga Menke
Vimal Mishra
Yadu Pokhrel
Oldrich Rakovec
Luis Samaniego
Yusuke Satoh
Harsh Lovekumar Shah
Mikhail Smilovic
Tobias Stacke
Edwin Sutanudjaja
Wim Thiery
Athanasios Tsilimigkras
Yoshihide Wada
Niko Wanders
Tokuta Yokohata
Numerical models are simplified representations of the real world at a finite level of complexity. Global water models are used to simulate the terrestrial part of the global water cycle, and their outputs contribute to the evaluation of important natural and societal issues, including water availability, flood risk, and ecological functioning. Whilst global water modeling is an area of science that has developed over several decades, and individual model-specific descriptions exist for some models, there has to date been no attempt to visualize the ways that several models work, using a standardized visualization framework. Here, we address this gap by presenting a community-driven process that developed a framework to visualize several global water models. The models considered participate in the Inter-Sectoral Impact Model Intercomparison Project phase 2b (ISIMIP2b). The diagrams were co-produced between a graphics designer and 16 modeling teams, based on extensive discussions and pragmatic decision-making that balanced the need for accuracy and detail against the need for effective visualization. The model diagrams are based on a standardized ISIMIP2b-complete global water model that represents what is theoretically possible to represent in the current generation of state-of-the-art global water models participating in ISIMIP2b. Model-specific diagrams are then copies of the ISIMIP2b-complete model, with individual processes either included or grayed out. An open-source tool has been developed and published jointly with the diagrams, which allows someone to generate a diagram for their own global water model by adapting the diagrams presented here. As well as serving an educational purpose, we envisage that the diagrams will help researchers in and outside of the global water model community to select suitable model(s) for specific applications, stimulate a community learning process, and identify missing components to help direct future model developments.
- Article
(15145 KB) - Full-text XML
-
Supplement
(22670 KB) - BibTeX
- EndNote


Graphical visualizations, or more simply put, diagrams, are essential communication tools in science. They are helpful for researchers, in education, for management, and in policy-related processes (Linton, 2008; Abbott et al., 2019; Cardak, 2009; Fandel et al., 2018). Here, we focus on diagrams of the water cycle, as it is represented in a set of model approaches that simulate the terrestrial part of the water cycle. We call these models global water models according to Telteu et al. (2021) and use the term water cycle with focus on these models and the terrestrial part for the remaining paper. Global climate models that simulate the global water cycle including the oceans and the atmosphere are explicitly not the focus of this study. Linton (2014) showed that the development of water cycle diagrams is associated with an increasing awareness of the social dimensions of water. Some water cycle diagrams have received much attention in a scientific context, for example the visualization of the terrestrial water balance including model-based quantifications of global fluxes and storages by Oki and Kanae (2006). In an educational experiment, Cardak (2009) explored misconceptions in the understanding of the global water cycle by undergraduate students, from interviews and by specifically letting them draw the water cycle. Elsewhere, the co-creation of diagrams between environmental modelers, design creatives, and policy-makers has facilitated the generation of infographics and visuals that improve scientific understanding and better contextualize the degree of trust placed in modeling results. Examples of such efforts to balance academic integrity and detail alongside maintaining policy relevance are the IPCC reports and the EU Green Deal (European Commission, 2023).
There are no commonly accepted guidelines for designing a global water diagram, although best practices for scientific illustration of water cycle diagrams for dryland environments are discussed by Fandel et al. (2018). The design of global water diagrams has been criticized in the past, e.g., Abbott et al. (2019) who explored the water storages, fluxes, and processes incorporated in 464 water cycle diagrams and found that human interactions were not included in the majority (85 %) of the diagrams. In total, they found rather similar diagrams despite differences in the intended target audience and year of creation. The reviews mentioned earlier (Abbott et al., 2019; Linton, 2008; Fandel et al., 2018) also include several very popular diagrams of the global water cycle. Recently, and also as a reflection of the findings of Abbott et al. (2019), a new version of the USGS water cycle diagram has been published (Nell et al., 2023) that illustrates components of human interferences to the water cycle.
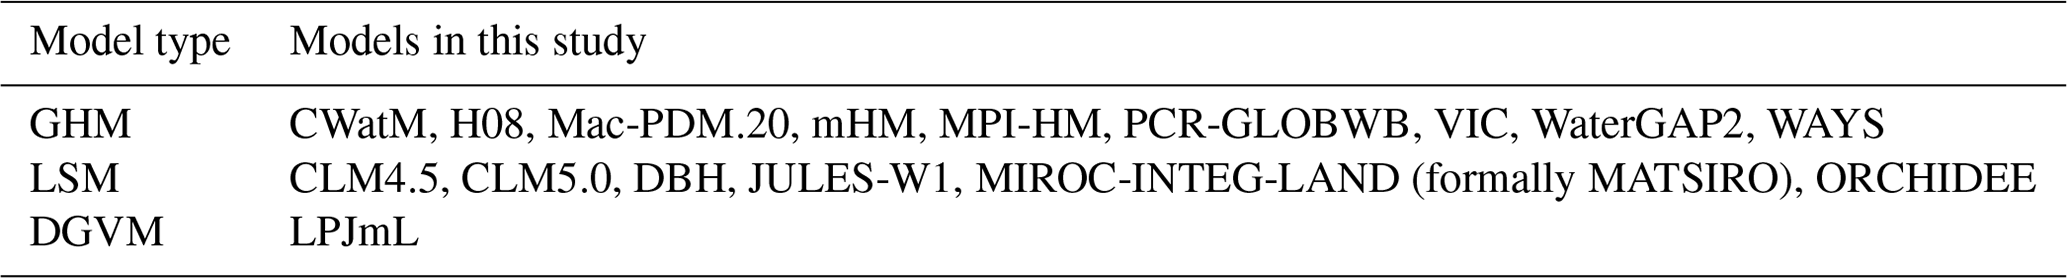
Table 1The three types of global water models that participated in this study: GHM, global hydrological model; LSM, land surface model; and DGVM, dynamic global vegetation model. For more details, the reader is referred to Telteu et al. (2021).
Abbott et al. (2019) classified the format of the diagrams into (a) three-dimensional, large-scale catchments; (b) two-dimensional small-scale hillslopes; (c) site-specific diagrams for certain aspects of a catchment and hillslopes; and (d) schematics that typically consist of boxes and arrows and are the most abstract representations. In the scientific community of global water modeling, it is nowadays common to publish model description papers alongside the output data. Typically, these descriptions also include a graphical representation of the model scheme, namely the water storages, fluxes, and processes included in the model. The format and approach differ largely, with the most popular approaches being three-dimensional diagrams (e.g. Hanasaki et al., 2018; Lawrence et al., 2019; Burek et al., 2020) and abstract illustrations with boxes and arrows (e.g. Stacke and Hagemann, 2021; Müller Schmied et al., 2021).
When it comes to model inter-comparison exercises, a typical goal is, next to comparing model outputs, the exploration of commonalities and differences between models (Haddeland et al., 2011). This understanding helps to explain why the model outputs differ. The global water sector in the Inter-Sectoral Impact Model Intercomparison Project (ISIMIP) consists of around 20 active global water models (Gosling et al., 2023b, a) that follow a specific modeling protocol to ensure a consistent cross-model assessment (Warszawski et al., 2014; Frieler et al., 2017, 2024).
The global water models participating in ISIMIP were developed from multiple backgrounds, and as such they contain different concepts and components. A common way of differentiating model types is to group them into land surface models (LSMs; relying on solving the terrestrial energy balance), global hydrological models (GHMs; often relying on solving the terrestrial water balance), dynamic global vegetation models (DGVMs; with a specific focus on functional plant development), and hybrids. Table 1 relates the models to each type. To avoid over-complication, we focus on the water balance, as it is addressed by all models, and we use the term “global water model” for all models that participated in this study. More details on the model backgrounds can be found in Telteu et al. (2021).
Telteu et al. (2021) reviewed the global water models that participated in the ISIMIP phase 2b, in terms of their components, to analyze which water storages and fluxes are included in the models. Furthermore, they developed a common notation for the equations of each model component, resulting in a compendium of model-specific equations. No visual depictions of the model components were shown though. Even though all the models follow basic hydrological principles, such as the conservation of mass, the individual calculation procedures and the relative complexities of the models differ (Telteu et al., 2021). This previous exercise was a community-driven effort, and the modeling groups were intensively involved, leading to a better understanding of each other's models inside the community. While the exercise served as a critical stepping stone for the global water model community, the wealth of information in Telteu et al. (2021) may be difficult to interpret for those unfamiliar with the specific equations and principles used in hydrology. This highlights the need for a visual depiction of different modeling components which can act as important additional information for model improvement, inter-model comparison, science communication, and education.
To this end, herein we present the efforts of the global water community within ISIMIP2b to describe the structure of the computational models in a common diagram scheme, whilst including some of the information from Telteu et al. (2021). The visualization of the models should support the following:
-
People outside of the global water model community should be familiarized with the features and concepts included in global water models. This could be lay audiences, university students learning about hydrology and/or modeling, or researchers.
-
Model developers should be supported in identifying missing model components, which could help to define areas for future model development.
-
Researchers should be supported, giving them the possibility to reflect on structural model uncertainty by visualizing the model structure including storages, processes, and fluxes, which builds the basis for assessing model output to generate a multi-model water budget considering this uncertainty.
-
Users of the ISIMIP model output data repository who want to conduct and communicate numerical assessments should be supported in selecting the most suitable models for their analyses. For example, users interested in specific components of the water cycle might select only those models that have a certain representation of these processes implemented. Thus, we envision that the diagrams will support users in selecting models appropriate for the intended purpose, both for historical periods and future projections.
-
End users, stakeholders, and decision-makers should be supported towards a better understanding of the benefits and limitations of specific models, in relation to the intended application of the models. For example, a model that is specifically designed as a vegetation model has benefits in simulating such processes but might have limitations in other areas, such as the representation of water management. A visualization could help identify those features quickly and build trust in results outside the modeling community.
The expected audience of our diagrams is relatively wide and comprises (a) model output users, (b) people who are new in the global water modeling community and want to learn about the existing models, (c) people in educational settings (in particular academic education), (d) policy-makers and civil society organizations, and (e) model developers seeking inspiration for improving their models.
The diagrams are aimed at a broad audience, so they are kept as simple as possible to assist with communication. To this end, the diagrams focus primarily on describing whether a process is included or not, or stating the number of layers in a specific storage, for example, rather than elaborating on the specifics of how that process is represented internally within the model. This means that the diagrams do not show the varying levels of complexity between models in representing any given process. For more detailed information about how each model represents each process, the reader is referred to Telteu et al. (2021).
The remaining paper is structured as follows. In Sect. 2 we describe the general methodology from the first idea to the finalization of the diagrams. The ISIMIP2b-complete model, as well as the individual model diagrams, is then shown in Sect. 3. A discussion about limitations and potential improvements, how the diagrams may be used, and an outlook, is in Sect. 4, followed by concluding remarks in Sect. 5.
2.1 ISIMIP and community-driven demand for a structural model intercomparison
In a project funded by the European Union (WATCH project under EU grant number 36946, runtime 2007–2011), the global water model community initiated a model intercomparison and hydrological assessment study. Based on this foundation, the global water sector in ISIMIP was formed and has been active since ISIMIP was started in 2012. There has been a wide range of studies focusing on model evaluation (e.g., Veldkamp et al., 2018; Zaherpour et al., 2018; Zhao et al., 2017; Masaki et al., 2017; Kumar et al., 2022; Gudmundsson et al., 2012a, b) and impact assessment (e.g., Gudmundsson et al., 2021; Reinecke et al., 2021; Prudhomme et al., 2014; Dankers et al., 2014; Schewe et al., 2014; Thompson et al., 2021; Gosling et al., 2017) but also considering other sectors like agriculture and health (e.g., Schewe et al., 2019; Thiery et al., 2021). The creation phase of such contributions, and specifically when trying to explain why model results differ, was hindered by the unavailability of a consistent and comparative model overview. This was the motivation for working collaboratively on an overview of the models participating in the global water sector of ISIMIP.
The entire process was a community effort. The overarching goals were to review the models through group discussions, identify the main hydrological components represented by each model, and to visualize each model's parameterization schemes in a consistent manner. The process to reach this goal was not predefined, nor subject of a funded, specific research project. As a result, this process was not accompanied by social scientists who could have provided a formal staged process and documented its diverse stages. The approach was therefore less formalized and ad hoc, driven by curiosity and a strong commitment to achieving the goal. In hindsight, the missing involvement of social scientists to document and guide the process was a missed opportunity. Nevertheless, a summary of the main activities and milestones is shown in Fig. 1, and a detailed history of the process is given in Table S1 in the Supplement. Later, we provide reflections and recommendations based on the lessons learned from the process, to assist other researchers with similar efforts in the future.
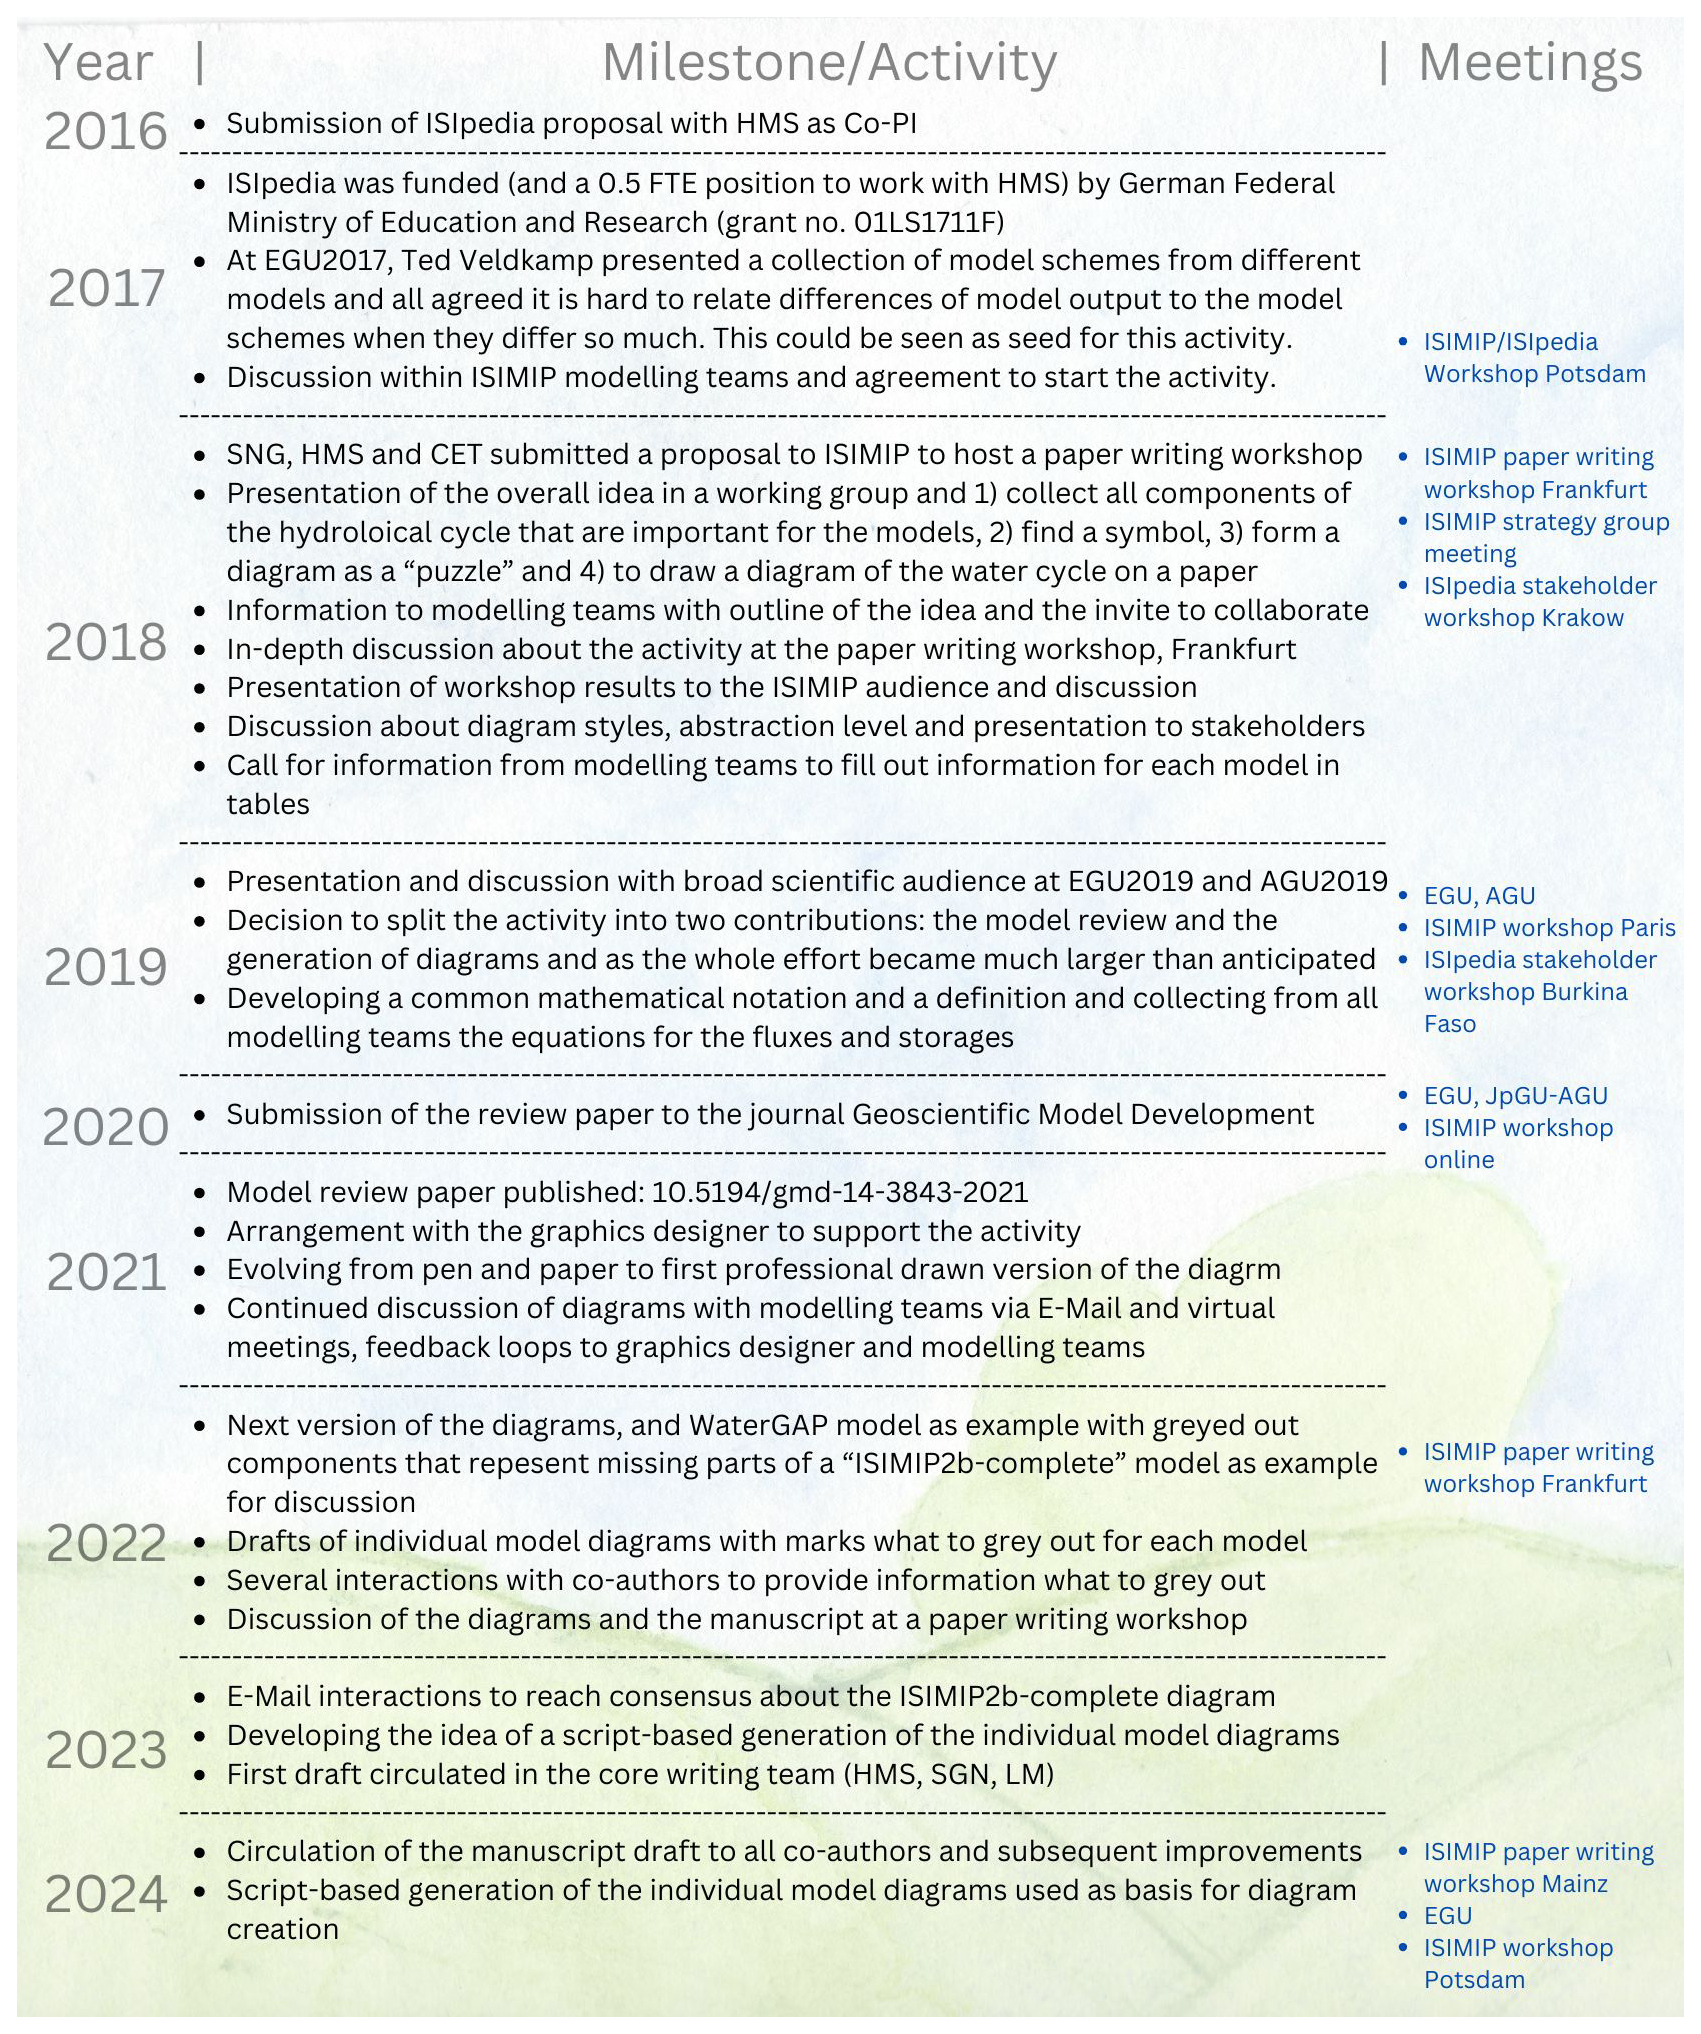
Figure 1Overview of the key milestones and meetings to discuss the progress to reach a community-based review of models including its graphical representation.
There have been diverse stages to draft the diagrams, and with Figs. S1–S8 in the Supplement we provide an insight into a selection of these diagrams to highlight their development. Finally, we decided to generate a three-dimensional diagram of the water cycle that also shows the vertical water balance in a second diagram. The motivation for this separation was to first provide an overview of the individual model's representation of the water cycle but then also to focus on a more detailed level of the vertical water balance.
2.2 From initial drafts to a final diagram
The initial stage was to collect the components (fluxes, storages) of the water cycle that should be displayed in a diagram of the hydrological cycle, as represented by a model participating in ISIMIP2b. We began compiling a list of fluxes in each storage compartment (e.g., soil, snow, canopy), which formed the basis for the visualization of the model diagrams. We then searched the internet for graphical representations of each of the components, printed them out, and created a diagram as a puzzle of the single components. Furthermore, in a group exercise, we asked the members of the hydrology working group at Goethe University Frankfurt, Germany, to sketch a diagram of the water cycle that included the list of fluxes we had identified with pen and paper (Fig. S1 for one example). Based on the pen-and-paper exercise, a first draft of a diagram (Fig. S2) was sent to the modeling teams. In an international paper-writing workshop during the summer of 2018 in Frankfurt am Main, Germany, initial ideas were discussed for conducting a thorough review of the global water models participating in ISIMIP phase 2b, the current active phase of ISIMIP at that time. The main outcome of this workshop was the commitment to review the models in terms of how they represent the water cycle as well as to create diagrams in a consistent way. We discussed how such diagrams should be drawn and what they should include. These discussions led to the realization that a realistic visual representation could be difficult to achieve, owing to the complexity of the water cycle and the models. To this end we attempted to present the components of each model in an abstract schematic (Fig. S3). However, it turned out that visualization on such an abstract level was not attractive for both the modelers involved and the audience (potential users) at the ISIMIP Strategy Group Meeting in Potsdam in the same year. We therefore agreed to work towards developing a more realistic visualization scheme but kept in mind that it might be necessary to include a degree of abstraction in the diagrams.
The next important step was to present the next iteration of the drawings at two ISIpedia stakeholder workshops (Table S4). Attendees were national policy-makers, in civil society organizations, international organizations, consultancies, companies, and academic institutions. The first workshop was held in 2018 in Kraków, Poland, bringing together 21 participants from 11 countries, mostly from eastern Europe. The participants were shown three types of diagrams (Figs. S2, S4, and S5). Feedback from the on-site workshop and an email survey indicated that a conceptual “block” model diagram with mathematical symbols (Fig. S5) was hard to understand and that a more realistic visualization with words instead of equations would make the diagrams easier to interpret.
The second ISIpedia stakeholder workshop took place in 2019 in Ouagadougou, Burkina Faso, with 41 participants from 16 countries, mostly from West Africa, with small delegations from East and Southern Africa. There, we reflected on the feedback of the first workshop and developed a new diagram (Fig. S6). We also distributed a survey in English and French at the workshop.
Scientific conferences such as the general assemblies of the European Geoscience Union (EGU) and the American Geophysical Union (AGU) were welcome opportunities to discuss the development of the diagrams (Telteu et al., 2019a, b) with a broad scientific audience. Further avenues for discussion have been the ISIMIP workshops that take place annually in different formats. In these discussions, we sought input on the level of detail to include in the diagrams. Whereas discussants with a more scientific view suggested adding more details to reflect the complexity of the water cycle, stakeholders in the two ISIpedia workshops expressed the wish for a simplified representation and felt overwhelmed by too much complexity. Also, we discussed avoiding some of the classical misconceptions, e.g., to draw the aquifer as a sub-surface lake or river (Fandel et al., 2018).
Finding a common basis for such a model diagram and agreeing on the level of detail of the hydrological storages and fluxes was challenging as the focus of the diagrams was to represent how different model structures represent the global water cycle, rather than representing the entire global water cycle with all possible processes, as intended, e.g., in Nell et al. (2023). Hence, the required level of abstraction as well as realism was discussed at length. These discussions resulted in the drafts of Figs. S7 and S8.
To provide a clear way forward to ourselves, we decided to focus on two main pieces of work: (1) the descriptive part of the models together with a standardized notation of how each flux in each storage is represented by each model (Telteu et al., 2021) and (2) the visualization by diagrams.
A milestone was reached in early 2021 when we involved Marlo Garnsworthy, a graphics designer and science communicator. We provided the latest drafts and received the first professionally designed versions and circulated them. After a joint virtual meeting, we decided on the final appearance of the ISIMIP2b-complete model. We found consensus on generating a diagram of an ISIMIP2b-complete global water model, characterized by its broad inclusion of water fluxes, storages, and processes represented in at least one of the models described in Telteu et al. (2021) and taking part in ISIMIP2b, without implying it is the most thorough or exhaustive representation. The climatic input variables are shown as well as the vertical and lateral water balance and the sectors considered for human water use. Based on this ISIMIP2b-complete model, we derived the diagrams for the individual models by graying out (and for people with color vision deficiency also by crossing out) the components that are not represented in the specific individual model. The numbers of layers in snow, glacier, soil, and groundwater storage are considered in the individual model diagrams; for the ISIMIP2b-complete diagram, the notation of “1+n” indicates that at least one layer should be represented. Please note that the inclusion of a specific flux, storage, or process can be reached at very different levels of complexity. For example, the process that reflects the CO2 concentration on plant growth and related water use is implemented in the models in different ways and levels of detail. However, this variety cannot be accurately captured as binary information (present or absent) in such diagrams. In a series of further feedback rounds with the individual modeling teams and the graphics designer, the diagrams converged towards a final set of illustrations, which are presented here.
To ensure the sustainability of the visualization approach described here, we have developed a Python tool to automatically generate the model diagrams based on JSON of the components included in each model (Müller Schmied, 2025b). This tool was used to generate the corresponding figures represented in this study. The resulting figures are available in Müller Schmied (2025a).
3.1 The ISIMIP2b-complete global water model
In the ISIMIP2b-complete model representation, all processes and features that could be included in a global water model based on current modeling capability within ISIMIP2b are shown (Figs. 2 and 3). Thus, all names, components, and input data are displayed in color. The term ISIMIP2b-complete refers to a hypothetical global water model that includes all the fluxes and storages represented in at least one model participating in ISIMIP2b. However, it does not imply that this is the optimal/best way of representing the water cycle in a model. None of the individual models considers all of these components together, so it is a hypothetical representation of the currently ISIMIP2b-complete global water model.
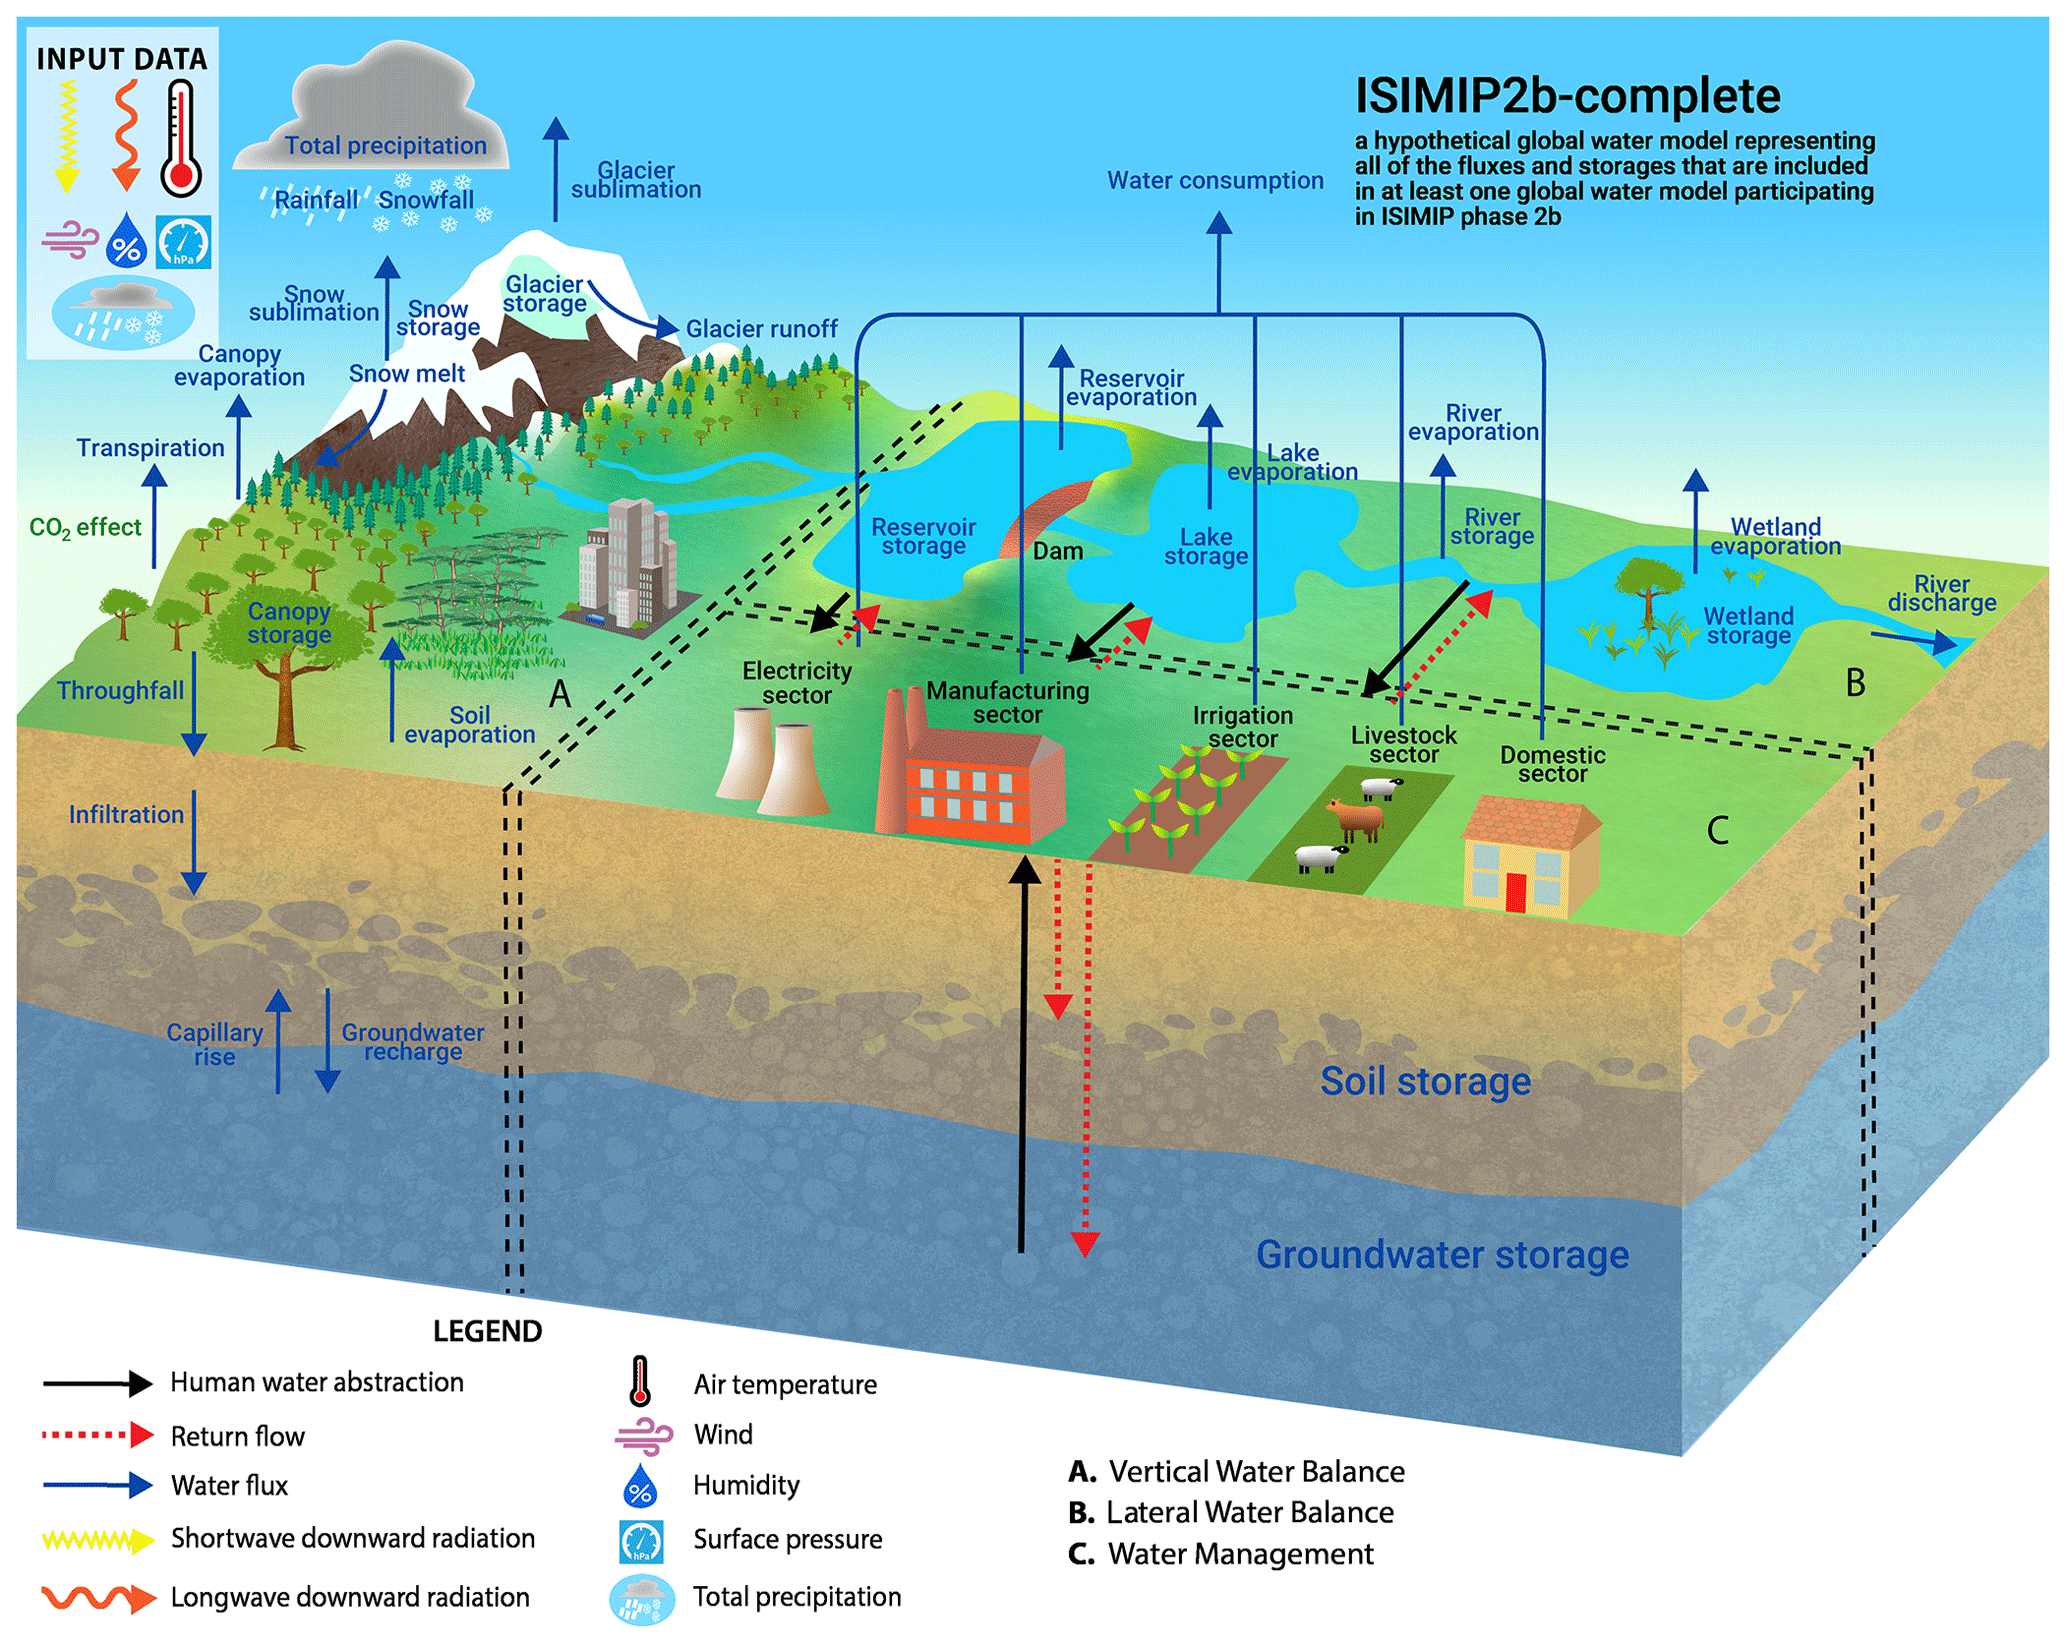
Figure 2The representation of the components of the ISIMIP2b-complete global water model that participates in ISIMIP. The vertical water balance is indicated with A, the lateral water balance with B, and the water management components with C.
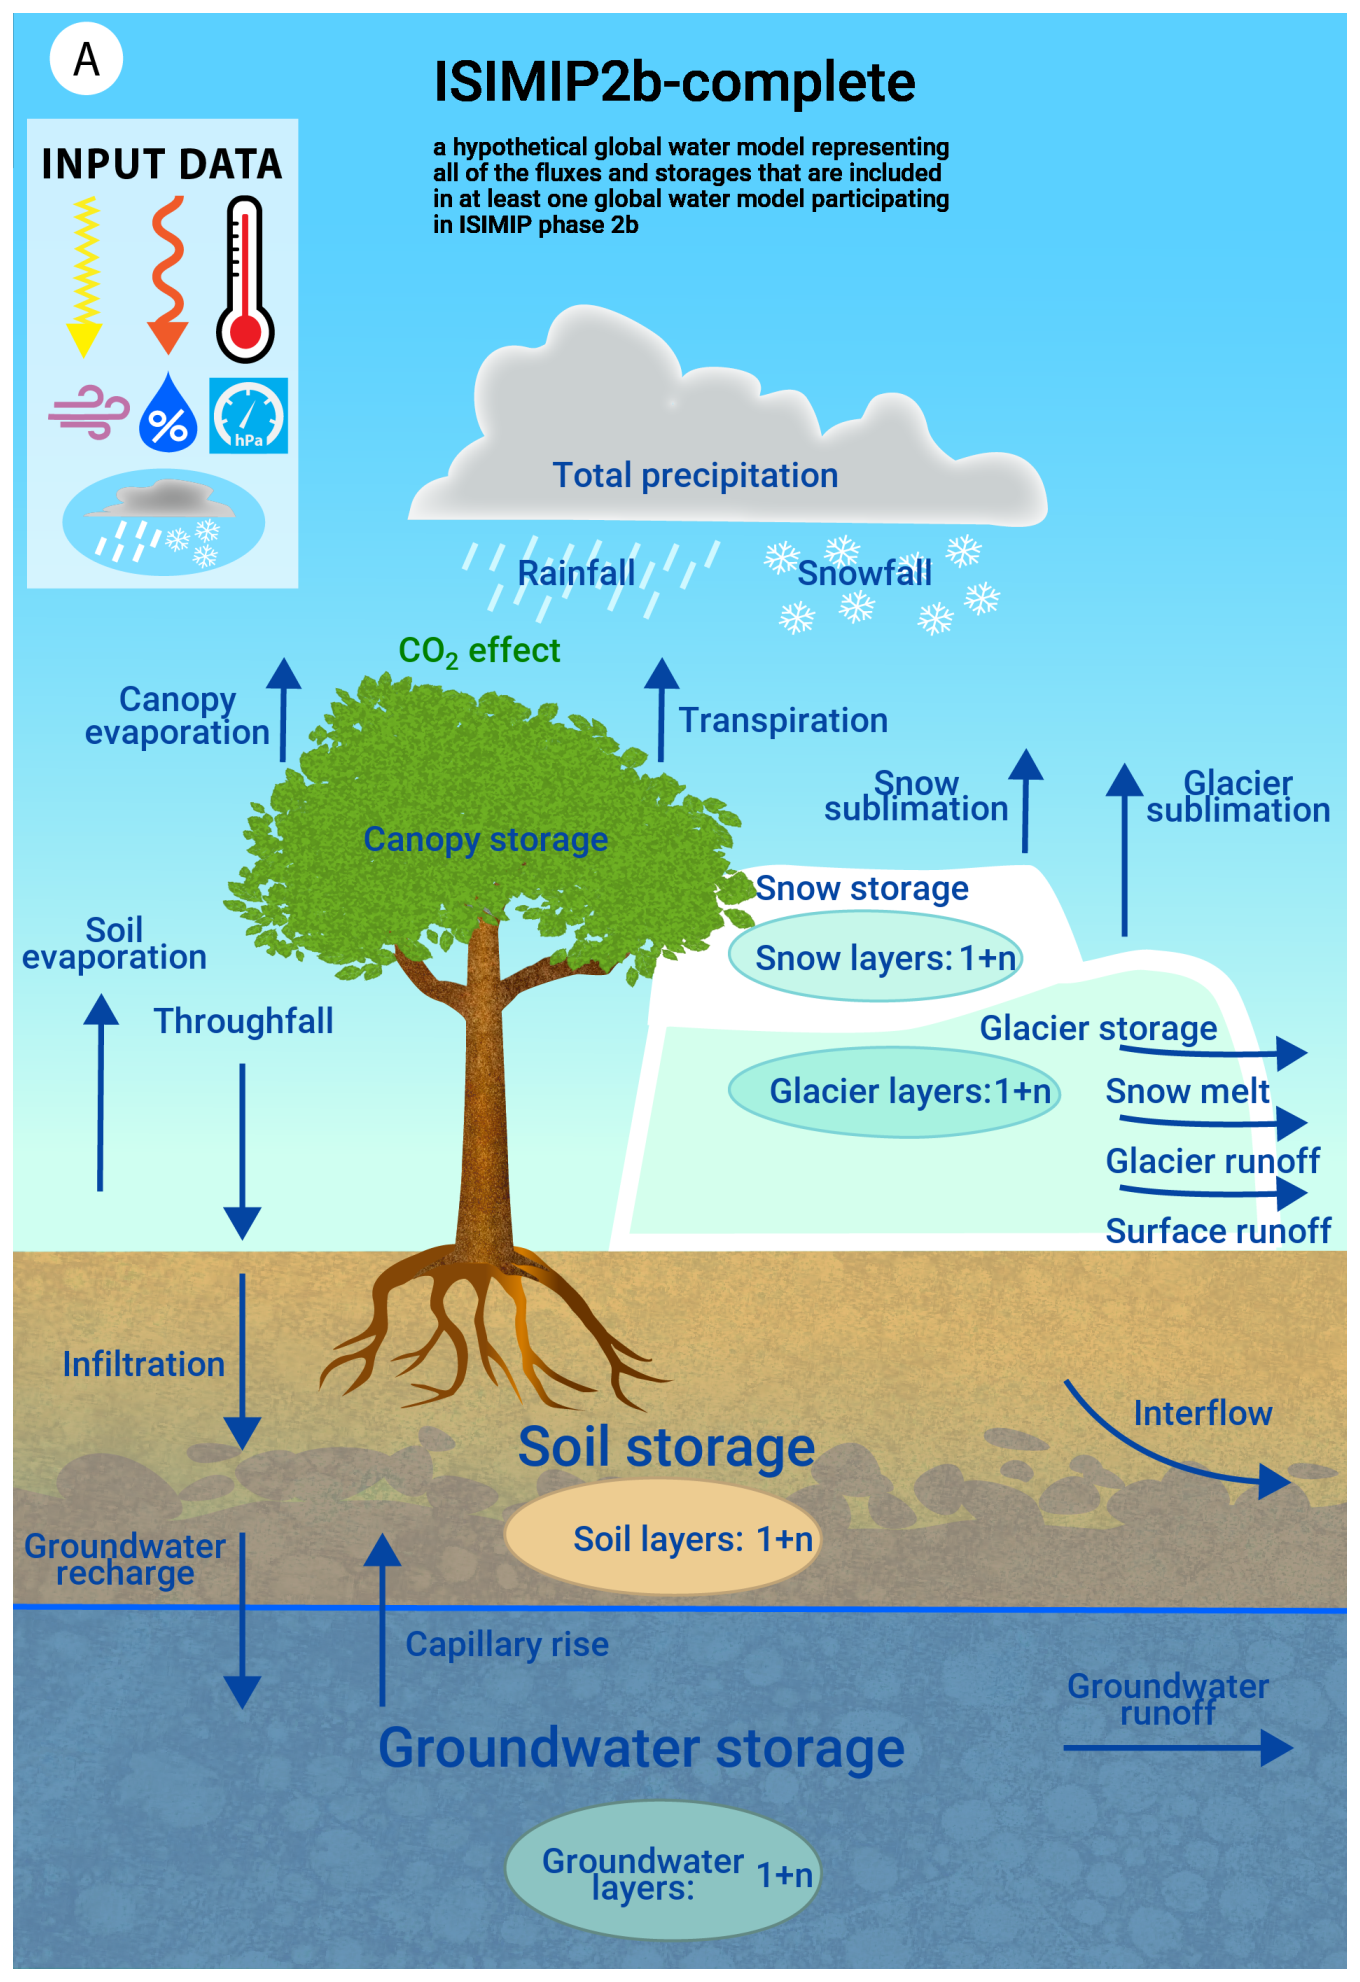
Figure 3The representation of the vertical water balance (part A of Fig. 2) for the ISIMIP2b-complete global water model that participates in ISIMIP.
This model shows the vertical water balance (indicated with A), the lateral water balance (B), and the water management components C) in Fig. 2. The specific illustration of the vertical water balance (Fig. 3) is also provided because, for a number of assessments, the model output of this part of the water cycle (e.g., for indicators of groundwater recharge, runoff or the variation of soil water storage) not only is relevant for society but also exhibits consistency among the models. In contrast, the components of the lateral water balance and the river routing approach differ substantially between the models, and this part of the water cycle is also much more integrated with water management than the vertical water balance.
3.2 The individual ISIMIP2b global water models
The individual model diagrams are displayed in an overview for the full water balance (Fig. 4) and the vertical water balance (Fig. 5) from left to right and top to bottom in order from the highest number of included fluxes and storages to the lowest. In the Supplement (Figs. S9–S40), the individual models are shown separately and are ordered alphabetically according to their model name.
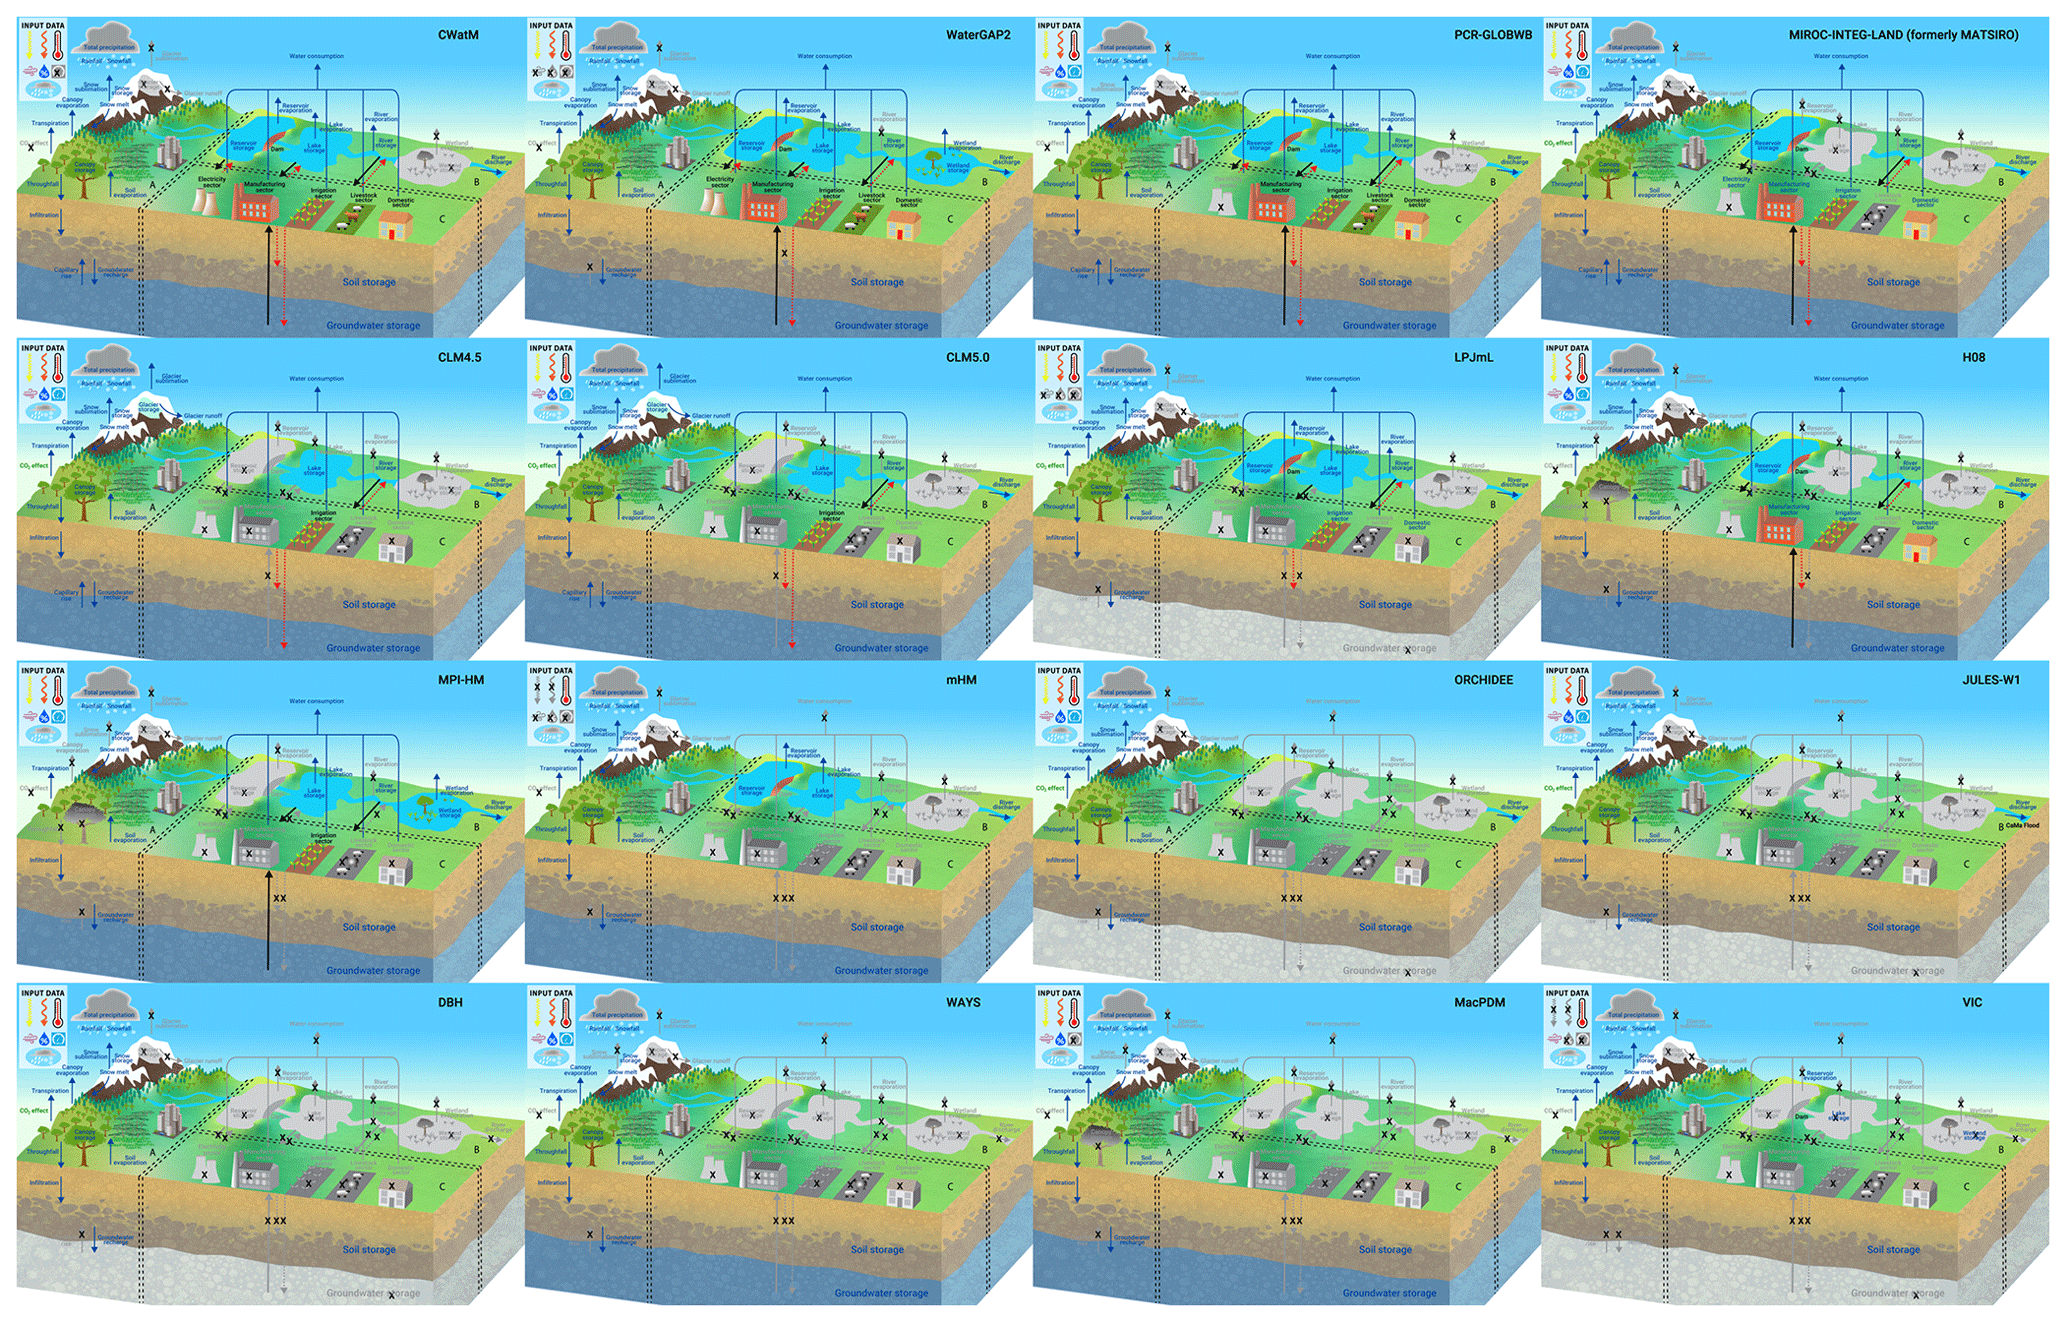
Figure 4The components of the individual ISIMIP2b global water models, ordered by decreasing number of included fluxes and storages from left to right and top to bottom.
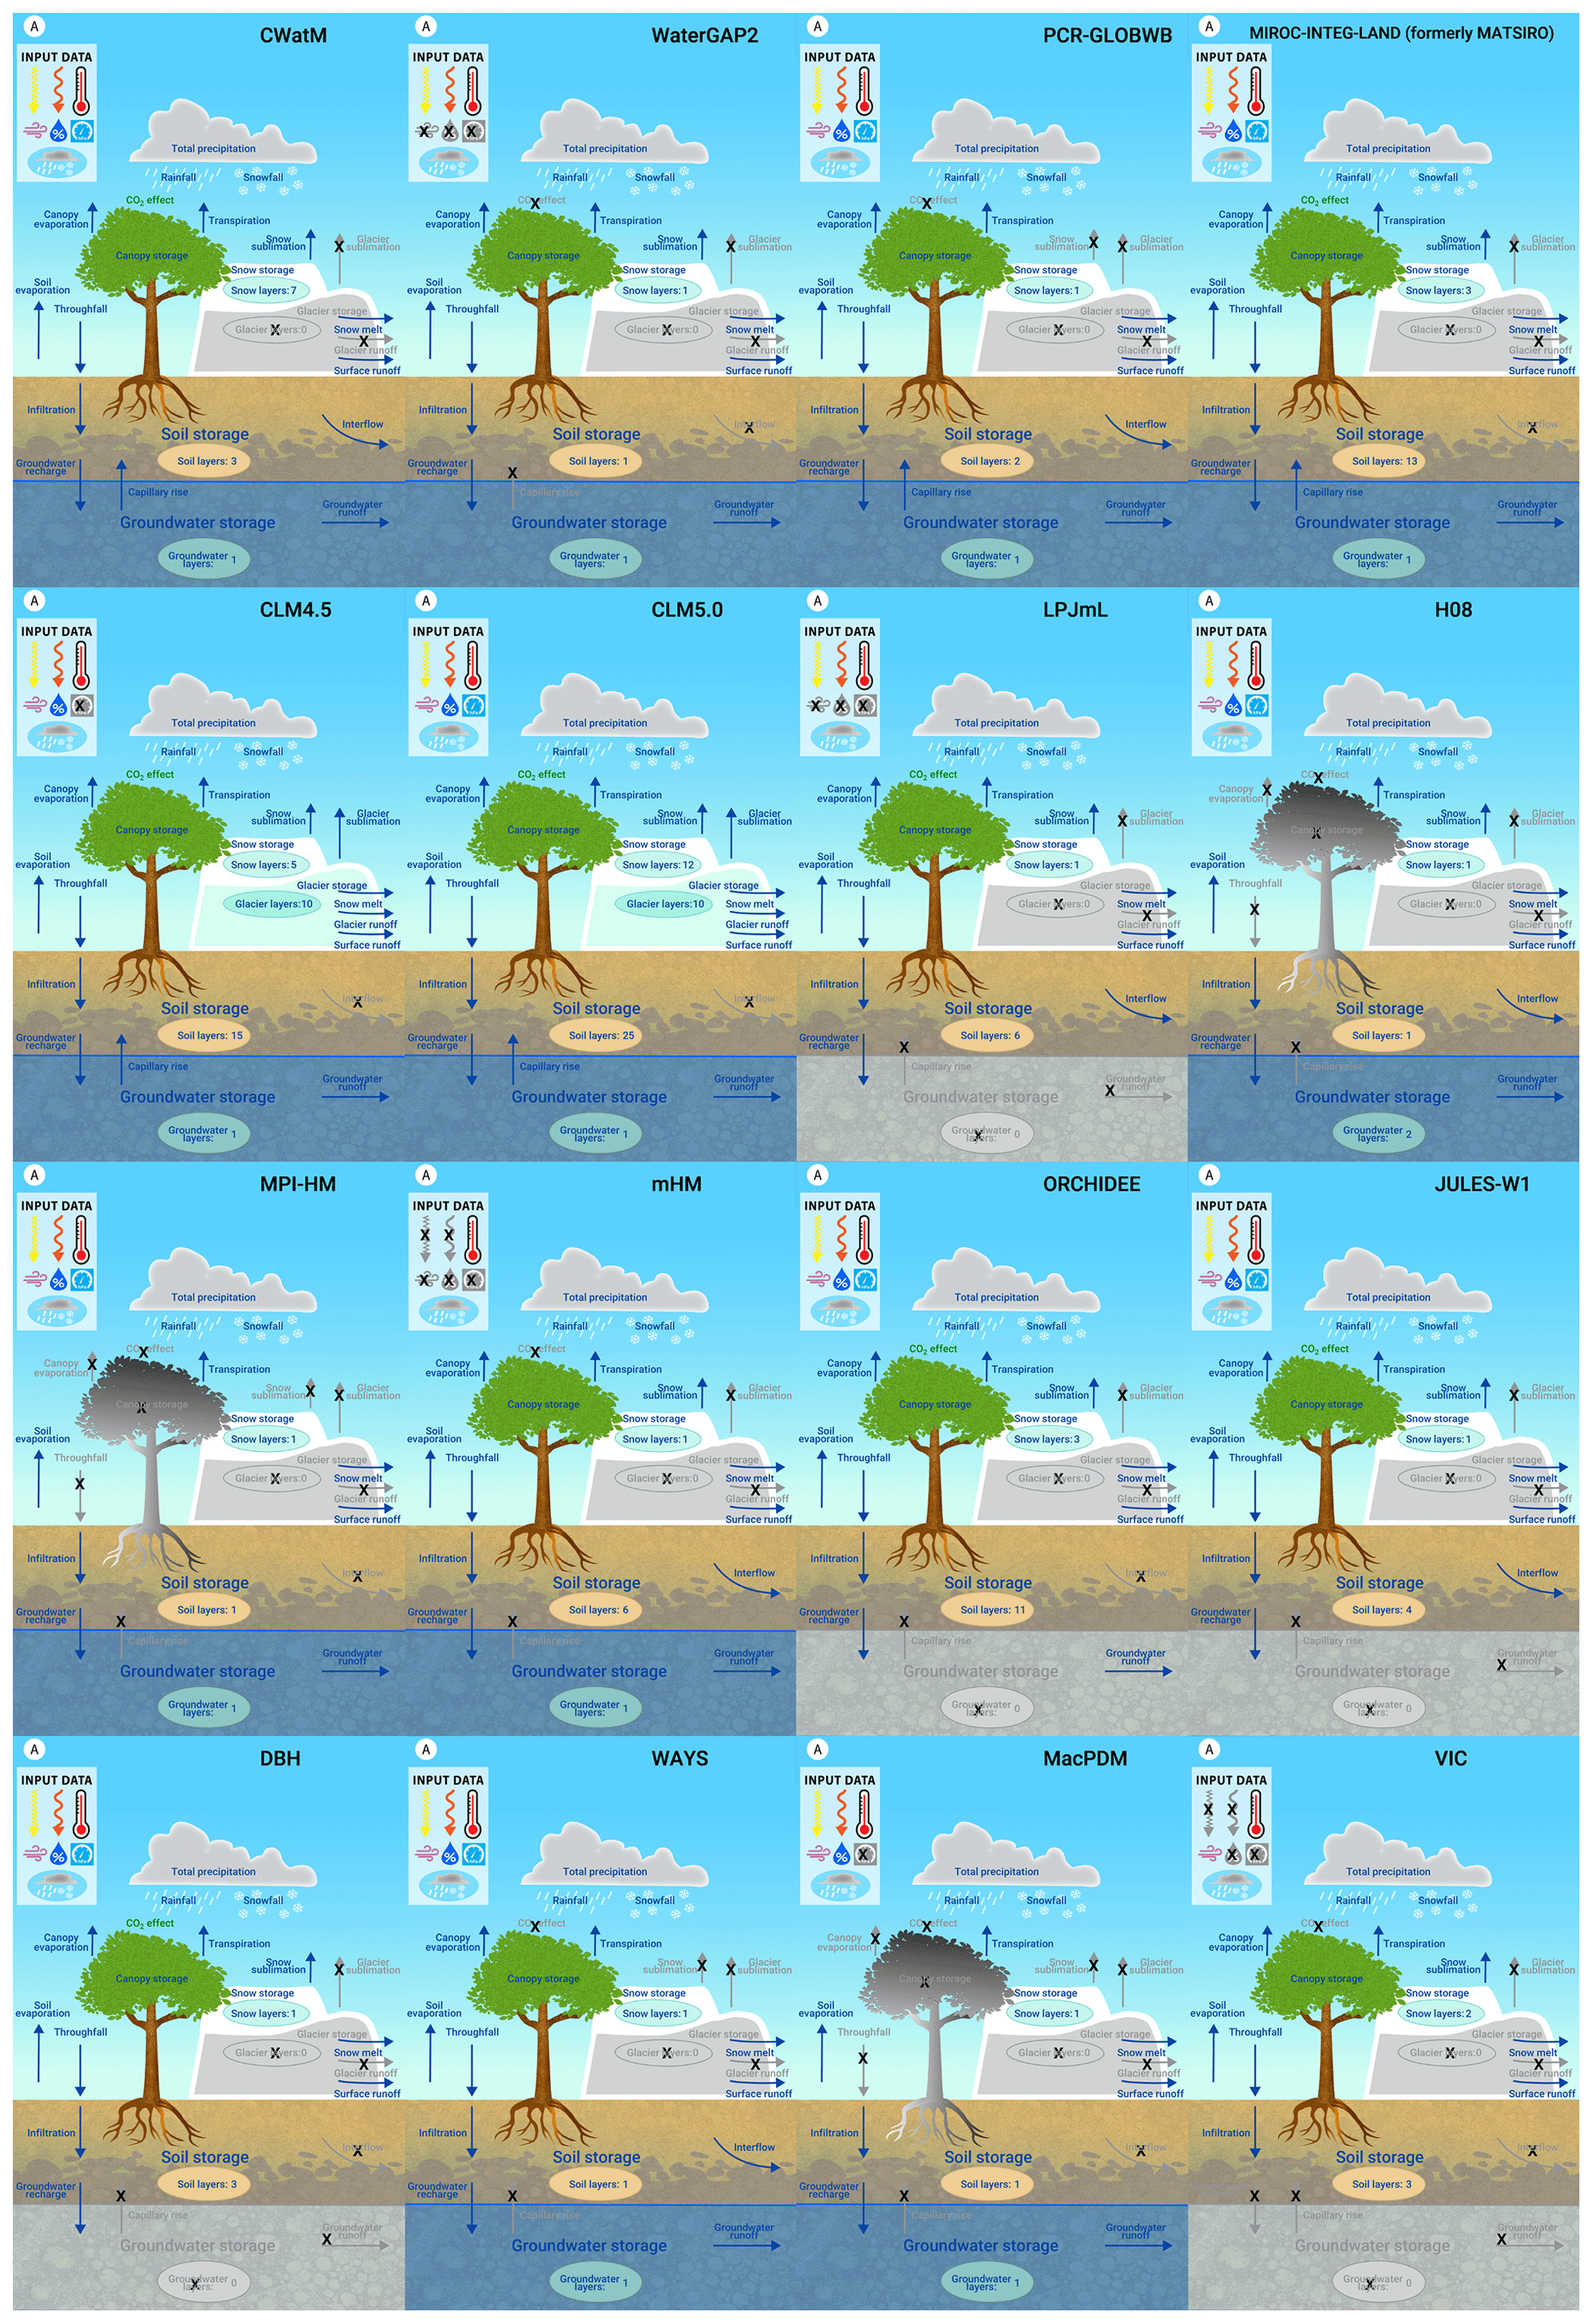
Figure 5The components of the vertical water balance of the individual ISIMIP2b global water models, ordered similarly as in Fig. 4.
The appearance of the 16 model representations next to each other reveals that all models commonly consider snow and soil water storage (Fig. 5). Most models include canopy storage (13 out of 16) and groundwater storage (11 out of 16), but only 2 models (different versions of CLM) have a representation of glacier storage. All models consider the water fluxes transpiration, soil evaporation, infiltration, and (surface) runoff, which can be considered, together with the storages described above, the core components of the hydrological cycle. Specific processes like capillary rise (included in 5 out of 16 models) and interflow (5 out of 16) are less often included, whereas fluxes like groundwater recharge are represented more frequently (15 out of 16). Interestingly, groundwater recharge is also presented for some models that lack an explicit representation of groundwater storage.
Other than for the vertical water balance, there is no commonality in the lateral water balance and water use sectors (B and C part of Fig. 4, respectively). Whereas a model like WaterGAP2 considers all lateral water storage types of the ISIMIP2b-complete representation, models like DBH, WAYS, and MacPDM do not integrate any storage of the lateral water balance. Nevertheless, even though WaterGAP2 has all the surface water storages included, it does not (in contrast to, e.g., PCR-GLBOWB) include evaporation from rivers and might therefore not be seen as a model that fully represents the lateral part of the water cycle.
For 9 out of 16 models, water use sectors are considered, at least with the irrigation sector. Fewer models include other sectors, and only 2 models (CWatM and WaterGAP2) consider all 5 water use sectors that are part of the ISIMIP2b-complete global water model. Reservoirs are included in 7 models, interestingly also in models that do not consider any water use sector (e.g., VIC). The effect of varying CO2 concentrations is included in 8 out of 16 models.
The overview also quickly reveals differences between model versions, in particular for CLM4.5 and CLM5.0, where the different numbers of snow and soil layers are visible.
Here we reflect on the design process, elaborate on opportunities for improvement, and provide an outlook for similar activities (e.g., in the recent ISIMIP phase 3).
4.1 Reflection of the design process
The stages in developing a visual model description are quite different from the stages involved in describing the models with formulas and equations (Telteu et al., 2021). The latter required individual elements of model processes and parameterizations to be studied and compared between models, while the development of the diagrams required a higher level of aggregation, where individual processes had to be lumped together to a higher order and consideration given as to whether they fell into any one particular part of the ISIMIP2b-complete model diagram.
It became clear that this process could only be successful with a strong commitment from the modeling participants. It was challenging to achieve this, and it is perhaps one of the main reasons that so few studies have been published that use visualizations to compare environmental models. Specific challenges included the limited duration of funding to support the activity (a few months) and variability in academic staff contracts (e.g., PhD candidates graduating and then moving to new places of work with new priorities).
Communication and the interaction with different groups (modelers, stakeholders, the broad ISIMIP audience) have been essential. The feedback from these discussions was presented at international conferences such as EGU and AGU, as well as to the ISIMIP modeling community. Abstract deadlines for these opportunities for discussion were helpful with working towards finding a timely consensus.
Intense interaction with the graphics designer was important for discussing and agreeing on how complex processes could be represented in a relatively simple, visual form. Much time was spent in developing a consensus on the right balance between visual complexity, accuracy, detail, and simplicity. For example, groundwater is often drawn like a large sub-surface lake or river (Abbott et al., 2019; Fandel et al., 2018), but it is not trivial to represent water-filled bedrock without creating such a misconception. Also, we discussed which shapes and icons could be used to illustrate specific features, such as vegetation. The main intention was to show a tree as in the final version to represent the canopy storage. Intrinsically, we initially sketched a typical Northern Hemisphere broad-leaf tree, but during the discussion, it became clear that this inadvertently ignored the diversity of different canopy types that exist around the world in different biomes (e.g., the vegetation of an African savanna).
It took several general discussion rounds (online meetings), countless bilateral email discussions, and several review rounds to reach a commonly agreed diagram. It was challenging to find the right balance between creating an appealing and realistic visualization while also maintaining a degree of abstractness that typically mirrors how the environment is represented in a computer model. One way that the balance was achieved was by implementing knowledge and feedback from the experiences that modelers have had when working with non-modelers, e.g., policy-makers. Also, communication with the graphics designer helped, as she was able to provide insights from her own expertise and experiences on how complex processes can be better visualized for wide audiences. Through this process and in particular while discussing what should be grayed out or not, the modeling teams achieved an enhanced level of understanding about the representation of specific fluxes and storages in the models.
4.2 Potential uses of the model diagrams and further directions
The development of a consistent design style for visualizing the models has several benefits and uses.
Model evaluation studies show that the outputs from the models differ, even when the models are forced with consistent input data (Veldkamp et al., 2018; Zaherpour et al., 2018; Kumar et al., 2022). Whilst it is useful to understand the extent to which the models perform differently, it is also important to understand why the models perform differently. The latter is often challenging to address, largely because the models have been developed by multiple groups over many years (in some cases decades, e.g., MacPDM (Gosling and Arnell, 2011) or WaterGAP (Döll et al., 2003)) and because detailed knowledge of how each model works is required (Melsen, 2022). The reasons for inter-model differences are thus often only rather vaguely explained in the literature (e.g. Zaherpour et al., 2018; Veldkamp et al., 2018). We anticipate that the model illustrations will be used alongside the numerical description of different modeling components such as in Telteu et al. (2021). By comparing consistently created diagrams, we can begin to understand the differences among the models at a glance. This will further help researchers understand why certain model outputs differ in future model evaluation studies.
One of the underlying rationales of model evaluation studies is that they identify opportunities for model development and improvement. Given that the ISIMIP2b-complete model was co-created by many members of the global water modeling community, it can be used to help plan the integration of missing components or schemes into individual models. The equations and concepts detailed in Telteu et al. (2021) should also help to build the basis for model development planning. We acknowledge that the ISIMIP2b-complete model diagram is missing some components from the observed water cycle, including aspects of water management like flood protection measures (both green and gray, O'Donnell et al., 2021) and inter-basin water transfer, as well as natural processes like permafrost and the role of animals such as beavers that can significantly modify river hydrology largely through dam construction (Larsen et al., 2021). Thus, the ISIMIP2b-complete model should not be seen as the best way to describe and visualize the full water cycle. Rather, it should be viewed as a representation of current capabilities of the models participating in the ISIMIP2b global water sector and the specifications of the ISIMIP2b protocol. The ISIMIP2b-complete model diagram is likely to evolve, also as the spatial and temporal resolution is refined, and finer-scale processes are represented, and also as computing power improves along with advances in artificial intelligence (Zaherpour et al., 2019), which are already leading to improvements in the capability of weather and climate prediction (Lam et al., 2023).
Given the range of inherent uncertainties and performance differences between the models (Zaherpour et al., 2019), it is often difficult to know which of the models are better suited for some applications than others, e.g., for simulating hydrology in dry regions only (see the discussion in Krysanova et al., 2020; Zaherpour et al., 2019) or for analyzing only droughts (Kumar et al., 2022). Some studies focus on human interactions with the natural water cycle (Haddeland et al., 2014). The model diagrams we present here help to illustrate the types of human interactions they include, to what extent, and how. This helps with selecting appropriate models to incorporate into selected studies. For example, if someone wants to assess the amplification of streamflow (river discharge) due to reservoir management and human water use, the user can use the diagrams to determine whether a model includes this process. Although this information can also be obtained from the equations described in Telteu et al. (2021), the graphical illustration provides a more intuitive and rapid overview of model components and structure. The value of the diagrams in the way that is outlined above is not limited to just human water use; e.g., they will also facilitate the identification of models suitable for studies on energy balance, CO2 effects, vegetation dynamics, and evapotranspiration.
Previous diagrams of the global water cycle have been criticized (Abbott et al., 2019; Fandel et al., 2018) for not accurately representing the magnitude of uncertainties that exist in current scientific understanding of the fluxes and stores that constitute the cycle. For example, the use of equally thick lines for fluxes, or values of water balances without error, gives the incorrect impression that the water cycle is fully understood and not subject to refinements or scientific discussion. Our diagrams have the same limitation, in that the fluxes and stores do not have an uncertainty range associated with them. This was not the goal of our exercise, but we acknowledge that such information is important. Our diagrams do, however, illustrate the concept of structural uncertainty. The model-specific differences in the diagrams of the individual models (Sect. 3.2) show that the water cycle can be represented in different, yet plausible, ways (Butts et al., 2004). In follow-on studies, the model outputs could be assessed to quantify the magnitude of uncertainty associated with the fluxes and storages. This information could then be included in the model diagrams by representing the fluxes and storages with different drawn thicknesses that correspond to the magnitude of uncertainty.
Lastly, the diagrams serve an educational purpose and support end users. The illustration of the ISIMIP2b-complete global water model helps to show what is potentially feasible based on current modeling capability in the ISIMIP2b scientific community, while the individual model diagrams help to show the different ways that models approach the process of simplifying the environment and human interactions into a numerical model form. However, advances in modeling the water cycle that are taking place in the wider scientific community, and that may happen in the future, are not directly represented in our diagram because they are happening, or will happen, outside of ISIMIP, for example, enhancements in the spatial and temporal resolution of water models (Bierkens et al., 2015; Van Jaarsveld et al., 2025), coupling with glaciers (Hanus et al., 2024), or using sophisticated ways of integrating additional information from remote sensing and calibration (Döll et al., 2024). The illustrations also help with understanding the different degrees of complexity that exist in modeling, e.g., the number of soil layers. From an educational standpoint, this helps to support understanding of the underlying basis of modeling the water cycle, and it opens the floor for a more detailed discussion about the way that processes are implemented in the models (Telteu et al., 2021). Also, this visualization of the structural model uncertainty of the current generation of global water models can help to better inform end users such as readers of assessment reports (e.g., those from IPCC).
4.3 Updating the diagrams for ISIMIP3
The model diagrams presented here are for the models that have participated in phase 2b of ISIMIP. ISIMIP is currently in phase 3 (Frieler et al., 2024). Some of the models that participated in ISIMIP2b have been updated for phase 3, and, in addition, some new models are participating in phase 3 that did not participate in earlier phases. The new models do not differ significantly in their representation of the water cycle compared to the 2b models. Therefore, the model diagrams presented here need only minor adaptations to accommodate the new models. Furthermore, the notation of the equations in Telteu et al. (2021) can also be used.
In the future, the modeling teams running new or updated models will be able to provide details on the components included in their models in a structured JSON format. Based on the (potentially updated) diagram generation tool and the provided component details, a model diagram could easily be created for that model.
We are also considering developing an interactive, web-based version of the diagrams. This would link to the underlying equations for each part of the diagram. There could also be an option to download the model outputs. We also envisage a search facility, which would allow users to select a specific component of interest and then obtain more information about the model(s) that consider that component, as well as the available model output. Once integrated in the general ISIMIP workflow, this would simplify the usability of output data and also increase the visibility and up-to-date status of the contributing models.
In the longer term, we anticipate exploring the feasibility of applying the ISIMIP2b-complete model visualization to some of the models that participate in other ISIMIP sectors, e.g., global gridded crops models, biomes models, and global water quality models. The tool to generate the diagrams was designed for the specifics of the models participating in the ISIMIP2b global water sector. Hence, this is not a generic tool that can generate model diagrams for other communities, but it can act as a blueprint for such activities. A similar visualization exercise to what we describe here, taking account of the lessons learned, could be undertaken for other sectors or communities to enhance cross-sectoral understanding of the models and support assessments of model outputs.
4.4 Recommendations for similar exercises
The overall process of producing the model diagrams presented here has taken nearly a decade, and we underestimated the effort required to achieve our goal. However, we gained a lot of experience during that time, and we use this as a basis for providing a set of recommendations for similar exercises below, based on the lessons learned:
-
Apply principles of project management so that the process is streamlined, with clear deadlines, responsibilities, and goals outlined.
-
Involve social scientist(s) in the process so that formal methods of collaborative working from other disciplines can be integrated into the process.
-
Formally document each stage and discussion so that there is a record of (and reasons for) decisions, which will help when new people join the collaboration and also for clarity in later stages (which may be many years later).
-
Unfunded “side-of-desk” activities such as this can be challenging to manage and complete, so we recommend securing funding to support a (group of) dedicated staff member(s) for the project and paying the main contributors (modeling groups in our case) for the time needed to commit to the project, if possible.
-
Conduct regular in-person and virtual meetings for discussing the process to avoid lengthy email discussions.
-
Consider sustainability from the beginning (e.g., by designing a tool for automatic diagram generation) to focus using funding for the design of the prototype rather than for the individual diagrams.
-
Generally work in a collaborative online working space to offer every participant the opportunity to see the status and progress at every point in time.
-
Actively search (and create) occasions to discuss the process and results with potential users, modelers, stakeholders, and other scientists.
-
Summarize the outcome and ideas of such discussions, and sketch the consequences of the recommendations (pros and cons) for the diagram itself but also for the scope of the exercise to have a basis for discussing the next steps for diagram design.
-
Discuss this outcome openly with the participants of the exercise and decide as a team the way forward.
This study provides insights from a community effort to illustrate the components of the terrestrial part of the global water cycle that are currently simulated by a set of state-of-the-art global water models participating in the ISIMIP phase 2b exercise. Based on inclusive discussions between the modeling teams and a graphics designer, we co-developed an ISIMIP2b-complete representation of the global water cycle components that several of the current generation of global water models can theoretically simulate. We then showed how individual models include/exclude some of the processes that appear in the ISIMIP2b-complete model by graying out processes where they do not appear and also by adding the number of layers for different storages.
The process has highlighted the challenges and opportunities in creating a set of standardized model description diagrams. The process has been lengthy and required multiple iterations with different user groups, but the final set of diagrams has many potential uses. These include helping to assist with understanding differences in model performance and identifying which models to include in future studies. The diagrams also serve an educational purpose and foster a better understanding of modeling results and their potential use in, e.g., policy-making or adaptation planning, and they provide a basis for future model development.
Although the models included in our study are not exhaustive (not all global water models participate in ISIMIP2b), they provide a point of reference for what is currently achievable from a large set of global water models, some of which have been developed over several decades. Looking to the future, the automated creation of the diagrams enables continuation and adapting of such graphical representations when models are updated and when new models join the ISIMIP exercise. We also hope that our experience and results will inspire other Earth system science modelers who are interested in other aspects of the environment to produce similar model ensemble visualizations that enhance understanding of each others' models.
The diagrams were initially drawn by using Adobe Illustrator. The single elements were then extracted and composed within a Python script and based on JSON of the components of the ISIMIP2b-complete and individual models. The code is available in Müller Schmied (2025b) (https://doi.org/10.5281/zenodo.15230181).
No model output is used in this particular study. The resulting diagrams are available in Müller Schmied (2025a) (https://doi.org/10.5281/zenodo.15232551).
The supplement related to this article is available online at https://doi.org/10.5194/gmd-18-2409-2025-supplement.
CET led the conceptualization and organization of the graphical representation of the ISIMIP2b models under guidance of HMS starting in 2017, and HMS took over the process in 2022. The initial idea to commonly provide the graphical representation of the ISIMIP2b models was proposed by HMS, who also obtained funding for the graphics designer. MG initially created the graphics with input and feedback obtained from CET and HMS, who both collected the feedback from the individual modeling teams. All other co-authors (and including CET, SNG, and HMS) directly provided feedback to the representation of the ISIMIP2b-complete model and in the particular models of the modeling teams. HMS created the script to automatize the creation of the final figures presented here. CET led and conducted the stakeholder interaction. HMS wrote the initial draft of the manuscript, and LM and SNG critically reviewed and revised it. All authors reviewed, commented on, and contributed to the final draft.
The contact author has declared that none of the authors has any competing interests.
Publisher's note: Copernicus Publications remains neutral with regard to jurisdictional claims made in the text, published maps, institutional affiliations, or any other geographical representation in this paper. While Copernicus Publications makes every effort to include appropriate place names, the final responsibility lies with the authors.
The present study was possible through the international ISIMIP framework. The authors thank Ted Veldkamp for a presentation at EGU General Assembly 2017 where she was trying to relate different model results to model schemes, showed a slide with some published schematics of the models in the global water sector, and concluded that it is hard to elaborate on the differences when there is no commonality in those visualizations. This can be seen as seed for this community effort. We thank the ISIMIP coordination team for providing funds for the workshops where this paper could be discussed. We thank Antolii Shmurak, Aimé Koudou, Tim Trautmann, Robert Reinecke, Inge de Graaf, and Nils Moosdorf for constructive feedback in the workshops. Furthermore, we acknowledge the support from Alicia Böhme for extracting the individual elements of the model diagram that enabled the creation of the model diagram generator. Hannes Müller Schmied is grateful to Lotta Müller Schmied for using the background image for Fig. 1 that was drawn by her. The authors acknowledge the detailed and helpful comments and suggestions by Wouter Knoben and an anonymous referee.
This research has been supported by the Bundesministerium für Bildung und Forschung (grant no. 01LS1711F); the European Cooperation in Science and Technology (grant no. CA19139); the National Science Foundation (grant no. 1752729); and the Ministerstvo Školství, Mládeže a Tělovýchovy (grant no. CZ.02.01.01/00/22_008/0004635).
This open-access publication was funded by Goethe University Frankfurt.
This paper was edited by Di Tian and David Ham and reviewed by Wouter Knoben and one anonymous referee.
Abbott, B. W., Bishop, K., Zarnetske, J. P., Minaudo, C., Chapin, F. S., Krause, S., Hannah, D. M., Conner, L., Ellison, D., Godsey, S. E., Plont, S., Marçais, J., Kolbe, T., Huebner, A., Frei, R. J., Hampton, T., Gu, S., Buhman, M., Sara Sayedi, S., Ursache, O., Chapin, M., Henderson, K. D., and Pinay, G.: Human domination of the global water cycle absent from depictions and perceptions, Nat. Geosci., 12, 533–540, https://doi.org/10.1038/s41561-019-0374-y, 2019. a, b, c, d, e, f, g
Bierkens, M. F. P., Bell, V. A., Burek, P., Chaney, N., Condon, L. E., David, C. H., De Roo, A., Döll, P., Drost, N., Famiglietti, J. S., Flörke, M., Gochis, D. J., Houser, P., Hut, R., Keune, J., Kollet, S., Maxwell, R. M., Reager, J. T., Samaniego, L., Sudicky, E., Sutanudjaja, E. H., Van De Giesen, N., Winsemius, H., and Wood, E. F.: Hyper-resolution global hydrological modelling: what is next: “Everywhere and locally relevant”, Hydrol. Process., 29, 310–320, https://doi.org/10.1002/hyp.10391, 2015. a
Burek, P., Satoh, Y., Kahil, T., Tang, T., Greve, P., Smilovic, M., Guillaumot, L., Zhao, F., and Wada, Y.: Development of the Community Water Model (CWatM v1.04) – a high-resolution hydrological model for global and regional assessment of integrated water resources management, Geosci. Model Dev., 13, 3267–3298, https://doi.org/10.5194/gmd-13-3267-2020, 2020. a
Butts, M. B., Payne, J. T., Kristensen, M., and Madsen, H.: An evaluation of the impact of model structure on hydrological modelling uncertainty for streamflow simulation, J. Hydrol., 298, 242–266, https://doi.org/10.1016/j.jhydrol.2004.03.042, 2004. a
Cardak, O.: Science Student's Misconceptions of the Water Cycle According to their Drawings, J. Appl. Sci., 9, 865–873, 2009. a, b
Dankers, R., Arnell, N. W., Clark, D. B., Falloon, P. D., Fekete, B. M., Gosling, S. N., Heinke, J., Kim, H., Masaki, Y., Satoh, Y., Stacke, T., Wada, Y., and Wisser, D.: First look at changes in flood hazard in the Inter-Sectoral Impact Model Intercomparison Project ensemble, P. Natl. Acad. Sci. USA, 111, 3257–3261, https://doi.org/10.1073/pnas.1302078110, 2014. a
Döll, P., Kaspar, F., and Lehner, B.: A global hydrological model for deriving water availability indicators: model tuning and validation, J. Hydrol., 270, 105–134, https://doi.org/10.1016/S0022-1694(02)00283-4, 2003. a
Döll, P., Hasan, H. M. M., Schulze, K., Gerdener, H., Börger, L., Shadkam, S., Ackermann, S., Hosseini-Moghari, S.-M., Müller Schmied, H., Güntner, A., and Kusche, J.: Leveraging multi-variable observations to reduce and quantify the output uncertainty of a global hydrological model: evaluation of three ensemble-based approaches for the Mississippi River basin, Hydrol. Earth Syst. Sci., 28, 2259–2295, https://doi.org/10.5194/hess-28-2259-2024, 2024. a
European Commission: JRC PESETA IV, https://joint-research-centre.ec.europa.eu/peseta-projects/jrc-peseta-iv_en (last access: 19 December 2023), 2023. a
Fandel, C. A., Breshears, D. D., and McMahon, E. E.: Implicit assumptions of conceptual diagrams in environmental science and best practices for their illustration, Ecosphere, 9, e02072, https://doi.org/10.1002/ecs2.2072, 2018. a, b, c, d, e, f
Frieler, K., Lange, S., Piontek, F., Reyer, C. P. O., Schewe, J., Warszawski, L., Zhao, F., Chini, L., Denvil, S., Emanuel, K., Geiger, T., Halladay, K., Hurtt, G., Mengel, M., Murakami, D., Ostberg, S., Popp, A., Riva, R., Stevanovic, M., Suzuki, T., Volkholz, J., Burke, E., Ciais, P., Ebi, K., Eddy, T. D., Elliott, J., Galbraith, E., Gosling, S. N., Hattermann, F., Hickler, T., Hinkel, J., Hof, C., Huber, V., Jägermeyr, J., Krysanova, V., Marcé, R., Müller Schmied, H., Mouratiadou, I., Pierson, D., Tittensor, D. P., Vautard, R., Van Vliet, M., Biber, M. F., Betts, R. A., Bodirsky, B. L., Deryng, D., Frolking, S., Jones, C. D., Lotze, H. K., Lotze-Campen, H., Sahajpal, R., Thonicke, K., Tian, H., and Yamagata, Y.: Assessing the impacts of 1.5 °C global warming – simulation protocol of the Inter-Sectoral Impact Model Intercomparison Project (ISIMIP2b), Geosci. Model Dev., 10, 4321–4345, https://doi.org/10.5194/gmd-10-4321-2017, 2017. a
Frieler, K., Volkholz, J., Lange, S., Schewe, J., Mengel, M., Del Rocío Rivas López, M., Otto, C., Reyer, C. P. O., Karger, D. N., Malle, J. T., Treu, S., Menz, C., Blanchard, J. L., Harrison, C. S., Petrik, C. M., Eddy, T. D., Ortega-Cisneros, K., Novaglio, C., Rousseau, Y., Watson, R. A., Stock, C., Liu, X., Heneghan, R., Tittensor, D., Maury, O., Büchner, M., Vogt, T., Wang, T., Sun, F., Sauer, I. J., Koch, J., Vanderkelen, I., Jägermeyr, J., Müller, C., Rabin, S., Klar, J., Vega Del Valle, I. D., Lasslop, G., Chadburn, S., Burke, E., Gallego-Sala, A., Smith, N., Chang, J., Hantson, S., Burton, C., Gädeke, A., Li, F., Gosling, S. N., Müller Schmied, H., Hattermann, F., Wang, J., Yao, F., Hickler, T., Marcé, R., Pierson, D., Thiery, W., Mercado-Bettín, D., Ladwig, R., Ayala-Zamora, A. I., Forrest, M., and Bechtold, M.: Scenario setup and forcing data for impact model evaluation and impact attribution within the third round of the Inter-Sectoral Model Intercomparison Project (ISIMIP3a), Geosci. Model Dev., 17, 1–51, https://doi.org/10.5194/gmd-17-1-2024, 2024. a, b
Gosling, S. N. and Arnell, N. W.: Simulating current global river runoff with a global hydrological model: model revisions, validation, and sensitivity analysis, Hydrol. Process., 25, 1129–1145, https://doi.org/10.1002/hyp.7727, 2011. a
Gosling, S. N., Zaherpour, J., Mount, N. J., Hattermann, F. F., Dankers, R., Arheimer, B., Breuer, L., Ding, J., Haddeland, I., Kumar, R., Kundu, D., Liu, J., Van Griensven, A., Veldkamp, T. I. E., Vetter, T., Wang, X., and Zhang, X.: A comparison of changes in river runoff from multiple global and catchment-scale hydrological models under global warming scenarios of 1 °C, 2 °C and 3 °C, Climatic Change, 141, 577–595, https://doi.org/10.1007/s10584-016-1773-3, 2017. a
Gosling, S. N., Müller Schmied, H., Burek, P., Chang, J., Ciais, P., Döll, P., Eisner, S., Fink, G., Flörke, M., Franssen, W., Grillakis, M., Hagemann, S., Hanasaki, N., Koutroulis, A., Leng, G., Liu, X., Masaki, Y., Mathison, C., Mishra, V., Ostberg, S., Portmann, F., Qi, W., Sahu, R.-K., Satoh, Y., Schewe, J., Seneviratne, S., Shah, H. L., Stacke, T., Tao, F., Telteu, C., Thiery, W., Trautmann, T., Tsanis, I., Wanders, N., Zhai, R., Büchner, M., Schewe, J., and Zhao, F.: ISIMIP2b Simulation Data from the Global Water Sector, ISIMIP [data set], https://doi.org/10.48364/ISIMIP.626689, 2023a. a
Gosling, S. N., Müller Schmied, H. M., Betts, R., Chang, J., Chen, H., Ciais, P., Dankers, R., Döll, P., Eisner, S., Flörke, M., Gerten, D., Grillakis, M., Hagemann, S., Hanasaki, N., Huang, M., Huang, Z., Jerez, S., Kim, H., Koutroulis, A., Leng, G., Liu, J., Liu, X., Mao, G., Masaki, Y., Montavez, J. P., Morfopoulos, C., Oki, T., Orth, R., Ostberg, S., Papadimitriou, L., Pokhrel, Y., Portmann, F., Qi, W., Satoh, Y., Seneviratne, S., Sommer, P. S., Stacke, T., Tang, Q., Tsanis, I., Wada, Y., Wang, X., Zhou, T., Büchner, M., Schewe, J., and Zhao, F.: ISIMIP2a Simulation Data from the Global Water Sector, ISIMIP [data set], https://doi.org/10.48364/ISIMIP.882536, 2023b. a
Gudmundsson, L., Tallaksen, L. M., Stahl, K., Clark, D. B., Dumont, E., Hagemann, S., Bertrand, N., Gerten, D., Heinke, J., Hanasaki, N., Voss, F., and Koirala, S.: Comparing Large-Scale Hydrological Model Simulations to Observed Runoff Percentiles in Europe, J. Hydrometeorol., 13, 604–620, https://doi.org/10.1175/JHM-D-11-083.1, 2012a. a
Gudmundsson, L., Wagener, T., Tallaksen, L. M., and Engeland, K.: Evaluation of nine large‐scale hydrological models with respect to the seasonal runoff climatology in Europe, Water Resour. Res., 48, 2011WR010911, https://doi.org/10.1029/2011WR010911, 2012b. a
Gudmundsson, L., Boulange, J., Do, H. X., Gosling, S. N., Grillakis, M. G., Koutroulis, A. G., Leonard, M., Liu, J., Müller Schmied, H., Papadimitriou, L., Pokhrel, Y., Seneviratne, S. I., Satoh, Y., Thiery, W., Westra, S., Zhang, X., and Zhao, F.: Globally observed trends in mean and extreme river flow attributed to climate change, Science, 371, 1159–1162, https://doi.org/10.1126/science.aba3996, 2021. a
Haddeland, I., Clark, D. B., Franssen, W., Ludwig, F., Voß, F., Arnell, N. W., Bertrand, N., Best, M., Folwell, S., Gerten, D., Gomes, S., Gosling, S. N., Hagemann, S., Hanasaki, N., Harding, R., Heinke, J., Kabat, P., Koirala, S., Oki, T., Polcher, J., Stacke, T., Viterbo, P., Weedon, G. P., and Yeh, P.: Multimodel Estimate of the Global Terrestrial Water Balance: Setup and First Results, J. Hydrometeorol., 12, 869–884, https://doi.org/10.1175/2011JHM1324.1, 2011. a
Haddeland, I., Heinke, J., Biemans, H., Eisner, S., Flörke, M., Hanasaki, N., Konzmann, M., Ludwig, F., Masaki, Y., Schewe, J., Stacke, T., Tessler, Z. D., Wada, Y., and Wisser, D.: Global water resources affected by human interventions and climate change, P. Natl. Acad. Sci. USA, 111, 3251–3256, https://doi.org/10.1073/pnas.1222475110, 2014. a
Hanasaki, N., Yoshikawa, S., Pokhrel, Y., and Kanae, S.: A global hydrological simulation to specify the sources of water used by humans, Hydrol. Earth Syst. Sci., 22, 789–817, https://doi.org/10.5194/hess-22-789-2018, 2018. a
Hanus, S., Schuster, L., Burek, P., Maussion, F., Wada, Y., and Viviroli, D.: Coupling a large-scale glacier and hydrological model (OGGM v1.5.3 and CWatM V1.08) – towards an improved representation of mountain water resources in global assessments, Geosci. Model Dev., 17, 5123–5144, https://doi.org/10.5194/gmd-17-5123-2024, 2024. a
Krysanova, V., Zaherpour, J., Didovets, I., Gosling, S. N., Gerten, D., Hanasaki, N., Müller Schmied, H., Pokhrel, Y., Satoh, Y., Tang, Q., and Wada, Y.: How evaluation of global hydrological models can help to improve credibility of river discharge projections under climate change, Climatic Change, 163, 1353–1377, https://doi.org/10.1007/s10584-020-02840-0, 2020. a
Kumar, A., Gosling, S. N., Johnson, M. F., Jones, M. D., Zaherpour, J., Kumar, R., Leng, G., Müller Schmied, H. M., Kupzig, J., Breuer, L., Hanasaki, N., Tang, Q., Ostberg, S., Stacke, T., Pokhrel, Y., Wada, Y., and Masaki, Y.: Multi-model evaluation of catchment- and global-scale hydrological model simulations of drought characteristics across eight large river catchments, Adv. Water Resour., 165, 104212, https://doi.org/10.1016/j.advwatres.2022.104212, 2022. a, b, c
Lam, R., Sanchez-Gonzalez, A., Willson, M., Wirnsberger, P., Fortunato, M., Alet, F., Ravuri, S., Ewalds, T., Eaton-Rosen, Z., Hu, W., Merose, A., Hoyer, S., Holland, G., Vinyals, O., Stott, J., Pritzel, A., Mohamed, S., and Battaglia, P.: Learning skillful medium-range global weather forecasting, Science, 382, 1416–1421, https://doi.org/10.1126/science.adi2336, 2023. a
Larsen, A., Larsen, J. R., and Lane, S. N.: Dam builders and their works: Beaver influences on the structure and function of river corridor hydrology, geomorphology, biogeochemistry and ecosystems, Earth-Sci. Rev., 218, 103623, https://doi.org/10.1016/j.earscirev.2021.103623, 2021. a
Lawrence, D. M., Fisher, R. A., Koven, C. D., Oleson, K. W., Swenson, S. C., Bonan, G., Collier, N., Ghimire, B., Van Kampenhout, L., Kennedy, D., Kluzek, E., Lawrence, P. J., Li, F., Li, H., Lombardozzi, D., Riley, W. J., Sacks, W. J., Shi, M., Vertenstein, M., Wieder, W. R., Xu, C., Ali, A. A., Badger, A. M., Bisht, G., Van Den Broeke, M., Brunke, M. A., Burns, S. P., Buzan, J., Clark, M., Craig, A., Dahlin, K., Drewniak, B., Fisher, J. B., Flanner, M., Fox, A. M., Gentine, P., Hoffman, F., Keppel‐Aleks, G., Knox, R., Kumar, S., Lenaerts, J., Leung, L. R., Lipscomb, W. H., Lu, Y., Pandey, A., Pelletier, J. D., Perket, J., Randerson, J. T., Ricciuto, D. M., Sanderson, B. M., Slater, A., Subin, Z. M., Tang, J., Thomas, R. Q., Val Martin, M., and Zeng, X.: The Community Land Model Version 5: Description of New Features, Benchmarking, and Impact of Forcing Uncertainty, J. Adv. Model. Earth Syst., 11, 4245–4287, https://doi.org/10.1029/2018MS001583, 2019. a
Linton, J.: Is the Hydrologic Cycle Sustainable? A Historical–Geographical Critique of a Modern Concept, Ann. Assoc. Am. Geogr., 98, 630–649, https://doi.org/10.1080/00045600802046619, 2008. a, b
Linton, J.: Modern water and its discontents: a history of hydrosocial renewal, WIREs Water, 1, 111–120, https://doi.org/10.1002/wat2.1009, 2014. a
Masaki, Y., Hanasaki, N., Biemans, H., Schmied, H. M., Tang, Q., Wada, Y., Gosling, S. N., Takahashi, K., and Hijioka, Y.: Intercomparison of global river discharge simulations focusing on dam operation–multiple models analysis in two case-study river basins, Missouri–Mississippi and Green–Colorado, Environ. Res. Lett., 12, 055002, https://doi.org/10.1088/1748-9326/aa57a8, 2017. a
Melsen, L. A.: It Takes a Village to Run a Model–The Social Practices of Hydrological Modeling, Water Resour. Res., 58, e2021WR030600, https://doi.org/10.1029/2021WR030600, 2022. a
Müller Schmied, H.: Diagrams of ISIMIP global water models, Version v1.2, Zenodo [data set], https://doi.org/10.5281/zenodo.15232551, 2025a. a, b
Müller Schmied, H.: Script for automatic diagram generation for ISIMIP global water models, Version v1.2, Zenodo [code], https://doi.org/10.5281/zenodo.15230181, 2025b. a, b
Müller Schmied, H., Cáceres, D., Eisner, S., Flörke, M., Herbert, C., Niemann, C., Peiris, T. A., Popat, E., Portmann, F. T., Reinecke, R., Schumacher, M., Shadkam, S., Telteu, C.-E., Trautmann, T., and Döll, P.: The global water resources and use model WaterGAP v2.2d: model description and evaluation, Geosci. Model Dev., 14, 1037–1079, https://doi.org/10.5194/gmd-14-1037-2021, 2021. a
Nell, C., Redwine, B., Corson-Dosch, H., Riggs, C., Volentine, R., and Felts, N.: A New Take on the Water Cycle, https://waterdata.usgs.gov/blog/water-cycle-release/ (last access: 1 November 2023), 2023. a, b
O'Donnell, E. C., Netusil, N. R., Chan, F. K. S., Dolman, N. J., and Gosling, S. N.: International Perceptions of Urban Blue-Green Infrastructure: A Comparison across Four Cities, Water, 13, 544, https://doi.org/10.3390/w13040544, 2021. a
Oki, T. and Kanae, S.: Global Hydrological Cycles and World Water Resources, Science, 313, 1068–1072, https://doi.org/10.1126/science.1128845, 2006. a
Prudhomme, C., Giuntoli, I., Robinson, E. L., Clark, D. B., Arnell, N. W., Dankers, R., Fekete, B. M., Franssen, W., Gerten, D., Gosling, S. N., Hagemann, S., Hannah, D. M., Kim, H., Masaki, Y., Satoh, Y., Stacke, T., Wada, Y., and Wisser, D.: Hydrological droughts in the 21st century, hotspots and uncertainties from a global multimodel ensemble experiment, P. Natl. Acad. Sci. USA, 111, 3262–3267, https://doi.org/10.1073/pnas.1222473110, 2014. a
Reinecke, R., Müller Schmied, H., Trautmann, T., Andersen, L. S., Burek, P., Flörke, M., Gosling, S. N., Grillakis, M., Hanasaki, N., Koutroulis, A., Pokhrel, Y., Thiery, W., Wada, Y., Yusuke, S., and Döll, P.: Uncertainty of simulated groundwater recharge at different global warming levels: a global-scale multi-model ensemble study, Hydrol. Earth Syst. Sci., 25, 787–810, https://doi.org/10.5194/hess-25-787-2021, 2021. a
Schewe, J., Heinke, J., Gerten, D., Haddeland, I., Arnell, N. W., Clark, D. B., Dankers, R., Eisner, S., Fekete, B. M., Colón-González, F. J., Gosling, S. N., Kim, H., Liu, X., Masaki, Y., Portmann, F. T., Satoh, Y., Stacke, T., Tang, Q., Wada, Y., Wisser, D., Albrecht, T., Frieler, K., Piontek, F., Warszawski, L., and Kabat, P.: Multimodel assessment of water scarcity under climate change, P. Natl. Acad. Sci. USA, 111, 3245–3250, https://doi.org/10.1073/pnas.1222460110, 2014. a
Schewe, J., Gosling, S. N., Reyer, C., Zhao, F., Ciais, P., Elliott, J., Francois, L., Huber, V., Lotze, H. K., Seneviratne, S. I., Van Vliet, M. T. H., Vautard, R., Wada, Y., Breuer, L., Büchner, M., Carozza, D. A., Chang, J., Coll, M., Deryng, D., De Wit, A., Eddy, T. D., Folberth, C., Frieler, K., Friend, A. D., Gerten, D., Gudmundsson, L., Hanasaki, N., Ito, A., Khabarov, N., Kim, H., Lawrence, P., Morfopoulos, C., Müller, C., Müller Schmied, H., Orth, R., Ostberg, S., Pokhrel, Y., Pugh, T. A. M., Sakurai, G., Satoh, Y., Schmid, E., Stacke, T., Steenbeek, J., Steinkamp, J., Tang, Q., Tian, H., Tittensor, D. P., Volkholz, J., Wang, X., and Warszawski, L.: State-of-the-art global models underestimate impacts from climate extremes, Nat. Commun., 10, 1005, https://doi.org/10.1038/s41467-019-08745-6, 2019. a
Stacke, T. and Hagemann, S.: HydroPy (v1.0): a new global hydrology model written in Python, Geosci. Model Dev., 14, 7795–7816, https://doi.org/10.5194/gmd-14-7795-2021, 2021. a
Telteu, C. E., Müller Schmied, H., Gosling, S. N., Thiery, W., Pokhrel, Y., Grillakis, M., Koutroulis, A., Satoh, Y., Wada, Y., Boulange, J., Seaby, L. P., Stacke, T., Liu, X., Ducharne, A., Leng, G., Burek, P., Trautmann, T., Schewe, J., Zhao, F., Menke, I., and Shmurak, A.: Understanding each other's models: a standard representation of global water models to support intercomparison, development, and communication, in: Geophysical Research Abstracts, vol. 21, 21st EGU General Assembly, EGU2019, Proceedings from the conference, 7–12 April 2019, Vienna, Austria, p. 2, id.6212, 2019a. a
Telteu, C. E., Müller Schmied, H., Gosling, S. N., Thiery, W., Pokhrel, Y., Grillakis, M., Koutroulis, A., Wada, Y., Satoh, Y., Boulange, J., Seaby, L. P., Stacke, T., Liu, X., Tao, F., Zhai, R., Ducharne, A., Leng, G., Burek, P., Wanders, N., Trautmann, T., Mishra, V., Schewe, J., Zhao, F., Menke, I., Shmurak, A., Koudou, A., and Ahmed, A. K.: Co-design of a Water Cycle Diagram to Discover Similarities and Differences among Global Water Impact Models, in: AGU, 9–13 December 2019, San Francisco, CA, https://agu.confex.com/agu/fm19/meetingapp.cgi/Paper/498407 (last access: 11 April 2025), 2019b. a
Telteu, C.-E., Müller Schmied, H., Thiery, W., Leng, G., Burek, P., Liu, X., Boulange, J. E. S., Andersen, L. S., Grillakis, M., Gosling, S. N., Satoh, Y., Rakovec, O., Stacke, T., Chang, J., Wanders, N., Shah, H. L., Trautmann, T., Mao, G., Hanasaki, N., Koutroulis, A., Pokhrel, Y., Samaniego, L., Wada, Y., Mishra, V., Liu, J., Döll, P., Zhao, F., Gädeke, A., Rabin, S. S., and Herz, F.: Understanding each other's models: an introduction and a standard representation of 16 global water models to support intercomparison, improvement, and communication, Geosci. Model Dev., 14, 3843–3878, https://doi.org/10.5194/gmd-14-3843-2021, 2021. a, b, c, d, e, f, g, h, i, j, k, l, m, n, o, p
Thiery, W., Lange, S., Rogelj, J., Schleussner, C.-F., Gudmundsson, L., Seneviratne, S. I., Andrijevic, M., Frieler, K., Emanuel, K., Geiger, T., Bresch, D. N., Zhao, F., Willner, S. N., Büchner, M., Volkholz, J., Bauer, N., Chang, J., Ciais, P., Dury, M., François, L., Grillakis, M., Gosling, S. N., Hanasaki, N., Hickler, T., Huber, V., Ito, A., Jägermeyr, J., Khabarov, N., Koutroulis, A., Liu, W., Lutz, W., Mengel, M., Müller, C., Ostberg, S., Reyer, C. P. O., Stacke, T., and Wada, Y.: Intergenerational inequities in exposure to climate extremes, Science, 374, 158–160, https://doi.org/10.1126/science.abi7339, 2021. a
Thompson, J. R., Gosling, S. N., Zaherpour, J., and Laizé, C. L. R.: Increasing Risk of Ecological Change to Major Rivers of the World With Global Warming, Earth's Future, 9, e2021EF002048, https://doi.org/10.1029/2021EF002048, 2021. a
Van Jaarsveld, B., Wanders, N., Sutanudjaja, E. H., Hoch, J., Droppers, B., Janzing, J., Van Beek, R. L. P. H., and Bierkens, M. F. P.: A first attempt to model global hydrology at hyper-resolution, Earth Syst. Dynam., 16, 29–54, https://doi.org/10.5194/esd-16-29-2025, 2025. a
Veldkamp, T. I. E., Zhao, F., Ward, P. J., De Moel, H., Aerts, J. C. J. H., Schmied, H. M., Portmann, F. T., Masaki, Y., Pokhrel, Y., Liu, X., Satoh, Y., Gerten, D., Gosling, S. N., Zaherpour, J., and Wada, Y.: Human impact parameterizations in global hydrological models improve estimates of monthly discharges and hydrological extremes: a multi-model validation study, Environ. Res. Lett., 13, 055008, https://doi.org/10.1088/1748-9326/aab96f, 2018. a, b, c
Warszawski, L., Frieler, K., Huber, V., Piontek, F., Serdeczny, O., and Schewe, J.: The Inter-Sectoral Impact Model Intercomparison Project (ISI–MIP): Project framework, P. Natl. Acad. Sci. USA, 111, 3228–3232, https://doi.org/10.1073/pnas.1312330110, 2014. a
Zaherpour, J., Gosling, S. N., Mount, N., Schmied, H. M., Veldkamp, T. I. E., Dankers, R., Eisner, S., Gerten, D., Gudmundsson, L., Haddeland, I., Hanasaki, N., Kim, H., Leng, G., Liu, J., Masaki, Y., Oki, T., Pokhrel, Y., Satoh, Y., Schewe, J., and Wada, Y.: Worldwide evaluation of mean and extreme runoff from six global-scale hydrological models that account for human impacts, Environ. Res. Lett., 13, 065015, https://doi.org/10.1088/1748-9326/aac547, 2018. a, b, c
Zaherpour, J., Mount, N., Gosling, S. N., Dankers, R., Eisner, S., Gerten, D., Liu, X., Masaki, Y., Müller Schmied, H., Tang, Q., and Wada, Y.: Exploring the value of machine learning for weighted multi-model combination of an ensemble of global hydrological models, Environ. Model. Softw., 114, 112–128, https://doi.org/10.1016/j.envsoft.2019.01.003, 2019. a, b, c
Zhao, F., Veldkamp, T. I. E., Frieler, K., Schewe, J., Ostberg, S., Willner, S., Schauberger, B., Gosling, S. N., Schmied, H. M., Portmann, F. T., Leng, G., Huang, M., Liu, X., Tang, Q., Hanasaki, N., Biemans, H., Gerten, D., Satoh, Y., Pokhrel, Y., Stacke, T., Ciais, P., Chang, J., Ducharne, A., Guimberteau, M., Wada, Y., Kim, H., and Yamazaki, D.: The critical role of the routing scheme in simulating peak river discharge in global hydrological models, Environ. Rese. Lett., 12, 075003, https://doi.org/10.1088/1748-9326/aa7250, 2017. a