the Creative Commons Attribution 4.0 License.
the Creative Commons Attribution 4.0 License.
Three-dimensional analytical solution of self-potential from regularly polarized bodies in a layered seafloor model
Pengfei Zhang
Yi-an Cui
Jing Xie
Youjun Guo
Jianxin Liu
Jieran Liu
The self-potential (SP) method is a sensitive geophysical technique to locate seafloor polymetallic sulfide deposits. Reasonable SP forward modeling can provide a good foundation for the inversion and interpretation of the measured data. Based on the mirror image theory, we proposed a method to derive the three-dimensional analytical solution of the SP generated by regularly polarized bodies in layered media, which is explained in detail within the context of the models. We discussed the analytical solutions for different types of layered models, considering variations in the number of layers and the distribution of sources. A lab-based oxidation–reduction experiment was conducted to record SP data. These data are used to simulate the SP generated by seafloor massive sulfide (SMS) deposits and validate the previous analytical solution. The result shows that the measured SP data match the analytical solution well, demonstrating the correctness of the proposed method and the corresponding analytical solution. This approach is significant for achieving fast and precise forward modeling and inversion in SMS explorations.
- Article
(8875 KB) - Full-text XML
- BibTeX
- EndNote
Seafloor massive sulfide (SMS) deposits are an important strategic resource because of their rich gold, silver, copper, zinc, and other high-value metal ores (Mendonca, 2008). Research into submarine hydrothermal vents at the Galápagos Islands in 1977 marked the beginning of investigating the seafloor massive sulfide, which continues today (Corliss et al., 1979). More than 700 submarine hydrothermal anomalies have been identified, with over 100 regions currently recognized as having significant exploration potential (Hannington et al., 2011). The seafloor acts as a unique redox interface, where electrical conductors formed by mineral deposits generate electric currents as they traverse this boundary (Sato and Mooney, 1960; Jones, 1999). The self-potential (SP) method is a passive source method and needs no power source under natural conditions. SP surveys exhibit a distinct sensitivity to the anomalous electric currents, allowing for the rapid identification of SMS deposits. Corwin (1976) was the first to attempt to measure the SP signal in marine minerals with an offshore SP array and recorded an abnormal signal of up to 300 mV. Safipour et al. (2017) recorded both horizontal components of a known site containing an SMS occurrence and proved that the SP method is an effective exploration tool in SMS areas with hydrothermal activity. Both Kawada and Kasaya (2017) and Constable et al. (2018) observed SP signals of SMS with a deep-tow handled AUV (autonomous underwater vehicle), which further proved the SP method is useful in SMS exploration. Zhu et al. (2020) reported a deep-sea self-potential investigation at the Yuhuang hydrothermal field, where a horizontal array of electrodes detected negative self-potential anomalies (ca. −27 mV) and high electrical conductivities (up to 12 S m−1), attributed to sulfide mineralization and the corrosion of polymetallic sulfides. Su et al. (2022) used an autonomous underwater vehicle to conduct an SP survey on the ultraslow-spreading Southwest Indian Ridge with a water depth from 1300 to 2200 m. Additionally, 3D SP tomography was used to reveal an ore body with a vertical extent of 100 m. The above research suggests that the self-potential method contributes to seafloor massive sulfide surveys.
In addition to field studies, laboratory experiments have been instrumental in advancing our understanding of self-potential phenomena. Castermant et al. (2008) explored how redox potential distributions are inferred from self-potential measurements during the corrosion of buried metallic bodies in a controlled sandbox experiment. Martínez-Pagán et al. (2010) investigated the use of self-potential monitoring to detect and track the leakage and migration of a salt plume in a sandbox experiment. Fachin et al. (2012) presented a laboratory experiment exploring SP signals generated by a biogeobattery model, simulating electron transfer between organic matter and oxygen-rich sediments. Vasconcelos et al. (2014) examined the relationship between self-potential signals and streaming potentials generated by water flow in porous media using laboratory experiments. Given the complexity of layered seafloor environments, validating analytical solutions through controlled laboratory experiments is crucial. By creating a controlled, layered model structure in the laboratory, we can systematically test and validate our analytical solution under known conditions. This approach allows us to bridge the gap between theoretical modeling and measured SP data, ensuring the reliability and applicability of our method to more complex seafloor scenarios.
The forward-modeling process simulates interaction between current sources and ore bodies, which can be used to predict the self-potential distribution. This enables more precise interpretation of observed data and improves the inversion of subsurface mineral deposits' geometry and electrical properties (Minsley, 1997). The forward methods commonly used for self-potential methods include numerical solutions and analytical solutions (Xie et al., 2023; Minsley et al., 2007). Numerical solutions employ qualitative (or semi-quantitative) techniques (Wei et al., 2023), which include the finite-element method (Alarouj and Jackson, 2022; Bérubé, 2007), the finite-volume method (Sheffer and Oldenburg, 2007), the finite-difference method (Mendonca, 2008), the natural–infinite-element coupling method (Xie et al., 2020a) and the finite–infinite-element coupling method (Xie et al., 2020b). Numerical modeling applies to any complex model. Xie et al. (2021) proposed a finite–infinite-element coupling method to calculate a numerical model of the marine SP from seafloor hydrothermal sulfide deposits. However, the results of numerical methods are obtained by approximate calculation under certain conditions (Chandra et al., 2020). The conductivity structure of complex media will affect the composition of the stiffness matrix. For anomalous sources that are not uniformly polarized, their uncertainty will also impact the construction of the source term in the finite-element system equations. The complex artificial boundary conditions also limit its development. Compared to numerical methods, analytical solutions are strict formulas that can overcome the difficulties in solving the Poisson equation. In most studies, the polarization structure of ore bodies can be equivalent to special geometric shapes (Yungul, 1950; Ai et al., 2024). The analytical solution of polarized geometry body is significant in mineral exploration (Luo et al., 2023; Liu et al., 2023). Yungul (1950) discussed the analytical solution of a polarized sphere, and other researchers obtained the analytical solution of the SP anomaly along a profile passing over the center of the sphere or along the strike of a horizontal cylinder (Bhattacharya and Roy, 1981; El-Araby, 2004). Satyanarayana Murty and Haricharan (1985) discussed the analytical solution of the SP anomaly at any point on a profile perpendicular to the strike of a 2D inclined thin sheet. Further, Biswas and Sharma (2014) derived the expression of the SP anomaly analytical solution when the sheet parameters were described with respect to one edge of the sheet and in terms of the x and y coordinates of the top and bottom edges of the sheet. Dmitriev (2012) derived the analytical solution of the SP anomaly due to a thick dipping body which could represent an ore body. In marine fieldwork, it is a challenge to determine the center or strike of subsurface geometric bodies accurately. The survey lines do not typically pass directly over the anomaly. Two-dimensional analytical solutions, while useful for simplified scenarios, may fall short in large-scale forward and inverse modeling. The inferred location and polarization angle of an anomalous source based on 2D solutions may not correspond to the true source properties. Furthermore, existing analytical solutions are predominantly based on homogeneous half-space conditions, assuming a uniform subsurface medium. Unlike terrestrial environments, most current marine self-potential measurement systems struggle to achieve full ground contact (Safipour et al., 2017; Kawada and Kasaya, 2017, 2018; Constable et al., 2018). When the measurement system is positioned within seawater, deriving analytical solutions for layered media becomes crucial. To address this, we proposed a 3D analytical solution based on the mirror image method for layered SMS models. The analytical solution serves as benchmarks for numerical simulations, enabling us to identify and correct deviations in numerical approaches. Moreover, in scenarios where the analytical model is applicable, it offers faster computations compared to numerical methods. This not only enhances computational efficiency but also provides a foundation for the inversion and interpretation of measured data.
The mirror image method is based on the uniqueness theorem. It can be used to solve electrostatic field problems such as some special problems of the conductor boundary with the point source or line source (Stephenson, 1990). By introducing a virtual image dipole on the other side of the medium boundary, the boundary conditions for the electric field and potential are satisfied. This allows the originally complex multilayer medium problem to be treated as a problem in a uniform half-space medium. The uniqueness theorem states that there is only one solution in the electrostatic system when the boundary conditions are uniquely determined (Wang et al., 2019). A seafloor massive sulfide model which meets the uniqueness theorem is built as shown in Fig. 1. The xOy surface is the boundary between the sea and the air. We denote the depth of seawater D and the depth of the seafloor L. A three-dimensional coordinate system is established with the downward vertical sea level as the z axis. We use ε, μ and σ to denote the medium permittivity, magnetic conductivity and conductivity and use subscripts 0, 1 and 2 to denote air, seawater and seafloor. We assume there is an electric dipole P=Idl oriented in any direction at (x0, y0, z0, with z0 < D), and the measuring point is at (x, y, z). If z≤0, the measuring point is in the air or on the sea surface. If 0 < z < D, the measuring point is in seawater. We decompose the electric dipole, oriented in any direction, into a horizontal dipole parallel to the z=0 plane and a vertical dipole parallel to the z axis. The following derivation process is based on the example of a horizontal electric dipole Px=Ixdl.
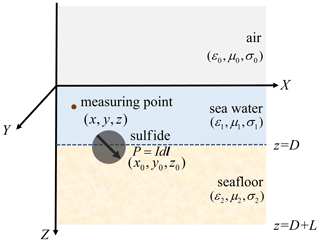
Figure 1Sketch of SMS simplified model. The model includes air, seawater and seafloor. The z axis points down towards the seafloor. The black sphere represents the simplified sulfide ore body, and the black arrow indicates its polarization direction.
2.1 Potential equivalence of the sphere and the electric dipole
An uneven double electric layer forms on the surface of the polarized sphere. The potential difference Δε varies linearly with the direction of polarization, which can be expressed as
where ΔU0 is the maximum potential difference. θ is the angle between the polarization axis and the line from the measuring point to the sphere center. In a uniformly polarized sphere, the external potential U is distributed symmetrically about the polarization axis and is independent of the azimuthal angle. This specific symmetry leads to a simplified form of the Laplace equation:
The general solution of potential can be solved by the separation of variables as
where Pn(cos θ) is the Legendre polynomial of n and An and Bn are undetermined coefficients. As R→∞, the potential outside the sphere U1→0. As R→0, the potential inside the sphere U2→0. The potentials outside (U1) and inside (U2) the sphere can be expressed as
Depending on the boundary conditions, the following can be stated:
-
There is a potential jump on both sides of the sphere. When R=r0, we have
where U1 and U2 are the potential outside and potential inside the sphere.
-
The current density normal vectors are continuous on both sides of the sphere. When R=r0, we have
It can be obtained that
For the self-potential generated by a simplified polarized body in a uniform half-space, we can directly handle the interface effects by doubling (Li, 2005; Biswas, 2021). From Eq. (5), we obtain
where θ is the polarization angle, R is the distance between the measuring point and the center of the sphere, ρ1 is the resistivity of the medium, ρ2 is the resistivity of the sphere, and r0 is the radius of the sphere. The scalar potential caused by a constant electric dipole is given by the formula
where . In Eqs. (9) and (10), R=r and P0=M. We establish that the potential distribution along the surface of a uniformly polarized sphere is equivalent to an electric dipole.
2.2 Two layers of media
When there is a two-layer medium model, we discuss the air–seawater model and the seawater–seafloor model. In the first model, we suppose the location of the image of the source is () when the measuring point is in the sea (z>0). It is assumed that the whole space is filled with seawater. We have the scalar potential of the source and the image:
where and .
If the measuring point is in the air (z≤0), the boundary condition requires that the potential in the air matches the potential just below the interface in the seawater. The key boundary conditions that need to be satisfied at the air–sea interface include the continuity of the electric potential across the interface and the continuity of the normal component of the electric field (or current density) across the interface. So the location of the image of the source is (x0, y0, z0), which coincides with the source. We suppose the whole space is filled with air. The combined dipole moment is
where .
The following can be obtained from the boundary conditions of the mirror image theory:
-
The potential of both sides of the surface is continuous (). We have
-
The current normal vectors on both sides of the interface are continuous and satisfy the boundary condition . We have . Because in the air σ0=0, only can satisfy the boundary condition, and we have
Using Eqs. (12) and (13), we obtain
The above analysis shows the horizontal dipole has two situations when it is in the air–seawater model. If the measuring point is in the sea, the location of the mirror image is (). If the measuring point is in the air, the mirror image coincides with the source () and the combined dipole is . In the seawater–seafloor model, we can perform calculations like in the first model. We suppose the electric dipole source Ixdl is at (). If we measure in the seawater, we can establish that the mirror image is at (). If the measuring point is on the seafloor, the mirror image is at (), which for the combined dipole is equivalent to . To verify the correctness of the mirror image method, we compare the 2D analytical solution in homogeneous half-space and the analytical solution of the seawater–seafloor model when the measuring lines fully contact seafloor. Based on the derivation above, the potential anomaly measured in the seawater of the seawater–seafloor model can be expressed as
The 2D analytical solution in the homogeneous half-space can be expressed as (Xie et al., 2021)
where M is the electric dipole moment, a is the polarizing angle and h0 is the depth of the electric dipole.
When σ2=σ1, the electrical conductivity of the two media (seawater and air or seawater and seafloor) becomes equal. This effectively means that there is no boundary between the two media, and the system behaves as a single uniform medium. The comparison results are shown in Fig. 2. The two solutions appear to coincide closely, indicating that the mirror image method accurately reproduces the traditional analytical solution. This proves that the mirror image method is correct in calculating the polarization self-potential.
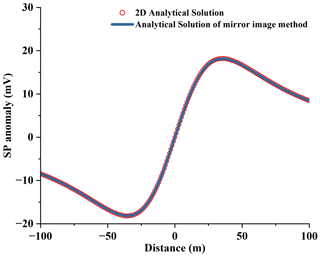
Figure 2The comparison of the analytical solution of the seawater–seafloor model. The analytical solution of the mirror image method is consistent with the 2D analytical solution.
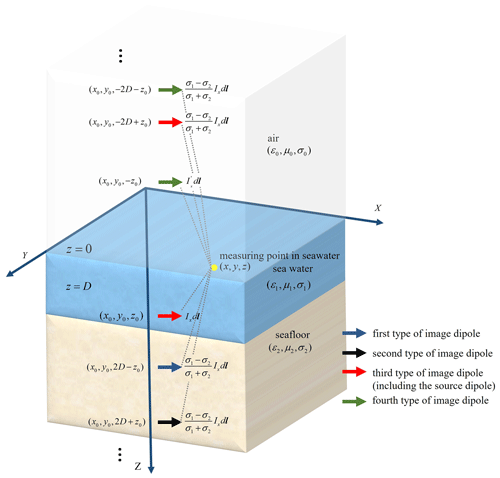
Figure 3Sketch of three layers of media in the SMS model. The yellow point represents the measuring point; the arrows in different colors represent different kinds of electric dipoles.
2.3 Three layers of media
The actual ocean environment can be reduced to a three-layer model consisting of air, seawater and seafloor. The source “generates” countless mirror images among the three media. The source point generates corresponding images in the other two media. The generated images in turn create new images in the other medium. For instance, an image dipole generated in the air by the source point will produce a second image dipole in the seafloor medium; similarly, an image dipole generated in the seafloor medium will produce another second image dipole in the air. This process continues, generating an infinite number of image dipoles. In the ocean model shown in Fig. 3, the potential produced by an electric dipole in the seafloor medium can be equivalent to the superposition of the source and an infinite number of mirror images. The potential is generated by each image point in a manner similar to that of the two-layer model, based on the same boundary conditions. Upon solving for different image points, we divide mirror images into four categories for their different locations and dipole moments. The locations and potentials of these mirror images are shown in Table 1. The coordinates of the first type of image dipole are , with the corresponding dipole moment solved as and the position vector as . The coordinates of the second type of image dipole are , with the corresponding dipole moment solved as and the position vector as . The coordinates of the third type of image dipole are , with the corresponding dipole moment solved as and the position vector as . The coordinates of the fourth type of image dipole are , with the corresponding dipole moment solved as and the position vector . The source dipole is included in the third type of image dipole (n=0). These four different types of image dipoles do not have physical differences; rather, they are classified based on their mathematical similarity observed during the actual solution process.
The scalar potential of the horizontal electric dipole Px=Ixdli at the measuring point for any dipole moment in the seafloor can be expressed as
The expression of r1m, r2m, r1n and r2n is shown in Table 1. The electric dipoles in the other two directions Py=Iydlj and Pz=Izdlk can be expressed by the same method. Therefore we can obtain the potential of the electric dipole in any direction, which can be equivalent to the superposition of the source and the countless mirror images:
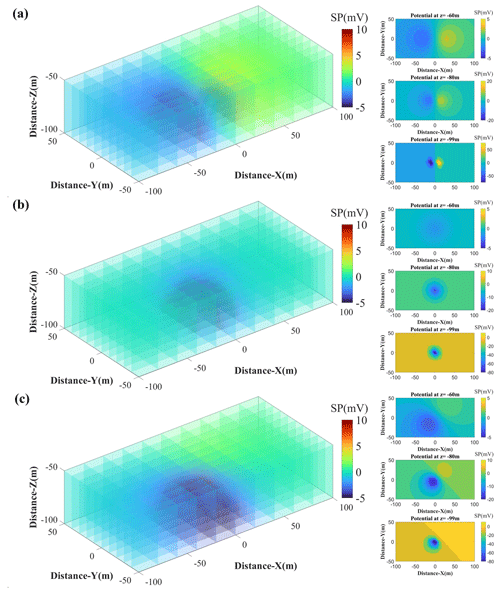
Figure 4Three-dimensional potential distribution diagrams for different orientations of electric dipoles. (a) A horizontal electric dipole and its potential slices at z = −60, z = −80 and z = −99 m. (b) A vertical electric dipole and its potential slices at z = −60, z = −80 and z = −99 m. (c) An inclined electric dipole, which is tilted 45° horizontally and 45° vertically, and its potential slices at z = −60, z = −80 and z = −99 m.
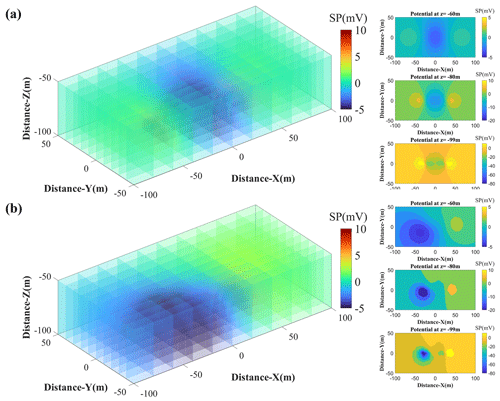
Figure 5Three-dimensional potential distribution diagrams for multi-electric dipoles. (a) Two horizontally polarized electric dipoles. (b) A horizontally polarized electric dipole and an inclined polarized electric dipole.

Figure 6(a) A sphere composed of copper and iron, with the black part being insulating tape. (b) The sphere after the experiment showing significant oxidation and rust formation on the iron at the upper part of the sphere. (c) The redox process of the sphere and its electrochemical half-cell reactions.
In this section, we perform numerical simulations of dipoles in different orientations based on the image method. Additionally, we plot slices of the self-potential signals at various depths to investigate the impact of measurement depth on the observed potential signals. We suppose the seawater depth is 100 m and the seafloor extends indefinitely along the z axis. The electric dipole simplified by spherical SMS is at the seafloor surface with location (). The conductivity of the seawater (σ1) and the seafloor (σ2) is 4 and 0.4 S m−1. The dipole moments of both the horizontal and the vertical dipoles are 3 × 10⁵ C m. An inclined dipole can be decomposed into an x-direction horizontal dipole (3 × 10⁵ C m), a y-direction horizontal dipole (3 × 10⁵ C m) and a vertical dipole (3 × 10⁴ C m). In the infinite summation, the computation will terminate when the difference between consecutive terms is less than 10−10. The three-dimensional potential distribution diagrams presented in Fig. 4 illustrate the self-potential fields generated by different orientations of electric dipoles within a medium. Each panel provides a comprehensive visualization of the potential distribution and includes specific slices at various depths (z coordinates) to offer detailed insights into the spatial variations in the potential. The horizontal electric dipole produces a positive SP anomaly and a negative SP anomaly on either side of it. The absolute values of the exceptions are equal. There is a negative anomaly caused by a vertical electric dipole. The tilted electric dipole produces a positive and a negative SP anomaly like the horizontal electric dipole. The self-potential signals increase along the polarization angle of the dipole, reflecting the combined effects of the horizontal and vertical components of the dipole's orientation. From the depth analysis, it is evident that at z = −99 m, the potential distribution displays a distinct dipole field. The horizontal electric dipole field symmetrically extends along the horizontal axis. The vertical electric dipole field is concentrated around the dipole axis. The inclined electric dipole field is oriented along the dipole's tilt direction. At z = −80 m, the potential distribution shows a more diffused pattern, and the potential is generally discernible. At z = −60 m, the potential field further attenuates. Due to the complexity of mineralization, actual seafloor polymetallic sulfide deposits often manifest as multi-source polarized bodies. To study the characteristics of self-potential signals from multi-source polarized bodies, we perform forward modeling on a multi-source polarized body model. Under the same conditions, we assume (a) anomaly source 1 is located at () and anomaly source 2 is located at (), both being horizontally polarized, and (b) anomaly source 1 is located at () and is horizontally polarized, while anomaly source 2 is located at () and is inclined polarized (with the same polarization angle as previously described). The forward-modeling results are shown in the Fig. 5. The slices demonstrate that the inclined polarization results in (scenario b) an elongated and distorted SP pattern compared to the symmetrical pattern observed in scenario (a). Overall, the self-potential signals generated by the multi-source model are more complex, making it difficult to discern the trends of subsurface anomaly sources from the self-potential signals.
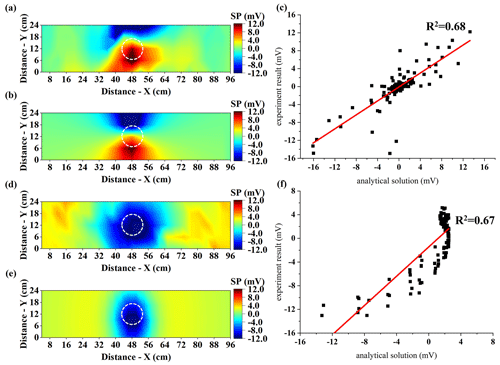
Figure 8Experimental measurements of the self-potential and comparison with forward-modeling results. The dashed white circle indicates the projection position of the sphere. (a) Measurement results for the inclined sphere. (b) Forward modeling for the inclined dipole. (c) Comparison of modeling results for the inclined model. (d) Measurement results for the vertically placed sphere. (e) Forward modeling for the vertical dipole. (f) Comparison of modeling results for the vertical model.
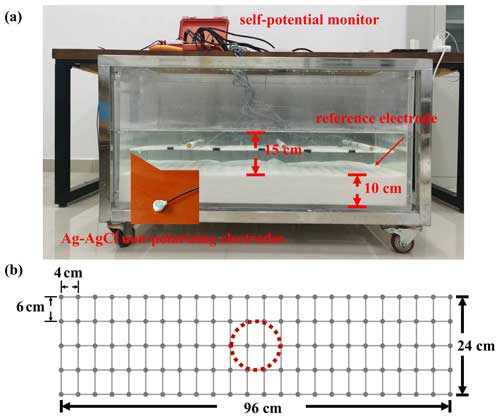
We built a three dimensional system for self-potential measurements from a laboratory perspective (shown in Fig. 7) to prove the analytical solution. A tank, with a scale of 50 cm × 50 cm × 100 cm, was filled with sand and saline water to simulate the ocean environment. A 10 cm thick layer of quartz sand (average grain size 0.4 mm, porosity 0.51) was laid at the bottom of the tank. Ag–AgCl electrodes were used due to their lower noise and more stable measurements compared to other non-polarizing electrodes (Rowan et al., 2023). A system of 120 Ag–AgCl non-polarizing electrodes, each with a diameter of 6 mm, was embedded in a 3D-printed measurement device. The electrodes were arranged in a 24 × 5 grid, with lateral spacing of 4 cm and longitudinal spacing of 6 cm. The measurement instrument used for the experiment was a multi-channel self-potential monitor with a sensitivity of 0.01 mV. To fully saturate the quartz sand at the bottom, saline water (maintaining the same salinity as seawater at 35 ‰) was injected through the bottom inlet of the tank, reaching a depth of 15 cm. After allowing the tank to settle for 4–5 d, the suspended sand in the water settled. The water level was recorded every 2 d, and saline water was added to prevent changes in salinity due to evaporation. The room temperature was maintained at 26 ± 2 °C throughout the experiment.
A sphere made of copper and iron was placed between the sand and the saline water. When a copper–iron sphere is immersed in water, the iron acts as the anode and undergoes oxidation, releasing electrons. Oxygen acts as the cathode and undergoes reduction, consuming electrons. Copper does not participate in the chemical reactions but serves as a medium for electron transport. Electrons within the sphere are transferred from the iron hemisphere to the copper hemisphere, while electrons on the exterior surface migrate from the copper hemisphere to the iron hemisphere. This process ultimately results in the formation of a self-potential. Redox reactions occurred on the surface of the sphere with the electronic transfer. Therefore we can control the polarization orientation of the electric dipole by changing the polarization angle of the sphere. We measured the SP signal when the Cu–Fe interface and the xOy plane were at an angle of 0 and 45° to simulate a vertical and an inclined electric dipole. The spheres before and after the experiment are shown in Fig. 6. Between the two sets of experiments, we thoroughly washed and polished the rusted sphere until all rust was removed. The measurement results and forward-modeling results are shown in Fig. 8. The dashed white circle marks the projection position of the sphere. The red line represents the best-fit linear regression, indicating the correlation between the experimental data and the model predictions. It can be seen that the self-potential signal characteristics of the experimental results and the forward-modeling simulations are generally consistent. The inclined sphere clearly shows potential characteristics corresponding to the polarization direction of the sphere, while the vertically placed sphere exhibits a significant negative potential characteristic at the sphere's location. We present the differences between the forward-modeling parameters and the experimental parameters in Table 2. ME and SD represent the mean error and the standard deviation of error. Since the dipole moment of the sphere is an estimated value, the coefficient of determination (R2) is 0.68 for the vertical sphere and 0.67 for the inclined sphere, which nonetheless reflects a good correlation between the experimental data and the model predictions. The expression for R2 is as follows:
where yi is the observed value, is the model-predicted value, is the mean of the observed values and n is the number of samples.
The three-dimensional (3D) self-potential (SP) analytical solution for regularly polarized bodies in a layered seafloor model is pivotal for advancing mineral exploration and enhancing the forward-modeling capabilities of the SP method. In this study, we derived a comprehensive 3D analytical solution using the mirror image method. This approach effectively reflects the self-potential signal characteristics of simply polarized bodies in layered media while also addressing the issue of field survey lines not necessarily being directly above the polarization center. By examining the equivalence between a sphere and an electric dipole, we derived formulas for two-layer and three-layer models by superposing the scalar fields generated by the source and mirror images in different media. The validity of the mirror image method was confirmed through a comparison of the two-layer model's analytical solution with the 2D analytical solution for a uniform space, demonstrating remarkable consistency. We conducted a laboratory experiment simulating a simplified SMS model. By varying the angle of a Fe–Cu sphere interface with respect to the xOy plane, we investigated different electric field distributions. The comparison between the measured data and the 3D analytical solution showed a high degree of agreement. This indicates that the analytical solution based on the mirror image method is highly effective for forward modeling in SMS exploration. This method not only provides a rigorous solution but also ensures faster computational performance compared to iterative numerical methods. Consequently, it offers a solid foundation for the inversion and interpretation of measured SP data, ultimately contributing to more accurate and efficient exploration of seafloor massive sulfide deposits.
The code is written in MATLAB, and figures are displayed with Origin software. The code and data are available at https://doi.org/10.5281/zenodo.13913302 (Zhang, 2024).
PZ is the first author of this paper, which is part of his research project. He conceived and designed the study, conducted the experiment, and wrote the paper. YC designed the study and experiment. JX and YG developed the idea for the study and performed some data analyses. JieL collected the experiment data. All authors discussed the results and revised the manuscript.
The contact author has declared that none of the authors has any competing interests.
Publisher's note: Copernicus Publications remains neutral with regard to jurisdictional claims made in the text, published maps, institutional affiliations, or any other geographical representation in this paper. While Copernicus Publications makes every effort to include appropriate place names, the final responsibility lies with the authors.
We gratefully acknowledge Rohitash Chandra and the two anonymous referees for their valuable contributions to this paper. Their thoughtful reviews have significantly improved the quality of this work. We also appreciate the editorial team for their assistance with figures, formatting, text revisions and so on.
This research has been supported by the National Natural Science Foundation of China (grant nos. 42174170, 41874145 and 72088101).
This paper was edited by Rohitash Chandra and reviewed by two anonymous referees.
Ai, H., Ekinci, Y. L., Balkaya, Ç., Alvandi, A., Ekinci, R., Roy, A., Su, K., and Pham, L. T.: Modified Barnacles mating optimizing algorithm for the inversion of self-potential anomalies due to ore deposits, Natural Resources Research, 33, 1073–1102, 2024. a
Alarouj, M. and Jackson, M. D.: Numerical modeling of self-potential in heterogeneous reservoirs, Geophysics, 87, E103–E120, 2022. a
Bérubé, A. P.: A Graphical 3D Finite Element Program for Modelling Self-Potentials Generated by Flow Through a Porous MediumA Graphical 3D FEM Program for Modelling SP, J. Environ. Eng. Geoph., 12, 185–197, 2007. a
Bhattacharya, B. and Roy, N.: A note on the use of a nomogram for self-potential anomalies, Geophys. Prospect., 29, 102–107, 1981. a
Biswas, A.: Self-potential method: theoretical modeling and applications in geosciences, vol. 10, Springer, Cham, https://doi.org/10.1007/978-3-030-79333-3, 2021. a
Biswas, A. and Sharma, S. P.: Resolution of multiple sheet-type structures in self-potential measurement, J. Earth Syst. Sci., 123, 809–825, 2014. a
Castermant, J., Mendonça, C. A., Revil, A., Trolard, F., Bourrié, G., and Linde, N.: Redox potential distribution inferred from self-potential measurements associated with the corrosion of a burden metallic body, Geophys. Prospect., 56, 269–282, 2008. a
Chandra, R., Azam, D., Kapoor, A., and Müller, R. D.: Surrogate-assisted Bayesian inversion for landscape and basin evolution models, Geosci. Model Dev., 13, 2959–2979, https://doi.org/10.5194/gmd-13-2959-2020, 2020. a
Constable, S., Kowalczyk, P., and Bloomer, S.: Measuring marine self-potential using an autonomous underwater vehicle, Geophys. J. Int., 215, 49–60, 2018. a, b
Corliss, J. B., Dymond, J., Gordon, L. I., Edmond, J. M., von Herzen, R. P., Ballard, R. D., Green, K., Williams, D., Bainbridge, A., Crane, K., and van Andel, T. H.: Submarine thermal springs on the Galapagos Rift, Science, 203, 1073–1083, 1979. a
Corwin, R.: Offshore use of the self-potential method, Geophys. Prospect., 24, 79–90, 1976. a
Dmitriev, A.: Forward and inverse self-potential modeling: a new approach, Russ, Geol, Geophys,+, 53, 611–622, 2012. a
El-Araby, H. M.: A new method for complete quantitative interpretation of self-potential anomalies, J. Appl. Geophys., 55, 211–224, 2004. a
Fachin, S. J., Abreu, E. L., Mendonça, C. A., Revil, A., Novaes, G. C., and Vasconcelos, S. S.: Self-potential signals from an analog biogeobattery model, Geophysics, 77, EN29–EN37, 2012. a
Hannington, M., Jamieson, J., Monecke, T., Petersen, S., and Beaulieu, S.: The abundance of seafloor massive sulfide deposits, Geology, 39, 1155–1158, 2011. a
Jones, E. J. W.: Marine geophysics, Wiley, New York, ISBN 978-0-471-98694-2, 1999. a
Kawada, Y. and Kasaya, T.: Marine self-potential survey for exploring seafloor hydrothermal ore deposits, Sci. Rep., 7, 1–12, 2017. a, b
Kawada, Y. and Kasaya, T.: Self-potential mapping using an autonomous underwater vehicle for the Sunrise deposit, Izu-Ogasawara arc, southern Japan, Earth Planets Space, 70, 1–15, 2018. a
Li, J.: Geoelectric field and electrical exploration, Geological Publishing House, Beijing, ISBN 7-116-04395-0, 2005. a
Liu, J., Cui, Y.-a., Xie, J., Zhang, P., and Liu, J.: Inversion of self-potential anomalies from regular geometric objects by using whale optimization algorithm, J. Cent. South Univ., 30, 3069–3082, 2023. a
Luo, Y., Du, X., Cui, Y.-a., Guo, Y., Xie, J., and Liu, J.: Inversion of self-potential source based on particle swarm optimization, Geophys. Prospect., 71, 322–335, 2023. a
Martínez-Pagán, P., Jardani, A., Revil, A., and Haas, A.: Self-potential monitoring of a salt plume, Geophysics, 75, WA17–WA25, 2010. a
Mendonca, C. A.: Forward and inverse self-potential modeling in mineral exploration, Geophysics, 73, F33–F43, 2008. a, b
Minsley, B. J.: Modeling and Inversion of Self-Potential Data, PhD thesis, Purdue University, West Lafayette, IN, 1997. a
Minsley, B. J., Sogade, J., and Morgan, F. D.: Three-dimensional source inversion of self-potential data, J. Geophys. Res.-Sol. Ea., 112, B02202, https://doi.org/10.1029/2006JB004262, 2007. a
Rowan, T. S., Karantoni, V. A., Butler, A. P., and Jackson, M. D.: 3D-printed Ag–AgCl electrodes for laboratory measurements of self-potential, Geosci. Instrum. Meth., 12, 259–270, 2023. a
Safipour, R., Hölz, S., Halbach, J., Jegen, M., Petersen, S., and Swidinsky, A.: A self-potential investigation of submarine massive sulfides: Palinuro Seamount, Tyrrhenian Sea, Geophysics, 82, A51–A56, 2017. a, b
Sato, M. and Mooney, H. M.: The electrochemical mechanism of sulfide self-potentials, Geophysics, 25, 226–249, 1960. a
Satyanarayana Murty, B. and Haricharan, P.: Nomogram for the complete interpretation of spontaneous potential profiles over sheet-like and cylindrical two-dimensional sources, Geophysics, 50, 1127–1135, 1985. a
Sheffer, M. and Oldenburg, D.: Three-dimensional modelling of streaming potential, Geophys. J. Int., 169, 839–848, 2007. a
Stephenson, U.: Comparison of the mirror image source method and the sound particle simulation method, Appl. Acoust., 29, 35–72, 1990. a
Su, Z., Tao, C., Shen, J., Revil, A., Zhu, Z., Deng, X., Nie, Z., Li, Q., Liu, L., Wu, T., Zhou, J., and Chen, D.: 3D self-potential tomography of seafloor massive sulfide deposits using an autonomous underwater vehicle, Geophysics, 87, B255–B267, 2022. a
Vasconcelos, S. S., Mendonça, C. A., and Silva, N.: Self-potential signals from pumping tests in laboratory experiments, Geophysics, 79, EN125–EN133, 2014. a
Wang, P., Chen, X., Li, J., and Wang, B.: Accurate porosity prediction for tight sandstone reservoir: A case study from North China, Geophysics, 85, 1–71, 2019. a
Wei, K., Chen, B., and Peng, J.: G&M3D 1.0: an Interactive framework for 3D Model Construction and Forward Calculation of Potential Fields, Geosci. Model Dev. Discuss. [preprint], https://doi.org/10.5194/gmd-2022-314, 2023. a
Xie, J., Cui, Y., Zhang, L., Guo, Y., Wang, J., Fanidi, M., and Liu, J.: Numerical modeling of biogeobattery system from microbial degradation of underground organic contaminant, SN Applied Sciences, 2, 1–11, 2020a. a
Xie, J., Cui, Y., Zhang, L., Ma, C., Yang, B., Chen, X., and Liu, J.: 3D forward modeling of seepage self-potential using finite-infinite element coupling method, J. Environ. Eng. Geoph., 25, 381–390, 2020b. a
Xie, J., Cui, Y., Fanidi, M., Zhang, L., Guo, Y., Luo, Y., and Liu, J.: Numerical modeling of marine self-potential from a seafloor hydrothermal ore deposit, Pure Appl. Geophys., 178, 1731–1744, 2021. a, b
Xie, J., Cui, Y., Liu, J., Guo, Y., Zhang, L., Luo, Y., and Zhang, P.: A review on theory, modeling, inversion, and application of self-potential in marine mineral exploration, T. Nonferr. Metal. Soc., 33, 1214–1232, 2023. a
Yungul, S. H.: Interpretation of spontaneous polarization anomalies caused by spheroidal ore bodies, Geophysics, 15, 237–246, 1950. a, b
Zhang, P.: 3d_theorical_solution, Zenodo [code and data set], https://doi.org/10.5281/zenodo.13913302, 2024. a
Zhu, Z., Tao, C., Shen, J., Revil, A., Deng, X., Liao, S., Zhou, J., Wang, W., Nie, Z., and Yu, J.: Self-potential tomography of a deep-sea polymetallic sulfide deposit on Southwest Indian Ridge, J. Geophys. Res.-Sol. Ea., 125, e2020JB019738, 2020. a
- Abstract
- Introduction
- The mirror image method of electric dipole
- Analytical calculation of electric dipole potential distribution in SMS
- An experimental verification of the 3D analytical solution of the mirror image method
- Conclusions
- Code and data availability
- Author contributions
- Competing interests
- Disclaimer
- Acknowledgements
- Financial support
- Review statement
- References


