the Creative Commons Attribution 4.0 License.
the Creative Commons Attribution 4.0 License.
An improved representation of aerosol in the ECMWF IFS-COMPO 49R1 through the integration of EQSAM4Climv12 – a first attempt at simulating aerosol acidity
Swen Metzger
Vincent Huijnen
Jason E. Williams
Johannes Flemming
The atmospheric composition forecasting system used to produce the Copernicus Atmosphere Monitoring Service (CAMS) forecasts of global aerosol and trace gas distributions, the Integrated Forecasting System (IFS-COMPO), undergoes periodic upgrades. In this study we describe the development of the future operational cycle 49R1 and focus on the implementation of the thermodynamical model EQSAM4Clim version 12, which represents gas–aerosol partitioning processes for the nitric acid–nitrate and ammonia–ammonium couples and computes diagnostic aerosol, cloud, and precipitation pH values at the global scale. This information on aerosol acidity influences the simulated tropospheric chemistry processes associated with aqueous-phase chemistry and wet deposition. The other updates of cycle 49R1 concern wet deposition, sea-salt aerosol emissions, dust optics, and size distribution used for the calculation of sulfate aerosol optics. The implementation of EQSAM4Clim significantly improves the partitioning of reactive nitrogen compounds, decreasing surface concentrations of both nitrate and ammonium in the particulate phase, which reduces PM2.5 biases for Europe, the US, and China, especially during summertime. For aerosol optical depth there is generally a decrease in the simulated wintertime biases and for some regions an increase in the summertime bias. Improvements in the simulated Ångström exponent are noted for almost all regions, resulting in generally good agreement with observations. The diagnostic aerosol and precipitation pH calculated by EQSAM4Clim have been compared to ground observations and published simulation results. For precipitation pH, the annual mean values show relatively good agreement with the regional observational datasets, while for aerosol pH the simulated values over continents are quite close to those simulated by ISORROPIA II. The use of aerosol acidity has a relatively smaller impact on the aqueous-phase production of sulfate compared to the changes in gas-to-particle partitioning induced by the use of EQSAM4Clim.
The Copernicus Atmosphere Monitoring Service (CAMS) provides daily global analysis and 5 d forecasts of atmospheric composition (aerosols, trace gases, and greenhouse gases) (Peuch et al., 2022). CAMS is coordinated by the European Centre for Medium-Range Weather Forecasts (ECMWF) and uses, for its global component, the Integrated Forecasting System (IFS), with extensions to represent aerosols as well as trace and greenhouses gases, which is called “IFS-COMPO” (also previously known as “C-IFS”; Flemming et al., 2015). In this article, we focus on the version of IFS-COMPO that simulates aerosols and trace gases. IFS-COMPO is composed of IFS(AER) for aerosols, as described in Rémy et al. (2022), while the atmospheric chemistry is based on the chemistry module as described in Williams et al. (2022) for the troposphere and Huijnen et al. (2016) for the stratosphere. Different versions of IFS-COMPO have been used to produce the MACC Reanalysis (Inness et al., 2013), the CAMS interim reanalysis (Flemming et al., 2017), and the CAMS reanalysis (Inness et al., 2019). Here, we primarily focus on tropospheric processes and use a version of IFS-COMPO without the application of stratospheric chemistry. This model configuration is also referred to as IFS(CB05). Please note, however, that in the operational context IFS-COMPO including stratospheric chemistry has been used since the operational implementation of cycle 48R1 on 27 June 2023 (hereafter referred to as CY48R1). All of the components of CY48R1 IFS-COMPO are described in detail in the publicly available IFS documentation (ECMWF, 2023), available at https://www.ecmwf.int/en/elibrary/81374-ifs-documentation-cy48r1-part-viii-atmospheric-composition (last access: 17 October 2024). Besides its use in CAMS, a different version of IFS(AER) has been adopted within the Météo-France CNRM climate model system (Michou et al., 2015); an older version of IFS-COMPO, based on cycle 43R3, is also provided as part of an OpenIFS release (Huijnen et al., 2022), while the release of OpenIFS based on cycle 48R1 has been available since January 2024 (https://confluence.ecmwf.int/display/OIFSUF/OpenIFS+48r1+release, last access: 17 October 2024).
IFS-COMPO has been continually updated over time, with yearly or twice-yearly upgrades of the operational forecasting system that followed and included upgrades of the operational IFS. The code revisions that are integrated into the operational version of IFS-COMPO must satisfy the two conditions (one qualitative, one quantitative) that they bring the model closer to “physical” reality, i.e., that more processes and/or species are represented, and that they improve the skill scores of the main products against observations. This article describes an upgrade of IFS-COMPO that will be implemented in cycle 49R1 (hereafter referred to as CY49R1), aimed at a better representation of aerosol composition and gas–particle partitioning processes, through the implementation of the thermodynamical model EQSAM4Clim (Metzger et al., 2016) to allow the representation of aerosol, cloud, and precipitation acidity in the IFS-COMPO chemical forecasting system. The other aerosol modeling updates of CY49R1 are also briefly introduced. CY49R1 is planned to become operational in November 2024.
In this article we focus on the update of the representation of aerosol, cloud, and precipitation acidity in the IFS-COMPO chemical forecasting system. With increasing complexity of the representation of atmospheric aerosols in air pollution, weather, and climate models, derived properties, such as the aerosol acidity, are receiving more and more attention. The solution's acidity is impacted by the aerosol composition and the water content, which itself depends on aerosol composition and meteorology. The recent literature review of Pye et al. (2020) summarizes the current state of knowledge on the acidity of atmospheric condensed phases, specifically particles and cloud droplets, while Tilgner et al. (2021) and Ault (2020) review the current state of knowledge with a focus on the acidity of aerosol and cloud systems, which involves both inorganic and organic aqueous-phase chemistry. In addition, Shah et al. (2020) address the global modeling of aerosol, cloud, and precipitation acidity, as well as acid inputs to ecosystems using the GEOS-Chem chemistry transport model (CTM). Nault et al. (2021) highlight the challenges of simulating aerosol acidity, showing that models often underestimate aerosol acidity in remote regions. Finally, Karydis et al. (2021) address how alkaline compounds control atmospheric aerosol acidity in the EMAC model, where alkaline compounds, notably ammonium (), and to a lesser extent crustal cations, e.g., Ca2+, buffer aerosol pH at the global scale. In the review of Tilgner et al. (2021) it is concluded that although many advances have been made in our understanding of acidity-driven and acid-catalyzed chemical processes, many open issues still need to be addressed for a better understanding of the impact on key pollutants. More recently, a more complex representation of aerosol acidity and its impact on multiphase chemistry has been introduced in the EC-EARTH Earth system model, as described in Myriokefalitakis et al. (2022).
Ammonium nitrate (NH4NO3) is a key component of anthropogenic aerosols and represents a growing share of particulate matter with an aerodynamical diameter below 2.5 µm (PM2.5), especially in light of the decreasing trend in sulfur dioxide (SO2) emissions (Bellouin et al., 2011). In IFS-COMPO, NH4NO3 is formed through gas–particle partitioning processes, parameterized from Hauglustaine et al. (2014), while other compounds are formed from heterogeneous reactions on desert dust and sea-salt particles (see Rémy et al., 2019, and ECMWF, 2023, for more details). The implementation of the thermodynamical model EQSAM4Clim aims to bring a more realistic representation of the production of and through both gas-to-particle processes and heterogeneous reactions, which in turn should improve the simulated PM2.5 and aerosol optical depth (AOD), two key CAMS forecast products. EQSAM4Clim also provides an estimate of the aerosol water and aerosol acidity, which allows the diagnosis of the acidity in aerosols, clouds, and precipitation. This information can then be used in the relevant multiphase chemistry processes – namely aqueous-phase chemistry and wet deposition (via the solubility computation). A better representation of gas–particle partitioning is also expected to bring an improvement in the simulated sulfur (S) and nitrogen (N) deposition terms, which are set to become new products of the CAMS portfolio because of their impact on pristine environments. Increased N deposition can cause an exceedance of critical loads in terms of the cumulative annual deposition on ecosystems (Sun et al., 2020). Elevated S and N deposition is also associated with a host of environmental issues such as acidification and eutrophication of the terrestrial system, while increasing nitrogen deposition could enhance the carbon uptake by land processes (Reay et al., 2008), similarly to phosphorus deposition (Wang et al., 2017).
Briefly, the contents of this article are as follows. In Sect. 2 we describe the integration of EQSAM4Clim version 12 into IFS-COMPO, how it has been coupled to other components of the system, and the new pH diagnostics that have been implemented. Other atmospheric composition model updates of CY49R1 are also presented. In Sect. 3 we compare IFS-COMPO simulations for 2019 using cycles 48R1 and pre-49R1 (i.e., including atmospheric composition model updates planned for CY49R1, on top of CY48R1) in terms of budgets and model fields. Section 4 presents comparisons of budgets and of model output between cycle 48R1 and pre-49R1. In Sect. 5, the simulated AOD and PM2.5 are evaluated. We also focus on the impact of EQSAM4Clim on the oxidized and reduced-N chemistry cycles and on the subsequent impact on the simulated surface concentration of oxidized and reduced-nitrogen species as well. The new aerosol and precipitation pH diagnostics from IFS-COMPO are also compared against selected validation datasets that have been recently published (Zhang et al., 2021, and Rosanka et al., 2024) and against routine monitoring networks over Europe, Asia, and the US.
2.1 General introduction to IFS-COMPO and IFS(AER) before CY49R1
The default tropospheric chemistry scheme in IFS-COMPO, also referred to as “IFS(CB05)”, is a reduced version of that developed by Yarwood et al. (2005) as described in Williams et al. (2013) and Huijnen et al. (2019) and further updated in Williams et al. (2022) to expand on NOy species and isoprene chemistry. Photolysis is calculated online using the modified band approach as developed in Williams et al. (2012) and embedded in IFS-COMPO, where aerosol effects are included in the calculation of photolysis rates. In this section, a description of the general features of cycle 48R1 IFS-COMPO is proposed. For further details, we refer the reader to the official documentation of cycle 48R1 IFS-COMPO, available at https://www.ecmwf.int/en/elibrary/81374-ifs-documentation-cy48r1-part-viii-atmospheric-composition (last access: 17 October 2024).
The aerosol component of IFS-COMPO is a bulk aerosol scheme for all species except sea-salt aerosol and desert dust, for which a sectional approach is preferred, with three bins for each of these two species. As such, it is often denoted as a “bulk–bin” scheme; IFS(AER) is derived from the Laboratoire d'Optique Atmosphérique/Laboratoire de Météorologie Dynamique – Zoom (LOA/LMDZ) model (Boucher et al., 2002; Reddy et al., 2005) and uses a mass mixing ratio as the prognostic variable of the aerosol tracers. Since the implementation of operational cycle 48R1 in June 2023, the prognostic species have been sea salt, desert dust, organic matter (OM), black carbon (BC), sulfate, , , and secondary organics (secondary organic aerosol – SOA). IFS(AER) is by default coupled with the tropospheric chemistry of IFS-COMPO.
Desert dust is represented with three size bins, with radius bin limits at 0.03, 0.55, 0.9, and 20 µm. Sea-salt aerosol is also represented with three size bins, with radius bin limits of 0.03, 0.5, 5, and 20 µm at 80 % relative humidity. All of the sea-salt aerosol parameters (concentration, emission, deposition) are expressed at 80 % relative humidity; this is in contrast to the other aerosol species in IFS(AER), which are expressed as a dry mixing ratio. The sea-salt aerosol mass mixing ratio, as well as the emissions, burden, and sink diagnostics, needs to be divided by a factor of 4.3 to convert to a dry mass mixing ratio in order to account for the hygroscopic growth and change in particle density. There is no mass transfer between bins for dust or sea salt.
The OM and BC aerosol species consist of their hydrophilic and hydrophobic fractions, with the aging processes transferring mass from the hydrophobic to hydrophilic components. Sulfate aerosol is represented by one prognostic variable. The species consist of two prognostic variables that represent fine produced by gas–particle partitioning (hereafter denoted NO3_1) and coarse produced by heterogeneous reactions of nitric acid on dust and sea-salt particles (denoted NO3_2). Finally, the secondary organic species consist of two tracers that represent biogenic and anthropogenic secondary organic aerosol (SOA). In all, the aerosol component of IFS-COMPO is thus composed of 16 variables in its operational configuration, which allows for a relatively limited consumption of computing resources.
One of the most important features of the recent upgrades of IFS-COMPO is the increasing integration of aerosol and chemistry. The sulfur and nitrogen cycles are represented across the aerosol module (for particulate species) and the chemistry module (for gaseous species and the production rate of particulate sulfate). The aerosol module provides supplementary input to the chemistry in order to better represent heterogeneous reactions and the impact of aerosols on photolysis rates.
The production scheme of and through gas–particle partitioning processes and of from heterogeneous reactions on dust and sea-salt particles is described in Rémy et al. (2019) and has been adapted from Hauglustaine et al. (2014). The gas–particle partitioning part uses the first version of the EQuilibrium Simplified Aerosol Model (EQSAM; Metzger et al., 2002). These parameterizations use meteorological parameters as input, which is provided by IFS, as well as the gaseous precursors nitric acid (HNO3) and ammonia (NH3), which are provided by the chemistry module. The gas–particle partitioning scheme estimates and production through the neutralization of HNO3 by the NH3 remaining after neutralization by sulfuric acid. The formation of from heterogeneous reactions of HNO3 with calcite (a component of dust aerosol) and sea-salt particles is accounted for.
IFS-COMPO is run operationally at a horizontal resolution of TL511 (40 km grid cell), with 137 levels over the vertical and a time step of 900 s. A definition of the vertical levels can be found at https://confluence.ecmwf.int/display/UDOC/L137+model+level+definitions (last access: 12 September 2024). Prognostic aerosols are used as an input of the IFS radiation scheme to compute the direct radiative effect of aerosols. IFS uses a semi-implicit semi-Lagrangian (SL) advection scheme (Hortal, 2002). It is computationally efficient but does not conserve the tracer mass when the flow is convergent or divergent, which is often the case in the presence of orographic features. To compensate for this, mass fixers are used for greenhouse gases (Agusti-Panareda et al., 2017), for trace gases (Diamantakis and Flemming, 2014), and for aerosols.
2.2 Description of EQSAM4Clim version 12 and integration into IFS-COMPO for CY49R1
For the integration of EQSAM4Clim into IFS-COMPO we use version 12 (v12), which includes a revised calculation of aerosol acidity. This version of EQSAM4Clim is described in detail in Metzger et al. (2024); its main features are summarized below. The overall gas–liquid–solid partitioning and parameterization for calculating aerosol water uptake are identical to that described in Metzger et al. (2016). In contrast to the original version of EQSAM (Metzger et al., 2002), EQSAM4Clim is based on a compound-specific single-solute coefficient (νi), which was introduced in Metzger et al. (2012) to accurately parameterize the single-solution hygroscopic growth, considering the Kelvin effect. This νi approach accounts for the water uptake of concentrated nanometer-sized particles up to dilute solutions, i.e., from the compound's relative humidity of deliquescence (RHD) up to supersaturation, using the Köhler theory (Köhler, 1936). EQSAM4Clim extends the νi approach to multicomponent mixtures, including semi-volatile compounds and major crustal elements such as , Na+, and Mg2+. A strength of EQSAM4Clim is that all gas–liquid–solid aerosol-phase partitioning and water uptake, including major mineral cations, can be solved analytically without iterations and numerical noise, making EQSAM4Clim suited for climate and high-resolution numerical weather prediction (NWP) applications.
EQSAM4Clim calculates the equilibrium aerosol composition and aerosol-associated water mass (AW) through the neutralization of anions by cations, which yields numerous salt compounds. All salt compounds (except calcium sulfate, CaSO4) partition between the liquid and solid aerosol phase, depending on atmospheric temperature (T), relative humidity (RH), AW, and the T-dependent RHD of (i) single-solute compound solutions or (ii) mixed salt solutions (Metzger et al., 2012). EQSAM4Clim outputs the aerosol pH along with the concentration of aerosol species (lumped cations, anions), as well as the AW. An application of EQSAM4Clim to AW and aerosol optical depth (AOD) calculations has been presented in Metzger et al. (2018).
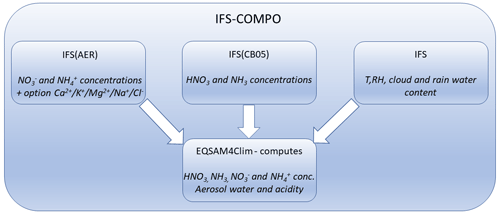
A schematic of the integration of EQSAM4Clim into IFS-COMPO is shown in Fig. 1. EQSAM4Clim takes the following as input for each model time step and within a given grid box:
- (i)
T and RH as provided by the meteorological component of IFS-COMPO;
- (ii)
the aerosol precursor gases, i.e., major oxidation products of natural and anthropogenic air pollution represented by NH3 and HNO3 from the tropospheric chemistry module IFS(CB05); and
- (iii)
the ionic aerosol concentration lumped (liquid+solid) anions sulfate (), nitrate (), and chloride (Cl−), as well as the lumped (liquid+solid) cations ammonium (), sodium (Na+), potassium (K+), magnesium (Mg2+), and calcium (Ca2+) as provided by IFS(AER).
It should be noted that input values for the application of EQSAM4Clim, i.e., HNO3 and , NH3 and , and , are prognostic species directly provided by IFS-COMPO, while the mineral anions (Cl−) and cations (Na+, K+, Mg2+, and Ca2+) must be derived from the existing prognostic tracers. HCl is not included in the EQSAM4Clim inputs as the CB05 scheme currently does not include tropospheric halogen chemistry. For Ca2+, the approach chosen is the same as that described in Rémy et al. (2019): an experimental version of IFS-COMPO that decomposes dust into a simplified mineralogical composition has been developed and is used to compute a climatology of airborne calcite. This experimental IFS-COMPO version uses as an input the dataset of soil mineralogical composition of Journet et al. (2014) to provide an estimate of the calcite content of airborne dust. Geographically dependent scaling factors derived from this climatology are used to estimate the calcium content of dust, which varies between 5 %–10 % for fine and coarse dust and 2 %–5 % for super-coarse dust. For Cl− and Na+ input is derived from sea-salt aerosol assuming the mean mass fractions of 55.0 % Cl− and 30.6 % Na+ from dry sea-salt aerosol mass, following Myriokefalitakis et al. (2022). Assuming 80 % relative humidity over the ocean, this translates into 12.8 % and 7.1 % of the mass of sea-salt aerosol at 80 % RH. The contribution of Na+, K+, and Mg2+ from desert dust is derived from desert dust tracers using constant scaling factors of 1.2 %, 1.5 %, and 0.9 %, following the approach in EC-Earth (Myriokefalitakis et al., 2022).
2.2.1 Computation of pH diagnostics
EQSAM4Clim calculates the pH of the solution, as governed by the H+, from the electro-neutrality in solution after neutralization of all available anions by all available cations by additionally accounting for the auto-dissociation of water but without the dissolution and dissociation of aerosol precursor gases (e.g., SO2) and weak acids (e.g., HCOOH), as this is considered in the default aqueous-phase chemistry module of IFS-COMPO. Based on the RHD of the single solutes in the (mixed) solution, liquid–solid partitioning is calculated, whereby all compounds for which the RH is below the RHD are assumed to be precipitated such that a solid phase and liquid phase can co-exist. The liquid–solid partitioning is strongly influenced by mineral cations and, in turn, largely determines the aerosol pH, which is also impacted by the estimated amount of AW. Because some IFS-COMPO aerosol species, such as black carbon, organic matter, and secondary organics, are not used in EQSAM4Clim, an amount of diagnostic aerosol water computed using relative-humidity-dependent growth factors for these aerosol species is used as an input to EQSAM4Clim to contribute to the estimation of aerosol acidity. This diagnostic aerosol water input of EQSAM4Clim also includes water from the coarse and super-coarse sea-salt aerosol. More detail on how aerosol, cloud, and precipitation pH is computed can be found in Metzger et al. (2024). Please note that the chemical domain-dependent correction factor described in Metzger et al. (2024) is not used in the implementation of EQSAM4Clim v12 in the IFS, although it is planned to include it in later IFS-COMPO upgrades.
The cloud and precipitation pH for each grid box is computed as the cumulative contribution of aerosol acidity, as computed by EQSAM4Clim, and of dissolved CO2, methane sulfonic acid (MSA), , and SO2. In CY49R1, the [H]+ contributions from formic acid (HCOOH) and acetic acid (CH3COOH) are also included.
2.2.2 Coupling with aqueous-phase chemistry
The pH of cloud droplets affects the uptake of trace gases in cloud droplets and hence aqueous-phase chemistry in IFS(CB05). With regard to aqueous-phase chemistry, the diagnostic of cloud pH is used to compute the fraction of gaseous SO2 dissolved in the aqueous phase, which can subsequently be oxidized to . More precisely, the cloud pH diagnostic is used to determine the fraction of dissolved SO2, which exists as SO2, H2O, bisulfite (), and bisulfate (), using pKa dissociation equilibrium values of 1.2 and 7.2. The oxidation to is then calculated as the sum of the fraction of S(IV) in the form reacting with O3 and H2O2, the two principal routes for aqueous-phase production using established reaction rate data (Seinfeld and Pandis, 2006). The transition metal catalyzed routes for S(IV) oxidation involving iron and magnesium are neglected as no cations or anions are included in solution, where is it considered less important than the other chemical production terms (Angle et al., 2021) and would require a significant upgrade to the aqueous-phase chemistry component, which is not the focus of this work. The subsequent change in the gas phase for SO2, NH3, O3, H2O2, , and is then accounted for once the oxidation step has occurred.
In-cloud and below-cloud scavenging of SO2 and NH3 is also affected by the acidity of cloud and rainwater through the use of an effective Henry solubility following Seinfeld and Pandis (2006) using a fixed value of pH. Until CY47R3 this value was set to a pH of 5.5 globally. In CY48R1, this has been updated to a pH of 5.6 (over ocean) and pH of 5 (over land). In CY49R1, the diagnostic precipitation pH as provided by EQSAM4Clim is used to compute the effective Henry solubility of SO2 and NH3.
The impact of the use of updated cloud acidity in aqueous chemistry and rain acidity in the IFS-COMPO wet deposition is found to be small in general and smaller than the impact of other contributions, in particular of the changes in gas–particle partitioning brought by the use of EQSAM4Clim. Hence, no specific discussion of this has been included, as we chose to focus on model upgrades that have the largest impact on simulated fields.
2.3 Other IFS-COMPO updates included in CY49R1
In this subsection we describe additional aerosol modeling changes implemented in cycle 49R1, which also affect the results of CY49R1 model simulations presented in Sect. 3 compared to the default CY48R1 configuration. These updates are described in less detail than the implementation of EQSAM4Clim; for an exhaustive description we refer the reader to the future operational cycle 49R1 documentation, which will be released simultaneously with the operational implementation of cycle 49R1.
2.3.1 Updates to wet deposition
In CY48R1, the aerosol and chemistry wet deposition routines of IFS-COMPO are distinct, but both include a scheme adapted from Luo et al. (2019), which is used operationally. In order to ensure a consistent approach between aerosol and trace gas wet deposition, as well as to facilitate the code maintenance, the various implementations of the native chemistry and aerosol wet deposition routine have been merged into a single routine that is used to represent the wet deposition processes for both aerosols and chemical species. This new routine is called with either the chemical tracers or aerosol tracers as an input. Similarly to CY48R1 and before, it is called twice with input from large-scale and convective precipitation. In the convective precipitation case, the assumed precipitation fraction has been harmonized to a value of 0.05 (in cycle 48R1, 0.1 was used for chemistry scavenging and 0.05 for aerosol scavenging). The following upgrades have additionally been included for aerosol wet deposition.
-
The aerosol activation parameterization of Verheggen et al. (2007) is implemented. The authors provide an estimate of the fraction of aerosols that can be scavenged through in-cloud processes as a function of temperature. This parameterization is used in mixed clouds, i.e., for temperatures below the freezing point and above 233 K. For temperatures above 0 °C, the consistency of the parameters that determine the fraction of aerosols that are subject to in-cloud wet deposition with the results of the Verheggen parameterization has been verified.
-
For below-cloud scavenging of aerosol species, the scavenging rates have been updated to more closely follow the particle size dependency of Croft et al. (2009). This involved updating the below-cloud scavenging parameters that describe the efficiency with which aerosols are washed out by rain and snow, depending on the species and the assumed size distribution, as well as implementing a below-cloud scavenging rate that is dependent on rain and snow intensity. This results in a significant increase in simulated below-cloud scavenging, which is consistent with results of Croft et al. (2009).
Both aerosol wet deposition and chemistry wet deposition use the re-evaporation scheme from de Bruine et al. (2018).
2.3.2 Updates to desert dust aerosol
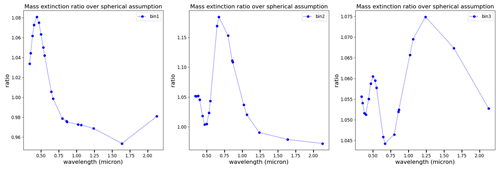
In CY49R1, hydrophilic growth for dust has been introduced, following Chen et al. (2020), using a growth factor that increases linearly from 0.8 % at 10 % RH to 7.4 % at 95 % RH. The hydrophilic growth is used in the desert dust optical properties, as well as in dry deposition. It is well known that desert dust is composed of mineralogical components and aggregates with very different shapes, which means that the assumed spherical shape of dust used in the Mie code (Wiscombe, 1980) that computes the aerosol optical properties offline (mass extinction, asymmetry parameter, single-scattering albedo, and lidar ratio) is clearly invalid. Using the online tool MOP-SMAP (Gasteiger and Wiegner, 2018), a scaling factor that accounts for the effect of asphericity has been computed, which is applied to the spherical desert dust optical properties computed with the Mie code. The assumed shape of the desert dust particles is derived from Kandler et al. (2009): a prolate spheroid with an aspect ratio of 1.6. The ratio of non-spherical to spherical dust mass extinction as a function of wavelength is shown in Fig. 2 for each of the three dust bins. The implementation of non-spherical dust in cycle 49R1 leads to an increase in the dust mass extinction of 5 %–20 % in the ultraviolet and visible parts of the spectrum for the fine and coarse bins and of 5 %–10 % for the super-coarse bin.
2.3.3 Updates to sea-salt aerosol
Since CY47R1, the sea-salt aerosol emissions have been computed from the simulated whitecap fraction following Monahan et al. (1986), and the whitecap fraction is estimated from the surface wind speed and sea surface temperature using the approach of Anguelova and Webster (2006), as detailed in Rémy et al. (2022). However, the Monahan et al. (1986) parameterization is applicable to particles between 0.8 and 8 µm diameter, which means that a large fraction of the coarsest sea-salt aerosol bin is outside of the applicability range of this parameterization. Following the results of Remy and Anguelova (2021), the sea-spray size distribution of Gong (2003) has been implemented to compute sea-salt aerosol emissions from the whitecap fraction. The computation of the whitecap fraction itself is unchanged compared to CY47R1 and CY48R1 and uses the Albert et al. (2016) formulation. The flux of emitted sea-salt aerosols is expressed as a function of whitecap fraction W and particle size Dp as
where
Here, θ is an adjustable parameter, which Gong (2003) introduced to fit the sea-spray source function (SSSF) values to field observations of O'Dowd et al. (1997).
2.3.4 Update of the PM formulae
Particulate matter smaller than 1, 2.5, and 10 µm is an important output of IFS-COMPO. In CY49R1, the assumed size distribution used to compute these diagnostic outputs has been updated to be consistent with the one assumed in the aerosol optics. This results in significantly higher PM1 and PM2.5 and has a small impact on PM10. PM1, PM2.5, and PM10 are computed with the following formulae that use the surface mass mixing ratio from each aerosol tracer as an input, denoted as for sea-salt aerosol; for desert dust; [NI1,2] for nitrate; and , and [SOA] for organic matter, black carbon, sulfate, nitrate, ammonium, and SOA, respectively.
Here, ρ is the air density at surface. The sea-salt aerosol tracers are divided by 4.3 to transform the mass mixing ratio at 80 % ambient relative humidity to a dry mass mixing ratio.
2.3.5 Update of the aerosol optics
The aerosol optical properties (mass extinction, single-scattering albedo, and asymmetry parameter) are computed offline using a Mie code, as described in ECMWF (2023). The assumed size distribution used for the sulfate optical properties has been updated, with a modal radius increase from 0.0355 to 0.11 µm and a geometric standard deviation decrease from 2 to 1.6. Also, a 1.375 scaling factor that was applied to sulfate mass extinction in previous cycles, which accounted for the difference in molar mass between ammonium sulfate and sulfate, has been removed in cycle 49R1, as ammonium is represented as a specific tracer with its own optics. This led to a significant decrease in the sulfate mass extinction in cycle 49R1.
3.1 Experiments
In this work we consider three cycling forecast experiments without data assimilation, denoted CY48R1, CY49R1, and CY49R1_NOE4C. The experiments simulated the period from 1 December 2018 to 31 December 2019, with December 2018 used as a spin-up period. Three similar experiments, which we will refer by the same names, covered the period from 1 December 2016 to 31 December 2017 in order to evaluate them against observations not available in 2019. The resolution used is the current operational resolution of TL511 with 137 vertical levels. CY48R1 uses a configuration similar to that of the operational CY48R1, while CY49R1 integrates all chemistry and aerosol modeling updates of IFS-COMPO intended for the operational CY49R1, including the use of EQSAM4Clim and its coupling to tropospheric chemistry processes but otherwise using a version of the meteorological core of IFS-COMPO identical to the CY48R1 experiment. This means that the differences between the two experiments come only from atmospheric composition modeling updates and not from changes to the meteorological part of the IFS or changes in the emissions. The simulated meteorological fields can, however, differ to some extent between the simulations because of the interaction between radiation and aerosols. The 49R1_NOE4C experiment deactivates the use of EQSAM4Clim and reverts to the application of the equilibrium model available in CY48R1 (Rémy et al., 2022). All experiments use the same emissions: anthropogenic emissions from the CAMS_GLOB_ANT v5.3 dataset (Soulie et al., 2024), biomass burning emissions from the Global Fire Assimilation System version 1.4 (GFAS, Kaiser et al., 2012), aviation emissions from CAMS-GLOB-AIR v1.1, biogenic emissions from the CAMS-GLOB-BIO v3.1 inventory (Sindelarova et al., 2021), and natural emissions of dimethyl sulfide (DMS) over the ocean from CAMS-GLOB-OCE v3.1. All of the experiments use only the tropospheric chemistry component of IFS-COMPO; no explicit stratospheric chemistry is included, as used operationally in CAMS. All simulations are run without data assimilation to better assess the impact of modeling changes.
4.1 Changes in global surface concentrations
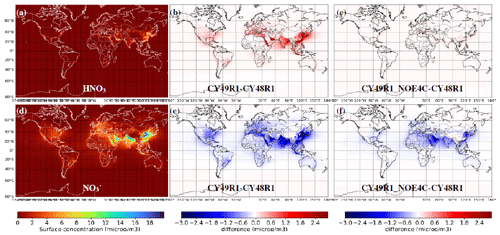
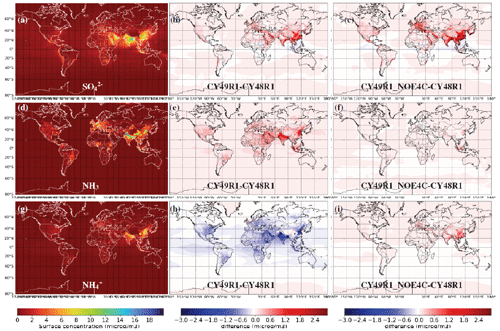
Figures 3 and 4 show the mean annual global surface concentrations for 2019 from CY48R1 for , HNO3, , NH3, and , along with the absolute differences when compared to the other simulations. In general the most significant changes in precursors and particles occur between 50° N–50° S, especially over India and Southeast Asia, where high fluxes of the primary emissions of NOx, NH3, and SO2 occur. For moderate increases occur over land, which are somewhat moderated by the application of EQSAM4Clim. This increase is likely associated with the reduced wet deposition in mixed clouds in the two CY49R1 simulations. Significant increases in HNO3 occur with associated decreases in in CY49R1, while in CY49R1_NOE4C surface is decreased compared to CY48R1, but to a lesser extent than with CY49R1, and HNO3 is impacted little. The lower in CY49R1_NOE4C is likely caused by the higher sulfate, which prevents the formation of nitrate. The additional decrease in surface with CY49R1 compared to CY49R1_NOE4C is caused by the use of EQSAM4Clim, which tilts gas–particle partitioning more towards the gas phase. Similar but smaller changes occur for NH3 and .
4.2 Global chemical budgets for precursors and particles
Table 1 shows the chemical tropospheric budget terms of the key species involved in the S and N cycles in IFS-COMPO for 2019 for both gas-phase species and particulates. The SO2 sources are from direct primary anthropogenic emissions with a contribution (30 %) from the oxidation of DMS by OH as well as outgassing and volcanic eruptions. The SO2 emissions from explosive eruptions such as that of Raikoke on 21–25 June 2019 (de Leeuw et al., 2021) are not taken into account. From Table 1 it can be seen that the production increases by 5 %–6 % (around 2.4 Tg yr−1) in CY49R1_NOE4C compared to CY48R1, with a corresponding small reduction in the global burden of SO2. The tropospheric lifetime of SO2 is also decreased by 10 % to 2.4 d with an associated increase in lifetime of 25 % for to 4.4 d, potentially affecting AOD near strong source regions. Lifetimes of SOx species are relatively unaffected by the application of EQSAM4Clim. The lifetime of SO2 exhibits strong seasonality (not shown). Satellite-derived estimates are reported to be between 10–20 h during summertime and 40–60 h during wintertime in the boundary layer (Lee et al., 2011; Qu et al., 2019). The simulated value is at the upper limit of these values, which can be explained by the fact that this is a global average over the whole troposphere, therefore including areas where dry and wet oxidation processes are much slower. For , the corresponding estimated lifetime is around 4–5 d (Chin et al., 1996; van Noije et al., 2014), agreeing well with our results.
Table 1Global tropospheric chemical budget terms for 2019 of SO2, , and aerosol from gas–particle partitioning (NO3_1) and from heterogeneous reactions (NO3_2) of HNO3, NH3, and as simulated by the three experiments CY48R1, CY49R1, and CY49R1_NOE4C. Fluxes are expressed in Tg S yr−1 or Tg N yr−1 and burden in teragrams of sulfur (Tg S) or teragrams of nitrogen (Tg N). For HNO3, NO3_1, and NO3_2 no direct emission occurs, and for NH3 no chemical production term exists. Results are presented as follows: CY48R1 / CY49R1 / CY49R1_NOE4C.

For HNO3 only minimal changes in the tropospheric budget occur between CY48R1 and CY49R1_NOE4C, with the dry and wet deposition terms exhibiting only limited differences due to the updated deposition routines. With the activation of EQSAM4Clim, the tropospheric burden of HNO3 almost doubles, mainly due to a reduced fraction of HNO3 being converted into the NO3_1 tracer (nitrate from gas-to-particle partitioning). The parameterization of heterogeneous production of nitrate particles on top of sea-salt and dust particles in EQSAM4Clim is strongly suppressed, leading to a much smaller burden of the NO3_2 tracer (nitrate from heterogeneous production) with CY49R1 compared to CY49R1_NOE4C and contributing to the higher burden of HNO3 for this experiment. Compared to CY48R1, for CY49R1_NOE4C there is only a small repartitioning of nitrate from NO3_1 towards NO3_2. This is associated with lower NO3_1 production, caused by a higher aerosol burden, which in turn results mainly from the wet deposition updates. For CY49R1, the total burden of decreases by around 50 % compared to CY48R1. This is particularly attributed to the change in the burden of NO3_2, as the burden of NO3_1 increases by more than 50 %. The use of EQSAM4Clim increases the tropospheric lifetime of NO3_1 from 4.9 d up to 6.2 d while reducing the lifetime of NO3_2 by 1.2 d. This essentially shifts simulated nitrate particles towards small sizes.
For the conversion of NH3 to , the updates in CY49R1_NOE4C reduce the wet deposition term for NH3 by around 15 %, increasing both the burden and lifetime. This subsequently increases the burden and lifetime by around 30 %. The use of EQSAM4Clim in CY49R1 further increases the burden and lifetime of NH3, associated with increased dry and wet deposition. Similarly to the HNO3– couple, EQSAM4Clim tilts the gas–particle conversion towards the gas phase for the NH3– couple, leading to substantially lower production, burden, and deposition with CY49R1 compared to CY49R1_NOE4C and, correspondingly, a higher simulated burden and deposition of NH3. This results in a lifetime of NH3 of 1.9 d with CY49R1, which is more than twice the value with CY48R1 (0.84 d). This is also at the high end of values found in Luo et al. (2022) from GEOS-CHEM, which range from less than a 10 h lifetime over China and northern high latitudes up to more than 40 h over large parts of Africa and Australia. Van Damme et al. (2018) provide a figure indicating 12 h, but only close to specific emission sources. The discrepancy between this short lifetime value and the CY49R1 1.9 d lifetime can be explained by different scales (global versus local) and the fact that the longer lifetimes are mostly far away from NH3 sources.
5.1 Evaluation of simulated PM2.5
Surface observations of both PM2.5 and PM10 are provided by the AirNow database (https://www.airnow.gov/about-airnow/, last access: 7 July 2023) covering the US, the European Environment Agency (EEA, https://www.eea.europa.eu/data-and-maps/explore-interactive-maps/up-to-date-air-quality-data, last access: 24 July 2024) covering Europe, and the China National Environmental Monitoring Center (CNEMC; https://www.cnemc.cn/en/, last access: 24 July 2024) covering China. For these three regions, special care was taken to use only the background rural stations representative of locations away from strong point sources.
The 2019 annual mean global distribution of simulated PM2.5 is shown in Fig. 5, along with the absolute differences between CY49R1_NOE4C and CY49R1 compared against CY48R1. The highest PM2.5 concentrations occur over Africa and the Middle East (associated with desert dust) as well as India and China (associated with anthropogenic particles), which are 3–7 times higher than the PM2.5 concentrations simulated for the US, Europe, Russia, and South America. Signatures over the ocean occur related to sea-salt aerosol, resulting in background PM2.5 concentrations of around 20 µg m−3. Considering the differences of CY49R1_NOE4C compared against CY48R1, there is a moderate reduction in PM2.5 over the pristine ocean of between 2–4 µg m−3 related to the application of an updated approach for sea-salt emissions, in contrast to an increase over land of up to 4–15 µg m−3 over most regions. For North Africa, technical changes to the wind gusts used in the emission scheme led to a decrease in desert dust emissions, therefore reducing the PM2.5 concentrations. The largest increases occur for regions with high anthropogenic emissions, reaching 12–18 µg m−3 for India and East Asia and thus 25 % in relative terms. These changes are reduced by the application of EQSAM4Clim over, e.g., the US and Europe, related to the significant reduction in the simulated surface concentration of and NO3_2 (see Table 1).
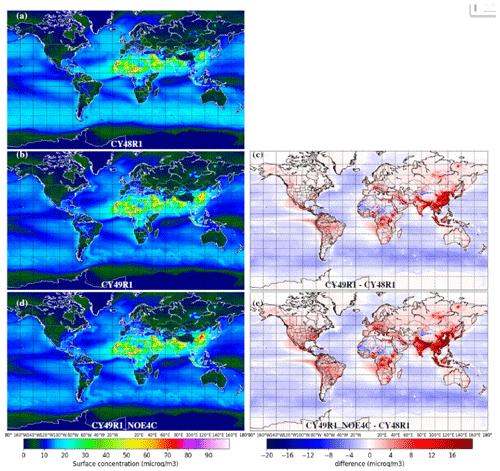
Figure 5Global mean PM2.5 distributions in µg m−3 (a, b, d) as simulated in CY48R1, CY49R1, and CY49R1_NOE4C when run in cycling forecast mode during 2019. The right column (c, e) shows the absolute difference in PM2.5 distributions compared against the CY48R1 values. Units are in µg m−3.
Figure 6 shows the weekly variability in PM2.5 as seen in the regional composites of observed and simulated particle concentrations for Europe, the US, and China for background rural sites. The associated fractional gross error (FGE) between simulations and observations is shown in the right column, providing some estimate of the ability of IFS-COMPO to capture the observations. The FGE is used as a metric of model error so that errors in regions with low values are not overlooked compared to the larger errors that occur in regions with higher values. The FGE varies between 0 (best) and 2 (worst) and is defined for a population of N forecasts fi and observations oi as
No real seasonal cycle exists in the regional mean PM2.5 concentrations in the US, whereas for China a strong seasonal cycle in PM2.5 exists with maximal concentrations during wintertime and, with a weaker amplitude, also in Europe. Figure 6 is complemented by Table 2, which provides the 2019 average of the modified normalized mean bias (MNMB), the FGE, and the correlation coefficient of simulated PM and AOD versus observations. The MNMB varies between −2 and B and is defined by the following equation for a population of N forecasts fi and observations oi:
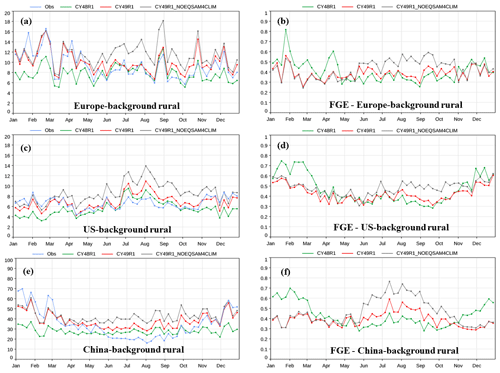
Figure 6A comparison of observed and simulated weekly PM2.5 concentrations for 2019 over background rural stations in Europe (69 sites), the US (124 sites), and China (153 sites) is shown in the left column (a, c, e). The corresponding fractional gross error (FGE) of simulated PM2.5 against observations is shown in the right column (b, d, f). Units are in µg m−3.
Table 2Regional evaluation of simulated daily PM2.5 compared against background rural stations for each region. The modified normalized mean bias (MNMB), fractional gross error (FGE), and Pearson correlation coefficient (R) are given for the three experiments as shown in solid, bold, and italic (CY48R1, CY49R1, CY49R1_NOE4C). Values for the MNMB are given in µg m−3. The number of background rural stations for each region is indicated in parentheses.

For CY48R1, a strong negative bias occurs during wintertime for China and Europe, indicating muted particle formation during colder periods with shorter days, with FGE values of between 0.6–0.8. For the summertime, biases are typically lower with FGE values of between 0.3–0.4 across regions. The updates of CY49R1_NOE4C reduce the wintertime FGE to between 0.3–0.4, substantially reducing the simulated bias and improving the representation of weekly variability in PM2.5. The correlation between simulated and observed values is significantly higher with CY49R1 over China and Europe, as shown in Table 2. In contrast, during summertime the FGE increases to 0.5–0.7 across all regions with CY49R1_NOE4C, somewhat degrading the performance of IFS-COMPO compared to CY48R1. The use of EQSAM4Clim in CY49R1 provides the best compromise between the other simulations, in that the wintertime improvements occur in tandem with lower summertime biases which are comparable to CY48R1 for Europe and slightly higher for the US and China.
5.2 Evaluation of AOD at 500 and 550 nm
In this section, we use observations of aerosol optical depth (AOD) at 500 nm, which are taken from the Aerosol Robotic Network (AERONET; Holben et al., 1998), to validate the integrated column properties of the simulations. In this study AERONET level 2 data are used for evaluation, which are cloud-screened and quality-assured with final calibrations, in preference to the level 1.5 AOD data at 500 nm. We also use the corresponding Ångström exponent values derived from AERONET data evaluated between 440–865 nm. The 1°×1° gridded monthly merged AOD at 550 nm fusion product provided by FMI (Sogacheva et al., 2020) has also been used to evaluate simulated AOD, particularly over regions where fewer AERONET stations are available.
The updates of the tropospheric aerosols in IFS-COMPO CY49R1 bring significant changes in the mean simulated AOD at 550 nm, as shown in Fig. 7. In general, the simulated AOD shows increases in the range of 0.04–0.1 AOD units in CY49R1, except over regions which are significantly affected by desert dust. For these dry regions decreases in AOD occur of between 0–0.06 AOD units. Such decreases can be attributed to changes in the inputs used in the dust emission scheme, which lead to lower dust emissions in general. The largest increases in AOD occur over India and China, corresponding to the regions exhibiting significant increases in PM2.5 (see Fig. 5). Over oceans, the increases in AOD are mostly caused by the changes in the emissions of sea-salt aerosol, with the implementation of the Gong (2003) sea-spray size distribution. At the higher latitudes the increase in the simulated AOD with the CY49R1 simulations compared to CY48R1 is even more significant compared to the low values and is caused by the reduction in wet deposition in mixed and ice clouds following the implementation of the Verheggen et al. (2007) aerosol activation parameterization in the wet deposition scheme.
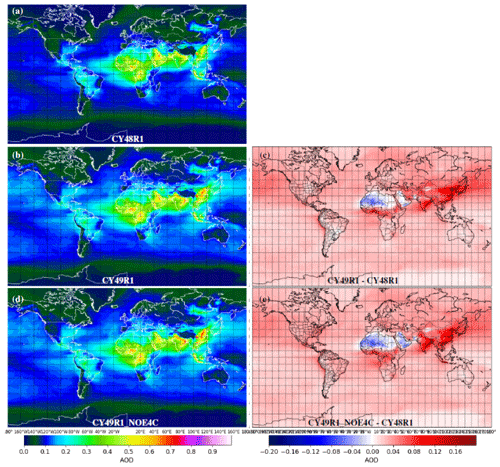
Figure 7The 2019 global mean AOD at 550 nm (a, b, d) as simulated by the CY48R1, CY49R1, and CY49R1_NOE4C experiments. (c, f) Difference with CY48R1 values.
A comparison between CY8R1 and CY49R1 2017 simulated AOD at 550 nm and FMI merged AOD from 2017 (last year of the Sogacheva et al., 2020, product) shows relatively good agreement (Fig. 8). Over oceans, the simulated values are generally too low with CY48R1 and often too high with CY49R1; the difference is caused by updates in the sea-salt aerosol emissions. Over regions with high anthropogenic emissions, the AOD is on average simulated too low over Europe and India and too high over the eastern US and China with CY48R1. Over the eastern US, this overestimation is caused mainly by biogenic secondary organics and sulfate that are too high (not shown). CY49R1 brings a small decrease in simulated AOD over China and India and an increase over Europe and the eastern US, thereby reducing bias over Europe and China and increasing it over the eastern US and India. Figure 8 also shows the corresponding fractional gross error (FGE) averaged over 2017 of monthly simulated vs. retrieved AOD at 550 nm. Over most areas, the FGE is significantly improved by CY49R1 compared to CY48R1. However, some degradation is noted over parts of the oceans and over the eastern US due to AOD values that are too high.
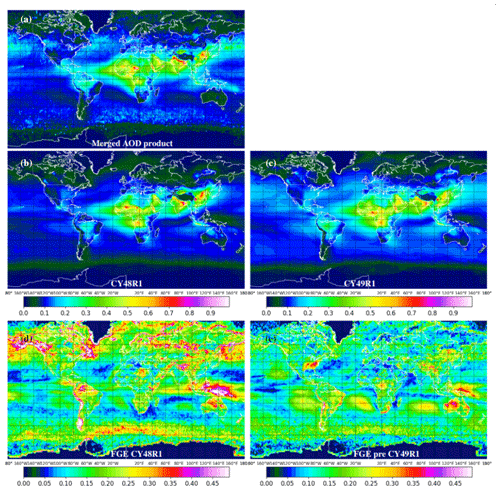
Figure 8Panel (a) (top) shows the 2017 average of the FMI merged AOD product at 550 nm. Panels (b) and (c) show the 2017 average of CY48R1 (b) and CY49R1 (c) simulated AOD at 550 nm. Panels (d) and (e) show the 2017 average of the fractional gross error (FGE) of monthly simulated vs. observed AOD at 550 nm for CY48R1 (d) and CY49R1 (e).
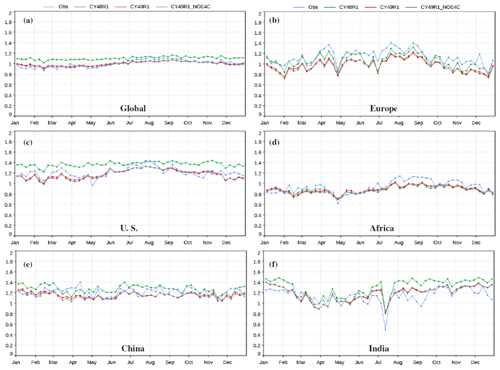
Generally, there is an increase in simulated AOD in both CY49R1_NOE4C and CY49R1 experiments, as shown by the comparison against AERONET observations in Fig. 9. Figure 9 is complemented by Table 3, which also provides global and regional skill scores (MNMB, FGE, and correlation coefficient). For CY48R1 a significant low bias of −0.02 to −0.1 AOD units occurs for the global mean values and for Europe, the US, India, and China. With the exception of the US, the summertime AOD bias is generally smaller. Over Africa seasonal variability is low in the observed AOD values, where no clear bias exists in CY48R1. For both CY49R1_NOE4C and CY49R1 large increases in AOD (between 0.025 and 0.1 AOD units) can be seen compared to CY48R1 over all regions, with a quite constant increase throughout the year of 0.05 AOD units (global average). For more polluted regions (e.g., Europe and China) this results in a clear improvement during wintertime in the simulated bias at 500 nm. For the US a positive bias in AOD is introduced throughout the year, and for China the positive bias is enhanced during summertime. Over Africa, both CY49R1 experiments bring a small positive bias on average. The difference between CY49R1_NOE4C and CY49R1 is generally small for the AOD at 550 nm, except in summertime over Europe, China and North America, with simulated AOD values at 550 nm lower by −0.02 to −0.05 AOD units for CY49R1_NOE4C. Overall, as indicated by Fig. 9 and Table 3, CY49R1 brings an improvement compared to CY48R1 globally and for all regions in terms of FGE and for all regions but Africa for MNMB. The impact on correlation is small but positive in general, except over North America.
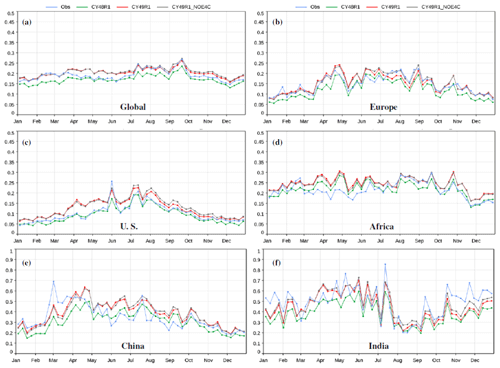
Figure 9Comparison of the global (a) and regional (b–f) weekly simulated and observed AOD (AERONET level 2) at 500 nm for 2019. The comparison is made for 461 AERONET sites globally, 113 sites in Europe, 119 sites over the US, 68 sites in Africa, 23 sites in China, and 16 sites in India.
Table 3Regional evaluation of simulated daily AOD at 500 nm compared against AERONET level 2 for AOD. The modified normalized mean bias (MNMB), fractional gross error (FGE), and Pearson correlation coefficient (R) are given for the three experiments as shown in solid, bold, and italic (CY48R1, CY49R1, CY49R1_NOE4C). Values for the MNMB are given in AOD units. The mean number of AERONET stations for each region is shown in parentheses.

5.3 Evaluation of the Ångström exponent
The evaluation of the weekly Ångström exponent (AE) between 440–865 nm, when compared to AERONET values, is shown in Fig. 10. The simulated AE decreases by around 0.1 in CY49R1_NOE4C and CY49R1 at the global scale, indicating that the relative quantity of simulated coarse particles increases compared to the finer particles. This results from several updates introduced into CY49R1: the change and decrease in AOD from and the increase in the contribution to AOD by sea salt. With the exception of Europe, this decrease in the simulated AE leads to an improvement via lower biases compared to CY48R1, indicating an overestimate in the abundance of fine particles. There is a significant change in the distribution with respect to particle size in both CY49R1_NOE4C and CY49R1. Over Europe, a negative bias of 0.2–0.3 exists in both CY49R1 and CY49R1_NOE4C. For the US, China, and India, a positive bias of 0.2–0.4 exists in CY48R1, with a reduction of between 0.1–0.2 for CY49R1_NOE4C and CY49R1. Over Africa the changes are limited: the general decrease in simulated AE with the two CY49R1 simulations is counterbalanced by the decrease in the simulated abundance of desert dust aerosols. In general, the simulated AE in CY49R1_NOE4C is quite similar to that simulated in CY49R1, showing that the application of EQSAM4Clim only has a second-order effect on the simulated Ångström exponent.
5.4 Evaluation of surface concentrations
Observations of speciated aerosol surface concentrations from three datasets have been used: the Clean Air Status and Trends Network (CASTNET; https://www.epa.gov/castnet, last access: 27 June 2023) for the US, the European Monitoring and Evaluation Programme (EMEP; https://ebas.nilu.no/, last access: 21 July 2023) for Europe, and the Acid Deposition Monitoring Network in East Asia (EANET; https://www.eanet.asia/, last access: 12 July 2023). The Ammonia Monitoring Network (AMoN; https://nadp.slh.wisc.edu/networks/ammonia-monitoring-network/, last access on 25 July 2023) also provides 3 d observations of surface NH3 for 107 sites in the US.
For our evaluation we used weekly ambient concentrations of HNO3, , , and from 93 of the CASTNET sites in 2019. Daily observations of ambient concentrations of selected trace gases and aerosol species, including HNO3, , , NH3, and , from 27 to 31 EMEP stations depending on the species have been used. For EANET, only yearly average concentrations of , , and have been used over 41 stations.
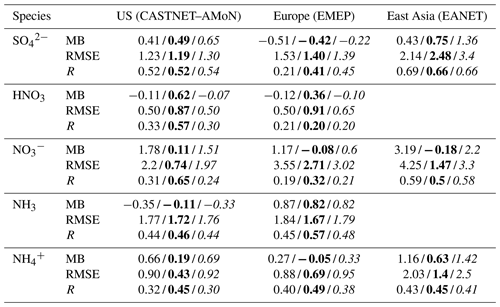
Comparisons of the temporal distribution of precursor and associated particulate concentrations made against the observational surface networks show varying degrees of improvement depending on the particle type, where Table 4 provides the mean bias (MB), root mean square error (RMSE), and Pearson correlation coefficients (R) for 2019. The frequency of the measurements varies across regions, meaning that statistics for, e.g., Europe (EMEP) are more robust using daily values than for East Asia (EANET), which only provide annual values limited to a handful of stations without corresponding precursor measurements, thus limiting the analysis for this region. In this subsection we focus on oxidized and reduced-nitrogen species in the gas and particulate phase because they are the species that exhibit the largest impact from the cycle 49R1 updates and the use of EQSAM4Clim in particular. Sulfate is also shown, but SO2 is not, as there are relatively few differences among the three experiments.
For HNO3 and , density scatterplots for the comparisons against weekly aggregated CASTNET surface observations for 2019 are shown as separate panels in Fig. 11 for the three simulations. For CY48R1, a small negative MB exists for HNO3 in CY48R1, with a poor correlation with the observations. The associated MB for is large and positive, again with a poor correlation (R=0.31), indicating an overestimation in formation. Comparing CY49R1_NOE4C shows that only small reductions in the MB occur with a further decrease in R, showing that the cycle 49R1 updates other than the use of EQSAM4Clim have a small impact for this species. The application of EQSAM4Clim in CY49R1 significantly reduces formation (see Table 1), which shifts the equilibrium towards the gaseous precursor HNO3 and for the US subsequently increases the MB and RMSE values, albeit with a much improved correlation, indicating a lifetime that is too long under a similar production term. For there is a significant reduction in the simulated mean bias and error, with a corresponding large increase in correlation, which generally improves continental particle distributions and the resulting PM2.5 comparisons as shown in Fig. 6. Therefore, the use of EQSAM4Clim in cycle 49R1 results in an improvement in the ability of IFS-COMPO to forecast resident concentrations.
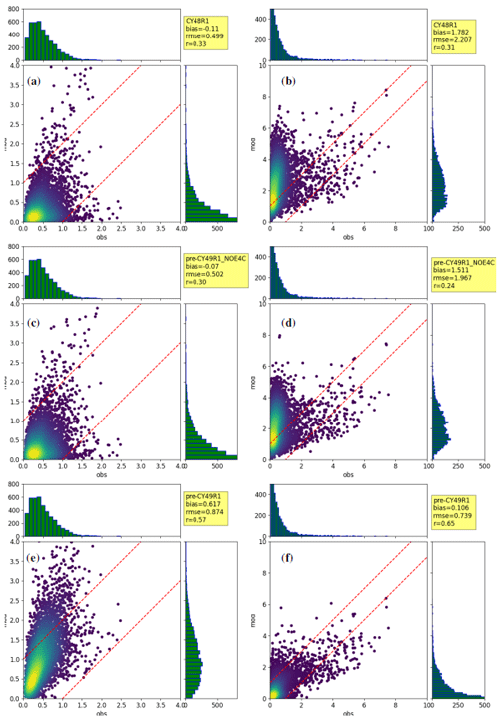
Figure 11Density scatterplots of the simulated vs. observed weekly surface HNO3 (a, c, e) and (b, d, f) over all 93 CASTNET stations for 2019. Top (a, b): CY48R1; middle (c, d): CY49R1_NOE4C; bottom (e, f): CY49. Units are in µg m−3. The dashed red lines demarcate the area where the error is less than 1 µg m−3.
The corresponding density scatterplots for the comparisons of NH3 and against AMoN/CASTNET data are shown in Fig. 12. As for HNO3, small negative mean bias values exist for NH3 in CY48R1, with an associated weak correlation (R=0.36). For a moderate MB exists, indicating an overestimate in particle formation similar to . The application of EQSAM4Clim in CY49R1 results in significant improvements in both the MB and RMSE of simulated surface across the US with a general reduction in the efficacy of particle formation, as would be expected considering the improvements in the comparisons. Again, this helps improve any PM2.5 forecast bias in IFS-COMPO. The impact of the use of EQSAM4Clim on the simulated surface concentration of NH3 is smaller than the impact noticed for but still positive, with an improvement in R from 0.36 with CY48R1 and CY49R1_NOE4C to 0.4 with CY49R1.
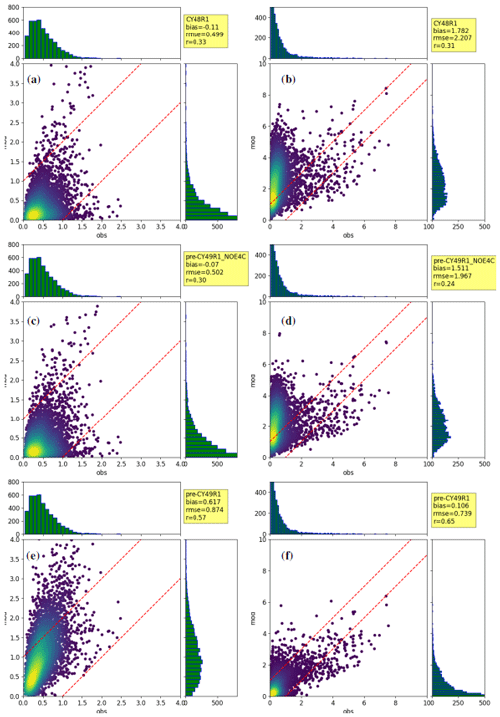
Figure 12Density scatterplots of simulated vs. observed weekly surface NH3 (a, c, e) and (b, d, f) over all collocated CASTNET and AMoN stations (72 stations in all) for 2019. Top (a, b): CY48R1; middle (c, d): CY49R1_NOE4C; bottom (e, f): CY49. Units are in µg m−3. The dashed red lines demarcate the area where the error is less than 1 µg m−3.
Figure 13 focuses on a comparison of simulated and observed surface concentrations for both precursors and particles for a single CASTNET–AMoN measurement station, namely Mackville in Kentucky (lat: 37.75° N, long: 85.07° W). The change in the equilibrium position of gas–particle partitioning for the HNO3– couple towards fewer particles and more of the gas-phase precursor becomes apparent when EQSAM4Clim is used, leading to a significant improvement in the representation of surface , with an associated increase in the relatively low bias simulated for HNO3 in CY48R1 and CY49R1_NOE4C to a high positive bias with CY49R1. Although the measured surface HNO3 remains relatively constant throughout the year between 0.5–1 µg m−3, a strong seasonal cycle exists for surface , where colder conditions increase the particle stability under lower water vapor concentrations, increasing resident concentrations 2- to 3-fold. This monthly variability is captured well by CY49R1. The same phenomenon occurs to a lesser extent for the NH3– couple, again with a notable improvement in the simulated surface concentration of by CY49R1 compared to the other two simulations. For NH3 the observed seasonal cycle is missed across simulations, with a maximum simulated in spring and observed in summer. The timing in the simulations is strongly governed by the monthly variability and magnitude in the emission inventories, which have been shown to have a significant difference when compared to satellite-derived emission estimates (Cao et al., 2022). For the excessive particle concentrations simulated in CY48R1 and CY49R1_NOE4C during summertime (+200 % bias) significantly improve upon the application of EQSAM4Clim.
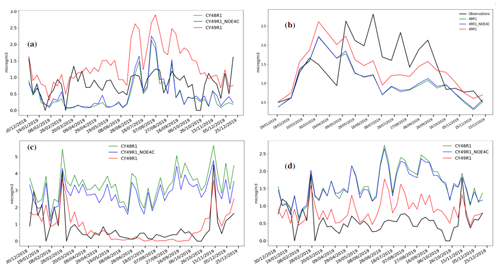
Figure 13Weekly time series of simulated vs. observed (solid black line) surface concentrations of HNO3– (a, c) and NH3– (b, d) at the CASTNET–AMoN Mackville site (Kentucky, US). Units are in µg m−3.
Table 4 summarizes the evaluation of the simulated surface concentrations of selected species against observations over Europe, the US, and East Asia. This evaluation confirms the conclusion reached using only the CASTNET–AMoN networks, showing a clear improvement for all networks of the simulated surface concentration of and in terms of bias, RMSE, and correlation coefficient. For example, the RMSE of simulated daily compared to EMEP observations over Europe decreases from 3.55 to 2.71 µg m−3 with CY49R1_NOE4C compared to CY48R1 and that of yearly compared to EANET observations over East Asia from 4.25 to 1.47 µg m−3. For HNO3 and , the skill scores of the CY49R1 experiments are more mixed.
Table 4Regional evaluation of simulated surface concentrations of selected aerosol and trace gas species associated with particle production. The mean bias (MB), root mean square error (RMSE), and Pearson correlation coefficient (R) are given for the three experiments as shown in solid, bold, and italic (CY48R1, CY49R1, CY49R1_NOE4C). Values for the MB are given in µg m−3. The evaluation is carried out against weekly values for CASTNET, semimonthly values for AMoN, daily values for EMEP, and yearly values for EANET.
5.5 Evaluation of surface aerosol pH
In this section and following, we focus on the new diagnostic output proposed in the CY49R1 experiments: aerosol and precipitation pH. The use of EQSAM4Clim has the potential to provide an improved regional representation of aerosol, cloud, and precipitation pH, which can act as a potential product provided by CAMS. To date, to our knowledge, such near-real-time products on the acidity of aerosol, clouds, and precipitation are not available.
Aerosol acidity plays an important role in a variety of aerosol physical and chemical processes as discussed in Freedman et al. (2019) and Pye et al. (2020). In particular, it can influence production rates of secondary inorganic aerosols through heterogeneous reactions and modulate aerosol mass by controlling the gas–particle partitioning of volatile and semi-volatile compounds. Aerosol acidity is usually measured in terms of aerosol pH, which is determined by both aerosol composition and aerosol water (Zhang et al., 2021). Very few direct observations of aerosol pH are available, as it is hard to measure it directly (Li and Jang, 2012). Zhang et al. (2021) propose a dataset of aerosol pH computed using ISORROPIA II (Fountoukis and Nenes, 2007) and local meteorological variables in tandem with both gas-phase and aerosol-phase composition observations over the USA and China. In the USA, observational data are available from collocated CASTNET and AMoN sites. In China, hourly observational data from the data-sharing platform operated by the Comprehensive Observation Network for Air Pollution in the Beijing–Tianjin–Hebei area are used. However, the Zhang et al. (2021) dataset has only been calculated for the year 2011 for the US and 2017 for China, while the IFS-COMPO dataset is for the year 2019, which means that the comparison between the two is only qualitative considering the changes in emissions which have occurred over this decade, particularly for the US dataset. We can still use such a comparison to assess the representation of regional variability. We also use the climatological surface pH observations compiled by Pye et al. (2020) as well as recent results from Rosanka et al. (2024).
In Fig. 14, we compare the 2019 average of surface aerosol pH simulated by CY49R1 to values simulated for fine-mode aerosols only and for 2010 by the AERCHEM and ISORROPIA II thermodynamical modules implemented in the Messy model as presented in Rosanka et al. (2024), as well as to climatological observations from Pye et al. (2020). The surface aerosol pH simulated by CY49R1 shows higher values over oceans, ranging from 3 to more than 5, than over continents, where they are between 1.5 and 3.5 in general. This can be explained by two factors: in general, higher relative humidity and thus aerosol water content over oceans and also sea-salt aerosols, which dominate over oceans, are on average more alkaline than other aerosol species. In particular, areas with higher quantities of sea-salt aerosols, such as below 40° S, are the areas with the highest simulated surface pH, with values reaching 5 and above. Over continents, the deserts stand out with lower surface aerosol pH values because of lower aerosol water. Compared to observations, the CY49R1-simulated values are slightly higher over Europe and China (ranging between 3 and 4 in general) than over the US (from 3 and above in the east to closer to 2 in the west). The simulated surface aerosol pH values are generally too acidic over the US and too alkaline over oceans, while over central and East Asia the values are more or less in the range of the climatological observations provided by Pye et al. (2020)
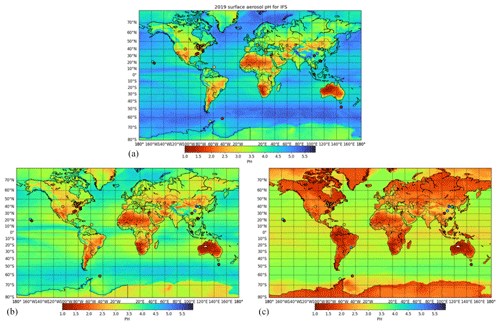
Figure 14Comparison of simulated global mean 2019 surface aerosol pH from CY49R1 (a), ISORROPIA II (b), and the AERCHEM (c) thermodynamical models. The bottom two plots (b, c) use data provided by Rosanka et al. (2024) for the year 2010 and only for fine-mode aerosols. Climatological surface aerosol pH observations provided by Pye et al. (2020) are also shown in circles.
The values simulated by CY49R1 match the ISORROPIA II simulations from Rosanka et al. (2024) relatively well over continents. Over oceans, the values simulated by CY49R1 are significantly higher, which is caused by the fact that diagnostic aerosol water from coarse and super-coarse sea salt is used as an input to the aerosol pH computations: this increases the pH values over oceans a lot, while the aerosol pH computed in Rosanka et al. (2024) is only for fine-mode aerosols. Over continents, the values from ISORROPIA II and CY49R1 are quite similar, with somewhat higher values for CY49R1, which could be from a different simulated aerosol composition but also from diagnostic aerosol water from OM, BC, and desert dust being used in CY49R1, which increases the simulated aerosol pH values somewhat. The CY49R1 surface aerosol pH values are much higher than those simulated by AERCHEM: over oceans, this is caused by higher aerosol water with CY49R1, as AERCHEM does not include coarse and super-coarse sea salt, and also because the AERCHEM module simulated the acidification of sea-salt aerosol (Rosanka et al., 2024), which is a process not represented in the IFS.
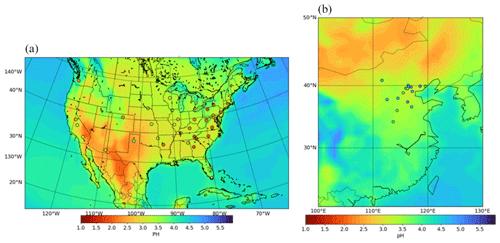
Figure 15Regional comparisons of surface aerosol pH simulated by CY49R1 averaged in 2019 against 2011 surface data from sites in the US (a) in circles taken from Zhang et al. (2021); (b) comparison against 2017 surface data from the Zhang et al. (2021) dataset over China (in circles).
5.6 Evaluation of precipitation pH
In contrast to aerosol pH, precipitation pH is measured routinely by several networks, namely the National Trends Network (NTN) operated by the National Atmospheric Deposition Program (NADP) in the US, EMEP in Europe, and EANET in East Asia for the regions of interest in this study, made at the same frequency as the measurements of gas species and particles. Recently, precipitation pH has also been simulated by the GEOS-CHEM chemistry transport model (CTM) for the year 2013 (Shah et al., 2020), although simulations were conducted at a coarser resolution than the IFS-COMPO simulations presented here and for a different year. In this section, the precipitation pH values simulated by IFS-COMPO are weighted by simulated precipitation and compared against the relevant observational data. The simulation of precipitation pH depends on both aerosol composition and precipitation fluxes and combines uncertainties from both forecasts; this is why we present yearly and monthly values here.
Figure 16 shows the average of the precipitation pH from IFS-COMPO for 2019 for CY49R1. Compared to the aerosol pH values shown in Fig. 15, these values are higher (less acidic), reaching values of pH between 4.0–5.0 over oceans and 4.5–5.5 over the majority of the continents. Precipitation pH is more impacted by simulated precipitation fluxes than by aerosol composition, which is why drier areas generally show lower pH values, while the opposite is true for wet areas. The comparison of the precipitation pH simulation against observed values over the USA, Europe, and Southeast Asia reveals that values are generally in the same range of observations, with some exceptions such as in the Mediterranean. Over the USA, the contrast between the eastern and western US is more marked in the simulated values than in the observations, although the gradient in pH values across the continent is captured. Over Europe, the simulated values agree well for most of the sites, although the simulated values are too high over Spain (dry and impacted by dust) and the Po Valley (high anthropogenic emissions), indicating some additional challenges for these locations, which includes uncertainties with the simulated precipitation. For East Asia, the simulated values agree favorably for China, while they are more acidic for other countries including Indonesia.
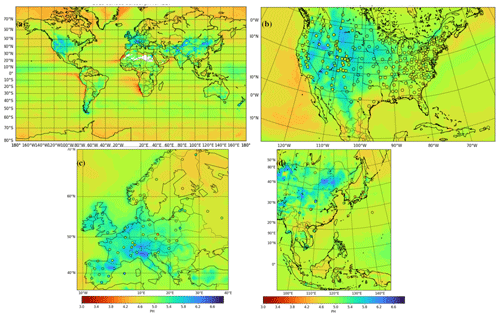
Figure 16(a) Global mean surface precipitation pH simulated in CY49R1 for 2019. Comparisons against the annual mean observational means for the US, Southeast Asia, and Europe are shown in panels (b), (c), and (d), respectively. The respective observational mean values are shown in the circles, with the details of the regional measurements being described in the text.
Focusing on the US, comparisons of precipitation pH from CY49R1 against observations are shown in Fig. 17. The top two panels show time series of simulated versus observed monthly pH values at two individual sites, namely Grand Teton National Park in Wyoming (43.833° N, 110.7° W) and Clinton in Massachusetts (42.42° N, 71.68° W), i.e., one site at the east coast and the other at the west coast, respectively. For Grand Teton National Park, the simulated values show a positive bias in the winter and early spring of 0.2–0.3 (i.e., too alkaline), followed by a negative bias of 0.4–0.6 (i.e., too acidic) for the rest of 2019; however, the seasonal variability is relatively well captured. The negative bias is probably caused by an overestimate of simulated sulfate, itself perhaps arising from SO2 emissions that are too high, as shown by a comparison of surface sulfate simulated by CY49R1 versus CASTNET stations in the regions (not shown). For Clinton, there is very good agreement between the simulated and observed monthly precipitation pH, with a small negative bias of 0.1–0.2 in the spring. The bottom panel shows a density scatterplot of a comparison of simulated yearly precipitation pH against corresponding NADP–NTN values over all 248 stations of this network. The agreement is much better than that for aerosol pH, albeit exhibiting a small negative bias of −0.27 pH units. This provides confidence that IFS-COMPO simulates the regional distribution and variability in precipitation pH relatively accurately, which results from a good representation of precipitation fluxes as well as aerosol composition.
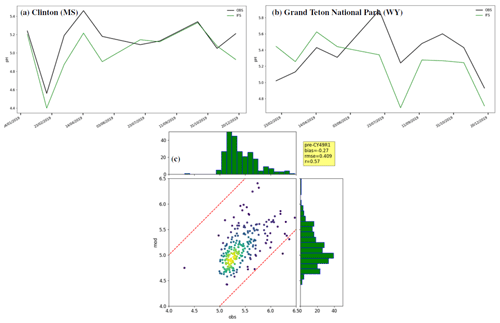
Figure 17Comparison of monthly and yearly averaged precipitation pH between simulated and observed values. Panels (a) and (b) show monthly comparisons for two NTN–NADP sites in the US: Clinton (Massachusetts) and Grand Teton National Park (Wyoming). Panel (c) shows a density scatterplot of simulated vs. observed yearly precipitation pH over all 248 NTN–NADP stations in 2019. The dashed red lines demarcate the area where the error is less than 1 pH unit.
Finally, Fig. 18 shows a comparison of regional observed and simulated precipitation pH, including data from the GEOS-CHEM CTM as provided by Shah et al. (2020). The GEOS-CHEM CTM data are for the year 2013 instead of 2019 and use a much coarser resolution than IFS-COMPO. For all regions, the simulated values, either by IFS-COMPO or GEOS-CHEM CTM, are too low compared to observations. The IFS-COMPO average precipitation pH values are in closer agreement with the observed values over the US and Europe and lower than GEOS-CHEM CTM over Asia.
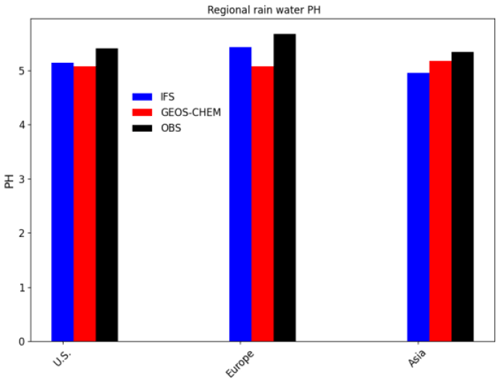
Figure 18Comparison of regionally averaged precipitation pH as simulated by the CY49R1 experiment and observed by NADP–NTN (US, 248 stations), EANET (East Asia, 49 stations), and EMEP (Europe, 77 stations). GEOS-CHEM-simulated precipitation pH for the year 2013, from Shah et al. (2020), is also shown.
In this study we have presented a description and an evaluation of the model changes that will form the basis of cycle 49R1 of IFS-COMPO, focusing on the impact of the implementation and use of a simplified thermodynamical equilibrium model, EQSAM4Clim, for the purpose of improving the simulated inorganic gas–particle partitioning and the provision of aerosol, cloud, and precipitation pH simulations. The changes bring a significant improvement in the representation of the nitrogen life cycle, mostly from the use of EQSAM4Clim, which improves the simulated biases for and over Europe, Southeast Asia, and the US. This significantly improves the simulated PM2.5 and, to a lesser extent, AOD. This provides confidence that for the future, the CAMS system will have an improved capability to simulate more accurate surface aerosol composition, which is one of the important products of the service.
In addition, we have shown that the representation of aerosol and precipitation acidity in IFS-COMPO is captured with sufficient accuracy to envisage their inclusion in the CAMS product portfolio. A preliminary evaluation of some of these potential products has been presented here, with reasonable agreement of simulated precipitation pH against routine observations in Europe, Asia, and the US. More evaluation is needed to fully assess the new pH diagnostics, especially concerning seasonal variability at specific locations, where this study acts as the groundwork for future datasets that could be provided by CAMS.
The other updates included in cycle 49R1 generally result in a positive impact on skill scores when applied in tandem with EQSAM4Clim. In particular, the biases in the AOD and Ångström exponent are decreased over almost all global regions compared to cycle 48R1. However, there are instances of an increased positive bias for, e.g., AOD at 500 nm and PM2.5 in spring and summertime over the US and China, as well as a persistent low bias in PM10 which requires some attention. Some of the PM2.5 summertime biases are caused by secondary organic aerosols of biogenic origin that are too high, which currently depend on static emissions of isoprene and monoterpenes from CAMS_GLOB_BIO. A better representation of the variability of these emissions depending on the meteorological and vegetation conditions could probably help in this respect and is one direction explored for the future improvement of global CAMS products. IFS-COMPO also clearly does not capture some sources or processes that lead to the formation of coarser particles, as indicated by the systematic low bias in PM10. More work is needed for a better representation of PM10 in IFS-COMPO.
Model codes developed at ECMWF are the intellectual property of ECMWF and its member states, and therefore the IFS code is not publicly available. ECMWF member-state weather services and their approved partners will get access granted. Access to an open version of the IFS code (OpenIFS) that includes cycle CY43R3 IFS(AER) (Huijnen et al., 2022) may be obtained from ECMWF under an OpenIFS license. More details can be found at https://confluence.ecmwf.int/display/OIFS/About+OpenIFS (ECMWF, 2018). The EQSAM4Clim version 12 code can be found at https://doi.org/10.5281/zenodo.10276178 (Metzger, 2023). The simulation data used in this article can be found at https://doi.org/10.5281/zenodo.10679832 (Remy, 2024).
SR, SM, and VH designed and carried out the numerical experiments used in this article. SR, SM, VH, and JEW drafted the article. SM did the pH literature review and developed and implemented the revised pH formulation of EQSAM4clim into IFS. SR, VH, SM, JEW, and JF maintain and carry out general aerosol and trace gas developments for IFS-COMPO. All authors contributed to drafting and revising this article.
At least one of the (co-)authors is a member of the editorial board of Geoscientific Model Development. The peer-review process was guided by an independent editor, and the authors also have no other competing interests to declare.
Publisher's note: Copernicus Publications remains neutral with regard to jurisdictional claims made in the text, published maps, institutional affiliations, or any other geographical representation in this paper. While Copernicus Publications makes every effort to include appropriate place names, the final responsibility lies with the authors.
A large number of observational datasets have been used in this work; the authors would like to thank all the actors that created and made public these datasets: NASA (MODIS, VIIRS, AERONET), the European Environment Agency (air base), the AirNow network and the United States Environmental Protection Agency (EPA for the CASTNET), the National Atmospheric Deposition Program (NADP), the Finish Meteorological Institute (FMI, merged AOD product), the Ammonia Monitoring Network (AMoN), and the Acid Deposition Monitoring Network in East Asia (EANET). We acknowledge the provision of Chinese PM2.5 data by Bas Mijling (KNMI) as acquired as part of the MarcoPolo-Panda project. We wish to thank Havala Pye for compiling a collection of surface aerosol pH observations.
This research has been supported by the Copernicus Atmospheric Monitoring Services (CAMS) program managed by ECMWF (Framework Agreement ECMWF/Copernicus/2021/CAMS2_35_HYGEOS) on behalf of the European Commission.
This paper was edited by Martine Michou and reviewed by two anonymous referees.
Agusti-Panareda, A., Diamantakis, M., Bayona, V., Klappenbach, F., and Butz, A.: Improving the inter-hemispheric gradient of total column atmospheric CO2 and CH4 in simulations with the ECMWF semi-Lagrangian atmospheric global model, Geosci. Model Dev., 10, 1–18, https://doi.org/10.5194/gmd-10-1-2017, 2017. a
Albert, M. F. M. A., Anguelova, M. D., Manders, A. M. M., Schaap, M., and de Leeuw, G.: Parameterization of oceanic whitecap fraction based on satellite observations, Atmos. Chem. Phys., 16, 13725–13751, https://doi.org/10.5194/acp-16-13725-2016, 2016. a
Angle, K., Neal, E., and Grassian, V.: Enhanced Rates of Transition-Metal-Ion-Catalyzed Oxidation of S(IV) in Aqueous Aerosols: Insights into Sulfate Aerosol Formation in the Atmosphere, Environ. Sci. Technol., 55, 10291–10299, 2021. a
Anguelova, M. D. and Webster, F.: Whitecap coverage from satellite measurements: A first step toward modeling the variability of oceanic whitecaps, J. Geophys. Res., 111, C03017, https://doi.org/10.1029/2005JC003158, 2006. a
Ault, A. P.: Aerosol Acidity: Novel Measurements and Implications for Atmospheric Chemistry, Accounts Chem. Res., 53, 1703–1714, 2020. a
Bellouin, N., Rae, J., Jones, A., Johnson, C., Haywood, J., and Boucher, O.: Aerosol forcing in the Climate Model Intercomparison Project (CMIP5) simulations by HadGEM2-ES and the role of ammonium nitrate, J. Geophys. Res., 116, D20206, https://doi.org/10.1029/2011JD016074, 2011. a
Boucher, O., Pham, M., and Venkataraman, C.: Simulation of the atmospheric sulfur cycle in the Laboratoire de Meteorologie Dynamique general circulation model: Model description, model evaluation, and global and European budgets, Note Scientifique de l'IPSL, 23, 27 pp., 2002. a
Cao, H., Henze, D. K., Zhu, L., Shephard, M. W., Cady-Pereira, K., Dammers, E., Sitwell, M., Heath, N., Lonsdale, C., Bash, J. O., Miyazaki, K., Flechard, C., Fauvel, Y., Kruit, R. W., Feigenspan, S., Brümmer, C., Schrader, F., Twigg, M. M., Leeson, S., Tang, Y. S., Stephens, A. C. M., Braban, C., Vincent, K., Meier, M., Seitler, E., Geels, C., Ellermann, T., Sanocka, A., and Capps, S. L.: 4D-Var Inversion of European NH3 Emissions Using CrIS NH3 Measurements and GEOS-Chem Adjoint With Bi-Directional and Uni-Directional Flux Schemes, J. Geophys. Res.-Atmos., 127, e2021JD035687, https://doi.org/10.1029/2021JD035687, 2022. a
Chen, L., Peng, C., Gu, W., Fu, H., Jian, X., Zhang, H., Zhang, G., Zhu, J., Wang, X., and Tang, M.: On mineral dust aerosol hygroscopicity, Atmos. Chem. Phys., 20, 13611–13626, https://doi.org/10.5194/acp-20-13611-2020, 2020. a
Chin, M., Jacob, D. J., Gardner, G. M., Foreman-Fowler, M. S., Spiro, P. A., and Savoie, D. L.: A global three-dimensional model of tropospheric sulfate, J. Geophys. Res., 101, D06304, https://doi.org/10.1029/96JD01221, 1996. a
Croft, B., Lohmann, U., Martin, R. V., Stier, P., Wurzler, S., Feichter, J., Posselt, R., and Ferrachat, S.: Aerosol size-dependent below-cloud scavenging by rain and snow in the ECHAM5-HAM, Atmos. Chem. Phys., 9, 4653–4675, https://doi.org/10.5194/acp-9-4653-2009, 2009. a, b
de Bruine, M., Krol, M., van Noije, T., Le Sager, P., and Röckmann, T.: The impact of precipitation evaporation on the atmospheric aerosol distribution in EC-Earth v3.2.0, Geosci. Model Dev., 11, 1443–1465, https://doi.org/10.5194/gmd-11-1443-2018, 2018. a
de Leeuw, J., Schmidt, A., Witham, C. S., Theys, N., Taylor, I. A., Grainger, R. G., Pope, R. J., Haywood, J., Osborne, M., and Kristiansen, N. I.: The 2019 Raikoke volcanic eruption – Part 1: Dispersion model simulations and satellite retrievals of volcanic sulfur dioxide, Atmos. Chem. Phys., 21, 10851–10879, https://doi.org/10.5194/acp-21-10851-2021, 2021. a
Diamantakis, M. and Flemming, J.: Global mass fixer algorithms for conservative tracer transport in the ECMWF model, Geosci. Model Dev., 7, 965–979, https://doi.org/10.5194/gmd-7-965-2014, 2014. a
ECMWF: About OpenIFS, https://confluence.ecmwf.int/display/OIFS/About+OpenIFS (last access: 17 October 2024), 2018. a
ECMWF: IFS Documentation CY48R1 – Part VIII: Atmospheric composition, ECMWF, https://doi.org/10.21957/749dc09059, 2023. a, b, c
Flemming, J., Huijnen, V., Arteta, J., Bechtold, P., Beljaars, A., Blechschmidt, A.-M., Diamantakis, M., Engelen, R. J., Gaudel, A., Inness, A., Jones, L., Josse, B., Katragkou, E., Marecal, V., Peuch, V.-H., Richter, A., Schultz, M. G., Stein, O., and Tsikerdekis, A.: Tropospheric chemistry in the Integrated Forecasting System of ECMWF, Geosci. Model Dev., 8, 975–1003, https://doi.org/10.5194/gmd-8-975-2015, 2015. a
Flemming, J., Benedetti, A., Inness, A., Engelen, R. J., Jones, L., Huijnen, V., Remy, S., Parrington, M., Suttie, M., Bozzo, A., Peuch, V.-H., Akritidis, D., and Katragkou, E.: The CAMS interim Reanalysis of Carbon Monoxide, Ozone and Aerosol for 2003–2015, Atmos. Chem. Phys., 17, 1945–1983, https://doi.org/10.5194/acp-17-1945-2017, 2017. a
Fountoukis, C. and Nenes, A.: ISORROPIA II: a computationally efficient thermodynamic equilibrium model for K+–Ca2+–Mg2+––Na+–SO42−––Cl−–H2O aerosols, Atmos. Chem. Phys., 7, 4639–4659, https://doi.org/10.5194/acp-7-4639-2007, 2007. a
Freedman, M., Ott, E.-J. E., and Marak, K.: Role of pH in Aerosol Processes and Measurement Challenges, J. Phys. Chem. A, 123, 1275–1284, 2019. a
Gasteiger, J. and Wiegner, M.: MOPSMAP v1.0: a versatile tool for the modeling of aerosol optical properties, Geosci. Model Dev., 11, 2739–2762, https://doi.org/10.5194/gmd-11-2739-2018, 2018. a
Gong, S.: A parameterization of sea-salt aerosol source function for sub- and super-micron particles, Global Biogeochem. Cy., 17, 1097, https://doi.org/10.1029/2003GB002079, 2003. a, b, c
Hauglustaine, D. A., Balkanski, Y., and Schulz, M.: A global model simulation of present and future nitrate aerosols and their direct radiative forcing of climate, Atmos. Chem. Phys., 14, 11031–11063, https://doi.org/10.5194/acp-14-11031-2014, 2014. a, b
Holben, B. N., Eck, T., Slutsker, I., Tanre, D., Buis, J., Setzer, A., Vermote, E., Reagan, J., Kaufman, Y., Nakajima, T., Lavenu, F., Jankowiak, I., and Smirnov, A.: AERONET – A federated instrument network and data archive for aerosol characterization, Remote Sens. Environ., 66, 1–16, https://doi.org/10.1016/S0034-4257(98)00031-5, 1998. a
Hortal, M.: The development and testing of a new two-time-level semi-Lagrangian scheme (SETTLS) in the ECMWF forecast model, Q. J. Roy. Meteor. Soc., 128, 1671–1687, 2002. a
Huijnen, V., Flemming, J., Chabrillat, S., Errera, Q., Christophe, Y., Blechschmidt, A.-M., Richter, A., and Eskes, H.: C-IFS-CB05-BASCOE: stratospheric chemistry in the Integrated Forecasting System of ECMWF, Geosci. Model Dev., 9, 3071–3091, https://doi.org/10.5194/gmd-9-3071-2016, 2016. a
Huijnen, V., Pozzer, A., Arteta, J., Brasseur, G., Bouarar, I., Chabrillat, S., Christophe, Y., Doumbia, T., Flemming, J., Guth, J., Josse, B., Karydis, V. A., Marécal, V., and Pelletier, S.: Quantifying uncertainties due to chemistry modelling – evaluation of tropospheric composition simulations in the CAMS model (cycle 43R1), Geosci. Model Dev., 12, 1725–1752, https://doi.org/10.5194/gmd-12-1725-2019, 2019. a
Huijnen, V., Le Sager, P., Köhler, M. O., Carver, G., Rémy, S., Flemming, J., Chabrillat, S., Errera, Q., and van Noije, T.: OpenIFS/AC: atmospheric chemistry and aerosol in OpenIFS 43r3, Geosci. Model Dev., 15, 6221–6241, https://doi.org/10.5194/gmd-15-6221-2022, 2022. a, b
Inness, A., Baier, F., Benedetti, A., Bouarar, I., Chabrillat, S., Clark, H., Clerbaux, C., Coheur, P., Engelen, R. J., Errera, Q., Flemming, J., George, M., Granier, C., Hadji-Lazaro, J., Huijnen, V., Hurtmans, D., Jones, L., Kaiser, J. W., Kapsomenakis, J., Lefever, K., Leitão, J., Razinger, M., Richter, A., Schultz, M. G., Simmons, A. J., Suttie, M., Stein, O., Thépaut, J.-N., Thouret, V., Vrekoussis, M., Zerefos, C., and the MACC team: The MACC reanalysis: an 8 yr data set of atmospheric composition, Atmos. Chem. Phys., 13, 4073–4109, https://doi.org/10.5194/acp-13-4073-2013, 2013. a
Inness, A., Ades, M., Agustí-Panareda, A., Barré, J., Benedictow, A., Blechschmidt, A.-M., Dominguez, J. J., Engelen, R., Eskes, H., Flemming, J., Huijnen, V., Jones, L., Kipling, Z., Massart, S., Parrington, M., Peuch, V.-H., Razinger, M., Remy, S., Schulz, M., and Suttie, M.: The CAMS reanalysis of atmospheric composition, Atmos. Chem. Phys., 19, 3515–3556, https://doi.org/10.5194/acp-19-3515-2019, 2019. a
Journet, E., Balkanski, Y., and Harrison, S. P.: A new data set of soil mineralogy for dust-cycle modeling, Atmos. Chem. Phys., 14, 3801–3816, https://doi.org/10.5194/acp-14-3801-2014, 2014. a
Kaiser, J. W., Heil, A., Andreae, M. O., Benedetti, A., Chubarova, N., Jones, L., Morcrette, J.-J., Razinger, M., Schultz, M. G., Suttie, M., and van der Werf, G. R.: Biomass burning emissions estimated with a global fire assimilation system based on observed fire radiative power, Biogeosciences, 9, 527–554, https://doi.org/10.5194/bg-9-527-2012, 2012. a
Kandler, K., Schutz, L., Deutscher, C., Ebert, M., Hofmann, H., Jackel, S., Jaenicke, R., Knippertz, P., Lieke, K., Massling, A., Petzold, A., Schladitz, A., Weinzierl, B., Wiedenshohler, A., Zorn, S., and Weinbruch, S.: Size distribution, mass concentration, chemical and mineralogical composition and derived optical parameters of the boundary layer aerosol at Tinfou, Morocco, during SAMUM 2006, Tellus B, 61, 32–50, https://doi.org/10.1111/j.1600-0889.2008.00385.x, 2009. a
Karydis, V. A., Tsimpidi, A. P., Pozzer, A., and Lelieveld, J.: How alkaline compounds control atmospheric aerosol particle acidity, Atmos. Chem. Phys., 21, 14983–15001, https://doi.org/10.5194/acp-21-14983-2021, 2021. a
Köhler, H.: The nucleus in and the growth of hygroscopic droplets, T. Faraday Soc., 32, 1152–1161, 1936. a
Lee, C., Martin, R. V., van Donkelaar, A., Lee, H., Dickerson, R. R., Hains, J. C., Krotkov, N., Richter, A., Vinnikovand, K., and Schwab, J. J.: S02 emissions and lifetimes: Estimates from inverse modeling using in situ and global, space-based (SCIAMACHY and OMI) observations, J. Geophys. Res., 116, D06304, https://doi.org/10.1029/2010JD014758, 2011. a
Li, J. and Jang, M.: Aerosol Acidity Measurement Using Colorimetry Coupled With a Reflectance UV-Visible Spectrometer, Aerosol Sci. Tech., 46, 833–842, https://doi.org/10.1080/02786826.2012.669873, 2012. a
Luo, G., Yu, F., and Schwab, J.: Revised treatment of wet scavenging processes dramatically improves GEOS-Chem 12.0.0 simulations of surface nitric acid, nitrate, and ammonium over the United States, Geosci. Model Dev., 12, 3439–3447, https://doi.org/10.5194/gmd-12-3439-2019, 2019. a
Luo, Z., Zhang, Y., Chen, W., Van Damme, M., Coheur, P.-F., and Clarisse, L.: Estimating global ammonia (NH3) emissions based on IASI observations from 2008 to 2018, Atmos. Chem. Phys., 22, 10375–10388, https://doi.org/10.5194/acp-22-10375-2022, 2022. a
Metzger, S.: The EQSAM Box Model (for eqsam4clim-v12), Zenodo [code], https://doi.org/10.5281/zenodo.10276178, 2023. a
Metzger, S., Dentener, F., Pandis, S., and Lelieveld, J.: Gas/aerosol partitioning: 1. A computationally efficient model, J. Geophys. Res., 107, 4312, https://doi.org/10.1029/2001JD001102, 2002. a, b
Metzger, S., Steil, B., Xu, L., Penner, J. E., and Lelieveld, J.: New representation of water activity based on a single solute specific constant to parameterize the hygroscopic growth of aerosols in atmospheric models, Atmos. Chem. Phys., 12, 5429–5446, https://doi.org/10.5194/acp-12-5429-2012, 2012. a, b
Metzger, S., Steil, B., Abdelkader, M., Klingmüller, K., Xu, L., Penner, J. E., Fountoukis, C., Nenes, A., and Lelieveld, J.: Aerosol water parameterisation: a single parameter framework, Atmos. Chem. Phys., 16, 7213–7237, https://doi.org/10.5194/acp-16-7213-2016, 2016. a, b
Metzger, S., Abdelkader, M., Steil, B., and Klingmüller, K.: Aerosol water parameterization: long-term evaluation and importance for climate studies, Atmos. Chem. Phys., 18, 16747–16774, https://doi.org/10.5194/acp-18-16747-2018, 2018. a
Metzger, S., Rémy, S., Williams, J. E., Huijnen, V., and Flemming, J.: A computationally efficient parameterization of aerosol, cloud and precipitation pH for application at global and regional scale (EQSAM4Clim-v12), Geosci. Model Dev., 17, 5009–5021, https://doi.org/10.5194/gmd-17-5009-2024, 2024. a, b, c
Michou, M., Nabat, P., and Saint-Martin, D.: Development and basic evaluation of a prognostic aerosol scheme (v1) in the CNRM Climate Model CNRM-CM6, Geosci. Model Dev., 8, 501–531, https://doi.org/10.5194/gmd-8-501-2015, 2015. a
Monahan, E. C., Spiel, D. E., and Davidson, K. L.: A model of marine aerosol generation via whitecaps and wave disruption, in: Oceanic Whitecaps and Their Role in Air–Sea Exchange Processes, edited by: Monahan, E. C. and MacNiocaill, G., D. Reidel, 167–174, https://doi.org/10.1038/s43247-021-00164-0, 1986. a, b
Myriokefalitakis, S., Bergas-Massó, E., Gonçalves-Ageitos, M., Pérez García-Pando, C., van Noije, T., Le Sager, P., Ito, A., Athanasopoulou, E., Nenes, A., Kanakidou, M., Krol, M. C., and Gerasopoulos, E.: Multiphase processes in the EC-Earth model and their relevance to the atmospheric oxalate, sulfate, and iron cycles, Geosci. Model Dev., 15, 3079–3120, https://doi.org/10.5194/gmd-15-3079-2022, 2022. a, b, c
Nault, B. A., Campuzano-Jost, P., Day, D. A., Jo, D. S., Schroder, J. C., Allen, H. M., Bahreini, R., Bian, H., Blake, D. R., Chin, M., Clegg, S. L., Colarco, P. R., Crounse, J. D., Cubison, M. J., DeCarlo, P. F., Dibb, J. E., Diskin, G. S., Hodzic, A., Hu, W., Katich, J. M., Kim, M. J., Kodros, J. K., Kupc, A., Lopez-Hilfiker, F. D., Marais, E. A., Middlebrook, A. M., Andrew Neuman, J., Nowak, J. B., Palm, B. B., Paulot, F., Pierce, J. R., Schill, G. P., Scheuer, E., Thornton, J. A., Tsigaridis, K., Wennberg, P. O., Williamson, C. J., and Jimenez, J. L.: Chemical transport models often underestimate inorganic aerosol acidity in remote regions of the atmosphere., Commun. Earth Environ., 2, 93, 2021. a
O'Dowd, C., Smith, M., Consterdine, I., and Lowe, J.: Marine aerosol, sea-salt, and the marine sulphur cycle: a short review, Atmos. Environ., 31, 73–80, 1997. a
Peuch, V.-H., Engelen, R., Rixen, M., Dee, D., Flemming, J., Suttie, M., Ades, M., Agusti-Panareda, A., Ananasso, C., Andersson, E., Armstrong, D., Barre, J., Bousserez, N., Dominguez, J. J., Garrigues, S., Inness, A., Jones, L., Kipling, Z., Letertre-Danczak, J., Parrington, M., Razinger, M., Ribas, R., Vermoote, S., Yang, X., Simmons, A., de Marcilla, J. G., and Thepaut, J.-N.: The Copernicus Atmosphere Monitoring Service: From Research to Operations, B. Am. Meteorol. Soc., 103, E2650–E2668, https://doi.org/10.1175/BAMS-D-21-0314.1, 2022. a
Pye, H. O. T., Nenes, A., Alexander, B., Ault, A. P., Barth, M. C., Clegg, S. L., Collett Jr., J. L., Fahey, K. M., Hennigan, C. J., Herrmann, H., Kanakidou, M., Kelly, J. T., Ku, I.-T., McNeill, V. F., Riemer, N., Schaefer, T., Shi, G., Tilgner, A., Walker, J. T., Wang, T., Weber, R., Xing, J., Zaveri, R. A., and Zuend, A.: The acidity of atmospheric particles and clouds, Atmos. Chem. Phys., 20, 4809–4888, https://doi.org/10.5194/acp-20-4809-2020, 2020. a, b, c, d, e, f
Qu, Z., Henze, D. K., Li, C., Theys, N., Wang, Y., Wang, J., Han, J., Shim, C., Dickerson, R. R., and Ren, X.: SO2 Emission Estimates Using OMI SO2 Retrievals for 2005–2017, J. Geophys. Res., 124, 18667–18690, https://doi.org/10.1029/2019JD030243, 2019. a
Reay, D., Dentener, F., Smith, P., Grace, J., and Feely, R.: Global nitrogen deposition and carbon sinks, Nature Geosci., 1, 430–437, https://doi.org/10.1038/ngeo230, 2008. a
Reddy, M. S., Boucher, O., Bellouin, N., Schulz, M., Balkanski, Y., Dufresne, J.-L., and Pham, M.: Estimates of global multicomponent aerosol optical depth and direct radiative perturbation in the Laboratoire de Météorologie Dynamique general circulation model, J. Geophys. Res., 110, D10S16, https://doi.org/10.1029/2004JD004757, 2005. a
Remy, S.: Simulation data of GMD-2023-3072, Zenodo [data set], https://doi.org/10.5281/zenodo.10679832, 2024. a
Remy, S. and Anguelova, M.: Improving the Representation of Whitecap Fraction and Sea Salt Aerosol Emissions in the ECMWF IFS-AER, Remote Sens.-Basel, 13, 4856, https://doi.org/10.3390/rs13234856, 2021. a
Rémy, S., Kipling, Z., Flemming, J., Boucher, O., Nabat, P., Michou, M., Bozzo, A., Ades, M., Huijnen, V., Benedetti, A., Engelen, R., Peuch, V.-H., and Morcrette, J.-J.: Description and evaluation of the tropospheric aerosol scheme in the European Centre for Medium-Range Weather Forecasts (ECMWF) Integrated Forecasting System (IFS-AER, cycle 45R1), Geosci. Model Dev., 12, 4627–4659, https://doi.org/10.5194/gmd-12-4627-2019, 2019. a, b, c
Rémy, S., Kipling, Z., Huijnen, V., Flemming, J., Nabat, P., Michou, M., Ades, M., Engelen, R., and Peuch, V.-H.: Description and evaluation of the tropospheric aerosol scheme in the Integrated Forecasting System (IFS-AER, cycle 47R1) of ECMWF, Geosci. Model Dev., 15, 4881–4912, https://doi.org/10.5194/gmd-15-4881-2022, 2022. a, b, c
Rosanka, S., Tost, H., Sander, R., Jöckel, P., Kerkweg, A., and Taraborrelli, D.: How non-equilibrium aerosol chemistry impacts particle acidity: the GMXe AERosol CHEMistry (GMXe–AERCHEM, v1.0) sub-submodel of MESSy, Geosci. Model Dev., 17, 2597–2615, https://doi.org/10.5194/gmd-17-2597-2024, 2024. a, b, c, d, e, f, g
Seinfeld, J. and Pandis, S.: Atmospheric Chemistry and Physics: From Air Pollution to Climate Change, 2nd edn., John Wiley and Sons, New Jersey, ISBN 10 0471720186, ISBN 13 9780471720188, 2006. a, b
Shah, V., Jacob, D. J., Moch, J. M., Wang, X., and Zhai, S.: Global modeling of cloud water acidity, precipitation acidity, and acid inputs to ecosystems, Atmos. Chem. Phys., 20, 12223–12245, https://doi.org/10.5194/acp-20-12223-2020, 2020. a, b, c, d
Sindelarova, K., Markova, J., Simpson, D., Huszar, P., Karlicky, J., Darras, S., and Granier, C.: Copernicus Atmosphere Monitoring Service Global Biogenic VOC emissions version 3.0 (CAMS-GLOB-BIO v3.0), ECCAD, https://doi.org/10.24380/xs64-gj42, 2021. a
Sogacheva, L., Popp, T., Sayer, A. M., Dubovik, O., Garay, M. J., Heckel, A., Hsu, N. C., Jethva, H., Kahn, R. A., Kolmonen, P., Kosmale, M., de Leeuw, G., Levy, R. C., Litvinov, P., Lyapustin, A., North, P., Torres, O., and Arola, A.: Merging regional and global aerosol optical depth records from major available satellite products, Atmos. Chem. Phys., 20, 2031–2056, https://doi.org/10.5194/acp-20-2031-2020, 2020. a
Soulie, A., Granier, C., Darras, S., Zilbermann, N., Doumbia, T., Guevara, M., Jalkanen, J.-P., Keita, S., Liousse, C., Crippa, M., Guizzardi, D., Hoesly, R., and Smith, S. J.: Global anthropogenic emissions (CAMS-GLOB-ANT) for the Copernicus Atmosphere Monitoring Service simulations of air quality forecasts and reanalyses, Earth Syst. Sci. Data, 16, 2261–2279, https://doi.org/10.5194/essd-16-2261-2024, 2024. a
Sun, Y., Guo, J., Li, Y., Luo, G., Li, L., Yuan, H., Mur, L. A. J., and Guo, S.: Negative effects of the simulated nitrogen deposition on plant phenolic metabolism: A meta-analysis, Sci. Total Environ., 719, 137442, https://doi.org/10.1016/j.scitotenv.2020.137442, 2020. a
Tilgner, A., Schaefer, T., Alexander, B., Barth, M., Collett Jr., J. L., Fahey, K. M., Nenes, A., Pye, H. O. T., Herrmann, H., and McNeill, V. F.: Acidity and the multiphase chemistry of atmospheric aqueous particles and clouds, Atmos. Chem. Phys., 21, 13483–13536, https://doi.org/10.5194/acp-21-13483-2021, 2021. a, b
Van Damme, M., Clarisse, L., Whitburn, S., Hadji-Lazero, J., Hurtmans, D., Clerbaux, C., and Coheur, P.-F.: Industrial and agricultural ammonia point sources exposed, Nature, 564, 99–103, https://doi.org/10.1038/s41586-018-0747-1, 2018. a
van Noije, T. P. C., Le Sager, P., Segers, A. J., van Velthoven, P. F. J., Krol, M. C., Hazeleger, W., Williams, A. G., and Chambers, S. D.: Simulation of tropospheric chemistry and aerosols with the climate model EC-Earth, Geosci. Model Dev., 7, 2435–2475, https://doi.org/10.5194/gmd-7-2435-2014, 2014. a
Verheggen, B., Cozic, J., Weingartner, E., Bower, K., Mertes, S., Connolly, P., Gallagher, M., Flynn, M., Choularton, T., and Baltensperger, U.: Aerosol partitioning between the interstitial and the condensed phase in mixed-phase clouds, J. Geophys. Res.-Atmos., 112, D23202, https://doi.org/10.1029/2007JD008714, 2007. a, b
Wang, R., Goll, D., Balkanski, Y., Hauglustaine, D., Boucher, O., Ciais, P., Janssens, I., Penuelas, J., Guenet, B., Sardans, J., Bopp, L., Vuichard, N., Zhou, F., Li, B., Piao, S., Peng, S., Huang, Y., and Tao, S.: Global forest carbon uptake due to nitrogen and phosphorus deposition from 1850 to 2100, Glob. Change Biol., 23, 4854–4872, 2017. a
Williams, J. E., Strunk, A., Huijnen, V., and van Weele, M.: The application of the Modified Band Approach for the calculation of on-line photodissociation rate constants in TM5: implications for oxidative capacity, Geosci. Model Dev., 5, 15–35, https://doi.org/10.5194/gmd-5-15-2012, 2012. a
Williams, J. E., van Velthoven, P. F. J., and Brenninkmeijer, C. A. M.: Quantifying the uncertainty in simulating global tropospheric composition due to the variability in global emission estimates of Biogenic Volatile Organic Compounds, Atmos. Chem. Phys., 13, 2857–2891, https://doi.org/10.5194/acp-13-2857-2013, 2013. a
Williams, J. E., Huijnen, V., Bouarar, I., Meziane, M., Schreurs, T., Pelletier, S., Marécal, V., Josse, B., and Flemming, J.: Regional evaluation of the performance of the global CAMS chemical modeling system over the United States (IFS cycle 47r1), Geosci. Model Dev., 15, 4657–4687, https://doi.org/10.5194/gmd-15-4657-2022, 2022. a, b
Wiscombe, W. J.: Improved Mie scattering algorithms, Appl. Optics, 19, 1505–1509, 1980. a
Yarwood, G., Rao, S., Yocke, M., and Whitten, G.: Updates to the carbon bond chemical mechanism: CB05, Final report to the US EPA, EPA Report No. RT-0400675, https://www.camx.com/Files/CB05_Final_Report_120805.pdf (last access: 3 April 2019), 2005. a
Zhang, B., Shen, H., Liu, P., Guo, H., Hu, Y., Chen, Y., Xie, S., Xi, Z., Skipper, T. N., and Russell, A. G.: Significant contrasts in aerosol acidity between China and the United States, Atmos. Chem. Phys., 21, 8341–8356, https://doi.org/10.5194/acp-21-8341-2021, 2021. a, b, c, d, e, f
- Abstract
- Introduction
- Implementation of EQSAM4Clim in IFS-COMPO and other updates of CY49R1
- Experimental set-up
- Comparison of budgets and model fields
- Evaluation
- Conclusions
- Code and data availability
- Author contributions
- Competing interests
- Disclaimer
- Acknowledgements
- Financial support
- Review statement
- References


