the Creative Commons Attribution 4.0 License.
the Creative Commons Attribution 4.0 License.
Challenges of high-fidelity air quality modeling in urban environments – PALM sensitivity study during stable conditions
Petra Bauerová
Michal Belda
Martin Bureš
Kryštof Eben
Vladimír Fuka
Jan Geletič
Radek Jareš
Jan Karel
Josef Keder
Pavel Krč
William Patiño
Jelena Radović
Hynek Řezníček
Matthias Sühring
Adriana Šindelářová
Ondřej Vlček
Urban air quality is an important part of human well-being, and its detailed and precise modeling is important for efficient urban planning. In this study the potential sources of errors in large eddy simulation (LES) runs of the PALM model in stable conditions for a high-traffic residential area in Prague, Czech Republic, with a focus on street canyon ventilation, are investigated. The evaluation of the PALM model simulations against observations obtained during a dedicated campaign revealed unrealistically high concentrations of modeled air pollutants for a short period during a winter inversion episode. To identify potential reasons, the sensitivities of the model to changes in meteorological boundary conditions and adjustments of model parameters were tested. The model adaptations included adding the anthropogenic heat from cars, setting a bottom limit of the subgrid-scale turbulent kinetic energy (TKE), adjusting the profiles of parameters of the synthetic turbulence generator in PALM, and limiting the model time step. The study confirmed the crucial role of the correct meteorological boundary conditions for realistic air quality modeling during stable conditions. Besides this, the studied adjustments of the model parameters proved to have a significant impact in these stable conditions, resulting in a decrease in concentration overestimation in the range 30 %–66 % while exhibiting a negligible influence on model results during the rest of the episode. This suggested that the inclusion or improvement of these processes in PALM is desirable despite their negligible impact in most other conditions. Moreover, the time step limitation test revealed numerical inaccuracies caused by discretization errors which occurred during such extremely stable conditions.
- Article
(9367 KB) - Full-text XML
-
Supplement
(40990 KB) - BibTeX
- EndNote
The ever-increasing process of urbanization (United Nations, Department of Economic and Social Affairs, Population Division, 2022) presses the issue of addressing urban environmental hazards, e.g., air pollution, heat waves, increased heat stress, and disrupted thermal comfort (Geletič et al., 2023; Tian et al., 2024), and obliges cities across the world to move their focus towards environmental sustainability and human well-being (Gál and Kántor, 2020; Hamdi et al., 2020). The way city features influence the atmospheric flow, turbulence regime, and overall microclimate by modifying the temperature, moisture, radiation, and wind field is well-known and documented (Oke et al., 2017). According to Hamdi et al. (2020), high-resolution urban micro-climate simulations combined with urban climate observations and high-resolution urban structure data are important to fully understand the impacts of climate change and urban population growth on cities. However, accurate representation of the complex urban environment (e.g., urban landscape and fabric) along with the number of different scales involved in physical processes remains a complicated challenge in meteorological models (Nazarian et al., 2023). Due to the current technological progress in climate models and the availability of computational resources, scientists can employ such models for mitigation scenarios and strategy development, as well as for analyzing urban atmospheres in great detail (Masson et al., 2020).
For this purpose, numerous numerical models with varying degrees of complexity have been developed ranging from simple urban canopy models (Grimmond et al., 2011, 2010) to high-resolution building-resolving models with resolutions of 10 m and finer (Schoetter et al., 2023). The latter class of models is based on computational fluid dynamics (CFD) methods and is further divided into Reynolds-averaged Navier–Stokes (RANS) and large eddy simulation (LES)-based models (Blocken, 2015, 2018).
However, high-precision turbulence-resolving modeling methods alone cannot guarantee sufficient reliability of urban micro-climate simulations, especially in air quality assessment. Model inputs and internal parameter settings are also among the deciding factors in simulation reliability. To assess the accuracy of model predictions for realistic urban meteorological conditions (e.g., air temperature and wind speed) and air pollution (e.g., NO, NO2, O3, PM10, and PM2.5) on street-scale levels, the complete modeling chain including model inputs and configurations must be validated against detailed measurements in a real environment. A further complication emerges from the urban surface heterogeneity, which cannot be sufficiently captured by standard meteorological stations due to their sparse distribution. Hence, quality-controlled meteorological and air quality measurement campaigns have to be conducted to acquire additional data for extensive model evaluation. Some examples of observational campaigns carried out in cities across the United States of America and Europe are listed in the works of Hamdi et al. (2020) and Resler et al. (2021).
When validating air quality, an important aspect is the overall capability of the utilized model to accurately capture the meteorological parameters and physical processes in the studied area due to the influence of wind speed (Cichowicz et al., 2020), air temperature profiles (Wolf et al., 2014), and near-surface turbulent mixing (Wolf et al., 2020) on air pollutant dispersion and spatiotemporal distribution. Over the years, atmospheric pollution modeling has been of interest to many authors who use different modeling approaches (e.g., Letzel et al., 2008; Wolf et al., 2014, 2020; Jeanjean et al., 2016; van Hooff et al., 2017; Grylls et al., 2019; Zhang et al., 2021; Weger and Heinold, 2023; Lumet et al., 2024; Wang et al., 2024; Borna et al., 2024; Samad et al., 2024). However, model validation studies accompanied by observational campaigns focusing on urban air quality within the street canyons are rather scarce and constructed mainly for RANS-based models (Resler et al., 2021).
The PALM model system (PALM; Maronga et al., 2020) utilized in this study has proven to be of service for various purposes owing to its well-rounded tools for atmospheric dynamics, energy balance, chemistry, and representation of urban emission inventories within the modeled domain, as shown in the validation study by Resler et al. (2021). It can employ realistic boundary conditions given by operational mesoscale models, capturing the real meteorology in arbitrary areas and thus providing the micro-scale model with the real physically consistent state of the atmosphere. PALM has been subjected to many studies analyzing its performance from different angles. For instance, Belda et al. (2020) tested its sensitivity to different parameters of urban surfaces through a series of different scenarios. Salim et al. (2022) focused on differentiating between the importance of radiative processes modeled by the radiative transfer model (RTM; Krč et al., 2021), and Radović et al. (2024) tested its sensitivity to different mesoscale driving conditions. Lo and Ngan (2015) studied ventilation characteristics of a simple street canyon with PALM using the tracer age approach, and Lo and Ngan (2017) used PALM for investigation of Lagrangian residence and exposure times. Tests of the effects of lateral openings on courtyard ventilation and pollution with PALM can be found in Gronemeier and Sühring (2019), and a wind tunnel experiment studying PALM's capability to simulate a complex flow field within a realistic urban building array is described in Gronemeier et al. (2021).
Tests of the sensitivities of LES models under stable boundary layer conditions are presented in some studies; e.g., Maronga and Li (2022) tested the grid sensitivity and Couvreux et al. (2020) tested the sensitivity to the domain resolution and size, initial profiles, subgrid-scale (SGS) parameterization, and surface roughness length and surface flux parameterization. They state that stable boundary layers represent a special challenge for LES models. A set of sensitivities testing the influence of internal and external factors on the street canyon ventilation in real urban conditions during stable conditions in combination with validation backed up by a quality-controlled observational campaign focused on air quality, to the best of our knowledge, has not been performed yet.
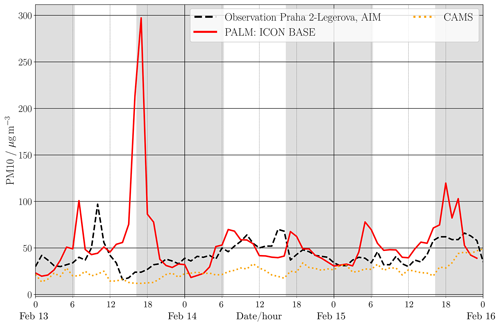
Figure 1Comparison of the concentrations from the PALM simulation (red line) with observations from the ALEGA AIM station (dashed black line) and mesoscale values used as BCs (dotted orange line) for the entire episode on 13–15 February 2023. The AIM station sensor is located 3.5 m above the ground.
Establishing a complete framework for a modeling system to be useful for routine assessment of air quality on the street level using a micro-scale meteorological model (e.g., PALM) requires careful selection of all its components (i.e., model configuration, numerical parameter settings, input data) and a thorough evaluation under various conditions. Our experiment is part of such a framework, which was specifically designed to facilitate an extensive evaluation of PALM's performance under multiple meteorological situations for the city of Prague. It was designed as an extension and a follow-up of an earlier evaluation experiment (Resler et al., 2021) allowing evaluation of the detailed spatiotemporal structure of air pollution in two transportation-burdened street canyons and their surroundings (see Sect. 2.1). Thus, an observation campaign encompassing the mentioned area was deliberately designed, and it took place from the spring of 2022 until the summer of 2023. The campaign was supported by various observational tools including low-cost sensor stations for air quality monitoring, a mobile telescopic meteorological mast, a microwave radiometer, and Doppler lidar, accompanied by the standard measurements from professional meteorological and air quality stations at the site of interest. A summary of the observation campaign is in Sect. 2.3, and its full description is in preprint (Bauerová et al., 2024a). To ensure the comparability of the modeled data with observations, special effort was devoted to securing detailed and precise modeling inputs, particularly information about the urban canopy, meteorological conditions, and emission sources (see Sect. 2.4).
In our validation simulations, we experienced unrealistic concentration patterns during some of the evaluated episodes which could disturb the validity of the results, e.g., deviation of the statistics based on modeled data. The most striking event arose during the episode covering 13–15 February 2023. This wintertime episode was characterized by a stable synoptic situation (see Sect. 2.2). Under these conditions, PALM showed a strong overestimation of aerosol air pollution on 13 February 2023 during the evening traffic peak hours of 16:00–19:00 UTC (see Fig. 1). All times in this paper are given in UTC if not stated otherwise.
In this study, we target the reasons for this unrealistic behavior and investigate the potential of different mitigation strategies. Due to high PM10 emissions from transport inside the street canyon, this pollutant can be considered a proxy for the ventilation inside the street canyon, and given efforts put into the preparation of precise model inputs including emissions, our working hypothesis was that ventilation in the street canyon was underestimated during this episode. To study this phenomenon, we devised a suite of tests evaluating the sensitivities of the ventilation to processes with potential to influence this behavior. This can provide a hint as to where to look for possible amendments for the issue in the future.
The design of the experiment, model inputs, model configuration, and utilized observations are described in Sect. 2; the air quality, wind speed, and turbulence comparisons are presented in Sect. 3. Detailed aspects of the processes and their impacts on concentration overestimation are discussed in Sect. 4. The paper closes with final conclusions in Sect. 5.
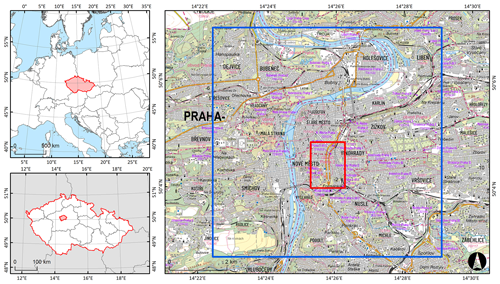
Figure 2Location of the Czech Republic in Europe (top left) and the city of Prague in the Czech Republic (bottom left). The map on the right represents the parent (blue rectangle) and child (red rectangle) domain, including the “Legerova hot spot”. The vector geodata for the maps on the left were provided by ESRI (Environmental Systems Research Institute, Europe NUTS 0 Boundaries), and the topographical map on the right map is provided through the web map service of the Czech Office for Surveying, Mapping and Cadastre – ČÚZK.
The design of the sensitivity tests is based on identified suspected reasons for the insufficient modeled ventilation in the street canyon during the studied episode. The experiment includes tests of the model driving meteorology and internal model processes and configurations; their description is given in detail in Sect. 2.5.
2.1 Study area
The study area, further called the “model domain” or “domain”, is located in the central part of Prague (Fig. 2), the capital of the Czech Republic. The evaluation was set up to cover the so-called “Legerova hot spot”, an area that faces various urban challenges, especially connected to very intense traffic. This hot spot has been the focus of the Czech Hydrometeorological Institute, city planners and officials, for many years. The area is centered around Legerova and Sokolská streets, which are parts of the Prague Magistrála, the north–south arterial road running through the Prague center. This road, constructed in the 1970s, is one of the major concerns for various reasons. One of the main problems is high traffic loads exceeding 35 000 cars per day in each direction and causing poor air quality. The second problem is the dominant building structure: the whole domain is mainly formed by compact midrise buildings (LCZ 2; Stewart and Oke, 2012) with small fractions of open midrise (LCZ 5). In the south part of the modeled domain, there is a deep valley with a park (LCZ B), which is bridged by the Prague Magistrála. These aspects make this area an ideal test bed for model experiments.
2.2 Study episode
For this analysis, a wintertime stable situation between 13 and 15 February 2023 was selected. For convenience, a climatological summary for Prague is provided in Appendix A1. Synoptically, the period was characterized by a slowly moving high-pressure system over western and central Europe (Figs. S1–S4 in the Supplement). Warm air advection was observed at the 850 hPa level (Figs. S5–S7), strengthening the prevalent capping inversion (Fig. S9). The situation represents a typical strong wintertime inversion with cloudy conditions (cloud cover of 7 or 8 oktas) during the daytime.
Meteorological station Praha 2-Karlov (P1PKAR01, WMO ID 11519), located in the area of interest several hundred meters from Legerova street (see Fig. S13), was used as a reference. The air temperature in the Prague city center varied between −1.0 and 9.2 °C, the relative humidity was 45 %–81 %, and the wind speed was lower than 10 m s−1. On 13 February, the sky was broken to overcast with a shallow layer of low clouds. During the evening hours (near 18:00) there was a temporary cloud cover decay (to ), but due to the deepening and lowering of the inversion a low cloud layer developed during the night and remained present until the end of the episode.
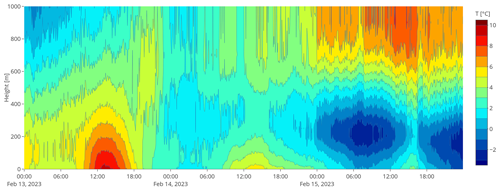
Figure 3Vertical profile of temperature T (°C) measured by MWR for 13–15 February 2023. The weather change and forming of the inversion during the 13 February evening can be identified at 18:00. The height variable denotes the height above the radiometer located at an altitude of 261
The temperature profiles and heights of the inversion layer forming during the evening can be identified in Fig. 3, where the outputs from the microwave radiometer (MWR) in Praha 2-Karlov are plotted for the whole 72 h episode. The well-mixed stratocumulus-topped convective boundary layer was present on 13 February during the day. During the night, the inversion deepened and moved lower, close to the height of 1000 m, according to the radio soundings at Praha 4-Libuš (P1PLIB01, WMO ID 11520), located 7 km to the south of Karlov station (for location see Fig. S13 and for more information Fig. S10). In the subsequent days of the episode, the wind speeds near the surface were very low, the sky was overcast or broken, and the deep inversion was moving even lower; on 15 February, it is visible in the microwave radiometer profiles.
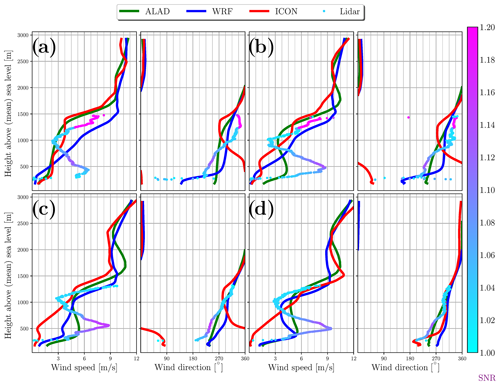
Figure 4(a–d) Comparison of the wind speed and wind direction profiles (up to 2750 ) modeled by the mesoscale models ICON (red), ALADIN (green), and WRF (blue) used as PALM model BCs with profiles from lidar observations (dots). The color of the lidar observation dots shows the lidar signal-to-noise ratio and the uncertainty of the observation. The displayed hours cover the concentration peak of 13 February: 16:00 (a), 17:00 (b), 18:00 (c), and 19:00 (d). Values represent hourly averages for the hour ending at the given time.
The wind in the evening of 13 February is significant due to the modeled concentration peak. The wind direction was changing with height from weak southwestern flow near the surface to northern flow at higher levels (see Figs. S8, S9, or 4 for the lidar observations). After sunset (16:17), the wind accelerated up to 10 m s−1 and formed a low-level jet near the inversion forming at the top of the boundary layer around the height of 300 m (Fig. S9).
2.3 Observational data
Drawing from the experience of previous analyses done by Resler et al. (2017, 2021), a targeted observational campaign was set up for the PALM model performance evaluation. It includes almost 1 year (from 30 May 2022 to 28 March 2023) of air quality and meteorological observations. The concentrations of NO2, O3, PM10, and PM2.5 were measured by 20 combined low-cost sensors placed at different sites and different heights above the ground. Observed values from sensors were subsequently corrected using the sensor co-measurement with the reference station Praha 4-Libuš (ALIBA) of the automatic air quality monitoring system (AIM) at the beginning and end of the campaign. Additionally, one professional meteorological station, Praha 2-Karlov, and one reference traffic AIM station, Praha 2-Legerova (ALEGA), are located within the child modeling domain. To obtain high-spatial- and temporal-resolution meteorological data for the studied area, supplementary measurements were established. They consisted of (i) a mobile telescopic meteorological mast for measuring temperature, relative humidity, wind velocity,and direction and air pressure; (ii) an MTP-5-He microwave radiometer for the temperature vertical profile; and (iii) a StreamLine XR Doppler lidar for the wind vertical profile. The location of the measurements on a map is shown in Fig. S13, and additional information about the measurement stations is in Table S11 in the Supplement. A detailed description of the observational campaign is available in Bauerová et al. (2024a).
2.4 Modeling setup
The PALM model system release 23.04 was used in this experiment. The particular code used was derived from the PALM GitLab master development branch from 24 May 2023, with added fixes and adaptations needed for simulations in this experiment. The model was configured with the LES core and it solves non-hydrostatic, filtered, Boussinesq-approximated, incompressible Navier–Stokes equations. The subgrid stress tensor is modeled by the Deardorff (1980) 1.5-order closure involving Moeng and Wyngaard (1988) and Saiki et al. (2000) modifications. For spatial and temporal discretization, the upwind-biased fifth-order differencing scheme from Wicker and Skamarock (2002) and the third-order Runge–Kutta time-stepping scheme from Williamson (1980) were used, respectively. The solution of the pressure Poisson equation in the projection step was configured to utilize the multi-grid scheme solver (e.g., Maronga et al., 2020). In addition to the core system, the PALM modules developed for studying the urban boundary layer were employed. They include, e.g., the land surface model (LSM; Gehrke et al., 2021), the building surface model (BSM; Resler et al., 2017; Maronga et al., 2020), the radiative transfer model and plant canopy model (RTM and PCM; Krč et al., 2021), online nesting (Hellsten et al., 2021), mesoscale nesting (Kadasch et al., 2021), and the chemical transport model (Khan et al., 2021).
This study concentrates on assessing concentrations of PM10. This pollutant was selected as it does not undergo significant changes in the usual timeframe of the passing of air through the PALM domain (unlike the ozone-chemistry-related species NO and NO2), and thus it can be modeled and evaluated as a passive tracer. This allows us to use it as a proxy for the assessment of the ventilation inside the street canyon. The additional reason for this decision was the fact that PM10 emissions from sources other than the sources related to transportation are very low in our modeling area and their influence on the street-level PM10 concentrations is negligible, while this is not the case for NOx emissions. This makes the relation of the PM10 street level concentrations and street canyon ventilation more specific.
To properly simulate all mixing layer scales, PALM was configured in two nested domains (see Fig. 2). The parent domain had an extent of 8000 m × 8000 m with a horizontal resolution of 10 m and a height of 2750 m. The vertical resolution of the parent domain was 10 m, and vertical stretching was applied from level 400 m, with a stretching factor of 1.08 and an upper limit of 20 m. The nested child domain had an extent of 1200 m × 1600 m, a horizontal and vertical resolution of 2 m, and a height of 320 m with no vertical stretching. The modeling setup was configured with the full 3D geometry, which allows modeling objects such as bridges and multilevel crossroads. The input emission was provided in the form of the recently developed PALM general volume sources, which allowed building the correct vertical structure of the emission flow.
The simulation was initialized in two steps. First, the temperature of soil, building walls, and pavement layers was simulated using the PALM built-in spin-up feature. During this phase, the dynamic part of the model was switched off and only the energy-balance-related modules (RTM, BSM, and LSM) were employed (see Maronga et al., 2020). Next, 6 h of initialization simulation followed with the full model processes. Both initialization steps were excluded from the evaluation.
2.4.1 Static input data
For detailed modeling of micro-scale processes utilized in the PALM model system, high-fidelity spatial data are needed. Due to the influence of surface thermal heating on airflow by buoyancy, processes of surface energy balance must be accurately represented. The correct modeling of the energy balance equations in BSM, LSM, and RTM requires proper estimates of numerous input parameters characterizing physical properties of horizontal (roads, pavements, etc.) and vertical surfaces (walls) as they have a high influence on radiative and heat exchanges (Belda et al., 2020). Surface parameters needed are, e.g., albedo, emissivity, thermal conductivity, roughness length, characteristics of the skin layer, and subsurface layers (thermal capacity and volumetric thermal conductivity). An updated GIS database, previously introduced by Resler et al. (2021), was used for the present study. This database includes information on wall, ground, and roof materials and finishes as well as roughness and window fractions, which were used to estimate surface and material properties. Each surface was described in terms of material category, albedo, and emissivity. Urban greenery, e.g., individual trees and shrubs, was described by its position, trunk height and diameter, tree height and crown diameter, crown shape, and tree type. The leaf area density (LAD) based on tree types was then calculated according to the irradiation and shading profile of the particular part of the tree crown (distance from the border of the crown). For deciduous trees in winter, only branches and trunks were modeled, and they were roughly estimated as 10 % of the LAD of the summer tree. However, Legerova and Sokolská streets, which are in the center of interest, contain almost no trees. All these data were processed into the PALM Input Data Standard (PIDS) format.
2.4.2 Initial and lateral boundary data
The meteorological initial and lateral boundary conditions (IBCs) for the base-case PALM simulation were provided by the operational simulation of the numerical weather prediction model ICON run at the German national meteorological service, the Deutscher Wetterdienst (Reinert et al., 2020). The data were taken from the ICON-D2 regional simulation with a horizontal resolution of approximately 2.2 km and prediction runs starting every 3 h: 00:00, 03:00, 06:00, etc. Due to the unavailability of certain required variables within the assimilation run archives, the data from the main forecast run were used with the shortest prediction horizon taken for every simulated hour. The selection of the ICON model resulted from a comparison of three meteorological models (ICON, WRF, and ALADIN) with sounding observations performed operationally by the Czech Hydrometeorological Institute (CHMI) at the nearest sounding station, Praha 4-Libuš, for multiple episodes of the year (see Tables S1–S9). The other models (ALADIN and WRF) were used in this study for tests of the sensitivity to the meteorological boundary conditions (BCs). The ALADIN model data were taken from the standard operational forecast provided by CHMI (Termonia et al., 2018; adaptation for the Czech Republic by Brožková et al., 2019); the prediction runs started at 00:00, 06:00, 12:00, and 18:00, with a 6 h prediction horizon. The WRF simulations were driven by ERA5 reanalysis (Hersbach et al., 2023) and the model configuration was selected based on the results of the comparison of different model setups (Radović et al., 2024).

Figure 5(a–d) Comparison of the potential temperature (Θ) profiles modeled by the mesoscale models ICON (red), ALADIN (green), and WRF (blue) used as PALM model BCs with profiles from MWR observations (dots). The displayed hours cover the concentration peak of 13 February: 16:00 (a), 17:00 (b)), 18:00 (c), and 19:00 (d). Values represent hourly averages for the hour ending at the given time.
The mesoscale model outputs used as the boundary conditions differed in capturing the correct wind speed and direction during the peak period (see Fig. 4 and for the whole day Fig. S11). Before sunset, all models underestimated the velocities in the boundary layer (at least below 700 m) but they differed in terms of wind directions. During the following hours, all models started to increase the wind speed near the ground. The quickest was ALADIN, which started to accelerate the wind almost immediately after sunset (16:00–17:00). WRF gave large wind speed later (between 17:00–18:00), but ICON underpredicted the velocities in the domain for the entire peak time. ICON also gave the most unrealistic wind directions in the first 2 h of the concentration peak episode (16:00–17:00). The statistical comparison of all three mesoscale models with the lidar and MWR observations for the whole day is shown in Table S10. The comparison of the profiles of the modeled potential temperature with observations from MWR for the peak period is in Fig. 5, and the complete set of profiles for the whole day is in Fig. S12. The profiles show that the mesoscale models were, in general, not able to completely capture the statically stable temperature gradient (inversion) that was forming below the strong inversion after sunset. They form a strongly stable boundary layer and a significantly less stable residual layer above. That is unrealistic according to the measurement. ICON and WRF predicted lower surface temperatures around sunset (16:00–17:00) and the effect occurred earlier for them.
The initial and boundary conditions for air pollutants were prepared using a different approach. Based on previous research (e.g., Resler et al., 2021), the concentrations from mesoscale chemical transport models (CTMs) suffer from large inaccuracies, and these inaccuracies can significantly influence the micro-scale model performance. The chemical IBCs for this study were prepared by combining data from the AIM stations with the CAMS ENSEMBLE model (CAMS, 2020): the median value of measurements from AIM background stations inside and in the surroundings of the domain (i.e., stations Praha 5-Stodůlky (ASTOA), Praha 8-Kobylisy (AKOBA), Praha 4-Chodov (ACHOA), Praha 4-Libuš (ALIBA); see Fig. S13 and Table S11) was complemented by the CAMS-ENSEMBLE-model-based vertical profiles scaled to the observed near-surface value. Therefore, for a given hour, boundary conditions were identical for all the boundaries. But because the borders of the parent 8 km × 8 km PALM domain are located mostly inside the built-up city area (see Fig. 2), we can assume that the conditions on the border will not differ significantly from each other and from background stations located in similar conditions.
The dynamic driver was prepared by using the recently developed tool PALM-Meteo (see the “Code and data availability” section), which is one of the PALM supporting tools. This tool can take inputs from different mesoscale meteorological and air quality models, transform them to the values needed for PALM, and store them in the format of the PALM dynamic driver according to the PIDS.
2.4.3 Emissions
As this study focuses on comparing air quality values, the preparation of the precise emission data was substantial. The data were processed mainly from datasets collected by CHMI and by the Municipality of Prague and its organizations, data obtained by the researcher (ATEM) while providing expert studies in the past, and results of previous research projects. The input data for the emission sources used can be divided into two basic groups: emissions from local heating and transport sources.
Emissions for local heating were determined by calculations based on data from CHMI and the Czech Statistical Office. Emissions from transport sources were modeled using the MEFA transportation emission model (MEFA et al., 2013), which is recommended for use in the Czech Republic by the Ministry of Environment of the Czech Republic. The model takes into account factors such as road gradient, the number of vehicles on the road, the flow of traffic, the composition of car types, and the emission characteristics of the individual car types. The emission calculation is based on data from the traffic census provided by the Prague Technical Administration of Roads (TSK Praha) and on data from the census on the composition of the transportation fleet in Prague built in the MEFA emission model. The data are based on regular surveys of the fleet composition carried out in Prague (Karel et al., 2021). The dust resuspension was computed according to the methodology published by the Ministry of Environment (Karel et al., 2015). This methodology is based on US EPA methodology AP-42 (EPA, 2011) and was adjusted for the conditions of the Czech Republic. For garages and parking lots, the results of project TH03030496 (Karel et al., 2020) were used. For bus stations, publicly available data on transportation were gathered from the Prague Public Transit Company (DPP).
The disaggregation of the annual emissions into hourly intervals was then performed according to the type of source. For combustion sources, distribution of emissions to days was done according to natural-gas supply profiles for category DOM4 (OTE, 2024) and complemented by daily profiles for SNAP 2 (Van der Gon et al., 2011). For transport sources, the census data from TSK Praha were utilized for all streets where available. For Legerova and Sokolská streets, hourly traffic intensity data were obtained and used directly for the selected episodes. For streets that were not covered by regular traffic surveys, the spatial and temporal distributions of the traffic intensities were based on analysis and evaluation of the relevant studies for the particular area, e.g., urban planning studies or environmental impact assessment (EIA, 2007). Then they were combined with information like street type, location, traffic regime, and pavement type. This approach allowed us to specify the distribution of the transportation intensities on smaller streets. For the detailed modeling of emissions from rail transport (diesel locomotives), data on train rides were obtained from the Railway Administration (SŽ), and emission factors from the EMEP/EEA Air Pollutant Emission Inventory Guidebook 2019 (EEA, 2019) were used. Emissions from river ships were obtained from the CHMI national database and spatially distributed to the area of the river.
Spatial transformation of the line and point emissions into the corresponding areas was done with the utilization of surrogates representing corresponding areas (e.g., areas of the street traffic lanes and parking places for traffic emissions and areas of the building roofs for local heating sources). This not only ensured a reasonable spatial distribution of the emissions in the street canyon but also decreased the gradients of the emission field and, through this, the proneness of the model to numerical inaccuracy (Ardeshiri et al., 2020). The processing of the emission sources into hourly emission flows in PIDS was done in the emission model FUME, recently extended for processing of the PALM emissions (Belda et al., 2024).
The inspection of the resulting PALM emission inputs shows that the majority of the emissions influencing the concentration of PM10 in the street canyon are related to transportation. Our testing simulations (not shown here) proved that the influence of local heating emissions on street-level concentrations is small and the impact of point sources is negligible. The modeling of car emissions employs very detailed information needed for detailed transportation model, and the resulting emission is assumed to be very reliable. This is not the case for dust resuspension from the streets, whose modeled value is between 40 % and 90 % of the primary transportation emission depending on place and time. Its estimation is based on the statistical approach and its accuracy is much lower. The paper by Patiño et al. (2024) provides a detailed discussion of resuspension uncertainties and the test of their impact on the modeled concentrations (their Sect. 4.1.2). Nevertheless, the possible inaccuracy in the modeled concentrations caused by emission inaccuracy is orders of magnitude lower than the studied overestimation and cannot significantly influence the conclusions of this study.
2.5 Scenario modeling setup
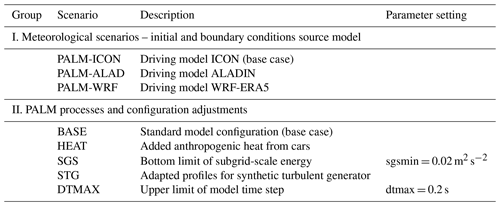
To assess the working hypothesis and possible reasons for the behavior of the model during the evening hours of 13 February 2023, a range of scenarios of meteorological inputs and individual PALM processes were simulated. The list of the sensitivity tests is in Table 1. A detailed description follows in Sects. 2.5.1–2.5.3.
2.5.1 Meteorological scenarios
The meteorology from the ICON model used for the creation of the PALM boundary conditions was selected as the best input based on the evaluation of multiple episodes of the year against sounding observations for the meteorological station Praha 4-Libuš. The detailed assessment of the model results against lidar and MWR observations inside the modeled domain showed that ICON is not superior for this area and episode in the wind speed and is the worst one in the wind direction (see Table S10). To assess the PALM response to differences between alternative meteorology inputs, simulations of the PALM model driven by ICON (base-case scenario PALM-ICON), ALADIN (scenario PALM-ALAD), and WRF-ERA5 (scenario PALM-WRF) were tested for 3 d from 13–15 February 2023.
2.5.2 PALM model processes and configurations
Sources of uncertainty were also identified in the PALM model processes and their settings. In addition to the base PALM configuration used for the validation (scenario BASE), four additional model configurations (scenarios HEAT, SGS, STG, and DTMAX) were simulated. To keep the experiment computationally feasible, the tests of model processes focused on the first day of the studied episode where the unrealistic behavior of the model occurred.
HEAT: anthropogenic heat from cars
The current version of the PALM model does not include the possibility to model the anthropogenic heat and turbulence induced by moving cars. The influence of the heat from cars on simulated air temperature proved to be minimal during a heat-wave episode (Juruš et al., 2016). On the other hand, the situation during stable winter conditions can be different and this scenario was included to assess the influence of this heat on the ventilation of the street canyon. As a proxy value for the heat flow, the model emission flow of PM10 from transportation was used and transformed into the corresponding heat flow. The calculation used is provided in Sect. F in the Supplement.
SGS: bottom limit of subgrid-scale energy
This sensitivity test was inspired by the usual practice in mesoscale chemical transport models (CTMs) to set the bottom limit of the eddy diffusivity; e.g., the model CMAQ limits this value to a minimum of 1.0 m2 s−2 (see, e.g., CMAQ, 2019). This practice is based on the experience that the diffusivity calculated from meteorology provided by mesoscale meteorological models is underestimated during low-wind stable situations; see, e.g., Byun et al. (1999) for a description and Makar et al. (2014) for tests of the influence of different settings of this limit. In the LES model PALM, the diffusivity is internally calculated by the subgrid model and depends on the modeled subgrid-scale turbulent kinetic energy (SGS TKE). Our working hypothesis assumes that the SGS TKE and consequently the diffusivity can be underestimated in PALM in conditions of the studied episode and this scenario applies the bottom limit for SGS TKE. The value of the limit 0.02 m2 s−2 was selected as the minimal value of SGS TKE modeled in the child domain at the time of the concentration peak. It also corresponds to values of SGS TKE in the street canyon before and after the peak in the BASE scenario (see Fig. 8 in Sect. 3).
STG: adapted profiles for synthetic turbulent generator
Another potential reason for the insufficient street canyon ventilation during this episode could be the turbulence coming from the boundary of the outer domain. As the boundary conditions provided by a mesoscale model to PALM contain only the wind components and no information about the turbulence, the PALM internal synthetic turbulent generator (STG) module was utilized in all PALM configurations. This generator was used on the border of the parent domain to add turbulence to the mesoscale-provided wind flow to generate a turbulent inflow condition. STG uses the approach proposed by Xie and Castro (2008) and Kim et al. (2013); see Kadasch et al. (2021) for more details. The parameterization used in the STG is based on a maritime boundary layer and has not been extensively tested under stable conditions.
To test the hypothesis that insufficient turbulence provided by STG influences the street canyon ventilation, this scenario adjusts the conditions of PALM STG by supplying vertical profiles of values of the Reynolds stress tensor and turbulent length scales and timescales for every simulation hour. These profiles add 1 m2 s−2 to the diagonal terms of the Reynolds stress tensor inside the boundary layer, which is almost twice as much as the original setting of the STG profile for the shear-driven boundary layers in which the maxima reached a value of 0.5 m2 s−2. This setting allows STG to generate higher TKE on the boundaries.
DTMAX: upper limit of model time step
The aim of this scenario was to detect possible inaccuracies in the numerical solution of the differential equations in PALM. PALM calculates the base integration time step as the maximum value satisfying the Courant–Friedrichs–Lewy (CFL) criterion for the Runge–Kutta scheme for the differential equations of air advection, diffusion, energy balance, and precipitation. This time step is also used for the transport of the chemical species implemented as a passive scalar for diffusion and advection. In our case, the CFL criterion applied for advection guarantees a time step exceeding 0.7 s on 13 February 2023 at hours 17:00–20:00. This large time step, together with relatively high concentration gradients around the traffic emission sources during the evening traffic peak, can make the upwind-biased fifth-order differencing scheme prone to dispersion and dissipation errors and could cause an inaccurate representation of the near-source dispersion. Moreover, this advection scheme is only conditionally conservative if the divergence is negligible. This is not necessarily met in our simulations with noticeable terrain structures like buildings. In this case, the advection term can become a source or sink of a scalar. To mitigate both these issues, various measures can be taken; one of them is a smaller model time step. To test this hypothesis, the time step maximum was limited to 0.2 s for the whole simulation.
2.5.3 Combined scenarios
To obtain the full set of the combinations, we also added scenarios combining meteorological scenarios PALM-ALAD and PALM-WRF with all scenarios modifying PALM processes except DTMAX. To keep the experiment computationally feasible, these combined scenarios were calculated only for the most relevant hours of 15:00–24:00, and they started from the simulation of the respective meteorological scenario in hour 14:00. The scenario DTMAX was omitted here as it represents a purely technical test of the accuracy of the numerical solution in the PALM model, and its combination with other BCs would bring no new substantial information and waste computational resources.
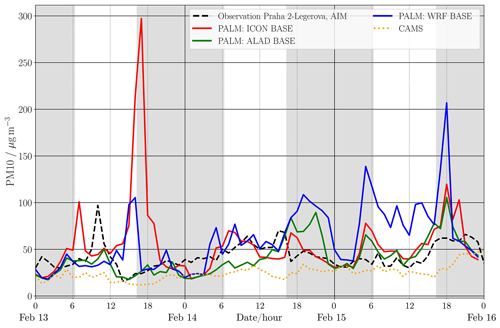
Figure 6Comparison of the PALM-modeled and observed concentrations of PM10 from the AIM station ALEGA. Observations are represented by the dotted red line, and the scenarios are shown by solid lines: base-case PALM-ICON (red), PALM-ALAD (green), and PALM-WRF (blue). The dotted orange line (CAMS) represents the analysis of the observations and CAMS model used as the BCs.
3.1 Effects of meteorological boundary conditions
Figure 6 shows a comparison of the modeled and observed PM10 street-level concentrations from the AIM station ALEGA for PALM simulations with different driving meteorology. All model results presented in this section and the following sections come from the fine-resolution child domain if not stated otherwise. The graph suggests that boundary conditions could play a crucial role in the explanation of the differences between model simulation and observations. The overestimation or underestimation of individual model scenarios differs and changes in time. The strong overestimation of PALM-ICON on 13 February 2023 at hours 16:00–19:00 (further called the “peak period”) is only partially seen in PALM-WRF, while PALM-ALAD agrees well with observations at those hours. Besides this disagreement, PALM-ICON underestimates PM10 during the night on 14 February (hours 00:00–06:00), similarly to other models, and it follows observations well during the rest of the episode. The maximum concentration of PALM-ICON is almost 300 µg m−3 at hour 17:00, which overestimates the observation by about 10 times. The overestimation of the PALM-WRF model against observations is lower, with a maximum of about 105 µg m−3 at hour 16:00, which is more than 4 times higher than the observation at the same time. Moreover, this overestimation is limited only to hours 16:00–17:00. In the rest of the episode, PALM-WRF overestimates the observation during the evening of 14 February and most of the day on 15 February. The PALM-ALAD model captures the observations almost perfectly during the afternoon and evening of 13 February, and its results during the rest of the episode are similar to the PALM-ICON base-case model, with slight underestimation in the morning and overestimation in the evening on 14 February.
Besides the main peak in the PALM-ICON concentrations of PM10, we can see a small peak in the morning at 07:00. It could lead to the conclusion that PALM-ICON was the only model able to catch the similar small morning peak in observations at 10:00, despite the 3 h time shift. But as a similar peak does not occur in observations of PM10 at the nearby sensor stations S14 and S15 (see Fig. S15) and does not occur in the observations of PM2.5 from the ALEGA station (see Fig. S16), we suppose that this small peak in observations was an effect of a nonstandard local emission of PM10 near ALEGA station (e.g., dust from building operations or street cleaning) and is not connected to the PALM-ICON model peak in hours 08:00–09:00.
Table 2The mean and median of the observations from the ALEGA AIM station and modeled values of scenarios PALM-ICON, PALM-ALAD, and PALM-WRF for the entire episode from 13–15 February 2023 and for the episode without the concentration peak hours of 13:00–19:00.

Table 3The statistics (mean, standard error, median, standard deviation) for errors of the model against observations from the ALEGA AIM station and modeled values for scenarios PALM-ICON, PALM-ALAD, and PALM-WRF for the entire episode from 13–15 February 2023 and for the episode without the concentration peak hours of 13:00–19:00.
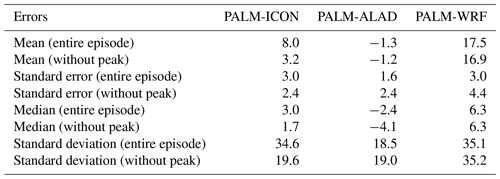
The statistics shown in Tables 2 and 3 demonstrate that the short unrealistic peak in PALM-ICON concentrations significantly disturbs the mean values and standard deviation of the whole 3 d episode. Omitting these hours from the statistics brings the performance of PALM-ICON to a similar level as PALM-ALAD.
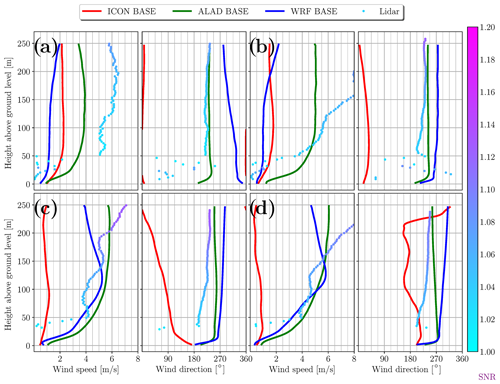
Figure 7(a–d) Comparison of the PALM-modeled wind speed and wind direction profiles (up to 250 ) in simulations driven by ICON (red), ALAD (green), and WRF (blue) with profiles from lidar observations (dots). The color of the lidar observation dots shows the lidar signal-to-noise ratio and the uncertainty of the observation. The displayed hours cover the concentration peak of 13 February: 16:00 (a), 17:00 (b), 18:00 (c), and 19:00 (d). Values represent hourly averages for the hour ending at the given time.
Additional information about the situation with respect to vertical profiles of the wind speed and wind direction is given in Fig. 7 for the peak period as well as in Fig. S17 for the entire day. Wind speed is strongly underestimated in the PALM-ICON model; moreover, PALM-ICON gives an incorrect wind direction, which is almost opposite to the observation between hours 16:00–17:00. Comparison with the profiles of the BCs provided by mesoscale models (Fig. 4) shows that during most of the episode, PALM simulation performances tend to follow that of their respective BC profiles (in the lowest 250 m), with the notable exception of the hour 16:00 at which the highest wind speeds are imposed from the ICON model, followed by ALADIN, while in PALM driven by ICON, wind speeds are roughly half that of PALM driven by ALADIN. Some minor improvements can be identified in PALM simulations, e.g., the wind direction of PALM-ICON in hours 16:00 and 18:00. Further, it becomes obvious from Fig. 5 that the potential temperature inflow profiles obtained from the mesoscale models deviate significantly from the observation. More precisely, the near-surface stratification (up to z = 300 m) is overestimated compared to the observation, which suggests less turbulent mixing and altered wind profiles.
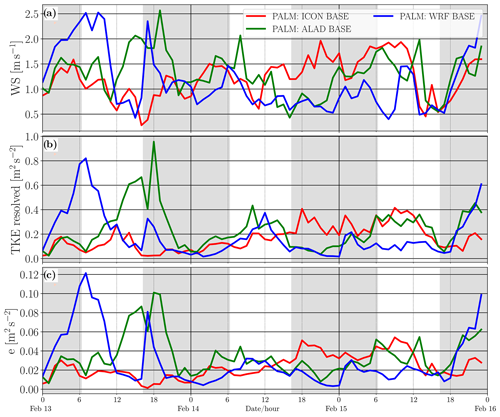
Figure 8(a–c) Comparison of the PALM-modeled wind speed (WS), resolved TKE (TKE), and SGS TKE (e) at the location of the ALEGA AIM station for scenarios PALM-ICON (red, base case), PALM-ALAD (green), and PALM-WRF (blue). The gray areas represent nighttime, and white areas represent the daytime.
Comparison of the modeled wind speed, resolved TKE, and subgrid-scale TKE in the street canyon for scenarios PALM-ICON, PALM-ALAD, and PALM-WRF (Fig. 8) shows that the overestimation of the concentrations in PALM-ICON in hours 16:00–19:00 and PALM-WRF in hours 15:00–16:00 agrees with the times with very low modeled wind speed and TKE in these models. The ratio of the PALM-ALAD vs. PALM-ICON modeled values of wind speed reaches maxima over 6, resolved TKE about 200, and subgrid-scale TKE about 40.
To show these results in a wider context, the maps of the PALM-ICON-modeled PM10 concentrations in the street canyon and over the roofs and the wind speed at 10 m from midday to midnight on 13 February are shown in Fig. S22. The maps show that the effect of the underestimation of the wind speed and overestimation of the concentrations which occurs over the whole domain is stronger in the densely built-up areas in the north and central parts of the domain and declines in the south part of the domain where the building density is lower and the ventilation is influenced by the opening caused by the deep valley. The overall statistics and performance metrics for the PALM-ICON model and all observation sensors, including Taylor diagrams and Q–Q plots, are provided and discussed in the related paper by Patiño et al. (2024).
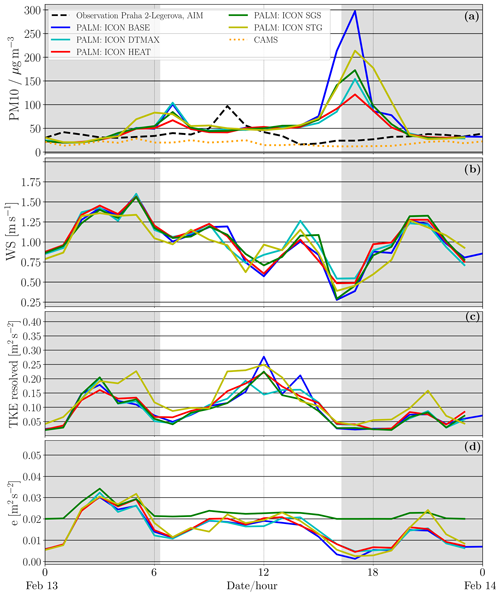
Figure 9(a–d) Comparison of the PALM-ICON-modeled values from the scenarios BASE (blue), HEAT (red), SGS (green), STG (yellow), and DTMAX (cyan) for the AIM station ALEGA. The graph (a) shows a comparison of concentrations of PM10 with observed values from the ALEGA station (dashed black line) and mesoscale values used as BCs (dotted orange line). The next graphs present modeled wind speed (b), resolved TKE (c), and subgrid-scale TKE (d). The gray areas represent nighttime, and white areas represent the daytime.
3.2 Effects of the PALM processes
Comparison of the observed concentration of PM10 for station ALEGA with the PALM-ICON model results for scenarios BASE, HEAT, SGS, STG, and DTMAX (see Fig. 9a) shows how much the modeled street canyon ventilation is influenced by adaptations of the particular scenarios. It shows that all scenarios differ very little from the base simulation except for the time of the peak period and partly during another small peak in the morning (hours 07:00–08:00). In hours of the main peak, the concentrations in all scenarios are significantly lower than the BASE simulation, but they still overestimate the observation. The most noticeable change can be observed for the scenario HEAT (heat from cars), with a decrease in concentrations from about 300 to 120 µg m−3 (decrease to 40 %), and the scenario DTMAX (limited model time step), which decreases concentrations to approximately 155 µg m−3 (decrease to approximately 50 %). Even so, the maximum ratio of the modeled to observed values still remains about 5 for HEAT and more than 6 for DTMAX.
The comparison of the modeled time series of wind speed in the area of ALEGA station (Fig. 9b) shows that street canyon wind speed is influenced very little by the adaptation of the scenarios. It is slightly and unsystematically increased in hours 12:00–18:00. A similar situation can be seen in the comparison of the vertical profiles of the modeled wind speed and wind direction with observations from lidar in Fig. S18. Comparison of the modeled time series of the resolved and subgrid-scale TKE (Fig. 9c and d) shows that the resolved TKE does not change significantly except for a slight increase in the scenario STG in most hours and that the subgrid-scale turbulence also does not change too much except for the increase in its values in the SGS scenario to values slightly higher than 0.02 m2 s−2, which is the lower-limit SGS TKE set in this scenario.
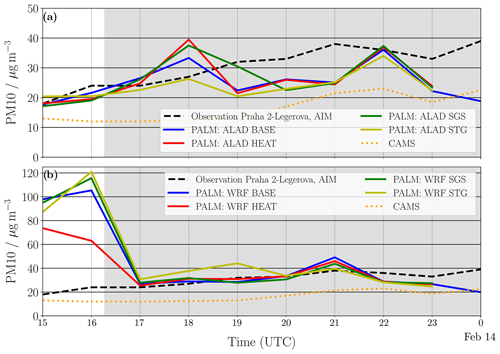
Figure 10(a, b) Comparison of the PALM-modeled and observed concentrations of PM10 on the AIM station ALEGA. (a) shows results for the PALM-ALAD model and (b) for the PALM-WRF model. The graphs show the simulation from the standard configuration of the model (BASE, blue), added anthropogenic heat from cars (HEAT, red), limit of subgrid-scale energy (SGS, green), and adapted profiles for synthetic turbulent generator (SGS, yellow). The gray areas represent nighttime, and white areas represent the daytime.
3.3 Effects of PALM processes with alternative meteorologies
To get a complete overview of the sensitivities, the sensitivity tests to model parameters were applied also to the meteorological scenarios PALM-ALAD and PALM-WRF. For computational feasibility reasons, these simulations were calculated for the most interesting hours of 14:00–24:00. Results (see Fig. 10) show very small differences between scenarios based on the PALM-ALAD model in all hours and the PALM-WRF model in hours 17:00–24:00. In hours 15:00–16:00 where the PALM-WRF model also overestimates observations, the scenario HEAT decreases the concentration from 105 to 65 µg m−3 (decrease to approx. 62 %), while the scenarios SGS and STG do not significantly change the concentration inside the street canyon. Also, there are no significant differences of the modeled wind profiles between these scenarios except slight modification of the wind speed profile for STG scenarios with PALM-WRF at hours 17:00–18:00 (see Figs. S19 and S20). These results confirm findings for the PALM-ICON sensitivity test.
This study confirms that stable conditions represent a challenge for urban boundary layer modeling. In addition to the challenges in modeling meteorological quantities in this situation, air quality modeling in an emission-laden street canyon adds an additional problem that increases the instability of the results. When the amount of the pollution transferred out of the canyon by ventilation drops near the level of the pollution produced by emissions, the pollutants start to accumulate in the canyon and each small change in the ventilation can lead to a large change in the pollution concentrations and increase them to unrealistic values.
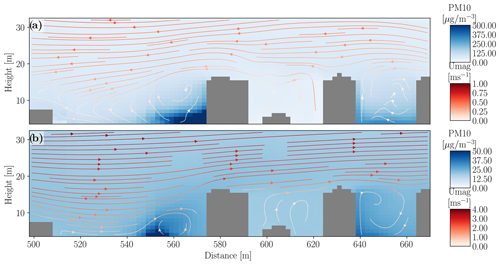
Figure 11(a, b) Comparison of the wind speed and PM10 concentrations at the west–east cross-section going through the area of ALEGA AIM station and lidar station for ICON (a) and ALADIN (b) scenarios. The values represent the 1 h time average from hour 17:00 to 18:00. The area of the lidar station is placed on the roof of the small building in the left bottom corner of the image, the Legerova street canyon is located between two buildings in the right side of the image. Note that the scales of the figures differ.
The comparison of the PALM results driven by different mesoscale meteorological models confirms the crucial role of the correct meteorological BCs for the comparability of the PALM results with observations as previously observed, e.g., by Radović et al. (2024). Figure 11, which compares concentrations and airflow inside the street canyon for PALM-ICON and PALM-ALAD, shows how BCs taken from two mesoscale models simulating the same real meteorological situation can lead to very different ventilation and air quality inside the street canyon.
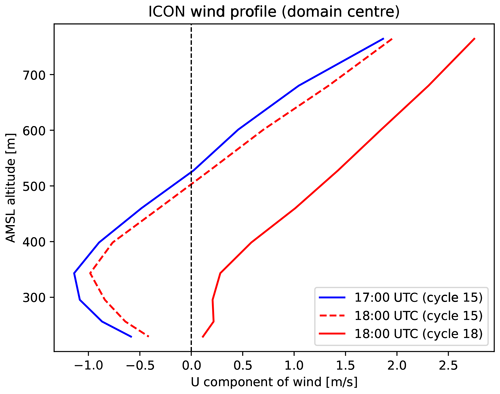
Figure 12Vertical profile of the U component of the wind from model ICON at hours 17:00 and 18:00 from the ICON prediction runs starting at 15:00 and 18:00 at the PALM domain center.
An additional factor which contributed to the very low model wind speed can be identified in the boundary conditions for PALM. The prediction for hour 17:00 was taken from the ICON run starting at 15:00 and the prediction for hour 18:00 was taken from the ICON run starting at 18:00 (see Sect. 2.4.2) and interpolated in PALM from these two inputs in between. As can be seen in Fig. 12 showing ICON vertical profiles of the prevailing U-wind component at 17:00 and 18:00, the wind direction is reversed in the prediction run starting at 18:00. Due to the internal interpolation between boundary conditions representing two opposite wind directions, wind velocities driving the PALM simulation reached values even lower than any ICON-predicted value and can be close to zero. This can contribute to the extreme concentration peak between 17:00 and 18:00 through suppressed ventilation.
On the other hand, the strength of the overestimation of concentrations from the PALM-ICON model in hours 16:00–18:00, which strongly exceed the values measured in this location throughout the year, suggests that it cannot be fully explained only by the meteorological conditions supplied by the mesoscale models, but it indicates some additional misrepresentation caused by the PALM model itself in the given situation. The sensitivities assess the potential of some adaptations to impact this behavior.
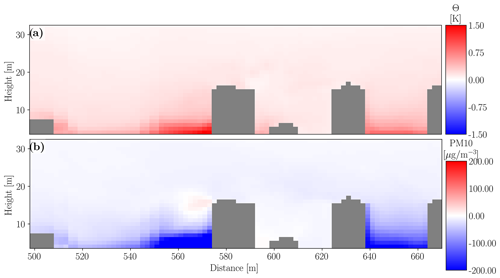
Figure 13(a, b) Difference of the HEAT minus BASE scenarios for the PALM-ICON model on 13 February 2023 at hour 18:00. The values of potential temperature Θ (a) and the concentration of PM10 (b) on the cross-section through the child domain in the position of the ALEGA station are shown. The view is limited to the area from the lidar station to Legerova street.
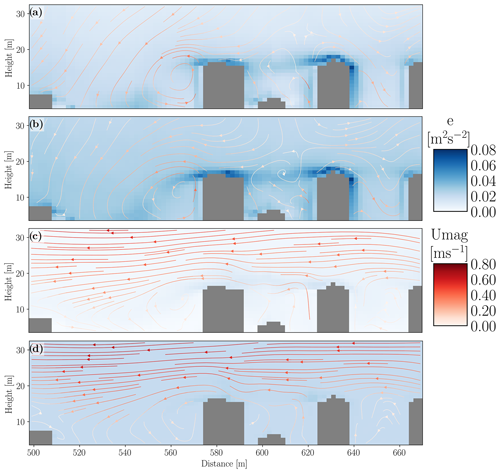
Figure 14(a–d) The SGS TKE for scenarios SGS and BASE on the child domain west–east cross-section through the area of the ALEGA AIM station. The figures show the BASE (a, c) and SGS (b, d) time average of SGS TKE for the time between hours 13:00–14:00 (a, b) and 17:00–18:00 (c, d). The view is limited to the area from the lidar station to Legerova street.
The anthropogenic heat from cars causes a significant change in concentrations for the model PALM-ICON only in two time periods (hour 08:00 and hours 17:00–18:00) and for the model PALM-WRF in hours 15:00–16:00. It shows that in meteorological situations with larger model wind flow, the additional ventilation induced in the street canyon by this anthropogenic heat is negligible in comparison with the ventilation caused by other turbulent flow. However, during the very stable situation, the modeled ventilation can be so low that the additional ventilation induced by this heat can disturb the stability of the air in the street canyon, and that can significantly influence the transport of the pollutants. Figure 13 compares the modeled air temperature and concentrations of PM10 in the west–east cross-section of the PALM child domain in the area of the ALEGA AIM station at the peak hour. The changes in the air temperature caused by the additional heat in the canyon of Legerova street do not exceed 1.2 K, but the decrease in the concentrations is substantial at about 66 %. Moreover, the increase in the temperature and decrease in the concentrations reach up to the height of 100 m above the surface (see Fig. S21), which shows that this adaptation also increases the exchange between the street canyon and the layers above the roofs. It suggests that the implementation of this feature in the PALM model would be desirable for air quality modeling in stable meteorological conditions.
The scenario SGS sets a lower limit for SGS TKE, which controls the modeled diffusion coefficient. That subsequently influences the ventilation of the street canyon and the dissipation of the chemical pollutants. The modeled concentrations only differ from the base case in times of strong model overestimation, i.e., in hours 07:00–08:00 in the morning and mainly 17:00–19:00 in the evening. Figure 14 shows a comparison of the modeled SGS TKE in the street canyon and its surroundings for hours 15:00 (situation before the peak episode) and 18:00 (peak episode). Before the peak period hour, turbulence is created in the interaction of the airflow with the urban canopy layer and the forced limitation of SGS TKE is applied only in the upper layers of the domain and has a negligible effect inside the street canyon. In the peak hour, the values of SGS TKE are low in the whole cross-section and the limit is applied in most parts of the cross-section. This explains the small changes in the concentrations inside the street canyon outside the peak episode.
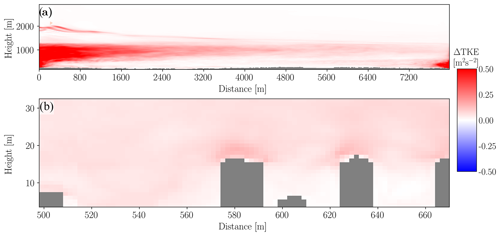
Figure 15(a, b) Differences of the modeled TKE for the scenarios STG and BASE for parent (a) and child (b) domains on the vertical west–east cross-section in the position of the ALEGA AIM station. The child domain view is limited to the area from the lidar station on the left side to the Legerova street canyon on the right side. Values represent the time average from hour 17:00 to 18:00.
This test shows the potential for improvements in SGS modeling. An approach that would limit the scalar diffusivity could be considered for partial mitigation of the underestimation of the modeled ventilation in the street canyon in stable situations. However, before its real application, more investigation and tests are needed to determine a proper procedure and the limit values under different meteorological conditions and/or land cover properties for particular vertical levels. Also, the impact of such a setting on other modeled values such as the resolved flow and turbulence or the concentrations of O3, NO, or NO2 needs to be tested (compare to, e.g., Makar et al., 2014).
The STG sensitivity test represents another approach where the local street canyon ventilation is not influenced locally but by changing the global TKE structure induced by the changes in TKE on the parent domain boundary. Figure 15 shows the comparison of TKE for BASE and STG scenarios for the parent and child domains at the peak hour. If the dominant length scale (which is parameterized in the model) is below the effective resolution of the advection scheme (which is roughly 80 m in the parent domain), the added perturbation dissipates. That can be partly seen in the results for the parent domain. It indicates potential for improvements of the profiles of turbulent stresses and length scales supplied to the STG. The remaining added turbulence inside the domain mainly influences the higher levels, while its influence on the low levels directly communicating with the street canyon is much lower. Despite this, the change in the TKE structure leads to increased street canyon ventilation and to a decrease in the PM10 concentrations by approximately 30 % at hour 18:00. It shows that potential future adaptations of the STG in PALM can be beneficial, specifically for such stable meteorological conditions, and that their assessment and testing shall include episodes of this type.
The DTMAX scenario differs from all other scenarios as it does not adjust physical processes in the model, but it tests the possible inaccuracies in the numerical scheme used in PALM during a stable situation.
Scalar dispersion, especially close to the source location, can be biased due to non-monotone discretizations of the advection term, where numerical errors lead to significant small-scale overshoots or undershoots associated with numerical dispersion errors and smoothing of small-scale patterns associated with dissipation errors (Ardeshiri et al., 2020). Even though we employed a flux-limiter scheme after Skamarock et al. (2008) for the vertical advection term to avoid overshooting and undershooting scalar concentration, scalar dispersion can still suffer from dissipation errors. Moreover, the advection scheme is only conditionally conservative; i.e., scalar conservation is achieved as long as the flow divergence is negligible. But this is not the case in simulations with terrain, e.g., near walls, where the divergence can be significant. Depending on its sign, the advection term can become a source or sink of scalars despite the correction term present in PALM at grid cells with solid-wall borders.
To avoid dissipation errors and assure a sufficient source representation by the numerical grid, preliminary measures were taken during preparation of the emission. Strong point sources (e.g., power plant chimneys) are rare in the Prague center and the preliminary test simulations proved that the existing ones have a negligible impact on street canyon concentrations in the studied area. To avoid potential dispersion error around these sources, they were omitted from the emission inputs. Further, emissions from transport were horizontally dissolved to the full street lanes, parking places and other relevant transport areas, and emissions from local heating were dissolved to the whole area of the building roofs.
As both these issues can be mitigated by decreasing the time step, this test highlights the role of discretization errors. The result of the simulation shows that apart from the concentration peak, none of these effects significantly affect the results. In the two peak hours of 16:00 and 17:00, this adaptation decreases the concentration by up to 50 %, which suggests possible problems with one or both of the discussed issues. Distinguishing between them, as well as testing suitable mitigation strategies (e.g., utilization of other advection schemes or testing of the improved divergence correction for scalar transports recently added to PALM), is out of the scope of this study and will require further investigation. But this test shows that in practical simulations of such extremely stable conditions, these effects can take place despite measures taken in preparation of the simulation.
Stable conditions still represent a challenge in LES modeling, especially for air quality modeling in poorly ventilated urban canyons where the lack of properly resolved turbulent eddies can lead to unrealistic predictions of air quality measures. At the same time, stable conditions are very important for air quality assessment as they are typically a precursor of bad air quality conditions. During the studied stable conditions, PALM underestimates the ventilation in the street canyon, which leads to strong overestimation of the air pollutant concentrations. This consequently leads to biased air pollution statistics for the whole episode, which could lead to wrong conclusions in practical applications. The main cause of the underestimation of the ventilation in the street canyon was the BCs supplied by the model ICON at given hours, while the same simulation with the alternative model ALADIN did not suffer from any overestimation of the concentrations. Moreover, at such stable conditions, induced by the ICON-provided BCs, the PALM model becomes sensitive to parameters and settings which play no significant role during other conditions. It shows that an assessment of the importance of the particular future model adaptations and development also needs to be performed in such extreme conditions.
Some suggestions for future model development and its applications follow from this study.
-
The meteorological conditions used for IBCs play a crucial role in the constitution of a system able to produce realistic results comparable with observations. The selection of the most suitable meteorological modeling system providing IBCs should be based on an evaluation performed for every modeled episode. Observations utilized for the evaluation should be located inside the domain, and, preferably, the observations directly or indirectly assimilated into this model should not be used for the evaluation. Also, the combination of different mesoscale prediction runs for creation of BCs can harm results in extreme cases.
-
For validation purposes, the mesoscale model information, serving as BCs for the LES, should be as accurate as possible. For modeling scenarios (e.g., response to changes in urban land cover or emissions and/or future climatologic scenarios), the boundary conditions do not necessarily need to represent an observed state. However, the represented state should be plausible so as to avoid an unrealistic response to the tested scenarios due to the LES high sensitivity to BCs.
-
Anthropogenic heat, which was evaluated as a nonsignificant contributor to the heat in a heat-wave episode in Juruš et al. (2016), increased modeled air temperature in the street canyon by up to 1.2 K during the studied stable winter conditions. This had a significant influence on the canyon ventilation, causing a 66 % decrease in the overestimation of the PM10 concentration in the street canyon. Adding the implementation of anthropogenic heat to PALM is therefore desirable for air quality modeling in stable conditions.
-
Limiting of the subgrid-scale TKE is an artificial adaptation which can ensure some basic level of diffusivity in cases where the model does not provide it. The limit of 0.02 m2 s−2 used in this study caused a 33 % decrease in the overestimation of the concentration during extremely stable conditions. However, a reasonable setting of this limit remains a question. For practical utilization, inhomogeneous setting for this limit based on, e.g., the surface roughness length and vertical level should be considered. Other adjustments of the SGS parameterization can also be considered, taking into account the large sensitivity of stably stratified turbulence to SGS modeling (see Couvreux et al., 2020; Dai et al., 2021). This topic requires further investigation.
-
The simple adaptation of the STG profiles changed TKE in both PALM modeling domains. The added turbulence partly dissipated during transport through the parent domain, but it still influenced the ventilation of the street canyon, which caused a decrease in the PM10 concentrations by approximately 30 %. A better utilization of the STG in PALM and the inclusion of TKE modeled by the mesoscale model can improve modeling of the TKE in PALM in stable conditions.
-
The decrease in the concentrations achieved by limiting the time step during the stable situation suggests issues with dispersion errors and/or mass conservation in the advection scheme used in PALM in such extreme conditions despite employing a flux-limiter scheme and the utilization of the spatially dissolved emissions. This issue can influence the reliability of the results and requires further investigation.
A1 Climatological description of Prague
In general terms, Prague is typical for a humid continental climate, with warm to hot summers (Köppen–Geiger climate type Dfb). The coldest month is January, with a daily mean air temperature of 0.4 °C (1991–2020 climate normal). In recent years, periods of mild temperatures in winter have been observed, especially in the period between the years 2021 and 2024. Summers in Prague are usually characterized by long sun irradiation; the daily mean air temperature in July, the hottest month, is 20.4 °C (1991–2020 climate normal). Precipitation in Prague is rather low (543.1 mm per year; 1991–2020 climate normal) since the city is located in the rain shadow of the Krušné hory. The driest season is usually winter (February, with a monthly mean of 21.8 mm), while late spring and summer can bring quite heavy rain, especially in the form of storms (around 80 mm per month in June, July, and August). Between mid-October and mid-March, temperature inversions are relatively common, bringing foggy, cold, or freezing days. Inversions in the wintertime are conducive to higher air pollution. Prague is also a windy city with prevailing western winds and an average wind speed of 4.5 m s−1 that helps to break temperature inversions and clear the air in cold months.
Observations used in this study are available in the repository at https://doi.org/10.5281/zenodo.10655033 (Bauerová et al., 2024b) under the Creative Commons Attribution 4.0 international license. PALM source code and input data used in the simulations are available in the repository at https://doi.org/10.5281/zenodo.10998235 (Geletič et al., 2024) under the Creative Commons Attribution 4.0 international license (data) and the GNU General Public License v.3 (source code). The tool PALM_METEO is available under the GNU General Public License v.3 from the repository at https://doi.org/10.5281/zenodo.11061001 (Krč et al., 2024). The emission model FUME is available under the GNU General Public License v.3 from the repository at https://doi.org/10.5281/zenodo.10142912 (Belda et al., 2023) and from https://github.com/FUME-dev (last access: 23 October 2024).
The supplement related to this article is available online at: https://doi.org/10.5194/gmd-17-7513-2024-supplement.
JaR – leading the TURBAN project, PALM development and simulations, emission processing. PB, JoK, AŠ – observation campaign, observation processing, observation expertise. MiB – data processing, post-processing, meteorological and air quality expertise. MaB – data preparation and post-processing, PALM model development, PALM simulations. KE – mesoscale simulations. VF – meteorological expertise, data post-processing. JG – input data collection and processing, post-processing. RJ, JaK – preparation of emission data. PK – PALM model development, PALM simulations, input data processing, post-processing. WP – air quality boundary data, post-processing. JeR – input data processing and testing, post-processing. HŘ – data preparation and post-processing, meteorological expertise. MS – meteorological and PALM expertise. OV – observation processing, emission processing, air quality boundary data, air quality expertise. All authors contributed to the experiment design and the manuscript text.
The contact author has declared that none of the authors has any competing interests.
Publisher's note: Copernicus Publications remains neutral with regard to jurisdictional claims made in the text, published maps, institutional affiliations, or any other geographical representation in this paper. While Copernicus Publications makes every effort to include appropriate place names, the final responsibility lies with the authors.
This work was supported by project TURBAN (TO01000219; TURBAN – Turbulent-resolving urban modeling of air quality and thermal comfort) supported by the Norway Grants and Technology Agency of the Czech Republic (TURBAN, 2024a, b). The research was also supported by the Johannes Amos Comenius Programme (P JAC) under project no. CZ.02.01.01/00/22_008/0004605: Natural and anthropogenic georisks. The PALM simulations, as well as pre- and post-processing, were performed on the HPC infrastructure of the Institute of Computer Science of the Czech Academy of Sciences (ICS) supported by the long-term strategic development financing of the ICS (RVO:67985807) and on facilities of the supercomputing center IT4I supported by the Ministry of Education, Youth and Sports of the Czech Republic through e-INFRA CZ (ID:90254). The co-author Matthias Sühring was supported by the German Federal Ministry of Education and Research (BMBF) under grant 01LP1601 within the framework of Research for Sustainable Development (FONA).
This research has been supported by the Technology Agency of the Czech Republic (grant no. TO01000219) and the Johannes Amos Comenius Programme (P JAC) (grant no. CZ.02.01.01/00/22_008/0004605).
This paper was edited by Jinkyu Hong and reviewed by two anonymous referees.
Ardeshiri, H., Cassiani, M., Park, S. Y., Stohl, A., Pisso, I., and Dinger, A. S.: On the convergence and capability of the large-eddy simulation of concentration fluctuations in passive plumes for a neutral boundary layer at infinite Reynolds number, Bound.-Lay. Meteorol., 176, 291–327, https://doi.org/10.1007/s10546-020-00537-6, 2020. a, b
Bauerová, P., Keder, J., Šindelářová, A., Vlček, O., Patiño, W., Resler, J., Krč, P., Geletič, J., Řezníček, H., Bureš, M., Eben, K., Belda, M., Radović, J., Fuka, V., Jareš, R., and Ezau, I.: Measurement report: TURBAN observation campaign combining street-level low-cost air quality sensors and meteorological profile measurements in Prague, EGUsphere [preprint], https://doi.org/10.5194/egusphere-2024-1222, 2024a. a, b
Bauerová, P., Šindelářová, A., Keder, J., Vlček, O., Patiño, W., Resler, J., Krč, P., Řezníček, H., Geletič, J., Bureš, M., Eben, K., Belda, M., Radović, J., Fuka, V., Jareš, R., and Ezau, I.: TURDATA: a database of low-cost air quality and remote sensing measurements for the validation of micro-scale models in the real Prague urban environments (0.1), Zenodo [data set], https://doi.org/10.5281/zenodo.10655033, 2024b. a
Belda, M., Resler, J., Geletič, J., Krč, P., Maronga, B., Sühring, M., Kurppa, M., Kanani-Sühring, F., Fuka, V., Eben, K., Benešová, N., and Auvinen, M.: Sensitivity analysis of the PALM model system 6.0 in the urban environment, Geosci. Model Dev., 14, 4443–4464, https://doi.org/10.5194/gmd-14-4443-2021, 2021. a, b
Belda, M., Krč, P., Resler, J., Huszár, P., Benešová, N., Karlický, J., and Juruš, P.: FUME-dev/fume: Official 2.0 release (2.0), Zenodo [code], https://doi.org/10.5281/zenodo.10142912, 2023. a
Belda, M., Benešová, N., Resler, J., Huszár, P., Vlček, O., Krč, P., Karlický, J., Juruš, P., and Eben, K.: FUME 2.0 – Flexible Universal processor for Modeling Emissions, Geosci. Model Dev., 17, 3867–3878, https://doi.org/10.5194/gmd-17-3867-2024, 2024. a
Blocken, B.: Computational Fluid Dynamics for urban physics: Importance, scales, possibilities, limitations and ten tips and tricks towards accurate and reliable simulations, Build. Environ., 91, 219–245, https://doi.org/10.1016/j.buildenv.2015.02.015, 2015. a
Blocken, B.: LES over RANS in building simulation for outdoor and indoor applications: A foregone conclusion?, in: Building Simulation, vol. 11, Springer, https://doi.org/10.1007/s12273-018-0459-3, 2018. a
Borna, M., Turci, G., Marchetti, M., and Schiano-Phan, R.: Evaluating the Influence of Urban Blocks on Air Pollution Concentration Levels: The Case Study of Golden Lane Estate in London, Sustainability, 16, 696, https://doi.org/10.3390/su16020696, 2024. a
Brožková, R., Bučánek, A., Mašek, J., Smolíková, P., and Trojáková, A.: Nová provozní konfigurace modelu Aladin ve vysokém rozlišení, Meteorologické Zprávy, 72, 129–139, https://www.chmi.cz/files/portal/docs/reditel/SIS/casmz/assets/2019/chmu_mz_5-19.pdf (last access: 23 October 2024), 2019 (in Czech). a
Byun, D. W., Young, J., and Pleim, J.: CMAQ Science Doc, Chapter 7: Numerical Transport Algorithms for CMAQ Chemical Transport Model in Generalized Coordinates, https://www.cmascenter.org/cmaq/science_documentation/pdf/ch07.pdf (last access: 23 October 2024), 1999. a
CAMS: Regional Production, Updated documentation covering all regional operational systems and the ENSEMBLE. Following U2 upgrade, February 2020, CAMS Report METEO-FRANCE, https://atmosphere.copernicus.eu/sites/default/files/2020-09/CAMS50_2018SC2_D2.0.2-U2_Models_documentation_202003_v2.pdf (last access: 21 April 2024), 2020. a
Cichowicz, R., Wielgosiński, G., and Fetter, W.: Effect of wind speed on the level of particulate matter PM10 concentration in atmospheric air during winter season in vicinity of large combustion plant, J. Atmos. Chem., 77, 35–48, https://doi.org/10.1007/s10874-020-09401-w, 2020. a
CMAQ: User manual, GitHub, https://github.com/USEPA/CMAQ/blob/main/DOCS/Users_Guide/PDF/CMAQ_UG_09_2019.pdf (last access: 20 April 2024), 2019. a
Couvreux, F., Bazile, E., Rodier, Q., Maronga, B., Matheou, G., Chinita, M. J., Edwards, J., van Stratum, B. J. H., van Heerwaarden, C. C., Huang, J., Moene, A. F., Cheng, A., Fuka, V., Basu, S., Bou-Zeid, E., Canut, G., and Vignon, E.: Intercomparison of large-eddy simulations of the Antarctic boundary layer for very stable stratification, Bound.-Lay. Meteorol., 176, 369–400, https://doi.org/10.1007/s10546-020-00539-4, 2020. a, b
Dai, Y., Basu, S., Maronga, B., and de Roode, S. R.: Addressing the grid-size sensitivity issue in large-eddy simulations of stable boundary layers, Bound.-Lay. Meteorol., 178, 63–89, https://doi.org/10.1007/s10546-020-00558-1, 2021. a
Deardorff, J. W.: Stratocumulus-capped mixed layers derived from a three-dimensional model, Bound.-Lay. Meteorol., 18, 495–527, https://doi.org/10.1007/BF00119502, 1980. a
EEA: EMEP/EEA air pollutant emission inventory guidebook 2019 – Technical guidance to prepare national emission inventories, European Environment Agency, Publications Office, https://doi.org/10.2800/293657, 2019. a
EIA: Environmental Impact Assessment, https://www.mzp.cz/en/environmental_impact_assessment (last access: 23 October 2024), 2007. a
EPA: Compilation of Air Pollutant Emission Factors, AP-42, Section 13.2.1, Paved roads, U.S. Environmental Protection Agency (EPA), USA, https://www.epa.gov/air-emissions-factors-and-quantification/ap-42-compilation-air-emissions-factors-stationary-sources (last access: 23 April 2024), 2011. a
Gál, C. V. and Kántor, N.: Modeling mean radiant temperature in outdoor spaces, A comparative numerical simulation and validation study, Urban Climate, 32, 100571, https://doi.org/10.1016/j.uclim.2019.100571, 2020. a
Gehrke, K. F., Sühring, M., and Maronga, B.: Modeling of land–surface interactions in the PALM model system 6.0: land surface model description, first evaluation, and sensitivity to model parameters, Geosci. Model Dev., 14, 5307–5329, https://doi.org/10.5194/gmd-14-5307-2021, 2021. a
Geletič, J., Lehnert, M., Resler, J., Krč, P., Bureš, M., Urban, A., and Krayenhoff, E.: Heat exposure variations and mitigation in a densely populated neighborhood during a hot day: Towards a people-oriented approach to urban climate management, Build. Environ., 242, 110564, https://doi.org/10.1016/j.buildenv.2023.110564, 2023. a
Geletič, J., Bauerová, P., Belda, M., Bureš, M., Eben, K., Fuka, V., Jareš, R., Karel, J., Keder, J., Krč, P., Patiño, W., Radović, J., Resler, J., Řezníček, H., and Vlček, O.: Challenges of high-fidelity air quality modeling in urban environments – PALM sensitivity study during stable conditions (TURBAN) (1.00), Zenodo [data set], https://doi.org/10.5281/zenodo.10998235, 2024. a
Grimmond, C. S. B., Blackett, M., Best, M. J., Barlow, J., Baik, J.-J., Belcher, S. E., Bohnenstengel, S. I., Calmet, I., Chen, F., Dandou, A., Fortuniak, K., Gouvea, M. L., Hamdi, R., Hendry, M., Kawai, T., Kawamoto, Y., Kondo, H., Krayenhoff, E. S., Lee, S.-H., Loridan, T., Martilli, A., Masson, V., Miao, S., Oleson, K., Pigeon, G., Porson, A., Ryu, Y.-H., Salamanca, F., Shashua-Bar, L., Steeneveld, G.-J., Tombrou, M., Voogt, J., Young, D., and Zhang, N.: The international urban energy balance models comparison project: first results from phase 1, J. Appl. Meteorol. Clim., 49, 1268–1292, https://doi.org/10.1175/2010JAMC2354.1, 2010. a
Grimmond, C. S. B., Blackett, M., Best, M. J., Baik, J.-J., Belcher, S., Beringer, J., Bohnenstengel, S., Calmet, I., Chen, F., Coutts, A., Dandou, A., Fortuniak, K., Gouvea, M. L., Hamdi, R., Hendry, M., Kanda, M., Kawai, T., Kawamoto, Y., Kondo, H., Krayenhoff, E. S., Lee, S. H., Loridan, T., Martilli, A., Masson, V., Miao, S., Oleson, K., Ooka, R., Pigeon, G., Porson, A., Ryu, Y.-H., Salamanca, F., Steeneveld, G. J., Tombrou, M., Voogt, J. A., Young, D. T., and Zhang, N.: Initial results from Phase 2 of the international urban energy balance model comparison, Int. J. Climatol., 31, 244–272, https://doi.org/10.1002/joc.2227, 2011. a
Gronemeier, T. and Sühring, M.: On the Effects of Lateral Openings on Courtyard Ventilation and Pollution—A Large-Eddy Simulation Study, Atmosphere, 10, 63, https://doi.org/10.3390/atmos10020063, 2019. a
Gronemeier, T., Surm, K., Harms, F., Leitl, B., Maronga, B., and Raasch, S.: Evaluation of the dynamic core of the PALM model system 6.0 in a neutrally stratified urban environment: comparison between LES and wind-tunnel experiments, Geosci. Model Dev., 14, 3317–3333, https://doi.org/10.5194/gmd-14-3317-2021, 2021. a
Grylls, T., Le Cornec, C. M., Salizzoni, P., Soulhac, L., Stettler, M. E., and Van Reeuwijk, M.: Evaluation of an operational air quality model using large-eddy simulation, Atmospheric Environment: X, 3, 100041, https://doi.org/10.1016/j.aeaoa.2019.100041, 2019. a
Hamdi, R., Kusaka, H., Doan, Q.-V., Cai, P., He, H., Luo, G., Kuang, W., Caluwaerts, S., Duchêne, F., Van Schaeybroek, B., and Termonia, P.: The state-of-the-art of urban climate change modeling and observations, Earth Systems and Environment, 4, 631–646, https://doi.org/10.1007/s41748-020-00193-3, 2020. a, b, c
Hellsten, A., Ketelsen, K., Sühring, M., Auvinen, M., Maronga, B., Knigge, C., Barmpas, F., Tsegas, G., Moussiopoulos, N., and Raasch, S.: A nested multi-scale system implemented in the large-eddy simulation model PALM model system 6.0, Geosci. Model Dev., 14, 3185–3214, https://doi.org/10.5194/gmd-14-3185-2021, 2021. a
Hersbach, H., Bell, B., Berrisford, P., Biavati, G., Horányi, A., Muñoz Sabater, J., Nicolas, J., Peubey, C., Radu, R., Rozum, I., Schepers, D., Simmons, A., Soci, C., Dee, D., and Thépaut, J.-N.: ERA5 hourly data on single levels from 1940 to present, Copernicus Climate Change Service (C3S), Climate Data Store (CDS) [data set], https://doi.org/10.24381/cds.adbb2d47, 2023. a
Jeanjean, A. P., Monks, P. S., and Leigh, R. J.: Modelling the effectiveness of urban trees and grass on PM2.5 reduction via dispersion and deposition at a city scale, Atmos. Environ., 147, 1–10, https://doi.org/10.1016/j.atmosenv.2016.09.033, 2016. a
Juruš, P., Resler, J., Derbek, P., Krč, P., Belda, M., Benešová, N., Vlček, O., Srbová, D., Eben, K., and Hrubeš, P.: High resolution modelling of anthropogenic heat from traffic in urban canopy: A sensitivity study, in: 2016 Smart Cities Symposium Prague (SCSP), 26–27 May 2016, Prague, Czech Republic, IEEE, https://doi.org/10.1109/SCSP.2016.7501031, 2016. a, b
Kadasch, E., Sühring, M., Gronemeier, T., and Raasch, S.: Mesoscale nesting interface of the PALM model system 6.0, Geosci. Model Dev., 14, 5435–5465, https://doi.org/10.5194/gmd-14-5435-2021, 2021. a, b
Karel, J., Jareš, R., Martinovský, J., Polák, R., Smolová, E., and Šimonová, K.: Metodika pro výpočet emisí částic pocházejících z resuspenze ze silniční dopravy, CENEST, https://www.mzp.cz/C1257458002F0DC7/cz/doprava/$FILE/OOO-resuspenze_metodika-20190708.pdf (last access: 23 October 2024), data upon request, 2015 (in Czech). a
Karel, J., Jareš, R., Martinovský, J., Polák, R., and Smolová, E.: Projekt TH03030496 Zmapování a emisní bilance neevidovaných zdrojů emisí znečišt́ujících látek na území městských aglomerací. Mapa neevidovaných zdrojů emisí znečišt́ujících látek na území aglomerace CZ01 Praha, ATEM – Studio of ecological models, Roztylská 1860/1, 148 00 Prague 4, Czech Republic, https://www.atem.cz/neevidovane_zdroje.php (last access: 23 October 2024), results partly available online, data upon request, 2020 (in Czech). a
Karel, J., Jareš, R., Martinovský, J., Polák, R., and Smolová, E.: Zpráva o dynamické skladbě vozového parku na území hlavního města Prahy v roce 2020, https://praha.eu/web/portalzp/w/zprava-o-dynam-skladbe-voz-parku-na-uzemi-hmp-v-roce-2020 (last access: 23 October 2024), data upon request, 2021 (in Czech). a
Khan, B., Banzhaf, S., Chan, E. C., Forkel, R., Kanani-Sühring, F., Ketelsen, K., Kurppa, M., Maronga, B., Mauder, M., Raasch, S., Russo, E., Schaap, M., and Sühring, M.: Development of an atmospheric chemistry model coupled to the PALM model system 6.0: implementation and first applications, Geosci. Model Dev., 14, 1171–1193, https://doi.org/10.5194/gmd-14-1171-2021, 2021. a
Kim, Y., Castro, I. P., and Xie, Z.-T.: Divergence-free turbulence inflow conditions for large-eddy simulations with incompressible flow solvers, Comput. Fluids, 84, 56–68, https://doi.org/10.1016/j.compfluid.2013.06.001, 2013. a
Krč, P., Resler, J., Sühring, M., Schubert, S., Salim, M. H., and Fuka, V.: Radiative Transfer Model 3.0 integrated into the PALM model system 6.0, Geosci. Model Dev., 14, 3095–3120, https://doi.org/10.5194/gmd-14-3095-2021, 2021. a, b
Krč, P., Bureš, M., Resler, J., and Belda, M.: PALM-METEO: Advanced modular tool for preparing meteorological inputs to the PALM model, Zenodo [code], https://doi.org/10.5281/zenodo.11061001, 2024. a
Letzel, M. O., Krane, M., and Raasch, S.: High resolution urban large-eddy simulation studies from street canyon to neighbourhood scale, Atmos. Environ., 42, 8770–8784, https://doi.org/10.1016/j.atmosenv.2008.08.001, 2008. a
Lo, K. and Ngan, K.: Characterising the pollutant ventilation characteristics of street canyons using the tracer age and age spectrum, Atmos. Environ., 122, 611–621, https://doi.org/10.1016/j.atmosenv.2015.10.023, 2015. a
Lo, K. W. and Ngan, K.: Characterizing Ventilation and Exposure in Street Canyons Using Lagrangian Particles, J. Appl. Meteorol. Clim., 56, 1177–1194, https://doi.org/10.1175/JAMC-D-16-0168.1, 2017. a
Lumet, E., Jaravel, T., Rochoux, M. C., Vermorel, O., and Lacroix, S.: Assessing the Internal Variability of Large-Eddy Simulations for Microscale Pollutant Dispersion Prediction in an Idealized Urban Environment, Bound.-Lay. Meteorol., 190, 9, https://doi.org/10.1007/s10546-023-00853-7, 2024. a
Makar, P. A., Nissen, R., Teakles, A., Zhang, J., Zheng, Q., Moran, M. D., Yau, H., and diCenzo, C.: Turbulent transport, emissions and the role of compensating errors in chemical transport models, Geosci. Model Dev., 7, 1001–1024, https://doi.org/10.5194/gmd-7-1001-2014, 2014. a, b
Maronga, B. and Li, D.: An investigation of the grid sensitivity in large-eddy simulations of the stable boundary layer, Bound.-Lay. Meteorol., 182, 251–273, https://doi.org/10.1007/s10546-021-00656-8, 2022. a
Maronga, B., Banzhaf, S., Burmeister, C., Esch, T., Forkel, R., Fröhlich, D., Fuka, V., Gehrke, K. F., Geletič, J., Giersch, S., Gronemeier, T., Groß, G., Heldens, W., Hellsten, A., Hoffmann, F., Inagaki, A., Kadasch, E., Kanani-Sühring, F., Ketelsen, K., Khan, B. A., Knigge, C., Knoop, H., Krč, P., Kurppa, M., Maamari, H., Matzarakis, A., Mauder, M., Pallasch, M., Pavlik, D., Pfafferott, J., Resler, J., Rissmann, S., Russo, E., Salim, M., Schrempf, M., Schwenkel, J., Seckmeyer, G., Schubert, S., Sühring, M., von Tils, R., Vollmer, L., Ward, S., Witha, B., Wurps, H., Zeidler, J., and Raasch, S.: Overview of the PALM model system 6.0, Geosci. Model Dev., 13, 1335–1372, https://doi.org/10.5194/gmd-13-1335-2020, 2020. a, b, c, d
Masson, V., Heldens, W., Bocher, E., Bonhomme, M., Bucher, B., Burmeister, C., de Munck, C., Esch, T., Hidalgo, J., Kanani-Sühring, F., Kwok, Y.-T., Lemonsu, A., Lévy, J.-P., Maronga, B., Pavlik, D., Petit, G., See, L., Schoetter, R., Tornay, N., Votsis, A., and Zeidler, J.: City-descriptive input data for urban climate models: Model requirements, data sources and challenges, Urban Climate, 31, 100536, https://doi.org/10.1016/j.uclim.2019.100536, 2020. a
MEFA, Karel, J., Jareš, R., Martinovský, J., Polák, R., and Smolová, E.: Transportation emission model, ATEM – Studio of ecological models, Roztylská 1860/1, 148 00 Prague 4, Czech Republic, https://www.atem.cz/mefa.php (last access: 23 October 2024), data upon request, 2013 (in Czech). a
Moeng, C.-H. and Wyngaard, J. C.: Spectral analysis of large-eddy simulations of the convective boundary layer, J. Atmos. Sci., 45, 3573–3587, https://doi.org/10.1175/1520-0469(1988)045<3573:SAOLES>2.0.CO;2, 1988. a
Nazarian, N., Lipson, M., and Norford, L. K.: Multiscale modeling techniques to document urban climate change, in: Urban Climate Change and Heat Islands, edited by: Paolini, R. and Santamouris, M., Elsevier, https://doi.org/10.1016/B978-0-12-818977-1.00004-1, pp. 123–164, 2023. a
Oke, T. R., Mills, G., Christen, A., and Voogt, J. A.: Urban climates, Cambridge University Press, https://doi.org/10.1017/9781139016476, 2017. a
OTE: Gas Load Profiles – temperature and recalculated TDD, OTE a.s, Sokolovská 192/79, Prague 8, Czech Republic, https://www.ote-cr.cz/en/statistics/gas-load-profiles/normalized-lp?set_language=en (last access: 23 October 2024), 2024. a
Patiño, W. R., Vlček, O., Bauerová, P., Belda, M., Bureš, M., Eben, K., Fuka, V., Geletič, J., Jareš, R., Karel, J., Keder, J., Krč, P., Radović, J., Řezníček, H., Šindelářová, A., and Resler, J.: On the suitability of dispersion models of varying degree of complexity for air quality assessment and urban planning, Build. Environ., 264, 111892, https://doi.org/10.1016/j.buildenv.2024.111892, 2024. a, b
Radović, J., Belda, M., Resler, J., Eben, K., Bureš, M., Geletič, J., Krč, P., Řezníček, H., and Fuka, V.: Challenges of constructing and selecting the “perfect” boundary conditions for the large-eddy simulation model PALM, Geosci. Model Dev., 17, 2901–2927, https://doi.org/10.5194/gmd-17-2901-2024, 2024. a, b, c
Reinert, D., Prill, F., Frank, H., Denhard, M., Baldauf, M., Schraff, C., Gebhardt, C., Marsigli, C., and Zängl, G.: DWD database reference for the global and regional ICON and ICON-EPS forecasting system, DWD 2023, Deutscher Wetterdienst, Frankfurter Straße 135, Offenbach am Main, Germany, https://www.dwd.de/DWD/forschung/nwv/fepub/icon_database_main.pdf (last access: 23 October 2024), 2020. a
Resler, J., Krč, P., Belda, M., Juruš, P., Benešová, N., Lopata, J., Vlček, O., Damašková, D., Eben, K., Derbek, P., Maronga, B., and Kanani-Sühring, F.: PALM-USM v1.0: A new urban surface model integrated into the PALM large-eddy simulation model, Geosci. Model Dev., 10, 3635–3659, https://doi.org/10.5194/gmd-10-3635-2017, 2017. a, b
Resler, J., Eben, K., Geletič, J., Krč, P., Rosecký, M., Sühring, M., Belda, M., Fuka, V., Halenka, T., Huszár, P., Karlický, J., Benešová, N., Ďoubalová, J., Honzáková, K., Keder, J., Nápravníková, Š., and Vlček, O.: Validation of the PALM model system 6.0 in a real urban environment: a case study in Dejvice, Prague, the Czech Republic, Geosci. Model Dev., 14, 4797–4842, https://doi.org/10.5194/gmd-14-4797-2021, 2021. a, b, c, d, e, f, g
Saiki, E. M., Moeng, C.-H., and Sullivan, P. P.: Large-eddy simulation of the stably stratified planetary boundary layer, Bound.-Lay. Meteorol., 95, 1–30, https://doi.org/10.1023/A:1002428223156, 2000. a
Salim, M. H., Schubert, S., Resler, J., Krč, P., Maronga, B., Kanani-Sühring, F., Sühring, M., and Schneider, C.: Importance of radiative transfer processes in urban climate models: a study based on the PALM 6.0 model system, Geosci. Model Dev., 15, 145–171, https://doi.org/10.5194/gmd-15-145-2022, 2022. a
Samad, A., Caballero Arciénega, N. A., Alabdallah, T., and Vogt, U.: Application of the Urban Climate Model PALM-4U to Investigate the Effects of the Diesel Traffic Ban on Air Quality in Stuttgart, Atmosphere, 15, 111, https://doi.org/10.3390/atmos15010111, 2024. a
Schoetter, R., Caliot, C., Chung, T.-Y., Hogan, R. J., and Masson, V.: Quantification of uncertainties of radiative transfer calculation in urban canopy models, Bound.-Lay. Meteorol., 189, 103–138, https://doi.org/10.1007/s10546-023-00827-9, 2023. a
Skamarock, W., Klemp, J., Dudhia, J., Gill, D. O., Barker, D., Duda, M. G., Huang, X.-Y., Wang, W., and Powers, J. G.: A description of the advanced research WRF version 3, NCAR technical note, 475, National Center for Atmospheric Research (NCAR), Boulder, Colorado, USA, https://doi.org/10.5065/D68S4MVH, 2008. a
Stewart, I. D. and Oke, T. R.: Local climate zones for urban temperature studies, B. Am. Meteorol. Soc., 93, 1879–1900, https://doi.org/10.1175/BAMS-D-11-00019.1, 2012. a
Termonia, P., Fischer, C., Bazile, E., Bouyssel, F., Brožková, R., Bénard, P., Bochenek, B., Degrauwe, D., Derková, M., El Khatib, R., Hamdi, R., Mašek, J., Pottier, P., Pristov, N., Seity, Y., Smolíková, P., Španiel, O., Tudor, M., Wang, Y., Wittmann, C., and Joly, A.: The ALADIN System and its canonical model configurations AROME CY41T1 and ALARO CY40T1, Geosci. Model Dev., 11, 257–281, https://doi.org/10.5194/gmd-11-257-2018, 2018. a
Tian, G., Ma, Y., Chen, Y., Wan, M., and Chen, S.: Impact of urban canopy characteristics on turbulence dynamics: Insights from large eddy simulation, Build. Environ., 250, 111183, https://doi.org/10.1016/j.buildenv.2024.111183, 2024. a
TURBAN: Turbulent-resolving urban modeling of air quality and thermal comfort (information on the project in the on-line database of the Czech research), Technology Agency of the Czech Republic (TA CR), Evropská 1692/37, Praha, Czech Republic, https://starfos.tacr.cz/en/projekty/TO01000219 (last access: 23 October 2024), 2024a. a
TURBAN: Turbulent-resolving urban modeling of air quality and thermal comfort (project website), ATEM – Studio of ecological models, Roztylská 1860/1, 148 00 Prague 4, Czech Republic, https://project-turban.eu/(last access: 23 October 2024), 2024b. a
United Nations, Department of Economic and Social Affairs, Population Division: World Population Prospects 2022: Summary of Results, United Nations, Department of Economic and Social Affairs, Population Division, https://population.un.org/wpp/Publications/ (last access: 23 October 2024), 2022. a
Van der Gon, H. D., Hendriks, C., Kuenen, J., Segers, A., and Visschedijk, A.: Description of current temporal emission patterns and sensitivity of predicted AQ for temporal emission patterns, EU FP7 MACC, TNO Report, TNO, Princetonlaan 6, Utrecht, the Netherlands, https://atmosphere.copernicus.eu/sites/default/files/2019-07/MACC_TNO_del_1_3_v2.pdf (last access: 17 April 2024), 2011. a
van Hooff, T., Blocken, B., and Tominaga, Y.: On the accuracy of CFD simulations of cross-ventilation flows for a generic isolated building: Comparison of RANS, LES and experiments, Build. Environ., 114, 148–165, https://doi.org/10.1016/j.buildenv.2016.12.019, 2017. a
Wang, S., McGibbon, J., and Zhang, Y.: Predicting high-resolution air quality using machine learning: Integration of large eddy simulation and urban morphology data, Environ. Pollut., 344, 123371, https://doi.org/10.1016/j.envpol.2024.123371, 2024. a
Weger, M. and Heinold, B.: Air pollution trapping in the Dresden Basin from gray-zone scale urban modeling, Atmos. Chem. Phys., 23, 13769–13790, https://doi.org/10.5194/acp-23-13769-2023, 2023. a
Wicker, L. J. and Skamarock, W. C.: Time-Splitting Methods for Elastic Models Using Forward Time Schemes, Mon. Weather Rev., 130, 2088–2097, https://doi.org/10.1175/1520-0493(2002)130<2088:TSMFEM>2.0.CO;2, 2002. a
Williamson, J. H.: Low-storage Runge-Kutta schemes, J. Comput. Phys., 35, 48–56, https://doi.org/10.1016/0021-9991(80)90033-9, 1980. a
Wolf, T., Esau, I., and Reuder, J.: Analysis of the vertical temperature structure in the Bergen valley, Norway, and its connection to pollution episodes, J. Geophys. Res.-Atmos., 119, 10645–10662, https://doi.org/10.1002/2014JD022085, 2014. a, b
Wolf, T., Pettersson, L. H., and Esau, I.: A very high-resolution assessment and modelling of urban air quality, Atmos. Chem. Phys., 20, 625–647, https://doi.org/10.5194/acp-20-625-2020, 2020. a, b
Xie, Z.-T. and Castro, I. P.: Efficient generation of inflow conditions for large eddy simulation of street-scale flows, Flow Turbul. Combust., 81, 2008. a
Zhang, Y., Ye, X., Wang, S., He, X., Dong, L., Zhang, N., Wang, H., Wang, Z., Ma, Y., Wang, L., Chi, X., Ding, A., Yao, M., Li, Y., Li, Q., Zhang, L., and Xiao, Y.: Large-eddy simulation of traffic-related air pollution at a very high resolution in a mega-city: evaluation against mobile sensors and insights for influencing factors, Atmos. Chem. Phys., 21, 2917–2929, https://doi.org/10.5194/acp-21-2917-2021, 2021. a


