the Creative Commons Attribution 4.0 License.
the Creative Commons Attribution 4.0 License.
 | 20 Jun 2024
Evaluation of CMIP6 model simulations of PM2.5 and its components over China
Fangxuan Ren
Chenghao Xu
Jamiu A. Adeniran
Jingxu Wang
Randall V. Martin
Aaron van Donkelaar
Melanie S. Hammer
Larry W. Horowitz
Steven T. Turnock
Naga Oshima
Jie Zhang
Susanne Bauer
Kostas Tsigaridis
Øyvind Seland
Pierre Nabat
David Neubauer
Gary Strand
Twan van Noije
Philippe Le Sager
Toshihiko Takemura
Earth system models (ESMs) participating in the latest Coupled Model Intercomparison Project Phase 6 (CMIP6) simulate various components of fine particulate matter (PM2.5) as major climate forcers. Yet the model performance for PM2.5 components remains little evaluated due in part to a lack of observational data. Here, we evaluate near-surface concentrations of PM2.5 and its five main components over China as simulated by 14 CMIP6 models, including organic carbon (OC; available in 14 models), black carbon (BC; 14 models), sulfate (14 models), nitrate (4 models), and ammonium (5 models). For this purpose, we collect observational data between 2000 and 2014 from a satellite-based dataset for total PM2.5 and from 2469 measurement records in the literature for PM2.5 components. Seven models output total PM2.5 concentrations, and they all underestimate the observed total PM2.5 over eastern China, with GFDL-ESM4 (−1.5 %) and MPI-ESM-1-2-HAM (−1.1 %) exhibiting the smallest biases averaged over the whole country. The other seven models, for which we recalculate total PM2.5 from the available component output, underestimate the total PM2.5 concentrations partly because of the missing model representations of nitrate and ammonium. Concentrations of the five individual components are underestimated in almost all models, except that sulfate is overestimated in MPI-ESM-1-2-HAM by 12.6 % and in MRI-ESM2-0 by 24.5 %. The underestimation is the largest for OC (by −71.2 % to −37.8 % across the 14 models) and the smallest for BC (−47.9 % to −12.1 %). The multi-model mean (MMM) reproduces the observed spatial pattern for OC (R = 0.51), sulfate (R = 0.57), nitrate (R = 0.70) and ammonium (R = 0.74) fairly well, yet the agreement is poorer for BC (R = 0.39). The varying performances of ESMs on total PM2.5 and its components have important implications for the modeled magnitude and spatial pattern of aerosol radiative forcing.
- Article
(4172 KB) - Full-text XML
-
Supplement
(2022 KB) - BibTeX
- EndNote


Fine particulate matter (PM2.5) influences air quality, human health, and climate change. Exposure to near-surface PM2.5 is associated with millions of global premature deaths each year (Zhang et al., 2017; World Health Organization, 2021). PM2.5 affects the radiative budget of the climate system directly through scattering and absorption and indirectly via clouds. The effects of atmospheric aerosols on cloud droplet concentrations, cloud distributions, and radiative properties pose large uncertainties in the estimating radiative forcing (Carslaw et al., 2013; Seinfeld et al., 2016). Earth system models (ESMs) are essential tools for studying global climate change. The accuracy of PM2.5 simulations in ESMs exhibits a crucial constraint on the reliability of these models in climate change simulation and projection. The Coupled Model Intercomparison Project Phase 6 (CMIP6) provides an opportunity to evaluate PM2.5 and its components simulated by the current-generation ESMs which implement interactive aerosol and atmospheric chemistry (Turnock et al., 2020). A total of 21 ESMs participating in CMIP6 provide total PM2.5 and/or several component simulations, although the aerosol component species vary across these models. Of these 21 ESMs, 14 models include organic aerosol (OA; converted to organic carbon (OC) in this study by assuming = 1.6), black carbon (BC), sulfate, dust (DST), and sea salt (SSLT). Of these 14 models, 4 also include nitrate, and 5 include ammonium (Table S1).
Aerosol optical depth (AOD) during 2000–2014 simulated in CMIP5 and CMIP6 is in broad agreement with satellite retrievals over most parts of Europe, North America, and India (L. Zhang et al., 2022; Cherian and Quaas, 2020). CMIP6 models better capture satellite-based AOD trends in western North America and eastern China, whereas CMIP5 models failed to reproduce the trends in AOD (Mortier et al., 2020; Cherian and Quaas, 2020). Studies have emerged over recent years to assess the CMIP model performance of individual aerosol components. An assessment of CMIP5 dust aerosol simulations using independent data from 1851 to 2011 over North Africa shows a common underestimate (Evan et al., 2016). Another analysis of the CMIP3 and CMIP5 models suggests sea salt aerosols over the tropical Pacific to be significantly underestimated (Chen et al., 2020). Evaluation of the vertical distribution of BC in CMIP5 models based on aircraft measurements shows an overestimate in the upper troposphere, especially over the central Pacific (Allen and Landuyt, 2014). Several CMIP5 models produce high sulfate burdens over eastern China, the Indian Peninsula, and the northern Indochinese Peninsula, although the transport difference among these models results in distinctive spatial distributions (Li et al., 2020). Overall, global climate models struggle to accurately reproduce observed aerosol component concentrations over different world regions.
China is a major region with heavy aerosol pollution, dense population, and complex climate, and thus it is critical to understand the performance of ESMs for aerosol simulations over this country. Several studies have evaluated total PM2.5 simulations of CMIP models over China, using AOD data from satellite retrievals (Sockol and Small Griswold, 2017; Michou et al., 2020) and ground-based aerosol networks (Mortier et al., 2020). They find that CMIP5 models reproduce the spatial pattern of AOD reasonably well over eastern China but with a tendency to underestimate AOD magnitudes (Liu and Liao, 2017; Park et al., 2014; Allen et al., 2013). The Geophysical Fluid Dynamics Laboratory Coupled Model 3 (GFDL CM3) performs best among CMIP5 models in simulating AOD over eastern China, partly because it includes nitrate and ammonium, which most models lack (Li et al., 2020). Other studies suggest that CMIP6 models simulate the magnitude of annual mean AOD better than CMIP5 over eastern China, in part due to the notable increase in sulfate (Cherian and Quaas, 2020; Fan et al., 2018b). Nonetheless, the CMIP6 models fail to capture the seasonal north–south shift of the AOD maximum center over China during 2000–2014 (Li et al., 2021) and the observed dipole pattern of AOD trends between China and India during 2006–2014 (Z. Wang et al., 2021).
Different PM2.5 components exhibit distinctive radiative effects; thus, understanding the performance of ESMs in simulating individual PM2.5 components is important. Due to the absence of publicly available observational component data over China, only a few studies target single aerosol components (such as sulfate and dust) over a large region of the country or different PM2.5 components over a short period or a small region (Pu and Ginoux, 2018; Zhao et al., 2022). For example, a model evaluation based on the Acid Deposition Monitoring Network in East Asia (EANET) suggests that sulfate concentrations simulated by CMIP5 and CMIP6 show a rising trend similar to observations (Mulcahy et al., 2020), but the simulations are still lower than observed concentrations (Fan et al., 2018a; Mortier et al., 2020). A recent study compares PM2.5 components (dust, sea salt, BC, OC, and sulfate) in CMIP6 models with the Modern Era Retrospective analysis for Research and Applications Aerosol Reanalysis (MERRAero) in Asia from 2005 to 2020 (Su et al., 2022; Buchard et al., 2016). The study shows that CMIP6 model uncertainties in the total PM2.5 over East Asia are mainly attributable to sulfate and mineral dust simulations. However, the model biases may partly come from other components (nitrate and ammonium) that are not analyzed in their study, and the MERRAero data might contain errors as well (Ma et al., 2021; Mahesh et al., 2019).
In this study, we evaluate near-surface concentrations of PM2.5 and its five main components (OC, BC, sulfate, nitrate, and ammonium) from 2000 to 2014 over China simulated by 14 CMIP6 models driven by historical emissions. For this purpose, we employ a satellite-based dataset for total PM2.5 concentrations and a self-compiled PM2.5 component dataset from 221 ground stations during 2000–2014 collected from the literature. Section 2 introduces CMIP6 model simulations, satellite-based total PM2.5 concentration data, and literature-based PM2.5 component data. Section 3 assesses the performance of CMIP6 models for total PM2.5. Section 4 evaluates the simulated PM2.5 components. Section 5 discusses the climate implications of the inadequacies in total PM2.5 and its components in CMIP6 models. Section 6 concludes the study.
2.1 CMIP6 simulations
Near-surface concentrations of total PM2.5 and its components can be converted from dry aerosol mass mixing ratios (MMRs) in CMIP6 models. Monthly mean near-surface MMRs (in the lowest model layer) of PM2.5 and its main components are taken from 14 CMIP6 models to assess the performance of ESMs over China (Table S1). Data are obtained from the “historical” experiments covering 1850–2014, which serve as the entry cards for participating in CMIP6 (Eyring et al., 2016). They are coupled atmosphere–ocean simulations that include all CMIP6 historical forcings and are well suited for quantifying and understanding model characteristics. The ensemble mean is taken for each model by averaging all available ensemble members. For GISS models, the ensemble members use two physics configurations with drastically different aerosol parameterizations. We average the ensemble members using the same physics configurations in GISS models, named GISS-E2-1-OMA (physics version = 3) and GISS-E2-1-MATRIX (physics version = 5), respectively (Bauer et al., 2020). Simulation results over 2000–2014 are selected and re-gridded to 1° × 1° for comparison with available satellite- and ground-based data.
The anthropogenic emission data (version 2016-07-26) to drive historical CMIP6 simulations are produced by the Community Emissions Data System (CEDS) (Hoesly et al., 2018). An updated version of CEDS (version 2017-05-18) corrected several errors in the spatial distribution within each country but does not change the total emissions by country and sector (Feng et al., 2020). The CEDS emissions (versions 2016-07-26 and 2017-05-18) of OC, BC, CO, NOx, and SO2 in China after 2000 are higher than those in the Multi-resolution Emission Inventory for China (i.e., MEIC) (Paulot et al., 2018; Zheng et al., 2018) and the Peking University (PKU) inventory (Wang et al., 2014; Huang et al., 2015; Tao et al., 2018) which use more detailed Chinese data. This difference in China has been reduced when CEDS was used to derive future Shared Socioeconomic Pathway (SSP) scenarios in the CMIP6 simulations (published on ESGF on 28 June 2018 at https://esgf-node.llnl.gov/search/cmip6, last access: 21 February 2024) and has been included in a post-CMIP6 version of CEDS (McDuffie et al., 2020).
Of the 14 models, all 14 output the MMRs of OA, BC, sulfate, dust, and sea salt, 5 output ammonium, and 4 output nitrate (Table S1). Moreover, 7 models output the MMRs of total PM2.5, as the sum over all components with suitable particle sizes. The MMRs are converted to mass concentrations (µg m−3) based on air density in each model. In evaluating PM2.5 components (Sect. 4), the evaluation of dust and sea salt concentrations is excluded due to the lack of available ground-based observations. We compare OC, BC, sulfate, nitrate, and ammonium simulations with the observed data available for these components. Modeled OA is converted to organic carbon (OC) to be comparable with the observational dataset. Modeled OA refers to total organic aerosol, including primary organic aerosol (POA) and secondary organic aerosol (SOA). For the GFDL-ESM4 model, the “mmroa” variable for OA only includes POA; thus, we calculate the total OA of GFDL-ESM4 as mmroa plus mmrsoa. The ratios in the literature range from 1.4 to 2.1 (Bürki et al., 2020; Lin et al., 2016). We choose an ratio of 1.6, which is the same as the ratio used in converting near-surface OA observations to OC. This ratio is slightly higher than the value of 1.4 recommended by CMIP6 for POA, but it does not affect the relative (percentage) model bias found in this study because the same ratio is used for models and observations.
For the seven models that do not output total PM2.5, we follow the previous work to estimate total PM2.5 concentrations (Eq. 1) (Turnock et al., 2020). Here, OA, BC, sulfate, and certain portions of sea salt (SSLT; a1) and dust (DST; a2) are assumed to be present in fine particles (diameter < 2.5 µm).
For most models, specific values of a1 and a2 are provided by model developers (Table S2). BCC-ESM1 does not provide the coefficients. Instead, the model outputs concentrations in four size bins for each of dust (DST01 is 0.1–1.0 µm, DST02 is 1.0–2.5 µm, DST03 is 2.5–5.0 µm, and DST04 is 5.0–10 µm) and sea salt (SSLT01 is 0.2–1.0 µm, SSLT02 is 1.0–3.0 µm, SSLT03 is 3.0–10 µm, and SSLT04 is 10–20 µm) (Su et al., 2022; Wu et al., 2019). Thus, the first two bins are assumed to belong to PM2.5. Ammonium and nitrate are not available in most of these six models (except GISS-E2-1-MATRIX) and are thus not included in Eq. (1).
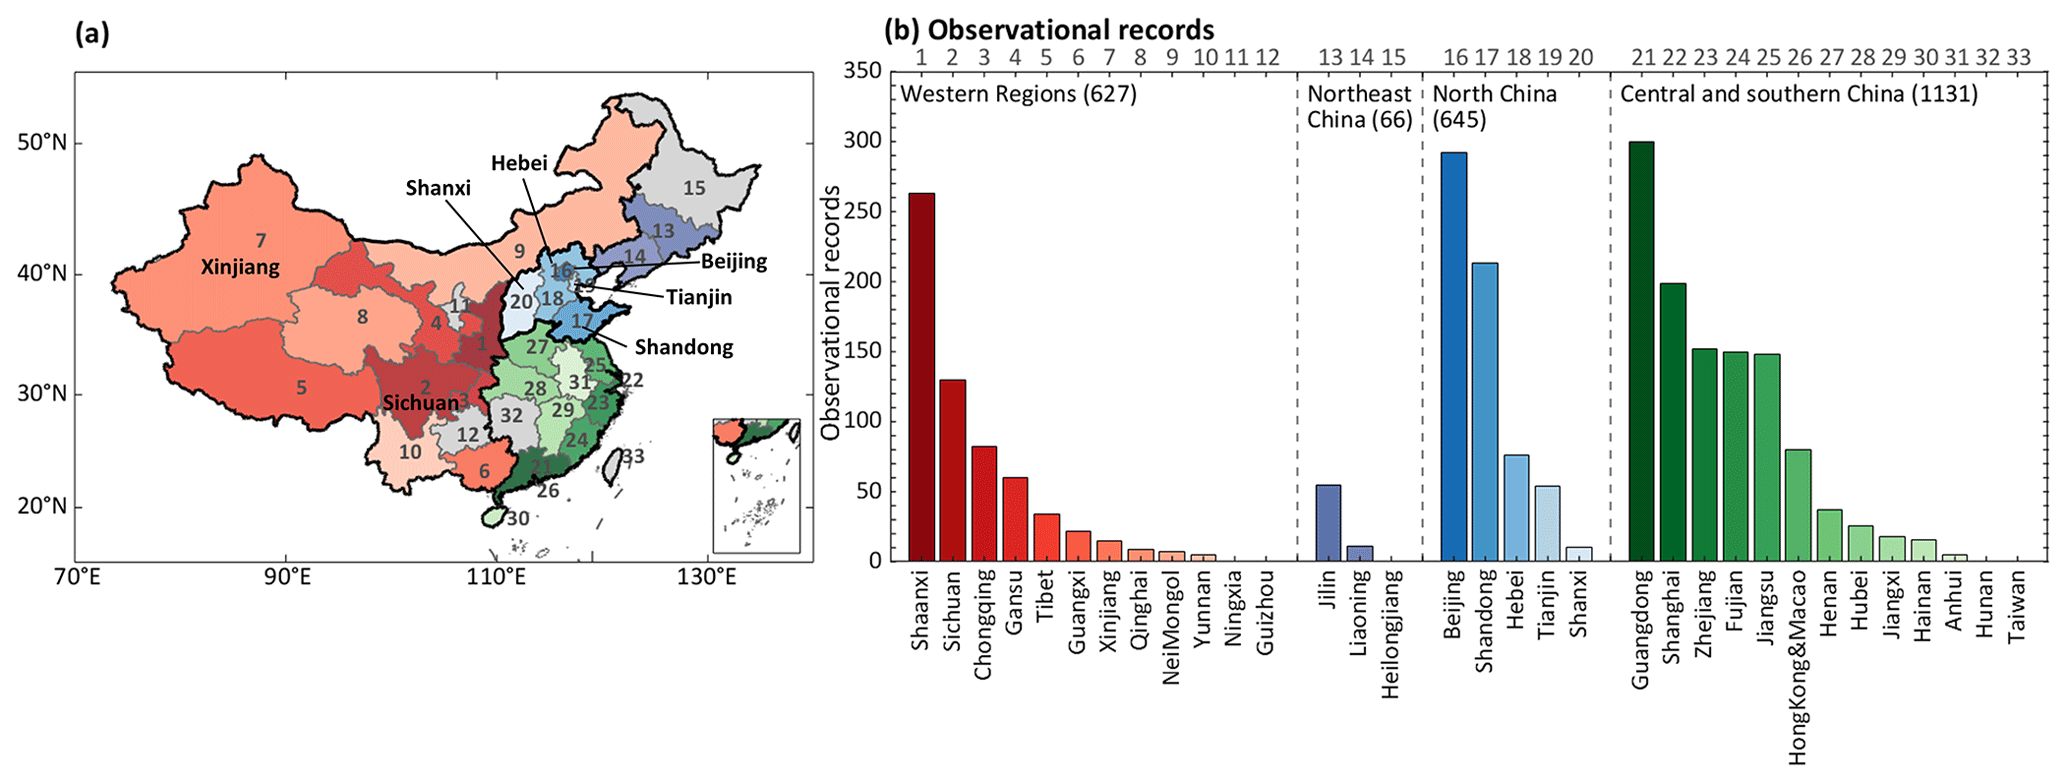
Figure 1Observational records of PM2.5 components during 2000–2014 collected from the literature. (a) The map depicts individual provinces in four regions, including the western regions in red colors, Northeast China in purple, North China in blue, and Central and South China in green. The provinces without observational records are in gray. The number denotes each province. (b) Provincial observation records in China. The number on the upper x axis and the color in each bar match the province in panel (a). Publisher's remark: please note that Figs. 1a, 2a–p, 4a–n, and 5a–o contain disputed territories.
2.2 Satellite-based total PM2.5
We take satellite-based near-surface total PM2.5 concentrations from the V4.CH.03 product of the Washington University Atmospheric Composition Analysis Group (Hammer et al., 2020). The dataset is constructed by combining multiple satellite products of AOD with simulations from a chemical transport model (GEOS-Chem) to predict PM2.5 and then constraining these estimates by ground-level PM2.5 monitoring. The GEOS-Chem aerosol simulations include primary and secondary carbonaceous aerosols, sulfate, nitrate, ammonium, mineral dust, and sea salt. The dataset provides the annual average PM2.5 concentrations during the period 2000–2014 with a high spatial resolution of 0.01° × 0.01° (∼ 1 km × 1 km). The adjusted satellite-derived PM2.5 concentrations over Asia are compared with surface PM2.5 observations collected from the Global Burden of Disease (GBD) collaborators during the period 2008–2013 (Meansatellite = 61.5 µg m−3 versus Meanobs = 59.1 µg m−3) (van Donkelaar et al., 2016) and from the China National Environmental Monitoring Center (CNEMC) during the period 2015–2019 (Meansatellite = 45.9 µg m−3 versus Meanobs = 43.4 µg m−3) (van Donkelaar et al., 2021). Detailed data descriptions are provided elsewhere (van Donkelaar et al., 2019; van Donkelaar et al., 2016). Here the satellite-based total PM2.5 data are re-gridded to 1° × 1° for model evaluation purposes.
2.3 Ground-based PM2.5 component data
Since national-scale continuous measurements of near-surface PM2.5 components are unavailable in China, we collect observational PM2.5 component data from the literature. Our collected dataset includes 2469 component records of OC, BC, sulfate, nitrate, and ammonium nationwide (627, 66, 645, and 1131 records in western regions, Northeast China, North China, and Central and South China, respectively), as shown in Fig. 1. Here a record represents one measured PM2.5 component at the specific sample site and period. These records cover 30 provinces (including provinces and provincial-level municipalities) and multiple land use types (urban, rural, near the road, and industrial park). The dataset does not cover Ningxia, Guizhou, Heilongjiang, and Taiwan. A total of 472, 459, 518, 519, and 501 records are available for OC, BC, sulfate, nitrate, and ammonium over China, respectively. The site locations, sampling periods, data sources, and other information are summarized in Table S4 in the Supplement.
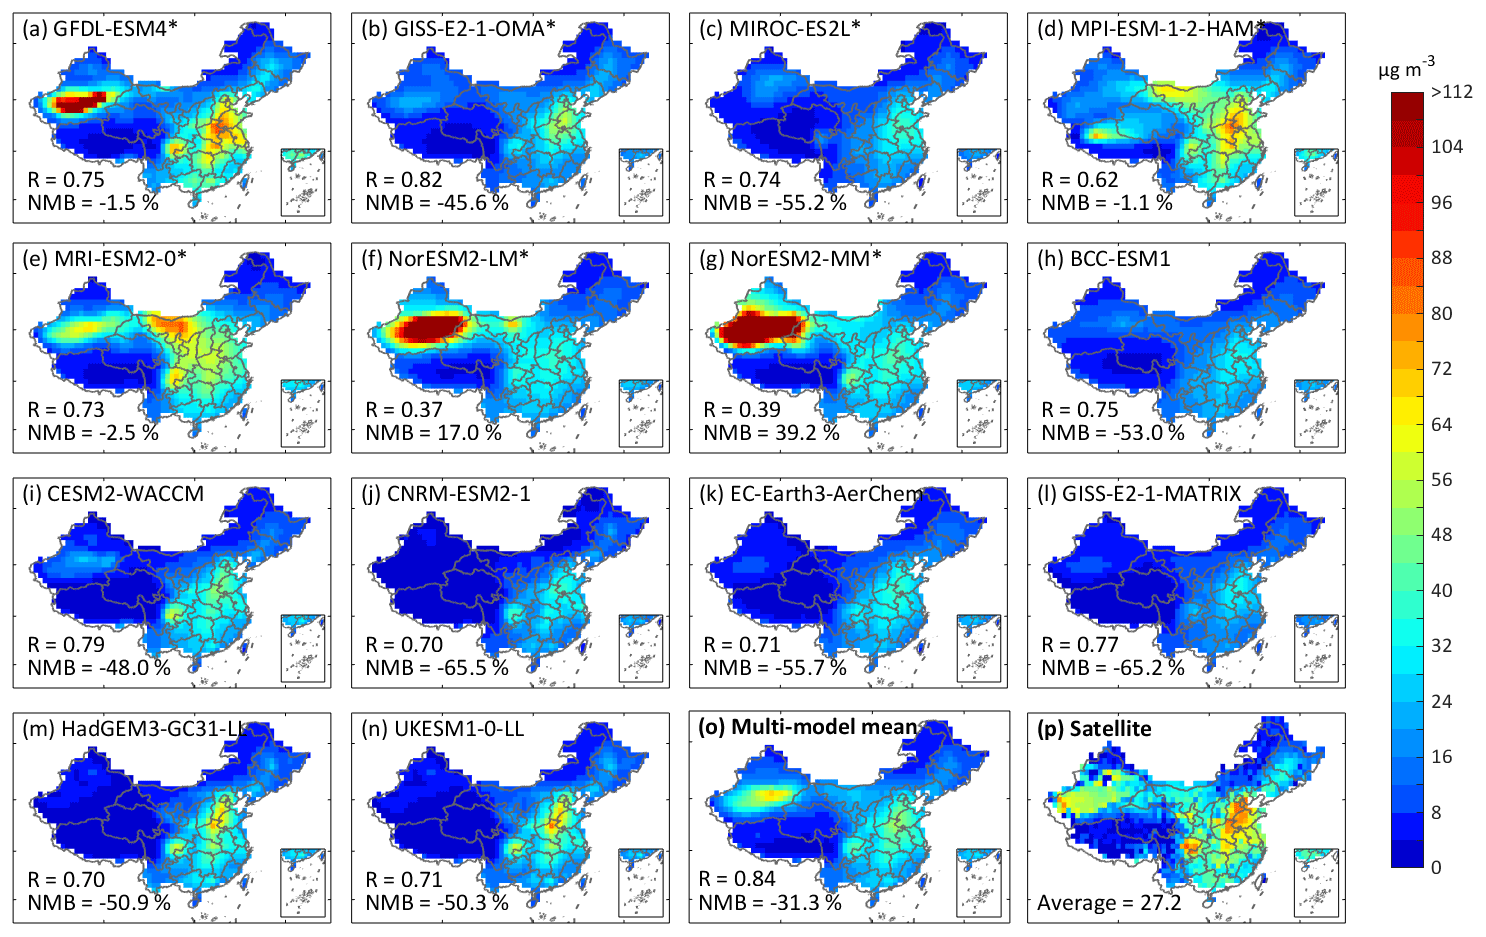
Figure 2Multi-year mean annual average near-surface total PM2.5 concentrations over China during 2000–2014. (a–g) Model-outputted PM2.5 concentrations in seven models. (h–n) Calculated PM2.5 concentrations in the other seven models according to Eq. (1). (o) Multi-model mean. (p) Satellite-based total PM2.5 dataset. R stands for spatial correlation, and NMB stands for normalized mean bias.
At a given site, the records are not continuous in time. These records cover varying sampling periods ranging from a few days to several years, although most are monthly data. We treat a record as seasonal if its data length is equal to or shorter than a season or as annual when its data length is longer than 6 months. The records are not evenly scattered across years and are more available in later years in general. From 2000 to 2008, the numbers of records range from 50 to 150 per year, except for 2003 (207 records), while from 2009 to 2014, the numbers of records vary between 150 and 550 per year (Fig. S1). To compare with CMIP6 simulations, we calculate for each site the multi-year mean PM2.5 component concentrations by averaging over the seasonal or annual observational records. If there is more than one site in a given model grid cell, we average data from all sites in that grid cell. To consider the effect of interannual variability (caused by an incomplete temporal match in data availability between models and observations), we compute for each CMIP6 model the average and maximum of annual mean values during 2000–2014 from all grid cells with available observational data and then compare with the multi-year-averaged observations from these grid cells. As detailed in Sect. 5, the model biases are not caused by imperfect model–observation matching in time.
3.1 Spatial distribution
The spatial distribution of satellite-based annual mean total PM2.5 concentrations (Fig. 2p) exhibits high values over populous and industrial North China (including Beijing, Tianjin, Hebei, Shandong, and Shanxi provinces; 52.6 µg m−3) and eastern Sichuan (60.9 µg m−3). Central and South China exhibits PM2.5 concentrations (46.5 µg m−3) lower than North China due to lower emissions, higher vegetation coverage, better ventilation conditions, and more precipitation. PM2.5 concentrations are modest over dusty southern Xinjiang (33.6 µg m−3). Low PM2.5 concentrations (< 8 µg m−3) are distributed over the plateaus or forested regions with small populations, such as Tibet and northern Heilongjiang. Overall, PM2.5 concentrations in the southern and coastal regions are lower than in the northern and inland regions.
Among the seven models that directly output total PM2.5 concentrations (Fig. 2a–g), GFDL-ESM4 and MPI-ESM-1-2-HAM show similar patterns and magnitudes to satellite data with small national average biases (−1.5 % and −1.1 %, respectively) because of better performance in BC, sulfate, and ammonium simulations (Figs. S4–S7) which are related to the aerosol–chemistry–climate schemes within CMIP6 models (Turnock et al., 2020). Over the eastern regions (including Northeast China, North China, and Central and South China), all models exhibit spatially averaged negative biases ranging from −47.9 % to −3.3 % (Fig. S2). Nevertheless, the spatial pattern over the eastern regions is well simulated by four models (GFDL-ESM4, GISS-E2-1-OMA, MIROC-ES2L, and MPI-ESM-1-2-HAM) (R > 0.9, as shown in Table S2), with the maximum center over North China correctly reproduced. Over the western regions, four models (GFDL-ESM4, MRI-ESM2-0, NorESM2-LM, and NorESM2-MM) reproduce the maximum center over southern Xinjiang, although each of the seven models can underestimate or overestimate the peak values substantially.
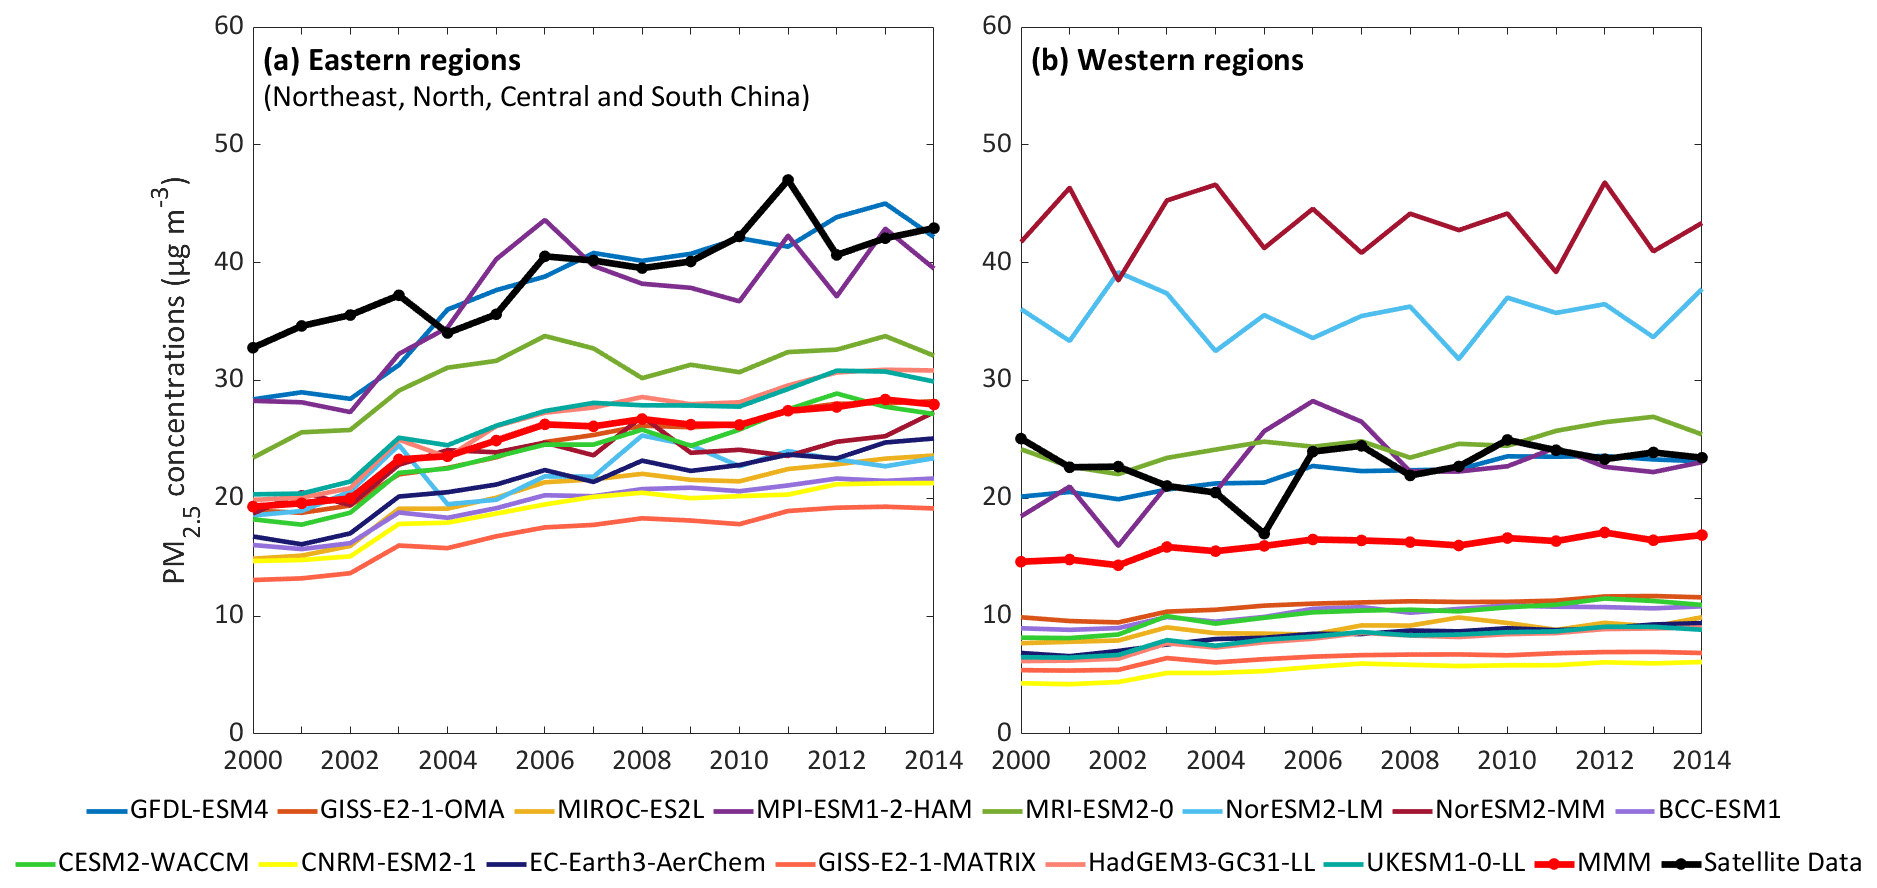
Figure 3Time series of annual mean regional average total PM2.5 concentrations (a) over the eastern regions (including Northeast China, North China, and Central and South China) and (b) over the western regions. The bold black lines denote satellite-based PM2.5 concentrations, and the bold red lines denote multi-model mean (MMM) concentrations.
For the seven models with total PM2.5 derived from Eq. (1), their simulated PM2.5 concentrations underestimate the satellite-based data from −65.5 % to −48.0 %, with the values averaged over the country (Fig. 2h–n). The negative biases are in part because nitrate and ammonium are not included. About 15.1–20.6 % and 11.4–14.6 % of PM2.5 are nitrate and ammonium in the models that do contain them, as shown in Table S3. Over the eastern regions, HadGEM3-GC31-LL and UKESM1-0-LL exhibit the least underestimation, and they also capture the observed maximum center over North China. Five of these seven models do not reproduce the PM2.5 peaks over dusty regions in the west, pointing to model deficiencies in dust simulations (Zhao et al., 2022).
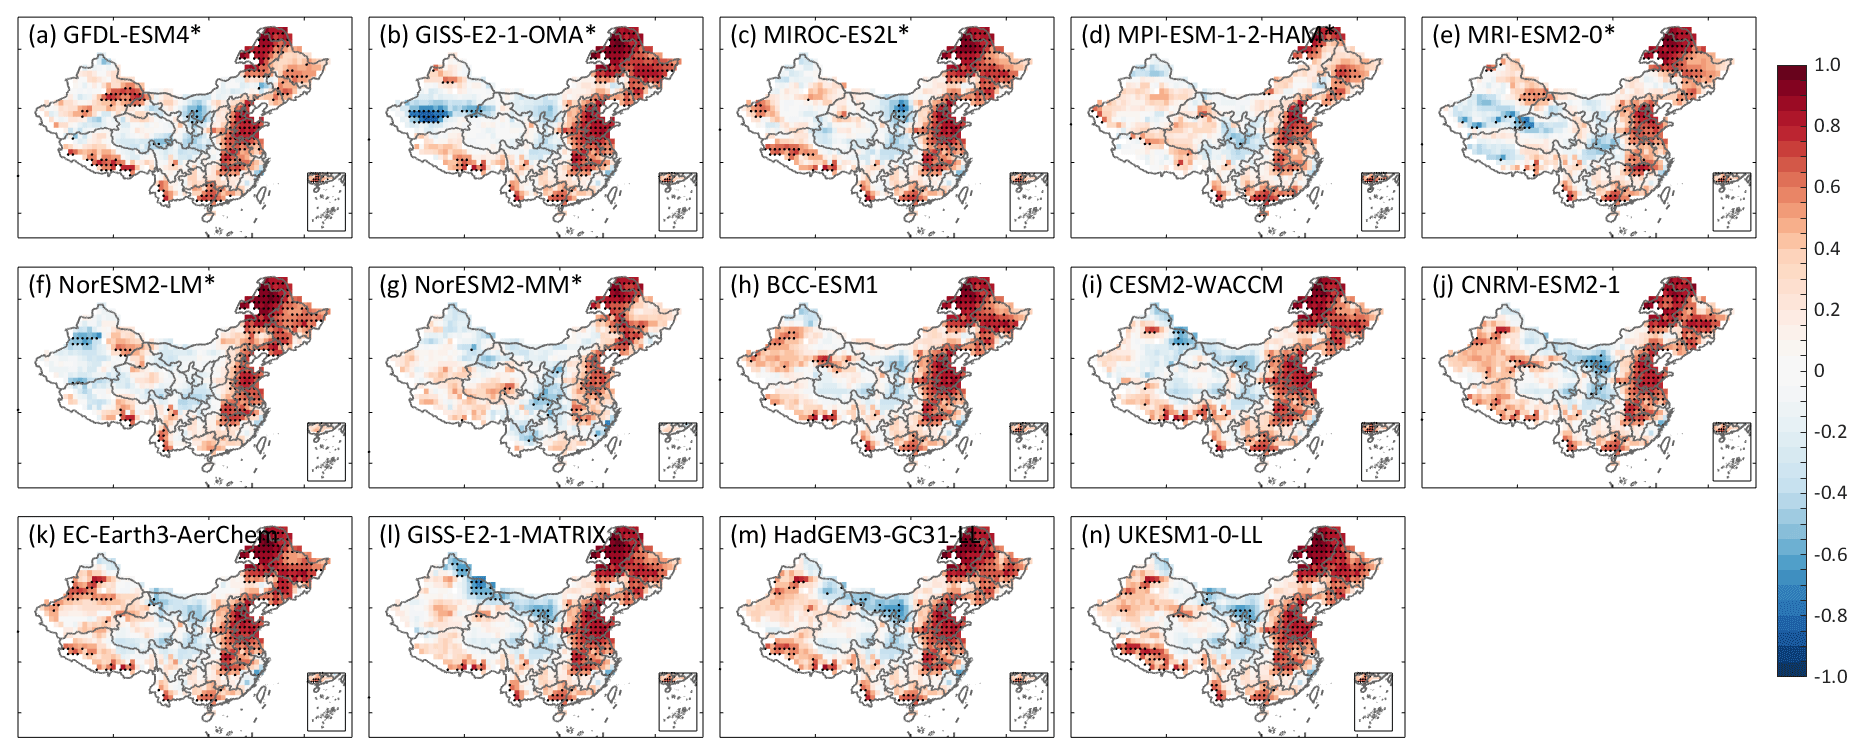
Figure 4Spatial distribution of correlation coefficients between modeled and satellite-based data for interannual variations in the annual mean total PM2.5 concentrations during 2000–2014. Black dots indicate a significance level of 0.05.
3.2 Trend and interannual variability
Over the eastern regions (Northeast China, North China, and Central and South China), data from satellite (0.72 ) and all models (0.32–1.14 ) exhibit significant increases (p value < 0.05) in annual mean total PM2.5 concentrations over 2000–2014, with temporal correlation between 0.63 and 0.87 (Fig. 3a and Table S2). The positive trend of satellite data over the eastern regions is consistent with findings from previous studies (de Leeuw et al., 2022; Geng et al., 2021), as caused mainly by emission changes (Hoesly et al., 2018; Wang et al., 2022). GFDL-ESM4 and MPI-ESM1-2-HAM have exhibited annual average PM2.5 concentrations and trends similar to the satellite data since 2004. Regionally, the 14 models capture the interannual variations in the satellite PM2.5 over Northeast China (R > 0.9) and North China (R > 0.8) (Fig. 4). The temporal consistency reflects that the models capture the temporal changes in anthropogenic emissions over these polluted regions, although the models might not align with natural (meteorology-driven) variability.
Over the western regions where natural dust dominates the aerosol loadings, satellite-based PM2.5 concentrations experience no significant trend over 2000–2014, whereas 11 models increase significantly (0.10–0.28 ) (Fig. 3b). There is a notable decline over 2000–2005 in satellite data (−1.12 at the significance level of 0.1) consistent with the previous studies that use dust aerosol optical depth (DOD) and ground-based observations of dust storm (S. Wang et al., 2021; Song et al., 2016). However, the dramatic drop is not captured by any model, reflecting large uncertainties and inter-model diversities in dust simulations stemming from many factors such as the driving mechanisms, dust particle size, and model structural differences (Zhao et al., 2022). Over 2000–2014, NorESM2-LM, NorESM2-MM, and MPI-ESM-1-2-HAM show large interannual variations, whereas other models do not. The models do not align with the yearly changes found in the satellite data, with modestly positive, low, or even negative correlation coefficients (−0.6 to 0.6; Fig. 4). The inaccuracy in aerosol trend and variability might exert an erroneous forcing upon the climate system.
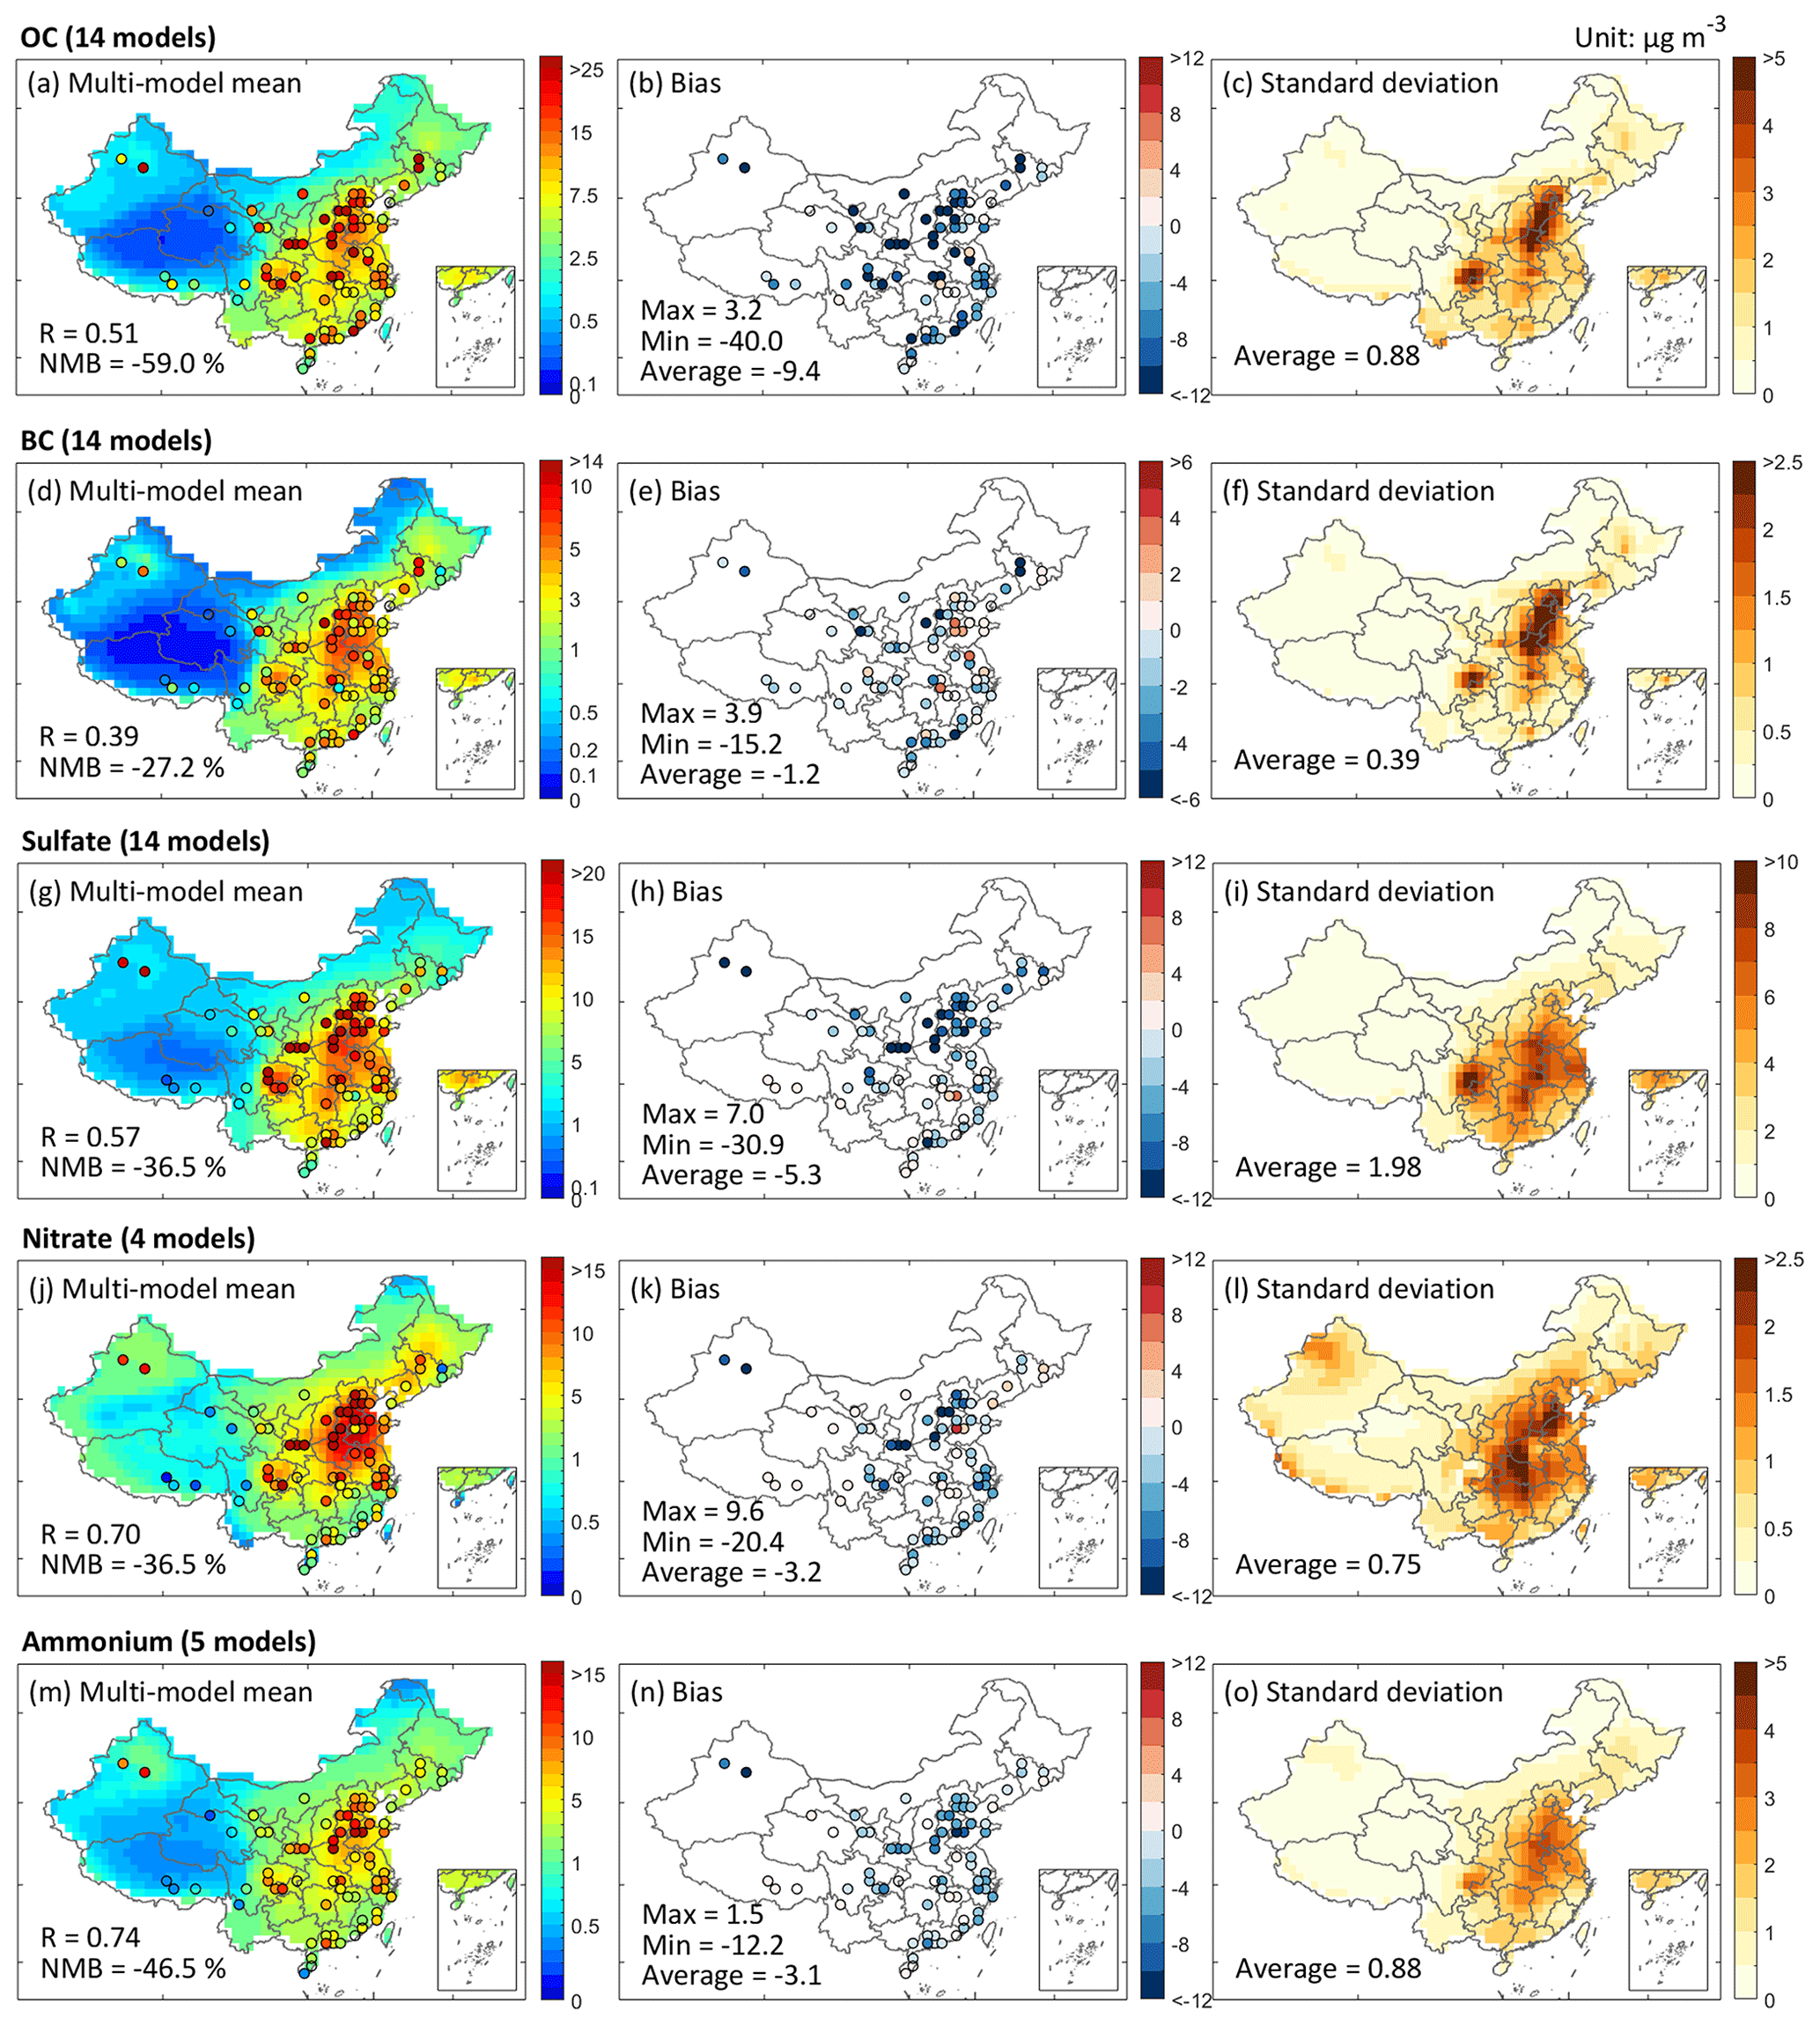
Figure 5Spatial distribution of multi-year averages of modeled PM2.5 components during 2000–2014. The first column shows the multi-model mean PM2.5 component concentrations overlaid with average ground-based observations in filled circles. The second column shows the bias of multi-model mean concentrations. The third column shows the standard deviation of PM2.5 component simulations among the CMIP6 models.
4.1 Organic carbon and black carbon
Ground-based observations of carbonaceous aerosols (OC and BC) are mostly available in the eastern regions. The national average multi-year mean observed OC concentration reaches 15.9 µg m−3. Observed OC concentrations peak over North China (> 25 µg m−3) and are also high over Central and South China (5–25 µg m−3) (Fig. 5a). The national average of the 14-model mean (6.5 µg m−3; normalized mean bias (NMB) = −59.0 %) which is spatially coincidently sampled with the ground-based observations (i.e., model values are obtained from grid cells with available observations) severely underestimates the observations, especially over parts of North China, with the bias reaching −40 µg m−3 (Fig. 5b). Nevertheless, the spatial pattern of OC observations is captured modestly well by the 14-model mean with a correlation coefficient of 0.51. Furthermore, a negative bias exceeding −50 % occurs in 11 models, even though they can simulate the spatial pattern moderately well (R ranges from 0.40 to 0.58; Fig. S4).
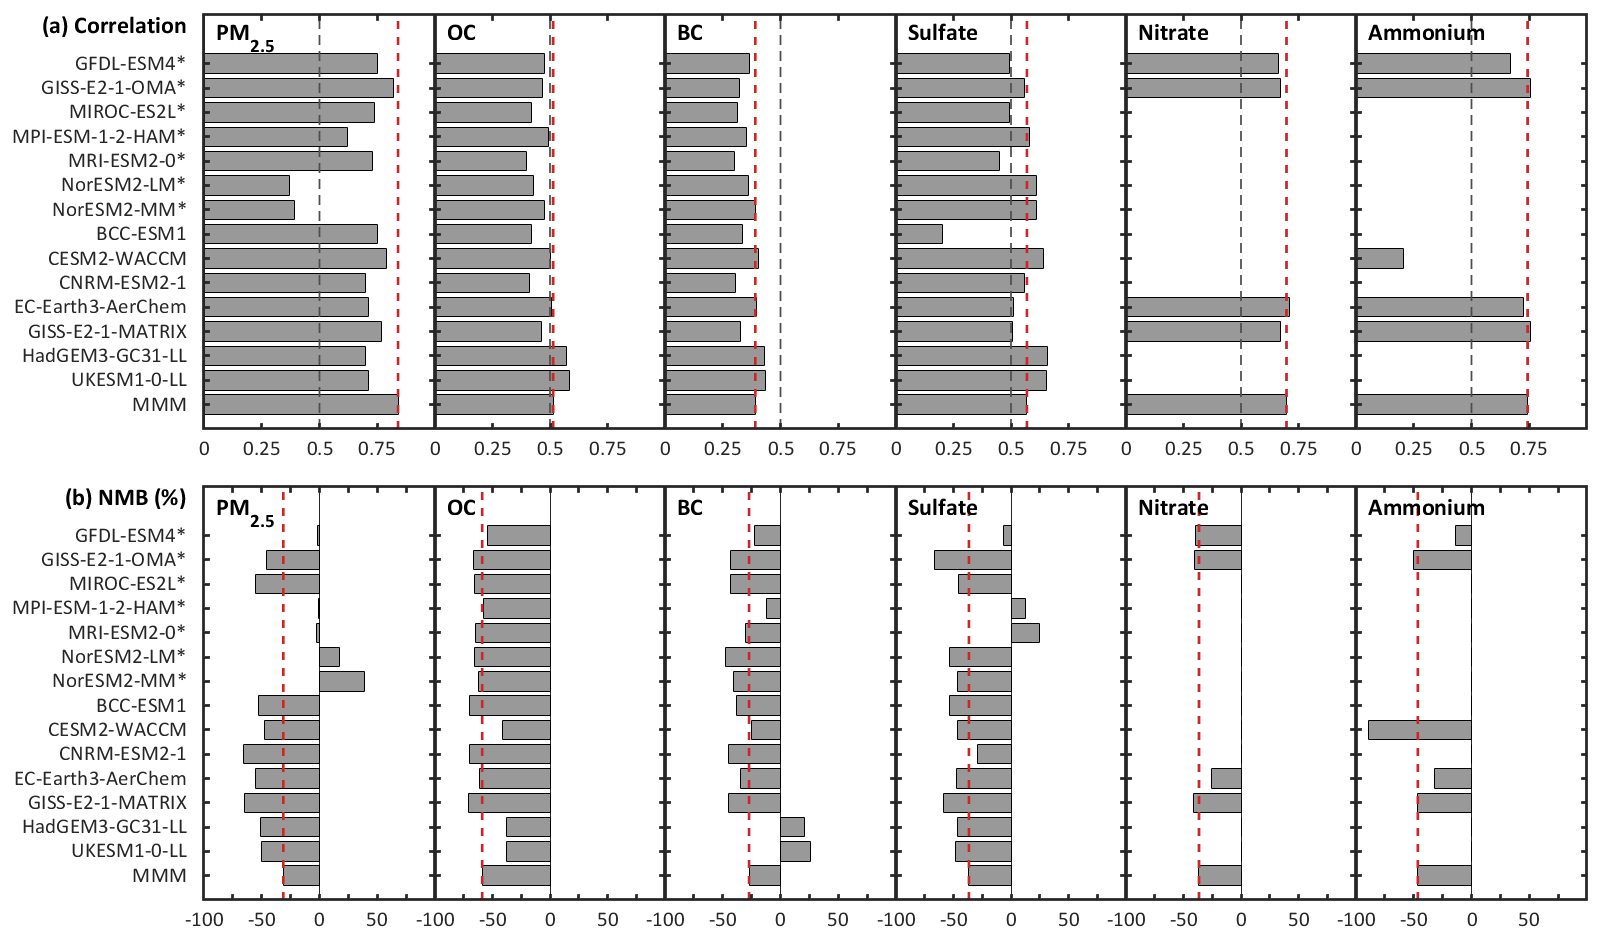
Figure 6Multi-year mean spatial correlation and bias for PM2.5 components over 2000–2014 for individual models. Results for total PM2.5 refer to the comparison against the satellite-based dataset, and those for the components are relative to the observations compiled from the literature. The dotted red lines denote multi-model mean (MMM). The dotted black lines denote the spatial correlation coefficient value of 0.5.
The national average multi-year mean observed BC concentration is 4.3 µg m−3. Observed BC concentrations are high (> 10 µg m−3) over parts of North China with mining and other heavy industries, such as in the Hebei and Shanxi provinces (Fig. 5d). However, the 14-model mean (3 µg m−3) does not capture the spatial pattern very well (R = 0.39), and it underestimates the observations (NMB = −27.2 %). The 14-model mean presents the largest negative bias over Shanxi (−15.2 µg m−3) and the greatest positive bias over Shandong (3.9 µg m−3; Fig. 5e); both provinces are in North China. Of the 14 models, 12 underestimate the BC observations (from −47.9 % to −12.1 % for the national average), whereas 2 models (HadGEM3-GC31-LL and UKESM1-0-LL) exhibit positive biases (21.1 % and 26.2 %, respectively) (Figs. 6 and S5). Most models produce high concentrations of BC over the whole of North China, including Beijing and Shandong which exhibit relatively low observational values. The spatial distributions of carbonaceous aerosol concentrations are mainly influenced by CEDS emissions used in models, with higher spatial correlation coefficients that are greater than 0.85 (Fig. S3).
The underestimation of carbonaceous aerosol concentrations might be associated with anthropogenic emissions, chemical mechanisms, and meteorological conditions. For China, the CEDS emission data (version 2016-07-26) used in CMIP6 historical simulations are about 3.8 %–31.3 % higher than those in MEIC inventory, except for NOx emissions (Fan et al., 2022). However, the positive bias in emissions cannot explain the model underestimation of OC and BC concentrations. The model inadequacies in chemical processes (e.g., using simplified aerosols and chemistry schemes, which tends to underestimate aerosol formation; Turnock et al., 2020) might lead to underestimated secondary organic aerosols (SOA, as a component of OC), especially over Central and South China (Chen et al., 2016). The inter-model discrepancies of OC and BC peak over North China and eastern Sichuan (Fig. 5c). The large absolute discrepancies are in part due to the higher air pollutant concentrations in these regions. Furthermore, many differences exist among CMIP6 models in PM2.5 component simulations, including the representation of aerosol size distribution; the simplification of chemical processes with photolytic, kinetic, and heterogeneous reactions (e.g., 33 photolytic reactions in BCC-ESM1 but 43 in GFDL-ESM4) (Turnock et al., 2020; T. Wu et al., 2020; Dunne et al., 2020); the treatment for transport of gaseous tracers and aerosols by advection and vertical convection; and the dry deposition and wet scavenging schemes (Su et al., 2022; Digby et al., 2024).
Meteorological conditions, including temperature, precipitation, and surface wind simulations, have critical impacts on local aerosol concentrations. Temperature simulations over the eastern regions of China by CMIP6 models are very close to the observed data (Yang et al., 2021). Over the western regions, a notable warm bias over Xinjiang in most CMIP6 models (X. Zhang et al., 2022) may contribute to higher planetary boundary layer height (Yue et al., 2021) and stronger vertical mixing, partly explaining the underestimation of OC and BC concentrations near the surface (Fig. 5), whereas the pronounced cold bias over the Tibetan Plateau (Zhu and Yang, 2020) might contribute to overestimated near-surface aerosol concentrations over there. Precipitation affects aerosol concentrations through wet scavenging, and it is overestimated (wet bias) in CMIP6 models over North China and Northeast China but close to observations over Central and South China (Yang et al., 2021). The model performance in precipitation may partly explain the more severe underestimation of OC concentrations over North China than over Central and South China. But the overestimation of BC over North China suggests that other factors offset the influence of local wet bias. Over the western regions, most models exhibit wet bias, except over northern Xinjiang, where local temperature (warm bias) and precipitation (dry bias) have opposite effects on near-surface aerosol concentrations. Furthermore, the overall underestimation of surface wind speed over China in CMIP6 (J. Wu et al., 2020) is conducive to the accumulation of near-surface aerosol concentrations around the anthropogenic emission source regions which may induce a negative contribution to the underestimation of OC and BC concentrations.
4.2 Sulfate, nitrate, and ammonium
This section evaluates the model performance of secondary inorganic aerosols (SIOAs; sulfate, nitrate, and ammonium). Sulfate aerosol in CMIP6 models is dependent on SO2 emissions (the main sulfuric acid precursor), chemical conversion of SO2 to sulfate, and loss through wet scavenging (T. Wu et al., 2020; Tegen et al., 2019). Some models also explicitly simulate nitrate and ammonium aerosols using the sulfate–nitrate–ammonia thermodynamic equilibrium. For instance, EC-Earth3-AerChem, GISS-E2-1-MATRAX, and GISS-E2-1-OMA use the Equilibrium Simplified Aerosol Model (EQSAM) (Metzger et al., 2002; Bauer et al., 2020; van Noije et al., 2021), while GFDL-ESM4 treats ammonium and nitrate aerosols with ISORROPIA (Fountoukis and Nenes, 2007; Paulot et al., 2016; Dunne et al., 2020).
The national average multi-year mean of observed sulfate concentrations reaches 14.6 µg m−3, the second-largest value among the five PM2.5 components (following OC). The observed sulfate concentrations exceed 15 µg m−3 over most of North China and eastern Sichuan, as well as cities over Xinjiang with large population and petroleum industry (Fig. 5g). The 14-model mean, whose national average is 9.3 µg m−3, has the greatest underestimation over North China and Xinjiang (Fig. 5h). The 14-model mean agrees modestly well with the observations in the spatial pattern (R = 0.57). Among the 14 models, the national average model biases range from −66.1 % (GISS-E2-1-OMA) to 24.5 % (MRI-ESM2-0), and 5 models better capture the observed spatial pattern with correlation coefficients exceeding 0.6 (Fig. 6). The cross-model discrepancy in sulfate (2 µg m−3 in national average) is larger than those for the other four components (0.4–0.9 µg m−3), particularly over Central and South China (Fig. 5i).
The national average multi-year mean of observational nitrate concentrations is 8.7 µg m−3. The observed spatial pattern of nitrate is similar to sulfate, with high values over North China, eastern Sichuan, and populous cities of Xinjiang (Fig. 5j). Only four models (GFDL-ESM4, GISS-E2-1-OMA, GISS-E2-1-MATRIX, and EC-Earth3-AerChem) include nitrate simulations. The four-model mean has a national average of 5.5 µg m−3, with a NMB of −36.5 %, but it captures the observed spatial pattern very well with a correlation coefficient reaching 0.7. All four models exhibit negative NMBs ranging from −41.4 % to −25.4 %; they reproduce high values over the eastern regions but have an underestimation over Xinjiang (Fig. S7).
The observed multi-year mean ammonium concentrations have a national average value of 6.7 µg m−3. The observational values peak over North China (> 10 µg m−3), particularly over the agricultural regions from which ammonia emissions are the greatest (Fig. 5m). Five models perform ammonium simulations. The five-model mean, with a national average of 3.4 µg m−3, has negative and positive biases between −12.2 and 1.5 µg m−3 at different locations (Fig. 5n). The five-model mean captures the observed spatial pattern of ammonium (R = 0.74) better than for other components (R = 0.39–0.70). The five models exhibit varying performances in magnitude and spatial pattern. The NMBs range from −89.0 % to −13.6 % across these models. Four models simulate the spatial patterns of ammonium well, with high correlation coefficients between 0.67 and 0.76, although the spatial agreement is poor for CESM2-WACCM (R = 0.21).
Emissions, meteorological conditions, and chemical processes affect the formation and loss of secondary inorganic aerosols. As explained in Sect. 4.1, the potentially overestimated CEDS emissions over China, the cold bias over the Tibetan Plateau, and the dry bias over northern Xinjiang tend to overestimate aerosol concentrations which are in contrast with the negative model biases over the respective regions. On the other hand, the warm bias over northern Xinjiang and the wet bias over North China and Northeast China are in line with the underestimation of aerosol concentrations. Furthermore, the formation of nitrate from nitric acid depends on the amount of residual ammonia left from the formation of ammonium sulfate. Over the regions where ammonia is not sufficient to neutralize both nitric acid and sulfuric acid (such as Shanxi and Shandong), decreased sulfate formation might promote nitrate formation with the released ammonium (Zhai et al., 2019; Zhai et al., 2021). This partly explains why the underestimation of nitrate simulations is less than sulfate over these regions.
Over the eastern regions, the concentrations of total PM2.5 and its 5 components are underestimated by the 14 models in general. The slight underestimation of three models (GFDL-ESM4, MPI-ESM-1-2-HAM, and MRI-ESM2-0) can be traced to positive biases in sulfate simulations, partly offsetting the negative biases in OC and BC. Over the western regions, most models underestimate the total PM2.5 concentrations dominated by dust aerosols, whereas three models (GFDL-ESM4, NorESM2-LM, and NorESM2-MM) produce overly high values over Xinjiang due to overestimated dust concentrations. Meanwhile, all models underestimate the five PM2.5 components over the west.
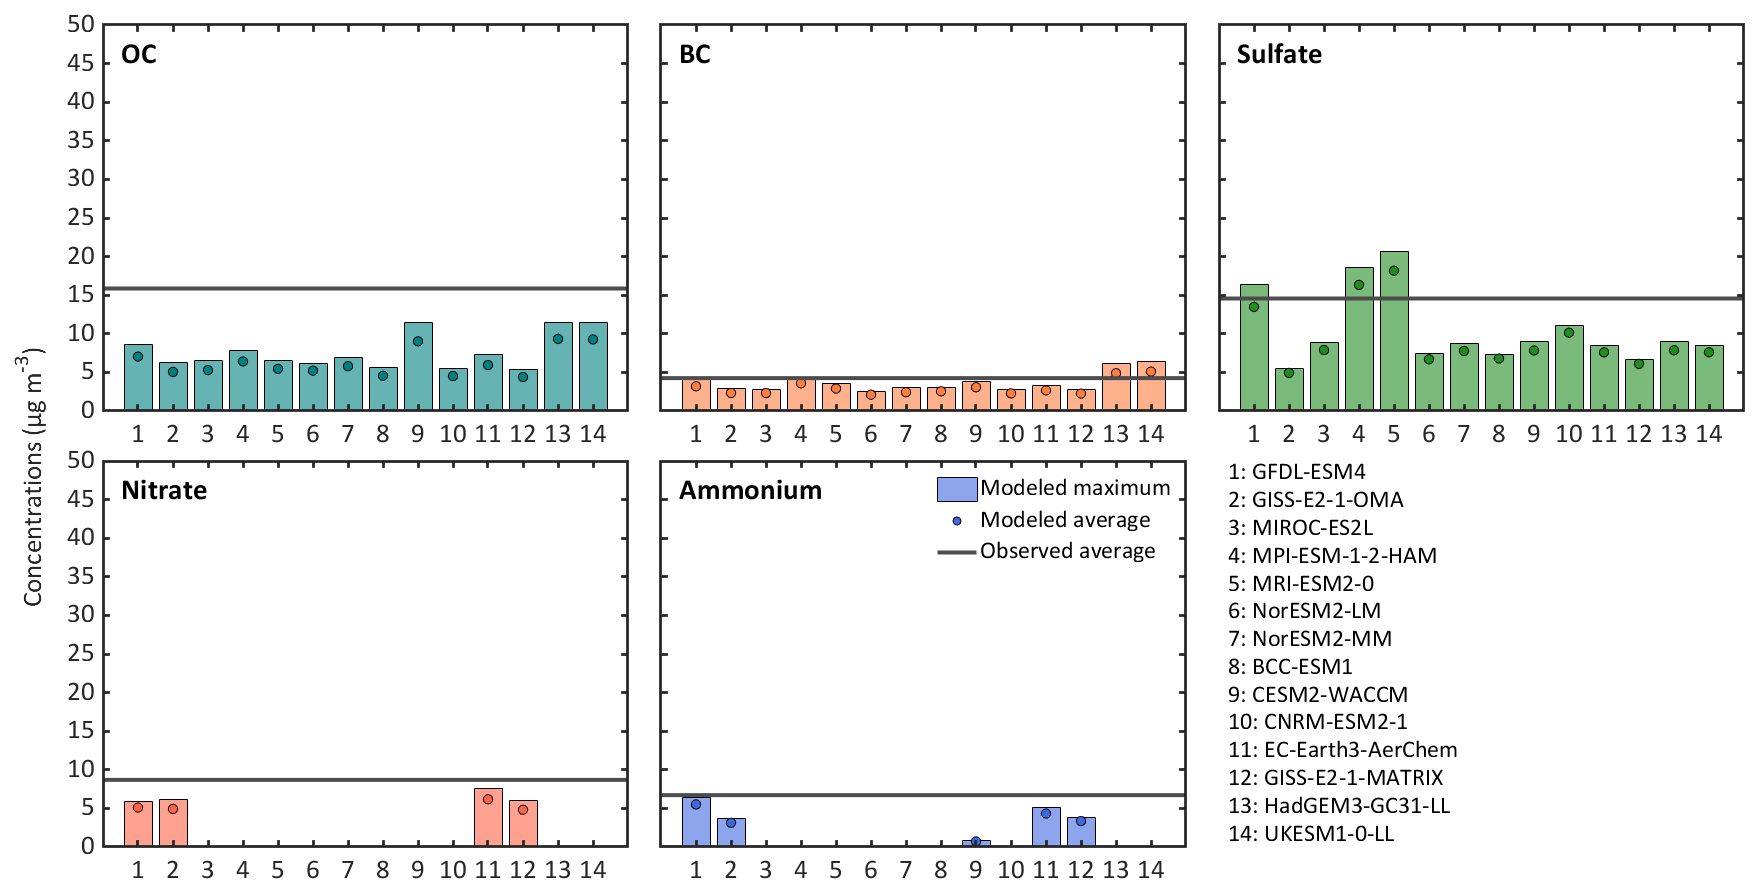
Figure 7Maximum and average concentrations over 2000–2014 for national mean PM2.5 components simulated by individual models. In each year, model values are sampled from grid cells with available observations.
Figure 7 shows little difference between the maximum and average annual concentrations over 2000–2014 for national mean PM2.5 components simulated by individual models. Furthermore, we average over all seasonal and annual observational records to compare with annual mean model results. A test using the seasonal (annual) model results to match seasonal (annual) observational records shows very similar comparison results (Fig. S8). These tests suggest that the model underestimation cannot be attributed to imperfect temporal matching between models and observations or the potential mis-phase (or variability) in models.
Among the five PM2.5 components evaluated, absorbing aerosol (BC) and four scattering aerosols (OC, sulfate, nitrate, and ammonium) have opposite direct radiative forcing at the top of atmosphere (TOA). The underestimation of BC is less than for the other four scattering aerosols. If this difference persists in the troposphere, the underestimated PM2.5 components might cause an underestimation of negative radiative forcing at the TOA. The underestimation of BC and scattering aerosols might result in more solar radiation reaching the ground (Chen et al., 2022; Tang et al., 2022). This is consistent with the overestimation of maximum daily maximum temperature over the eastern regions (Zhu et al., 2020), likely serving as a positive feedback between negative aerosol biases and overestimated surface temperature.
The spatial biases in aerosols might also serve as an important limiting factor for the performance of meteorological/climate simulations. The observed PM2.5 and its five components are characterized by high concentrations over the east and low values over the west (except northern Xinjiang). In a few models, the large overestimation of PM2.5 over Xinjiang of the west (dominated by dust) with underestimated PM2.5 (dominated by anthropogenic aerosols) over the east might exert an incorrect west–east asymmetric climate forcing. The spatial pattern of the resulting climate response might include cold–warm biases of surface temperature (cold bias over the west and warm bias over the east). The difference in the spatial pattern of model bias between BC and scattering aerosols might have additional impacts on the climate. Future work is needed to examine how the model errors in PM2.5 and its components might affect climate simulations through aerosol–climate feedback.
In this study, we evaluate the performance of 14 CMIP6 ESMs in simulating total near-surface PM2.5 and its 5 components over China during 2000–2014 and discuss the likely causes for model errors and their climate implications. Our assessment helps us to understand the capability of the current-generation models in the simulation of aerosols and aerosol–climate interactions towards a further improvement of climate predictions and projections. Our findings are summarized as follows.
Of the 14 CMIP6 models, 12 tend to underestimate the total PM2.5 concentrations over China (NMB = −65.5 % to −1.1 %), and the other 2 models overestimate them (NMB = 17.0 %–39.2 %), as compared to a satellite-based dataset. The seven models that output total PM2.5 concentrations exhibit underestimation between −47.9 % and −3.3 % over the eastern regions, although four of them capture the observed spatial pattern (R > 0.9). Over the western regions, four of these seven models reproduce the maximum center over southern Xinjiang. The seven models for which we calculate the total PM2.5 concentrations from outputted components underestimate the observed PM2.5 from −65.5 % to −48.0 % (averaged over the country), in part due to missing nitrate and ammonium in the models.
Over the eastern regions, all models simulate significant increasing trends of total PM2.5 (0.32–1.14 ) over 2000–2014 that are close to the satellite-based data (0.72 ). The models also capture the interannual variability in the satellite PM2.5 over Northeast China and North China. Over the western regions, 11 models simulate growing PM2.5 concentrations at rates of 0.10–0.28 , in contrast to no significant trends in satellite data.
The 14-model mean captures the spatial pattern of observed OC modestly well (R = 0.51), but it exhibits a severe underestimation nationwide (NMB = −59.0 %), with negative biases exceeding −50 % in 11 models. The 14-model mean shows a poor capability with respect to capturing the BC spatial pattern (R = 0.39), and it also underestimates the BC observations (NMB = −27.2 %). Of the models, 2 exhibit positive biases in BC, while the other 12 models exhibit negative biases.
There are 14, 4, and 5 models which output sulfate, nitrate, and ammonium, respectively. The 14-model mean of sulfate exhibits a modest spatial correlation and bias (R = 0.57; NMB = −36.5 %), and large discrepancies exist among these models, with biases ranging from −66.1 % to 24.5 %. The four-model mean of nitrate captures the spatial pattern well (R = 0.7), although it still underestimates concentrations nationwide (NMB = −36.5 %). The five-model mean of ammonium has the best performance with respect to reproducing the spatial pattern (R = 0.74) but with a negative bias in magnitudes (NMB = −46.5 %).
The overall underestimation of PM2.5 and its components is associated with imperfectness in emissions as input, modeled meteorology, and chemistry. The underestimated PM2.5 and its components might cause an overall underestimated cooling effect at TOA and stronger warming at the surface in the models. The model performance in spatial pattern differs between BC and scattering aerosols, and a few models also exhibit strong positive biases over the west (associated with dust) but negative biases over the east. Together, the errors in spatial pattern might have additional consequences for the modeled climate. Further studies are warranted to quantify how model errors in the magnitude and spatial pattern of aerosols affect the regional and global climate, for example, through the Regional Aerosol Model Intercomparison Project (RAMIP) (Wilcox et al., 2022).
As a final note, those causes for aerosol underestimation may also affect ozone, and the underestimated aerosol concentrations might also further affect the ozone simulation through radiative or heterogeneous chemical processes (Jacob, 2000; Lin et al., 2012; Li et al., 2019). In addition, as CMIP6 models are also used to study the health impacts of aerosols (Xu et al., 2022; Shim et al., 2021), the aerosol underestimation needs to be corrected to allow a more reliable estimate of health consequences.
CMIP6 data are available from the Earth System Grid Federation (ESGF) and can be freely downloaded at https://esgf-data.dkrz.de/search/cmip6-dkrz/ (last access: 8 September 2020, WCRP, 2020), and all relevant references to the CMIP6 data used are provided in Table S1 in the Supplement. Satellite-derived surface PM2.5 concentration products can be accessed from the Washington University Atmospheric Composition Analysis Group website (as version V4.CH.03) at https://sites.wustl.edu/acag/datasets/surface-pm2-5-archive/#V4.CH.03 (van Donkelaar et al., 2019). Observational data used in this paper are provided in the Supplement, with raw data available upon request to the corresponding author (Jintai Lin; linjt@pku.edu.cn).
The supplement related to this article is available online at: https://doi.org/10.5194/gmd-17-4821-2024-supplement.
JL led the study. FR and JL designed the study, analyzed the results, and wrote the paper. CX provided the map data of the four regions in China. JAA collected observation data of PM2.5 components from the literature. JW helped to analyze the evaluation results. RVM, AvD, and MSH provided satellite-derived data of total PM2.5. STT performed UKESM1-0-LL and HadGEM3-GC31-LL simulations. NO performed MRI-ESM2-0 simulations. JZ performed BCC-ESM1 simulations. SB and KT performed GISS-E2-1-OMA and GISS-E2-1-MATRIX simulations. ØS performed NorESM2-LM and NorESM2-MM simulations. PN performed CNRM-ESM2-1 simulations. DN performed MPI-ESM1-2-HAM simulations. GS performed CESM2-WACCM simulations. TvN and PLS performed EC-Earth3-AerChem simulations. LWH performed GFDL-ESM4 simulations. TT performed MIROC-ES2L simulations. All authors commented on the paper.
The contact author has declared that none of the authors has any competing interests.
Publisher's note: Copernicus Publications remains neutral with regard to jurisdictional claims made in the text, published maps, institutional affiliations, or any other geographical representation in this paper. While Copernicus Publications makes every effort to include appropriate place names, the final responsibility lies with the authors.
Jintai Lin and Fangxuan Ren have been supported by the National Natural Science Foundation of China (grant no. 42075175) and the Second Tibetan Plateau Scientific Expedition and Research Program (grant no. 2019QZKK0604). Naga Oshima has been supported by the Environment Research and Technology Development Fund (grant nos. JPMEERF20202003 and JPMEERF20232001) of the Environmental Restoration and Conservation Agency provided by Ministry of the Environment of Japan, the Arctic Challenge for Sustainability II (ArCS II; grant no. JPMXD1420318865), and the Global Environmental Research Coordination System from Ministry of the Environment, Japan (grant no. MLIT2253). David Neubauer has been supported by the European Union's Horizon 2020 research and innovation programme project (FORCeS; grant no. 821205). Randall V. Martin has been supported by NASA (grant no. 80NSSC21K0508).
This paper was edited by Samuel Remy and reviewed by two anonymous referees.
Allen, R. J. and Landuyt, W.: The vertical distribution of black carbon in CMIP5 models: Comparison to observations and the importance of convective transport, J. Geophys. Res.-Atmos., 119, 4808–4835, https://doi.org/10.1002/2014JD021595, 2014.
Allen, R. J., Norris, J. R., and Wild, M.: Evaluation of multidecadal variability in CMIP5 surface solar radiation and inferred underestimation of aerosol direct effects over Europe, China, Japan, and India, J. Geophys. Res.-Atmos., 118, 6311–6336, https://doi.org/10.1002/jgrd.50426, 2013.
Bauer, S. E., Tsigaridis, K., Faluvegi, G., Kelley, M., Lo, K. K., Miller, R. L., Nazarenko, L., Schmidt, G. A., and Wu, J.: Historical (1850–2014) Aerosol Evolution and Role on Climate Forcing Using the GISS ModelE2.1 Contribution to CMIP6, J. Adv. Model. Earth Sy., 12, e2019MS001978, https://doi.org/10.1029/2019MS001978, 2020.
Buchard, V., da Silva, A. M., Randles, C. A., Colarco, P., Ferrare, R., Hair, J., Hostetler, C., Tackett, J., and Winker, D.: Evaluation of the surface PM2.5 in Version 1 of the NASA MERRA Aerosol Reanalysis over the United States, Atmos. Environ., 125, 100–111, https://doi.org/10.1016/j.atmosenv.2015.11.004, 2016.
Bürki, C., Reggente, M., Dillner, A. M., Hand, J. L., Shaw, S. L., and Takahama, S.: Analysis of functional groups in atmospheric aerosols by infrared spectroscopy: method development for probabilistic modeling of organic carbon and organic matter concentrations, Atmos. Meas. Tech., 13, 1517–1538, https://doi.org/10.5194/amt-13-1517-2020, 2020.
Carslaw, K. S., Lee, L. A., Reddington, C. L., Pringle, K. J., Rap, A., Forster, P. M., Mann, G. W., Spracklen, D. V., Woodhouse, M. T., Regayre, L. A., and Pierce, J. R.: Large contribution of natural aerosols to uncertainty in indirect forcing, Nature, 503, 67–71, https://doi.org/10.1038/nature12674, 2013.
Chen, D., Liao, H., Yang, Y., Chen, L., Zhao, D., and Ding, D.: Simulated impacts of vertical distributions of black carbon aerosol on meteorology and PM2.5 concentrations in Beijing during severe haze events, Atmos. Chem. Phys., 22, 1825–1844, https://doi.org/10.5194/acp-22-1825-2022, 2022.
Chen, Y., Li, J., Lee, W., Diner, D., Garay, M., Jiang, J., Wang, Y., Yu, J., and Kalashnikova, O.: Evaluation of sea salt aerosols in climate systems: global climate modeling and observation-based analyses, Environ. Res. Lett., 15, 034047, https://doi.org/10.1088/1748-9326/ab751c, 2020.
Chen, Z., Liu, J. F., Tao, W., and Tao, S.: Spatiotemporal distribution and source attribution of SOA in China, Huan Jing Ke Xue, 37, 2815–2822, https://doi.org/10.13227/j.hjkx.2016.08.001, 2016.
Cherian, R. and Quaas, J.: Trends in AOD, Clouds, and Cloud Radiative Effects in Satellite Data and CMIP5 and CMIP6 Model Simulations Over Aerosol Source Regions, Geophys. Res. Lett., 47, e2020GL087132, https://doi.org/10.1029/2020GL087132, 2020.
de Leeuw, G., Fan, C., Li, Z., Dong, J., Li, Y., Ou, Y., and Zhu, S.: Spatiotemporal variation and provincial scale differences of the AOD across China during 2000–2021, Atmos. Pollut. Res., 13, 101359, https://doi.org/10.1016/j.apr.2022.101359, 2022.
Digby, R. A. R., Gillett, N. P., Monahan, A. H., von Salzen, K., Gkikas, A., Song, Q., and Zhang, Z.: How well do Earth system models reproduce the observed aerosol response to rapid emission reductions? A COVID-19 case study, Atmos. Chem. Phys., 24, 2077–2097, https://doi.org/10.5194/acp-24-2077-2024, 2024.
Dunne, J. P., Horowitz, L. W., Adcroft, A. J., Ginoux, P., Held, I. M., John, J. G., Krasting, J. P., Malyshev, S., Naik, V., Paulot, F., Shevliakova, E., Stock, C. A., Zadeh, N., Balaji, V., Blanton, C., Dunne, K. A., Dupuis, C., Durachta, J., Dussin, R., Gauthier, P. P. G., Griffies, S. M., Guo, H., Hallberg, R. W., Harrison, M., He, J., Hurlin, W., McHugh, C., Menzel, R., Milly, P. C. D., Nikonov, S., Paynter, D. J., Ploshay, J., Radhakrishnan, A., Rand, K., Reichl, B. G., Robinson, T., Schwarzkopf, D. M., Sentman, L. T., Underwood, S., Vahlenkamp, H., Winton, M., Wittenberg, A. T., Wyman, B., Zeng, Y., and Zhao, M.: The GFDL Earth System Model Version 4.1 (GFDL-ESM 4.1): Overall Coupled Model Description and Simulation Characteristics, J. Adv. Model. Earth Sy., 12, e2019MS002015, https://doi.org/10.1029/2019MS002015, 2020.
Evan, A. T., Flamant, C., Gaetani, M., and Guichard, F.: The past, present and future of African dust, Nature, 531, 493–495, https://doi.org/10.1038/nature17149, 2016.
Eyring, V., Bony, S., Meehl, G. A., Senior, C. A., Stevens, B., Stouffer, R. J., and Taylor, K. E.: Overview of the Coupled Model Intercomparison Project Phase 6 (CMIP6) experimental design and organization, Geosci. Model Dev., 9, 1937–1958, https://doi.org/10.5194/gmd-9-1937-2016, 2016.
Fan, T., Liu, X., Ma, P.-L., Zhang, Q., Li, Z., Jiang, Y., Zhang, F., Zhao, C., Yang, X., Wu, F., and Wang, Y.: Emission or atmospheric processes? An attempt to attribute the source of large bias of aerosols in eastern China simulated by global climate models, Atmos. Chem. Phys., 18, 1395–1417, https://doi.org/10.5194/acp-18-1395-2018, 2018a.
Fan, T., Zhao, C., Dong, X., Liu, X., Yang, X., Zhang, F., Shi, C., Wang, Y., and Wu, F.: Quantify contribution of aerosol errors to cloud fraction biases in CMIP5 Atmospheric Model Intercomparison Project simulations, Int. J. Climatol., 38, 3140–3156, https://doi.org/10.1002/joc.5490, 2018b.
Fan, T., Liu, X., Wu, C., Zhang, Q., Zhao, C., Yang, X., and Li, Y.: Comparison of the Anthropogenic Emission Inventory for CMIP6 Models with a Country-Level Inventory over China and the Simulations of the Aerosol Properties, Adv. Atmos. Sci., 39, 80–96, https://doi.org/10.1007/s00376-021-1119-6, 2022.
Feng, L., Smith, S. J., Braun, C., Crippa, M., Gidden, M. J., Hoesly, R., Klimont, Z., van Marle, M., van den Berg, M., and van der Werf, G. R.: The generation of gridded emissions data for CMIP6, Geosci. Model Dev., 13, 461–482, https://doi.org/10.5194/gmd-13-461-2020, 2020.
Fountoukis, C. and Nenes, A.: ISORROPIA II: a computationally efficient thermodynamic equilibrium model for K+–Ca2+–Mg2+––Na+–––Cl−–H2O aerosols, Atmos. Chem. Phys., 7, 4639–4659, https://doi.org/10.5194/acp-7-4639-2007, 2007.
Geng, G., Xiao, Q., Liu, S., Liu, X., Cheng, J., Zheng, Y., Xue, T., Tong, D., Zheng, B., Peng, Y., Huang, X., He, K., and Zhang, Q.: Tracking Air Pollution in China: Near Real-Time PM2.5 Retrievals from Multisource Data Fusion, Environ. Sci. Technol., 55, 12106–12115, https://doi.org/10.1021/acs.est.1c01863, 2021.
Hammer, M. S., van Donkelaar, A., Li, C., Lyapustin, A., Sayer, A. M., Hsu, N. C., Levy, R. C., Garay, M. J., Kalashnikova, O. V., Kahn, R. A., Brauer, M., Apte, J. S., Henze, D. K., Zhang, L., Zhang, Q., Ford, B., Pierce, J. R., and Martin, R. V.: Global Estimates and Long-Term Trends of Fine Particulate Matter Concentrations (1998–2018), Environ. Sci. Technol., 54, 7879–7890, https://doi.org/10.1021/acs.est.0c01764, 2020.
Hoesly, R. M., Smith, S. J., Feng, L., Klimont, Z., Janssens-Maenhout, G., Pitkanen, T., Seibert, J. J., Vu, L., Andres, R. J., Bolt, R. M., Bond, T. C., Dawidowski, L., Kholod, N., Kurokawa, J.-I., Li, M., Liu, L., Lu, Z., Moura, M. C. P., O'Rourke, P. R., and Zhang, Q.: Historical (1750–2014) anthropogenic emissions of reactive gases and aerosols from the Community Emissions Data System (CEDS), Geosci. Model Dev., 11, 369–408, https://doi.org/10.5194/gmd-11-369-2018, 2018.
Huang, Y., Shen, H., Chen, Y., Zhong, Q., Chen, H., Wang, R., Shen, G., Liu, J., Li, B., and Tao, S.: Global organic carbon emissions from primary sources from 1960 to 2009, Atmos. Environ., 122, 505–512, https://doi.org/10.1016/j.atmosenv.2015.10.017, 2015.
Jacob, D. J.: Heterogeneous chemistry and tropospheric ozone, Atmos. Environ., 34, 2131–2159, https://doi.org/10.1016/S1352-2310(99)00462-8, 2000.
Li, K., Jacob, D. J., Liao, H., Zhu, J., Shah, V., Shen, L., Bates, K. H., Zhang, Q., and Zhai, S.: A two-pollutant strategy for improving ozone and particulate air quality in China, Nat. Geosci., 12, 906–910, https://doi.org/10.1038/s41561-019-0464-x, 2019.
Li, R., Ma, X., Xiong, F., Jia, H., Sha, T., and Tian, R.: Comparisons and evaluation of aerosol burden and optical depth in CMIP5 simulations over East Asia, J. Atmos. Sol.-Terr. Phy., 206, 105315, https://doi.org/10.1016/j.jastp.2020.105315, 2020.
Li, X., Liu, Y., Wang, M., Jiang, Y., and Dong, X.: Assessment of the Coupled Model Intercomparison Project phase 6 (CMIP6) Model performance in simulating the spatial-temporal variation of aerosol optical depth over Eastern Central China, Atmos. Res., 261, 105747, https://doi.org/10.1016/j.atmosres.2021.105747, 2021.
Lin, J., Tong, D., Davis, S., Ni, R., Tan, X., Pan, D., Zhao, H., Lu, Z., Streets, D., Feng, T., Zhang, Q., Yan, Y., Hu, Y., Li, J., Liu, Z., Jiang, X., Geng, G., He, K., Huang, Y., and Guan, D.: Global climate forcing of aerosols embodied in international trade, Nat. Geosci., 9, 790–794, https://doi.org/10.1038/ngeo2798, 2016.
Lin, J.-T., Liu, Z., Zhang, Q., Liu, H., Mao, J., and Zhuang, G.: Modeling uncertainties for tropospheric nitrogen dioxide columns affecting satellite-based inverse modeling of nitrogen oxides emissions, Atmos. Chem. Phys., 12, 12255–12275, https://doi.org/10.5194/acp-12-12255-2012, 2012.
Liu, R. and Liao, H.: Assessment of aerosol effective radiative forcing and surface air temperature response over eastern China in CMIP5 models, Atmos. Oceanic Sci. Lett., 10, 228–234, https://doi.org/10.1080/16742834.2017.1301188, 2017.
Ma, X., Yan, P., Zhao, T., Jia, X., Jiao, J., Ma, Q., Wu, D., Shu, Z., Sun, X., and Habtemicheal, B. A.: Evaluations of Surface PM10 Concentration and Chemical Compositions in MERRA-2 Aerosol Reanalysis over Central and Eastern China, Remote Sens.-Basel, 13, 1317, https://doi.org/10.3390/rs13071317, 2021.
Mahesh, B., Rama, B. V., Spandana, B., Sarma, M. S. S. R. K. N., Niranjan, K., and Sreekanth, V.: Evaluation of MERRAero PM2.5 over Indian cities, Adv. Space Res., 64, 328–334, https://doi.org/10.1016/j.asr.2019.04.026, 2019.
McDuffie, E. E., Smith, S. J., O'Rourke, P., Tibrewal, K., Venkataraman, C., Marais, E. A., Zheng, B., Crippa, M., Brauer, M., and Martin, R. V.: A global anthropogenic emission inventory of atmospheric pollutants from sector- and fuel-specific sources (1970–2017): an application of the Community Emissions Data System (CEDS), Earth Syst. Sci. Data, 12, 3413–3442, https://doi.org/10.5194/essd-12-3413-2020, 2020.
Metzger, S., Dentener, F., Pandis, S., and Lelieveld, J.: Gas/aerosol partitioning: 1. A computationally efficient model, J. Geophys. Res.-Atmos., 107, ACH 16-11–ACH 16-24, https://doi.org/10.1029/2001JD001102, 2002.
Michou, M., Nabat, P., Saint-Martin, D., Bock, J., Decharme, B., Mallet, M., Roehrig, R., Séférian, R., Sénési, S., and Voldoire, A.: Present-Day and Historical Aerosol and Ozone Characteristics in CNRM CMIP6 Simulations, J. Adv. Model. Earth Sy., 12, e2019MS001816, https://doi.org/10.1029/2019MS001816, 2020.
Mortier, A., Gliß, J., Schulz, M., Aas, W., Andrews, E., Bian, H., Chin, M., Ginoux, P., Hand, J., Holben, B., Zhang, H., Kipling, Z., Kirkevåg, A., Laj, P., Lurton, T., Myhre, G., Neubauer, D., Olivié, D., von Salzen, K., Skeie, R. B., Takemura, T., and Tilmes, S.: Evaluation of climate model aerosol trends with ground-based observations over the last 2 decades – an AeroCom and CMIP6 analysis, Atmos. Chem. Phys., 20, 13355–13378, https://doi.org/10.5194/acp-20-13355-2020, 2020.
Mulcahy, J. P., Johnson, C., Jones, C. G., Povey, A. C., Scott, C. E., Sellar, A., Turnock, S. T., Woodhouse, M. T., Abraham, N. L., Andrews, M. B., Bellouin, N., Browse, J., Carslaw, K. S., Dalvi, M., Folberth, G. A., Glover, M., Grosvenor, D. P., Hardacre, C., Hill, R., Johnson, B., Jones, A., Kipling, Z., Mann, G., Mollard, J., O'Connor, F. M., Palmiéri, J., Reddington, C., Rumbold, S. T., Richardson, M., Schutgens, N. A. J., Stier, P., Stringer, M., Tang, Y., Walton, J., Woodward, S., and Yool, A.: Description and evaluation of aerosol in UKESM1 and HadGEM3-GC3.1 CMIP6 historical simulations, Geosci. Model Dev., 13, 6383–6423, https://doi.org/10.5194/gmd-13-6383-2020, 2020.
Park, H., Chung, C. E., Ekman, A. M. L., and Choi, J.-O.: Evaluation of ACCMIP simulated fine-mode AOD and its implication for aerosol direct forcing, Asia-Pac. J. Atmos. Sci., 50, 377–390, https://doi.org/10.1007/s13143-014-0025-6, 2014.
Paulot, F., Ginoux, P., Cooke, W. F., Donner, L. J., Fan, S., Lin, M.-Y., Mao, J., Naik, V., and Horowitz, L. W.: Sensitivity of nitrate aerosols to ammonia emissions and to nitrate chemistry: implications for present and future nitrate optical depth, Atmos. Chem. Phys., 16, 1459–1477, https://doi.org/10.5194/acp-16-1459-2016, 2016.
Paulot, F., Paynter, D., Ginoux, P., Naik, V., and Horowitz, L. W.: Changes in the aerosol direct radiative forcing from 2001 to 2015: observational constraints and regional mechanisms, Atmos. Chem. Phys., 18, 13265–13281, https://doi.org/10.5194/acp-18-13265-2018, 2018.
Pu, B. and Ginoux, P.: How reliable are CMIP5 models in simulating dust optical depth?, Atmos. Chem. Phys., 18, 12491–12510, https://doi.org/10.5194/acp-18-12491-2018, 2018.
Seinfeld, J. H., Bretherton, C., Carslaw, K. S., Coe, H., DeMott, P. J., Dunlea, E. J., Feingold, G., Ghan, S., Guenther, A. B., Kahn, R., Kraucunas, I., Kreidenweis, S. M., Molina, M. J., Nenes, A., Penner, J. E., Prather, K. A., Ramanathan, V., Ramaswamy, V., Rasch, P. J., Ravishankara, A. R., Rosenfeld, D., Stephens, G., and Wood, R.: Improving our fundamental understanding of the role of aerosol-cloud interactions in the climate system, P. Natl. Acad. Sci. USA, 113, 5781–5790, https://doi.org/10.1073/pnas.1514043113, 2016.
Shim, S., Sung, H., Kwon, S., Kim, J., Lee, J., Sun, M., Song, J., Ha, J., Byun, Y., Kim, Y., Turnock, S. T., Stevenson, D. S., Allen, R. J., O'Connor, F. M., Teixeira, J. C., Williams, J., Johnson, B., Keeble, J., Mulcahy, J., and Zeng, G.: Regional Features of Long-Term Exposure to PM2.5 Air Quality over Asia under SSP Scenarios Based on CMIP6 Models, Int. J. Env. Res. Pub. He., 18, 6817, https://doi.org/10.3390/ijerph18136817, 2021.
Sockol, A. and Small Griswold, J. D.: Intercomparison between CMIP5 model and MODIS satellite-retrieved data of aerosol optical depth, cloud fraction, and cloud-aerosol interactions, Earth Space Sci., 4, 485–505, https://doi.org/10.1002/2017EA000288, 2017.
Song, H., Zhang, K., Piao, S., and Wan, S.: Spatial and temporal variations of spring dust emissions in northern China over the last 30 years, Atmos. Environ., 126, 117–127, https://doi.org/10.1016/j.atmosenv.2015.11.052, 2016.
Su, X., Wu, T., Zhang, J., Zhang, Y., Jin, J., Zhou, Q., Zhang, F., Liu, Y., Zhou, Y., Zhang, L., Turnock, S. T., and Furtado, K.: Present-Day PM2.5 over Asia: Simulation and Uncertainty in CMIP6 ESMs, J. Meteorol. Res.-PRC, 36, 429–449, https://doi.org/10.1007/s13351-022-1202-7, 2022.
Tang, Z., Tian, J., Zhang, Y., Zhang, X., Zhang, J., Ma, N., Li, X., and Song, P.: Anthropogenic aerosols dominated the decreased solar radiation in eastern China over the last five decades, J. Clean. Prod., 380, 135150, https://doi.org/10.1016/j.jclepro.2022.135150, 2022.
Tao, S., Ru, M. Y., Du, W., Zhu, X., Zhong, Q. R., Li, B. G., Shen, G. F., Pan, X. L., Meng, W. J., Chen, Y. L., Shen, H. Z., Lin, N., Su, S., Zhuo, S. J., Huang, T. B., Xu, Y., Yun, X., Liu, J. F., Wang, X. L., Liu, W. X., Cheng, H. F., and Zhu, D. Q.: Quantifying the rural residential energy transition in China from 1992 to 2012 through a representative national survey, Nat. Energy, 3, 567–573, https://doi.org/10.1038/s41560-018-0158-4, 2018.
Tegen, I., Neubauer, D., Ferrachat, S., Siegenthaler-Le Drian, C., Bey, I., Schutgens, N., Stier, P., Watson-Parris, D., Stanelle, T., Schmidt, H., Rast, S., Kokkola, H., Schultz, M., Schroeder, S., Daskalakis, N., Barthel, S., Heinold, B., and Lohmann, U.: The global aerosol–climate model ECHAM6.3–HAM2.3 – Part 1: Aerosol evaluation, Geosci. Model Dev., 12, 1643–1677, https://doi.org/10.5194/gmd-12-1643-2019, 2019.
Turnock, S. T., Allen, R. J., Andrews, M., Bauer, S. E., Deushi, M., Emmons, L., Good, P., Horowitz, L., John, J. G., Michou, M., Nabat, P., Naik, V., Neubauer, D., O'Connor, F. M., Olivié, D., Oshima, N., Schulz, M., Sellar, A., Shim, S., Takemura, T., Tilmes, S., Tsigaridis, K., Wu, T., and Zhang, J.: Historical and future changes in air pollutants from CMIP6 models, Atmos. Chem. Phys., 20, 14547–14579, https://doi.org/10.5194/acp-20-14547-2020, 2020.
van Donkelaar, A., Martin, R. V., Brauer, M., Hsu, N. C., Kahn, R. A., Levy, R. C., Lyapustin, A., Sayer, A. M., and Winker, D. M.: Global Estimates of Fine Particulate Matter using a Combined Geophysical-Statistical Method with Information from Satellites, Models, and Monitors, Environ. Sci. Technol., 50, 3762–3772, https://doi.org/10.1021/acs.est.5b05833, 2016.
van Donkelaar, A., Martin, R. V., Li, C., and Burnett, R. T.: Regional Estimates of Chemical Composition of Fine Particulate Matter Using a Combined Geoscience-Statistical Method with Information from Satellites, Models, and Monitors, Environ. Sci. Technol., 53, 2595–2611, https://doi.org/10.1021/acs.est.8b06392, 2019 (data available at: https://sites.wustl.edu/acag/datasets/surface-pm2-5-archive/#V4.CH.03, last access: 2 December 2020).
van Donkelaar, A., Hammer, M. S., Bindle, L., Brauer, M., Brook, J. R., Garay, M. J., Hsu, N. C., Kalashnikova, O. V., Kahn, R. A., Lee, C., Levy, R. C., Lyapustin, A., Sayer, A. M., and Martin, R. V.: Monthly Global Estimates of Fine Particulate Matter and Their Uncertainty, Environ. Sci. Technol., 55, 15287–15300, https://doi.org/10.1021/acs.est.1c05309, 2021.
van Noije, T., Bergman, T., Le Sager, P., O'Donnell, D., Makkonen, R., Gonçalves-Ageitos, M., Döscher, R., Fladrich, U., von Hardenberg, J., Keskinen, J.-P., Korhonen, H., Laakso, A., Myriokefalitakis, S., Ollinaho, P., Pérez García-Pando, C., Reerink, T., Schrödner, R., Wyser, K., and Yang, S.: EC-Earth3-AerChem: a global climate model with interactive aerosols and atmospheric chemistry participating in CMIP6, Geosci. Model Dev., 14, 5637–5668, https://doi.org/10.5194/gmd-14-5637-2021, 2021.
Wang, C., Wang, Z., Lei, Y., Zhang, H., Che, H., and Zhang, X.: Differences in East Asian summer monsoon responses to Asian aerosol forcing under different emission inventories, Adv. Clim. Change Res., 13, 309–322, https://doi.org/10.1016/j.accre.2022.02.008, 2022.
Wang, R., Tao, S., Shen, H., Huang, Y., Chen, H., Balkanski, Y., Boucher, O., Ciais, P., Shen, G., Li, W., Zhang, Y., Chen, Y., Lin, N., Su, S., Li, B., Liu, J., and Liu, W.: Trend in Global Black Carbon Emissions from 1960 to 2007, Environ. Sci. Technol., 48, 6780–6787, https://doi.org/10.1021/es5021422, 2014.
Wang, S., Yu, Y., Zhang, X., Lu, H., Zhang, X., and Xu, Z.: Weakened dust activity over China and Mongolia from 2001 to 2020 associated with climate change and land-use management, Environ. Res. Lett., 16, https://doi.org/10.1088/1748-9326/ac3b79, 2021.
Wang, Z., Lin, L., Xu, Y., Che, H., Zhang, X., Zhang, H., Dong, W., Wang, C., Gui, K., and Xie, B.: Incorrect Asian aerosols affecting the attribution and projection of regional climate change in CMIP6 models, NPJ Clim. Atmos. Sci., 4, 2, https://doi.org/10.1038/s41612-020-00159-2, 2021.
Wilcox, L. J., Allen, R. J., Samset, B. H., Bollasina, M. A., Griffiths, P. T., Keeble, J., Lund, M. T., Makkonen, R., Merikanto, J., O'Donnell, D., Paynter, D. J., Persad, G. G., Rumbold, S. T., Takemura, T., Tsigaridis, K., Undorf, S., and Westervelt, D. M.: The Regional Aerosol Model Intercomparison Project (RAMIP), Geosci. Model Dev., 16, 4451–4479, https://doi.org/10.5194/gmd-16-4451-2023, 2023.
World Climate Research Programme (WCRP): WCRP Coupled Model Intercomparison Project (Phase 6), ESGF [data set], https://esgf-node.llnl.gov/projects/cmip6/, last access: 8 September 2020.
World Health Organization: WHO Global Air Quality Guidelines: Particulate Matter (PM2.5 and PM10), Ozone, Nitrogen Dioxide, Sulfur Dioxide and Carbon Monoxide, World Health Organization, Geneva, ISBN 978924003422, 2021.
Wu, J., Shi, Y., and Xu, Y.: Evaluation and Projection of Surface Wind Speed Over China Based on CMIP6 GCMs, J. Geophys. Res.-Atmos., 125, e2020JD033611, https://doi.org/10.1029/2020JD033611, 2020.
Wu, T., Lu, Y., Fang, Y., Xin, X., Li, L., Li, W., Jie, W., Zhang, J., Liu, Y., Zhang, L., Zhang, F., Zhang, Y., Wu, F., Li, J., Chu, M., Wang, Z., Shi, X., Liu, X., Wei, M., Huang, A., Zhang, Y., and Liu, X.: The Beijing Climate Center Climate System Model (BCC-CSM): the main progress from CMIP5 to CMIP6, Geosci. Model Dev., 12, 1573–1600, https://doi.org/10.5194/gmd-12-1573-2019, 2019.
Wu, T., Zhang, F., Zhang, J., Jie, W., Zhang, Y., Wu, F., Li, L., Yan, J., Liu, X., Lu, X., Tan, H., Zhang, L., Wang, J., and Hu, A.: Beijing Climate Center Earth System Model version 1 (BCC-ESM1): model description and evaluation of aerosol simulations, Geosci. Model Dev., 13, 977–1005, https://doi.org/10.5194/gmd-13-977-2020, 2020.
Xu, Y., Wu, J., and Han, Z.: Evaluation and Projection of Surface PM2.5 and Its Exposure on Population in Asia Based on the CMIP6 GCMs, Int. J. Env. Res. Pub. He., 19, 12092, https://doi.org/10.3390/ijerph191912092, 2022.
Yang, X., Zhou, B., Xu, Y., and Han, Z.: CMIP6 Evaluation and Projection of Temperature and Precipitation over China, Adv. Atmos. Sci., 38, 817–830, https://doi.org/10.1007/s00376-021-0351-4, 2021.
Yue, M., Wang, M., Guo, J., Zhang, H., Dong, X., and Liu, Y.: Long-Term Trend Comparison of Planetary Boundary Layer Height in Observations and CMIP6 Models over China, J. Climate, 34, 8237–8256, https://doi.org/10.1175/JCLI-D-20-1000.1, 2021.
Zhai, S., Jacob, D. J., Wang, X., Shen, L., Li, K., Zhang, Y., Gui, K., Zhao, T., and Liao, H.: Fine particulate matter (PM2.5) trends in China, 2013–2018: separating contributions from anthropogenic emissions and meteorology, Atmos. Chem. Phys., 19, 11031–11041, https://doi.org/10.5194/acp-19-11031-2019, 2019.
Zhai, S., Jacob, D. J., Wang, X., Liu, Z., Wen, T., Shah, V., Li, K., Moch, J. M., Bates, K. H., Song, S., Shen, L., Zhang, Y., Luo, G., Yu, F., Sun, Y., Wang, L., Qi, M., Tao, J., Gui, K., Xu, H., Zhang, Q., Zhao, T., Wang, Y., Lee, H. C., Choi, H., and Liao, H.: Control of particulate nitrate air pollution in China, Nat. Geosci., 14, 389–395, https://doi.org/10.1038/s41561-021-00726-z, 2021.
Zhang, L., Li, J., Jiang, Z., Dong, Y., Ying, T., and Zhang, Z.: Clear-Sky Direct Aerosol Radiative Forcing Uncertainty Associated with Aerosol Optical Properties Based on CMIP6 Models, J. Climate, 35, 3007–3019, https://doi.org/10.1175/JCLI-D-21-0479.1, 2022.
Zhang, Q., Jiang, X., Tong, D., Davis, S. J., Zhao, H., Geng, G., Feng, T., Zheng, B., Lu, Z., Streets, D. G., Ni, R., Brauer, M., van Donkelaar, A., Martin, R. V., Huo, H., Liu, Z., Pan, D., Kan, H., Yan, Y., Lin, J., He, K., and Guan, D.: Transboundary health impacts of transported global air pollution and international trade, Nature, 543, 705–709, https://doi.org/10.1038/nature21712, 2017.
Zhang, X., Hua, L., and Jiang, D.: Assessment of CMIP6 model performance for temperature and precipitation in Xinjiang, China, Atmos. Oceanic Sci. Lett., 15, 100128, https://doi.org/10.1016/j.aosl.2021.100128, 2022.
Zhao, A., Ryder, C. L., and Wilcox, L. J.: How well do the CMIP6 models simulate dust aerosols?, Atmos. Chem. Phys., 22, 2095–2119, https://doi.org/10.5194/acp-22-2095-2022, 2022.
Zheng, B., Tong, D., Li, M., Liu, F., Hong, C., Geng, G., Li, H., Li, X., Peng, L., Qi, J., Yan, L., Zhang, Y., Zhao, H., Zheng, Y., He, K., and Zhang, Q.: Trends in China's anthropogenic emissions since 2010 as the consequence of clean air actions, Atmos. Chem. Phys., 18, 14095–14111, https://doi.org/10.5194/acp-18-14095-2018, 2018.
Zhu, H., Jiang, Z., Li, J., Li, W., Sun, C., and Li, L.: Does CMIP6 Inspire More Confidence in Simulating Climate Extremes over China?, Adv. Atmos. Sci., 37, 1119–1132, https://doi.org/10.1007/s00376-020-9289-1, 2020.
Zhu, Y. and Yang, S.: Evaluation of CMIP6 for historical temperature and precipitation over the Tibetan Plateau and its comparison with CMIP5, Adv. Clim. Change Res., 11, 239–251, https://doi.org/10.1016/j.accre.2020.08.001, 2020.