the Creative Commons Attribution 4.0 License.
the Creative Commons Attribution 4.0 License.
 | 18 Jun 2024
Calibrating and validating the Integrated Valuation of Ecosystem Services and Tradeoffs (InVEST) urban cooling model: case studies in France and the United States
Martí Bosch
Léa Tardieu
Aude Lemonsu
Cécile de Munck
Chris Nootenboom
Vincent Viguié
Eric Lonsdorf
James A. Douglass
Richard P. Sharp
Understanding the cooling service provided by vegetation in cities is important to inform urban policy and planning. However, the performance of decision-support tools estimating heat mitigation for urban greening strategies has not been evaluated systematically. Here, we further develop a calibration algorithm and evaluate the performance of the urban cooling model developed within the open-source InVEST (Integrated Valuation of Ecosystem Services and Tradeoffs) software. The urban cooling model estimates air temperature reduction due to vegetation based on four predictors, shade, evapotranspiration, albedo, and building density, and was designed for data-rich and data-scarce situations. We apply the calibration algorithm and evaluate the model in two case studies (Paris, France, and Minneapolis–St Paul, USA) by examining the spatial correlation between InVEST predictions and reference temperature data at a 1 km horizontal resolution. In both case studies, model performance was high for nighttime air temperatures, which are an important indicator of human wellbeing. After calibration, we found medium performance for surface temperatures during daytime but low performance for daytime air temperatures in both case studies, which may be due to model and data limitations. We illustrate the model adequacy for urban planning by testing its ability to simulate a green infrastructure scenario in the Paris case study. The predicted air temperature change compared well to that of an alternative physics-based model (r2=0.55 and r2=0.85 for daytime and nighttime air temperatures, respectively). Finally, we discuss opportunities and challenges for the use of such parsimonious decision-support tools, highlighting their importance to mainstream ecosystem services information for urban planning.
- Article
(4676 KB) - Full-text XML
-
Supplement
(295 KB) - BibTeX
- EndNote


The urban heat island has been increasingly documented, varying from 1 to 10 °C in European cities with an average of 6 °C for a sample of 110 European cities (Santamouris, 2016). The phenomenon involves an increase in air and surface temperatures in urban areas due to the modification of the energy budget (Oke, 1982). This has direct health, economic, and energy consumption implications (Lehmann, 2014; Santamouris, 2020) as excessive heat has been associated with increases in energy consumption for cooling purposes, increases in ground-level ozone and particulate matter concentrations, and increases in hospital admissions due to cardiovascular conditions (Hémon and Jougla, 2004; Gosling et al., 2009; Lai and Cheng, 2009; Reid et al., 2012; Santamouris, 2015; Wang et al., 2017; Viguié et al., 2020). To reduce these effects, policymakers and urban planners are increasingly turning to blue–green infrastructure (e.g., street trees, green roofs, and urban parks), a cost-effective option for urban cooling that also produces multiple secondary benefits (Bolund and Hunhammar, 1999; Rosenzweig et al., 2006; Villanueva-Solis, 2017; Corburn, 2009; Cortinovis and Geneletti, 2019).
Blue–green infrastructure influences air temperatures and thermal comfort at several scales. At a local scale – a tree or building – shade can reduce air temperature under the canopy (Kroeger et al., 2018; McDonald et al., 2016; Shashua-Bar and Hoffman, 2000). Street trees can also indirectly improve pedestrian comfort and reduce the use of air conditioning in neighboring buildings, thus avoiding additional heat generation (Viguié et al., 2020). Green roofs and walls change the heat and energy balance of buildings; by absorbing incident solar radiation to support biological functions, vegetation acts as a screen and reduces seasonal temperature variations – although to a limited extent compared to other insulating materials (Eumorfopoulou and Kontoleon, 2009). At a larger scale, urban parks provide an “oasis effect”, reducing air temperatures by up to 6 °C (Ziter et al., 2019; Kroeger et al., 2018; Jauregui, 1990; Eliasson, 1996; Spronken-Smith and Oke, 1999; Potchter et al., 2006; Yu et al., 2020). The effect is influenced by park size (Cao et al., 2010; Yu et al., 2020), composition (Potchter et al., 2006), and local climatic conditions (Shashua-Bar and Hoffman, 2000; Yu et al., 2020). In a systematic literature review, Bowler et al. (2010) showed that parks larger than 2–3 ha are systematically cooler than the rest of the city. Recent work by Wong et al. (2021) suggests a lower threshold of 1 ha. For such large parks, the cooling capacity depends mainly on evapotranspiration and can extend to 800 m, although it is more frequently closer to 100 m (Kroeger et al., 2018; Wong et al., 2021).
Quantitative estimates of the cooling service provided by vegetation come from two main areas. Research in urban climatology examines the physical processes contributing to air cooling (Phelan et al., 2015). These studies often involve complex numerical models – mesoscale or microscale (Meili et al., 2020; Lemonsu et al., 2012) that focus on one or several processes explaining microclimate and increasingly incorporate vegetation effects (Bartesaghi Koc et al., 2018). Such models require long development and calibration processes and therefore significant human and time resources. The same applies to geostatistical models that require large geospatial datasets (e.g., Cheung et al., 2021). On the other hand, an increasing body of literature in the fields of urban ecology and ecosystem services science examines the cooling service through indicators associated with land use (Zardo et al., 2017; Larondelle and Haase, 2013; Derkzen et al., 2015; Nedkov et al., 2017; Farrugia et al., 2013) as reviewed in previous work (Hamel et al., 2021). These models further simplify the physical processes underlying the cooling dynamics, the effect of the morphological parameters of the buildings, and the daily or seasonal temperature variations, often by attributing a “cooling capacity” to a broadly defined land use type.
Cooling service models routinely measure the cooling effect of vegetation using land surface temperature, which is readily accessible from satellite data (Manoli et al., 2019; Zhao et al., 2014). Surface temperature influences thermal comfort and is often correlated with air temperature, making it an interesting proxy for microclimate studies. However, this temperature alone does not suffice to estimate the economic or health implications of the urban heat island (Martilli et al., 2020; Venter et al., 2021), reducing the relevance of models estimating land surface temperature in policy making.
These model limitations lead to a lack of decision-support tools that accurately quantify the cooling effect of vegetation on air temperatures and therefore cannot quantify its impact in socioeconomic terms. A recent review of open-source tools found that only a few ecosystem services software tools were adequate for general urban planning purposes – i.e., applicable in any location and flexible enough to represent different types of blue–green infrastructure and decision contexts (Hamel et al., 2021). InVEST (Integrated Valuation of Ecosystem Services and Tradeoffs) is one of the most popular tools developed to support ecosystem services assessments by quantifying and mapping the benefits provided by blue–green infrastructure in urban or non-urban environments (Natural Capital Project, 2022). The urban cooling model within InVEST, developed by the author team, addresses some of the limitations stated above by estimating air temperature (instead of land surface temperature only), as it is applicable in cities all around the world using readily available data.
The InVEST urban cooling model has recently been applied to an urban European dataset (Cortinovis et al., 2022) and to individual cities in Europe and India (Kadaverugu et al., 2021; Zawadzka et al., 2021; Bosch et al., 2021). However, attempts to validate the model against observed or modeled data are much rarer. In previous work, Bosch et al. (2021) found that the model performed well in Lausanne, although the observation data were sparse, with 11 weather stations over 112 km2. Zawadzka et al. (2021) found that the model explained between 48 % and 60 % of the variability in land surface temperature for a summer day in three towns in the United Kingdom. Despite these notable efforts, the model has not been extensively tested and validated against spatialized air temperature data.
The goal of this paper is to evaluate the performance of the InVEST urban cooling model in different contexts: daytime and nighttime and with different levels of data availability. In doing so, we further develop an open-source calibration algorithm to facilitate future applications of the model (Bosch et al., 2021). Given the intended use of InVEST as a decision-support tool, we focus model performance assessment on two aspects: the ability to represent spatial variations in temperatures and the ability to represent temporal changes in temperature due to landscape changes. We test the model through two case studies with contrasting climates: the Paris metropolitan area, France, and the Twin Cities, Minnesota, USA. In the following sections, we present the model performance assessment and discuss the strengths and limitations of the tool and its recommended use to inform urban planning policies.
We assess the performance of the InVEST model for the current land use and land cover (LULC) by comparing its outputs with available air temperature and land surface temperature “best estimates”. Since daytime temperatures are highly influenced by convection and atmospheric turbulence confounding the effect of land use (Le Roy et al., 2020), we hypothesized that the InVEST daytime outputs would better capture variations in land surface temperatures rather than air temperatures. On the contrary, nighttime temperatures are strongly influenced by land cover (in particular built infrastructure) and thermal processes, so we expected to find a stronger correlation between InVEST and nighttime air temperature. Given the purpose of the model to support decision-making, we also assess the model's ability to capture the effect of a change in LULC on urban cooling.
2.1 Case studies
2.1.1 Paris metropolitan area
The Paris metropolitan area, situated in the Île-de-France administrative region, is our main case study. Île-de-France spans over 12 000 km2, with the land use being predominantly agriculture (50 %), forests (24 %), and artificial areas (22.5 %) (see Fig. A1 in Appendix A). The climate in Paris is oceanic (humid temperate, no dry season, and warm summers). Average rainfall over the period 1981–2010 was 637 mm, and summer (June to August) temperatures averaged 19.7 °C with increasingly frequent temperature peaks in the middle of summer (Météo-France). The study period is the heat wave of 8–13 August 2003, described in previous work (de Munck et al., 2018), which led to maximum daytime temperatures of over 39 °C in the region. A greening scenario for the Paris metropolitan area was developed by de Munck et al. (2018) to simulate the implementation of low and high vegetation (60 % grass and small shrubs and 40 % deciduous trees) for 50 % of available ground surface (except roads and areas already covered by vegetation). This represents the greening of pavements, squares, car parks, and some roofs over a surface of 199 km2, or a 23 % increase in green areas, resulting in a reduction of up to 2 °C in maximum daily mean temperatures over the study area (de Munck et al., 2018).
2.1.2 The Twin Cities
The second case study, used to validate the model in a different climate zone, is in the Twin Cities metropolitan area surrounding the cities of Minneapolis and St Paul in Minnesota, USA (see Fig. A2 in Appendix A). The climate of the Twin Cities is classified as hot-summer humid continental. We studied the regional heat wave event of 22 July 2016 and the average air temperatures over the period 2011–2014, building on previous studies of urban heat islands in the region (Smoliak et al., 2015).
2.2 Model description
The InVEST urban cooling model, hereafter “InVEST model”, is fully described in the InVEST software user manual (Natural Capital Project, 2022). We provide a summary of the key equations here to orient readers. The model computes air temperature prior to air mixing (Tnomix, in degrees Celsius) for each pixel as a function of a background rural reference temperature (Tref) modified by a local heat factor. The latter is expressed as the maximum urban heat island intensity for the city (UHImax) modulated by the local heat mitigation (HM) such that for a given pixel i,
While this temperature does not account for mixing due to atmospheric turbulence, actual air temperature, Tair, is estimated from Tnomix using a spatial moving average algorithm with search radius rmix. This radius varies with time depending on the lateral mixing due to atmospheric turbulence and can be estimated through calibration (Sect. 2.4).
The proportion of heat mitigation relative to UHImax, with values ranging between 0 and 1, is derived from the cooling capacity (CC) of the LULC type for a given pixel and from the proximity to large parks. Following an approach proposed by others (Zardo et al., 2017; Kunapo et al., 2018), the cooling capacity during daytime is expressed as a function of shade, evapotranspiration, and albedo:
where S(i), A(i), and E(i) are unitless indices ranging from 0 to 1 that characterize shade, albedo, and evapotranspiration for the pixel i, respectively. They are each weighted by a coefficient (WS, WA, or WE) constant across the study area. S represents the proportion of shade for a given LULC type, e.g., 1 for a land cover type completely covered by canopy or high buildings and 0 for bare ground. A is the albedo value of the land cover. E is calculated from reference evapotranspiration (a raster called ET0, in mm) and the crop coefficient (Kc, no unit) for the LULC type and then normalized by the maximum value of reference evapotranspiration in the area of interest according to
For nighttime temperatures, the model calculates cooling capacity as the complement of building density (B), an indicator representing urban compactness that is highly correlated with heat storage capacity (Wong et al., 2021). Building capacity is normalized across the area and can be obtained from building density data: a value of 1 implies that the pixel is covered by the buildings with the highest energy retention, often the tallest buildings, corresponding to a maximum nighttime urban heat island effect.
To account for the effect of large parks (>2 ha) in both nighttime and daytime, the heat mitigation factor, HM, equals a distance-weighted average of the CC values from surrounding areas (CCpark). The algorithm for this distance-weighted average for a pixel i is as follows:
where GA(i) is the total area of green spaces in a buffer of radius dcool (the distance over which a green space has a cooling effect); area is the area of a pixel in ha; c(dcool) is the buffer area of radius dcool; g(j) is 1 if pixel j is a green space, 0 otherwise; CCpark(i) is the cooling capacity including the influence of parks; and d(i,j) is the distance between pixels i and j.
In plain words, if the amount of green space surrounding a pixel (GA) is less than 2 ha, the value of HM for the pixel equals CC (Eq. 5c), assuming little cooling effect outside the park other than through air mixing due to atmospheric turbulence (defined by rmix). The threshold size of 2 ha is obtained from the literature (Bowler et al., 2010; see also the “Discussion” section).
2.3 Input and calibration data
2.3.1 Paris metropolitan area
Input data. LULC data for the Île-de-France region were obtained from the regional urban planning agency Mode d'occupation du sol (MOS) for the year 2003 (Fig. S1). Reference evapotranspiration (ET0) for August was obtained from monthly modeled climatological data for the region, averaged for the 1985–2005 period (ALADIN model; Stéfanon et al., 2015). Using long-term average reference evapotranspiration instead of the 2003 reference evapotranspiration has a limited effect on outputs given that the InVEST model only uses relative values (see Eq. 3), which have lower temporal variability than absolute values. LULC parameter values for shade, crop evapotranspiration coefficient, albedo, and building intensity were assigned based on a combination of expert opinion and literature review (see Appendix B).
Reference temperature data. In the Paris case study, we compared the InVEST model outputs with two datasets of land surface temperature and air temperature. Land surface temperature maps with a 1 km horizontal resolution were retrieved from MODIS satellite products (Wan, 2013). They were obtained for 13 August 2003 during daytime and nighttime since data were missing for the two dates closer to the peak of the heat wave (11 and 12 August). We also considered higher-resolution data from Landsat, but due to their lower frequency (16 d) there were no data from around the study period. MODIS land surface temperature data have been used in many surface urban heat island studies globally and regionally (Chakraborty and Lee, 2019; Li et al., 2017).
Predictions of air temperature maps with a 1 km horizontal resolution were obtained from the simulations performed by de Munck et al. (2018) using the physical land surface model Town Energy Balance/surface–atmosphere exchanges (TEB/SURFEX; Masson, 2000; Lemonsu et al., 2012; Masson et al., 2013). The model computes the energy and water budgets for a geographic domain of 100 km × 100 km centered on Paris with a user-defined regular grid and for natural and urban areas, taking land cover and building characteristics as inputs (Masson, 2000). The outputs used in this study were the 6 d average air temperatures from 8 to 13 August 2003. The 1st and 99th percentiles were extracted from these air temperature data to define the extreme temperature conditions over the domain during the heat wave (to exclude visible outliers). The background reference rural temperature (Tref) was set to the 1st percentile, while the maximum urban heat island intensity (UHImax) was the difference between both percentiles. Because the TEB/SURFEX data were available for a 100 km × 100 km window, the rest of the analyses are presented for this domain rather than for the entire Île-de-France region. The three datasets, InVEST, TEB/SURFEX, and MODIS, were resampled using bilinear interpolation to a common 1 km grid for comparison.
2.3.2 The Twin Cities
Input data. We used the 2016 LULC data from the National Land Cover Dataset (NLCD; Homer et al., 2020). Details on LULC parameter values are provided in Appendix B and in previous work (Hamel et al., 2021). Reference evapotranspiration for July 2016 was obtained from globally available data from the Consultative Group on International Agricultural Research (CGIAR) Global Aridity Index and Potential Evapotranspiration (ET0) Climate Database v2.
Reference temperature data. We compared air temperature as modeled by InVEST to two data sources: the midday land surface temperature maps of the study area during a regional heat wave on 22 July 2016, retrieved from Landsat data at a 30 m horizontal resolution for daytime and MODIS for nighttime (Wan, 2013), and rasters of average summertime (June, July, and August, 2011–2014) daytime and nighttime air temperatures across the study area, interpolated from a dense network of temperature sensors (∼ 170 stations over 5000 km2, interpolated by co-kriging using impervious surfaces; Smoliak et al., 2015). We projected the reference temperature data to match the InVEST output coordinate system and resampled all datasets using bilinear interpolation to match the resolution (∼ 1 km) of the Smoliak et al. (2015) data. The background reference rural temperature (Tref) was defined using the average air temperature in July for the metropolitan area obtained from the US National Weather Service (23.2 °C; NOAA, 2020), and the maximum urban heat island intensity (UHImax) was taken from a global assessment of urban heat islands (2.05 °C; Chakraborty and Lee, 2019).
2.4 Model calibration and performance assessment
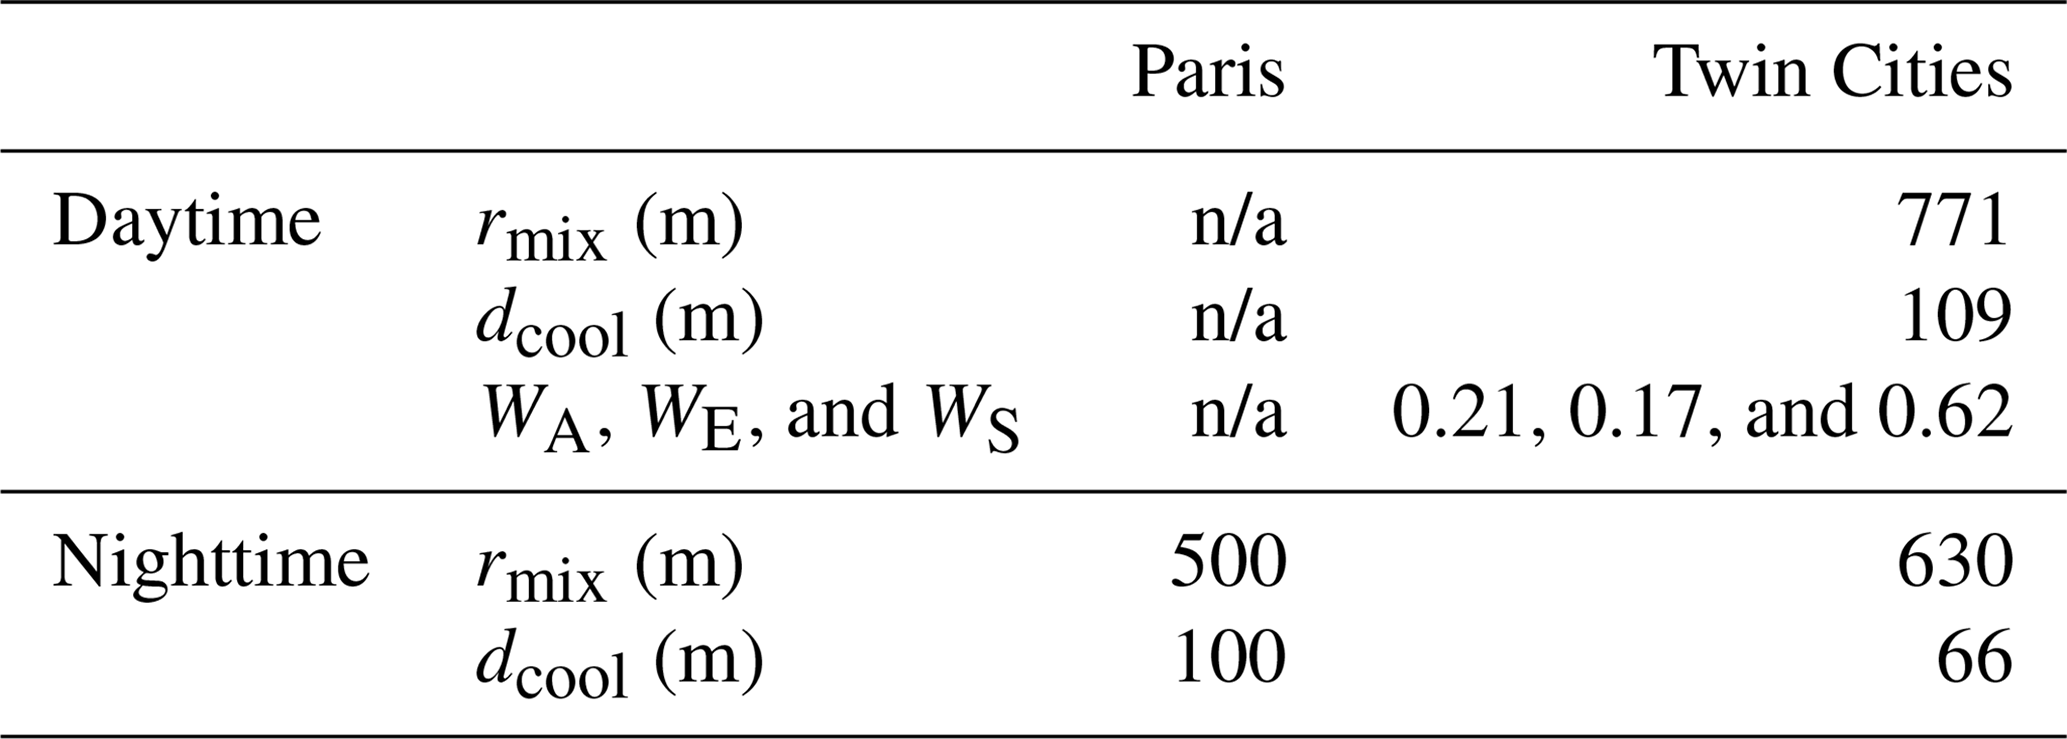
The model outputs were first assessed without calibration, using the default parameter values (500, 100 m, 0.2, 0.2, and 0.6, for rmix, dcool, WA, WE, and WS, respectively). For calibration, we further developed an optimization algorithm used in previous work (Bosch et al., 2021). The algorithm starts with default parameter values and implements a simulated annealing optimization to derive the values of the five parameters for daytime (rmix, dcool, WA, WE, and WS) or the two parameters for nighttime (rmix and dcool) until the algorithm converges to a solution that minimizes r2 (or a limit of 100 iterations is reached). The main improvement to the calibration tool developed for this study is the ability to use either point data (e.g., a network of stations) or raster data (as is the case for the temperature data in this study) as reference temperatures. Other improvements are minor and of a technical nature. They include testing for the compatibility of user inputs, updating deprecated packages, and improving the code efficiency and readability, as is documented in the source code. The tool reports several performance metrics: mean absolute error (MAE), root mean square error (RMSE), and r2. Following previous work (Bosch et al., 2021), we selected these metrics since MAE and RMSE are useful quantifications of the uncertainty in model outputs with physical quantities (expressed in °C), which is important for understanding the impact of errors. However, MAE and RMSE also depend on UHImax, which means that performance might be artificially good for areas with small urban heat island magnitudes. For this reason, we also report r2 (the default performance criterion for the optimization). The source code for the calibration tool can be found at https://github.com/martibosch/invest-ucm-calibration/tree/v0.6.0 (last access: 20 March 2024) and on Zenodo; please refer to the “Code availability ” section. A user guide is available at https://invest-ucm-calibration.readthedocs.io/en/latest/usage.html (last access: 20 March 2024). In addition, we performed one-at-a-time sensitivity analyses to further understand how the calibration parameters influence model outputs. Ranges of variation for each parameter are provided in Appendix C.
To demonstrate the application of the InVEST model in practice and assess the model's ability to represent the effect of a change in LULC, we also examined the effect of a greening strategy on urban cooling in the first case study, where comparison data were available from an alternative model. We used the greening scenario “LHV50” (50 % of impervious areas covered by low and high vegetation) developed and simulated by de Munck et al. (2018) and described in Sect. 2.1. In InVEST, we represented this scenario by changing the LULC properties (shade, albedo, and crop coefficient) for urban categories. Specifically, we estimated the proportion of available ground, as defined above, for each category of the LULC map and computed the weighted average of initial parameter values and values for an urban forest. For example, for the “parks or gardens” LULC category, it was estimated that 15 % of the ground was available, so a weighted average of the shade value for the forest (1) and the original park value (0.5) was computed. The resulting parameter values are shown in the Supplement.
3.1 Model performance prior to calibration
3.1.1 Daytime temperatures
For the Paris case study, prior to calibration the InVEST daytime temperatures were moderately correlated with daytime land surface temperature (r2=0.60), with a MAE of 3 °C, but showed no correlation with air temperatures (Table 1). In the Twin Cities, the InVEST results had low correlation with land surface temperature (r2=0.20) but slightly higher correlation for air temperatures (r2=0.29). Of note, comparisons between InVEST and land surface temperature in the Twin Cities revealed a large MAE (11.90 °C), as surface temperatures can be much higher (up to 52 °C) than air temperatures (up to 26 °C) based on the reference temperature data.
Visual observations of the differences between the two maps suggest that the model overestimates the temperatures in forested areas (e.g., to the west and south; see Fig. S1 for the LULC map) and in the dense urban areas in the city of Paris (Fig. 1, center). In the Twin Cities, the model overestimates temperatures in agricultural areas, while underestimating temperatures around wetland areas (see Figs. 2 and S1 for the detailed LULC map). In both case studies, the model exhibited a higher variability than the reference data.
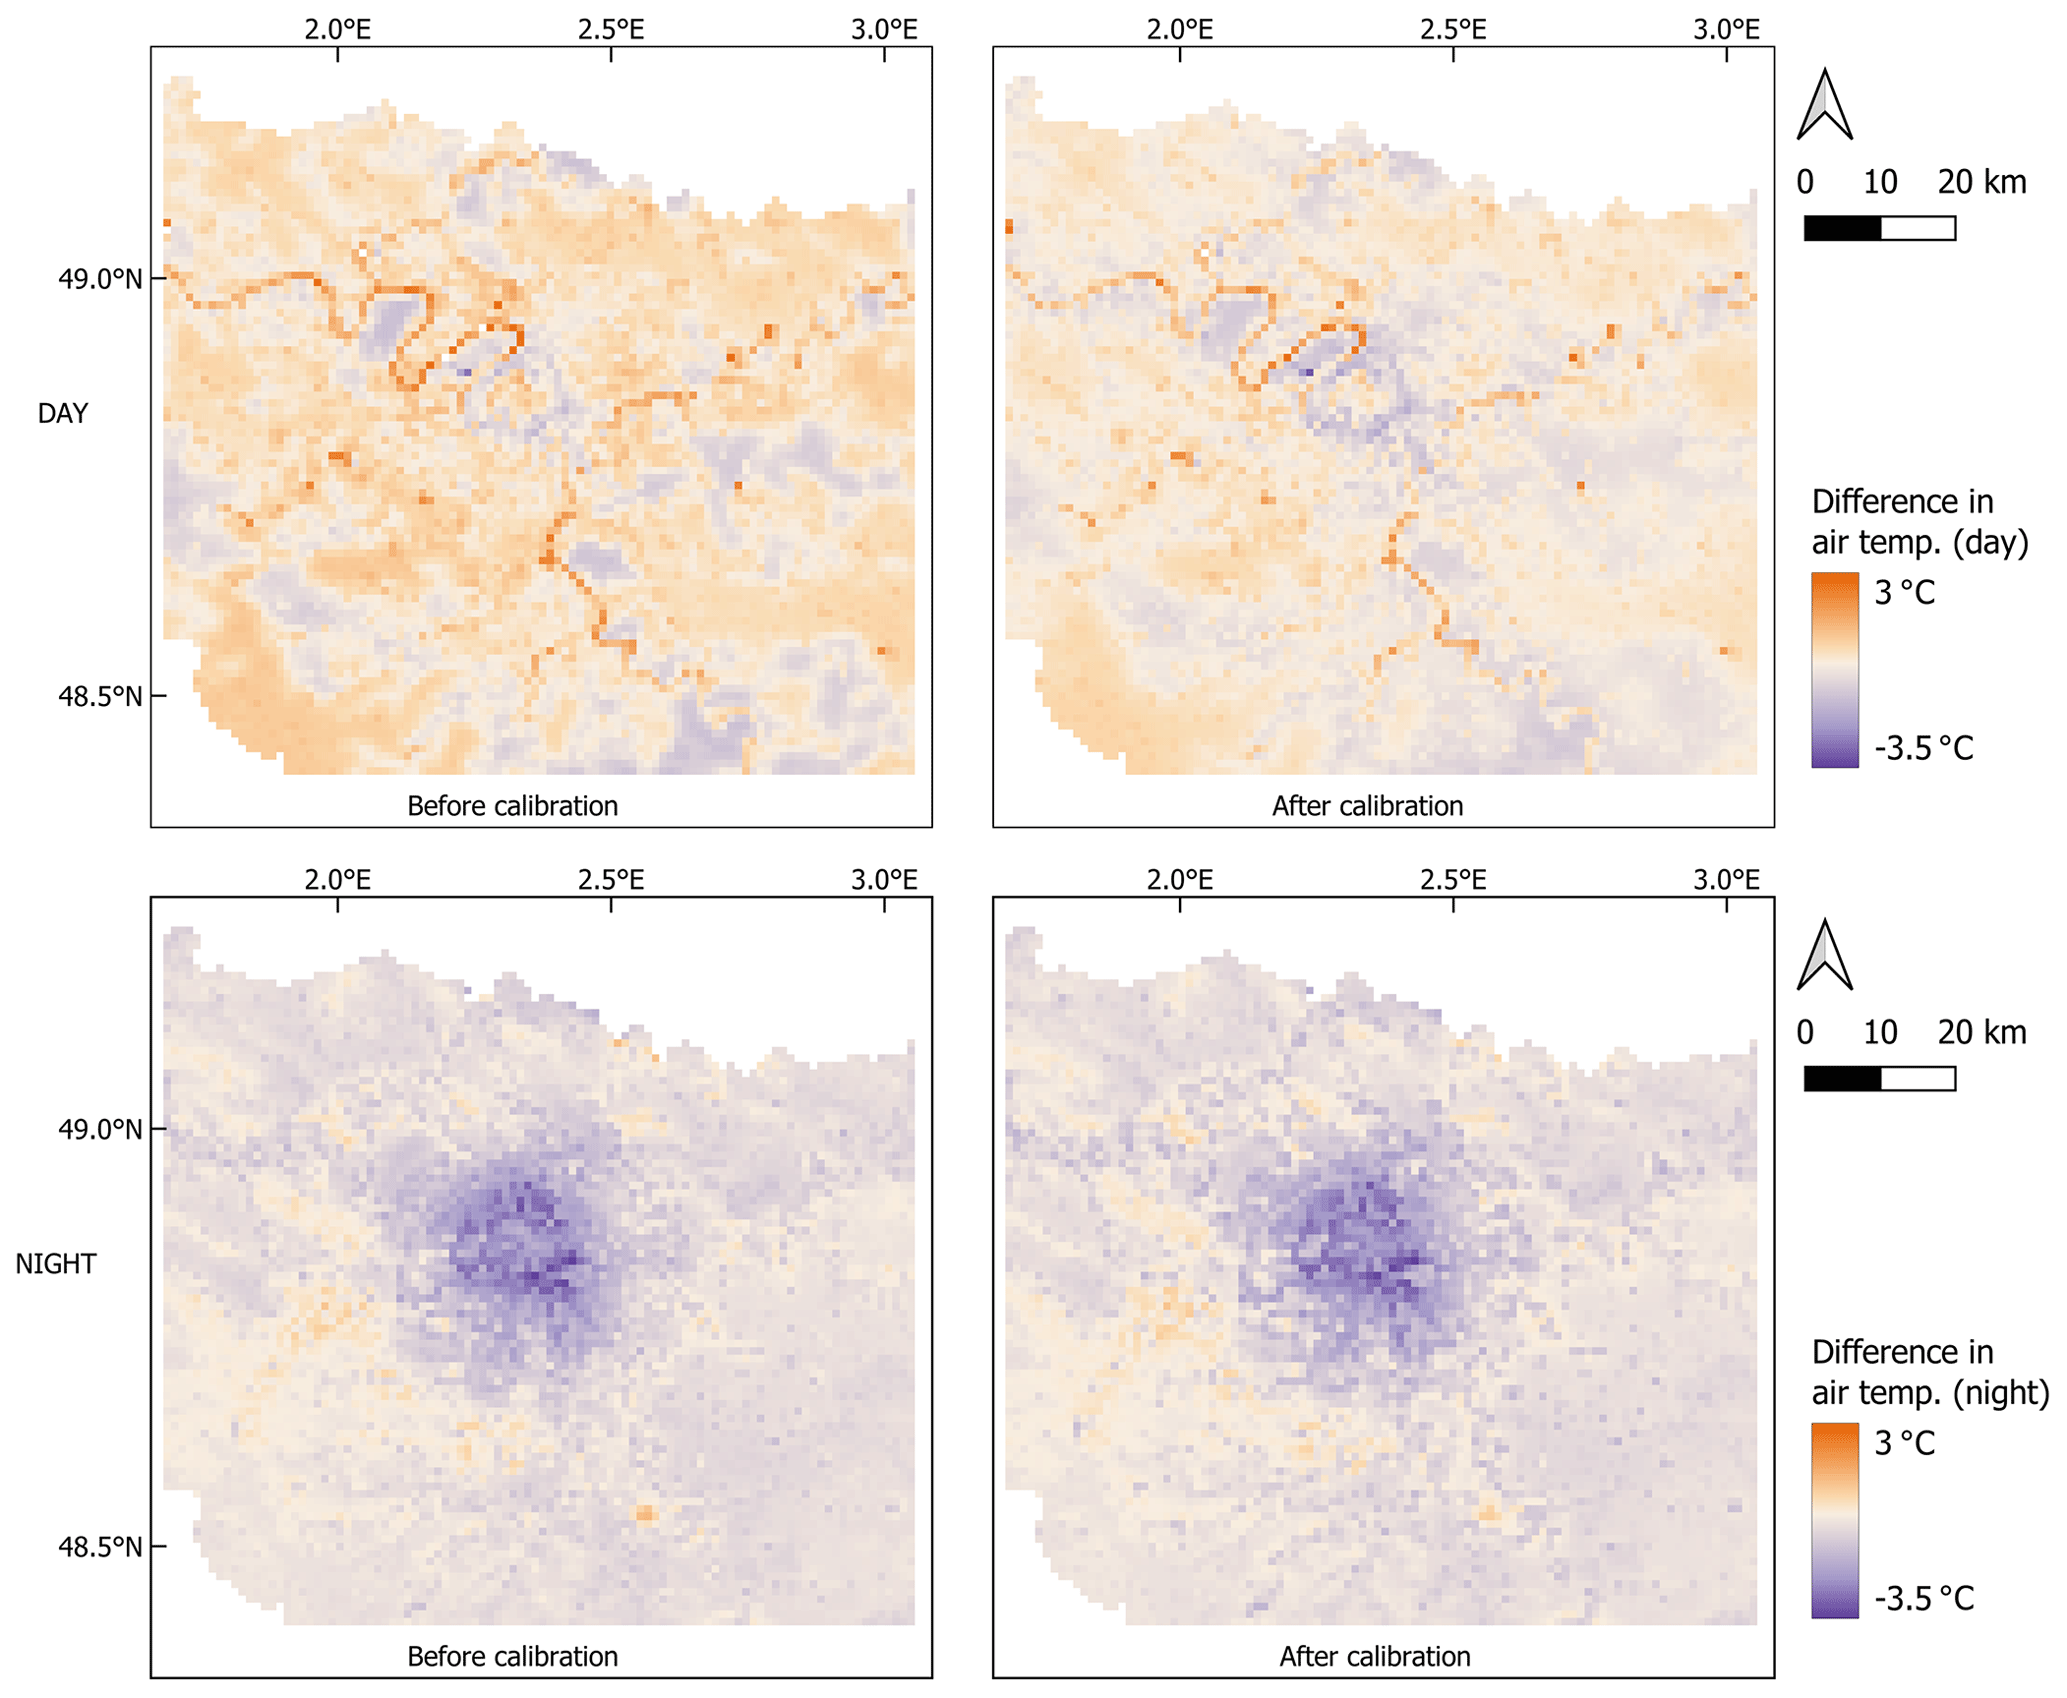
Figure 1Differences between modeled and reference air temperatures (°C) for the Paris region for daytime and nighttime simulations pre- and post-calibration.
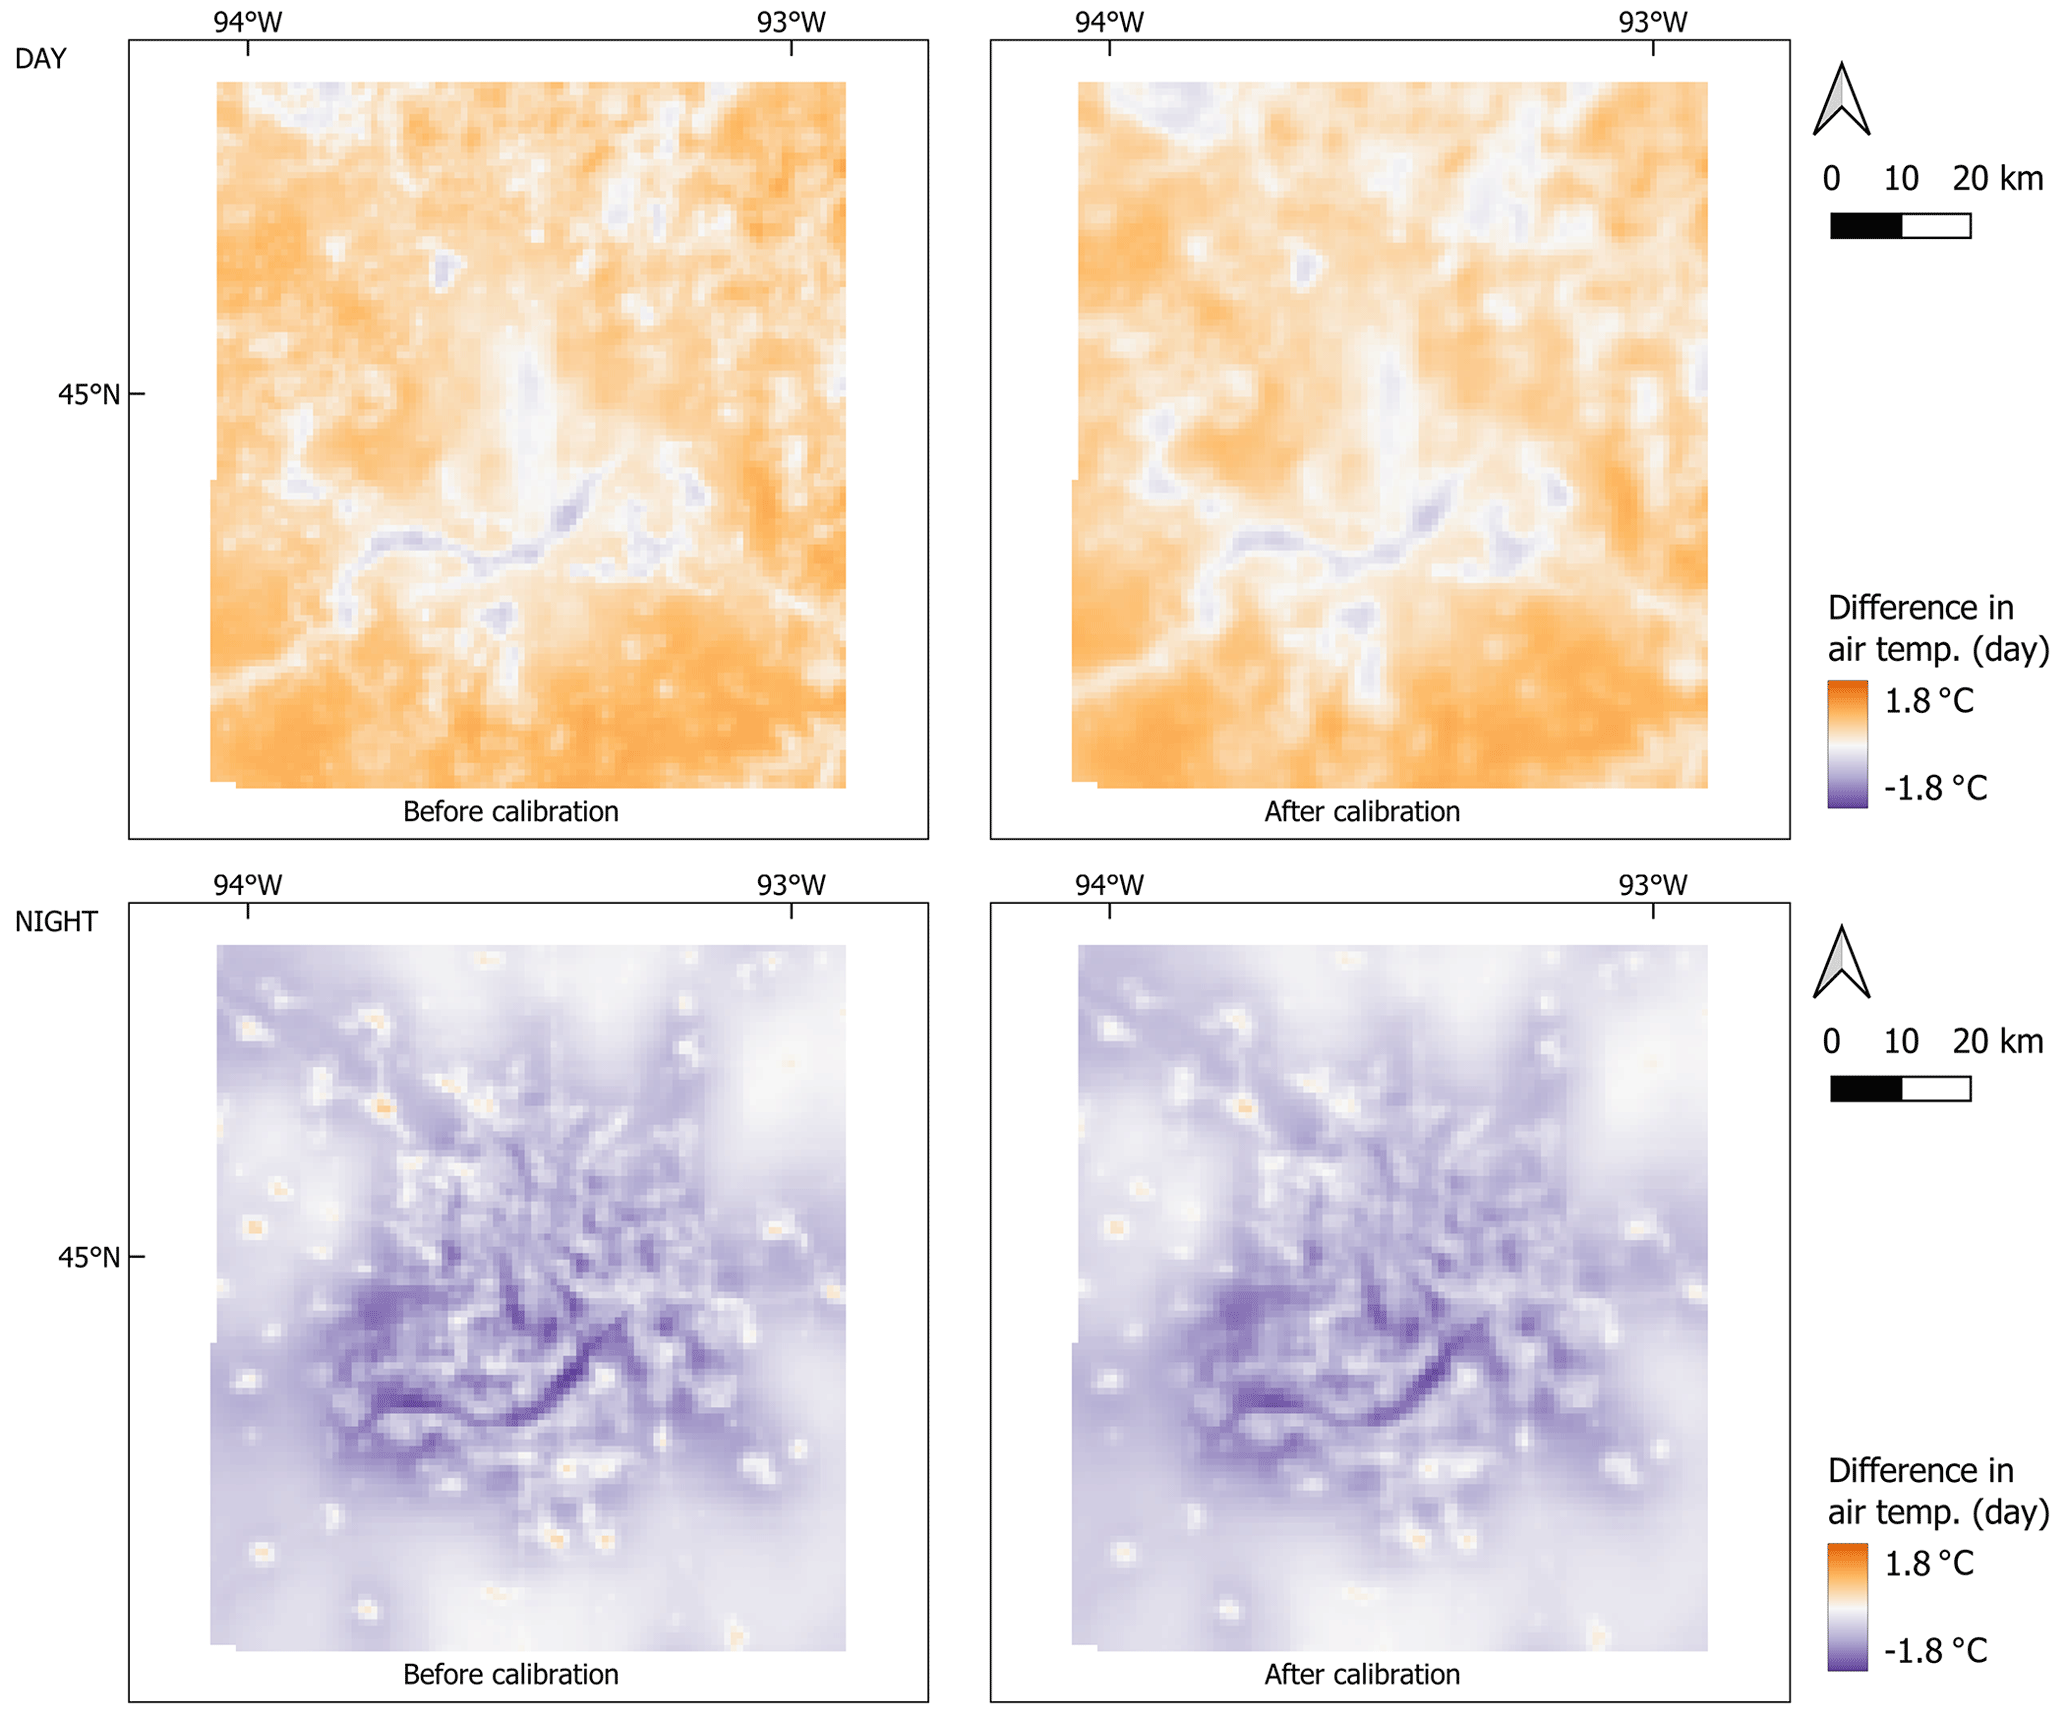
Figure 2Differences between modeled and reference air temperatures (°C) for the Twin Cities region for daytime and nighttime simulations pre- and post-calibration.
3.1.2 Nighttime temperatures
As expected, the InVEST nighttime temperatures were correlated with both air temperature and surface temperature, although more strongly with air temperature in Paris (r2=0.84 for Paris and r2=0.70 for the Twin Cities; Table 1). The MAE is also significantly lower when calculated with respect to air temperatures than to land surface temperatures for both cases (0.5 vs. 3.0 °C for Paris and 0.5 vs. 2.5 °C for the Twin Cities).
Nevertheless, the maps of the differences between InVEST and nighttime air temperature show important spatial heterogeneities. For Paris, this suggests that the model severely underestimates temperatures in the core area (by about 3 °C) and overestimates temperatures in the new urban developments (by about 1 °C; Figs. 1 and S1). In the Twin Cities, InVEST systematically underestimates temperatures in the city center, outlying developed suburbs, and around bodies of water (e.g., in the west and at the confluence of the Minnesota and Mississippi rivers south of the city center), while overestimating temperatures in the surrounding agricultural countryside (Figs. 2 and S2).
3.2 Model performance after calibration
The model performance remained relatively stable after calibration for nighttime air temperatures in both Paris and the Twin Cities, reaching r2 values of 0.84 and 0.73, respectively. Daytime temperatures, however, showed very low correlation with the best estimates in Paris and medium correlation (r2=0.33) in the Twin Cities. The sensitivity analysis conducted for the Paris case study confirmed that most model parameters had only a limited effect on correlations with land surface temperature data, which could explain the limited effect of calibration (Figs. C1 and C2 in Appendix C). Only rmix had a significant effect on r2 (with r2 values ranging from 0.30 to 0.62 for rmix ranging from 100 to 5000 m). Because of the very low r2 values for daytime temperatures in Paris, we considered calibration unsuccessful, and we do not report the calibrated values.
The Twin Cities daytime calibrated values of the parameters are reported in Table 2 (UHImax=11.7 °C). The shade weight remains the highest after calibration, and values only changed by <15 %. Nighttime calibrated parameter values suggest that there is less air mixing, with both rmix and dcool having lower values than during daytime in the Twin Cities (Table 2).
Table 1InVEST model performance for daytime and nighttime air (Tair) and land surface temperatures (LST) before and after calibration. MAE is the mean absolute error. Post-calibration values are shown in parentheses.
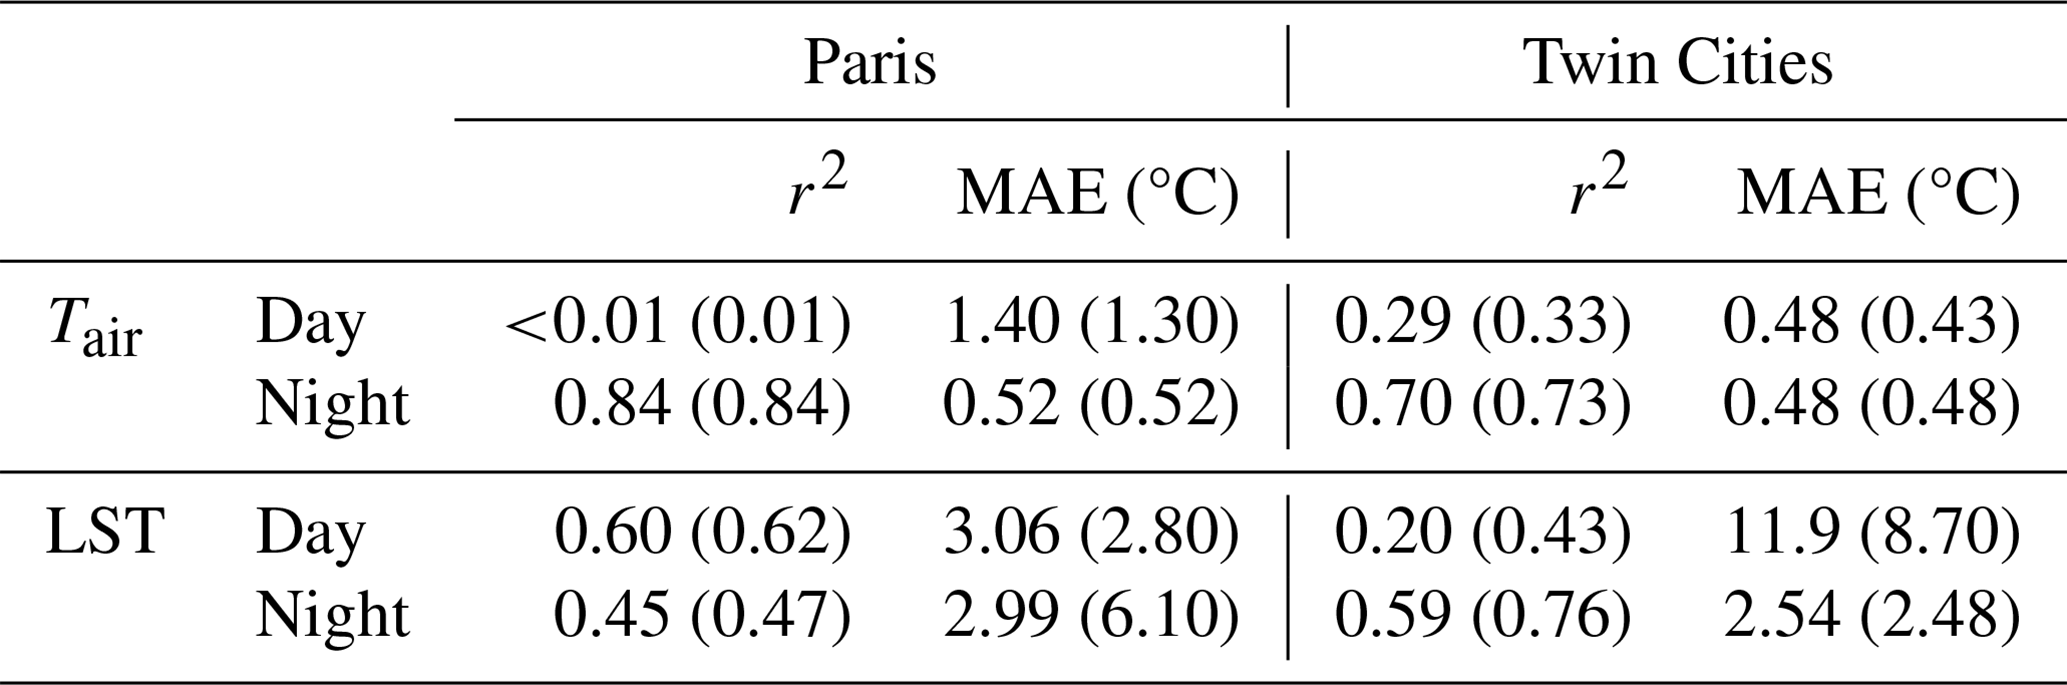
Table 2Calibrated coefficient values for air temperature in the two case studies (n/a – not applicable).
3.3 Effect of the greening scenario
Given the limited effect of calibration on daytime and nighttime air temperature data (see Sect. 3.2), we tested the correlation obtained with temperature estimates from the uncalibrated model. The results were satisfactory, with medium correlation strength between InVEST and the TEB/SURFEX model (r2=0.55 and a mean absolute error of 0.07 °C) for daytime data (Fig. 3). For nighttime data, the correlation between the two models was stronger, with r2=0.85.
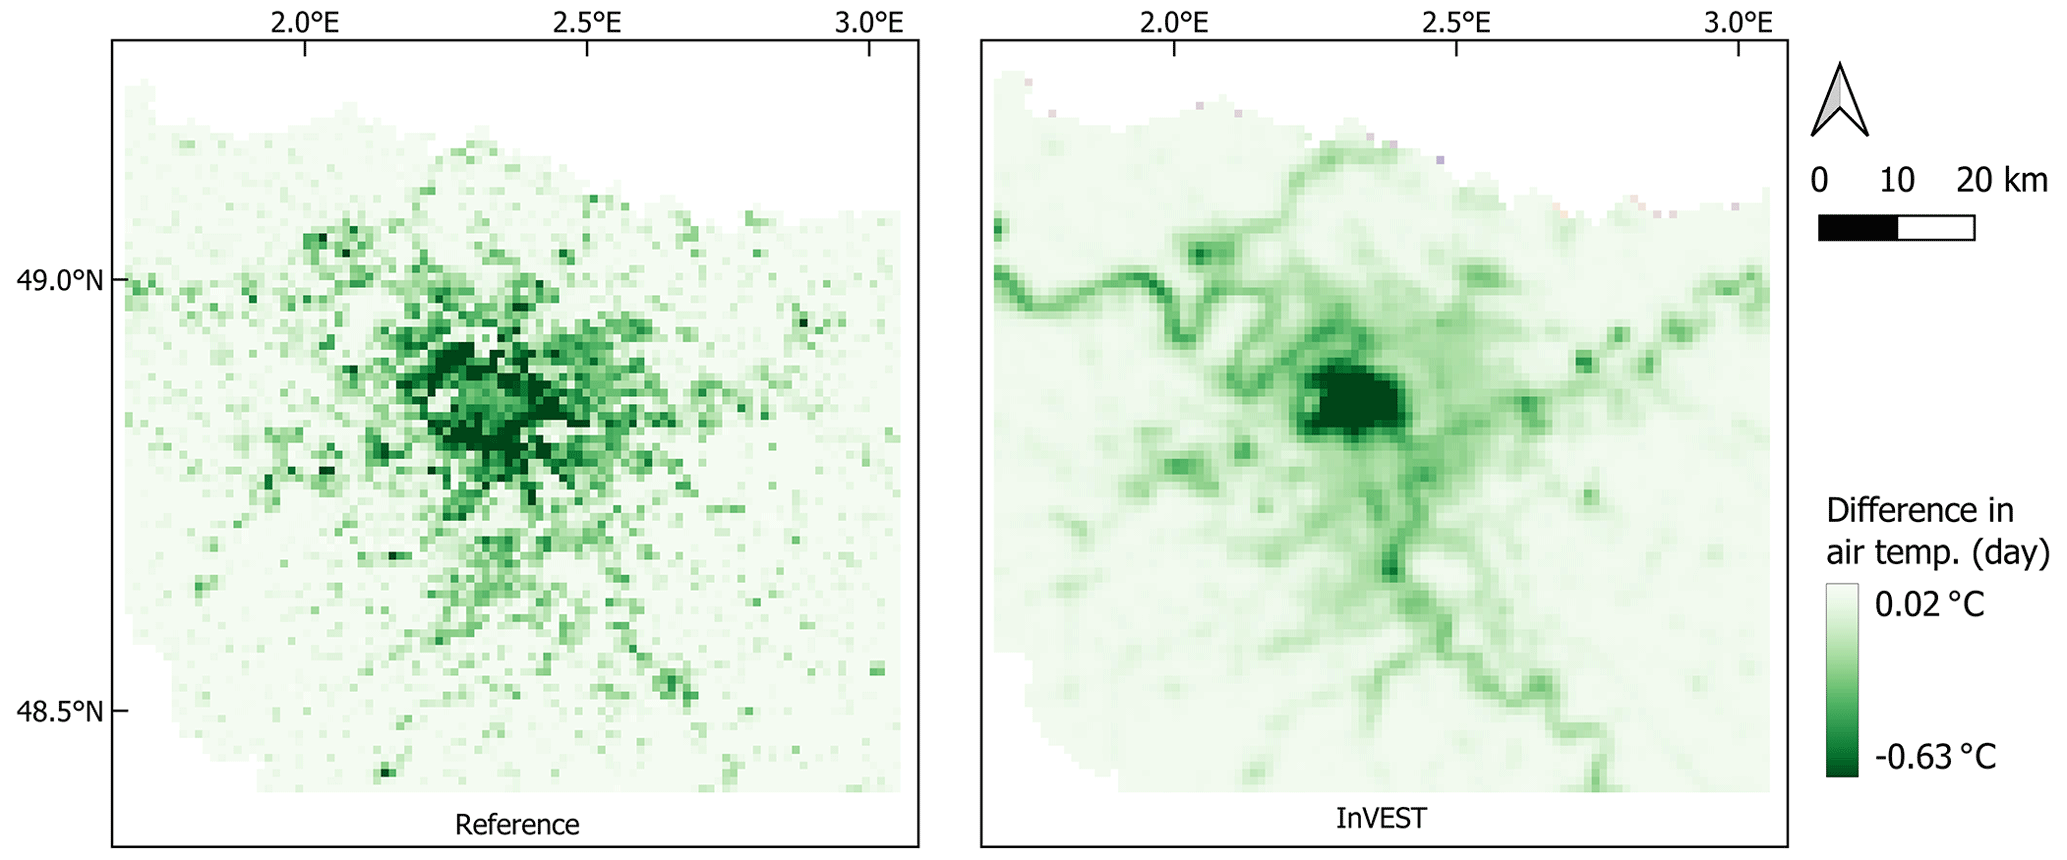
Figure 3Cooling service (°C) during daytime resulting from the greening scenario as simulated by InVEST and by the TEB/SURFEX model (reference data).
4.1 Model calibration and performance
Based on the two case studies, the InVEST model performance was best (r2>0.73) for nighttime air temperature after calibration. The performance improvement due to calibration was modest in most cases (day or night, air or surface temperature), especially for nighttime air temperature in Paris where the performance was already high prior to calibration (r2=0.84). The calibration significantly improved model performance in the Twin Cities only for surface temperature, possibly due to the LULC configuration in this landscape, although our analyses do not allow us to confirm this hypothesis. The modest effect due to calibration can be explained by a relatively low sensitivity to model parameters, which is suggested by the sensitivity analyses presented in Appendix C (Figs. C3 and C4).
For the Twin Cities, nighttime calibrated parameter values (rmix and dcool) are lower than those for daytime, which supports the lower convection and air mixing during the night. Calibrated values of rmix are 771 and 660 m for daytime and nighttime, respectively, which compares well with the estimate of 600 m obtained from previous studies (Schatz and Kucharik, 2014; Lonsdorf et al., 2021). Similar reasoning to verify the physical interpretation of model parameters could be done in a case study for the shade, albedo, and evapotranspiration weights if such data are available; for example, calibrated values could be compared with the relative proportion of shade to evapotranspiration that has been studied in some cities (e.g., in Singapore; Tan et al., 2018). In both case studies, model performance for surface temperatures (r2 ranging from 0.43 to 0.76 post-calibration) compares with the study by Zawadzka et al. (2021), who found that the InVEST model explained between 48 % and 60 % of the variability in land surface temperature for a summer day in three towns in the United Kingdom. We highlight, however, that the model was not initially developed for land surface temperatures. The fair performance for land surface temperatures is an artifact of the model's simplified representation of air temperatures, which imperfectly represents the local energy balance, and of the strong correlation of both air and surface temperatures with LULC.
Regarding scenario assessment, the model in the Paris case study performed reasonably well (r2=0.55 and r2=0.85 for daytime and nighttime air temperatures, respectively). This confirms the potential of the tool to support urban planning studies where different scenarios might need to be compared based on their cooling potential, similar to earlier work with InVEST (Bosch et al., 2022). The effect from the greening scenario, resulting in less than 1 °C cooling, is modest but in line with the literature on such large-scale implementation of green infrastructure, not only from the reference study by de Munck et al. (2018) but also for other temperate climate studies.
4.2 Limitations of the study and future work
In both our case studies, we note that the performance was poor for daytime air temperature, which does not support the use of the model for absolute temperature estimates. This poor performance may be due to oversimplifications of the physical processes involved in urban cooling. In particular, simplification of the flow dynamics means that a model such as InVEST cannot represent urban canyon and wind effects in the city. The effect of parks is also simplified with a threshold of 2 ha for park size. While this has the advantage of reducing the number of model parameters, it also ignores the effect that smaller green spaces might have on their surroundings (Yu et al., 2020; Wong et al., 2021). The poor performance of the model for daytime air temperature may also be attributed to errors in parameterizations, in particular the use of climate data for short periods (e.g., 6–13 August 2003 for Paris) vs. averaged values over several months as was the case for some inputs (e.g., reference evapotranspiration in the Paris case study or Tref and UHImax in the Twin Cities; see Sect. 2.3). Further investigation of these temporal dynamics should be explored in future work, although we highlight that they did not seem to impact the fair performance of the model for nighttime air temperatures or land surface temperatures.
An important limitation of any urban climate study examining fine-resolution spatial variations in temperature is the availability of robust reference data. Because air temperature cannot be readily derived from remote sensing data, models are routinely compared to networks of weather stations (de Munck et al., 2018; Smoliak et al., 2015; Bosch et al., 2021). This means that model performance is only assessed for a limited number of points, which are not typically representative of the diversity of LULC in a region. When data are collected specifically for model validation purposes (e.g., transect data), they are also limited by practical factors such as timing considerations (e.g., a mismatch in time between the beginning and end of the transect) or a lack of reference data (Stewart, 2011; Velasco, 2018).
In our study, we have used alternative models as reference data for air temperatures: either a physics-based model or a statistical interpolation model. Both of these models have limitations and uncertainties in and of themselves, making a fine-scale understanding of the limitations of the InVEST model challenging. In other words, the differences in models observed in Figs. 1 and 2 might also be due to errors in the reference data, and future studies could examine the effect of uncertainty in reference datasets on calibration and model performance. For example, the effect of shade during daytime is poorly represented in the TEB/SURFEX model used in Paris (de Munck et al., 2018). Land surface temperature datasets, on the other hand, are less prone to such limitations and are more robust when it comes to spatial distributions. Absolute values are nonetheless challenging to ascertain due to temperature calculations requiring correction algorithms.
Finally, an important study limitation that could be explored in future work is the spatial resolution and scale of case studies. In both cases, the InVEST model was evaluated at a 1 km horizontal resolution over an area of about 100 km by 100 km. Because the model produces outputs at the same resolution as LULC inputs, it would be interesting to evaluate its performance at a different scale and resolution where such data are available. Relatedly, the use of local climate zones, which is common in urban climate studies (Aslam and Rana, 2022), could be examined as an alternative parameterization of the InVEST model. This work would also examine the influence of reference temperature (Tref) and maximum intensity (UHImax) as well as the biophysical parameter values (in particular crop coefficients – notably difficult to ascertain for urban land uses), which have not been explored in the present study.
Overall, this discussion of data quality and calibrated parameter values highlights an important contribution of this study to the customized calibration tool available on GitHub (https://github.com/martibosch/invest-ucm-calibration, last access: 20 March 2024) and on Zenodo; please refer to the “Code and data availability” section. Such a tool can be applied to any other city where the InVEST urban cooling model is applied with the only data requirement beyond the InVEST model input data being a reference temperature dataset (either point data or raster data). The calibration tool allows for systematic calibration and model testing, which paves the way for a better understanding of model limitations and strengths. Although in our case studies the performance improvement from calibration was modest, future work could assess the performance of the model over multiple cities with comparable datasets, examine the potential of local climate zones for improved parameterization, or explore finer temporal resolution by linking the night and day model outputs.
In this study, we have developed a custom calibration tool to assess the performance of the InVEST urban cooling model in two case studies: in Paris, France, and in the Twin Cities, MN, USA. Our analyses expand on past model testing studies by providing a much more extensive validation dataset of air temperatures (continuous data based on a reference urban climate model in Paris and on data interpolated from a dense weather station network in the Twin Cities). The model showed good performance, assessed through mean absolute error (0.52 °C) and r2 (0.84) for nighttime air temperatures. Calibration only slightly improved model performance in the Twin Cities. For the case study of Paris, the use of the tool for scenario assessment was supported by moderate (daytime) and high (nighttime) correlation with change predicted by an alternative physics-based model (r2=0.55 and r2=0.85 for daytime and nighttime air temperatures, respectively). With respect to the study objectives, we conclude that the open-source model can be used to support decisions related to land use and land cover change in cities, with greater reliability of nighttime UHI applications and of relative change (i.e., comparing scenarios to one another as opposed to the using absolute values of model predictions). As these results were obtained for the case studies in Paris and in the Twin Cities, the InVEST model and calibration tools should be tested at other locations to assess model performance for urban planning applications. For research applications, future studies at other locations will help us further understand the effect of data resolution and data quality on model performance.
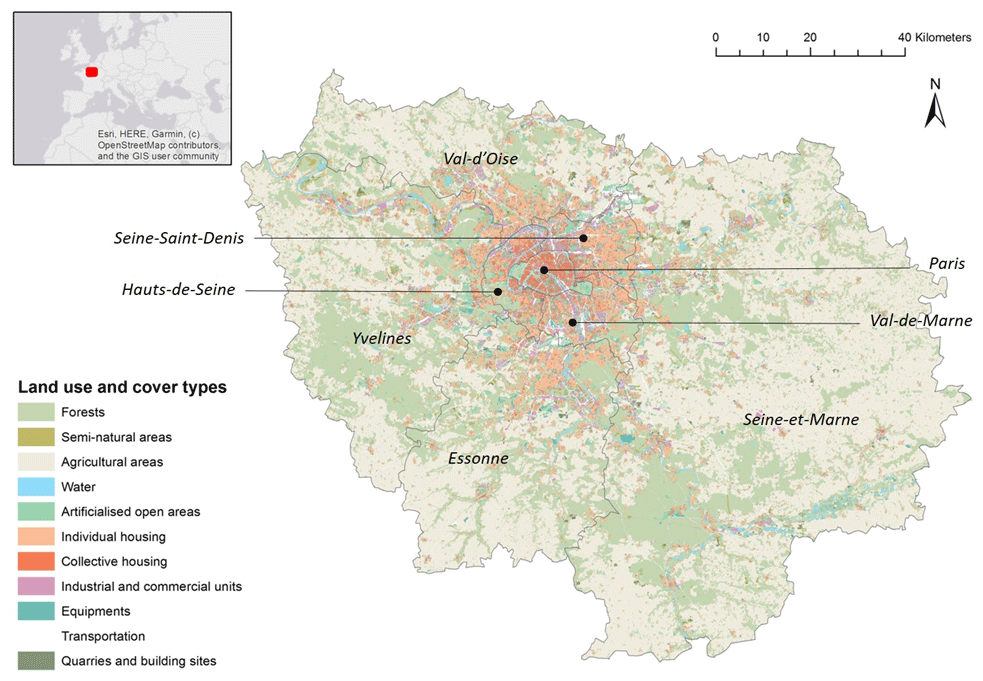
Figure A1Land use and cover in the Île-de-France region, France, in 2017 (based on data developed by the Institut Paris Region).
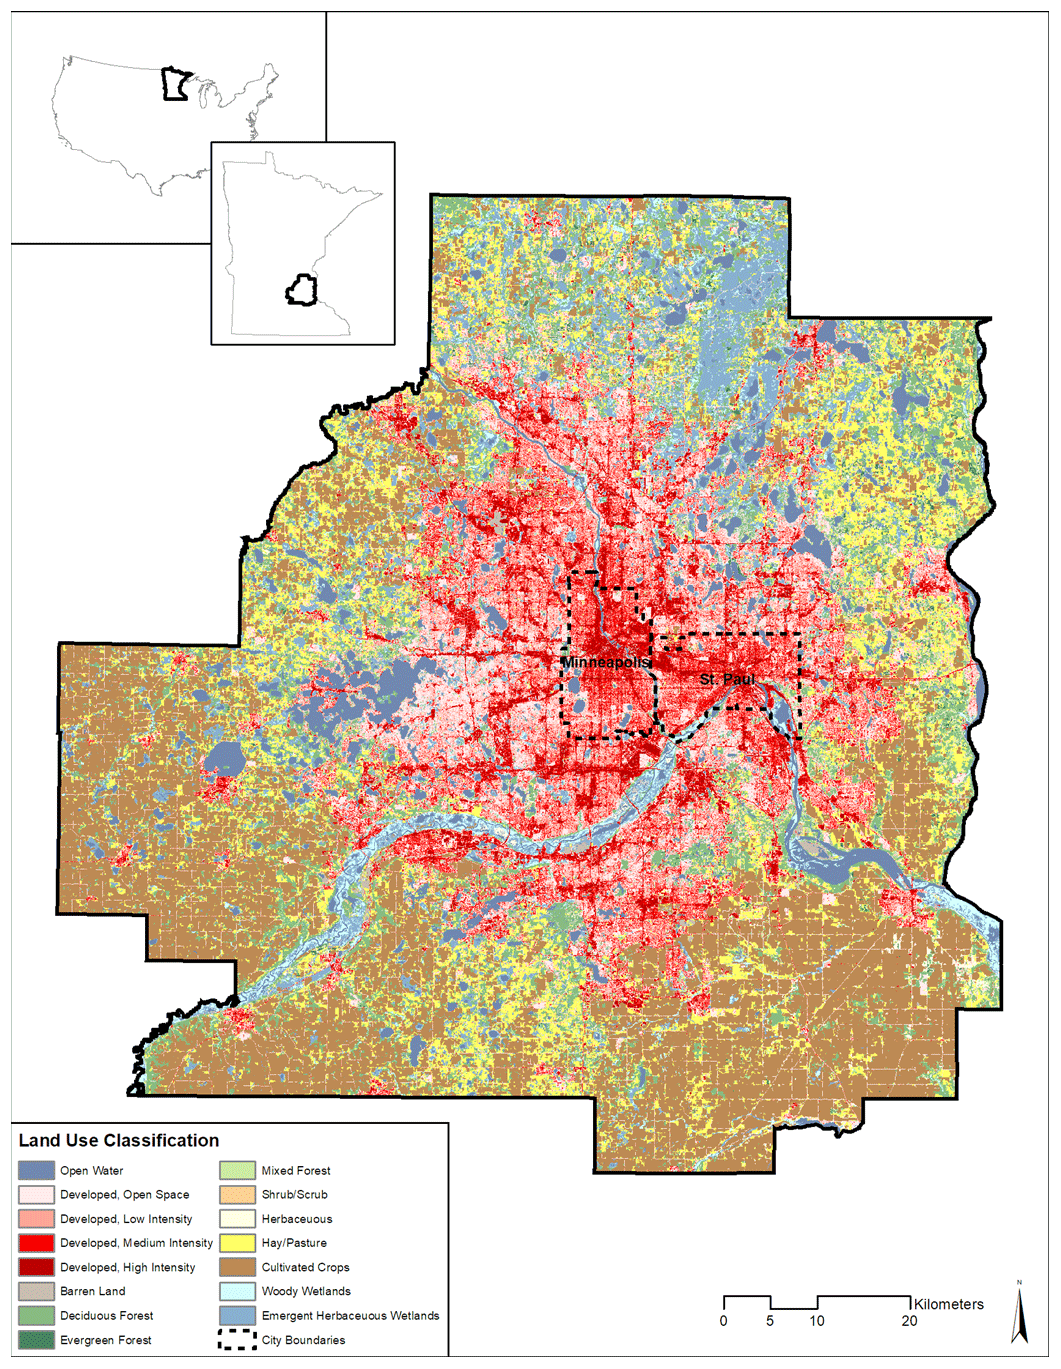
Figure A2Locations and land cover in the Twin Cities metropolitan area in Minnesota, USA, with the cities of Minneapolis and St. Paul outlined.
InVEST biophysical tables can be found in the Supplement.
B1 Paris case study
Albedo values for the Paris biophysical table were derived from the following three sources.
-
APUR (2020).
-
Lavigne et al. (1994).
-
Stewart and Oke (2012).
Specifically, most albedo values were taken from Stewart and Oke (2012). Exceptions were parks, cemeteries, all industrial land use, and all facilities except hippodromes and race tracks (derived from Lavigne et al., 1994), while outdoor courts, transportation land use, quarries, dumpsites, construction sites, hippodromes, and car tracks were derived from APUR (2020).
Crop evapotranspiration values were derived from the FAO Irrigation paper 56 (Allen et al., 1998) as is described in previous work (Tardieu et al., 2020).
-
Allen et al. (1998).
-
Tardieu et al. (2021).
Shade values were assumed to be 1 for forested or tree-planted land use, 0.5 for mixed land use with trees, 0.25 for commercial land use with planted trees, and 0 for all remaining land use.
B2 Twin Cities case study
Details of the Twin Cities biophysical tables are provided in the supplement of this source: Hamel et al. (2021).
For the Paris case study, we performed a local sensitivity analysis for the following five parameters (ranges for each parameter are in parentheses).
-
Air mixing distance, rmix (50 to 5000 m).
-
Green area maximum cooling distance, dcool (50 to 1000 m).
-
Cooling capacity factors: WS, WA, and WE (0 to 1).
We assessed results based on the correlation between daytime and nighttime temperatures and land surface temperatures. We found that the model was highly sensitive to rmix (Fig. S1), with a local maximum of 500 m for daytime temperatures and 1000 m for nighttime temperatures (Fig. S3). The model was less sensitive to the values of maximum cooling distance and the cooling capacity factors; r2 varied between 0.61 and 0.63 for dcool and 0.59 and 0.64 for the weight factors.
These results held for nighttime temperature, where InVEST was also most sensitive to the air mixing parameter, rmix (Fig. S4). Sensitivity to the building density parameter, B, and the maximum cooling distance, dcool, was much lower.
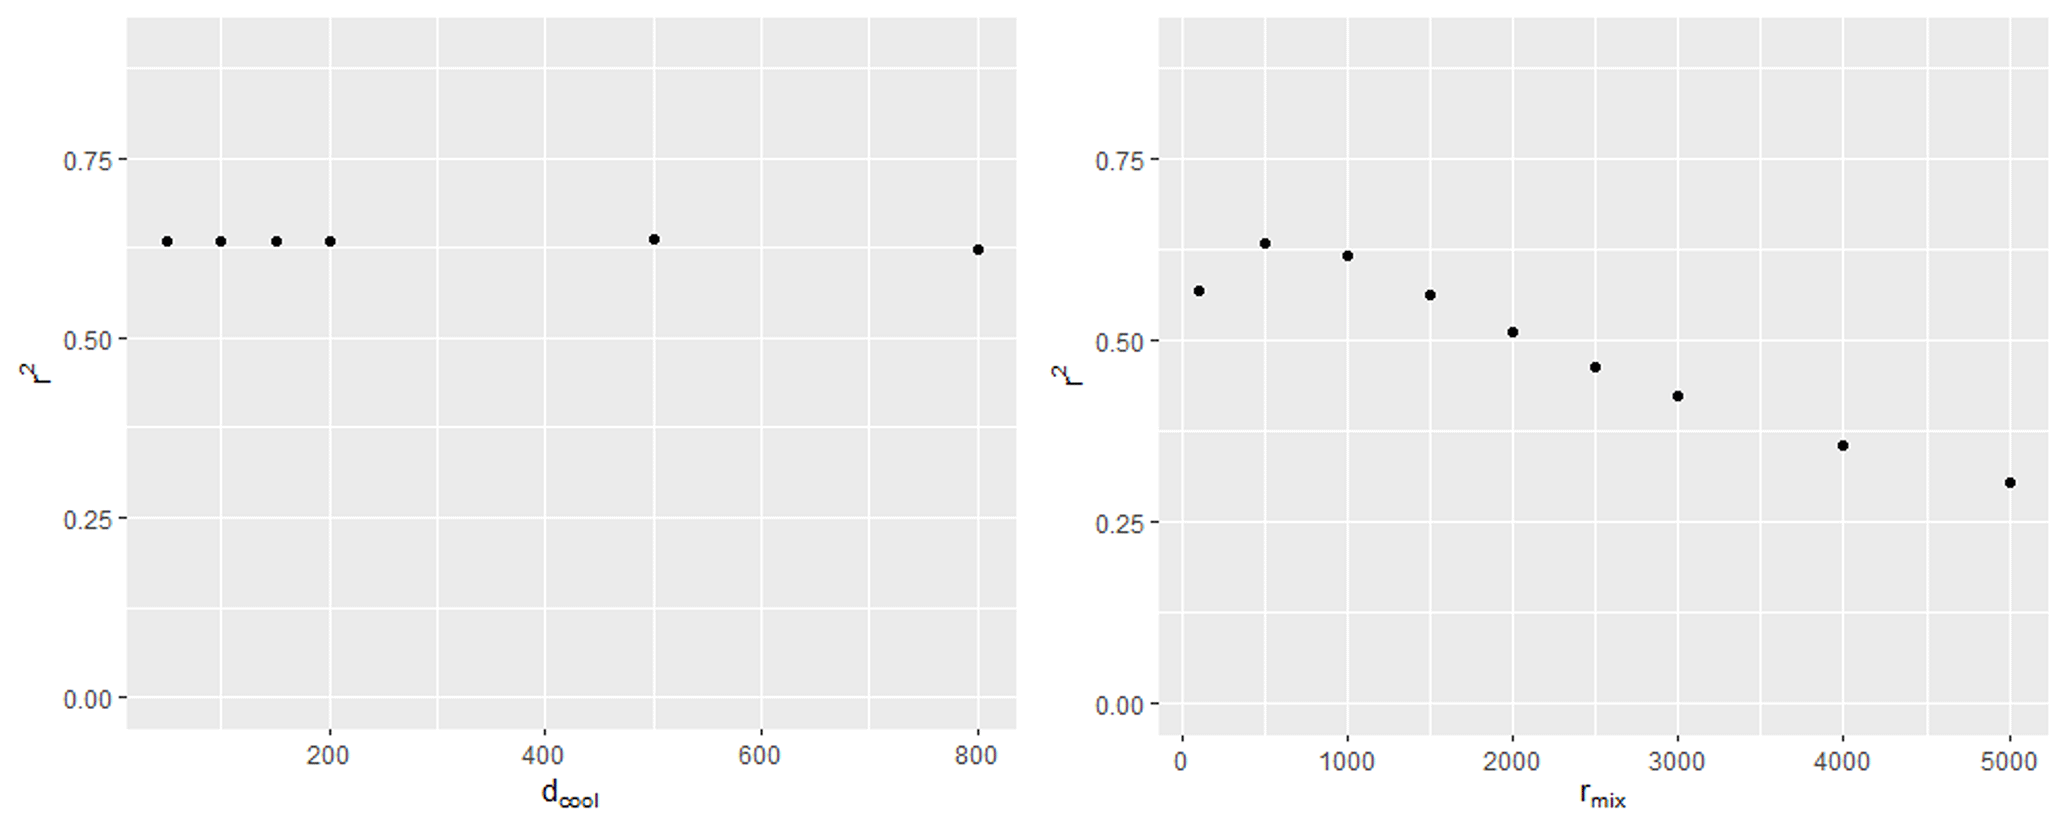
Figure C1Sensitivity of the InVEST model to the rmix and dcool parameters and WE and WS factors. Results are plotted against the correlation coefficient (r2) with daytime land surface temperature (MODIS).
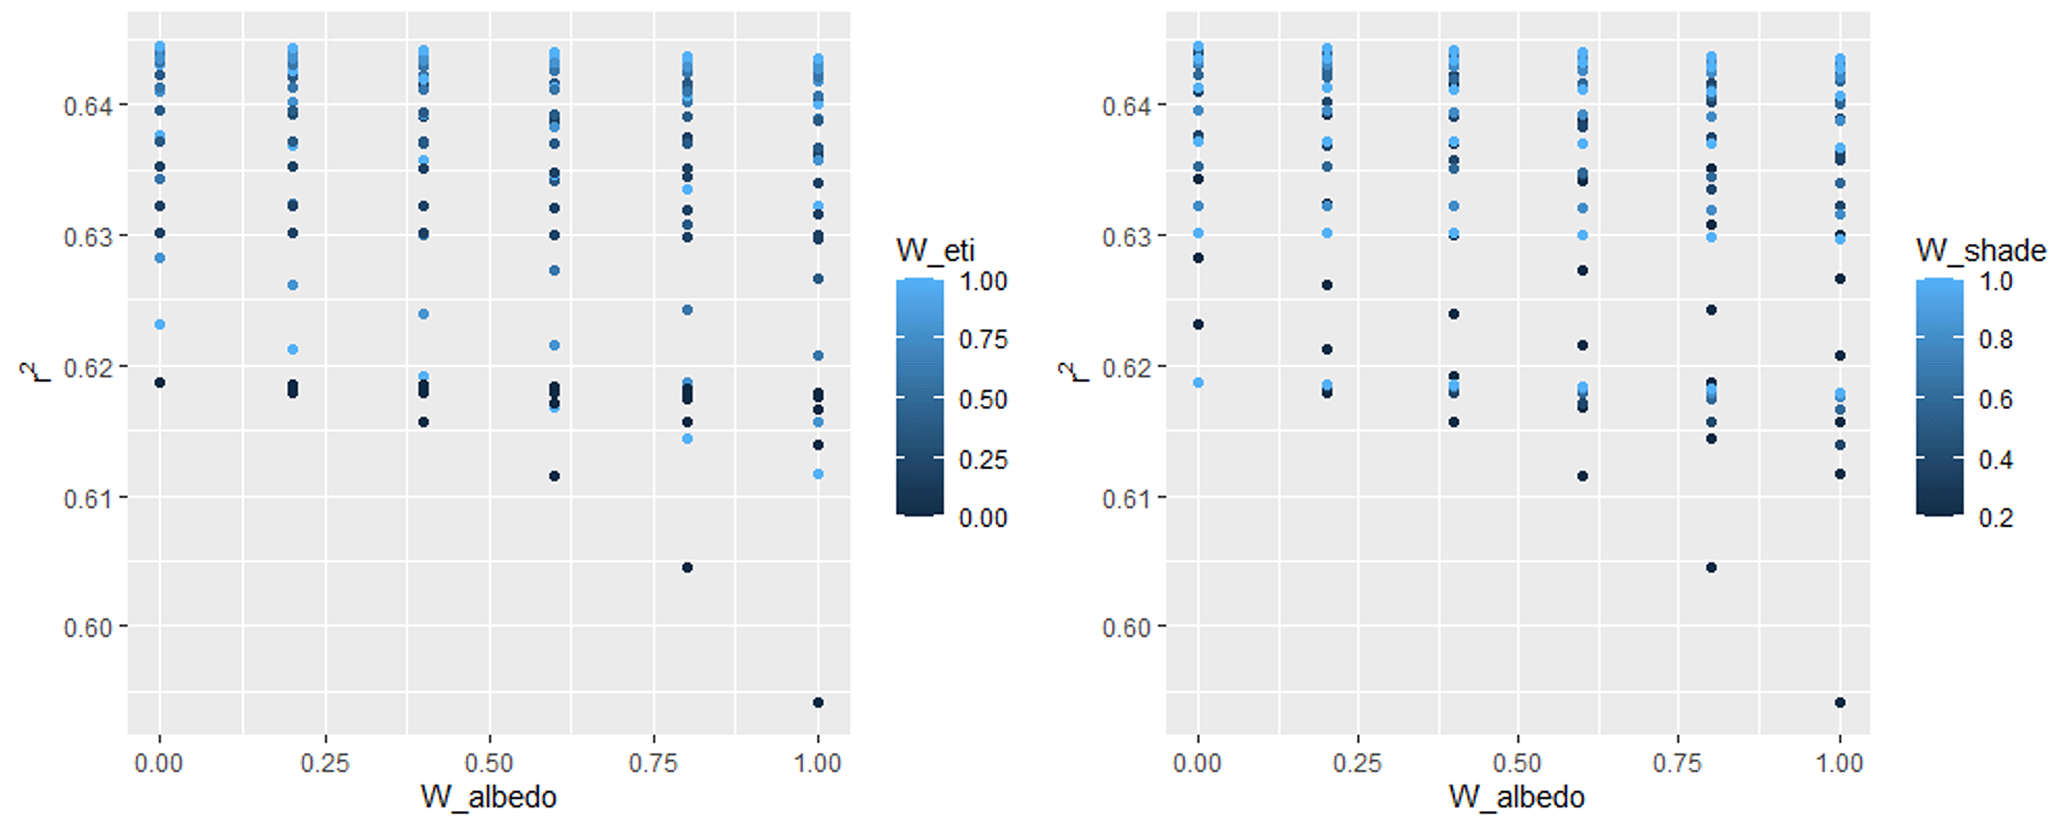
Figure C2Sensitivity of the InVEST model to the daytime weight factors, WE (W_eti), WA (W_albedo), and WS (W_shade). Results are plotted against the correlation coefficient (r2) with daytime land surface temperature (MODIS).
The code used in this article is available at https://doi.org/10.5281/zenodo.8081822 (github-actions[bot], 2023). The source files for the biophysical tables to run the InVEST models can be found in the Supplement.
Other input data such as the LULC map for the Paris case study are not publicly available.
The supplement related to this article is available online at: https://doi.org/10.5194/gmd-17-4755-2024-supplement.
PH designed the study and conducted the analysis with MB and CN, with technical input from LT, AL, CdM, and VV. JAD and RPS led the software development for the InVEST urban cooling model, and MB developed the code for the calibration algorithm. PH wrote the first draft of the paper with input from LT and CN. All authors provided comments and contributed to the final version of the paper.
The contact author has declared that none of the authors has any competing interests.
Publisher’s note: Copernicus Publications remains neutral with regard to jurisdictional claims made in the text, published maps, institutional affiliations, or any other geographical representation in this paper. While Copernicus Publications makes every effort to include appropriate place names, the final responsibility lies with the authors.
This study is part of the IDEFESE project (https://idefese.wordpress.com/, last access: 20 March 2024) funded by ADEME, the French Ministry for an Ecological Transition (CGDD and PUCA), and AgroParisTech. We wish to thank the Institut Paris Region for providing important data necessary for the success of the study.
This research has been supported by the National Research Foundation, Prime Minister’s Office, Singapore (grant no. NRF-NRFF12-2020-0009), and by ADEME, the French Ministry for an Ecological Transition (CGDD and PUCA), and AgroParisTech.
This paper was edited by Jinkyu Hong and reviewed by Harald Zepp and one anonymous referee.
Allen, R. G., Pereira, L. S., Raes, D., and Smith, M.: FAO Irrigation and Drainage Paper No. 56. Irrigation and Drainage, 56, No. 97, Food and Agriculture Organization of the United Nations, Rome, ISBN 978-9251042199, 1998.
APUR: Atténuer les îlots de chaleur urbains – Cahier n° 5: méthodes et outils de conception des projets, https://www.apur.org/fr/nos-travaux/attenuer-ilots-chaleur-urbains-cahier-5-methodes-outils-conception-projets (last access: 30 April 2023), 2020.
Aslam, A. and Rana, I. A.: The use of local climate zones in the urban environment: A systematic review of data sources, methods, and themes, Urban Clim., 42, 101120, https://doi.org/10.1016/J.UCLIM.2022.101120, 2022.
Bartesaghi Koc, C., Osmond, P., and Peters, A.: Evaluating the cooling effects of green infrastructure: A systematic review of methods, indicators and data sources, Sol. Energy, 166, 486–508, https://doi.org/10.1016/J.SOLENER.2018.03.008, 2018.
Bolund, P. and Hunhammar, S.: Ecosystem services in urban areas, Ecol. Econ., 29, 293–301, https://doi.org/10.1016/S0921-8009(99)00013-0, 1999.
Bosch, M., Locatelli, M., Hamel, P., Remme, R. P., Chenal, J., and Joost, S.: A spatially explicit approach to simulate urban heat mitigation with InVEST (v3.8.0), Geosci. Model Dev., 14, 3521–3537, https://doi.org/10.5194/gmd-14-3521-2021, 2021.
Bosch, M., Locatelli, M., Hamel, P., Remme, R. P., Jaligot, R., Chenal, J., and Joost, S.: Evaluating urban greening scenarios for urban heat mitigation: a spatially explicit approach, R. Soc. Open Sci., 8, 202174, https://doi.org/10.1098/rsos.202174, 2022.
Bowler, D. E., Buyung-Ali, L. M., Knight, T. M., and Pullin, A. S.: A systematic review of evidence for the added benefits to health of exposure to natural environments, BMC Public Health, 10, 456, https://doi.org/10.1186/1471-2458-10-456, 2010.
Cao, X., Onishi, A., Chen, J., and Imura, H.: Quantifying the cool island intensity of urban parks using ASTER and IKONOS data, Landsc. Urban Plan., 96, 224–231, https://doi.org/10.1016/J.LANDURBPLAN.2010.03.008, 2010.
Chakraborty, T. and Lee, X.: A simplified urban-extent algorithm to characterize surface urban heat islands on a global scale and examine vegetation control on their spatiotemporal variability, Int. J. Appl. Earth Obs., 74, 269–280, https://doi.org/10.1016/J.JAG.2018.09.015, 2019.
Cheung, P. K., Livesley, S. J., and Nice, K. A.: Estimating the cooling potential of irrigating green spaces in 100 global cities with arid, temperate or continental climates, Sustain. Cities Soc., 71, 102974, https://doi.org/10.1016/J.SCS.2021.102974, 2021.
Corburn, J.: Cities, Climate Change and Urban Heat Island Mitigation: Localising Global Environmental Science, Urban Stud., 46, 413–427, https://doi.org/10.1177/0042098008099361, 2009.
Cortinovis, C. and Geneletti, D.: A framework to explore the effects of urban planning decisions on regulating ecosystem services in cities, Ecosyst. Serv., 38, 100946, https://doi.org/10.1016/J.ECOSER.2019.100946, 2019.
Cortinovis, C., Olsson, P., Boke-Olén, N., and Hedlund, K.: Scaling up nature-based solutions for climate-change adaptation: Potential and benefits in three European cities, Urban For Urban Green, 67, 127450, https://doi.org/10.1016/J.UFUG.2021.127450, 2022.
de Munck, C., Lemonsu, A., Masson, V., Le Bras, J., and Bonhomme, M.: Evaluating the impacts of greening scenarios on thermal comfort and energy and water consumptions for adapting Paris city to climate change, Urban Clim., 23, 260–286, https://doi.org/10.1016/J.UCLIM.2017.01.003, 2018.
Derkzen, M. L., van Teeffelen, A. J. A., and Verburg, P. H.: Review: Quantifying urban ecosystem services based on high-resolution data of urban green space: an assessment for Rotterdam, the Netherlands, J. Appl. Ecol., 52, 1020–1032, https://doi.org/10.1111/1365-2664.12469, 2015.
Eliasson, I.: Urban nocturnal temperatures, street geometry and land use, Atmos. Environ., 30, 379–392, https://doi.org/10.1016/1352-2310(95)00033-X, 1996.
Eumorfopoulou, E. A. and Kontoleon, K. J.: Experimental approach to the contribution of plant-covered walls to the thermal behaviour of building envelopes, Build. Environ., 44, 1024–1038, https://doi.org/10.1016/J.BUILDENV.2008.07.004, 2009.
Farrugia, S., Hudson, M. D., and McCulloch, L.: An evaluation of flood control and urban cooling ecosystem services delivered by urban green infrastructure, International Journal of Biodiversity Science, Ecosystem Services & Management, 9, 136–145, https://doi.org/10.1080/21513732.2013.782342, 2013.
github-actions[bot]: martibosch/invest-ucm-calibration: Release v0.6.0 (v0.6.0), Zenodo [code and data set], https://doi.org/10.5281/zenodo.8081822, 2023.
Gosling, S. N., Lowe, J. A., McGregor, G. R., Pelling, M., and Malamud, B. D.: Associations between elevated atmospheric temperature and human mortality: A critical review of the literature, Climatic Change, 92, 299–341, https://doi.org/10.1007/S10584-008-9441-X, 2009.
Hamel, P., Guerry, A. D., Polasky, S., Han, B., Douglass, J. A., Hamann, M., Janke, B., Kuiper, J. J., Levrel, H., Liu, H., Lonsdorf, E., McDonald, R. I., Nootenboom, C., Ouyang, Z., Remme, R. P., Sharp, R. P., Tardieu, L., Viguié, V., Xu, D., Zheng, H., and Daily, G. C.: Mapping the benefits of nature in cities with the InVEST software, npj Urban Sustainability, 1, 25, https://doi.org/10.1038/s42949-021-00027-9, 2021.
Hémon, D. and Jougla, E.: Surmortalité liée à la canicule d'août 2003, Rapport remis au Ministre de la Santé et de la protection sociale, https://www.inserm.fr/wp-content/uploads/2017-11/inserm-rapportthematique-surmortalitecaniculeaout2003-rapportfinal.pdf (last access: 20 March 2024), 2004.
Homer, C., Dewitz, J., Jin, S., Xian, G., Costello, C., Danielson, P., Gass, L., Funk, M., Wickham, J., Stehman, S., Auch, R., and Riitters, K.: Conterminous United States land cover change patterns 2001–2016 from the 2016 National Land Cover Database, ISPRS J. Photogramm., 162, 184–199, https://doi.org/10.1016/j.isprsjprs.2020.02.019, 2020.
Jauregui, E.: Influence of a large urban park on temperature and convective precipitation in a tropical city, Energy Build., 15, 457–463, https://doi.org/10.1016/0378-7788(90)90021-A, 1990.
Kadaverugu, R., Gurav, C., Rai, A., Sharma, A., Matli, C., and Biniwale, R.: Quantification of heat mitigation by urban green spaces using InVEST model – a scenario analysis of Nagpur City, India, Arab. J. Geosci., 14, 82, https://doi.org/10.1007/S12517-020-06380-W, 2021.
Kroeger, T., McDonald, R. I., Boucher, T., Zhang, P., and Wang, L.: Where the people are: Current trends and future potential targeted investments in urban trees for PM10 and temperature mitigation in 27 U.S. Cities, Landsc. Urban Plan., 177, 227–240, https://doi.org/10.1016/j.landurbplan.2018.05.014, 2018.
Kunapo, J., Fletcher, T. D., Ladson, A. R., Cunningham, L., and Burns, M. J.: A spatially explicit framework for climate adaptation, 15, 159–166, https://doi.org/10.1080/1573062X.2018.1424216, 2018.
Lai, L. W. and Cheng, W. L.: Air quality influenced by urban heat island coupled with synoptic weather patterns, Sci. Total Environ., 407, 2724–2733, https://doi.org/10.1016/j.scitotenv.2008.12.002, 2009.
Larondelle, N. and Haase, D.: Urban ecosystem services assessment along a rural–urban gradient: A cross-analysis of European cities, Ecol. Indic., 29, 179–190, https://doi.org/10.1016/J.ECOLIND.2012.12.022, 2013.
Lavigne, P., Brejon, P., and Fernandez, P.: Architecture Climatique: Une Contribution Au Développement Durable, Edisud, ISBN 978-2857447504, 1994.
Lehmann, S.: Low carbon districts: Mitigating the urban heat island with green roof infrastructure, City, Culture and Society, 5, 1–18, https://doi.org/10.1016/j.ccs.2014.02.002, 2014.
Lemonsu, A., Masson, V., Shashua-Bar, L., Erell, E., and Pearlmutter, D.: Inclusion of vegetation in the Town Energy Balance model for modelling urban green areas, Geosci. Model Dev., 5, 1377–1393, https://doi.org/10.5194/gmd-5-1377-2012, 2012.
Le Roy, B., Lemonsu, A., Kounkou-Arnaud, R., Brion, D., and Masson, V.: Long time series spatialized data for urban climatological studies: A case study of Paris, France, Int. J. Climatol., 40, 3567–3584, https://doi.org/10.1002/JOC.6414, 2020.
Li, X., Zhou, Y., Asrar, G. R., Imhoff, M., and Li, X.: The surface urban heat island response to urban expansion: A panel analysis for the conterminous United States, Sci. Total Environ., 605–606, 426–435, https://doi.org/10.1016/J.SCITOTENV.2017.06.229, 2017.
Lonsdorf, E. V., Nootenboom, C., Janke, B., and Horgan, B. P.: Assessing urban ecosystem services provided by green infrastructure: Golf courses in the Minneapolis-St. Paul metro area, Landsc. Urban Plan., 208, 104022, https://doi.org/10.1016/J.LANDURBPLAN.2020.104022, 2021.
Manoli, G., Fatichi, S., Schläpfer, M., Yu, K., Crowther, T. W., Meili, N., Burlando, P., Katul, G. G., and Bou-Zeid, E.: Magnitude of urban heat islands largely explained by climate and population, Nature, 573, 573, 55–60, https://doi.org/10.1038/s41586-019-1512-9, 2019.
Martilli, A., Roth, M., Chow, W. T. L., Demuzere, M., Lipson, M., Krayenhoff, E. S., Sailor, D., Nazarian, N., Voogt, J., Wouters, H., Middel, A., Stewart, I. D., Bechtel, B., Christen, A., and Hart, M. A.: Summer average urban-rural surface temperature differences do not indicate the need for urban heat reduction, Research Collection School of Social Sciences, Paper 3391, https://ink.library.smu.edu.sg/soss_research/3391 (last access: 20 March 2024), 2020.
Masson, V.: A physically-based scheme for the urban energy budget in atmospheric models, Bound.-Lay. Meteorol., 94, 357–397, https://doi.org/10.1023/A:1002463829265, 2000.
Masson, V., Le Moigne, P., Martin, E., Faroux, S., Alias, A., Alkama, R., Belamari, S., Barbu, A., Boone, A., Bouyssel, F., Brousseau, P., Brun, E., Calvet, J.-C., Carrer, D., Decharme, B., Delire, C., Donier, S., Essaouini, K., Gibelin, A.-L., Giordani, H., Habets, F., Jidane, M., Kerdraon, G., Kourzeneva, E., Lafaysse, M., Lafont, S., Lebeaupin Brossier, C., Lemonsu, A., Mahfouf, J.-F., Marguinaud, P., Mokhtari, M., Morin, S., Pigeon, G., Salgado, R., Seity, Y., Taillefer, F., Tanguy, G., Tulet, P., Vincendon, B., Vionnet, V., and Voldoire, A.: The SURFEXv7.2 land and ocean surface platform for coupled or offline simulation of earth surface variables and fluxes, Geosci. Model Dev., 6, 929–960, https://doi.org/10.5194/gmd-6-929-2013, 2013.
McDonald, R., Kroeger, T., Boucher, T., LongZhu, W., and Salem, R.: Planting healthy air: a global analysis of the role of urban trees in addressing particulate matter pollution and extreme heat. The Nature Conservancy, https://www.nature.org/content/dam/tnc/nature/en/documents/20160825_PHA_Report_Final.pdf (last access: 20 March 2024), 2016.
Meili, N., Manoli, G., Burlando, P., Bou-Zeid, E., Chow, W. T. L., Coutts, A. M., Daly, E., Nice, K. A., Roth, M., Tapper, N. J., Velasco, E., Vivoni, E. R., and Fatichi, S.: An urban ecohydrological model to quantify the effect of vegetation on urban climate and hydrology (UT&C v1.0), Geosci. Model Dev., 13, 335–362, https://doi.org/10.5194/gmd-13-335-2020, 2020.
Natural Capital Project: InVEST 3.13.0 User's Guide, Stanford University, University of Minnesota, Chinese Academy of Sciences, The Nature Conservancy, World Wildlife Fund, and Stockholm Resilience Centre, https://naturalcapitalproject.stanford.edu/software/invest (last access: 20 March 2024), 2022.
Nedkov, S., Zhiyanski, M., Dimitrov, S., Borisova, B., Popov, A., Ihtimanski, I., Yaneva, R., Nikolov, P., and Bratanova-Doncheva, S.: Mapping and assessment of urban ecosystem condition and services using integrated index of spatial structure, One Ecosystem, 2, e14499, https://doi.org/10.3897/oneeco.2.e14499, 2017.
NOAA: National Oceanic and Atmospheric Administration’s Online Weather Data (NOWData), Minneapolis-St Paul Area monthly summarized data, mean of monthly average temperatures 1981–2010, https://www.weather.gov/climateservices/nowdatafaq (last access: 20 March 2024), 2020.
Oke, T. R.: The energetic basis of the urban heat island, Q. J. Roy. Meteor. Soc., 108, 1–24, https://doi.org/10.1002/qj.49710845502, 1982.
Phelan, P. E., Kaloush, K., Miner, M., Golden, J., Phelan, B., Silva, H., and Taylor, R. A.: Urban Heat Island: Mechanisms, Implications, and Possible Remedies, Annu. Rev. Environ. Resour., 40, 285–307, https://doi.org/10.1146/annurev-environ-102014-021155, 2015.
Potchter, O., Cohen, P., and Bitan, A.: Climatic behavior of various urban parks during hot and humid summer in the mediterranean city of Tel Aviv, Israel, Int. J. Climatol., 26, 1695–1711, https://doi.org/10.1002/joc.1330, 2006.
Reid, C. E., Snowden, J. M., Kontgis, C., and Tager, I. B.: The Role of Ambient Ozone in Epidemiologic Studies of Heat-Related Mortality, Environ. Health Perspect., 120, 1627–1630, https://doi.org/10.1289/EHP.1205251, 2012.
Rosenzweig, C., Solecki, W., and Slosberg, R.: Mitigating New York City’s heat island with urban forestry, living roofs, and light surfaces, A report to the New York State Energy Research and Development Authority, http://usclimateandhealthalliance.org/post_resource/mitigating-new-york-citys-heat-island-with-urban-forestry-living-roofs-and-light-surfaces/ (last access: 20 March 2024), 2006.
Santamouris, M.: Regulating the damaged thermostat of the cities – Status, impacts and mitigation challenges, Energy Build., 91, 43–56, https://doi.org/10.1016/J.ENBUILD.2015.01.027, 2015.
Santamouris, M.: Innovating to zero the building sector in Europe: Minimising the energy consumption, eradication of the energy poverty and mitigating the local climate change, Sol. Energy, 128, 61–94, https://doi.org/10.1016/J.SOLENER.2016.01.021, 2016.
Santamouris, M.: Recent progress on urban overheating and heat island research. Integrated assessment of the energy, environmental, vulnerability and health impact. Synergies with the global climate change, Energy Build., 207, 109482, https://doi.org/10.1016/J.ENBUILD.2019.109482, 2020.
Schatz, J. and Kucharik, C. J.: Seasonality of the Urban Heat Island Effect in Madison, Wisconsin, J. Appl. Meteorol. Climatol., 53, 2371–2386, https://doi.org/10.1175/JAMC-D-14-0107.1, 2014.
Shashua-Bar, L. and Hoffman, M. E.: Vegetation as a climatic component in the design of an urban street: An empirical model for predicting the cooling effect of urban green areas with trees, Energy Build., 31, 221–235, https://doi.org/10.1016/S0378-7788(99)00018-3, 2000.
Smoliak, B. V., Snyder, P. K., Twine, T. E., Mykleby, P. M., and Hertel, W. F.: Dense network observations of the Twin Cities Canopy-Layer urban heat island, J. Appl. Meteorol. Climatol., 54, 1899–1917, https://doi.org/10.1175/JAMC-D-14-0239.1, 2015.
Spronken-Smith, R. A. and Oke, T. R.: Scale Modelling of Nocturnal Cooling in Urban Parks, Bound.-Lay. Meteorol., 93, 287–312, https://doi.org/10.1023/A:1002001408973, 1999.
Stéfanon, M., Martin-StPaul, N. K., Leadley, P., Bastin, S., Dell'Aquila, A., Drobinski, P., and Gallardo, C.: Testing climate models using an impact model: what are the advantages?, Climatic Change, 131, 649–661, https://doi.org/10.1007/s10584-015-1412-4, 2015.
Stewart, I. D.: A systematic review and scientific critique of methodology in modern urban heat island literature, Int. J. Climatol., 31, 200–217, https://doi.org/10.1002/JOC.2141, 2011.
Stewart, I. D. and Oke, T. R.: Local Climate Zones for Urban Temperature Studies, B. Am. Meteorol. Soc., 93, 1879–1900, 2012.
Tan, P. Y., Wong, N. H., Tan, C. L., Jusuf, S. K., Chang, M. F., and Chiam, Z. Q.: A method to partition the relative effects of evaporative cooling and shading on air temperature within vegetation canopy, Journal of Urban Ecology, 4, juy012, https://doi.org/10.1093/JUE/JUY012, 2018.
Tardieu, L., Hamel, P., Viguié, V., Coste, L., and Levrel, H.: Are soil sealing indicators sufficient to guide urban planning? Insights from an ecosystem services assessment in the Paris metropolitan area, Environ. Res. Lett., 16, 104019, https://doi.org/10.1088/1748-9326/ac24d0, 2021.
Velasco, E.: Go to field, look around, measure and then run models, Urban Clim., 24, 231–236, https://doi.org/10.1016/J.UCLIM.2018.04.001, 2018.
Venter, Z. S., Chakraborty, T., and Lee, X.: Crowdsourced air temperatures contrast satellite measures of the urban heat island and its mechanisms, Sci. Adv., 7, eabb9569, https://doi.org/10.1126/SCIADV.ABB9569, 2021.
Viguié, V., Lemonsu, A., Hallegatte, S., Beaulant, A. L., Marchadier, C., Masson, V., Pigeon, G., and Salagnac, J. L.: Early adaptation to heat waves and future reduction of air-conditioning energy use in Paris, Environ. Res. Lett., 15, 075006, https://doi.org/10.1088/1748-9326/ab6a24, 2020.
Villanueva-Solis, J.: Urban Heat Island Mitigation and Urban Planning: The Case of the Mexicali, B. C. Mexico, Am. J. Clim. Change, 6, 22–39, https://doi.org/10.4236/ajcc.2017.61002, 2017.
Wan, Z.: Collection-6 MODIS Land Surface Temperature Products Users' Guide, https://lpdaac.usgs.gov/documents/118/MOD11_User_Guide_V6.pdf (last access: 20 March 2024), 2013.
Wang, T., Xue, L., Brimblecombe, P., Lam, Y. F., Li, L., and Zhang, L.: Ozone pollution in China: A review of concentrations, meteorological influences, chemical precursors, and effects, Sci. Total Environ., 575, 1582–1596, https://doi.org/10.1016/j.scitotenv.2016.10.081, 2017.
Wong, N. H., Tan, C. L., Kolokotsa, D. D., and Takebayashi, H.: Greenery as a mitigation and adaptation strategy to urban heat, Nature Reviews Earth & Environment, 2, 166–181, https://doi.org/10.1038/s43017-020-00129-5, 2021.
Yu, Z., Yang, G., Zuo, S., Jørgensen, G., Koga, M., and Vejre, H.: Critical review on the cooling effect of urban blue-green space: A threshold-size perspective, Urban For Urban Green, 49, 126630, https://doi.org/10.1016/J.UFUG.2020.126630, 2020.
Zardo, L., Geneletti, D., Pérez-Soba, M., and Van Eupen, M.: Estimating the cooling capacity of green infrastructures to support urban planning, Ecosyst. Serv., 26, 225–235, https://doi.org/10.1016/J.ECOSER.2017.06.016, 2017.
Zawadzka, J. E., Harris, J. A., and Corstanje, R.: Assessment of heat mitigation capacity of urban greenspaces with the use of InVEST urban cooling model, verified with day-time land surface temperature data, Landsc. Urban Plan., 214, 104163, https://doi.org/10.1016/J.LANDURBPLAN.2021.104163, 2021.
Zhao, L., Lee, X., Smith, R. B., and Oleson, K.: Strong contributions of local background climate to urban heat islands, Nature, 511, 216–219, https://doi.org/10.1038/nature13462, 2014.
Ziter, C. D., Pedersen, E. J., Kucharik, C. J., and Turner, M. G.: Scale-dependent interactions between tree canopy cover and impervious surfaces reduce daytime urban heat during summer, P. Natl. Acad. Sci. USA, 116, 7575–7580, https://doi.org/10.1073/pnas.1817561116, 2019.
- Abstract
- Introduction
- Methods
- Results
- Discussion
- Conclusion
- Appendix A: LULC input data
- Appendix B: InVEST biophysical tables
- Appendix C: Sensitivity analyses
- Code and data availability
- Author contributions
- Competing interests
- Disclaimer
- Acknowledgements
- Financial support
- Review statement
- References
- Supplement