the Creative Commons Attribution 4.0 License.
the Creative Commons Attribution 4.0 License.
 | 12 Jan 2024
Earth system modeling on modular supercomputing architecture: coupled atmosphere–ocean simulations with ICON 2.6.6-rc
Abhiraj Bishnoi
Catrin I. Meyer
René Redler
Norbert Eicker
Helmuth Haak
Lars Hoffmann
Daniel Klocke
Luis Kornblueh
Estela Suarez
The confrontation of complex Earth system model (ESM) codes with novel supercomputing architectures poses challenges to efficient modeling and job submission strategies. The modular setup of these models naturally fits a modular supercomputing architecture (MSA), which tightly integrates heterogeneous hardware resources into a larger and more flexible high-performance computing (HPC) system. While parts of the ESM codes can easily take advantage of the increased parallelism and communication capabilities of modern GPUs, others lag behind due to the long development cycles or are better suited to run on classical CPUs due to their communication and memory usage patterns. To better cope with these imbalances between the development of the model components, we performed benchmark campaigns on the Jülich Wizard for European Leadership Science (JUWELS) modular HPC system. We enabled the weather and climate model Icosahedral Nonhydrostatic (ICON) to run in a coupled atmosphere–ocean setup, where the ocean and the model I/O is running on the CPU Cluster, while the atmosphere is simulated simultaneously on the GPUs of JUWELS Booster (ICON-MSA). Both atmosphere and ocean are running globally with a resolution of 5 km. In our test case, an optimal configuration in terms of model performance (core hours per simulation day) was found for the combination of 84 GPU nodes on the JUWELS Booster module to simulate the atmosphere and 80 CPU nodes on the JUWELS Cluster module, of which 63 nodes were used for the ocean simulation and the remaining 17 nodes were reserved for I/O. With this configuration the waiting times of the coupler were minimized. Compared to a simulation performed on CPUs only, the MSA approach reduces energy consumption by 45 % with comparable runtimes. ICON-MSA is able to scale up to a significant portion of the JUWELS system, making best use of the available computing resources. A maximum throughput of 170 simulation days per day (SDPD) was achieved when running ICON on 335 JUWELS Booster nodes and 268 Cluster nodes.
- Article
(870 KB) - Full-text XML
- BibTeX
- EndNote


The Earth's climate is a highly complicated, dynamic system built out of interacting sub-systems that have distinctly different governing equations and constraints. Now, more than ever before, it is crucial to attain a deeper understanding of the underlying processes that govern the weather and climate of our planet, as well as predict the effect of human activities on its environment (Bony et al., 2015; Ummenhofer and Meehl, 2017). These are the major driving forces behind the Destination Earth initiative of the European Union to create a digital twin of our planet (Bauer et al., 2021b).
Since the dawn of supercomputing in the 1960s, numerical modeling of weather and climate has been one of the most important applications (Manabe and Bryan, 1969; Trenberth and Trenberth, 1992; Houghton, 1996; Flato, 2011). With ever progressing advances in computation technologies, climate models have increased their resolution, complexity, ensemble size, number of scenarios, and simulation length to make use of more powerful computers (Randall et al., 2018). But to optimally exploit new technologies, climate codes need to change or adapt (Bauer et al., 2021a). This is a challenge for complex Earth system models, which must rely on scientific and technical innovation efforts of large communities working on single model components and result in development cycles with different speeds.
The code of more advanced complex climate models is composed of many different kinds of operations, e.g., conditional branch selections, index-based indirect addressing, large table access, frequent time-based output, and time-dependent updating of boundary conditions. Another level of complexity is added through optimizations adapted to specific computing hardware (Lawrence et al., 2018). These bring features such as blocking, with the capability of changing the innermost loop length at runtime with stride one access. The outermost loop length can be defined as the number of blocks corresponding to the length of the innermost loop, allowing for blocking, e.g., with OpenMP. Including additional model components to more accurately represent the Earth's physical system further increases the computational demand. As a result, increasing the processing power does not necessarily translate into faster computations done in single simulations. In concrete terms: since 1990, when the first assessment report of the Intergovernmental Panel for Climate Change (IPCC) was released, the speed of the fastest computer in the world increased by a factor of more than 1 million from under 1 TFLOPS (1993) to over 1 EFLOPS (2023). In the same time span, climate models refined their horizontal resolution from about 500 km (1990) to about 125 km (2021) – a factor of only 128 in computations, considering the two horizontal directions, the time step length, and doubling the number of vertical levels.
A second pathway to utilize the increased computing power of high-performance computing (HPC) systems are storm-resolving class models (Stevens et al., 2020) with resolutions from 5 km (2018) up to 1.25 km (2022). This model resolution marks a breakthrough in climate modeling because important processes, which shape the climate of ocean and atmosphere, can be simulated explicitly. At the same time, relevant aspects of climate change, like weather-related hazards, are inherent to the simulations, and their statistics can be assessed on a regional scale.
The latest generations of HPC systems consist largely of GPUs as accelerators, which require adapting climate codes to exploit their enhanced computing capabilities (Jiang et al., 2019; Schär et al., 2020; Giorgetta et al., 2022). These new technologies can provide better throughput for climate integrations at lower energy consumption, enabling a new realm of climate modeling in which the climate system can be simulated at the kilometer scale.
The Icosahedral Nonhydrostatic (ICON) Weather and Climate Model, which consists of component models for atmosphere, land, and ocean, originated as a joint project of the German Weather Service (DWD) and the Max Planck Institute for Meteorology (MPI-M) (Zängl et al., 2015). It has then expanded to involve a growing list of partners, now including the German Climate Computing Center Hamburg (DKRZ), the Center for Climate System Modeling at ETH Zürich (C2SM), and the Karlsruhe Institute of Technology (KIT). Recently, the model entered the stage of kilometer-scale resolutions to resolve important processes of the climate, like convective storms, ocean eddies, land heterogeneity, and sea ice leads (Hohenegger et al., 2023; Korn et al., 2022). While the atmosphere component has been adapted and optimized to run on GPUs by means of OpenACC directives (Giorgetta et al., 2022), using the already available innermost loop length adaptation, it is still not yet possible to simulate the ocean on GPUs. This situation presents an ideal scenario to exploit the modular supercomputing architecture (MSA) (Suarez et al., 2019) to improve the efficiency of running such models on large supercomputing systems in terms of runtime for the model itself, as well as resource efficiency of the supercomputing system.
The modular supercomputing architecture concept is a novel way of organizing computing resources in HPC systems, developed at the Jülich Supercomputing Centre (JSC) in the course of the DEEP projects (Suarez et al., 2018). Its key idea is to segregate hardware resources (e.g., CPUs, GPUs, other accelerators) into separate modules such that the nodes within each module are maximally homogeneous. This approach has the potential to bring substantial benefits for heterogeneous applications such as ICON, wherein each sub-component has been tailored or is by nature of the numerical solution better suited to run efficiently on specific hardware, corresponding to differences in the governing physics. Another intriguing target for running on target-specific hardware is using asynchronous output strategies based on remote memory access. Optimizing the network utilization for such a usage model supports performance objectives by reducing network jitter due to different network usage patterns for the components. In such applications, each part can ideally be run on an exactly matching module of the MSA, improving time to solution and energy efficiency.
The primary focus of this work is to explore and empirically describe the benefits of using the MSA for running large-scale climate simulations, using coupled ICON atmosphere–ocean simulations as an exemplary scientific use case. A second focus is to describe the process and challenges associated with undertaking such an endeavor. The ICON model was ported to and optimized on the MSA system Jülich Wizard for European Leadership Science (JUWELS; Jülich Supercomputing Centre, 2019), in such a manner that the atmosphere component of ICON is run on GPU-equipped nodes, while the ocean component runs on standard CPU-only nodes. The output servers, responsible for performing I/O, also run on CPU-only nodes. This setup allows for an optimal use of the GPU nodes by fully dedicating not only the GPU usage but also the available network adapters per GPU.
In Sect. 2 we provide a comprehensive description of the ICON model and its specific setup. Section 3 presents a brief overview of the MSA, starting with an introduction to the concept (Sect. 3.1), the presentation of the modular hardware and software architecture of the JUWELS system at JSC (Sect. 3.2), and the strategy for porting the ICON model to the MSA, with a detailed explanation of the rationale behind each decision we made (Sect. 3.3). Section 4 contains the results from our analyses for finding a sweet-spot configuration for ICON (Sect. 4.1), the comparison to a non-modular setup (Sect. 4.2), and strong scaling tests (Sect. 4.3). Specific challenges and considerations associated with porting such complex codes as ICON to the MSA are discussed in Sect. 5. Section 6 provides the summary and conclusions of this study.
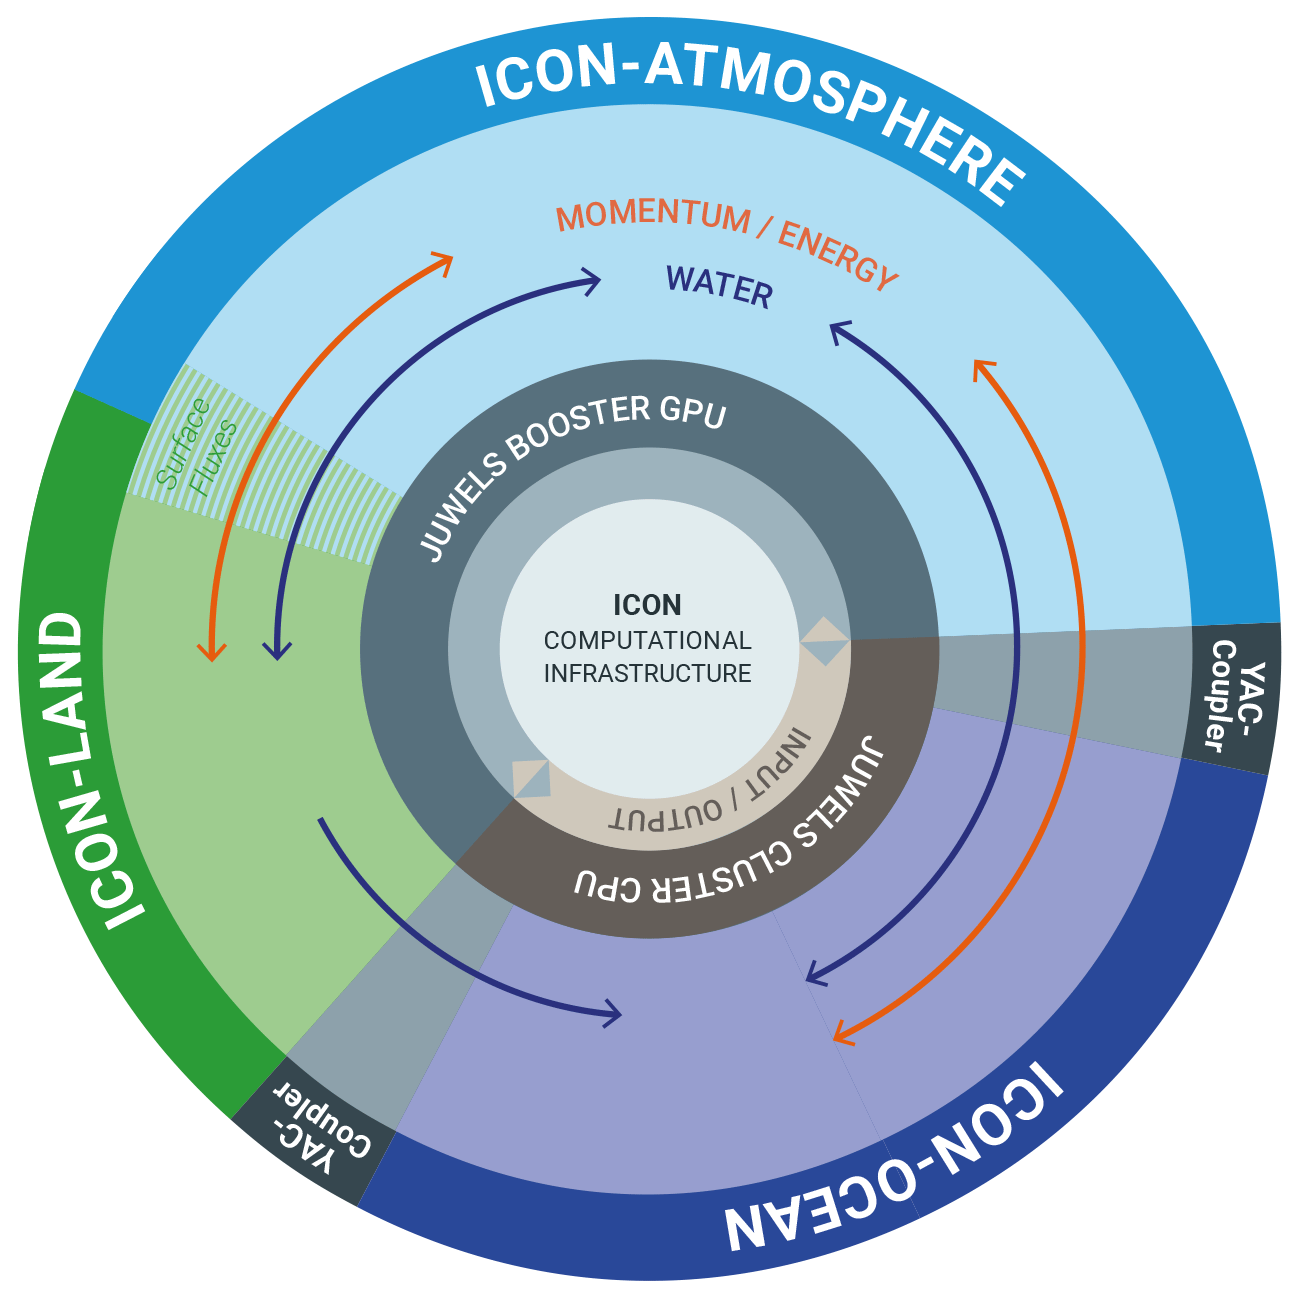
The global coupled ICON model setup used in this study (Fig. 1) is based on the non-hydrostatic atmosphere model employing the Sapphire physics (Hohenegger et al., 2023), from hereon referred to as ICON-A, and a hydrostatic ocean including sea ice (ICON-O) (Korn et al., 2022). The land surface model ICON-LAND is integral part of the ICON-A code, and its configuration will not be discussed here any further. The setup used here is described in detail as the G_AO_5km setup by Hohenegger et al. (2023). Here we repeat only those characteristics of the model components that are key for the technical focus of this study. The horizontal grid resolution is 5 km (R2B9) in both components, land cells in the ocean component are excluded. Thus, the horizontal grids encompass 20 971 520 cells for the atmosphere and 14 886 338 for the ocean. In the vertical, the ocean is discretized on 128 z levels, in the atmosphere a terrain-following hybrid sigma z coordinate (the Smooth Level Vertical coordinate (SLEVE), Leuenberger et al., 2010) is used with 90 vertical levels. Compared to coarser-resolution climate models this configuration allows for a better representation of atmospheric convection and mesoscale eddies in the ocean (Schär et al., 2020).
Atmosphere and ocean interact tightly, exchanging surface fluxes at the sea surface interface. In this interaction, the atmosphere model provides zonal and meridional components of the wind stress, surface freshwater flux (rain, snow, evaporation, river discharge), shortwave and longwave radiation, latent and sensible heat fluxes, sea ice surface and bottom melt potentials, 10 m wind speed, and sea level pressure. The ocean provides sea surface temperature, zonal and meridional components of velocity at the sea surface, ice and snow thickness, and ice concentration. Technically the data exchange between the two components is implemented via Yet Another Coupler (YAC, Hanke et al., 2016), here using a more recent version (2.6.1). The geographical positions of ocean cell centers and vertices are identical in both components. Therefore, no interpolation is required and we use the one-nearest-neighbor search to repartition all coupling fields but the river discharge. The latter is transferred via source-to-target mapping where the discharge, which is provided on single coastal cells in the atmosphere domain, is remapped to a wider range of coastal ocean cells.
While it is believed that many physical processes are already represented on kilometer scales within the non-hydrostatic equations of motion and conservation laws, which form the basis of ICON (Zängl et al., 2015), a few others still need to be parameterized due to their small scale, especially radiation, microphysics, and turbulence. The parameterizations for these processes and their calling sequences are described in detail in Hohenegger et al. (2023).
2.1 Model input data
In this study we performed several short ICON simulations of one simulation day each. For all our experiments, ICON-A is initialized using ECMWF's Integrated Forecasting System (IFS) operational analysis data on 20 January 2020, 00:00 UTC. The ocean initial state for the same date is taken from an uncoupled ICON ocean model simulation with ERA-5 reanalysis forcing (Hersbach et al., 2020). Details of the ocean spinup can be found in Hohenegger et al. (2023). Several external parameters need to be provided as boundary or background conditions. This includes orography and bathymetry, as well as global mean concentrations of greenhouse gases and monthly varying fields of ozone concentrations and aerosols. The data sets used here are described in more detail in Hohenegger et al. (2023). Our simulations are running with a horizontal grid spacing of 5 km (R2B9). Input data for these simulations add up to a total of 793 GB and are provided as files with global coverage in NetCDF format following the CF conventions (Hassell et al., 2017), which are already interpolated onto the horizontal model grid. As an exception, the ocean initialization is performed in parallel from multiple patch files.
2.2 Model output data
To allow for long-time (in the model's world) integrations, one single program run is a bad choice. The reason is that it can never be assured that the underlying compute system is sufficiently stable, which forces the requirement for the model integration to be able to checkpoint and restart. Furthermore, most sites limit the runtime of a single job to several hours. For example, single jobs are limited to 24 h for the systems in Jülich. System checkpoint and restart of big model codes requires large amounts of data to be dumped to disk. To minimize this, ICON uses a model-internal checkpoint and restart process. This substantially reduces pressure on the disk subsystem. Moreover, checkpointing can be performed asynchronously and several times per single job, and restarts in case of failures can be launched with minimal loss in computing time.
For efficient and parallelized checkpoint/restart, ICON creates restart information in the form of multiple files in the NetCDF format, which handles the minimum amount of information to continue a run with bit-identical results. For ICON-A, the total restart output is 483 GB, consisting of 390 output variables; ICON-O restarts consist of 83 variables with a total of 356 GB when using R2B9 resolution. A single checkpoint and restart is split into 82 patch files for the atmosphere and 100 patch files for the ocean, respectively, equivalent to one patch file per node. With subsequent jobs each node has to read one patch file and distribute data only within a node, provided that the number of nodes is kept fixed from job to job.
For ICON general output, numbers, frequency, and content of regular output files can be chosen freely with a namelist driven approach. In general, I/O is performed asynchronously to the model integration on dedicated I/O nodes, which allows us to hide the overhead introduced by the output behind the computation (except for checkpointing). Single-level global atmospheric fields in original ICON R2B9 resolution need about 78 MB of storage, while ocean fields can be stored in about 58 MB for single levels. Thus, model output can easily reach the order of Terabytes per simulation day.
All simulations performed for our MSA benchmarks run for one simulation day with 3-hourly output of 14 three-dimensional atmospheric variables. In addition, 125 two-dimensional variables are written from the atmosphere, ocean, and land component with various output frequencies from 0.5 to 3 hours. Restart files are written at the end of the simulation. For all simulations, 17 Cluster nodes were dedicated to input/output, and the total amount of storage needed for output and restart sums up to 2.2 TB.
3.1 Concept
The variety of application profiles running on today's HPC systems is extremely broad, as is the specificity of their requirements. Thus, serving them all with the same homogeneous hardware architecture in a suitable and energy-efficient way becomes impossible. Therefore, most of the top supercomputers today are heterogeneous platforms: they combine CPUs with some kind of acceleration device, in the majority of the cases general-purpose graphic cards (GPUs). According to the June 2023 top 500 list, 185 of the 500 systems on the top 500 list include GPUs (Prometeus GmbH, 2023).
Efficiently sharing resources between users in so-called “monolithic” computers, in which different kinds of hardware devices are combined within the node, is challenging. For instance, when an application running on the node is not using some of its computational elements (e.g., a GPU), making those resources available to another user is usually prevented by a critical, common node resource (typically memory and network bandwidth) that tends to be fully utilized by the first user and which is not manageable in a fair and consistent way.
The segregation of hardware resources, which consists of grouping equal devices within compute partitions (called “module”), makes it much easier to dynamically allocate different kinds of nodes – and therefore resources – to different users. Each application can select any number of nodes on the different modules, reserving only those resources that are needed at each point in time, and leaving the rest free for other users. The result is an optimal utilization of the overall computational resources, which in turn maximizes the scientific output of the HPC system.
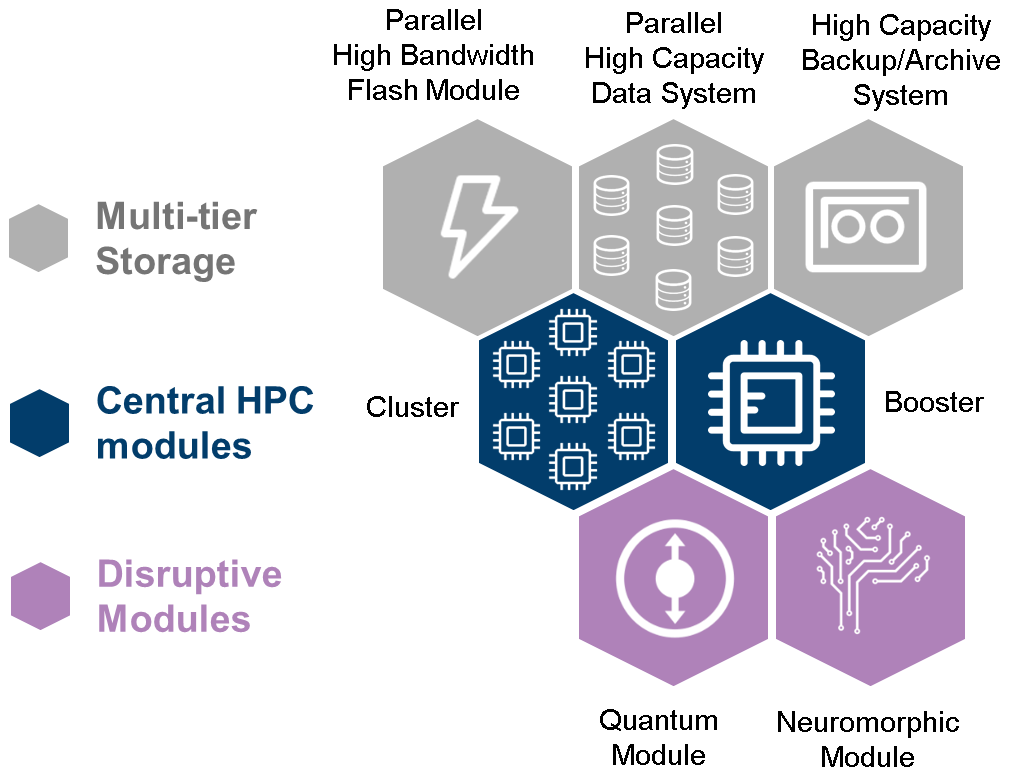
Figure 2Schematic view of the modular supercomputing architecture. Each module is a cluster computer of potentially large size, and its node configuration differs from the rest of modules.
The modular supercomputer architecture (MSA, Suarez et al., 2019) leverages two or more computational modules of potentially large size – each one relatively homogeneous and designed to best match the needs of a certain class of algorithms – to create an overall heterogeneous system (Fig. 2). For example, while the Cluster module is a CPU-based system, the processing power in the Booster module is provided by some kind of energy-efficient acceleration device (today mostly GPUs). In this manner, application parts that require high single-thread performance can use the Cluster, while the highly scalable parts run on the Booster. The MSA concept allows for integration of additional modules to target the needs of specific user communities (e.g., data analytics or visualization modules) or to include emerging technologies such as quantum or neuromorphic computing.
With the MSA, application developers gain more freedom to choose any number and combination of CPUs, GPUs, or other accelerators. A common software stack enables them to map the intrinsic application requirements (e.g., their need for different acceleration technologies and varying memory types or capacities) onto the hardware in order to achieve maximum performance. This is particularly interesting for workflows that are themselves somewhat modular, i.e., that perform multi-physics or multi-scale simulations (Kreuzer et al., 2021). This is frequently the case in terrestrial and atmospheric sciences, which couple different models to reproduce the highly complex interactions between the compartments of the Earth system, like atmosphere, land, and ocean, as is also the case in ICON. Since the various modules of an Earth system model (ESM) represent different computation behavior, they can profit from running on Cluster, Booster, or a mixture of both. In addition, the more technical issue of handling large amounts of data in model I/O may also demand specific architectural solutions.
3.2 JUWELS
JUWELS (Jülich Supercomputing Centre, 2019) is an MSA system operated by JSC as a European and German computing resource. JUWELS currently consists of two modules, a Cluster and a Booster. The Cluster – installed in 2018 – is an Atos BullSequana X1000 system with 2567 compute nodes, equipped with Intel Skylake CPUs and Mellanox EDR InfiniBand allowing for 100 Gbit s−1 connectivity. Each Cluster node consists of two CPUs with 24 cores each. In 2020 it was accompanied by the Booster, a 936 node Atos BullSequana XH2000 system, with each node equipped with four NVIDIA A100 GPUs and four Mellanox HDR InfiniBand adapters (200 Gbit s−1 each) managed by two AMD EPYC 7402 processors. The combined theoretical peak performance is about 80 PFLOPS. Both modules feature an InfiniBand-based interconnect and are operated using ParTec's ParaStation Modulo software suite (ParTec AG, 2023).
JUWELS is catering to users needing the highest computer performance. It is used by various national and European scientific communities from different domains. The 3700 GPUs of the JUWELS Booster offer accelerated tensor operations and mixed precision, which is especially suited for AI research (Kesselheim et al., 2021). These are now also increasingly used by more classical HPC applications successfully ported to GPUs, a development supported by intensive preparation and training courses like the JUWELS Booster Early Access Program (Herten, 2021). Some recent examples of scientific applications in the ESM community that are actively run on JUWELS Booster include deep-learning methods for temperature forecasting (Gong et al., 2022), explainable machine learning for mapping of tropospheric ozone (Betancourt et al., 2022), atmospheric chemical kinetics in the atmospheric chemistry model EMAC (Christoudias et al., 2021), the Lagrangian particle dispersion model MPTRAC (Hoffmann et al., 2022), the hydrologic model ParFlow (Hokkanen et al., 2021), the radiative transfer model JURASSIC (Baumeister and Hoffmann, 2022), and the atmospheric component of the ICON-ESM (ICON-A) (Giorgetta et al., 2022).
3.3 Porting and optimization strategy
To optimally run the ICON-ESM on the JUWELS system, a strategy was adopted to find a configuration in which each component of the coupled model is matched to the best-suited hardware platform. Here, the best fit refers to the hardware platform and resource configuration that maximizes the performance of the application (typically defined in terms of runtime), while simultaneously maintaining a high level of resource efficiency (considering system usage and energy efficiency).
In our experiments, the total energy consumption of all nodes involved in a particular run is used as a measure of resource efficiency. Due to the absence of energy meters on the JUWELS nodes, it is not yet possible to measure the exact energy consumption. As a workaround, we used a proxy for the total energy consumption defined in terms of the average total runtime of each simulation run, multiplied by the thermal design power (TDP) of all nodes involved in a particular run. The TDP of a single node in our experiments was calculated by adding the TDP of the CPU and (if applicable), of all GPUs connected to a node. For simplicity, we ignore the power consumed by the network or the memory in our experiments. Nevertheless, experience shows that real-world applications never reach TDP. Thus, our proxy is rather conservative and overestimates power consumption. The ideal representation for resource efficiency then translates to minimizing this proxy metric.
Taking both runtime and energy consumption metrics into account, it was observed that the best configuration for running the coupled model is with ICON-A running on the Booster module and ICON-O running on the Cluster module along with the I/O servers of both components. ICON-A is suited to run on a Booster module as large parts of the code base have been optimized to make use of GPUs for faster calculations (Giorgetta et al., 2022). The ocean code has not been ported to GPUs because preliminary studies indicate that the required porting effort would be overproportionally higher than the expected performance gains. Given this constraint, the configuration that minimized energy consumption while simultaneously maintaining a high application performance was found to be through the execution of ICON-O on the Cluster module. For similar reasons, the I/O servers for both components were executed on JUWELS Cluster. The MSA experiments on JUWELS presented in Sect. 4 all rely on these basic choices, and only the number of nodes has been adjusted to achieve optimal load balancing.
To quantify the benefit of the MSA approach we compare the energy consumption of an optimal MSA configuration with a homogeneous setting in which the entire coupled model is run on the same type of nodes while keeping the runtime roughly the same. Since not all model components of ICON can take advantage of GPUs, we use the CPU nodes of the JUWELS Cluster module as a baseline for this comparison. The runtime is kept roughly the same by using the same number of nodes for the ocean component. Both configurations (MSA and homogeneous baseline) are optimized by adjusting the number of nodes used for the atmosphere component such that waiting times between model components are minimized. All other model parameters are kept the same. The process of finding the optimal configuration is described in detail in Sect. 4.1 for the MSA configuration and in Sect. 4.2 for the homogeneous baseline. In addition, we performed a strong scaling experiment to prove the scalability of the MSA approach, which is presented in Sect. 4.3.
4.1 Sweet spot analysis
To test the effectiveness of the MSA approach in comparison to homogeneous HPC systems, a natural question arises as to which configuration of nodes can be used as a reference baseline for comparison. Especially with heterogeneous workloads such as ICON, it is fairly common that one component of the coupled system is much faster than the other(s) due to differences in the physics and algorithms used by the different components themselves, as well as differences in the hardware on which they run best. These differences frequently lead to situations where one component spends a significant portion of its overall runtime waiting for intermediate results from the other components, which can lead to large losses in efficiency in terms of time and energy.
Finding a sweet spot configuration of nodes that perfectly balances the components involved is important to maximize the overall efficiency of the simulations. It also serves the second purpose of finding a node configuration suitable as a baseline reference for comparison between the modular and non-modular approach and for strong scaling studies. The experiments performed to find the sweet spot settings are summarized in Fig. 3.
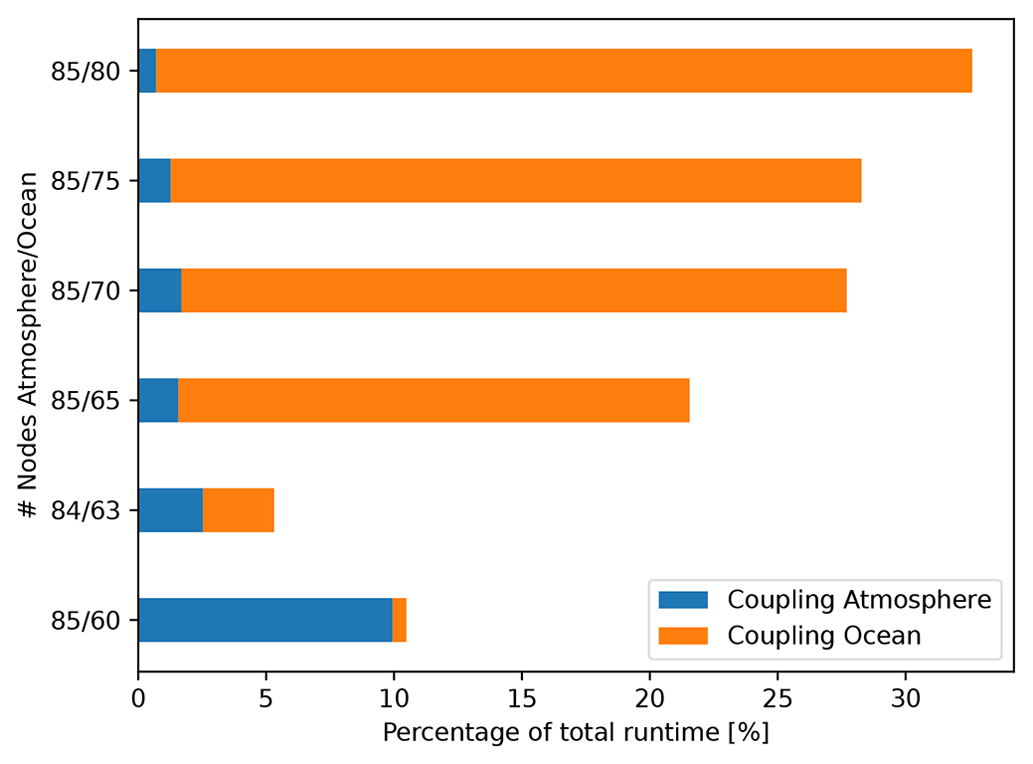
Figure 3Sweet spot analysis to find a configuration of nodes that minimizes the total coupling time. On the y axis, tuples of values represent the number of JUWELS Booster and Cluster nodes used for a simulation run. The first value of each tuple signifies the number of nodes used by ICON-A for this run, and the second value of the tuple signifies the total number of nodes used by ICON-O. The 17 Cluster nodes dedicated to I/O are not taken into account since the number of I/O nodes is kept constant across all experiments.
We started out with an initial guess using a ballpark estimate of the minimum number of nodes needed for each component, considering the memory requirements of each component of the model. Keeping all other parameters fixed, we vary the number of Cluster and Booster nodes simultaneously in order to minimize the total coupling time of the model.
The coupling time of the atmosphere component represents the cumulative time that the atmosphere component of the model spends waiting for the ocean component during a simulation run. A larger atmospheric coupling time signifies that ICON-A runs faster than ICON-O, and we can potentially achieve better performance by either increasing the number of ocean nodes or decreasing the number of atmosphere nodes used for the simulation. Similarly, the coupling time of the ocean component represents the cumulative time ICON-O spends waiting for ICON-A during a simulation. The total coupling time represents the sum of the waiting times of the atmosphere and ocean components. From the optimization standpoint, in terms of both performance and energy consumption, this time should be minimized as it is idle time that the two components spend waiting for each other, during which no calculations are performed in the waiting component.
Based on the results of prior standalone atmosphere-only runs, the atmosphere nodes were set to 85 JUWELS Booster nodes using 4 GPUs and 4 CPU cores per node with 1 GPU per core. The number of nodes used by ICON-O was initially set to be 80 using all available cores on a JUWELS Cluster node (48 cores per node) as a starting point for the study. For the first trial node configuration (85 Booster nodes and 80 Cluster nodes), it was observed that a significant portion of the overall runtime of ICON-O was spent waiting for intermediate results from ICON-A. The atmosphere component also spends some time waiting for the ICON-O, but this time paled in comparison.
This information was sufficient to give clues about the ocean component being much faster than the atmosphere component for this configuration of nodes (85 and 80). This means that the resources allocated to ICON-O can potentially be reduced without losing runtime performance. Alternatively, one could allocate more resources to ICON-A to achieve similar results. The former approach of reducing the resources allocated to ICON-O was chosen over the latter, as this was found to be more resource efficient.
The analysis was repeated for other node combinations by reducing the number of JUWELS Cluster nodes by steps of 5, until the atmosphere component became faster than the ocean component. This state is reached for the combination (85 and 60) Booster and Cluster nodes. The optimal configuration of nodes that minimizes the total coupling time lies in between Booster and Cluster combinations (85 and 65) and (85 and 60) and was empirically determined to be 84 and 63, respectively, by tweaking the node configurations in steps of 1. For this combination of nodes the times spent by the coupler module in ICON-A and ICON-O are almost equal and the total coupling time is minimal. It has to be stated that another 17 Cluster nodes have been reserved as I/O servers, and their number remains constant throughout all simulations reported in this work.
4.2 Comparison with simulations on non-modular architectures
The optimal node configuration found through the sweet spot analysis is used as a reference to compare the MSA setup to the non-modular case for the analysis of runtime and energy efficiency. We decided to scale up the non-modular simulation such that total runtimes are in the same order than for the MSA setup. To achieve this, the number of ICON-O nodes is fixed to the number that was found to be optimal for the MSA case (63 nodes) and all other model parameters are kept identical between simulation runs. For the homogeneous Cluster setup the number of atmosphere nodes was increased until we reached user allocation limits (it is not possible for a single user to make use of more than a predefined threshold of 1024 nodes of the JUWELS Cluster module on a regular basis). In all cases we recorded the total time and energy consumed by the simulations.
The total power consumed by each experiment is estimated using thermal design power (TDP) as a metric for power consumption. The TDPs of all processing elements (CPUs and GPUs) involved in the simulation runs are described in Table 1. This information has been taken from the hardware specifications of the individual vendors (Intel, AMD, and NVIDIA).
Table 1Thermal design power (TDP) of individual processing elements involved in the simulation runs.
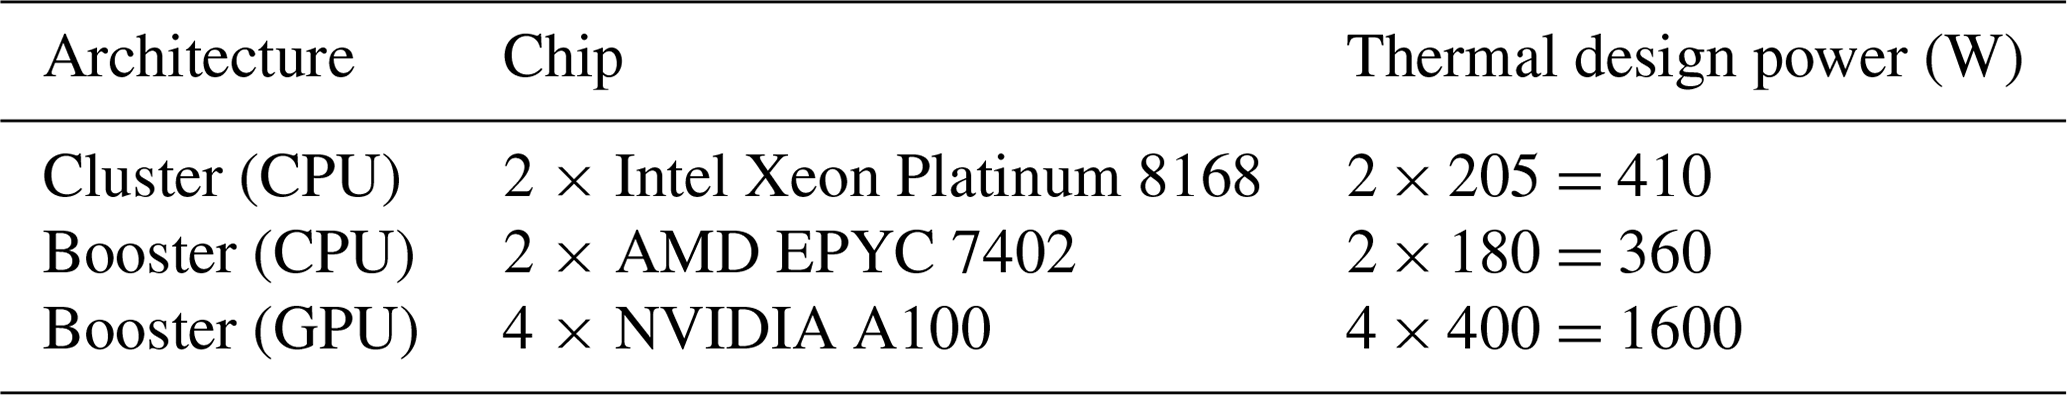
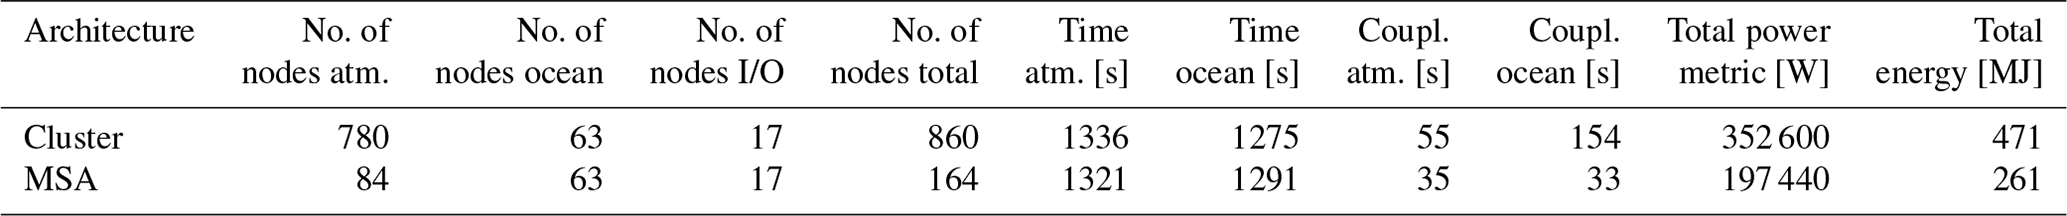
Table 2 summarizes the results of the comparison between the modular and non-modular architectures based on runtime and energy consumption. In both configurations runtimes for ICON-A are longer than for ICON-O and determine the overall runtime. For the non-modular setup, based on previous experience, we increased the number of nodes used for ICON-A until the workload for the integration of atmosphere and ocean was balanced, which is the case with 780 nodes used by ICON-A, summing up to a total of 860 Cluster nodes used by the ICON simulation including the I/O nodes. With the MSA setup, the coupling times in both components are reduced compared to the cluster-only simulation, most significantly in ICON-O where the reduced number of communication partners resulted in reduced network traffic. It can be observed that even though the modular and non-modular approaches are nearly identical in terms of runtime, the modular approach results in an overall reduction in energy consumption of 45 %, based on the total TDP of all CPU and GPUs involved multiplied by the total runtime of the simulation.
Table 2Comparison between non-MSA and MSA configuration in terms of runtime and energy consumption. Energy consumption is computed by multiplying the total TDP of all processing elements used in the simulation multiplied by the total runtime.
The TDP metrics used for the computations are maximum values and assume that all nodes were being utilized at full capacity. While this might be true for non-modular runs, this is not the case with the modular approach. For all simulation runs conducted in this study, only 4 out of the 24 CPU cores present on each JUWELS Booster node are used to run the atmosphere component. Therefore, the real savings in terms of energy consumption using the modular approach is likely to be even larger than reported here and serves as an opportunity for model performance optimization in future work.
4.3 Scaling test
To further prove the efficiency of the MSA in running coupled ESM simulations with ICON, a strong scaling test was performed with the modular configuration. This was done to evaluate if the well-known good scaling behavior of ICON also covers the coupling overhead introduced by MSA. To do so, the problem size was fixed at the base configuration (R2B9, 1 simulation day) and the number of nodes used by both ICON-A and ICON-O were subsequently raised for each simulation by a factor of until they reach the current user allocation limits on JUWELS Booster (384 nodes). This rather small factor was chosen to accommodate enough experimental data before reaching the user allocation limits.
The results of this strong scaling test are summarized in Table 3 and Fig. 4. It is observed that the modular approach scales reasonably well up to (335 Booster/251 Cluster) nodes. The scaling behavior is found to be similar to standalone runs of ICON-A, which we performed on the JUWELS Booster system, lending credibility to the use of the modular super-computing architecture to perform ESM simulations.
In ICON, the computation domain in each MPI process is divided into blocks of a fixed length (nproma). The parameter nproma determines the length of the inner loop and has to be specified at runtime and adjusted properly for each architecture. On CPUs nproma is typically a small value that does not need to be changed with the number of nodes. This is set to 32 for the atmospheric component and 8 for the ocean component. In contrast, for GPUs nproma has to be set as large as possible – ideally resulting in a single local block per MPI process – in order to reduce the memory traffic between host and accelerator. With a growing number of MPI processes the local domains get smaller, and thus nproma has to be reduced as well in order to allow for safely copying of and looping over non-required array elements. The GPU memory on JUWELS is sufficiently large to host the local compute domain in one single block even in our base configuration with 84 Booster nodes. This is the only parameter that is varied between the scaling simulations, keeping all other parameters of the simulation consistent across runs. Our choice of nproma for the different Booster node counts are also presented in Table 3.
From the sums of the runtimes spent in the integration loops of ICON and the coupling overhead times one can also estimate the throughput of ICON in MSA mode, which is given in Table 3 as simulation days per day (SDPD). With the resource-efficient baseline simulation (84 and 63 Booster and Cluster nodes, respectively) the throughput is 76 SDPD, the highest value is reached on 335 and 251 (Booster and Cluster, respectively) nodes with 170 SDPD.
Table 3Experimental data for the strong scaling test of the MSA setup on the JUWELS system. Coupling waiting times are the times which are spent by one model component waiting for the other and are part of the total times for each component but not of the model integration time. Model throughput in SDPD is calculated for the maximum of the integration times of ICON-A and ICON-O.
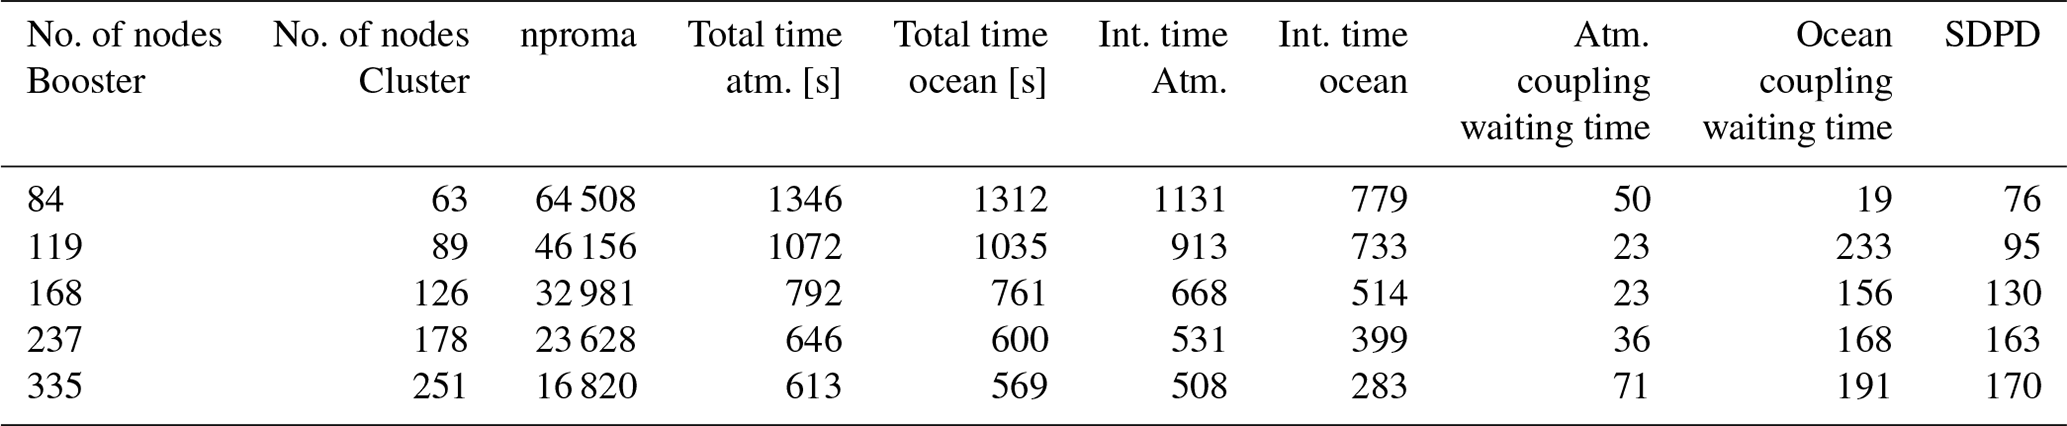
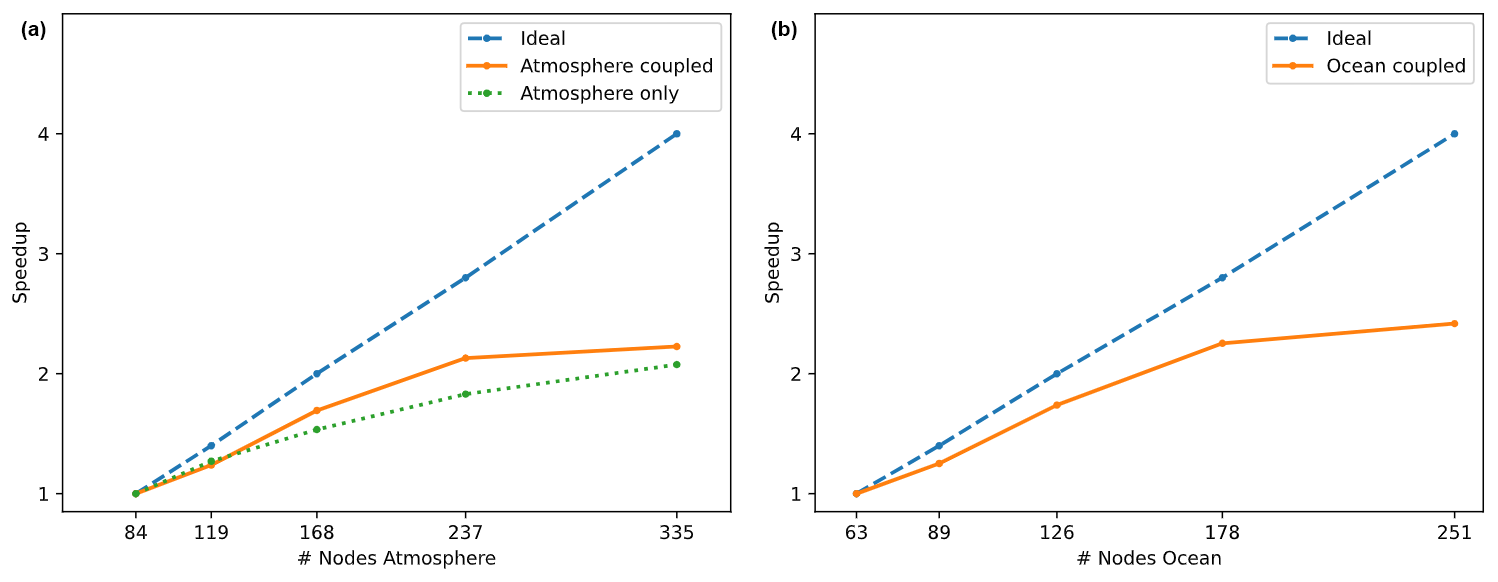
Figure 4Strong scaling test using the MSA concept for the coupled components ICON-A (a) and ICON-O (b). Scaling lines (orange) are based on model integration times excluding initialization and writing of regular output. For ICON-A, scaling of the standalone atmosphere model is given for comparison (in green).
Figure 5 shows the scaling behavior of the total runtime composed of the model time spend in the time integration loop, the model initialization, and the writing of restart files. The initialization phase accounts for about 15 % of the total runtime in our simulations. For the climate simulations envisaged within the ICON-ESM the model initialization can be neglected. Similarly, the writing of restart files takes only a small portion of the total runtime and is performed only rarely. The regular writing of netCDF output (ICON timer wrt_output) is done asynchronously on dedicated Cluster nodes. Care needs to be taken that writing times are shorter than the integration times of the model time loops. If this limit is reached it may be advisable to either increase the number of I/O servers or to reduce output amount or frequency. For our simulations the time needed for writing output is always smaller than the model integration time.
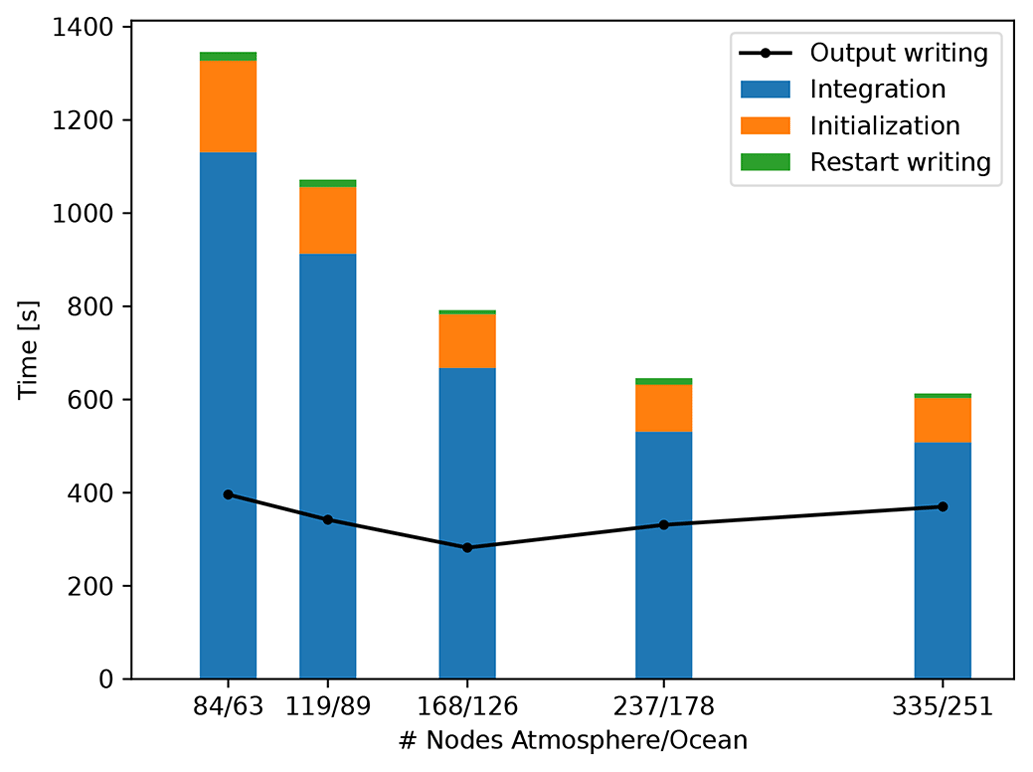
Figure 5Major individual timers of ICON for the strong scaling experiments. Shown are the maxima of the timers in ICON-A and ICON-O.
The requirements of the different components of a complex model system like ICON must be taken into account when adapting it to heterogeneous hardware computers, especially when mapping model code to different kinds of hardware. For the atmosphere-only simulations performed on JUWELS Booster previously described in Giorgetta et al. (2022), initially the output server was mixed in with the host CPUs of the GPU nodes, which introduced a significant imbalance in the node usage. This is a strong indication for network jitter where the halo exchange and the asynchronous data exchange by one-sided communication interfere. Moving the output servers to dedicated nodes led to a substantial speed-up in the wall clock time by about 15 %. However, using dedicated GPU nodes for this purpose, in which context only the host CPU is used, means letting four GPUs idle, which is a serious waste of resources. Thus, we decided here to employ CPU-only nodes of JUWELS Cluster for I/O – essentially disentangling the network resource usage and making better use of the GPUs.
As the target here is not running atmosphere-only experiments, but coupled ones where the ocean provides sufficient performance on CPUs, the selection of running this particular model component on CPU-only resources is another approach to disentangle the network traffic. As ICON-O is using a global solver for the sea level height, another different type of communication is entering the network and more jitter would be disturbing the runtime if the resources would be interleaved on the host CPU within a GPU node. In essence, currently the best way to disentangle the network usage patterns is using a hybrid setup, where the resources are used in a way as dedicated as possible. This in turn means that for our experiments the ICON-A, which is optimized for GPUs, runs on the JUWELS Booster, while dedicated CPU nodes of the JUWELS Cluster are deployed for I/O and ICON-O calculations, respectively. Efforts are now ongoing to also port ICON-O to GPU architecture, enabling GPU-only simulations with the ICON-ESM in the long run. We state here that with our setup ICON-O is always faster than ICON-A. In the (84 and 63) node configuration the ocean module accounts for about 17 % of the total energy consumption. Estimating similar behavior to ICON-A, an ocean porting would result in additional energy savings of 5 % to 10 % for the coupled experiment. In simulations where ICON-O is run in a higher resolution than ICON-A or with a computational telescope (Hohenegger et al., 2023), more ocean nodes will be needed and energy-saving potential is higher.
The ICON internal model structure is based on the multiple-program–multiple-data (MPMD) model. Therefore, the model internal structure is well prepared for distributing each of the specific components: atmosphere, ocean, and the respective output servers. From the parallel programming perspective, the same MPI environment is running on Cluster and Booster. Therefore, one model can be compiled with the required compiler for the CPUs and the second with that required for the GPUs. An application binary interface (ABI)-compatible MPI library is used for both compiler variants, and the remaining set of required libraries is provided for both compilers. Launching this particular type of a MPMD execution model relies on the heterogeneous job support of the Slurm HPC workload manager.
In our case we had to initially use a privately installed software stack based on the system-provided compilers and ParaStation-MPI (here version 5.5.0-1). For initial porting and exploring new features we tend to favor such a setup. As previously noted, the compiler and MPI are from the system side and remaining software stack is built by us ourselves. System-side software stacks are much easier to adapt when an application is working and tested and in principle favorable. Another challenge was (and still is) associated with the Slurm scheduler (backfill), which does not favor the allocation of resources simultaneously on both Cluster and Booster and can result in long queuing times. Essentially, it can thus be a cumbersome and hard process to get modular application setups like the one of ICON working, and it requires a close collaboration with system administrators at least in the pioneering phase.
The model throughput achieved with our ICON simulations on MSA can be compared to those reported in (Giorgetta et al., 2022). They present results from ICON atmosphere-only simulations on JUWELS Booster, using a similar model resolution and setup to what we did for ICON-A. Simulations performed in this work result in throughput estimates that are less than 50 % of their reported values when compared to linearly scaled results – in terms of GPU nodes and vertical levels – from their work. This is somewhat lower than we expected, but our simulations have to account for the overhead needed for data exchange between GPU and CPU in the course of atmosphere–ocean coupling. Moreover, we could not make use of the Open MPI library in the modular setup, which is estimated to be 15 % faster than ParaStation MPI on JUWELS based on ICON atmosphere-only simulations. This is due to the fact that so far the Intel compiler on JUWELS does not properly support Open MPI, which is our only compiler option for ICON-O. Alternatively, our results can be compared to those of Hohenegger et al. (2023), who present coupled ICON simulations in a model setup (G_AO_5km) equivalent to ours. In contrast to this study, they used CPU nodes only on the DKRZ HPC systems Mistral and Levante. One can compare their numbers to our CPU-only run on JUWELS Cluster, where we achieve 76 SDPD on 860 nodes (of which 780 nodes are used by ICON-A). Throughput is about 35 %–40 % of their results on similar node numbers on Levante CPUs, but those are better performing than JUWELS Cluster CPUs by a factor of 2 to 3, and the exchange overhead between CPU and GPU on different devices additionally needs to be taken into account here.
This work demonstrates the applicability and benefits of the modular supercomputing approach to efficiently run ESMs such as ICON on heterogeneous HPC architectures. In particular, for our test case, a coupled ICON simulation, we found that the modular approach presents an opportunity to obtain a significant reduction in energy consumption of 45 % for running such workloads, while offering comparable levels of runtime performance to standard non-modular supercomputing architectures. It is general understanding that on climate timescales the throughput of an ESM must be greater than 100 SDPD in order to perform meaningful simulations in a reasonable time. Using the JUWELS system, we are already able to exceed this goal with a horizontal resolution of 5 km. Outside the context of this project, ICON-A is already running at a resolution of R2B10 (2.5 km) on JUWELS Booster, occupying a significant portion of its GPU resources. In order to achieve effective ICON-ESM simulations at this or even at R2B11 (1.25 km) resolution, HPC systems in the exaflop range will be needed. EuroHPC and Research Center Jülich will provide such a system – JUPITER – based on the MSA concept by late 2024, and ICON is preparing for the first kilometer-scale coupled climate simulations there.
Through interactions with the developers of large scientific code bases such as ICON it was noted that the porting of scientific code tends to take place in a phased fashion, wherein a subset of the code that is most suited to take advantage of a new hardware platform is ported first, before attempting to port other parts of the source code. This approach is transferable to other multi-physics applications as well. In traditional architectures, one might have to waste hardware resources during development and testing while migrating subsets of a large application such as ICON to a new hardware platform such as a GPU. The modular approach provides developers with more freedom to pick and choose nodes with differing hardware configurations to run subsets of the code during development and testing, which can lead to higher developer productivity and resource efficiency. However, an imported pre-condition to the successful application of the modular approach is that it requires the design of the code itself, and by extension the physical problem that one is trying to simulate, to be modular in nature. Whenever there is a clear separation of concerns, for example in multi-physics simulations such as the ones performed within ICON, the use of modular architectures is natural and expected to provide significant benefits. However, it must be noted that the modular architecture is not a silver bullet that is expected to be beneficial to all types of problems.
In recent years, awareness of responsible energy use has steadily increased. Supercomputing centers are known to be large energy consumers, and there is growing pressure from funding organizations to keep energy costs at a low level. We thus believe that modular supercomputing architecture can play a leading role in running modular workflows like large-scale earth system models efficiently on HPC systems in the near future.
Simulations were done with the ICON branch 2.6.6-rc. This source code and data can be downloaded from the publicly available repository https://doi.org/10.17617/3.4NHKPH (Bishnoi et al., 2023). The ICON model is distributed under an institutional license issued by DWD and under a personal non-commercial research license distributed by MPI-M (https://code.mpimet.mpg.de/projects/iconpublic/wiki/How_to_obtain_the_model_code, last access: 14 August 2023). By downloading the ICON source code, the user accepts the license agreement.
AB prepared and optimized the ICON model for usage with the MSA on the JUWELS system and conducted most of the experiments. OS and RR supported the experiments and contributed with analysis and discussion of the results. CIM designed the experiment setup, analyzed the model results, and prepared Figs. 3–5. LK, HH, and DK are developers of the ICON model and provided expertise on high-resolution modeling and the coupled setup for the MSA. LK was responsible for downloading and preparing input data sets for ICON. NE and ES developed the concept for this study and steered the experiments to study the specifics of the MSA concept on the JUWELS system. AB and OS wrote the manuscript with contributions from all co-authors.
The contact author has declared that none of the authors has any competing interests.
Publisher's note: Copernicus Publications remains neutral with regard to jurisdictional claims made in the text, published maps, institutional affiliations, or any other geographical representation in this paper. While Copernicus Publications makes every effort to include appropriate place names, the final responsibility lies with the authors.
This work was supported by the Helmholtz Association of German Research Centers (HGF) through the Joint Lab Exascale Earth System Modeling (JL-ExaESM) activity and by the AIDAS project of the Forschungszentrum Jülich and CEA. The authors gratefully acknowledge the computing time and storage resources granted through the ESM partition on the supercomputer JUWELS at the Jülich Supercomputing Centre, Forschungszentrum Jülich, Germany. We are thankful to Dmitry Alexeev, NVIDIA, Will Sawyer, CSCS, PRACE project pra127, and the application support and systems operations teams at JSC.
The article processing charges for this open-access publication were covered by the Forschungszentrum Jülich.
This paper was edited by Ludovic Räss and reviewed by two anonymous referees.
Bauer, P., Dueben, P. D., Hoefler, T., Quintino, T., Schulthess, T. C., and Wedi, N. P.: The digital revolution of Earth-system science, Nat. Comput. Sci., 1, 104–113, https://doi.org/10.1038/s43588-021-00023-0, 2021a. a
Bauer, P., Stevens, B., and Hazeleger, W.: A digital twin of Earth for the green transition, Nat. Clim. Change, 11, 80–83, https://doi.org/10.1038/s41558-021-00986-y, 2021b. a
Baumeister, P. F. and Hoffmann, L.: Fast infrared radiative transfer calculations using graphics processing units: JURASSIC-GPU v2.0, Geosci. Model Dev., 15, 1855–1874, https://doi.org/10.5194/gmd-15-1855-2022, 2022. a
Betancourt, C., Stomberg, T. T., Edrich, A.-K., Patnala, A., Schultz, M. G., Roscher, R., Kowalski, J., and Stadtler, S.: Global, high-resolution mapping of tropospheric ozone – explainable machine learning and impact of uncertainties, Geosci. Model Dev., 15, 4331–4354, https://doi.org/10.5194/gmd-15-4331-2022, 2022. a
Bishnoi, A., Stein, O., Meyer, C. I., Redler, R., Eicker, N., Haak, H., Hoffmann, L., Klocke, D., Kornblueh, L., and Suarez, E.: Earth system modeling on Modular Supercomputing Architectures: coupled atmosphere-ocean simulations with ICON 2.6.6-rc, Edmond [code and data set], https://doi.org/10.17617/3.4NHKPH, 2023. a
Bony, S., Stevens, B., Frierson, D. M., Jakob, C., Kageyama, M., Pincus, R., Shepherd, T. G., Sherwood, S. C., Siebesma, A. P., Sobel, A. H., Watanabe, M., and Webb, M. J.: Clouds, circulation and climate sensitivity, Nat. Geosci., 8, 261–268, 2015. a
Christoudias, T., Kirfel, T., Kerkweg, A., Taraborrelli, D., Moulard, G.-E., Raffin, E., Azizi, V., van den Oord, G., and van Werkhoven, B.: GPU Optimizations for Atmospheric Chemical Kinetics, in: The International Conference on High Performance Computing in Asia-Pacific Region, HPC Asia 2021, Association for Computing Machinery, New York, NY, USA, 136–138, ISBN 9781450388429, https://doi.org/10.1145/3432261.3439863, 2021. a
Flato, G. M.: Earth system models: an overview, Wires Clim. Change, 2, 783–800, 2011. a
Giorgetta, M. A., Sawyer, W., Lapillonne, X., Adamidis, P., Alexeev, D., Clément, V., Dietlicher, R., Engels, J. F., Esch, M., Franke, H., Frauen, C., Hannah, W. M., Hillman, B. R., Kornblueh, L., Marti, P., Norman, M. R., Pincus, R., Rast, S., Reinert, D., Schnur, R., Schulzweida, U., and Stevens, B.: The ICON-A model for direct QBO simulations on GPUs (version icon-cscs:baf28a514), Geosci. Model Dev., 15, 6985–7016, https://doi.org/10.5194/gmd-15-6985-2022, 2022. a, b, c, d, e, f
Gong, B., Langguth, M., Ji, Y., Mozaffari, A., Stadtler, S., Mache, K., and Schultz, M. G.: Temperature forecasting by deep learning methods, Geosci. Model Dev., 15, 8931–8956, https://doi.org/10.5194/gmd-15-8931-2022, 2022. a
Hanke, M., Redler, R., Holfeld, T., and Yastremsky, M.: YAC 1.2.0: new aspects for coupling software in Earth system modelling, Geosci. Model Dev., 9, 2755–2769, https://doi.org/10.5194/gmd-9-2755-2016, 2016. a
Hassell, D., Gregory, J., Blower, J., Lawrence, B. N., and Taylor, K. E.: A data model of the Climate and Forecast metadata conventions (CF-1.6) with a software implementation (cf-python v2.1), Geosci. Model Dev., 10, 4619–4646, https://doi.org/10.5194/gmd-10-4619-2017, 2017. a
Hersbach, H., Bell, B., Berrisford, P., Hirahara, S., Horanyi, A., Munoz-Sabater, J., Nicolas, J., Peubey, C., Radu, R., D., S., Simmons, A., Soci, C., Abdalla, S., Abellan, X., Balsamo, G., Bechtold, P., Biavati, G., Bidlot, J., Bonavita, M., De Chiara, G., Dahlgren, P., Dee, D., Diamantakis, M., Dragani, R., Flemming, J., Forbes, R., Fuentes, M., Geer, A., Haimberger, L., Healy, S., Hogan, R. J., Holm, E., Janiskova, M., Keeley, S., Laloyaux, P., Lopez, P., Lupu, C., Radnoti, G., de Rosnay, P., Rozum, I., Vamborg, F., Villaume, S., , and Thépaut, J.-N.: The ERA5 global analysis, Q. J. Roy. Meteor. Soc., 146, 1999–2049, https://doi.org/10.1002/qj.3803, 2020. a
Herten, A.: JUWELS Booster – Early User Experiences, in: Proceedings of the 2021 on Performance EngineeRing, Modelling, Analysis, and VisualizatiOn STrategy, PERMAVOST '21, Association for Computing Machinery, New York, NY, USA, p. 1, ISBN 9781450383875, https://doi.org/10.1145/3452412.3462752, 2021. a
Hoffmann, L., Baumeister, P. F., Cai, Z., Clemens, J., Griessbach, S., Günther, G., Heng, Y., Liu, M., Haghighi Mood, K., Stein, O., Thomas, N., Vogel, B., Wu, X., and Zou, L.: Massive-Parallel Trajectory Calculations version 2.2 (MPTRAC-2.2): Lagrangian transport simulations on graphics processing units (GPUs), Geosci. Model Dev., 15, 2731–2762, https://doi.org/10.5194/gmd-15-2731-2022, 2022. a
Hohenegger, C., Korn, P., Linardakis, L., Redler, R., Schnur, R., Adamidis, P., Bao, J., Bastin, S., Behravesh, M., Bergemann, M., Biercamp, J., Bockelmann, H., Brokopf, R., Brüggemann, N., Casaroli, L., Chegini, F., Datseris, G., Esch, M., George, G., Giorgetta, M., Gutjahr, O., Haak, H., Hanke, M., Ilyina, T., Jahns, T., Jungclaus, J., Kern, M., Klocke, D., Kluft, L., Kölling, T., Kornblueh, L., Kosukhin, S., Kroll, C., Lee, J., Mauritsen, T., Mehlmann, C., Mieslinger, T., Naumann, A. K., Paccini, L., Peinado, A., Praturi, D. S., Putrasahan, D., Rast, S., Riddick, T., Roeber, N., Schmidt, H., Schulzweida, U., Schütte, F., Segura, H., Shevchenko, R., Singh, V., Specht, M., Stephan, C. C., von Storch, J.-S., Vogel, R., Wengel, C., Winkler, M., Ziemen, F., Marotzke, J., and Stevens, B.: ICON-Sapphire: simulating the components of the Earth system and their interactions at kilometer and subkilometer scales, Geosci. Model Dev., 16, 779–811, https://doi.org/10.5194/gmd-16-779-2023, 2023. a, b, c, d, e, f, g, h
Hokkanen, J., Kollet, S., Kraus, J., Herten, A., Hrywniak, M., and Pleiter, D.: Leveraging HPC accelerator architectures with modern techniques – hydrologic modeling on GPUs with ParFlow, Comput. Geosci., 25, 1579–1590, https://doi.org/10.1007/s10596-021-10051-4, 2021. a
Houghton, E.: Climate change 1995: The science of climate change: contribution of working group I to the second assessment report of the Intergovernmental Panel on Climate Change, vol. 2, Cambridge University Press, ISBN-10 0521564336, ISBN-13 978-0521564335, 1996. a
Jiang, J., Lin, P., Wang, J., Liu, H., Chi, X., Hao, H., Wang, Y., Wang, W., and Zhang, L.: Porting LASG/ IAP Climate System Ocean Model to Gpus Using OpenAcc, IEEE Access, 7, 154490–154501, https://doi.org/10.1109/ACCESS.2019.2932443, 2019. a
Jülich Supercomputing Centre: JUWELS: Modular Tier-0/1 Supercomputer at the Jülich Supercomputing Centre, J. Large-Scale Res. Facil., 5, A135, https://doi.org/10.17815/jlsrf-5-171, 2019. a, b
Kesselheim, S., Herten, A., Krajsek, K., Ebert, J., Jitsev, J., Cherti, M., Langguth, M., Gong, B., Stadtler, S., Mozaffari, A., Cavallaro, G., Sedona, R., Schug, A., Strube, A., Kamath, R., Schultz, M. G., Riedel, M., and Lippert, T.: JUWELS Booster – A Supercomputer for Large-Scale AI Research, in: High Performance Computing, edited by: Jagode, H., Anzt, H., Ltaief, H., and Luszczek, P., Springer International Publishing, Cham, 453–468, ISBN 978-3-030-90539-2, 2021. a
Korn, P., Brüggemann, N., Jungclaus, J. H., Lorenz, S. J., Gutjahr, O., Haak, H., Linardakis, L., Mehlmann, C., Mikolajewicz, U., Notz, D., Putrasahan, D. A., Singh, V., von Storch, J.-S., Zhu, X., and Marotzke, J.: ICON-O: The Ocean Component of the ICON Earth System Model–Global Simulation Characteristics and Local Telescoping Capability, J. Adv. Model. Earth Sys., 14, e2021MS002952, https://doi.org/10.1029/2021MS002952, 2022. a, b
Kreuzer, A., Suarez, E., Eicker, N., and Lippert, T. (Eds.): Porting applications to a Modular Supercomputer – Experiences from the DEEP-EST project, vol. 48 of Schriften des Forschungszentrums Jülich IAS Series, Forschungszentrum Jülich GmbH Zentralbibliothek, Verlag, Jülich, ISBN 978-3-95806-590-1, https://juser.fz-juelich.de/record/905738 (last access: 5 January 2024), 2021. a
Lawrence, B. N., Rezny, M., Budich, R., Bauer, P., Behrens, J., Carter, M., Deconinck, W., Ford, R., Maynard, C., Mullerworth, S., Osuna, C., Porter, A., Serradell, K., Valcke, S., Wedi, N., and Wilson, S.: Crossing the chasm: how to develop weather and climate models for next generation computers?, Geosci. Model Dev., 11, 1799–1821, https://doi.org/10.5194/gmd-11-1799-2018, 2018. a
Leuenberger, D., Koller, M., Fuhrer, O., and Schär, C.: A generalization of the SLEVE vertical coordinate, Mon. Weather Rev., 138, 3683–3689, 2010. a
Manabe, S. and Bryan, K.: Climate calculations with a combined ocean-atmosphere model, J. Atmos. Sci, 26, 786–789, 1969. a
ParTec AG: ParaStation Modulo, https://par-tec.com/software/ (last access: 11 April 2023), 2023. a
Prometeus GmbH: Top500 list, http://top500.org (last access: 14 June 2023), 2023. a
Randall, D. A., Bitz, C. M., Danabasoglu, G., Denning, A. S., Gent, P. R., Gettelman, A., Griffies, S. M., Lynch, P., Morrison, H., Pincus, R., and Thuburn, J.: 100 Years of Earth System Model Development, Meteorol. Monogr., 59, 12.1–12.66, https://doi.org/10.1175/AMSMONOGRAPHS-D-18-0018.1, 2018. a
Schär, C., Fuhrer, O., Arteaga, A., Ban, N., Charpilloz, C., Girolamo, S. D., Hentgen, L., Hoefler, T., Lapillonne, X., Leutwyler, D., Osterried, K., Panosetti, D., Rüdisühli, S., Schlemmer, L., Schulthess, T. C., Sprenger, M., Ubbiali, S., and Wernli, H.: Kilometer-Scale Climate Models: Prospects and Challenges, B. Am. Meteorol. Soc., 101, E567–E587, https://doi.org/10.1175/BAMSD-18-0167.1, 2020. a, b
Stevens, B., Acquistapace, C., Hansen, A., Heinze, R., Klinger, C., Klocke, D., Rybka, H., Schubotz, W., Windmiller, J., Adamidis, P., Arka, I., Barlakas, V., Biercamp, J., Brueck, M., Brune, S., Buehler, S. A., Burkhardt, U., Cioni, G., Costa-Suros, M., Crewell, S., Crüger, T., Deneke, H., Friederichs, P., Henken, C. C., Hohenegger, C., Jacob, M., Jakub, F., Kalthoff, N., Köhler, M., van Laar, T. W., Li, P., Löhnert, U., Macke, A., Madenach, N., Mayer, B., Nam, C., Naumann, A. K., Peters, K., Poll, S., Quaas, J., Röber, N., Rochetin, N., Scheck, L., Schemann, V., Schnitt, S., Seifert, A., Senf, F., Shapkalijevski, M., Simmer, C., Singh, S., Sourdeval, O., Spickermann, D., Strandgren, J., Tessiot, O., Vercauteren, N., Vial, J. Voigt, A., and Zängl, G.: The Added Value of Large-eddy and Storm-resolving Models for Simulating Clouds and Precipitation, J. Meteor. Soc. Jpn. Ser. II, 98, 395–435, https://doi.org/10.2151/jmsj.2020-021, 2020. a
Suarez, E., Eicker, N., and Lippert, T.: Supercomputer Evolution at JSC, in: NIC Symposium 2018, vol. 49 of Publication Series of the John von Neumann Institute for Computing (NIC) NIC Series, NIC Symposium 2018, Jülich (Germany), 22–23 February 2018, John von Neumann Institute for Computing, Jülich, 1–12, https://juser.fz-juelich.de/record/844072 (last access: 5 January 2024), 2018. a
Suarez, E., Eicker, N., and Lippert, T.: Modular Supercomputing Architecture: from Idea to Production, vol. 3, CRC Press, FL, USA, 223–251, ISBN 9781138487079, http://hdl.handle.net/2128/22212 (last access: 5 January 2024), 2019. a, b
Trenberth, K. E. and Trenberth, K. E.: Climate system modeling, Cambridge University Press, ISBN-10 0521432316, ISBN-13 978-0521432313, 1992. a
Ummenhofer, C. C. and Meehl, G. A.: Extreme weather and climate events with ecological relevance: a review, Philos. T. Roy. Soc. B, 372, 20160135, https://doi.org/10.1098/rstb.2016.0135, 2017. a
Zängl, G., Reinert, D., Rípodas, P., and Baldauf, M.: The ICON (ICOsahedral Non-hydrostatic) modelling framework of DWD and MPI-M: Description of the non-hydrostatic dynamical core, Q. J. Roy. Meteor. Soc., 141, 563–579, https://doi.org/10.1002/qj.2378, 2015. a, b