the Creative Commons Attribution 4.0 License.
the Creative Commons Attribution 4.0 License.
 | 19 Dec 2023
The Southern Ocean Freshwater Input from Antarctica (SOFIA) Initiative: scientific objectives and experimental design
Neil C. Swart
Torge Martin
Rebecca Beadling
Jia-Jia Chen
Christopher Danek
Matthew H. England
Riccardo Farneti
Stephen M. Griffies
Tore Hattermann
Judith Hauck
F. Alexander Haumann
André Jüling
Qian Li
John Marshall
Morven Muilwijk
Andrew G. Pauling
Ariaan Purich
Inga J. Smith
Max Thomas
As the climate warms, the grounded ice sheet and floating ice shelves surrounding Antarctica are melting and releasing additional freshwater into the Southern Ocean. Nonetheless, almost all existing coupled climate models have fixed ice sheets and lack the physics required to represent the dominant sources of Antarctic melt. These missing ice dynamics represent a key uncertainty that is typically unaccounted for in current global climate change projections. Previous modelling studies that have imposed additional Antarctic meltwater have demonstrated regional impacts on Southern Ocean stratification, circulation, and sea ice, as well as remote changes in atmospheric circulation, tropical precipitation, and global temperature. However, these previous studies have used widely varying rates of freshwater forcing, have been conducted using different climate models and configurations, and have reached differing conclusions on the magnitude of meltwater–climate feedbacks. The Southern Ocean Freshwater Input from Antarctica (SOFIA) initiative brings together a team of scientists to quantify the climate system response to Antarctic meltwater input along with key aspects of the uncertainty. In this paper, we summarize the state of knowledge on meltwater discharge from the Antarctic ice sheet and ice shelves to the Southern Ocean and explain the scientific objectives of our initiative. We propose a series of coupled and ocean–sea ice model experiments, including idealized meltwater experiments, historical experiments with observationally consistent meltwater input, and future scenarios driven by meltwater inputs derived from stand-alone ice sheet models. Through coordinating a multi-model ensemble of simulations using a common experimental design, open data archiving, and facilitating scientific collaboration, SOFIA aims to move the community toward better constraining our understanding of the climate system response to Antarctic melt.
- Article
(1376 KB) - Full-text XML
- BibTeX
- EndNote


As the largest relative contributor to the oceanic sink of both anthropogenic heat and carbon, processes at work in the Southern Ocean directly modulate the rate of global change (Roemmich et al., 2015; Khatiwala et al., 2009; Frölicher et al., 2015; Gruber et al., 2019; Meredith et al., 2019). The Southern Ocean also exerts a direct influence on sea level rise, as interactions with the warming ocean are the primary driver of the observed melting of ice shelves around West Antarctica that in turn leads to mass loss from the grounded Antarctic ice sheet (AIS) (Fox-Kemper et al., 2021; DeConto and Pollard, 2016; Pritchard et al., 2012). Observations over recent decades show that mass loss from Antarctica is accelerating in regions of rapid ice shelf melt (Shepherd et al., 2018; Rignot et al., 2019). Standalone ice sheet models project that this mass loss will continue to accelerate in the future, with the resulting freshwater input to the Southern Ocean becoming a primary contributor to global sea level rise in coming decades and centuries (Fox-Kemper et al., 2021). This freshwater input from melting of the grounded ice sheet and the fringing floating ice shelves is expected to have significant impacts that feedback onto the global climate system and influence the trajectory of global climate change (Fyke et al., 2018; Bronselaer et al., 2018; Golledge et al., 2019; Sadai et al., 2020; Dong et al., 2022). However, interactive ice sheets and shelves have generally not been included in coupled climate model simulations, including those used in the latest generation of the Coupled Model Intercomparison Project (CMIP6; Eyring et al., 2016). Thus, any feedbacks between ice sheets, ice shelves, and the global climate system are unaccounted for in CMIP6. This lack of inclusion of ice–climate feedbacks in CMIP coupled climate simulations represents a major source of uncertainty in future climate projections (Fyke et al., 2018; Bronselaer et al., 2018; Golledge et al., 2019; Sadai et al., 2020).
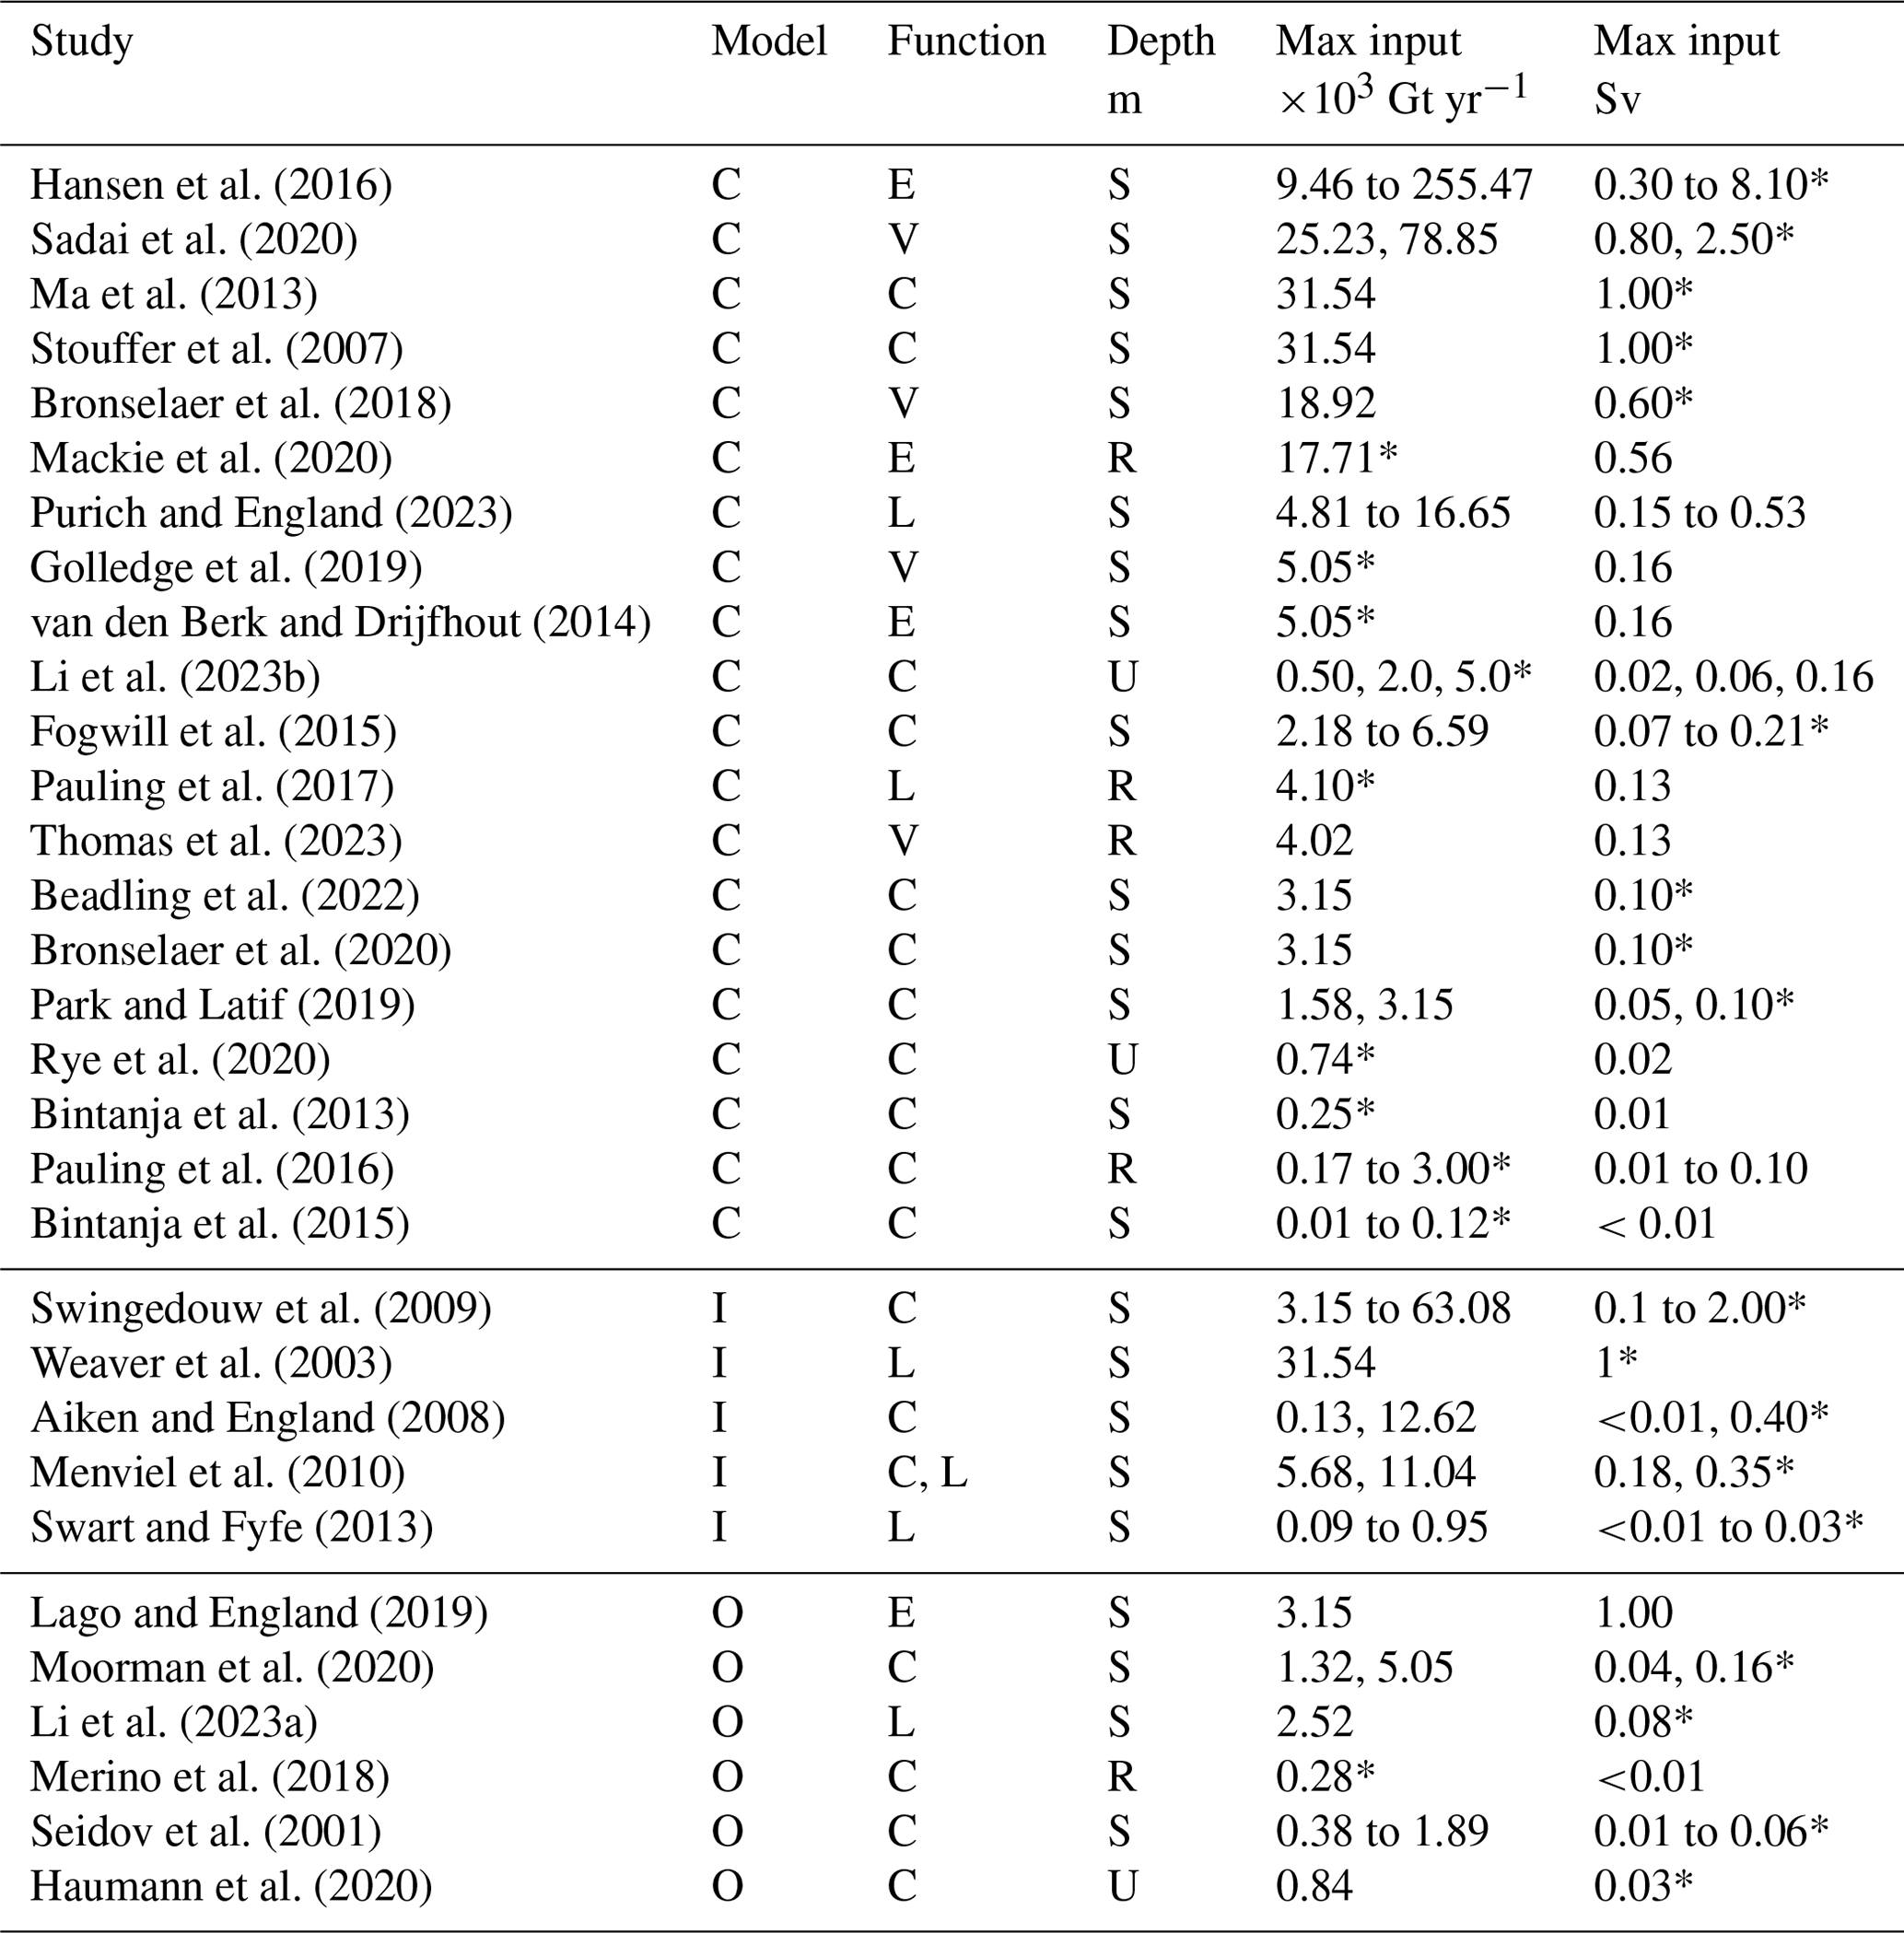
Previous studies have attempted to quantify the impacts of Antarctic meltwater on the global climate system through the use of idealized freshwater perturbation experiments in which additional freshwater is imposed in a coupled climate model or ocean–sea ice simulation (Table 1). However, these previous studies have used widely varying experimental designs, including differing magnitudes and spatiotemporal distributions of freshwater forcing, and differing methods to impose freshwater and heat fluxes associated with the melting ice. These studies have also been conducted using various model configurations including intermediate-complexity models, CMIP-class coupled atmosphere–ocean models with varying horizontal resolutions (typically 1∘), and finer-resolution ocean–sea ice simulations (<0.25∘). The results have revealed some model responses that appear to be qualitatively robust to additional freshening in the Southern Ocean, such as cooling of Southern Hemisphere sea surface and surface air temperatures, Antarctic sea ice expansion, accumulation of oceanic heat at depth, and a reduction in Antarctic Bottom Water (AABW) formation. However, these studies often disagree on the magnitude of the response and in some cases have reached opposing conclusions, for example regarding subsurface thermal changes on the continental shelf (Beadling et al., 2022; Bronselaer et al., 2018; Moorman et al., 2020; Thomas et al., 2023) and the magnitude of the meltwater impact on historical sea ice trends (e.g. Bintanja et al., 2013; Swart and Fyfe, 2013; Pauling et al., 2016).
Hansen et al. (2016)Sadai et al. (2020)Ma et al. (2013)Stouffer et al. (2007)Bronselaer et al. (2018)Mackie et al. (2020)Purich and England (2023)Golledge et al. (2019)van den Berk and Drijfhout (2014)Li et al. (2023b)Fogwill et al. (2015)Pauling et al. (2017)Thomas et al. (2023)Beadling et al. (2022)Bronselaer et al. (2020)Park and Latif (2019)Rye et al. (2020)Bintanja et al. (2013)Pauling et al. (2016)Bintanja et al. (2015)Swingedouw et al. (2009)Weaver et al. (2003)Aiken and England (2008)Menviel et al. (2010)Swart and Fyfe (2013)Lago and England (2019)Moorman et al. (2020)Li et al. (2023a)Merino et al. (2018)Seidov et al. (2001)Haumann et al. (2020)Table 1Survey of recent studies inserting freshwater forcing into coupled or ocean-only models. Model refers to atmosphere–ocean coupled (C), intermediate-complexity (I), or ocean-only (O) models. Function is the freshwater forcing function with time, either constant (C), linear (L), exponential (E), or variable (V). Depth is the depth of freshwater input being at the surface (S; <50 m), with a uniform distribution (U) or a realistic distribution (R), and the maximum freshwater input applied in the study is given in both Gt yr−1 and Sv. Where values were not clear, they were left blank. The list of studies in this table is not exhaustive but covers the range of forcing used in previous work. The value marked with an asterisk (*) was derived from the literature, and the other value was computed using 1 Sv = 3.154×10⁴ Gt yr−1, and all are reported to two places to facilitate comparison.
The inconsistency in experimental design across previous studies inhibits our ability to constrain the climate impacts of Antarctic mass loss and the uncertainties associated with not accounting for this forcing in climate projections. Since virtually all existing Southern Ocean hosing experiments have each used only a single model, the role of model uncertainty in response to freshwater is unknown. Understanding the climate system feedbacks to meltwater is important context as coupled climate models evolve to include more comprehensive representations of ice sheet–ocean interactions (e.g. Fyke et al., 2018; Siahaan et al., 2022; Smith et al., 2021). Understanding the future evolution of the real climate system and its impact on society requires better quantification of the important feedbacks associated with meltwater-derived freshwater input to the ocean (e.g. Fyke et al., 2018; Bronselaer et al., 2018; Sadai et al., 2020; Golledge et al., 2019). A large body of ice sheet modelling literature exists that explores the response and feedbacks of ice sheet dynamics to changing climate, such as the Ice Sheet Model Intercomparison Project (Nowicki et al., 2016) or the Marine Ice Sheet–Ocean Model Intercomparison Project (Asay-Davis et al., 2016). However, there has not yet been a comprehensive effort to assess the response in other components of the climate system to ice sheet driven freshwater input from Antarctica (i.e. ocean, sea ice, and atmospheric changes) and particularly the role of model uncertainty in that response.
The SOFIA initiative aims to advance our understanding of the climate response to Antarctic freshwater input through coordinating a model intercomparison and by facilitating open and collaborative research. This effort builds off of established model intercomparison projects (MIPs), including the Flux-Anomaly-Forced Model Intercomparison Project (Gregory et al., 2016), that are designed to document the climate system response to specific forcings across an ensemble of models. Here, we summarize the state of knowledge on meltwater discharge from the Antarctic ice sheet and ice shelves to the Southern Ocean, explain the key scientific objectives of our initiative, and describe the design of a coordinated set of experiments that allows the consistent quantification of the impact of Antarctic meltwater on climate simulations across multiple models and some key uncertainties.
This section provides an overview of ice mass balance in the observations and in coupled models, as well as projections of future changes in mass balance. The goal of this section is to provide context for scientific objectives and experiments proposed by SOFIA in the following sections.
2.1 The observed mass balance
Pauling et al. (2016) provide a detailed explanation of the Antarctic ice mass budget as it relates to freshwater forcing supplied to the ocean, which we briefly summarize here. The total budget comprises two components: the first is for the grounded ice mass (M) and the second for the floating ice shelves (m). Only the grounded ice is relevant to sea level rise. In steady state, the total grounded ice mass budget represents a balance between surface mass transports () and mass transports across the grounding line () meaning that the general mass imbalance is as follows ( would equal zero; Fig. 1a):
where positive tendencies lead to mass gain for the ice sheet. Runoff is considered a result of the local surface mass balance and thus already lost to the ice sheet mass. In a changing climate, the grounded mass can be altered via changes in the surface mass balance or via changes in transport across the grounding line. Observations suggest that the grounded ice sheet has lost a total of 2720±1390 Gt between 1992 and 2017 (Shepherd et al., 2018). This mass loss from the grounded ice sheet is rapidly accelerating, increasing from 49±67 Gt yr−1 over 1992 to 1997 to 219±43 Gt yr−1 over 2012 to 2017 (Shepherd et al., 2018).
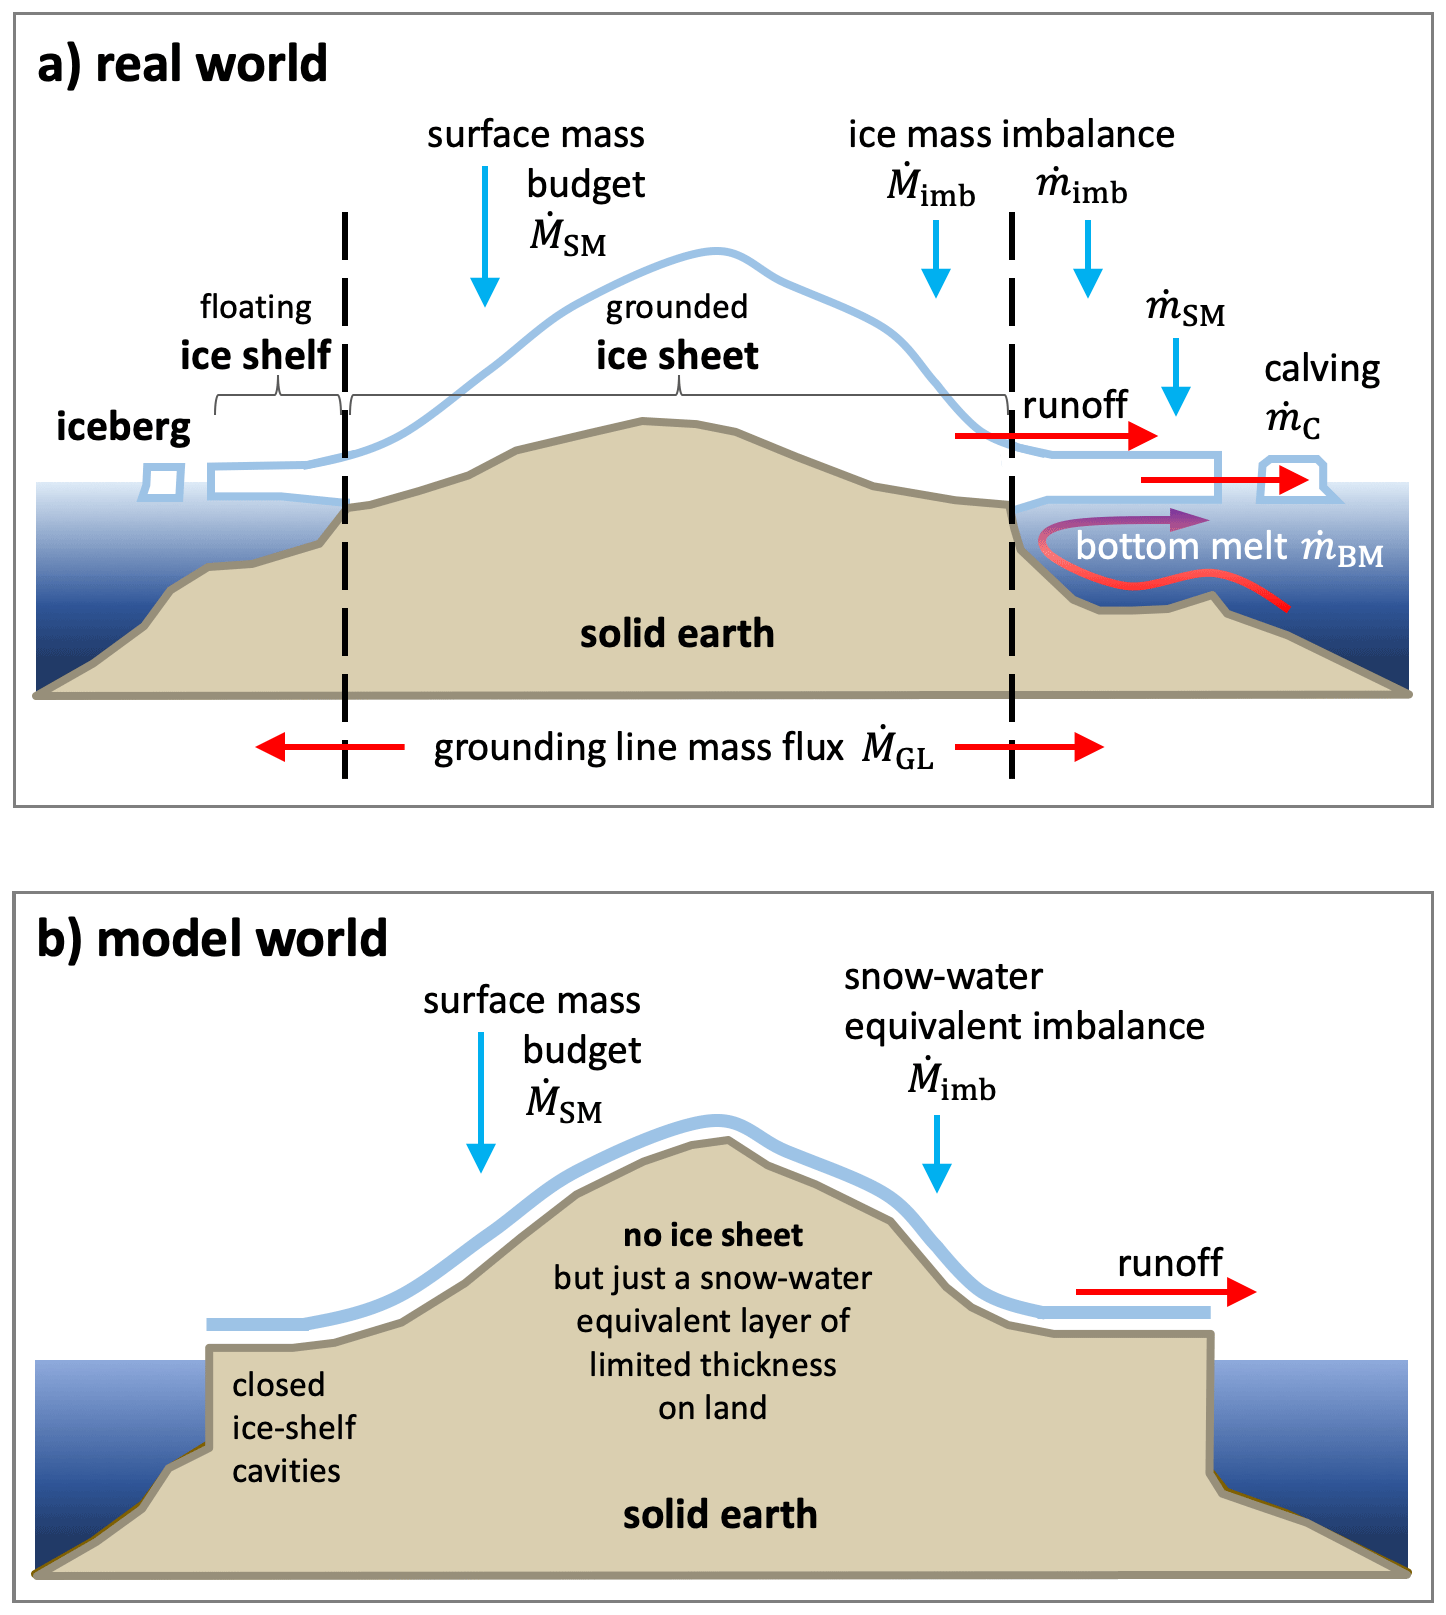
Figure 1A schematic showing the key components of the Antarctic ice mass budget in (a) the real world and (b) the representation of the budget in typical CMIP6-class coupled climate models. In reality, the total ice mass consists of grounded ice (M) and floating ice shelves (m). Mass change over time is noted as or and considered positive for mass gain. Red arrows indicate transport directions associated with a negative sign in the respective mass budget. In contrast, most models only consider a snow–water equivalent layer of limited mass Mswe for surface mass balance and runoff calculations. Some models distinguish between liquid and solid runoff (snow), albeit with the latter often denoted as discharge. After Pauling et al. (2016), their Fig. 1.
The second component of the mass budget is associated with floating ice shelves (Fig. 1a). The ice shelves receive mass from the grounded ice via transport across the grounding line (), exchange mass with the atmosphere via their surface (), and lose mass via basal melt () and calving of icebergs ().
Here, the grounding line transport is considered negative in the predominant case of ice sheet mass loss and ice shelf mass gain. Climatologically, calving and basal melt are roughly equivalent in magnitude (Rignot et al., 2013; Depoorter et al., 2013; Greene et al., 2022). It is important to note that while changes in the mass balance of floating ice shelves do not affect sea level rise directly, they do affect the liquid freshwater input to the Southern Ocean and thus ocean circulation and climate. Furthermore, through their mechanical coupling to the grounded ice (buttressing), ice shelf thinning is believed to accelerate the mass transport across the grounding line (Reese et al., 2018). Observational studies show that overall the Antarctic ice shelves have been losing mass since the early 1990s when suitable satellite observations began (Adusumilli et al., 2020; Paolo et al., 2015; Rignot et al., 2013; Shepherd et al., 2010). Paolo et al. (2015) found mass loss due to ice shelf thinning by basal melt was small between 1994 and 2003 but increased to 288±69 Gt yr−1 (∼0.009 Sv) between 2003 and 2012. More recent satellite data revealed that mass loss from the ice shelves due to basal melt slowed down in the 2010s relative to the previous decade and that the excess meltwater transport over the longer period 1994 to 2018 was about 161±147 Gt yr−1 (∼0.005 Sv) (Adusumilli et al., 2020; Slater et al., 2021). Net mass loss due to calving has increased in recent decades, reaching 250±68 Gt yr−1 in the 2010s (Slater et al., 2021).
To estimate the additional freshwater input to the Southern Ocean, the net mass loss from grounded ice and floating ice shelves has to be added. For the decade of the 2010s, Slater et al. (2021) give a total mass loss rate of 509±186 Gt yr−1 (0.017±0.006 Sv; see Fig. A1b). Summing the grounded and floating ice shelf numbers of Shepherd et al. (2018) and Greene et al. (2022) provides a comparable estimate. This additional freshwater transport entering the Southern Ocean over recent decades can be regarded as the transport that is unaccounted for by CMIP6 models, assuming approximate mass balance before this time (Pauling et al., 2016, see below). We use these numbers to inform the freshwater input in our historical experiments described in Sect. A4.3. Note that the time at which the net ice mass balance left its presumable pre-industrial steady state and mass loss began is not precisely known. In addition, the influence of long-term natural variability in the observed estimates is also not known, but it likely contributes to, for example, differences in reported ice shelf thinning (Adusumilli et al., 2020; Paolo et al., 2015). From trends in available observations and the rate of known anthropogenic warming in the climate system, we infer that forced net mass loss around Antarctica before 1970 was likely negligible.
2.2 Antarctic meltwater discharge in coupled climate models
Coupled climate models represent many significant sources of freshwater forcing to the Southern Ocean, including that from net precipitation (precipitation–evaporation; P-E), surface runoff (R), and in some configurations iceberg calving (typically with a fixed, prescribed calving flux). Some models distinguish between liquid and solid (snow) runoff where the latter could serve as input mass transport to an interactive iceberg module (Martin and Adcroft, 2010). There is also freshwater redistribution via sea ice formation, transport and melt, with dynamic–thermodynamic interactive sea ice components being state-of-the-art examples in such models. In a limited number of dedicated studies, interactive ice sheet components fully coupled to atmosphere–ocean climate models have been applied for Greenland (e.g. Vizcaino et al., 2015; Muntjewerf et al., 2020) and Antarctica (e.g. Siahaan et al., 2022). However, due to their large computational expense, long timescales, and sensitivity to background climate, fully interactive ice sheet and ice shelf components, or even ice shelf cavities for the surrounding ocean, have generally not been included in coupled climate models, particularly those participating in CMIP6 (Fox-Kemper et al., 2021).
In these CMIP-class coupled models, ice sheet coverage is typically prescribed as fixed, with any imbalances in surface mass balance carried to the ocean via runoff, although the exact details vary (see Fig. 1b; e.g. Pauling et al., 2016; Swart et al., 2019). This runoff implicitly represents the calving and basal melt transport, which balances the accumulation of ice mass over land resulting from positive net precipitation (some models have explicit calving instead of pure runoff). The instantaneous runoff may respond to future changes in surface mass balance on timescales very different from those of the real ice sheet. In fact, liquid runoff from the Antarctic ice sheet is insignificant (due to low atmospheric temperatures year-round), while most of the snow that is deposited will remain on the continent for centuries or even millennia and become part of the glaciological cycle, before being discharged at the coast. Interactions between the Antarctic ice sheet and the ocean and dynamical ice sheet changes remain unaccounted for despite these processes being the primary drivers of Antarctic mass loss in the real world (Fox-Kemper et al., 2021; Shepherd et al., 2018). For example, increasing basal melt and acceleration of mass transport across the grounding line are not represented in CMIP6 models. Owing to their highly simplified ice sheet physics, CMIP6 class climate models are thus missing an important feedback associated with the growing source of meltwater input into the Southern Ocean. The SOFIA project aims to systematically test the climate effect of including this missing freshwater forcing using the coordinated experiments described in Sect. A below.
2.3 Projected changes in future ice sheet mass
Integrating ice sheet models directly into coupled climate simulations is challenging; hence, the primary approach to date has been to take ocean and atmospheric climate fields from climate models and using these to force stand-alone ice sheet models to produce future projections of ice mass (Seroussi et al., 2020; DeConto and Pollard, 2016), in some cases allowing for an offline single-step coupling back to the ocean (Golledge et al., 2019) to explore feedback between the ice sheet and the climate system or in some very recent studies using full inline coupling between the ice sheet and climate models (Siahaan et al., 2022; Park et al., 2023).
The magnitude of future mass loss projected by ice sheet models is highly uncertain, due to both uncertainties in the input climate scenarios and potential dynamic instabilities in the ice sheet response to this forcing (Fox-Kemper et al., 2021; Edwards et al., 2021; Seroussi et al., 2020; Edwards et al., 2019; DeConto and Pollard, 2016). The latter notably arises from major uncertainties relating to marine ice sheet and ice cliff instability (Fox-Kemper et al., 2021; Edwards et al., 2019). As a result, a large range of excess freshwater input rates have been used in previous coupled modelling studies (Table 1). As increasing Antarctic meltwater enters the Southern Ocean, its potential to feedback onto the global climate system is a compounding uncertainty (Fyke et al., 2018). There are some emerging coupled modelling systems that include key ice sheet processes (e.g. Siahaan et al., 2022; Park et al., 2023), but these are not yet widely employed. The approach we take in Appendix A is to obtain future freshwater forcing from an ensemble of ice sheet models run under two different scenarios spanning the broad uncertainty range in future climate forcing and applying this forcing to coupled climate or ocean/sea-ice models.
This section describes the key scientific objectives of SOFIA and links these objectives to the experiments proposed in Appendix A.
3.1 The climate response to freshwater forcing
A major objective of SOFIA is to quantify the pattern and magnitude of the climate system response to freshwater input associated with melt of the Antarctic ice sheet (see Fig. 2). Previous studies have shown that freshwater input affects ocean stratification and the thermohaline structure; large-scale ocean circulation, including the Antarctic Circumpolar Current (ACC) and the Atlantic Meridional Overturning Circulation (AMOC); and circulation regimes along the Antarctic continental shelves (Li et al., 2023a; Beadling et al., 2022; Mackie et al., 2020; Sadai et al., 2020; Aiken and England, 2008). A key area of scientific interest is the impact of meltwater on sea ice extent and trends, which is an area of particular disagreement in previous literature (Bintanja et al., 2013; Swart and Fyfe, 2013; Pauling et al., 2016, 2017). Furthermore, feedbacks have been hypothesized, where increased meltwater input further enhances on-shore ocean heat transport through different processes in different regions (Hellmer et al., 2017; Hattermann, 2018; Bronselaer et al., 2018) and with impacts on the ice sheet mass loss (Park et al., 2023; Golledge et al., 2019; Timmermann and Goeller, 2017; Naughten et al., 2021). Some of these feedbacks have been assessed more carefully in regional (Jourdain et al., 2017) or process-oriented (Si et al., 2023) contexts, while other studies delineate larger-scale effects (Li et al., 2023b; Hattermann and Levermann, 2010; Wang and Beckmann, 2007). However, a systematic assessment of the response of on-shore heat transport to increased freshwater input from Antarctica across state-of-the-art climate models is still lacking, and is subject to resolution and other uncertainties in the models.
Responses to meltwater input are not confined to the Southern Ocean but are also known to impact, for example, global surface air temperature (Sadai et al., 2020; Mackie et al., 2020; Park and Latif, 2019; Bronselaer et al., 2018; Hansen et al., 2016). Indeed, meltwater addition can reduce the climate sensitivity, making it a key process to include in future climate projections (Dong et al., 2022). Beyond temperatures, meltwater addition can influence precipitation, both regionally and remotely through shifts in the Intertropical Convergence Zone (ITCZ) (Bronselaer et al., 2018; Park and Latif, 2019; Mackie et al., 2020; Sadai et al., 2020). Teleconnections between freshwater-induced Southern Ocean change and remote parts of the climate system are of key interest and can be formed through both oceanic and atmospheric pathways (Dong et al., 2022; Cabré et al., 2017; Ma and Wu, 2011). We also note that while the SOFIA experiments and models are not designed to quantify total eustatic sea-level rise, the meltwater impact on the steric sea level component could be assessed. Southern Ocean freshwater input will also likely have an influence on biological production, ocean carbon uptake, and ocean acidification in this key region that connects the atmosphere to the deep ocean (Frölicher et al., 2015; Marshall and Speer, 2012; Hattermann and Levermann, 2010; Russell et al., 2006; Sarmiento et al., 2004; Toggweiler and Samuels, 1995).
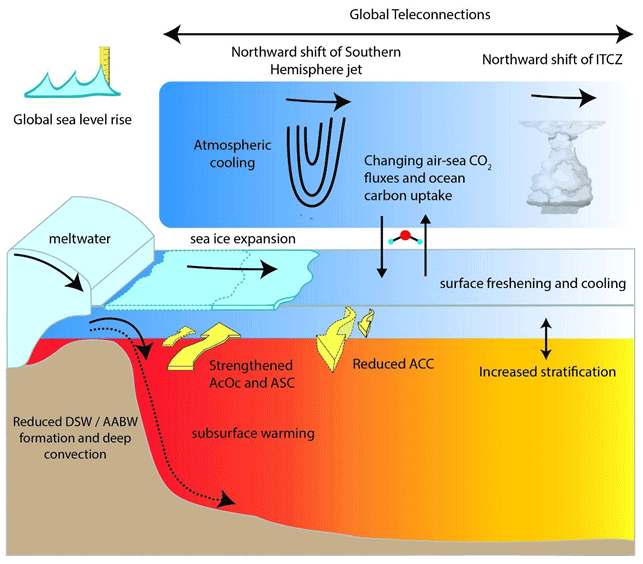
Figure 2A schematic showing the key impacts of Antarctic ice sheet meltwater forcing on the climate system. Relevant changes in ocean circulation are highlighted, including changes in the Antarctic Slope Current (ASC), Antarctic Coastal Current (AcOc), Antarctic Circumpolar Current (ACC), Dense Shelf Water (DSW), and Antarctic Bottom Water (AABW) formation.
The model experiments described in Appendix A are intended to enable quantification of these key impacts of Antarctic meltwater on the climate system. We have structured the experimental design as follows. The idealized tier 1 antwater experiment adds 0.1 Sv of meltwater at the surface evenly around Antarctica and is intended to quantify the basic climate response to meltwater forcing alone. The meltwater impact in the antwater experiment can be derived by comparison with each model's piControl simulation. The tier 2 experiments are designed to test plausible historical and future rates of meltwater input in combination with other climate forcing, such as increasing greenhouse gas concentrations, again using idealized horizontal distributions. We have selected to use plausible rates of meltwater and other climate forcing (as opposed to idealized forcing), as we aim to understand how existing historical simulations and future projections from these coupled models are influenced by the inclusion of meltwater. These tier 2 experiments will be compared with each other and also used in reference to each model's historical or scenario simulations without meltwater. Tier 3 experiments test the sensitivity of the climate response to the distribution of meltwater input and the associated latent heat of melt. Central to the SOFIA effort is improved quantification of key uncertainties in the climate response to Antarctic meltwater forcing, which we expand on more below following the uncertainty breakdown of Hawkins and Sutton (2009).
3.2 Quantifying uncertainty
3.2.1 Model uncertainty
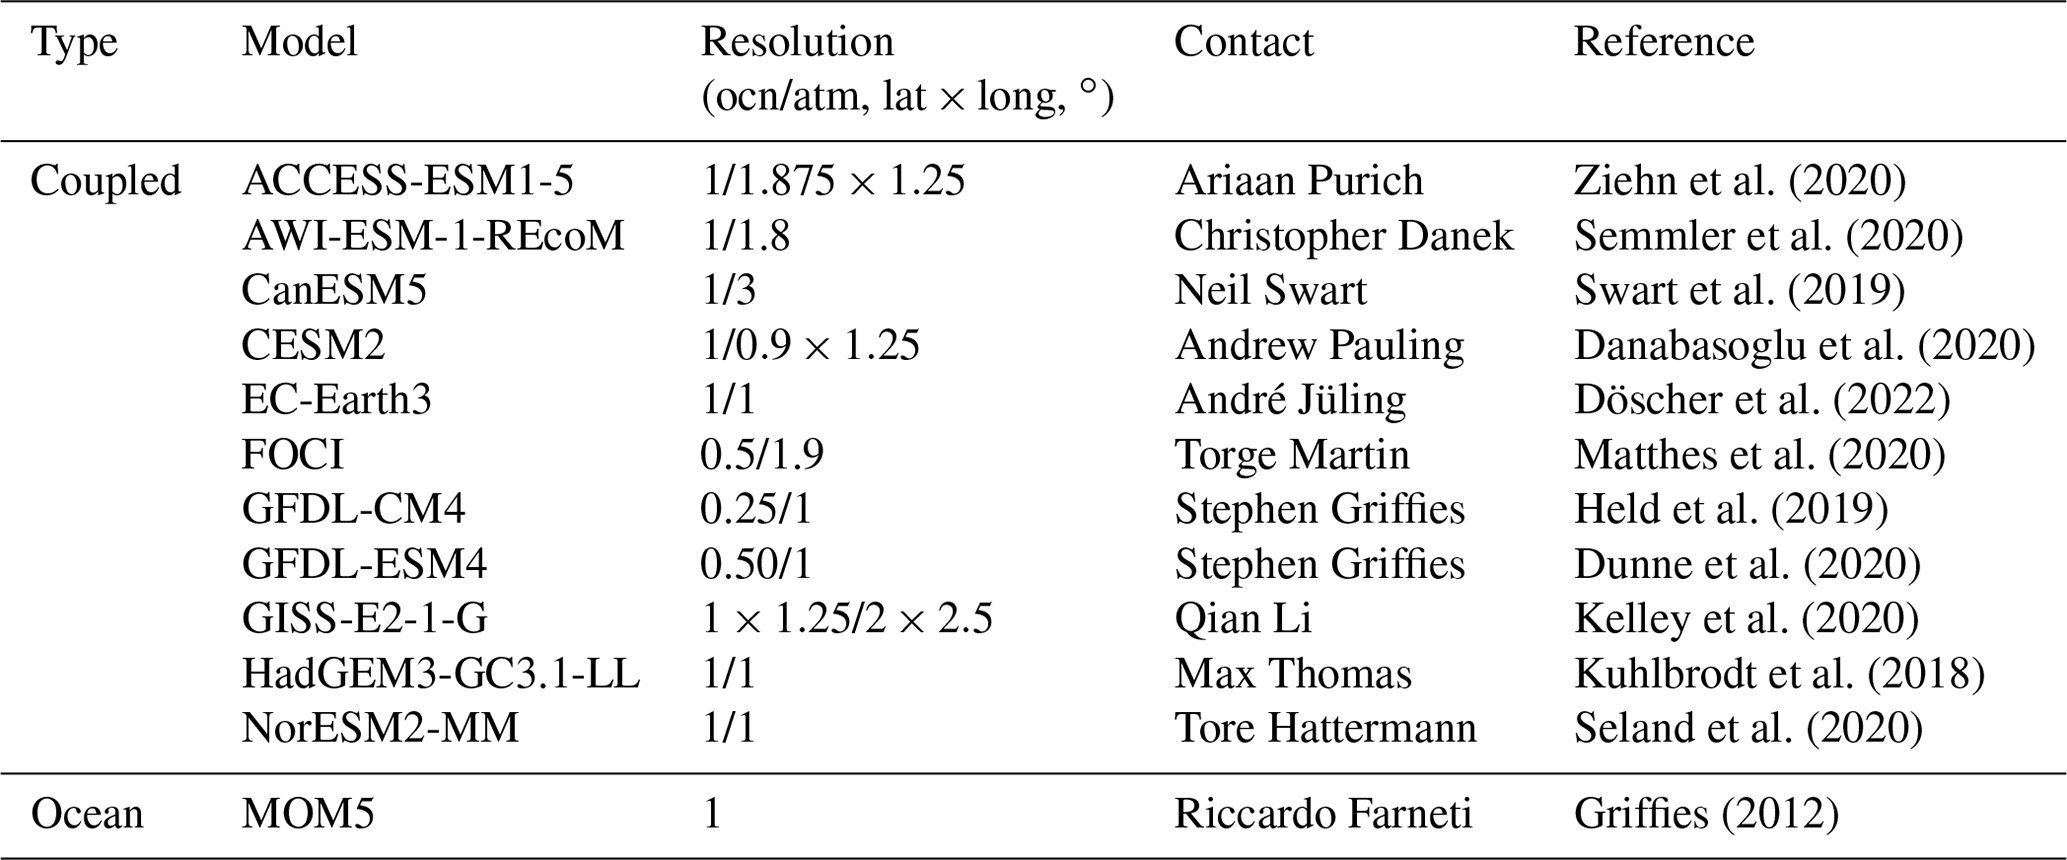
Since virtually all existing Southern Ocean hosing experiments have used only one model each, the role of model uncertainty in response to freshwater is unknown. Running the coordinated suite of simulations proposed by SOFIA across a diversity of models will allow us to address how the response to Southern Ocean freshwater release depends on differing model physics and numerics. The models that have completed the tier 1 experiment at the time of writing are listed in Table 2. We invite additional models to participate, and indeed the intention of this paper is to formalize the experiments to encourage broad and diverse participation.
The models participating so far have differing horizontal and vertical resolutions, ocean vertical coordinates, parameterization schemes to represent sub-grid-scale processes, numerics, and underlying mean state model biases. Of particular relevance is whether models exhibit deep open-ocean convection or not (de Lavergne et al., 2014; Reintges et al., 2017). Other relevant processes that may impact a model's response to Antarctic meltwater include the underlying thermal state and stratification of the Southern Ocean and the mechanisms of dense water formation, such as whether Antarctic Bottom Water (AABW) is formed realistically as Dense Shelf Water (DSW) or though open-ocean convection (Dufour et al., 2017; Lockwood et al., 2021; Mohrmann et al., 2021; Heuzé, 2021). Sampling across a range of models that have different representations of such processes will enable quantification of differing responses to Antarctic meltwater due to model uncertainty.
Ziehn et al. (2020)Semmler et al. (2020)Swart et al. (2019)Danabasoglu et al. (2020)Döscher et al. (2022)Matthes et al. (2020)Held et al. (2019)Dunne et al. (2020)Kelley et al. (2020)Kuhlbrodt et al. (2018)Seland et al. (2020)Griffies (2012)Table 2Models that have submitted data for the SOFIA antwater experiment at the time of writing. Resolution refers to the nominal horizontal resolution of the model component. A contact person for the simulations and model reference paper are also provided.
3.2.2 Internal variability
Internal climate variability is significant in the Southern Ocean and has the potential to influence the climate system response to Antarctic melt (Beadling et al., 2022; Swart and Fyfe, 2013). To quantify the impact of internal variability on the forced response, the experimental design proposed by SOFIA encourages the production of multiple ensemble members. Of particular note are the large, multi-decadal- to centennial-scale oscillations in Southern Ocean properties known to exist in many CMIP-class climate models due to open-ocean deep convective events (Martin et al., 2013; Zanowski and Hallberg, 2017; Zhang et al., 2019; Purich and England, 2021; Behrens et al., 2016). We aim to enable an understanding of how the magnitude and patterns of the forced response depend on the phase of these internal oscillations, with more detailed description for generating the ensemble members given in Appendix A3.
3.2.3 Forcing uncertainty
Section 2 described the uncertainties in both historical and future rates of Antarctic meltwater forcing. In the experimental design described below (Appendix A), we include multiple experiments over the historical period and aim to capture the uncertainty represented in the observational estimate. Similarly, for future projections, we use two scenarios – one with large increases in anthropogenic forcing and meltwater and another with smaller changes to broadly bracket possible future combinations of forcing. There are also uncertainties in both the horizontal and vertical distribution of freshwater input to the ocean, as discussed, for example, in Pauling et al. (2016). We include multiple tier 3 experiments, which test the sensitivity to different vertical and horizontal distributions of freshwater forcing in an idealized way. Whether the latent heat required to melt the ice resulting in freshwater input is extracted from the ocean or not is a further uncertainty (Pauling et al., 2017), and we include tier 3 experiments to test this sensitivity. Finally, because there might be interactions between freshwater forcing and other climate forcings such as greenhouse gases, we aim to test the impact of freshwater forcing both alone (e.g. under piControl conditions) and in combination with other forcings (e.g. under historical and Shared Socioeconomic Pathways (SSP) conditions). We note that our experiments do not comprehensively test all the uncertainties in the meltwater forcing, but they are designed to span the largest known uncertainties at leading order.
Our experiments are best interpreted as tests of the impact of adding meltwater into coupled atmosphere-ocean or ocean only models, and for understanding how excluding this meltwater has influenced existing climate change projections, such as those from CMIP6. When interpreting results from SOFIA, and in particular the tier 2 historical and future scenario simulations, users should bear in mind the idealized nature of the horizontal and vertical distributions of meltwater input and the absence of latent heat of melt associated with this water. While the tier 2 experiments aim to use realistic meltwater inputs, there are large uncertainties in these historical and future meltwater input rates. We encourage users to make use of the various tier 2 and tier 3 experiments that have different magnitudes and distributions of forcing, and the inclusion or not of latent heat of melt, in order to understand the sensitivity of their results to these choices.
Beyond the simplifications in the SOFIA forcing protocol, users of the data should also remain aware of the limitations of the models used to run the experiments. For example, many of the models participating in SOFIA so far are CMIP6-class coupled climate models, that do not directly resolve mesoscale and submesoscale dynamics, the continental slope current, Dense Shelf Water overflows, etc. Nonetheless, such coupled models remain the best available tools for understanding future climate change, including the impact of meltwater that we examine here. Higher-resolution models (particularly ocean-only models) that participate in the future may better resolve these dynamics. Despite the simplification in the meltwater forcing protocol and the limitations of the models, we believe that the SOFIA results can be used to help inform the next generation of Earth system models, as well as helping us to understand the possible impact of meltwater on the real climate system.
The immediate goal of SOFIA is to encourage the participation of a wide and diverse group of models in the experiments described here. The larger and more diverse the participating ensemble, the more robust our quantification of the climate response to freshwater forcing and its uncertainty will be. The initial group of participating models is starting to archive data for the antwater experiment. SOFIA also advances research by facilitating collaboration across an international team of researchers through regular meetings and online communications portals (see https://sofiamip.github.io/, last access: 11 December 2023). A series of analysis papers are being prepared, one on the general climate response to freshwater forcing, and several papers focused on particularly noteworthy aspects of the response, including the effect on deep convection and bottom water formation and Southern Ocean circulation. We anticipate that results from the historical experiments will allow us to study important questions surrounding detection and attribution of climate changes to freshwater forcing, such as for Antarctic sea ice. Through analysis of the SOFIA future scenario runs with freshwater forcing, we aim to quantify the impact of this missing climate feedback in the CMIP6 model projections. Moreover, we aim to provide information for modelling centres trying to determine the relative importance of including ice–ocean interactions in future generations of coupled climate models, such as those being prepared for CMIP7. We invite the broader community to propose additional studies and to make use of the SOFIA data archive (Appendix A6.2) to advance our collective understanding of the role of Antarctic meltwater on the climate system.
A1 Overall philosophy
The experimental suite designed by SOFIA builds off the CMIP6 framework for organizing our experiments and data request (Eyring et al., 2016). A tiered hierarchy of experiments is proposed to allow basic quantification of meltwater impacts in idealized and more realistic settings (Table A1). The idealized experiments provide a low barrier to entry for participants, whereas higher-tier experiments explore more realistic scenarios and sensitivities. In the following sections we provide details on the model setup and realizations, the details of each experiment, and the data request.
Table A1SOFIA experiment name, branch year from the standard CMIP6 run, the amount or increasing rate of freshwater (FW) forcing starting from the branch year, simulation year, and other external forcing. For all experiments, besides where explicitly noted, the freshwater is added in the circumpolar adjacent distribution.
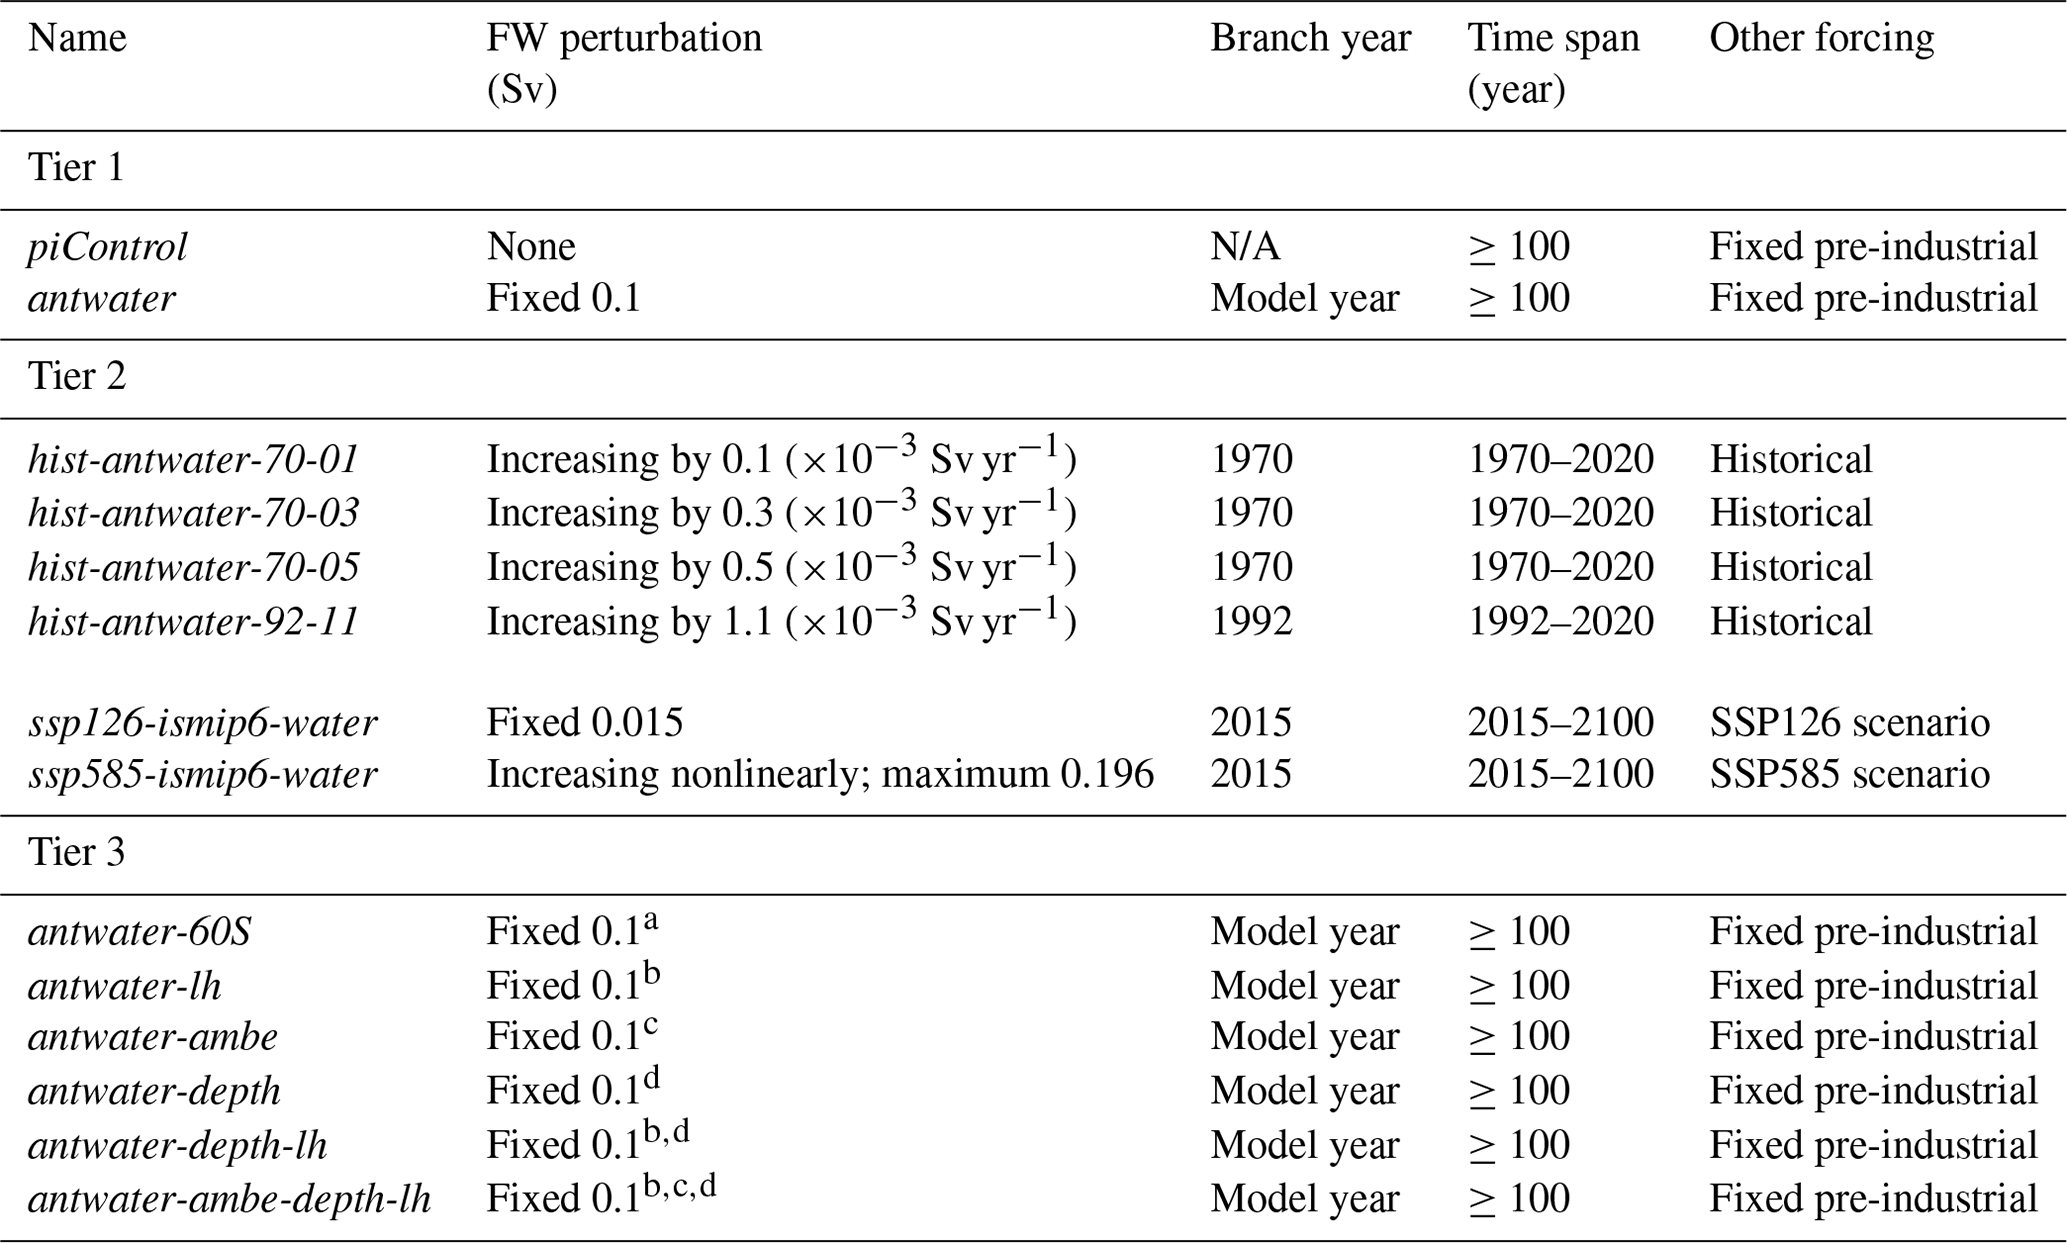
a Freshwater added south of 60∘ S. b Ocean cooling imposed to extract latent heat required to melt equivalent freshwater. c Freshwater added exclusively to the Amundsen and Bellingshausen seas (210 to 290∘ E). d Freshwater added uniformly from the surface to the continental shelf base.
A2 Model configurations and forcings
SOFIA welcomes contributions from fully coupled and ocean–sea ice models. Many of our objectives (Sect. 3) relate to the broader climate system and require coupled atmosphere–ocean models to fully address. However, additional information relating to the ocean response may also be gained by examining the response of forced ocean–sea ice models, as done in the CMIP6 OMIP exercise (Griffies et al., 2016). Models that already include interactive representations of ocean–ice shelf interactions should not be used for SOFIA experiments, as they already include the freshwater forcing that we represent with our protocol.
In all cases, we encourage groups to use well-known and documented versions of their models. In particular, for models that participated in CMIP6, we suggest using the same configuration as used in CMIP6 for SOFIA. The same model configuration should be used for all SOFIA experiments labelled with the same name, with only the forcing changing between experiments (if multiple physical variants are submitted, they should be clearly labelled). The SOFIA experiments build on the protocols for the CMIP6 DECK and ScenarioMIP experiments (Eyring et al., 2016; O'Neill et al., 2016). Besides the specified freshwater flux anomalies, all forcing prescriptions follow the relevant CMIP6 design.
A2.1 Distribution of freshwater anomalies
In the experiments below, three spatial (horizontal) distributions are defined for the implementation of freshwater anomalies. By default, in all tier 1 and tier 2 cases, the freshwater anomaly is applied at the ocean surface, which is equivalent to an adjustment in E-P-R. The Antarctic-adjacent distribution applies the freshwater anomaly directly around the Antarctic coastline (Fig. A1a). For simplicity, the anomalies are by default applied uniformly in the model grid cell immediately adjacent to the Antarctic coast. This means that models with different horizontal resolutions will spread the anomalies over different areas, but the area-integrated anomalies will be the same across models. Models may choose, at their discretion, to distribute the anomalies over a slightly broader area immediately adjacent to the Antarctic coast. However, we recommend all anomalies are constrained within 100 km of the coastline as far as practically possible.
In reality, some meltwater is distributed northward by iceberg transport, and over the observational period most Antarctic mass loss has occurred in the Amundsen region and at depth (Shepherd et al., 2018; Rignot et al., 2019). To examine the impact of the idealized horizontal distribution of freshwater (Antarctic adjacent) and the surface distribution of freshwater anomalies in tier 1 and 2 experiments, additional distributions of freshwater anomalies are proposed in tier 3 experiments. Specifically, we propose a combination of experiments applying freshwater in the grid cells adjacent to the coast in the Amundsen and Bellingshausen seas only, applying vertically distributed freshwater anomalies, and distributing freshwater input uniformly south of 60∘ S (see tier 3 below for details).
A3 Initial conditions and ensemble members
For all experiments, participants are encouraged to run as many ensemble members as they can afford to help quantify internal variability. We identify between 3 and 10 members per model and experiment as likely optimal. For SOFIA experiments that start from the piControl (Table A1), the recommended method for spawning ensemble members is to launch the SOFIA experiments from restarts of substantially different years in the control simulation. Using this macro-initialization approach allows for sampling over decadal or longer timescale ocean variability. Micro-initialization approaches, which typically add round-off-level perturbations to model fields, cannot properly sample over such ocean variability and thus are discouraged. We leave it to each participating model to decide the strategy and restart time spacing to optimally sample variability in their model, factoring in the timescales of the dominant modes of decadal climate variability.
We also invite participating models to submit variants with alternative process representation of their models, using different parameters or parameter tunings, which might reveal different but plausible responses to freshwater input. When using different variants with different model physics, participants need to clearly identify this as a different model configuration in their output. In the CMIP6 naming convention, this is typically done using either a different “source_id” or a different “p” number in the model variant label.
A4 Experiments
Beyond the freshwater forcing, the experimental design below provides details of the forcing to be used in coupled models. Ocean/sea-ice modellers may apply the SOFIA freshwater perturbations in their own forcing frameworks, however, we recommend the CMIP6 OMIP-1 (Griffies et al., 2016) or OMIP-2 (Tsujino et al., 2020) experiment and protocol as a logical common choice for other forcing fields (see Appendix A5).
A4.1 piControl
The piControl simulation provides the model baseline state against which the Antarctic freshwater forcing simulations will be compared. For coupled models, the SOFIA piControl experiment is equivalent to the CMIP6 piControl experiment. For models that participated in CMIP6, the published piControl may be used. If a model has changed its configuration since CMIP6 or did not participate in CMIP6, then it should run a simulation conforming to the CMIP6 piControl experimental design for at least 100 years and preferably 500 or more years.
A4.2 antwater
The aim of the idealized antwater experiment is to assess the climate response to an applied Antarctic freshwater forcing anomaly in the participating models. The antwater experiment is branched off the piControl simulation, with all other forcings the same as in piControl. On top of this, a freshwater flux anomaly is applied at the ocean surface in the Antarctic-adjacent distribution, which when area integrated represents a constant freshwater transport of 0.1 Sv (1 Sv = 3.15×10⁴ Gt yr−1). The simulation is run for a minimum of 100 years. The SOFIA antwater experiment is closely related to the CMIP6 FAFMIP experiment faf-antwater-stress (Gregory et al., 2016). The only difference in SOFIA antwater relative to faf-antwater-stress is that no wind stress anomaly is applied. We note that the perturbation applied in antwater is substantially larger then current observational estimates and the SOFIA historical experiments (Sect. A4.3). However, the magnitude of freshwater forcing in antwater is used to produce a clear signal for the purposes of comparing model responses, is well within the range of previous studies (Table 1), and is comparable to forcing magnitudes expected in the 21st century, such as those in the SOFIA future scenario experiments (Sect. A4.4; Fig. A1c).
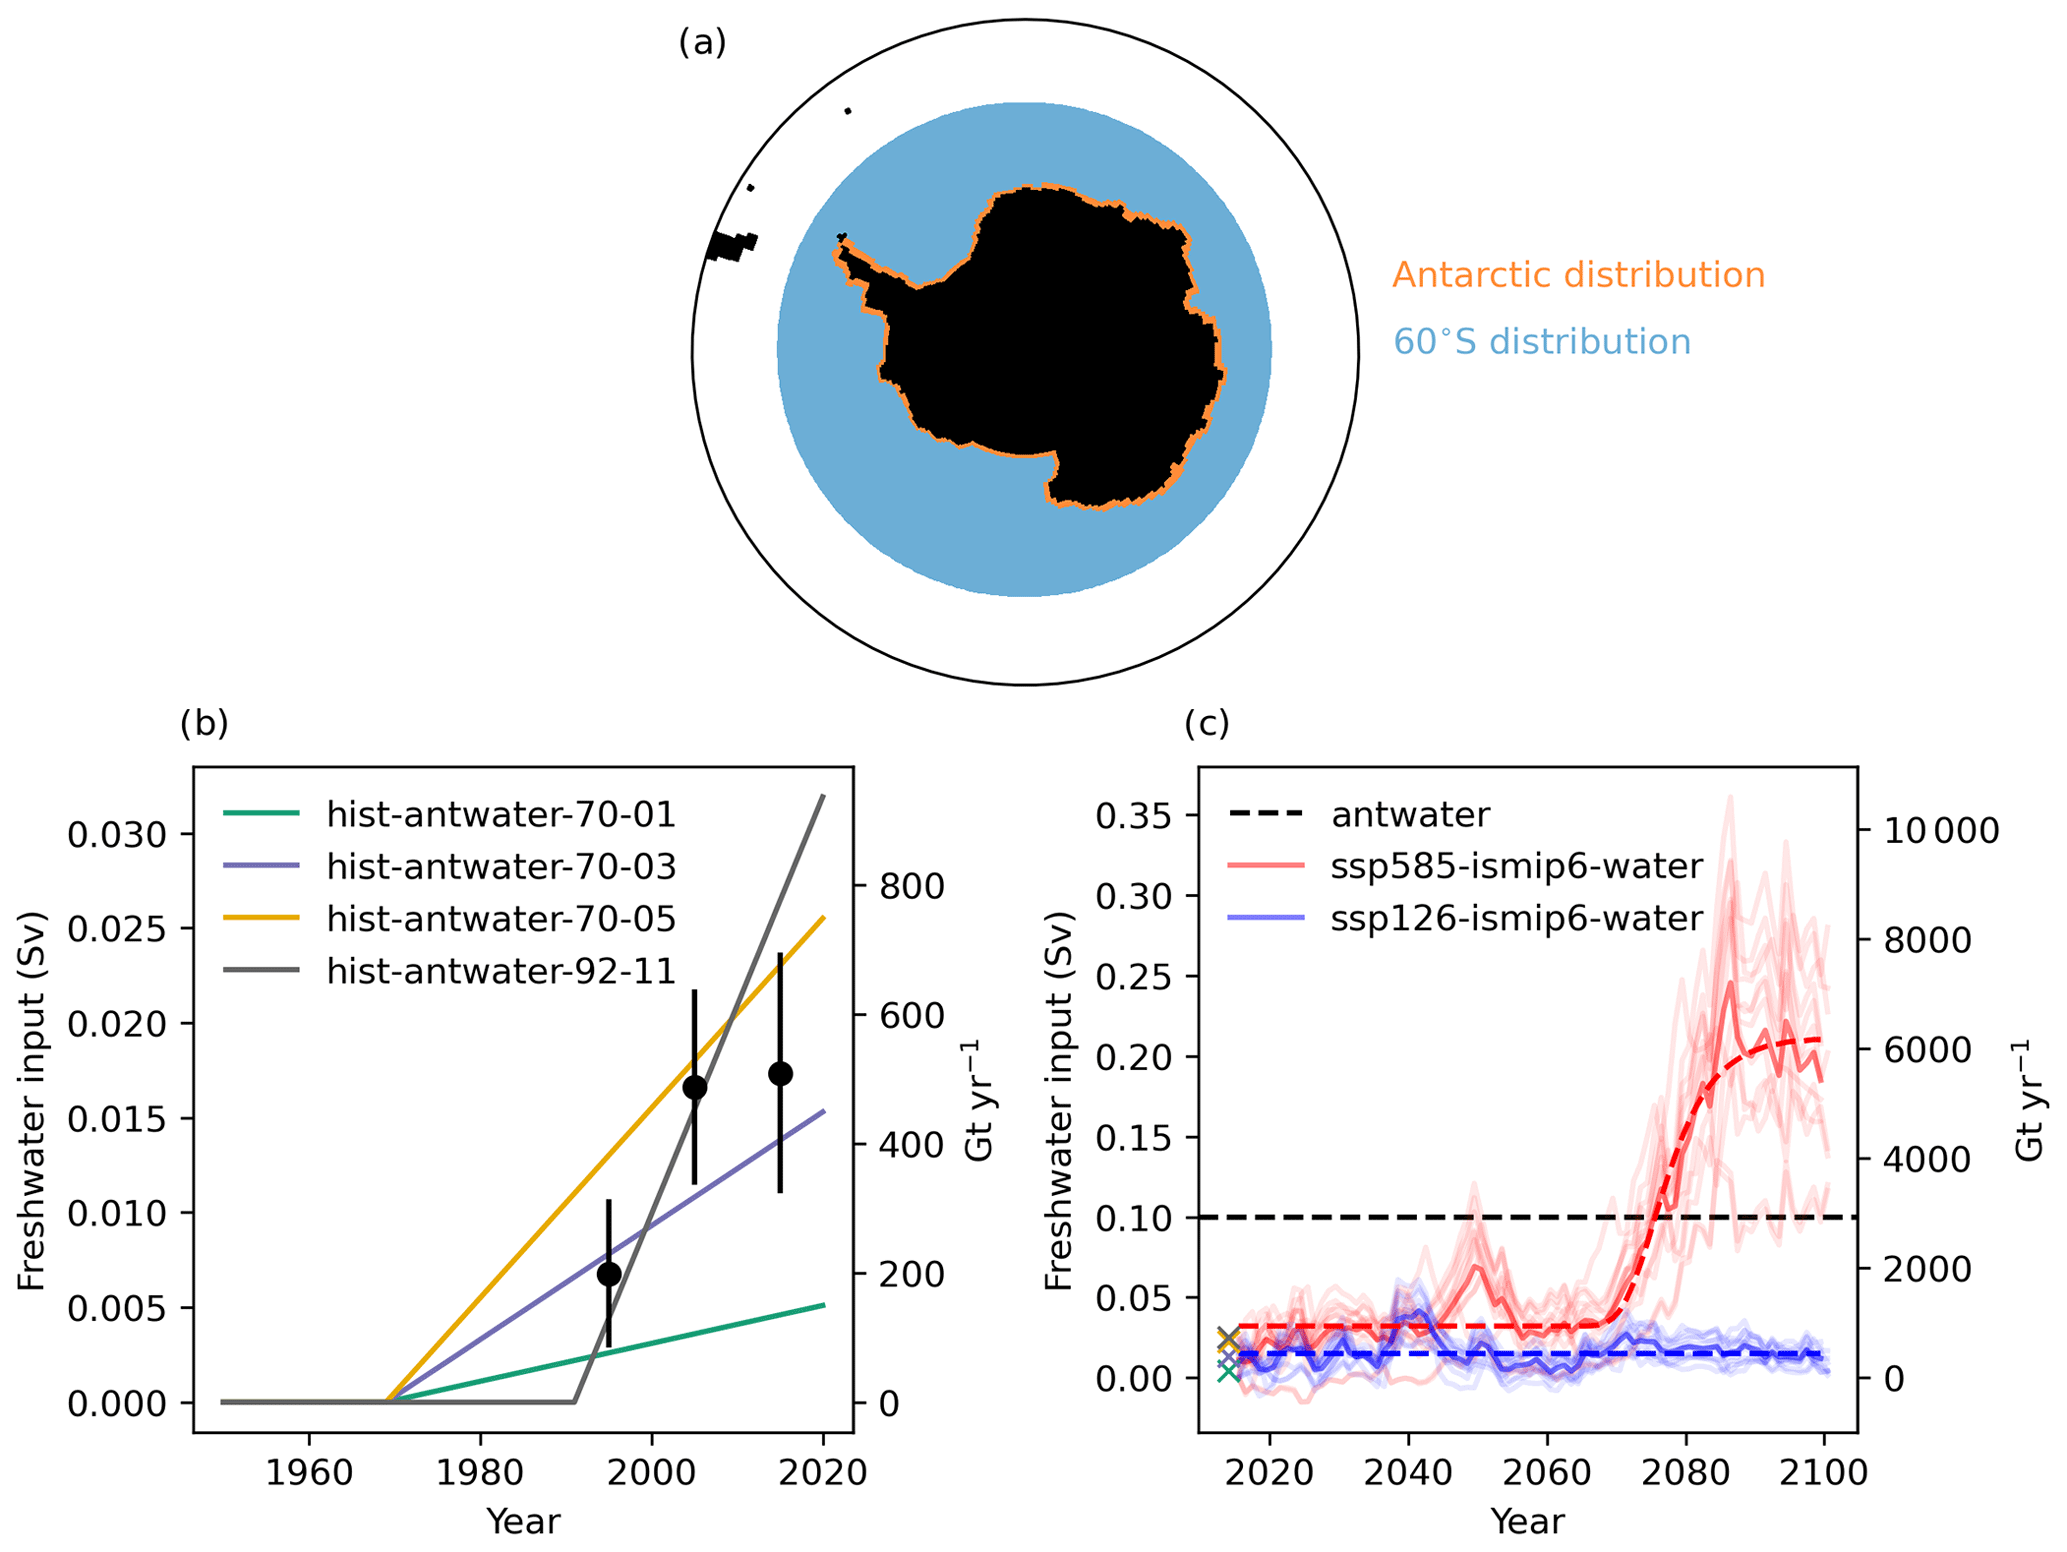
Figure A1SOFIA forcing. (a) The horizontal distribution of freshwater inputs and (b) rate of freshwater input in historical experiments and (c) in future scenario experiments. In (c), the idealized fits to the forcing described in the text are shown as dashed lines, and the rates of input in historical experiments in 2014 are shown by crosses. The lighter red lines show the basal melt rate simulated by individual ISMIP6 models multiplied by to account for calving. In (b) the central black dots and error bars represent the summed ice shelf plus Antarctic grounded ice loss estimates from (Slater et al., 2021). In (b) and (c) we show both units of Gt yr−1 (with lines computed using the equations in the text) and Sv using the conversion 1 Sv = 3.154×10⁴ Gt yr−1.
A4.3 Historical experiments
The aim of the SOFIA hist-antwater simulations is to assess the impact of plausible rates of historical Antarctic freshwater input, in conjunction with and relative to other realistically evolving climate forcings. The hist-antwater experiments are branched off an existing CMIP6 or CMIP6-like historical experiment in the year 1970 or 1992, and run to 2020. A regular historical experiment (without additional freshwater), conforming to the CMIP6 standard, is the reference against which this is to be compared and should be submitted by models that did not publish historical experiment data for CMIP6. We intentionally keep the simulations short to make the experiment more computationally affordable. Two different start dates are used because the exact point at which Antarctic mass loss began is not precisely known, although it was likely weak prior to 1970 and is only observationally constrained since the early 1990s (Sect. 2). All forcings and protocols from the CMIP6 historical experiment apply from January 1970 to December 2014, and from January 2015 to December 2020 the ssp585 forcings are used. Since all forcing scenarios are very similar over 2015 to 2020, which scenario is used is arbitrary, and such extensions are commonly used (e.g. Gillett et al., 2016). Extending the historical experiments to 2020 will allow for a more comprehensive comparison with observations and will provide overlap with the future scenario runs. Models without existing historical simulations can branch off the control experiment in 1850 and run under CMIP6 historical forcings. For ocean and sea ice simulations, participating models can use the JRA55-do surface forcing dataset from 1958 to 2020 following the OMIP-2 framework (Tsujino et al., 2020).
Four separate historical experiments with additional meltwater forcing are proposed to span the uncertainty range in historical freshwater input (Fig. A1b). In each experiment, additional freshwater input before the branch date is zero. From the branch date onwards, a freshwater transport anomaly is applied over the Antarctic-adjacent distribution, with a linearly increasing rate, according to Table A1. The linear rates of increase in Table A1 are given in Sv yr−1, and the intention is that the input would increase linearly over the course of the year, starting on 1 January of the branch year and increasing by the annual increment by 31 December. How exactly modelling centres implement the increase (e.g. as monthly means or at the time step level) could slightly influence the amount of input, but this method-based variance is small compared to the annual amount of freshwater being added. The span of freshwater input magnitudes across the experiments will allow us to quantify how uncertainty in historical rates of ice sheet melt affect the climate response.
In these experiments, the cumulative freshwater input ranges from 4101 Gt in the hist-antwater-70-01 experiment to 20 506 Gt in the hist-antwater-70-05 experiment. In the hist-antwater-92-11 experiment, the cumulative input amounts to 14 587 Gt, and the average transport is 0.0165 Sv (521 Gt yr−1). Both measures in this experiment agree closely with the current best estimate of the observed combined changes in the grounded ice sheet (Shepherd et al., 2018) and the floating ice shelves (Greene et al., 2022) (Sect. 2). The maximum input of about 0.03 Sv by the end of the historical experiment is at the lower end of the maximum input applied in previous modelling experiments (Table 1).
A4.4 Future scenarios
The aim of the SOFIA future scenario simulations is to assess the impact of possible rates of future Antarctic freshwater input in conjunction with and relative to other evolving climate forcings. As climate forcings, we use one low-end (SSP126) and one high-end (SSP585) emission scenario from CMIP6 ScenarioMIP (O'Neill et al., 2016). To these we add freshwater forcing, which is derived from the basal melt rates generated by offline ice sheet models participating in the Ice Sheet Model Intercomparison for CMIP6 (ISMIP6) under the equivalent CMIP5 climate forcings (RCP2.6 and RCP8.5, respectively; Seroussi et al., 2020). Basal melt rates for ISMIP6 were obtained from projected ocean temperatures and time-varying ice geometry, intended to provide boundary conditions for the ice sheet simulations to quantify the mass flux across the grounding line (Jourdain et al., 2020), which is relevant for assessing sea level contributions from Antarctica. Although iceberg calving is a by-product of many of the ISMIP6 models, its reliability was not systematically assessed, and the intercomparison does not make any statements about the partitioning of the total freshwater flux between basal melting and iceberg calving in future scenarios. Hence, to account for additional iceberg calving, we divide the ISMIP6 basal melting rate by a factor of 0.55, following the fraction of basal melt to calving given in Rignot et al. (2013). Our approach is similar to that applied in Thomas et al. (2023).
The SOFIA scenario experiments are branched off a regular CMIP6 or CMIP6-like historical experiment instead of the hist-antwater experiments. Branching from a standard historical run makes the experiments more modular – groups could run only future scenarios if they choose. Further, in the high-end warming scenario (SSP585) the freshwater forcing in the future is considerably stronger than the historical freshwater forcing, implying that starting from a zero freshwater transport anomaly in 2015 is a reasonable approximation given the scale of the future freshwater increase. Figure A1c shows the SOFIA scenario freshwater input rates, along with idealized fits described below.
A4.5 ssp126-ismip6-water
The ssp126-ismip6-water experiment is branched off a CMIP6 or CMIP6-like historical experiment and runs for at least 86 years from 2015 to at least 2100. In coupled models, all forcings and protocols from the CMIP6 ssp126 experiment apply. In addition to this, a freshwater transport anomaly is applied over the Antarctic-adjacent distribution at a rate which is determined from the ensemble mean basal melt rate from ISMIP6 under RCP26 forcing (Seroussi et al., 2020). This rate is then multiplied by to account for calving fluxes, following the basal melt to calving ratios in Rignot et al. (2013). For simplicity, this total forcing can be approximated by a constant input of 0.015 Sv (475 Gt yr−1, Fig. A1c, dashed blue line), which approximately matches the current observed rate (Sect. 2) and the rate of the historical experiments (Sect. A4.3; crosses in Fig. A1c).
A4.6 ssp585-ismip6-water
The ssp585-ismip6-water experiment is branched off a CMIP6 or CMIP6-like historical experiment and runs for 86 years from 2015 to 2100. If possible, we encourage modellers to extend their simulations to 2300, as some impacts of the strong ramp-up in freshwater input in this scenario might have long timescale responses. If extending beyond 2100, all forcings, including freshwater, should be held constant at 2100 levels. In coupled models, all forcings and protocols from the CMIP6 ssp585 experiment apply. In addition to this, a freshwater transport anomaly is applied over the Antarctic-adjacent distribution at a rate which is determined from the ensemble mean basal melt rate from ismip6 under RCP85 forcing. As for ssp126-ismip6-water, this rate is then multiplied by to account for additional calving fluxes.
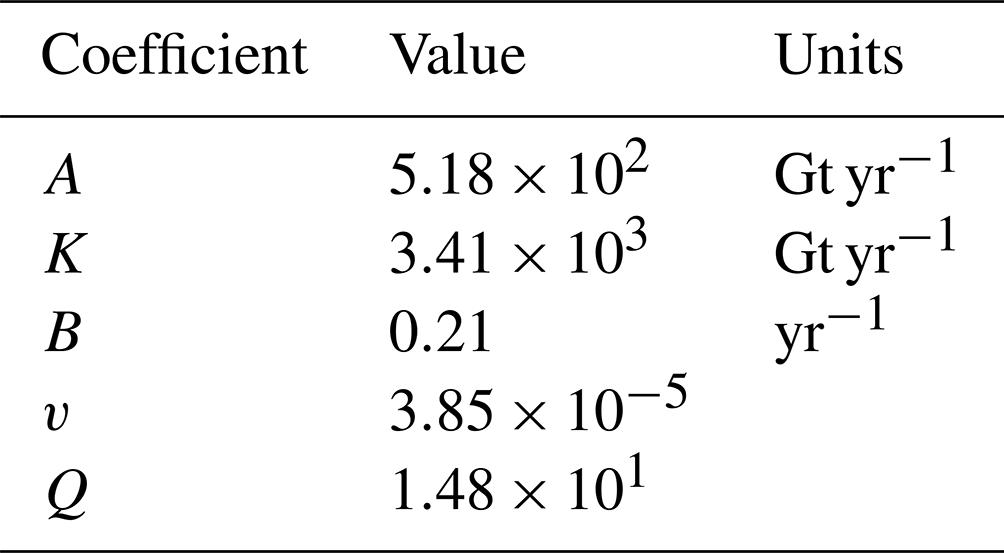
For convenience in applying the forcing in models, we have produced a generalized logistic fit for the total freshwater forcing (Fig. A1c, dashed red line). This fit is given by
where the coefficients are given in Table A2 and t is the number of years since 2015 (with t starting at 0 in 2015).
Table A2Coefficients of the generalized logistic fit from Eq. (A1) to the freshwater forcing to be applied in the SOFIA ssp585-ismip6-water experiment.
All models undertaking the SOFIA scenario simulations should also make available standard CMIP6-conforming ssp126 and ssp585 experiments against which the SOFIA experiments can be compared (again this could be via the CMIP6 data archive for those models who participated).
A4.7 Idealized sensitivity tests
Idealized sensitivity tests are proposed as tier 3 to help with the interpretation of tier 1 and 2 data. The experiments are designed to test the consequences of four key simplifying assumptions in the tier 1 and 2 freshwater distribution: (1) coastal input, (2) surface input, (3) uniform input around the coast, and (4) input without extracting latent heat. These tier 3 experiments require additional technical work to implement and may require significant modifications to the model, particularly for depth distribution changes. Even a small subset of models submitting tier 3 runs would help us to identify the likely consequences of our simplified freshwater input protocol.
A4.8 antwater-60S
The antwater-60S experiment is identical to antwater, except for the horizontal distribution of the freshwater anomalies. In antwater-60S, the freshwater flux anomaly is applied at the ocean surface uniformly south of 60∘ S, with an area-integrated constant rate of 0.1 Sv (blue area in Fig. A1a). Freshwater is added at the surface and latent heat is not extracted. The intention of this experiment is to test the sensitivity of the horizontal distribution of freshwater input, and in particular as a crude representation of the effect that northward distribution by icebergs might have on the climate. It will also facilitate comparison with previous studies using a broader distribution of freshwater (e.g. Ma and Wu, 2011; Stouffer et al., 2007; Seidov et al., 2001; Purich et al., 2018). Subtracting antwater from antwater-60S gives the impact of confining freshwater inputs to the coast.
A4.9 antwater-lh
The antwater-lh experiment is identical to antwater, except that in addition to the freshwater anomaly applied to the ocean surface, the latent heat of melt required to melt 0.1 Sv is also extracted from the ocean surface, uniformly with the Antarctic adjacent distribution. In reality, latent heat is extracted from the ocean to induce basal melt of ice shelves and icebergs; however, this latent heat forcing is often neglected in the literature (Pauling et al., 2016, 2017; Swart and Fyfe, 2013; Bintanja et al., 2013), and indeed in all the experiments described above it has been excluded for simplicity. The aim of this experiment is to quantify the additional effect of including the latent heat of melt on the climate response. We do not include the heat required to bring the ice from its ambient temperature to the freezing point, as this is generally much smaller than the latent heat of melt (Slater et al., 2021). Subtracting antwater from antwater-lh gives the impact of neglecting ocean cooling from latent heat extraction.
A4.10 antwater-ambe
The antwater-ambe experiment is identical to antwater, except that the entire 0.1 Sv perturbation is confined to the Amundsen and Bellingshausen seas (210 to 290∘ E). Freshwater is added at the surface, and latent heat is not extracted. This experiment tests the impact of the lateral distribution of freshwater input. The Amundsen and Bellingshausen seas are a major source of freshwater in the present (Seroussi et al., 2020). Subtracting antwater from antwater-ambe tests the sensitivity of freshwater-induced anomalies to changes in lateral input distribution.
A4.11 antwater-depth
The antwater-depth experiment is identical to antwater, except that the freshwater perturbation is spread uniformly from the surface to the continental shelf base for each coastal location. Latent heat is not extracted. This experiment tests the impact of different vertical freshwater input distributions. In reality, we expect basal shelf melt to be input at depth. Subtracting antwater from antwater-depth gives the impact of confining freshwater inputs to the surface.
A4.12 antwater-depth-lh
The antwater-depth-lh experiment is identical to antwater-depth, except that the latent heat of melt requires to melt 0.1 Sv is extracted from the corresponding ocean. In reality, we expect the basal melting of ice shelves to cool the ocean at depth from latent heat extraction. Subtracting antwater-depth from antwater-depth-lh tests the sensitivity of freshwater-induced anomalies to extraction of latent heat at depth.
A4.13 antwater-ambe-depth-lh
The antwater-ambe-depth-lh provides an extreme counter-example to antwater, where the simplifying assumptions of a uniform, surface freshwater input with no latent heat extraction have all been removed. Subtracting antwater from antwater-ambe-depth-lh gives an upper limit on the impact of our simplifying assumptions.
A5 Using ocean–sea ice models
Performing forced global ocean–sea ice simulations requires the use of sea surface salinity (SSS) or water restoring. Surface restoring is not physical, and its required strength is sensitive to the model and configuration used. However, it is necessary in order to prevent long-term salinity drifts due to uncertainties in the prescribed surface forcing (Griffies et al., 2009; Danabasoglu et al., 2014; Griffies et al., 2016). When performing surface flux perturbations, such as the idealized meltwater experiments proposed in SOFIA, surface restoring would inevitably affect the perturbation-induced response in both the surface and interior of the ocean. A methodology proposed for carrying out SOFIA experiments in forced ocean–sea ice mode is detailed next, with recommendations on how to obtain stable control solutions without applying any surface restoring.
Table A3SOFIA data request. For more details, see the OMIP data request specified in Griffies et al. (2016).
First, and after a sufficiently long spin-up, a multi-century-long control experiment is completed using SSS restoring. The restoring timescale is subject to the model but it is recommended to be as weak as possible. Also, no SSS restoring is applied under sea ice. Models transporting water across the ocean surface, such as MOM, add or subtract freshwater impacting the ocean volume. For this reason, a global normalization is applied at each time step at the surface so that the net water input is set to zero. We chose to force the model with the Coordinated Ocean-Ice Reference Experiment (CORE) repeating Normal Year Forcing (NYF); see Griffies et al. (2009), where the Large and Yeager (2009) atmospheric dataset is used to compute idealized repeating annual cycles for heat, moisture, and momentum. An alternative approach could use the JRA55-do (Tsujino et al., 2018) 1984–1985 Repeat Year Forcing (RYF; Stewart et al., 2020). In both cases, air–sea fluxes are diagnosed through bulk formulae.
During the last 100 years of the control simulation, SSS restoring-induced surface freshwater fluxes are saved with a recommended frequency of 6 h, as daily fluxes have been proven to be not sufficient to reproduce a stable solution. Then, a twin control is performed, reproducing the last 100 years of the control simulation, but with SSS restoring deactivated and adding as salt correction the 6-hourly SSS fluxes from the restoring simulation. Hence, following the method described in Boeira Dias et al. (2020, 2021), in this case no SSS restoring is applied, and only the restoring-induced fluxes are prescribed to the ocean and sea ice model. Imposing 6-hourly SSS restoring-induced fluxes results in negligible changes in globally averaged sea surface temperature (SST), SSS, and volume-average temperature and salinity. Standard metrics such as the ACC and AMOC strength present a stable behaviour during the entire length of both controls, with no significant modifications in transports.
Now that a control simulation without SSS restoring is available, serving the same purpose as a piControl experiment for coupled models (Sect. A4.1), the idealized antwater experiment (Sect. A4.2) can be carried out by adding to the SSS restoring-induced fluxes the SOFIA freshwater perturbations during the entire 100-year period. Given the deterministic behaviour within a forced ocean–sea ice simulation and the limited spread achieved by perturbing the initial conditions, we recommend exploring the response within the parameter space of the freshwater anomalies instead of producing an ensemble of simulations.
For historical experiments (Sect. A4.3), the same protocol is followed with an ocean–sea ice model forced by either the interannual CORE-II atmospheric state (as in OMIP-1; Griffies et al., 2012; Danabasoglu et al., 2014) or the interannually varying JRA55-do surface atmospheric dataset (as in OMIP-2; Tsujino et al., 2020).
A6 Data request
A6.1 Requested variables and format
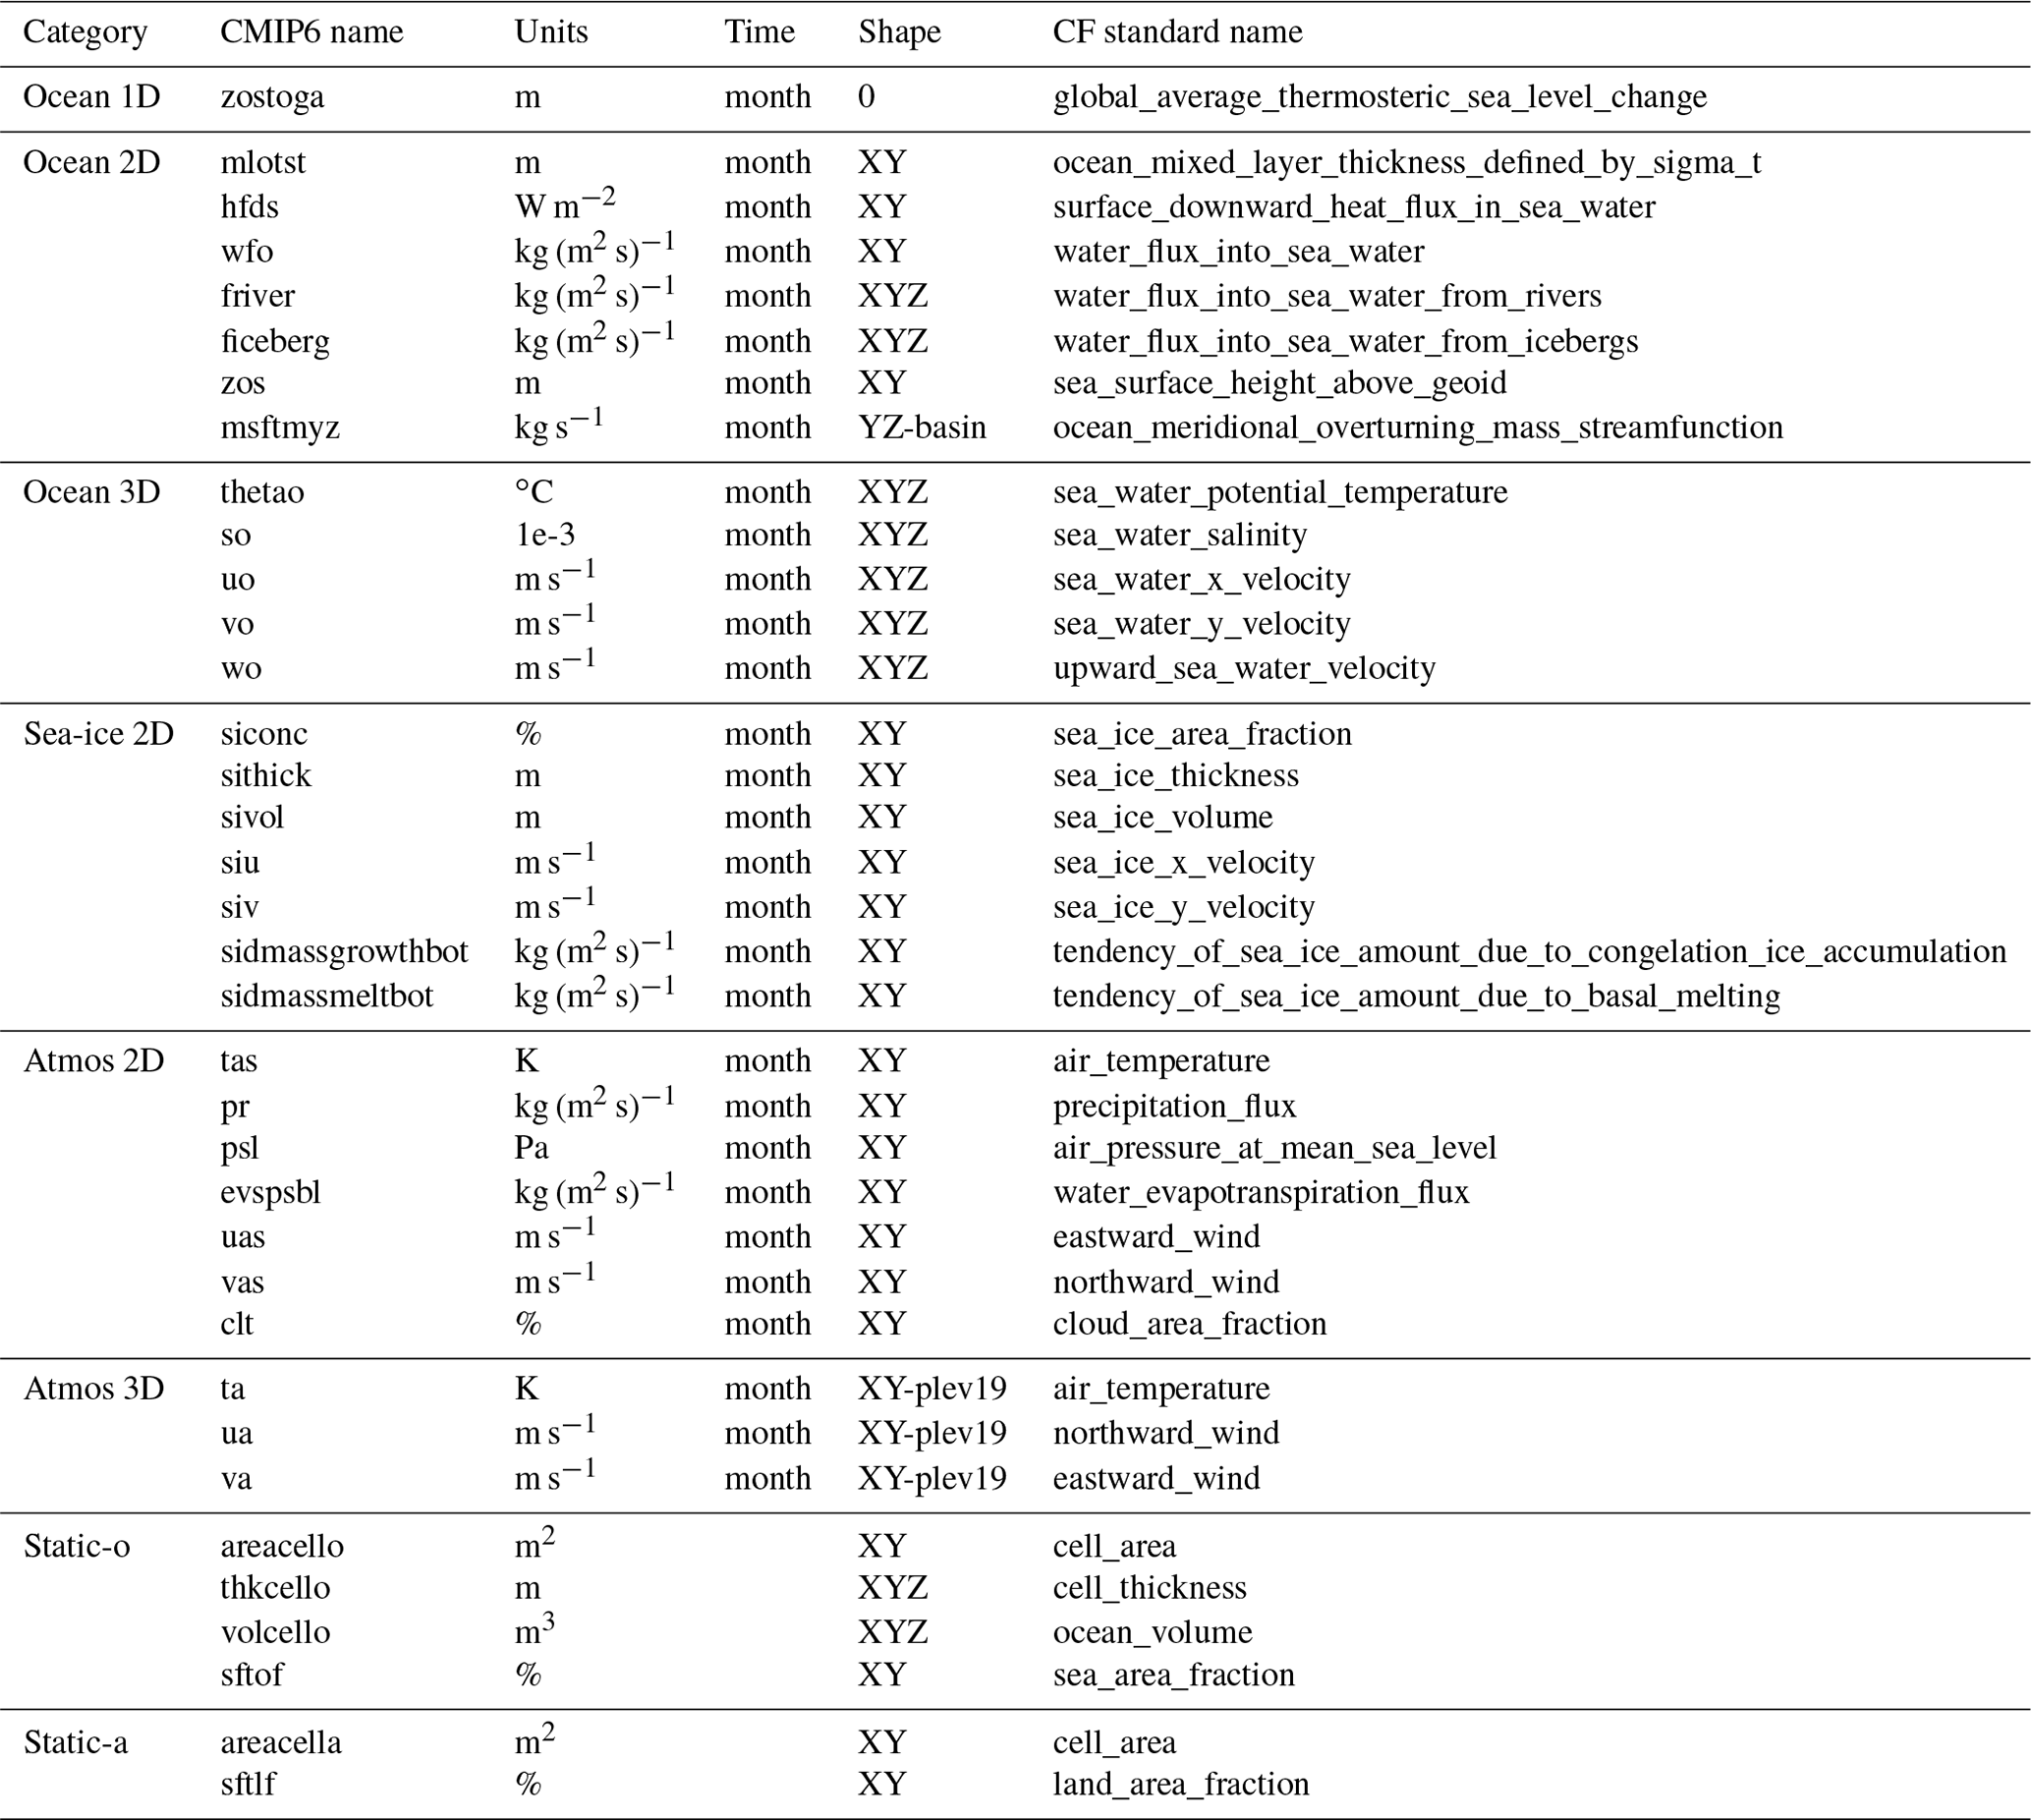
We request a subset of the full CMIP6 data request (Griffies et al., 2016; Juckes et al., 2020) to enable us to address our core scientific objectives, while limiting the burden on modellers and disc archives. The list of requested variables, using CMIP6 standard nomenclature, is provided in Table A3. Output according to CMIP6 standards and conventions (i.e. Coupled Model Output Rewriter; CMOR) is preferred. However, in the interest of a low bar for participating in SOFIA, netCDF formatted data not conforming with CMIP6 naming and metadata requirements will be accepted. In this case, models must provide sufficient information for users to interpret their data and specifically the mapping between CMIP6 names and units and their model names and units.
A6.2 Data sharing and usage policy
A common archive of key variables is housed at http://crd-data-donnees-rdc.ec.gc.ca/CCCMA/SOFIA/ (last access: 11 December 2023). Each modelling group may provide more complete output using a service of their choice. Significant effort has been invested by the SOFIA team to design the experiments, the modellers to run the experiments, and the project coordinators to house the data in an open common archive. These efforts should be recognized. We request that this experimental design paper should be cited whenever the SOFIA data are used in publication. We also suggest that users of the data contact us (https://sofiamip.github.io/, last access: 11 December 2023) for input on appropriate use of the data and attribution, as well as collaboration on addressing scientific questions.
SOFIA data will be provided at http://crd-data-donnees-rdc.ec.gc.ca/CCCMA/SOFIA/ (Swart, 2023) – see Sect. A6
NCS coordinated the authors, wrote much of the original text, made Fig. A1, and managed the common data archive. TM coordinated author meetings and produced Fig. 1. RB created Fig. 2. All authors contributed to the discussion of the experimental design and the editing of the text. Various authors ran and contributed model results or acted as points of contact for their model output (Table 2).
At least one of the (co-)authors is a member of the editorial board of Geoscientific Model Development. The peer-review process was guided by an independent editor, and the authors also have no other competing interests to declare.
Publisher's note: Copernicus Publications remains neutral with regard to jurisdictional claims made in the text, published maps, institutional affiliations, or any other geographical representation in this paper. While Copernicus Publications makes every effort to include appropriate place names, the final responsibility lies with the authors.
The authors thank Nicholas Golledge, Karen J. Heywood, Paul Holland, Katherine Turner, and an anonymous reviewer for their valuable comments helping to improve the manuscript and the experimental design.
Matthew H. England and Ariaan Purich are funded by the Australian Research Council Special Research Initiative as part of the Antarctic Science scheme (grant nos. SR200100008 and SR200100005). Tore Hattermann and Morven Muilwijk received funding from the European Union's Horizon 2020 Research and Innovation Programme (grant no. 101003826) via project CRiceS. F. Alexander Haumann was supported by NASA (grant no. 80NSSC19K1115), the European Union (ERC, VERTEXSO, grant no. 101041743), and the Initiative and Networking Fund of the Helmholtz Association (grant no. VH-NG-19-33). Qian Li and John Marshall are supported by the NASA MAP program 19-MAP19-0011 and the MIT-GISS cooperative agreement. The model simulations and analysis were conducted on the NASA High-End Computing (HEC) Program through the NASA Center for Climate Simulation (NCCS) at Goddard Space Flight Center. Torge Martin received funding from the German Federal Ministry of Education and Research (BMBF) through project PalMod: From the Last Interglacial to the Anthropocene – Modeling a Complete Glacial Cycle, WP1.4.3 (FKZ: 01LP1918C). Andrew G. Pauling, Max Thomas, and Inga J. Smith were supported by the Deep South National Science Challenge (MBIE C01X1412) and the Antarctic Science Platform (University of Otago subcontract 19424 from VUW's ASP Project 4 contract with Antarctica New Zealand through MBIE SSIF Programmes Investment ANTA1801).
This paper was edited by Philippe Huybrechts and reviewed by Nicholas Golledge and one anonymous referee.
Adusumilli, S., Fricker, H. A., Medley, B., Padman, L., and Siegfried, M. R.: Interannual variations in meltwater input to the Southern Ocean from Antarctic ice shelves, Nat. Geosci., 13, 616–620, https://doi.org/10.1038/s41561-020-0616-z, 2020. a, b, c
Aiken, C. M. and England, M. H.: Sensitivity of the Present-Day Climate to Freshwater Forcing Associated with Antarctic Sea Ice Loss, J. Climate, 21, 3936–3946, https://doi.org/10.1175/2007JCLI1901.1, 2008. a, b
Asay-Davis, X. S., Cornford, S. L., Durand, G., Galton-Fenzi, B. K., Gladstone, R. M., Gudmundsson, G. H., Hattermann, T., Holland, D. M., Holland, D., Holland, P. R., Martin, D. F., Mathiot, P., Pattyn, F., and Seroussi, H.: Experimental design for three interrelated marine ice sheet and ocean model intercomparison projects: MISMIP v. 3 (MISMIP +), ISOMIP v. 2 (ISOMIP +) and MISOMIP v. 1 (MISOMIP1), Geosci. Model Dev., 9, 2471–2497, https://doi.org/10.5194/gmd-9-2471-2016, 2016. a
Beadling, R. L., Krasting, J. P., Griffies, S. M., Hurlin, W. J., Bronselaer, B., Russell, J. L., MacGilchrist, G. A., Tesdal, J.-E., and Winton, M.: Importance of the Antarctic Slope Current in the Southern Ocean Response to Ice Sheet Melt and Wind Stress Change, J. Geophys. Res.-Oceans, 127, e2021JC017608, https://doi.org/10.1029/2021JC017608, 2022. a, b, c, d
Behrens, E., Rickard, G., Morgenstern, O., Martin, T., Osprey, A., and Joshi, M.: Southern Ocean deep convection in global climate models: A driver for variability of subpolar gyres and Drake Passage transport on decadal timescales, J. Geophys. Res.-Oceans, 121, 3905–3925, https://doi.org/10.1002/2015JC011286, 2016. a
Bintanja, R., van Oldenborgh, G. J., Drijfhout, S. S., Wouters, B., and Katsman, C. A.: Important role for ocean warming and increased ice-shelf melt in Antarctic sea-ice expansion, Nat. Geosci., 6, 376–379, https://doi.org/10.1038/ngeo1767, 2013. a, b, c, d
Bintanja, R., van Oldenborgh, G., and Katsman, C.: The effect of increased fresh water from Antarctic ice shelves on future trends in Antarctic sea ice, Ann. Glaciol., 56, 120–126, https://doi.org/10.3189/2015AoG69A001, 2015. a
Boeira Dias, F., Fiedler, R., Marsland, S. J., Domingues, C. M., Clement, L., Rintoul, S. R., McDonagh, E. L., Mata, M. M., and Savita, A.: Ocean heat storage in response to changing ocean circulation processes, J. Climate, 33, 9065–9082, 2020. a
Boeira Dias, F., Domingues, C. M., Marsland, S. J., Rintoul, S. R., Uotila, P., Fiedler, R., Mata, M. M., Bindoff, N. L., and Savita, A.: Subpolar Southern Ocean response to changes in the surface momentum, heat and freshwater fluxes under 2xCO2, J. Climate, 34, 8755–8775, 2021. a
Bronselaer, B., Winton, M., Griffies, S. M., Hurlin, W. J., Rodgers, K. B., Sergienko, O. V., Stouffer, R. J., and Russell, J. L.: Change in future climate due to Antarctic meltwater, Nature, 564, 53–58, https://doi.org/10.1038/s41586-018-0712-z, 2018. a, b, c, d, e, f, g, h
Bronselaer, B., Russell, J. L., Winton, M., Williams, N. L., Key, R. M., Dunne, J. P., Feely, R. A., Johnson, K. S., and Sarmiento, J. L.: Importance of wind and meltwater for observed chemical and physical changes in the Southern Ocean, Nat. Geosci., 13, 35–42, https://doi.org/10.1038/s41561-019-0502-8, 2020. a
Cabré, A., Marinov, I., and Gnanadesikan, A.: Global Atmospheric Teleconnections and Multidecadal Climate Oscillations Driven by Southern Ocean Convection, J. Climate, 30, 8107–8126, https://doi.org/10.1175/JCLI-D-16-0741.1, 2017. a
Danabasoglu, G., Yeager, S. G., Bailey, D., Behrens, E., Bentsen, M., Bi, D., Biastoch, A., Böning, C., Bozec, A., Canuto, V. M., Cassou, C., Chassignet, E., Coward, A. C., Danilov, S., Diansky, N., Drange, H., Farneti, R., Fernandez, E., Fogli, P. G., Forget, G., Fujii, Y., Griffies, S. M., Gusev, A., Heimbach, P., Howard, A., Jung, T., Kelley, M., Large, W. G., Leboissetier, A., Lu, J., Madec, G., Marsland, S. J., Masina, S., Navarra, A., Nurser, A. J. G., Pirani, A., Salas y Mélia, D., Samuels, B. L., Scheinert, M., Sidorenko, D., Treguier, A.-M., Tsujino, H., Uotila, P., Valcke, S., Voldoire, A., and Wang, Q.: North Atlantic simulations in Coordinated Ocean-ice Reference Experiments phase II (CORE-II). Part I: Mean states, Ocean Model., 73, 76–107, 2014. a, b
Danabasoglu, G., Lamarque, J.-F., Bacmeister, J., Bailey, D. A., DuVivier, A. K., Edwards, J., Emmons, L. K., Fasullo, J., Garcia, R., Gettelman, A., Hannay, C., Holland, M. M., Large, W. G., Lauritzen, P. H., Lawrence, D. M., Lenaerts, J. T. M., Lindsay, K., Lipscomb, W. H., Mills, M. J., Neale, R., Oleson, K. W., Otto-Bliesner, B., Phillips, A. S., Sacks, W., Tilmes, S., van Kampenhout, L., Vertenstein, M., Bertini, A., Dennis, J., Deser, C., Fischer, C., Fox-Kemper, B., Kay, J. E., Kinnison, D., Kushner, P. J., Larson, V. E., Long, M. C., Mickelson, S., Moore, J. K., Nienhouse, E., Polvani, L., Rasch, P. J., and Strand, W. G.: The Community Earth System Model Version 2 (CESM2), J. Adv. Model. Earth Sy., 12, e2019MS001916, https://doi.org/10.1029/2019MS001916, 2020. a
DeConto, R. M. and Pollard, D.: Contribution of Antarctica to past and future sea-level rise, Nature, 531, 591–597, https://doi.org/10.1038/nature17145, 2016. a, b, c
de Lavergne, C., Palter, J. B., Galbraith, E. D., Bernardello, R., and Marinov, I.: Cessation of deep convection in the open Southern Ocean under anthropogenic climate change, Nat. Clim. Change, 4, 278–282, https://doi.org/10.1038/nclimate2132, 2014. a
Depoorter, M. A., Bamber, J. L., Griggs, J. A., Lenaerts, J. T. M., Ligtenberg, S. R. M., van den Broeke, M. R., and Moholdt, G.: Calving fluxes and basal melt rates of Antarctic ice shelves, Nature, 502, 89–92, https://doi.org/10.1038/nature12567, 2013. a
Dong, Y., Pauling, A. G., Sadai, S., and Armour, K. C.: Antarctic Ice-Sheet Meltwater Reduces Transient Warming and Climate Sensitivity Through the Sea-Surface Temperature Pattern Effect, Geophys. Res. Lett., 49, e2022GL101249, https://doi.org/10.1029/2022GL101249, 2022. a, b, c
Döscher, R., Acosta, M., Alessandri, A., Anthoni, P., Arsouze, T., Bergman, T., Bernardello, R., Boussetta, S., Caron, L.-P., Carver, G., Castrillo, M., Catalano, F., Cvijanovic, I., Davini, P., Dekker, E., Doblas-Reyes, F. J., Docquier, D., Echevarria, P., Fladrich, U., Fuentes-Franco, R., Gröger, M., v. Hardenberg, J., Hieronymus, J., Karami, M. P., Keskinen, J.-P., Koenigk, T., Makkonen, R., Massonnet, F., Ménégoz, M., Miller, P. A., Moreno-Chamarro, E., Nieradzik, L., van Noije, T., Nolan, P., O'Donnell, D., Ollinaho, P., van den Oord, G., Ortega, P., Prims, O. T., Ramos, A., Reerink, T., Rousset, C., Ruprich-Robert, Y., Le Sager, P., Schmith, T., Schrödner, R., Serva, F., Sicardi, V., Sloth Madsen, M., Smith, B., Tian, T., Tourigny, E., Uotila, P., Vancoppenolle, M., Wang, S., Wårlind, D., Willén, U., Wyser, K., Yang, S., Yepes-Arbós, X., and Zhang, Q.: The EC-Earth3 Earth system model for the Coupled Model Intercomparison Project 6, Geosci. Model Dev., 15, 2973–3020, https://doi.org/10.5194/gmd-15-2973-2022, 2022. a
Dufour, C. O., Morrizon, A. K., Griffies, S. M., Frenger, I., Zanowski, H., and Winton, M.: Preconditioning of the Weddell Sea polynya by the ocean mesoscale and dense water overflows, J. Climate, 30, 7719–7737, https://doi.org/10.1175/JCLI-D-16-0586.1, 2017. a
Dunne, J. P., Horowitz, L. W., Adcroft, A. J., Ginoux, P., Held, I. M., John, J. G., Krasting, J. P., Malyshev, S., Naik, V., Paulot, F., Shevliakova, E., Stock, C. A., Zadeh, N., Balaji, V., Blanton, C., Dunne, K. A., Dupuis, C., Durachta, J., Dussin, R., Gauthier, P. P. G., Griffies, S. M., Guo, H., Hallberg, R. W., Harrison, M., He, J., Hurlin, W., McHugh, C., Menzel, R., Milly, P. C. D., Nikonov, S., Paynter, D. J., Ploshay, J., Radhakrishnan, A., Rand, K., Reichl, B. G., Robinson, T., Schwarzkopf, D. M., Sentman, L. T., Underwood, S., Vahlenkamp, H., Winton, M., Wittenberg, A. T., Wyman, B., Zeng, Y., and Zhao, M.: The GFDL Earth System Model Version 4.1 (GFDL-ESM 4.1): Overall Coupled Model Description and Simulation Characteristics, J. Adv. Model. Earth Sy., 12, e2019MS002015, https://doi.org/10.1029/2019MS002015, 2020. a
Edwards, T. L., Brandon, M. A., Durand, G., Edwards, N. R., Golledge, N. R., Holden, P. B., Nias, I. J., Payne, A. J., Ritz, C., and Wernecke, A.: Revisiting Antarctic ice loss due to marine ice-cliff instability, Nature, 566, 58–64, https://doi.org/10.1038/s41586-019-0901-4, 2019. a, b
Edwards, T. L., Nowicki, S., Marzeion, B., Hock, R., Goelzer, H., Seroussi, H., Jourdain, N. C., Slater, D. A., Turner, F. E., Smith, C. J., McKenna, C. M., Simon, E., Abe-Ouchi, A., Gregory, J. M., Larour, E., Lipscomb, W. H., Payne, A. J., Shepherd, A., Agosta, C., Alexander, P., Albrecht, T., Anderson, B., Asay-Davis, X., Aschwanden, A., Barthel, A., Bliss, A., Calov, R., Chambers, C., Champollion, N., Choi, Y., Cullather, R., Cuzzone, J., Dumas, C., Felikson, D., Fettweis, X., Fujita, K., Galton-Fenzi, B. K., Gladstone, R., Golledge, N. R., Greve, R., Hattermann, T., Hoffman, M. J., Humbert, A., Huss, M., Huybrechts, P., Immerzeel, W., Kleiner, T., Kraaijenbrink, P., Le clec’h, S., Lee, V., Leguy, G. R., Little, C. M., Lowry, D. P., Malles, J.-H., Martin, D. F., Maussion, F., Morlighem, M., O’Neill, J. F., Nias, I., Pattyn, F., Pelle, T., Price, S. F., Quiquet, A., Radić, V., Reese, R., Rounce, D. R., Rückamp, M., Sakai, A., Shafer, C., Schlegel, N.-J., Shannon, S., Smith, R. S., Straneo, F., Sun, S., Tarasov, L., Trusel, L. D., Van Breedam, J., van de Wal, R., van den Broeke, M., Winkelmann, R., Zekollari, H., Zhao, C., Zhang, T., and Zwinger, T.: Projected land ice contributions to twenty-first-century sea level rise, Nature, 593, 74–82, https://doi.org/10.1038/s41586-021-03302-y, 2021. a
Eyring, V., Bony, S., Meehl, G. A., Senior, C. A., Stevens, B., Stouffer, R. J., and Taylor, K. E.: Overview of the Coupled Model Intercomparison Project Phase 6 (CMIP6) experimental design and organization, Geosci. Model Dev., 9, 1937–1958, https://doi.org/10.5194/gmd-9-1937-2016, 2016. a, b, c
Fogwill, C. J., Phipps, S. J., Turney, C. S. M., and Golledge, N. R.: Sensitivity of the Southern Ocean to enhanced regional Antarctic ice sheet meltwater input, Earth's Future, 3, 317–329, https://doi.org/10.1002/2015EF000306, 2015. a
Fox-Kemper, B., Hewitt, H. T., Xiao, C., Aðalgeirsdóttir, G., Drijfhout, S. S., Edwards, T. L., Golledge, N. R., Hemer, M., Kopp, R. E., Krinner, G., Mix, A., Notz, D., Nowicki, S., Nurhati, I. S., Ruiz, L., Sallée, J.-B., Slangen, A. B. A., and Yu, Y.: Ocean, cryosphere, and sea level change, in: Climate Change 2021: The Physical Science Basis. Contribution of Working Group I to the Sixth Assessment Report of the Intergovernmental Panel on Climate Change, edited by: Masson-Delmotte, V., Zhai, P., Pirani, A., Connors, S. L., Péan, C., Berger, S., Caud, N., Chen, Y., Goldfarb, L., Gomis, M. I., Huang, M., Leitzell, K., Lonnoy, E., Matthews, J. B. R., Maycock, T. K., Waterfield, T., Yelekçi, O., Yu, R., and Zhou, B., 1211–1362, Cambridge University Press, Cambridge, United Kingdom and New York, NY, USA, https://doi.org/10.1017/9781009157896.001, 2021. a, b, c, d, e, f
Frölicher, T. L., Sarmiento, J. L., Paynter, D. J., Dunne, J. P., Krasting, J. P., and Winton, M.: Dominance of the Southern Ocean in Anthropogenic Carbon and Heat Uptake in CMIP5 Models, J. Climate, 28, 862–886, https://doi.org/10.1175/JCLI-D-14-00117.1, 2015. a, b
Fyke, J., Sergienko, O., Löfverström, M., Price, S., and Lenaerts, J. T. M.: An Overview of Interactions and Feedbacks Between Ice Sheets and the Earth System, Rev. Geophys., 56, 361–408, https://doi.org/10.1029/2018RG000600, 2018. a, b, c, d, e
Gillett, N. P., Shiogama, H., Funke, B., Hegerl, G., Knutti, R., Matthes, K., Santer, B. D., Stone, D., and Tebaldi, C.: The Detection and Attribution Model Intercomparison Project (DAMIP v1.0) contribution to CMIP6, Geosci. Model Dev., 9, 3685–3697, https://doi.org/10.5194/gmd-9-3685-2016, 2016. a
Golledge, N. R., Keller, E. D., Gomez, N., Naughten, K. A., Bernales, J., Trusel, L. D., and Edwards, T. L.: Global environmental consequences of twenty-first-century ice-sheet melt, Nature, 566, 65–72, https://doi.org/10.1038/s41586-019-0889-9, 2019. a, b, c, d, e, f
Greene, C. A., Gardner, A. S., Schlegel, N.-J., and Fraser, A. D.: Antarctic calving loss rivals ice-shelf thinning, Nature, 609, 948–953, https://doi.org/10.1038/s41586-022-05037-w, 2022. a, b, c
Gregory, J. M., Bouttes, N., Griffies, S. M., Haak, H., Hurlin, W. J., Jungclaus, J., Kelley, M., Lee, W. G., Marshall, J., Romanou, A., Saenko, O. A., Stammer, D., and Winton, M.: The Flux-Anomaly-Forced Model Intercomparison Project (FAFMIP) contribution to CMIP6: investigation of sea-level and ocean climate change in response to CO2 forcing, Geosci. Model Dev., 9, 3993–4017, https://doi.org/10.5194/gmd-9-3993-2016, 2016. a, b
Griffies, S., Biastoch, A., Boning, C., Bryan, F., Danabasoglu, G., Chassignet, E., England, M., Gerdes, R., Haak, H., and Hallberg, R.: Coordinated Ocean-ice Reference Experiments (COREs), Ocean Model., 26, 1–46, 2009. a, b
Griffies, S. M.: Elements of the Modular Ocean Model (MOM) (2012 release), GFDL Ocean Group Technical Report 7, NOAA/Geophysical Fluid Dynamics Laboratory, https://mom-ocean.github.io/assets/pdfs/MOM5_manual.pdf (last access: 11 December 2023), 2012. a
Griffies, S. M., Winton, M., Samuels, B. L., Danabasoglu, G., Yeager, S. G., Marsland, S. J., Drange, H., and Bentsen, M.: Datasets and protocol for the CLIVAR WGOMD Coordinated Ocean-sea ice Reference Experiments (COREs), WCRP Report, No. 21, 1–21, 2012. a
Griffies, S. M., Danabasoglu, G., Durack, P. J., Adcroft, A. J., Balaji, V., Böning, C. W., Chassignet, E. P., Curchitser, E., Deshayes, J., Drange, H., Fox-Kemper, B., Gleckler, P. J., Gregory, J. M., Haak, H., Hallberg, R. W., Heimbach, P., Hewitt, H. T., Holland, D. M., Ilyina, T., Jungclaus, J. H., Komuro, Y., Krasting, J. P., Large, W. G., Marsland, S. J., Masina, S., McDougall, T. J., Nurser, A. J. G., Orr, J. C., Pirani, A., Qiao, F., Stouffer, R. J., Taylor, K. E., Treguier, A. M., Tsujino, H., Uotila, P., Valdivieso, M., Wang, Q., Winton, M., and Yeager, S. G.: OMIP contribution to CMIP6: experimental and diagnostic protocol for the physical component of the Ocean Model Intercomparison Project, Geosci. Model Dev., 9, 3231–3296, https://doi.org/10.5194/gmd-9-3231-2016, 2016. a, b, c, d, e
Gruber, N., Clement, D., Carter, B. R., Feely, R. A., Heuven, S. v., Hoppema, M., Ishii, M., Key, R. M., Kozyr, A., Lauvset, S. K., Monaco, C. L., Mathis, J. T., Murata, A., Olsen, A., Perez, F. F., Sabine, C. L., Tanhua, T., and Wanninkhof, R.: The oceanic sink for anthropogenic CO2 from 1994 to 2007, Science, 363, 1193–1199, https://doi.org/10.1126/science.aau5153, 2019. a
Hansen, J., Sato, M., Hearty, P., Ruedy, R., Kelley, M., Masson-Delmotte, V., Russell, G., Tselioudis, G., Cao, J., Rignot, E., Velicogna, I., Tormey, B., Donovan, B., Kandiano, E., von Schuckmann, K., Kharecha, P., Legrande, A. N., Bauer, M., and Lo, K.-W.: Ice melt, sea level rise and superstorms: evidence from paleoclimate data, climate modeling, and modern observations that 2 °C global warming could be dangerous, Atmos. Chem. Phys., 16, 3761–3812, https://doi.org/10.5194/acp-16-3761-2016, 2016. a, b
Hattermann, T.: Antarctic Thermocline Dynamics along a Narrow Shelf with Easterly Winds, J. Phys. Oceanogr., 48, 2419–2443, https://doi.org/10.1175/JPO-D-18-0064.1, 2018. a
Hattermann, T. and Levermann, A.: Response of Southern Ocean circulation to global warming may enhance basal ice shelf melting around Antarctica, Clim. Dynam., 35, 741–756, https://doi.org/10.1007/s00382-009-0643-3, 2010. a, b
Haumann, F. A., Gruber, N., and Münnich, M.: Sea-Ice Induced Southern Ocean Subsurface Warming and Surface Cooling in a Warming Climate, AGU Advances, 1, e2019AV000132, https://doi.org/10.1029/2019AV000132, 2020. a
Hawkins, E. and Sutton, R.: The Potential to Narrow Uncertainty in Regional Climate Predictions, B. Am. Meteorol. Soc., 90, 1095–1108, https://doi.org/10.1175/2009BAMS2607.1, 2009. a
Held, I. M., Guo, H., Adcroft, A., Dunne, J. P., Horowitz, L. W., Krasting, J., Shevliakova, E., Winton, M., Zhao, M., Bushuk, M., Wittenberg, A. T., Wyman, B., Xiang, B., Zhang, R., Anderson, W., Balaji, V., Donner, L., Dunne, K., Durachta, J., Gauthier, P. P. G., Ginoux, P., Golaz, J.-C., Griffies, S. M., Hallberg, R., Harris, L., Harrison, M., Hurlin, W., John, J., Lin, P., Lin, S.-J., Malyshev, S., Menzel, R., Milly, P. C. D., Ming, Y., Naik, V., Paynter, D., Paulot, F., Ramaswamy, V., Reichl, B., Robinson, T., Rosati, A., Seman, C., Silvers, L. G., Underwood, S., and Zadeh, N.: Structure and Performance of GFDL's CM4.0 Climate Model, J. Adv. Model. Earth Sy., 11, 3691–3727, https://doi.org/10.1029/2019MS001829, 2019. a
Hellmer, H. H., Kauker, F., Timmermann, R., and Hattermann, T.: The Fate of the Southern Weddell Sea Continental Shelf in a Warming Climate, J. Climate, 30, 4337–4350, https://doi.org/10.1175/JCLI-D-16-0420.1, 2017. a
Heuzé, C.: Antarctic Bottom Water and North Atlantic Deep Water in CMIP6 models, Ocean Sci., 17, 59–90, https://doi.org/10.5194/os-17-59-2021, 2021. a
Jourdain, N. C., Mathiot, P., Merino, N., Durand, G., Le Sommer, J., Spence, P., Dutrieux, P., and Madec, G.: Ocean circulation and sea-ice thinning induced by melting ice shelves in the Amundsen Sea, J. Geophys. Res.-Oceans, 122, 2550–2573, https://doi.org/10.1002/2016JC012509, 2017. a
Jourdain, N. C., Asay-Davis, X., Hattermann, T., Straneo, F., Seroussi, H., Little, C. M., and Nowicki, S.: A protocol for calculating basal melt rates in the ISMIP6 Antarctic ice sheet projections, The Cryosphere, 14, 3111–3134, https://doi.org/10.5194/tc-14-3111-2020, 2020. a
Juckes, M., Taylor, K. E., Durack, P. J., Lawrence, B., Mizielinski, M. S., Pamment, A., Peterschmitt, J.-Y., Rixen, M., and Sénési, S.: The CMIP6 Data Request (DREQ, version 01.00.31), Geosci. Model Dev., 13, 201–224, https://doi.org/10.5194/gmd-13-201-2020, 2020. a
Kelley, M., Schmidt, G. A., Nazarenko, L. S., Bauer, S. E., Ruedy, R., Russell, G. L., Ackerman, A. S., Aleinov, I., Bauer, M., Bleck, R., Canuto, V., Cesana, G., Cheng, Y., Clune, T. L., Cook, B. I., Cruz, C. A., Del Genio, A. D., Elsaesser, G. S., Faluvegi, G., Kiang, N. Y., Kim, D., Lacis, A. A., Leboissetier, A., LeGrande, A. N., Lo, K. K., Marshall, J., Matthews, E. E., McDermid, S., Mezuman, K., Miller, R. L., Murray, L. T., Oinas, V., Orbe, C., García-Pando, C. P., Perlwitz, J. P., Puma, M. J., Rind, D., Romanou, A., Shindell, D. T., Sun, S., Tausnev, N., Tsigaridis, K., Tselioudis, G., Weng, E., Wu, J., and Yao, M.-S.: GISS-E2.1: Configurations and Climatology, J. Adv. Model. Earth Sy., 12, e2019MS002025, https://doi.org/10.1029/2019MS002025, 2020. a
Khatiwala, S., Primeau, F., and Hall, T.: Reconstruction of the history of anthropogenic CO2 concentrations in the ocean, Nature, 462, 346–349, https://doi.org/10.1038/nature08526, 2009. a
Kuhlbrodt, T., Jones, C. G., Sellar, A., Storkey, D., Blockley, E., Stringer, M., Hill, R., Graham, T., Ridley, J., Blaker, A., Calvert, D., Copsey, D., Ellis, R., Hewitt, H., Hyder, P., Ineson, S., Mulcahy, J., Siahaan, A., and Walton, J.: The Low-Resolution Version of HadGEM3 GC3.1: Development and Evaluation for Global Climate, J. Adv. Model. Earth Sy., 10, 2865–2888, https://doi.org/10.1029/2018MS001370, 2018. a
Lago, V. and England, M. H.: Projected Slowdown of Antarctic Bottom Water Formation in Response to Amplified Meltwater Contributions, J. Climate, 32, 6319–6335, https://doi.org/10.1175/JCLI-D-18-0622.1, 2019. a
Large, W. G. and Yeager, S. G.: The global climatology of an interannually varying air-sea flux data set, Clim. Dynam., 33, 341–364, 2009. a
Li, Q., England, M. H., Hogg, A. M., Rintoul, S. R., and Morrison, A. K.: Abyssal ocean overturning slowdown and warming driven by Antarctic meltwater, Nature, 615, 841–847, https://doi.org/10.1038/s41586-023-05762-w, 2023a. a, b
Li, Q., Marshall, J., Rye, C. D., Romanou, A., Rind, D., and Kelley, M.: Global Climate Impacts of Greenland and Antarctic Meltwater: A Comparative Study, J. Climate, 36, 3571–3590, https://doi.org/10.1175/JCLI-D-22-0433.1, 2023b. a, b
Lockwood, J. W., Griffies, C. O. D. S. M., and Winton, M.: On the role of the Antarctic Slope Front on the occurrence of the Weddell Sea polynya under climate change, J. Climate, 34, 2529–2548, https://doi.org/10.1175/JCLI-D-20-0069.1, 2021. a
Ma, H. and Wu, L.: Global Teleconnections in Response to Freshening over the Antarctic Ocean, J. Climate, 24, 1071–1088, https://doi.org/10.1175/2010JCLI3634.1, 2011. a, b
Ma, H., Wu, L., and Li, Z.: Impact of freshening over the Southern Ocean on ENSO, Atmos. Sci. Lett., 14, 28–33, https://doi.org/10.1002/asl2.410, 2013. a
Mackie, S., Smith, I. J., Ridley, J. K., Stevens, D. P., and Langhorne, P. J.: Climate Response to Increasing Antarctic Iceberg and Ice Shelf Melt, J. Climate, 33, 8917–8938, https://doi.org/10.1175/JCLI-D-19-0881.1, 2020. a, b, c, d
Marshall, J. and Speer, K.: Closure of the meridional overturning circulation through Southern Ocean upwelling, Nat. Geosci., 5, 171–180, https://doi.org/10.1038/ngeo1391, 2012. a
Martin, T. and Adcroft, A.: Parameterizing the fresh-water flux from land ice to ocean with interactive icebergs in a coupled climate model, Ocean Model., 34, 111–124, https://doi.org/10.1016/j.ocemod.2010.05.001, 2010. a
Martin, T., Park, W., and Latif, M.: Multi-centennial variability controlled by Southern Ocean convection in the Kiel Climate Model, Clim. Dynam., 40, 2005–2022, https://doi.org/10.1007/s00382-012-1586-7, 2013. a
Matthes, K., Biastoch, A., Wahl, S., Harlaß, J., Martin, T., Brücher, T., Drews, A., Ehlert, D., Getzlaff, K., Krüger, F., Rath, W., Scheinert, M., Schwarzkopf, F. U., Bayr, T., Schmidt, H., and Park, W.: The Flexible Ocean and Climate Infrastructure version 1 (FOCI1): mean state and variability, Geosci. Model Dev., 13, 2533–2568, https://doi.org/10.5194/gmd-13-2533-2020, 2020. a
Menviel, L., Timmermann, A., Timm, O. E., and Mouchet, A.: Climate and biogeochemical response to a rapid melting of the West Antarctic Ice Sheet during interglacials and implications for future climate, Paleoceanography, 25, PA4231, https://doi.org/10.1029/2009PA001892, 2010. a
Meredith, M., Sommerkorn, M., Cassotta, S., Derkson, C., Ekaykin, A., Hollowed, A., Kofinas, G., Mackintosh, A., Melbourne-Thomas, J., Muelbert, M., Ottersen, G., Pritchard, H., and Schuur, E.: Polar Regions, in: IPCC Special Report on the Ocean and Cryosphere in a Changing Climate, edited by: Pörtner, H.-O., Roberts, D., Masson-Delmotte, V., Zhai, P., Tignor, M., Poloczanska, E., Mintenbeck, K., Alegria, A., Nicolai, M., Okem, A., Petzold, J., Rama, B., and Weyer, N., 203–320, Cambridge University Press, Cambridge, UK and New York, NY, USA, https://doi.org/10.1017/9781009157964.005, 2019. a
Merino, N., Jourdain, N. C., Le Sommer, J., Goosse, H., Mathiot, P., and Durand, G.: Impact of increasing antarctic glacial freshwater release on regional sea-ice cover in the Southern Ocean, Ocean Model., 121, 76–89, https://doi.org/10.1016/j.ocemod.2017.11.009, 2018. a
Mohrmann, M., Heuzé, C., and Swart, S.: Southern Ocean polynyas in CMIP6 models, The Cryosphere, 15, 4281–4313, https://doi.org/10.5194/tc-15-4281-2021, 2021. a
Moorman, R., Morrison, A. K., and Hogg, A. M.: Thermal Responses to Antarctic Ice Shelf Melt in an Eddy-Rich Global Ocean–Sea Ice Model, J. Climate, 33, 6599–6620, https://doi.org/10.1175/JCLI-D-19-0846.1, 2020. a, b
Muntjewerf, L., Petrini, M., Vizcaino, M., Ernani da Silva, C., Sellevold, R., Scherrenberg, M. D. W., Thayer-Calder, K., Bradley, S. L., Lenaerts, J. T. M., Lipscomb, W. H., and Lofverstrom, M.: Greenland Ice Sheet Contribution to 21st Century Sea Level Rise as Simulated by the Coupled CESM2.1-CISM2.1, Geophys. Res. Lett., 47, e2019GL086836, https://doi.org/10.1029/2019GL086836, 2020. a
Naughten, K. A., De Rydt, J., Rosier, S. H. R., Jenkins, A., Holland, P. R., and Ridley, J. K.: Two-timescale response of a large Antarctic ice shelf to climate change, Nat. Commun., 12, 1991, https://doi.org/10.1038/s41467-021-22259-0, 2021. a
Nowicki, S. M. J., Payne, A., Larour, E., Seroussi, H., Goelzer, H., Lipscomb, W., Gregory, J., Abe-Ouchi, A., and Shepherd, A.: Ice Sheet Model Intercomparison Project (ISMIP6) contribution to CMIP6, Geosci. Model Dev., 9, 4521–4545, https://doi.org/10.5194/gmd-9-4521-2016, 2016. a
O'Neill, B. C., Tebaldi, C., van Vuuren, D. P., Eyring, V., Friedlingstein, P., Hurtt, G., Knutti, R., Kriegler, E., Lamarque, J.-F., Lowe, J., Meehl, G. A., Moss, R., Riahi, K., and Sanderson, B. M.: The Scenario Model Intercomparison Project (ScenarioMIP) for CMIP6, Geosci. Model Dev., 9, 3461–3482, https://doi.org/10.5194/gmd-9-3461-2016, 2016. a, b
Paolo, F. S., Fricker, H. A., and Padman, L.: Volume loss from Antarctic ice shelves is accelerating, Science, 348, 327–331, https://doi.org/10.1126/science.aaa0940, 2015. a, b, c
Park, J.-Y., Schloesser, F., Timmermann, A., Choudhury, D., Lee, J.-Y., and Nellikkattil, A. B.: Future sea-level projections with a coupled atmosphere-ocean-ice-sheet model, Nat. Commun., 14, 636, https://doi.org/10.1038/s41467-023-36051-9, 2023. a, b, c
Park, W. and Latif, M.: Ensemble global warming simulations with idealized Antarctic meltwater input, Clim. Dynam., 52, 3223–3239, https://doi.org/10.1007/s00382-018-4319-8, 2019. a, b, c
Pauling, A. G., Bitz, C. M., Smith, I. J., and Langhorne, P. J.: The Response of the Southern Ocean and Antarctic Sea Ice to Freshwater from Ice Shelves in an Earth System Model, J. Climate, 29, 1655–1672, https://doi.org/10.1175/JCLI-D-15-0501.1, 2016. a, b, c, d, e, f, g, h, i
Pauling, A. G., Smith, I. J., Langhorne, P. J., and Bitz, C. M.: Time-Dependent Freshwater Input From Ice Shelves: Impacts on Antarctic Sea Ice and the Southern Ocean in an Earth System Model, Geophys. Res. Lett., 44, 10,454–10,461, https://doi.org/10.1002/2017GL075017, 2017. a, b, c, d
Pritchard, H. D., Ligtenberg, S. R. M., Fricker, H. A., Vaughan, D. G., van den Broeke, M. R., and Padman, L.: Antarctic ice-sheet loss driven by basal melting of ice shelves, Nature, 484, 502–505, https://doi.org/10.1038/nature10968, 2012. a
Purich, A. and England, M. H.: Historical and Future Projected Warming of Antarctic Shelf Bottom Water in CMIP6 Models, Geophys. Res. Lett., 48, e2021GL092752, https://doi.org/10.1029/2021GL092752, 2021. a
Purich, A. and England, M. H.: Projected Impacts of Antarctic Meltwater Anomalies over the Twenty-First Century, J. Climate, 36, 2703–2719, https://doi.org/10.1175/JCLI-D-22-0457.1, 2023. a
Purich, A., England, M. H., Cai, W., Sullivan, A., and Durack, P. J.: Impacts of Broad-Scale Surface Freshening of the Southern Ocean in a Coupled Climate Model, J. Climate, 31, 2613–2632, https://doi.org/10.1175/JCLI-D-17-0092.1, 2018. a
Reese, R., Gudmundsson, G. H., Levermann, A., and Winkelmann, R.: The far reach of ice-shelf thinning in Antarctica, Nat. Clim. Change, 8, 53–57, https://doi.org/10.1038/s41558-017-0020-x, 2018. a
Reintges, A., Martin, T., Latif, M., and Park, W.: Physical controls of Southern Ocean deep-convection variability in CMIP5 models and the Kiel Climate Model, Geophys. Res. Lett., 44, 6951–6958, https://doi.org/10.1002/2017GL074087, 2017. a
Rignot, E., Jacobs, S., Mouginot, J., and Scheuchl, B.: Ice-Shelf Melting Around Antarctica, Science, 341, 266–270, https://doi.org/10.1126/science.1235798, 2013. a, b, c, d
Rignot, E., Mouginot, J., Scheuchl, B., van den Broeke, M., van Wessem, M. J., and Morlighem, M.: Four decades of Antarctic Ice Sheet mass balance from 1979–2017, P. Natl. Acad. Sci. USA, 116, 1095–1103, https://doi.org/10.1073/pnas.1812883116, 2019. a, b
Roemmich, D., Church, J., Gilson, J., Monselesan, D., Sutton, P., and Wijffels, S.: Unabated planetary warming and its ocean structure since 2006, Nat. Clim. Change, 5, 240–245, https://doi.org/10.1038/nclimate2513, 2015. a
Russell, J. L., Dixon, K. W., Gnanadesikan, A., Stouffer, R. J., and Toggweiler, J. R.: The Southern Hemisphere Westerlies in a Warming World: Propping Open the Door to the Deep Ocean, J. Climate, 19, 6382–6390, https://doi.org/10.1175/JCLI3984.1, 2006. a
Rye, C. D., Marshall, J., Kelley, M., Russell, G., Nazarenko, L. S., Kostov, Y., Schmidt, G. A., and Hansen, J.: Antarctic Glacial Melt as a Driver of Recent Southern Ocean Climate Trends, Geophys. Res. Lett., 47, e2019GL086892, https://doi.org/10.1029/2019GL086892, 2020. a
Sadai, S., Condron, A., DeConto, R., and Pollard, D.: Future climate response to Antarctic Ice Sheet melt caused by anthropogenic warming, Science Advances, 6, eaaz1169, https://doi.org/10.1126/sciadv.aaz1169, 2020. a, b, c, d, e, f, g
Sarmiento, J. L., Gruber, N., Brzezinski, M. A., and Dunne, J. P.: High-latitude controls of thermocline nutrients and low latitude biological productivity, Nature, 427, 56–60, https://doi.org/10.1038/nature02127, 2004. a
Seidov, D., Barron, E., and Haupt, B. J.: Meltwater and the global ocean conveyor: northern versus southern connections, Global Planet. Change, 30, 257–270, https://doi.org/10.1016/S0921-8181(00)00087-4, 2001. a, b
Seland, Ø., Bentsen, M., Olivié, D., Toniazzo, T., Gjermundsen, A., Graff, L. S., Debernard, J. B., Gupta, A. K., He, Y.-C., Kirkevåg, A., Schwinger, J., Tjiputra, J., Aas, K. S., Bethke, I., Fan, Y., Griesfeller, J., Grini, A., Guo, C., Ilicak, M., Karset, I. H. H., Landgren, O., Liakka, J., Moseid, K. O., Nummelin, A., Spensberger, C., Tang, H., Zhang, Z., Heinze, C., Iversen, T., and Schulz, M.: Overview of the Norwegian Earth System Model (NorESM2) and key climate response of CMIP6 DECK, historical, and scenario simulations, Geosci. Model Dev., 13, 6165–6200, https://doi.org/10.5194/gmd-13-6165-2020, 2020. a
Semmler, T., Danilov, S., Gierz, P., Goessling, H. F., Hegewald, J., Hinrichs, C., Koldunov, N., Khosravi, N., Mu, L., Rackow, T., Sein, D. V., Sidorenko, D., Wang, Q., and Jung, T.: Simulations for CMIP6 With the AWI Climate Model AWI-CM-1-1, J. Adv. Model. Earth Sy., 12, e2019MS002009, https://doi.org/10.1029/2019MS002009, 2020. a
Seroussi, H., Nowicki, S., Payne, A. J., Goelzer, H., Lipscomb, W. H., Abe-Ouchi, A., Agosta, C., Albrecht, T., Asay-Davis, X., Barthel, A., Calov, R., Cullather, R., Dumas, C., Galton-Fenzi, B. K., Gladstone, R., Golledge, N. R., Gregory, J. M., Greve, R., Hattermann, T., Hoffman, M. J., Humbert, A., Huybrechts, P., Jourdain, N. C., Kleiner, T., Larour, E., Leguy, G. R., Lowry, D. P., Little, C. M., Morlighem, M., Pattyn, F., Pelle, T., Price, S. F., Quiquet, A., Reese, R., Schlegel, N.-J., Shepherd, A., Simon, E., Smith, R. S., Straneo, F., Sun, S., Trusel, L. D., Van Breedam, J., van de Wal, R. S. W., Winkelmann, R., Zhao, C., Zhang, T., and Zwinger, T.: ISMIP6 Antarctica: a multi-model ensemble of the Antarctic ice sheet evolution over the 21st century, The Cryosphere, 14, 3033–3070, https://doi.org/10.5194/tc-14-3033-2020, 2020. a, b, c, d, e
Shepherd, A., Wingham, D., Wallis, D., Giles, K., Laxon, S., and Sundal, A. V.: Recent loss of floating ice and the consequent sea level contribution, Geophys. Res. Lett., 37, L13503, https://doi.org/10.1029/2010GL042496, 2010. a
Shepherd, A., Ivins, E., Rignot, E., Smith, B., van den Broeke, M., Velicogna, I., Whitehouse, P., Briggs, K., Joughin, I., Krinner, G., Nowicki, S., Payne, T., Scambos, T., Schlegel, N., A, G., Agosta, C., Ahlstrøm, A., Babonis, G., Barletta, V., Blazquez, A., Bonin, J., Csatho, B., Cullather, R., Felikson, D., Fettweis, X., Forsberg, R., Gallee, H., Gardner, A., Gilbert, L., Groh, A., Gunter, B., Hanna, E., Harig, C., Helm, V., Horvath, A., Horwath, M., Khan, S., Kjeldsen, K. K., Konrad, H., Langen, P., Lecavalier, B., Loomis, B., Luthcke, S., McMillan, M., Melini, D., Mernild, S., Mohajerani, Y., Moore, P., Mouginot, J., Moyano, G., Muir, A., Nagler, T., Nield, G., Nilsson, J., Noel, B., Otosaka, I., Pattle, M. E., Peltier, W. R., Pie, N., Rietbroek, R., Rott, H., Sandberg-Sørensen, L., Sasgen, I., Save, H., Scheuchl, B., Schrama, E., Schröder, L., Seo, K.-W., Simonsen, S., Slater, T., Spada, G., Sutterley, T., Talpe, M., Tarasov, L., van de Berg, W. J., van der Wal, W., van Wessem, M., Vishwakarma, B. D., Wiese, D., Wouters, B., and The IMBIE team: Mass balance of the Antarctic Ice Sheet from 1992 to 2017, Nature, 558, 219–222, https://doi.org/10.1038/s41586-018-0179-y, 2018. a, b, c, d, e, f, g
Si, Y., Stewart, A. L., and Eisenman, I.: Heat transport across the Antarctic Slope Front controlled by cross-slope salinity gradients, Sci. Adv., 9, eadd7049, https://doi.org/10.1126/sciadv.add7049, 2023. a
Siahaan, A., Smith, R. S., Holland, P. R., Jenkins, A., Gregory, J. M., Lee, V., Mathiot, P., Payne, A. J., Ridley, J. K., and Jones, C. G.: The Antarctic contribution to 21st-century sea-level rise predicted by the UK Earth System Model with an interactive ice sheet, The Cryosphere, 16, 4053–4086, https://doi.org/10.5194/tc-16-4053-2022, 2022. a, b, c, d
Slater, T., Lawrence, I. R., Otosaka, I. N., Shepherd, A., Gourmelen, N., Jakob, L., Tepes, P., Gilbert, L., and Nienow, P.: Review article: Earth's ice imbalance, The Cryosphere, 15, 233–246, https://doi.org/10.5194/tc-15-233-2021, 2021. a, b, c, d, e
Smith, R. S., Mathiot, P., Siahaan, A., Lee, V., Cornford, S. L., Gregory, J. M., Payne, A. J., Jenkins, A., Holland, P. R., Ridley, J. K., and Jones, C. G.: Coupling the U.K. Earth System Model to Dynamic Models of the Greenland and Antarctic Ice Sheets, J. Adv. Model. Earth Sy., 13, e2021MS002520, https://doi.org/10.1029/2021MS002520, 2021. a
Stewart, K., Kim, W., Urakawa, S., Hogg, A., Yeager, S., Tsujino, H., Nakano, H., Kiss, A., and Danabasoglu, G.: JRA55-do-based repeat year forcing datasets for driving ocean–sea-ice models, Ocean Model., 147, 101557, https://doi.org/10.1016/j.ocemod.2019.101557, 2020. a
Stouffer, R. J., Seidov, D., and Haupt, B. J.: Climate Response to External Sources of Freshwater: North Atlantic versus the Southern Ocean, J. Climate, 20, 436–448, https://doi.org/10.1175/JCLI4015.1, 2007. a, b
Swart, N. C. and Fyfe, J. C.: The influence of recent Antarctic ice sheet retreat on simulated sea ice area trends, Geophys. Res. Lett., 40, 4328–4332, https://doi.org/10.1002/grl.50820, 2013. a, b, c, d, e
Swart, N. C., Cole, J. N. S., Kharin, V. V., Lazare, M., Scinocca, J. F., Gillett, N. P., Anstey, J., Arora, V., Christian, J. R., Hanna, S., Jiao, Y., Lee, W. G., Majaess, F., Saenko, O. A., Seiler, C., Seinen, C., Shao, A., Sigmond, M., Solheim, L., von Salzen, K., Yang, D., and Winter, B.: The Canadian Earth System Model version 5 (CanESM5.0.3), Geosci. Model Dev., 12, 4823–4873, https://doi.org/10.5194/gmd-12-4823-2019, 2019. a, b
Swart, N.: SOFIA model output associated with Swart et al. (2023) “The Southern Ocean Freshwater Input from Antarctica (SOFIA) Initiative: scientific objectives and experimental design”, Environment and Climate Change Canada (ECCC), Canada [data set], http://crd-data-donnees-rdc.ec.gc.ca/CCCMA/SOFIA/, last access: 11 December 2023. a
Swingedouw, D., Fichefet, T., Goosse, H., and Loutre, M. F.: Impact of transient freshwater releases in the Southern Ocean on the AMOC and climate, Clim. Dynam., 33, 365–381, https://doi.org/10.1007/s00382-008-0496-1, 2009. a
Thomas, M., Ridley, J. K., Smith, I. J., Stevens, D. P., Holland, P. R., and Mackie, S.: Future Response of Antarctic Continental Shelf Temperatures to Ice Shelf Basal Melting and Calving, Geophys. Res. Lett., 50, e2022GL102101, https://doi.org/10.1029/2022GL102101, 2023. a, b, c
Timmermann, R. and Goeller, S.: Response to Filchner–Ronne Ice Shelf cavity warming in a coupled ocean–ice sheet model – Part 1: The ocean perspective, Ocean Sci., 13, 765–776, https://doi.org/10.5194/os-13-765-2017, 2017. a
Toggweiler, J. R. and Samuels, B.: Effect of drake passage on the global thermohaline circulation, Deep-Sea Res. Pt. I, 42, 477–500, https://doi.org/10.1016/0967-0637(95)00012-U, 1995. a
Tsujino, H., Urakawa, S., Nakano, H., Small, R. J., Kim, W. M., Yeager, S. G., Danabasoglu, G., Suzuki, T., Bamber, J. L., Bentsen, M., Böning, C. W., Bozec, A., Chassignet, E. P., Curchitser, E., Boeira Dias, F., Durack, P. J., Griffies, S. M., Harada, Y., Ilicak, M., Josey, S. A., Kobayashi, C., Kobayashi, S., Komuro, Y., Large, W. G., Le Sommer, J., Marsland, S. J., Masina, S., Scheinert, M., Tomita, H., Valdivieso, M., and Yamazaki, D.: JRA-55 based surface dataset for driving ocean–sea-ice models (JRA55-do), Ocean Model., 130, 79–139, 2018. a
Tsujino, H., Urakawa, L. S., Griffies, S. M., Danabasoglu, G., Adcroft, A. J., Amaral, A. E., Arsouze, T., Bentsen, M., Bernardello, R., Böning, C. W., Bozec, A., Chassignet, E. P., Danilov, S., Dussin, R., Exarchou, E., Fogli, P. G., Fox-Kemper, B., Guo, C., Ilicak, M., Iovino, D., Kim, W. M., Koldunov, N., Lapin, V., Li, Y., Lin, P., Lindsay, K., Liu, H., Long, M. C., Komuro, Y., Marsland, S. J., Masina, S., Nummelin, A., Rieck, J. K., Ruprich-Robert, Y., Scheinert, M., Sicardi, V., Sidorenko, D., Suzuki, T., Tatebe, H., Wang, Q., Yeager, S. G., and Yu, Z.: Evaluation of global ocean–sea-ice model simulations based on the experimental protocols of the Ocean Model Intercomparison Project phase 2 (OMIP-2), Geosci. Model Dev., 13, 3643–3708, https://doi.org/10.5194/gmd-13-3643-2020, 2020. a, b, c
van den Berk, J. and Drijfhout, S. S.: A realistic freshwater forcing protocol for ocean-coupled climate models, Ocean Model., 81, 36–48, https://doi.org/10.1016/j.ocemod.2014.07.003, 2014. a
Vizcaino, M., Mikolajewicz, U., Ziemen, F., Rodehacke, C. B., Greve, R., and van den Broeke, M. R.: Coupled simulations of Greenland Ice Sheet and climate change up to A.D. 2300, Geophys. Res. Lett., 42, 3927–3935, https://doi.org/10.1002/2014GL061142, 2015. a
Wang, C. and Beckmann, A.: Investigation of the impact of Antarctic ice-shelf melting in a global ice–ocean model (ORCA2-LIM), Ann. Glaciol., 46, 78–82, https://doi.org/10.3189/172756407782871602, 2007. a
Weaver, A. J., Saenko, O. A., Clark, P. U., and Mitrovica, J. X.: Meltwater Pulse 1A from Antarctica as a Trigger of the Bølling-Allerød Warm Interval, Science, 299, 1709–1713, https://doi.org/10.1126/science.1081002, 2003. a
Zanowski, H. and Hallberg, R.: Weddell Polynya Transport Mechanisms in the Abyssal Ocean, J. Phys. Oceanogr., 47, 2907–2925, https://doi.org/10.1175/JPO-D-17-0091.1, 2017. a
Zhang, L., Delworth, T. L., Cooke, W., and Yang, X.: Natural variability of Southern Ocean convection as a driver of observed climate trends, Nat. Clim. Change, 9, 59–65, https://doi.org/10.1038/s41558-018-0350-3, 2019. a
Ziehn, T., Chamberlain, M. A., Law, R. M., Lenton, A., Bodman, R. W., Dix, M., Stevens, L., Wang, Y.-P., Srbinovsky, J., Ziehn, T., Chamberlain, M. A., Law, R. M., Lenton, A., Bodman, R. W., Dix, M., Stevens, L., Wang, Y.-P., and Srbinovsky, J.: The Australian Earth System Model: ACCESS-ESM1.5, Journal of Southern Hemisphere Earth Systems Science, 70, 193–214, https://doi.org/10.1071/ES19035, 2020. a
- Abstract
- Introduction
- Mass balance of Antarctic ice sheet and ice shelves
- Scientific objectives
- Interpreting SOFIA results
- Ongoing work and activities
- Appendix A: Experimental design
- Code and data availability
- Author contributions
- Competing interests
- Disclaimer
- Acknowledgements
- Financial support
- Review statement
- References