the Creative Commons Attribution 4.0 License.
the Creative Commons Attribution 4.0 License.
 | 26 Oct 2023
Application of the Multi-Scale Infrastructure for Chemistry and Aerosols version 0 (MUSICAv0) for air quality research in Africa
Louisa K. Emmons
Helen M. Worden
Rajesh Kumar
Cenlin He
Benjamin Gaubert
Zhonghua Zheng
Simone Tilmes
Rebecca R. Buchholz
Sara-Eva Martinez-Alonso
Claire Granier
Antonin Soulie
Kathryn McKain
Bruce C. Daube
Jeff Peischl
Chelsea Thompson
Pieternel Levelt
The Multi-Scale Infrastructure for Chemistry and Aerosols Version 0 (MUSICAv0) is a new community modeling infrastructure that enables the study of atmospheric composition and chemistry across all relevant scales. We develop a MUSICAv0 grid with Africa refinement (∼ 28 km × 28 km over Africa). We evaluate the MUSICAv0 simulation for 2017 with in situ observations and compare the model results to satellite products over Africa. A simulation from the Weather Research and Forecasting model coupled with Chemistry (WRF-Chem), a regional model that is widely used in Africa studies, is also included in the analyses as a reference. Overall, the performance of MUSICAv0 is comparable to WRF-Chem. Both models underestimate carbon monoxide (CO) compared to in situ observations and satellite CO column retrievals from the Measurements of Pollution in the Troposphere (MOPITT) satellite instrument. MUSICAv0 tends to overestimate ozone (O3), likely due to overestimated stratosphere-to-troposphere flux of ozone. Both models significantly underestimate fine particulate matter (PM2.5) at two surface sites in East Africa. The MUSICAv0 simulation agrees better with aerosol optical depth (AOD) retrievals from the Moderate Resolution Imaging Spectroradiometer (MODIS) and tropospheric nitrogen dioxide (NO2) column retrievals from the Ozone Monitoring Instrument (OMI) than WRF-Chem. MUSICAv0 has a consistently lower tropospheric formaldehyde (HCHO) column than OMI retrievals. Based on model–satellite discrepancies between MUSICAv0 and WRF-Chem and MOPITT CO, MODIS AOD, and OMI tropospheric NO2, we find that future field campaign(s) and more in situ observations in the East African region (5∘ S–5∘ N, 30–45∘ E) could substantially improve the predictive skill of atmospheric chemistry model(s). This suggested focus region exhibits the largest model–in situ observation discrepancies, as well as targets for high population density, land cover variability, and anthropogenic pollution sources.
- Article
(12599 KB) - Full-text XML
-
Supplement
(10015 KB) - BibTeX
- EndNote


As one of the most dramatically changing continents, Africa is experiencing myriad environmental sustainability issues (e.g., Davidson et al., 2003; Washington et al., 2006; Ziervogel et al., 2014; Boone et al., 2016; Swilling et al., 2016; Baudoin et al., 2017; Güneralp et al., 2017; Nicholson, 2019; Fisher et al., 2021; Langerman et al., 2023). These environmental issues are causing vast losses in lives and in African economies and are coupled with poverty and underdevelopment (Washington et al., 2006; Fisher et al., 2021). Some of these environmental challenges are particularly severe in Africa compared to many other regions of the world (e.g., droughts, floods, high temperatures, land degradation, and fires; Washington et al., 2006; Nka et al., 2015; van der Werf et al., 2017; Haile et al., 2019). However, even though Africa is the second-largest continent in land area and population, attention and research regarding environmental challenges in Africa are very limited, leading to a deficit of knowledge and solutions (e.g., De Longueville et al., 2010). The Intergovernmental Panel on Climate Change (IPCC) computes a human vulnerability metric from existing challenges such as poverty and access to health care; expected mortality for climate hazards such as heat, drought, flood, and fires; and constraints on adaptation like funding and government infrastructure (Moss et al., 2001). Many regions in Africa exhibit the most extreme values for this metric.
Degraded air quality is an example of a severe environmental challenge with growing importance in Africa (e.g., Kinney et al., 2011; Naiker et al., 2012; Liousse et al., 2014; Thompson et al., 2014; Amegah and Agyei-Mensah, 2017; Heft-Neal et al., 2018; Fisher et al., 2021; Okure et al., 2022; Vohra et al., 2022). A previous study found that air pollution across Africa caused ∼ 1.1 million deaths in 2019 (Fisher et al., 2021). However, the study of air quality in Africa is hindered by the scarcity of ground-based observations (e.g., Paton-Walsh et al., 2022; Kalisa et al., 2023), modeling capability, and the use of satellite observations. In this paper, we will focus on air quality analyses over Africa with the new model Multi-Scale Infrastructure for Chemistry and Aerosols (MUSICA; Pfister et al., 2020).
Atmospheric chemistry modeling is a useful tool to provide air quality forecasts and to understand chemical processes. Various models have been applied to study atmospheric chemistry and air quality in Africa, such as the Weather Research and Forecasting (WRF) model coupled with Chemistry (WRF-Chem) (e.g., Kuik et al., 2015; Kumar et al., 2022; Jenkins and Gueye, 2022), the GEOS-Chem chemical transport model (e.g., Marais et al., 2012, 2019; Lacey et al., 2017), the CHIMERE chemical transport model (e.g., Menut et al., 2018; Mazzeo et al., 2022), the UK Earth System Model (UKESM1) (Brown et al., 2022), and GEOS5 (Bauer et al., 2019).
MUSICA is a new state-of-the-art community modeling infrastructure that enables the study of atmospheric composition and chemistry across all relevant scales (Pfister et al., 2020). The newly developed MUSICA Version 0 (MUSICAv0) is a global chemistry–climate model that allows global simulations with regional refinement down to a few kilometers spatial resolution (Schwantes et al., 2022). The coupling with other components of the Earth system (e.g., land, ocean, and sea ice) can also be performed at multiple scales. MUSICAv0 has various advantages and is particularly suitable for research applications over Africa. For example, MUSICAv0 can be used to study the interactions between atmospheric chemistry and other components of the Earth system and climate. MUSICA also includes the whole atmosphere (from the surface to thermosphere) and therefore can also be used to study the stratosphere and above and interactions between the stratosphere and troposphere. This is critical because some of the environmental issues are coupled (e.g., the ozone–climate penalty; Brown et al., 2022). In addition, as a global model, MUSICAv0 does not require boundary conditions to study a region at high resolution. Global impacts and interactions can be simulated in a consistent and coherent way. This feature is important as inflow from other continents and oceans significantly impacts air quality in Africa. MUSICAv0 has been evaluated over North America (Schwantes et al., 2022; Tang et al., 2022) and is also being developed and tested in other regions around the globe (https://wiki.ucar.edu/display/MUSICA/Available+Grids, last access: 6 October 2023).
This paper serves as the basis for the future application of MUSICAv0 in Africa. In this study, we develop a MUSICAv0 model grid with regional refinement over Africa. Because MUSICAv0 with Africa refinement is newly developed, while WRF-Chem has been previously used for African atmospheric chemistry and air quality studies, here we include results from WRF-Chem to assess the ability of MUSICAv0 in reproducing the regional features of atmospheric composition as simulated by WRF-Chem. We conduct the MUSICAv0 simulation for the year 2017 to compare it with a previous WRF-Chem simulation (Kumar et al., 2022). MUSICAv0, the WRF-Chem simulation, and the observational data used in this study are described in Sect. 2. The MUSICAv0 model simulation results are evaluated against in situ observations and compared with satellite retrievals in Sect. 3. In Sect. 4, we provide an example application of MUSICAv0 over Africa – identifying key potential regions in Africa for future in situ observations and field campaign(s).
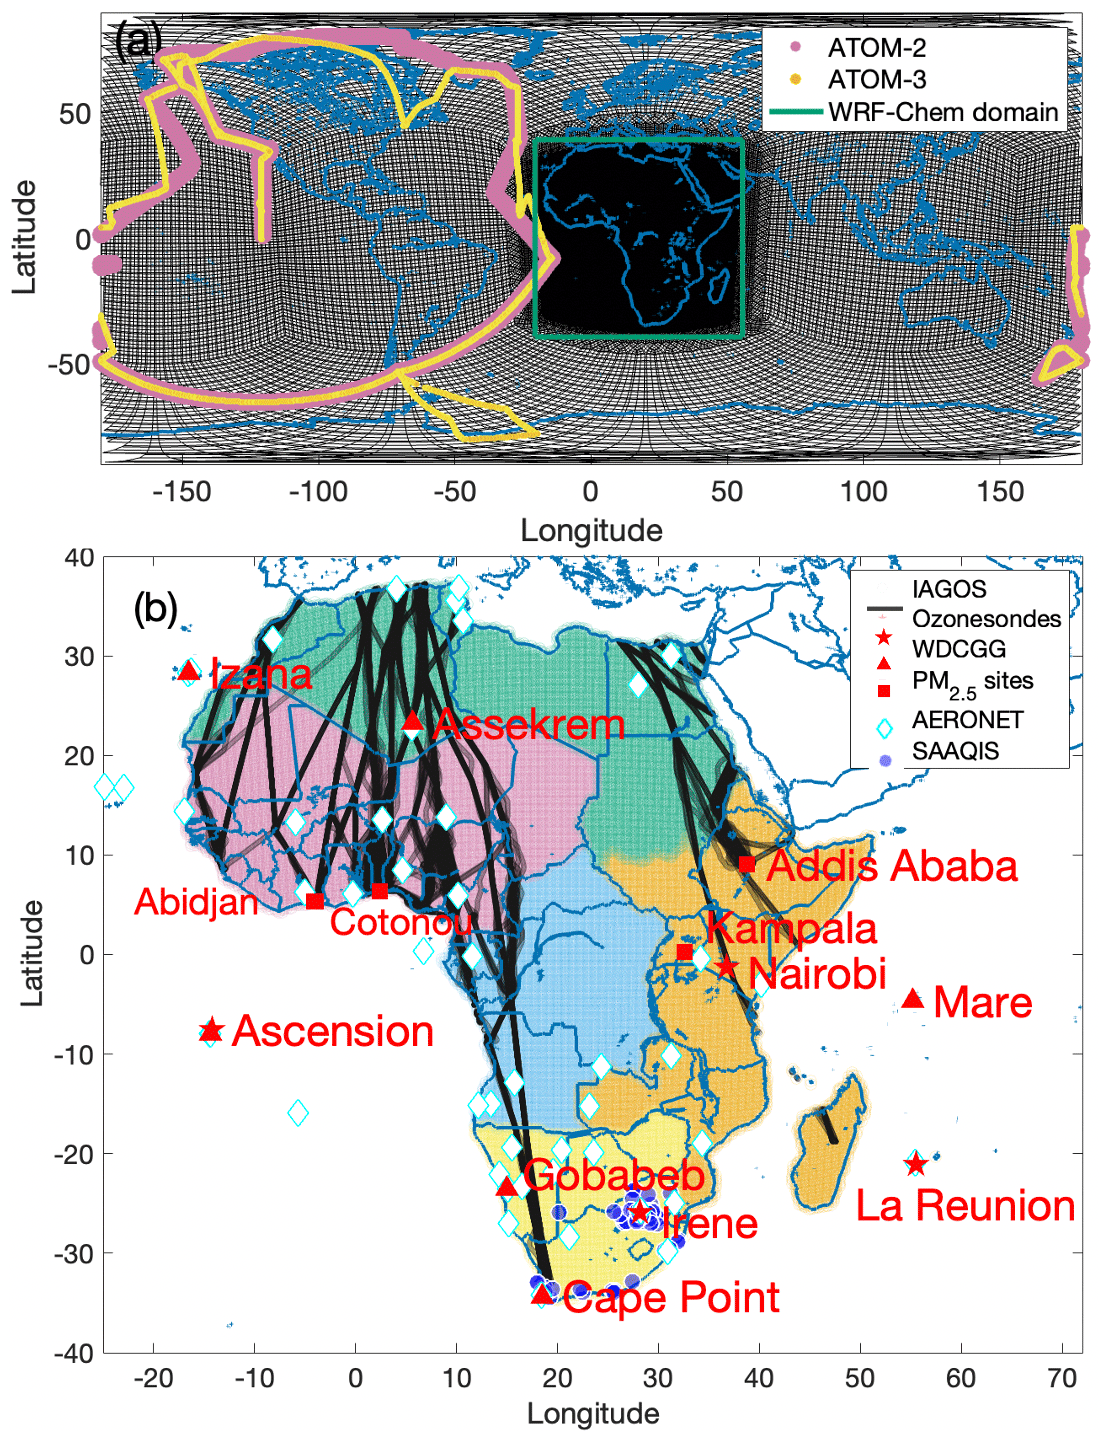
Figure 1Model grid, in situ observations used in this study, and sub-regions in Africa. (a) MUSICAv0 model grid developed for Africa in this study (black), domain boundary of the WRF-Chem simulation compared in this study (shown by green box), and observations from the Atmospheric Tomography Mission (ATom) field campaign 2 (ATom-2; January 2017 to February 2017; pink) and ATom-3 (September 2017 to October 2017; yellow). (b) Sub-regions in Africa are shown, namely North Africa (green), West Africa (pink), East Africa (orange), Central Africa (blue), and Southern Africa (yellow). Location of in situ observations are labeled on the map. Flight tracks of the In-service Aircraft for a Global Observing System (IAGOS) are shown with black lines. Four ozonesonde sites are shown by pentagrams (Ascension, Irene, Nairobi, and La Réunion); six sites from the World Data Centre for Greenhouse Gases are shown by triangles (Assekrem, Cape Point, Izaña, Gobabeb, Mare, and Ascension); surface sites for PM2.5 are shown by squares (Addis Ababa and Kampala in East Africa and Abidjan and Cotonou in West Africa); AErosol RObotic NETwork (AERONET) sites are shown with diamonds; South Africa Air Quality Information System (SAAQIS) sites are shown with blue circles.
2.1 MUSICAv0
MUSICA is a newly developed framework for simulations of large-scale atmospheric phenomena in a global modeling framework, while still resolving chemistry at emission- and exposure-relevant scales (Pfister et al., 2020). MUSICA version 0 (MUSICAv0) is a configuration of the Community Earth System Model (CESM). It is also known as the Community Atmospheric Model with chemistry (CAM-chem) (Tilmes et al., 2019; Emmons et al., 2020) with regional refinement (RR) down to a few kilometers (Lauritzen et al., 2018; Schwantes et al., 2022). CAM-chem, and thus MUSICAv0, includes several choices of chemical mechanisms of varying complexity. This study uses the default MOZART-TS1 chemical mechanism for gas-phase chemistry (including comprehensive tropospheric and stratospheric chemistry; Emmons et al., 2020) and the four-mode version of the Modal Aerosol Module (MAM4; Liu et al., 2016) for the aerosol scheme. The generation of desert dust particles in MUSICAv0 is calculated based on the Dust Entrainment and Deposition Model (Mahowald et al., 2006; Yoshioka et al., 2007). Dust emissions calculation is sensitive to the model surface wind speed. The dust aerosol processes in the MUSICAv0 simulation are simulated based on the MAM4 model (Liu et al., 2016). MAM4 has four modes – Aitken, accumulation, coarse, and primary carbon modes. Dust is mostly in the accumulation and coarse modes. The MUSICAv0 model source code and the model documentation can be downloaded through https://wiki.ucar.edu/display/MUSICA/MUSICA+Home (last access: 3 April 2023).
The MUSICAv0 users have the option to create their own model grid. MUSICAv0 is currently being developed and tested for applications over various regions globally (https://wiki.ucar.edu/display/MUSICA/Available+Grids, last access: 6 October 2023), including North America, India, East Asia, South America, Australia, and Korea (e.g., Schwantes et al., 2022; Tang et al., 2022; Jo et al., 2023). In this study, we develop a model grid for applications in Africa (ne0np4.africa_v5.ne30x4). As shown in Fig. 1a, the horizontal resolution is ∼ 111 km × 111 km (i.e., 1∘ latitude × 1∘ equatorial longitude) globally and ∼ 28 km × 28 km (i.e., 0.25∘ latitude × 0.25∘ equatorial longitude)within the region over Africa. Our simulation uses the default option for vertical layers (i.e., 32 layers from the surface to ∼ 3.64 hPa).
Here we run MUSICAv0 with the model grid for Africa for the year 2017, saving 3-hourly output. We use the Copernicus Atmosphere Monitoring Service Global Anthropogenic emissions (CAMS-GLOB-ANT) version 5.1 (Soulie et al., 2023) for anthropogenic emissions and the Quick Fire Emissions Dataset (QFED) for fire emissions (Darmenov and da Silva, 2013). CAMS-GLOB-ANT version 5.1 emissions can be found at https://eccad3.sedoo.fr/data (last access: 3 April 2023). QFED emissions can be found at https://portal.nccs.nasa.gov/datashare/iesa/aerosol/emissions/QFED/ (last access: 3 April 2023). CAMS-GLOB-ANT version 5.1 (Soulie et al., 2023) is one of the most widely used global inventories for anthropogenic emissions. CAMS-GLOB-ANT version 5.1 has been implemented in MUSICAv0 and evaluated in our previous studies (Tang et al., 2022, 2023; Jo et al., 2023). CAMS-GLOB-ANT version 5.1 does not include information from the Dynamics–Aerosol–Chemistry–Cloud Interactions in West Africa (DACCIWA) project; however, a future version of CAMS-GLOB-ANT is expected to include DACCIWA for Africa. In future work on this topic, we plan to make use of regional emissions inventories, such as the DACCIWA emission inventory. Plume rise climatology is applied to fire emissions following Tang et al. (2022). In addition, we also include open waste burning (https://www.acom.ucar.edu/Data/fire/, last access: 6 October 2023; Wiedinmyer et al., 2014) emissions in the simulation. The model has the option of a free-running atmosphere or nudging to external meteorological reanalysis. In this simulation, only wind and temperature are nudged to the Modern-Era Retrospective analysis for Research and Applications version 2 (MERRA-2; Gelaro et al., 2017) with a relaxation time of 12 h. MERRA-2 data can be found at https://disc.gsfc.nasa.gov/datasets?project=MERRA-2 (last access: 3 April 2023).
We also added carbon monoxide (CO) tracers in the simulation to understand the source and transport of air pollution. CO tracers in CAM-chem and MUSICAv0 are described in detail by Tang et al. (2019). In this study we include tracers for six regions (North Africa, West Africa, East Africa, Central Africa, Southern Africa, and the rest of the world) and three emission sources separately (anthropogenic emissions, fire emissions, and open waste burning emissions). In total, there are 18 tagged CO tracers.
2.2 WRF-Chem
The Weather Research and Forecasting (WRF) model coupled with Chemistry (WRF-Chem) is a regional chemical transport model. It has been widely used for air quality studies in Africa. In this study we use model results from a WRF-Chem simulation described by Kumar et al. (2022). The WRF-Chem simulation has a grid spacing of 20 km, slightly higher than the MUSICAv0 simulation, and the model domain is highlighted in Fig. 1a. The simulation has 36 vertical levels from the surface to ∼ 50 hPa. The WRF-Chem simulation uses the Model for Ozone and Related Tracers-4 (MOZART-4) chemical mechanism (Emmons et al., 2010) for tropospheric gas-phase chemistry and the Goddard Global Ozone Chemistry Aerosol Radiation and Transport (GOCART) model (Chin et al., 2002) for aerosol processes. The dust aerosol processes in the WRF-Chem simulation are simulated based on the Goddard Global Ozone Chemistry Aerosol Radiation and Transport (GOCART) model (Chin et al., 2002). Specifically, the dust emission scheme is following the GOCART emission treatment (Ginoux et al., 2001), which is a function of 10 m wind speed, soil moisture, and soil erosion capability. The atmospheric processes of dust are simulated based on the mass mixing ratio and size distribution, which has been divided into five size bins with effective radii of 0.73, 1.4, 2.4, 4.5, and 8.0 µm. The dust dry and wet depositions are also treated following the GOCART scheme (Chin et al., 2002). The European Centre for Medium Range Weather Forecasts (ECMWF) global reanalysis (ERA-Interim) fields are used for initial and boundary meteorology conditions, while another CAM-chem simulation is used for initial and boundary chemical conditions (Kumar et al., 2022). The WRF-Chem simulation used the global Emission Database for Atmospheric Research developed for Hemispheric Transport of Air Pollution (EDGAR-HTAP v2) for anthropogenic emissions and the Fire Inventory from NCAR version 1.5 (FINNv1.5) (Wiedinmyer et al., 2011) for fire emissions. The WRF-Chem output is saved hourly; however, we only use 3-hourly output to match the MUSICAv0 simulation.
2.3 ATom
The Atmospheric Tomography mission (ATom; Thompson et al., 2022) was designed to study the impact of human-produced air pollution on greenhouse gases, chemically reactive gases, and aerosols in remote ocean air masses. ATom data (Wofsy et al., 2021) are available at https://espoarchive.nasa.gov/archive/browse/atom (last access: 3 April 2023). During the project, the DC-8 aircraft sampled the remote troposphere with continuous vertical profiles. There were four seasonal deployments from the summer of 2016 through the spring of 2018. Here we compare the MUSICAv0 simulation with observations from ATom-2 (January–February 2017) and ATom-3 (September–October 2017). Since the ATom flight tracks were mostly outside the WRF-Chem domain (Fig. 1a), we do not compare the WRF-Chem simulation with ATom data. However, we compare chemical species from the MUSICAv0 simulation to the 2 min merged ATom measurements globally to obtain a benchmark and broader understanding of MUSICAv0 performance both within and outside the refined region. The model output is saved along the ATom aircraft flight tracks and with respect to the observational times at run time. Nitric oxide (NO) and ozone (O3) measurements from the NOAA Nitrogen Oxides and Ozone (NOyO3) instrument (Bourgeois et al., 2020, 2021) and the merged CO data (from Quantum Cascade Laser System and NOAA Picarro CO measurements) are used. As we use 2 min merged ATom measurements, there are 2796 data points in ATom-2 (January–February 2017) and 3369 data points in ATom-3 (September–October 2017).
2.4 IAGOS
The In-service Aircraft for a Global Observing System (IAGOS) is a European research infrastructure and was developed for operations on commercial aircraft to monitor atmospheric composition (Petzold et al., 2015). IAGOS data are available at https://www.iagos.org/iagos-data/ (last access: 3 April 2023). The IAGOS instrument package 1 measures CO, O3, air temperature, and water vapor (https://www.iagos.org/iagos-core-instruments/package1/, last access: 6 October 2023). CO is measured by infrared absorption using the gas filter correlation technique (precision: ± 5 %; accuracy: ± 5 ppb), while O3 is measured by UV absorption at 253.7 nm (precision: ± 2 %; accuracy: ± 2 ppb). We use airborne measurements of CO, O3, air temperature, and water vapor from IAGOS for model evaluation. The locations of the IAGOS flight tracks over Africa are shown in Fig. 1b. The model results and IAGOS data comparisons are conducted separately for five African sub-regions (defined in Fig. 1b). The IAGOS instruments are onboard commercial airliners, and the sampling may not be representative of the whole sub-region. For example, IAGOS data over Southern Africa only covers the western part of Southern Africa.
2.5 Ozonesondes
The ozonesonde is a balloon-borne instrument that measures atmospheric O3 profiles through the electrochemical concentration cell using iodine–iodide electrode reactions (Thompson et al., 2017), with records of temperature, pressure, and relative humidity from standard radiosondes. NASA and GSFC Southern Hemisphere ADditional OZonesondes (SHADOZ) data are available at https://tropo.gsfc.nasa.gov/shadoz/ (last access: 3 April 2023). We use ozonesonde data from NASA/GSFC SHADOZ (Thompson et al., 2017; Witte et al., 2017, 2018; Stauffer et al., 2020). Specifically, ozonesonde data from four sites are used (Fig. 1b): Ascension (Ascension Island, UK), Nairobi (Kenya), Irene (South Africa), and La Réunion (La Réunion Island, France). The average O3 measurement uncertainty ranged from 5 %–9 % for the ozonesonde data used in this study.
2.6 WDCGG
Monthly surface CO measurements from the World Data Center for Greenhouse Gases (WDCGG; operated by the Japan Meteorological Agency in collaboration with the World Meteorological Organization) are used for model evaluation. WDCGG data are available at https://gaw.kishou.go.jp/ (last access: 3 April 2023). Data from six sites are used (Fig. 1b), namely (Ascension Island, UK), Assekrem (Algeria; remote site located in the Sahara), Gobabeb (Namibia; located at the base of a linear sand dune, next to an inter-dune plain), Cape Point (South Africa; site exposed to the sea on top of a cliff 230 m above sea level), Izaña (Tenerife, Spain; located on the Island that is ∼ 300 km west of the African coast), and Mare (Seychelles; near an international airport).
2.7 Surface PM2.5
At the US embassies, regulatory-grade monitoring data are collected with beta attenuation monitors (BAMs) using a federal equivalent monitoring method with an accuracy within 10 % of federal reference methods (Watson et al., 1998; U.S. EPA, 2016). These instruments are operated by the U.S. State Department and the U.S. EPA, and the data are available through AirNow (https://www.airnow.gov/international/us-embassies-and-consulates/, last access: 6 October 2023). We use the measurements at the US embassy locations in central Addis Ababa (Ethiopia, 9.06∘ N, 38.76∘ E) and Kampala (Uganda, 0.30∘ N, 32.59∘ E) for the year 2017 as references (Malings et al., 2020) to match our simulations. The raw data are made available hourly and for this study we use daily mean PM2.5 for comparison with model simulations. Djossou et al. (2018) presented PM2.5 measurements from February 2015 to March 2017 at two cities in West Africa – Abidjan and Cotonou (Fig. 1b). In Abidjan, there were three sites that are representative of traffic, waste burning at landfill, and domestic fires. The site in Cotonou is close to traffic emissions. The concentrations of PM2.5 particles were measured at a weekly time step by the ambient air pumping technique (Djossou et al., 2018). We compare model results with the weekly PM2.5 measurements from the sites in Abidjan and Cotonou for January–March 2017.
2.8 MOPITT
The Measurements of Pollution in the Troposphere (MOPITT) instrument on board the NASA Terra satellite provides both thermal infrared (TIR) and near-infrared (NIR) radiance measurements since March 2000. MOPITT CO data can be accessed through https://search.earthdata.nasa.gov/search (last access: 3 April 2023). Retrievals of CO column density and vertical profiles are provided in a multispectral TIR–NIR joint product which has sensitivity to near-surface as well as free tropospheric CO (Deeter et al., 2011; Worden et al., 2010). Here we use the MOPITT Version 9 Level 2 CO column product (Deeter et al., 2022) over Africa to evaluate the MUSICAv0 and WRF-Chem simulations. MOPITT Version 9 has significant updates to the cloud detection algorithm and NIR calibration scheme. The MOPITT satellite pixel size is ∼ 22 km × 22 km, and the overpass time is ∼ 10:30 am local time in 2017. When comparing model outputs to MOPITT the recommended data quality filter is applied and model outputs are interpolated to the MOPITT retrievals in space and time. To perform quantitative comparisons, the MOPITT averaging kernel and a priori are used to transform the model CO profiles to derive model column amounts.
2.9 OMI NO2 (QA4ECV)
Tropospheric column NO2 from the Ozone Monitoring Instrument (OMI) on board Aura is compared to the model in this study (Levelt et al., 2006). Specifically, the NO2 product from the quality assurance for the essential climate variables (QA4ECV) project is used (Boersma et al., 2017a; Compernolle et al., 2020). OMI NO2 data are available at https://www.temis.nl/qa4ecv/no2.html (last access: 3 April 2023). The satellite pixel size is ∼ 13 km × 25 km, and the overpass time is ∼ 13:40 LT (local time) in 2017. A data quality filter was applied following the product specification document (Boersma et al., 2017b; processing_error_flag = 0; solar_zenith_angle < 80; snow_ice_flag < 10 or snow_ice_flag = 255; amf_trop/amf_geo > 0.2; and cloud_radiance_fraction_no20 < = 0.5). Model profiles were transformed using the provided tropospheric air mass factor (AMF) and averaging kernels.
2.10 OMI HCHO (QA4ECV)
We also use tropospheric column HCHO from OMI in this study. Similar to OMI NO2, we also use OMI HCHO product from QA4ECV (De Smedt et al., 2017a). OMI HCHO data are available at https://www.temis.nl/qa4ecv/hcho.html (last access: 3 April 2023). A data quality filter was applied following the Product User Guide (De Smedt et al., 2017b; processing_error_flag = 0 and processing_quality_flag = 0). Model profiles were transformed using provided averaging kernels. We note that HCHO retrievals are subject to relatively large uncertainties compared to other satellite products used in this study. Therefore, the comparisons between model results and the OMI HCHO product only indicate the model-satellite discrepancies rather than determining model deficiencies. In addition, the WRF-Chem simulation from Kumar et al. (2022) does not include HCHO in the output and hence will not be compared.
2.11 MODIS AOD
The aerosol optical depth (AOD) product (550 nm) from the Moderate Resolution Imaging Spectroradiometer (MODIS) on board the Terra NASA Terra satellite is used. MODIS AOD data can be accessed through https://search.earthdata.nasa.gov/search (last access: 3 April 2023). Specifically, we used the MODIS Level 2 Collection 6.1 product (MOD04_L2; Levy and Hsu, 2015). Deep Blue Aerosol retrievals are used (Hsu et al., 2013; Levy et al., 2013) to include retrievals over the desert. The MODIS satellite pixel size is ∼ 1 km × 1 km, and the overpass time is ∼ 10:30 LT. East and Southern Africa have complex terrain due to mountains and rift valleys. This may lead to some uncertainties in MODIS AOD retrievals.
2.12 AERONET AOD
We use AOD measurements from the AErosol RObotic NETwork (AERONET; Holben et al., 1998, 2001). AERONET data can be accessed through https://aeronet.gsfc.nasa.gov/ (last access: 6 October 2023). We use Level 2 daily data (quality assured) with pre-field and post-field calibration applied that have been automatically cloud cleared and manually inspected. AOD data at 675 nm from AERONET are converted to AOD data at 550 nm using provided Ångström exponent to compare with modeled AOD at 550 nm.
2.13 SAAQIS
We also compare model results with PM2.5, CO, NO2, and O3 measurements from the South Africa Air Quality Information System (SAAQIS; Gwaze and Mashele, 2018; Tshehla and Wright, 2019). SAAQIS is available at http://saaqis.environment.gov.za/ (last access: 6 October 2023). The data are hourly, and we calculate daily average values before comparing them with model results. Similar to Zhang et al. (2021), we removed negative values and only calculate daily averages when 75 % or more of the hourly data are available.
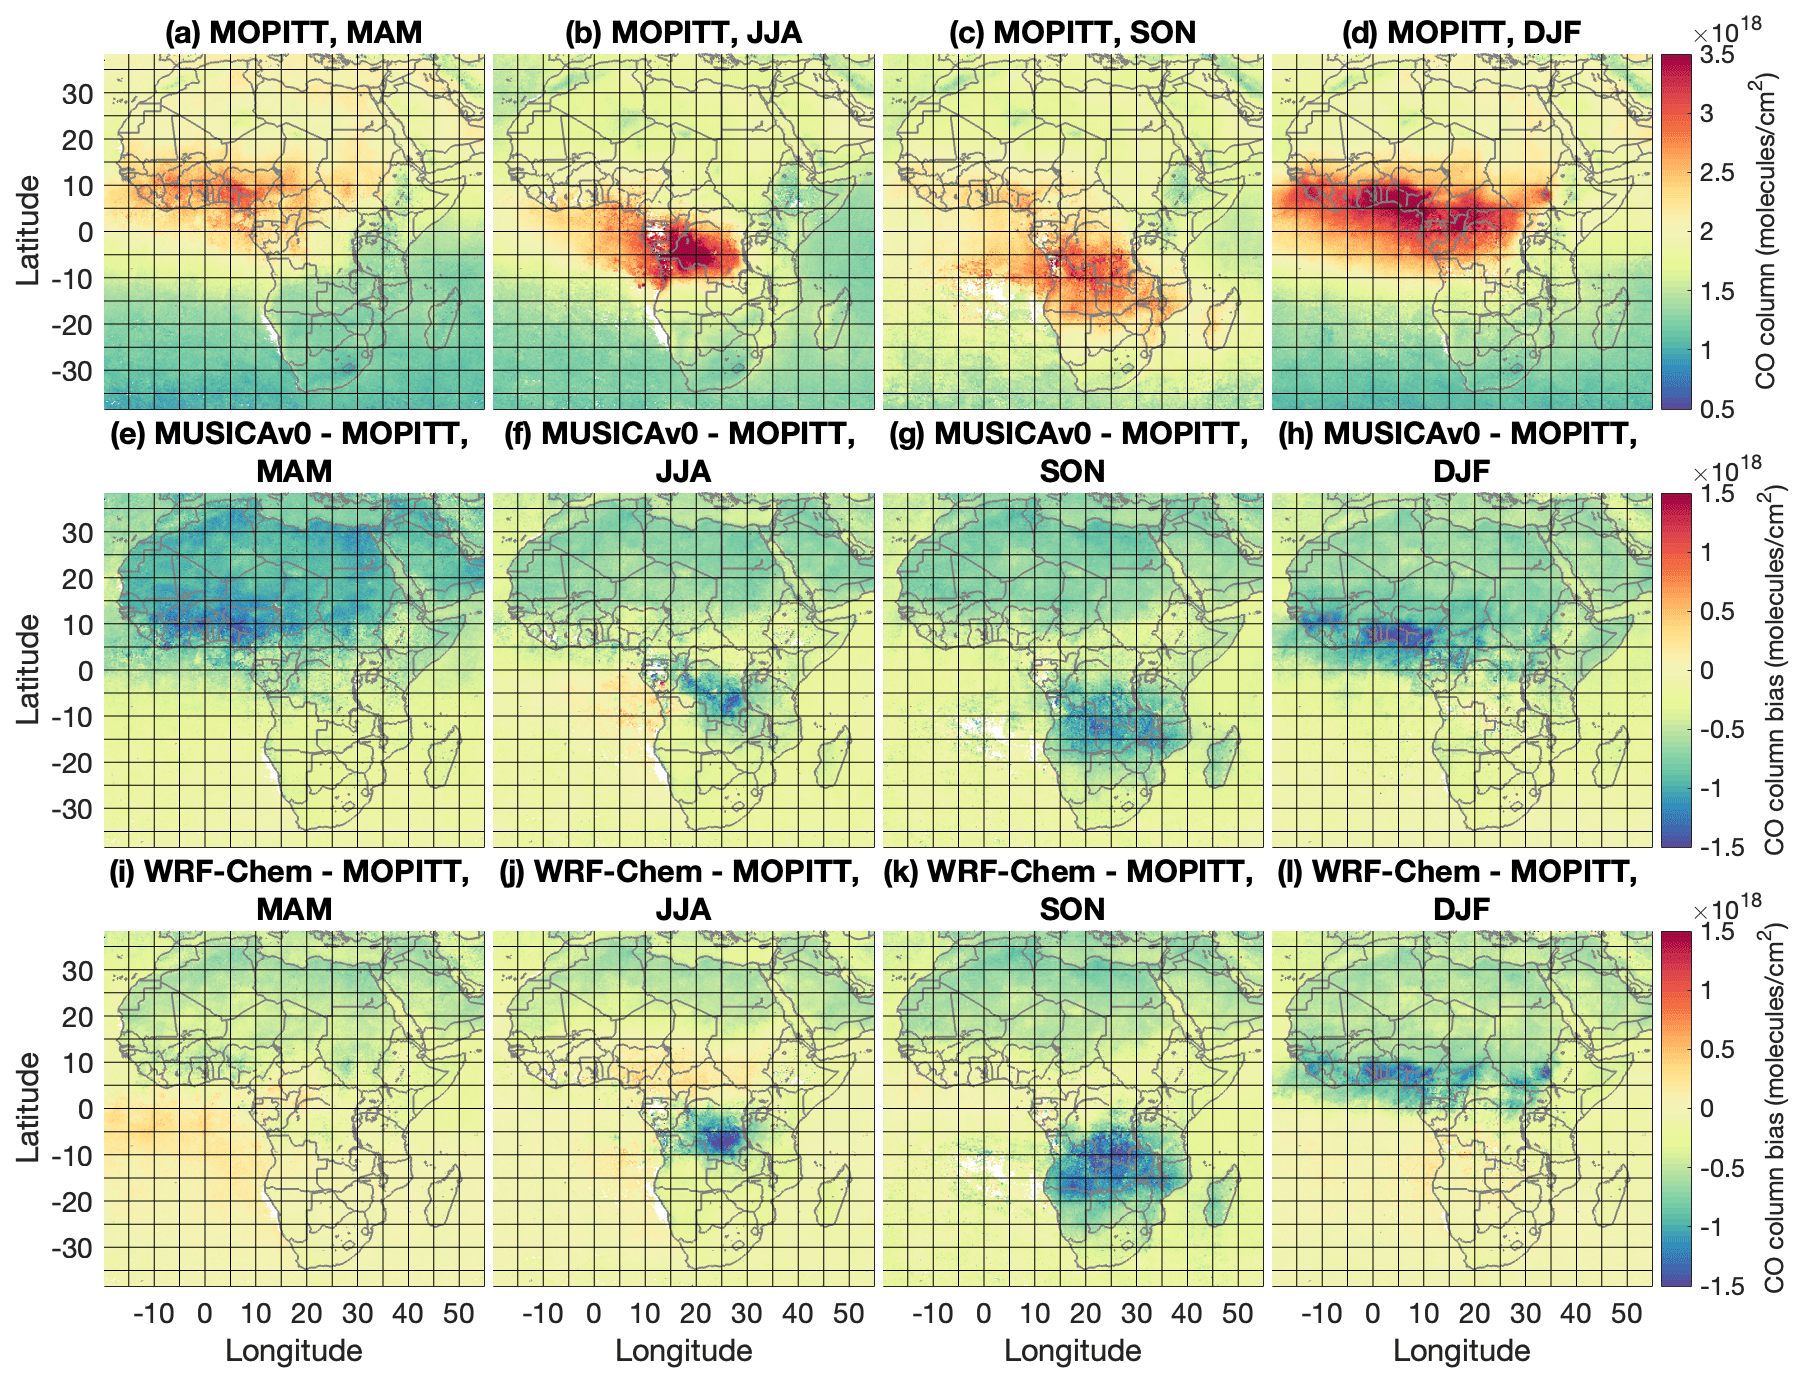
Figure 2Comparisons of MUSICAv0 and WRF-Chem simulations to MOPITT CO column () for each season of 2017. (a–d) Averaged MOPITT CO column: MAM (March, April, and May), JJA (June, July, and August), SON (September, October, and November), and DJF (December, January, and February). (e–h) MUSICAv0 model biases against MOPITT CO column for MAM, JJA, SON, and DJF. Panels (i–l) are the same as (e–h) but for WRF-Chem. All data are gridded to 0.25∘ × 0.25∘ for plotting.
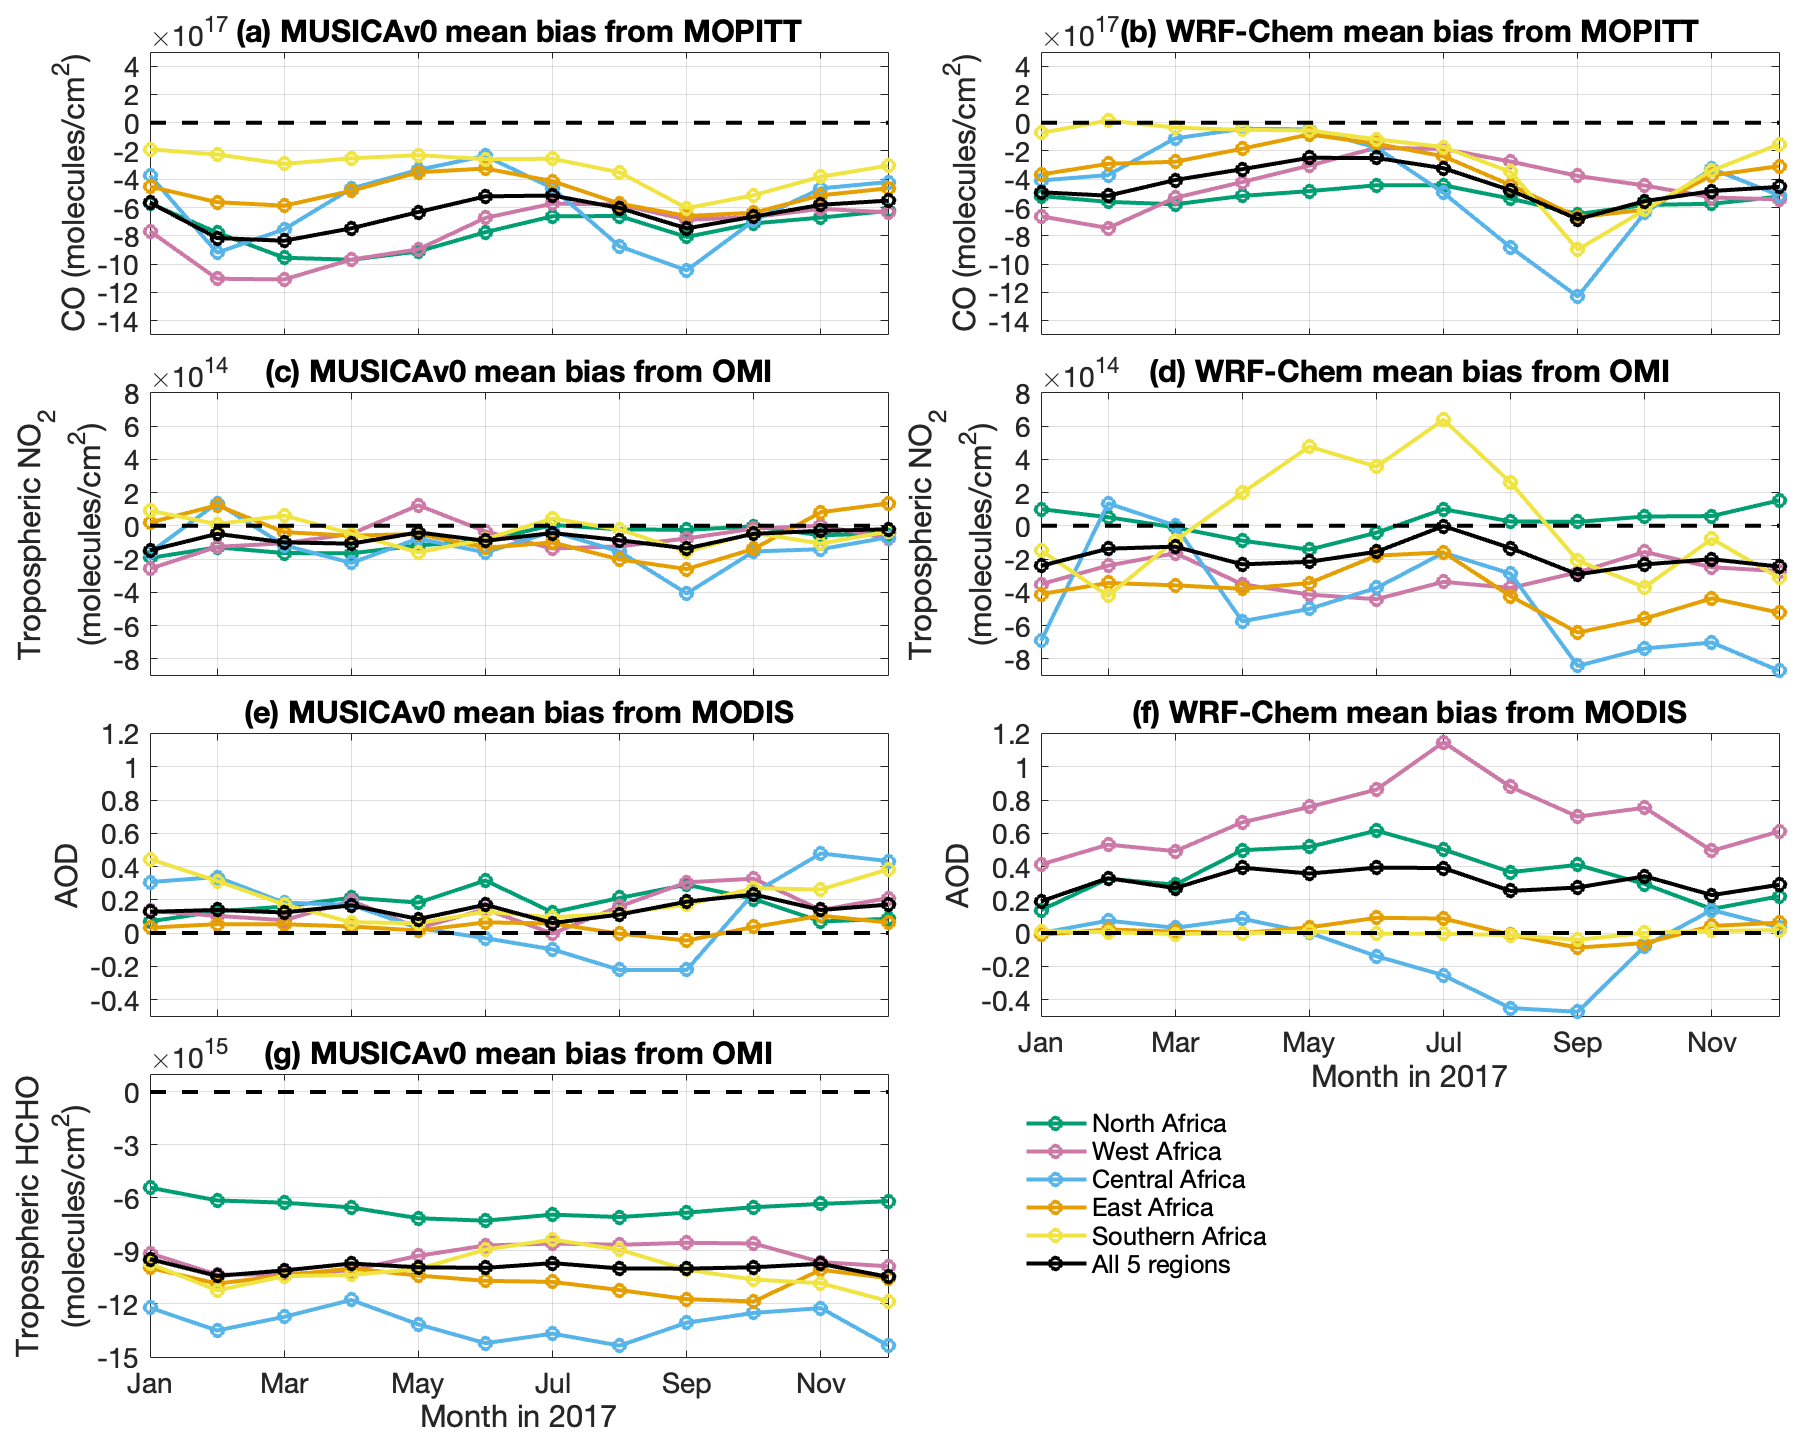
Figure 3Mean bias of MUSICAv0 and WRF-Chem simulations from satellite data. Monthly time series of mean bias of (a) MUSICAv0 and (b) WRF-Chem against MOPITT CO column () in 2017 over Africa (black), North Africa (green), West Africa (pink), East Africa (orange), Central Africa (blue), and Southern Africa (yellow). Panels (c, d) are the same as (a, b) but for mean bias against the OMI tropospheric NO2 column (). Panels (e, f) are the same as (a, b) but for mean bias against MODIS (Terra) aerosol optical depth (AOD). Panel (g) is the same as (a) but for mean bias against the OMI tropospheric HCHO column ().
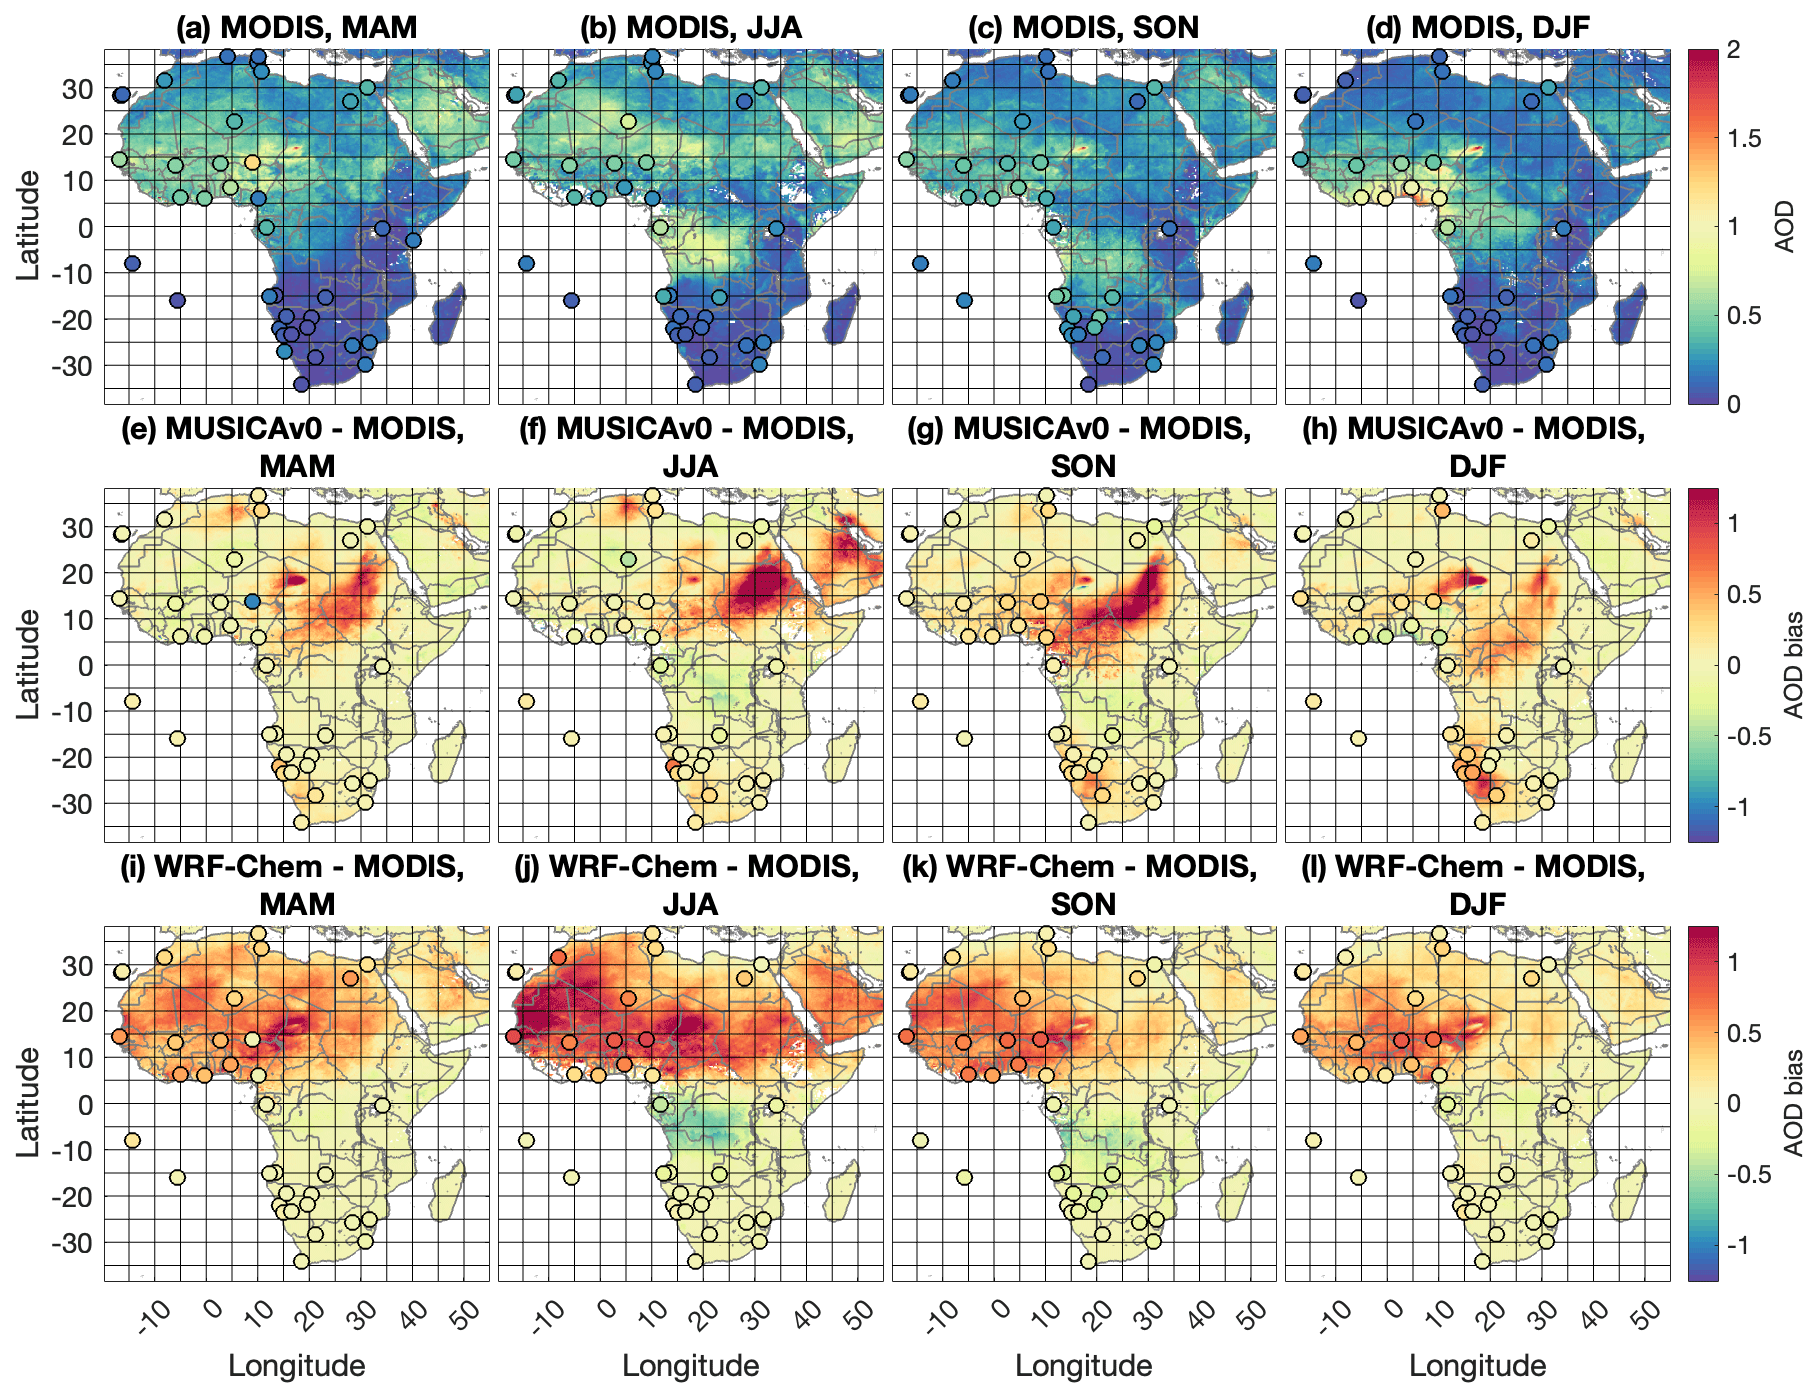
Figure 4Comparisons of MUSICAv0 and WRF-Chem simulations and MODIS and AERONET AOD at 550 nm in 2017. (a–d) Averaged MODIS and AERONET AOD in MAM (March, April, and May), JJA (June, July, and August), SON (September, October, and November), and DJF (December, January, and February). (e–h) MUSICAv0 model biases against MODIS and AERONET AOD in MAM, JJA, SON, and DJF. Panels (i–l) are the same as (e, h) but for WRF-Chem. All data are gridded to 0.25∘ × 0.25∘ for plotting. AERONET AOD in (a–d) and model bias against AERONET AOD in (e–l) are shown by the circles overlaid on the map.
Africa includes a wide range of environments and emissions sources. Therefore, in this section we separate the continent in five sub-regions for analysis following Kumar et al. (2022). CO is a good tracer of anthropogenic and biomass burning emissions, and modeled CO tracers are used in this section to understand sources. CO is a commonly used tracer in models with only one photochemical sink and an intermediate lifetime (e.g., Tang et al., 2019). CO tracers also allow clear identification of simulated anthropogenic and biomass burning contributions. Therefore, tagging CO is computationally efficient, and tagged CO is relatively reliable as a tracer in models. Meteorology has a significant impact on the distributions of pollutants across the regions (e.g., Gordon et al., 2023). The CO tracers in the model go through the same model processes (e.g., transport) as CO. Therefore, the source contribution shown by the CO tracers is a result of both emissions and transport. Figure 2 shows the seasonal averages of CO column distributions over Africa from MOPITT along with the MUSICAv0 and WRF-Chem biases. The highest levels of CO in these maps are primarily associated with biomass burning, which moves around the continent with season. Both MUSICAv0 and WRF-Chem simulations underestimate the CO column compared to MOPITT (Fig. 3a and b). Overall, MUSICAv0 agrees better with the OMI tropospheric NO2 column (Fig. 3c) and MODIS AOD (Fig. 3e) than WRF-Chem (Fig. 3d and f). The MUSICAv0 simulation overall has lower tropospheric HCHO column than OMI in all regions and seasons (Fig. 3g). Spatial distributions of model biases against the OMI tropospheric NO2 column, MODIS AOD, and OMI tropospheric HCHO column are included in Fig. 4 and Figs. S1 and S2 in the Supplement. In this section we compare the model results with satellite data and in situ observations over sub-regions in Africa and oceans near Africa (Fig. 1b). AERONET data are overlaid with MODIS data in Fig. 4. Overall, MODIS and AERONET AOD are consistent.
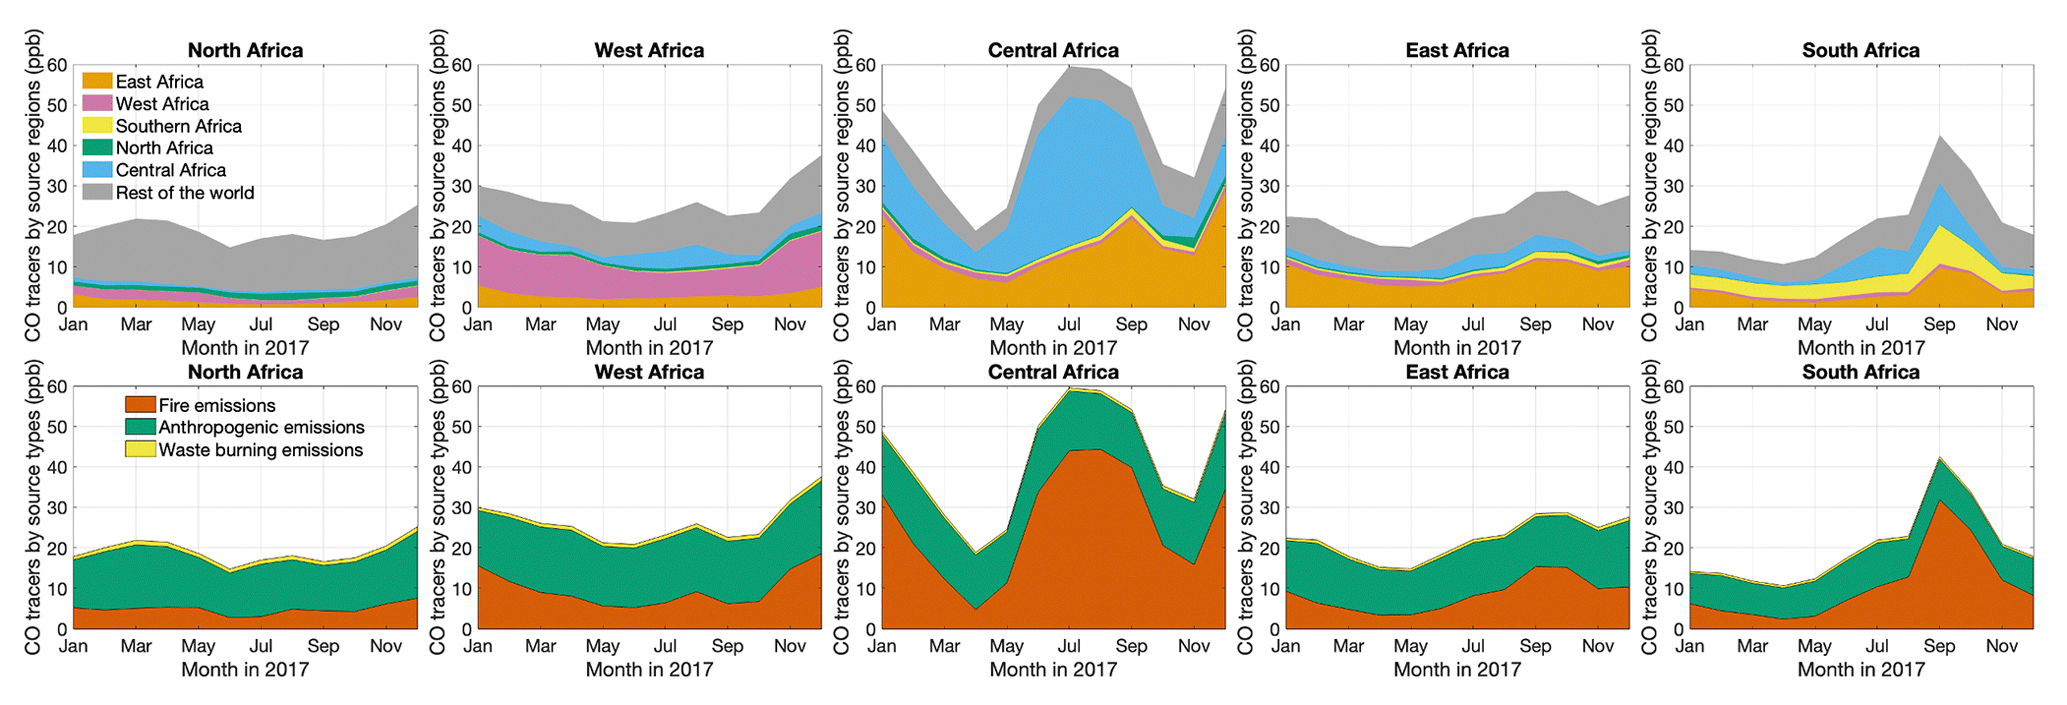
Figure 5Monthly time series of column-averaged CO tracers in North Africa, West Africa, East Africa, Central Africa, and Southern Africa. The top panels show CO tracers of emissions from North Africa (green), West Africa (pink), East Africa (orange), Central Africa (blue), Southern Africa (yellow), and the rest of the world (grey). The bottom panels show CO tracers of fire emissions (red), anthropogenic emissions (green), and waste burning emissions (yellow).
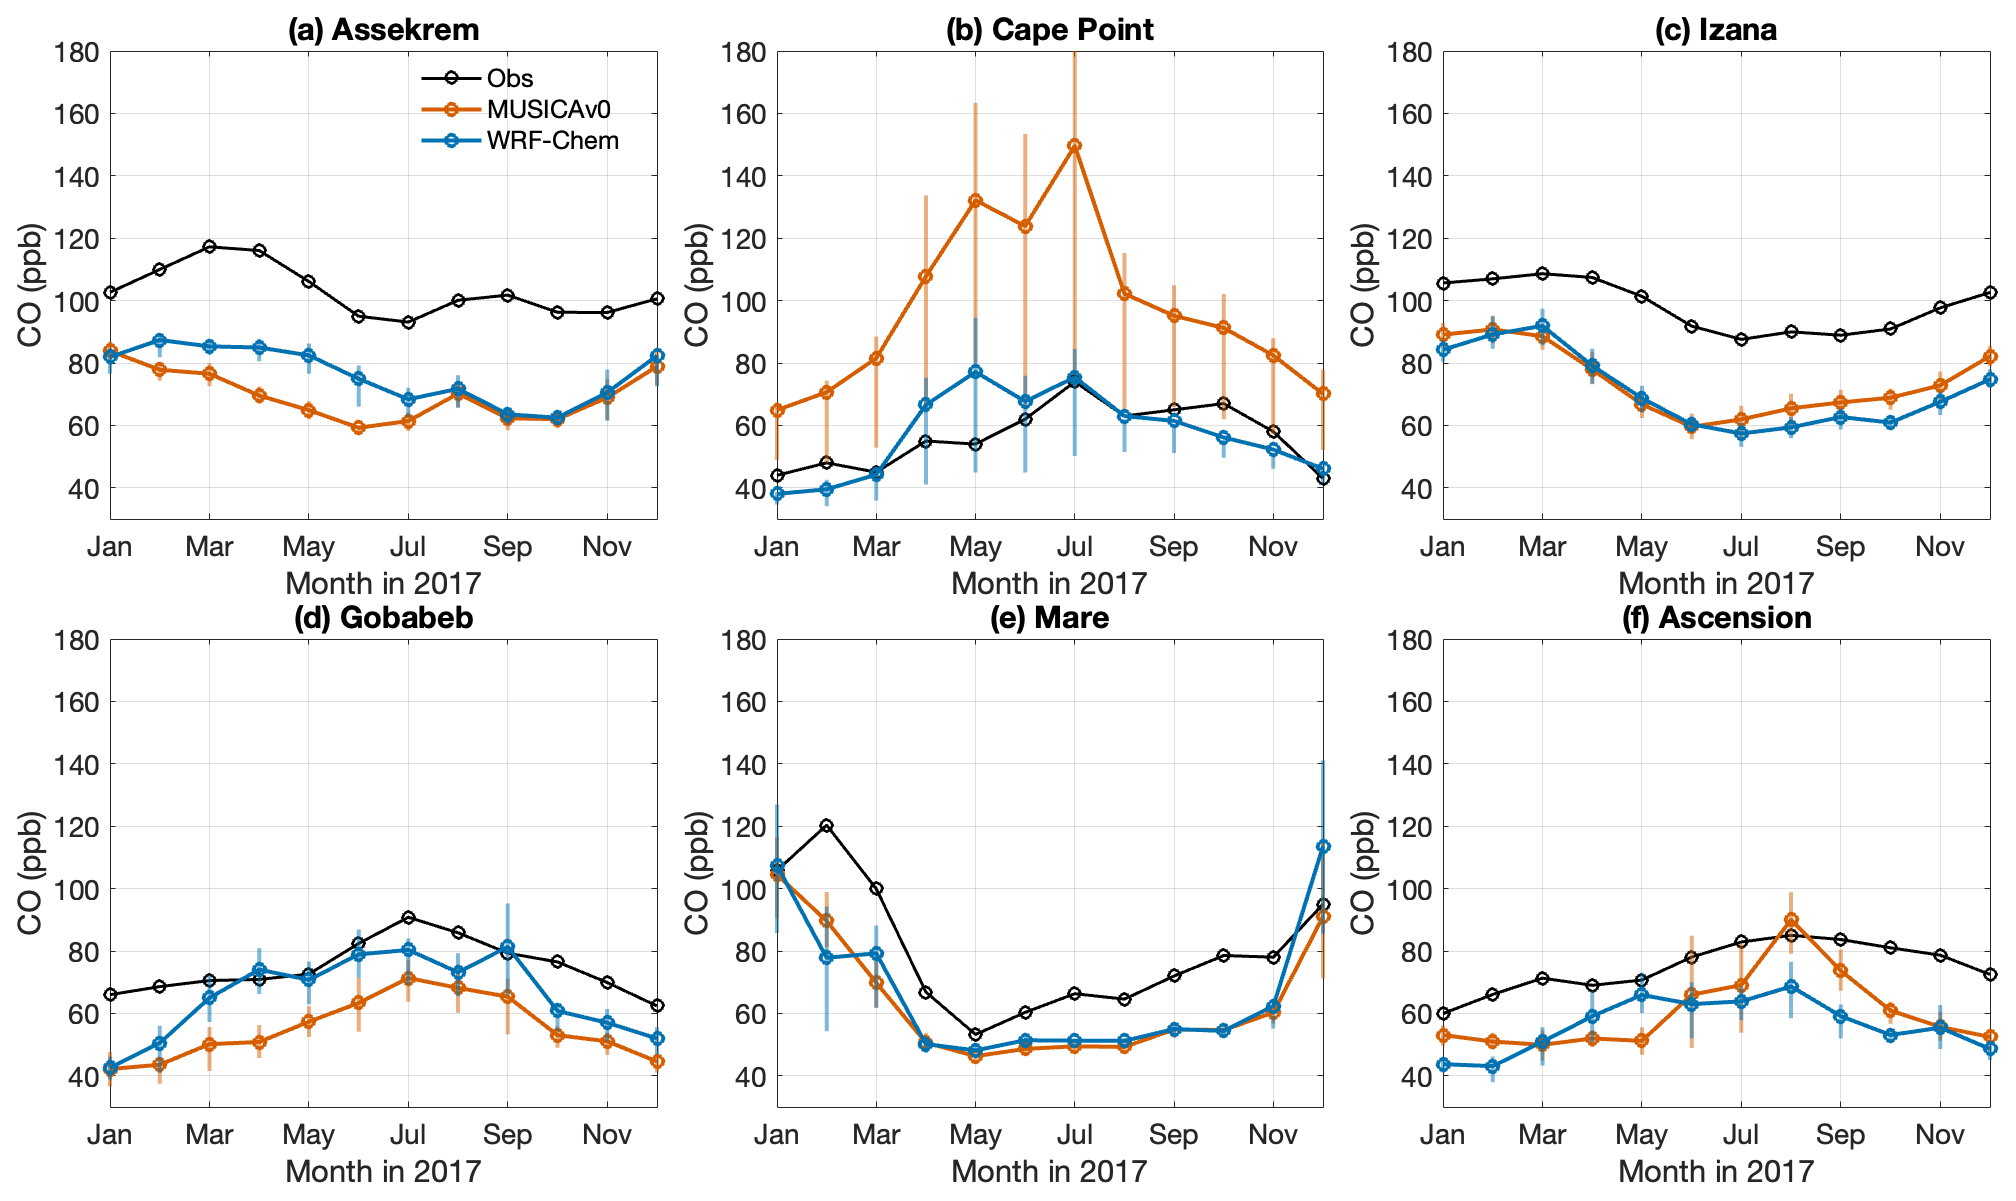
Figure 6Monthly mean CO (ppb) from in situ observations (black), MUSICAv0 (red), and WRF-Chem (blue) during 2017 at (a) Assekrem, (b) Cape Point, (c) Izaña, (d) Gobabeb, (e) Mare, and (f) Ascension (see Fig. 1b for locations). Monthly means are calculated from 3-hourly data. The range for each data point shows the variation in the 3-hourly data on that day (25 % quantile to 75 % quantile). Observational data are from the World Data Centre for Greenhouse Gases (WDCGG).
3.1 North Africa
Over North Africa, both MUSICAv0 and WRF-Chem simulations underestimate the CO column during 2017 (Figs. 2 and 3). As shown by the tagged model CO tracers (Fig. 5), CO over North Africa is mainly driven by transport of CO from outside the continent and anthropogenic emissions. The model underestimation compared to the MOPITT CO column is consistent with the results of the comparisons with surface CO observations from WDCGG at the two sites located in North Africa (Assekrem and Izaña; Fig. 6a and c). At the two surface sites, the composition of source types and source regions are close to the composition of source types and source regions of the column average over North Africa (Figs. 5 and S3 and S4 in the Supplement); hence, the two sites are representative of the background conditions of North Africa. Compared to MODIS AOD, WRF-Chem has a mean bias of 0.36, whereas MUSICAv0's mean bias is 0.17 for 2017. The model AOD biases over North Africa are likely driven by dust. No comparison is made with IAGOS O3 in North Africa due to data availability.
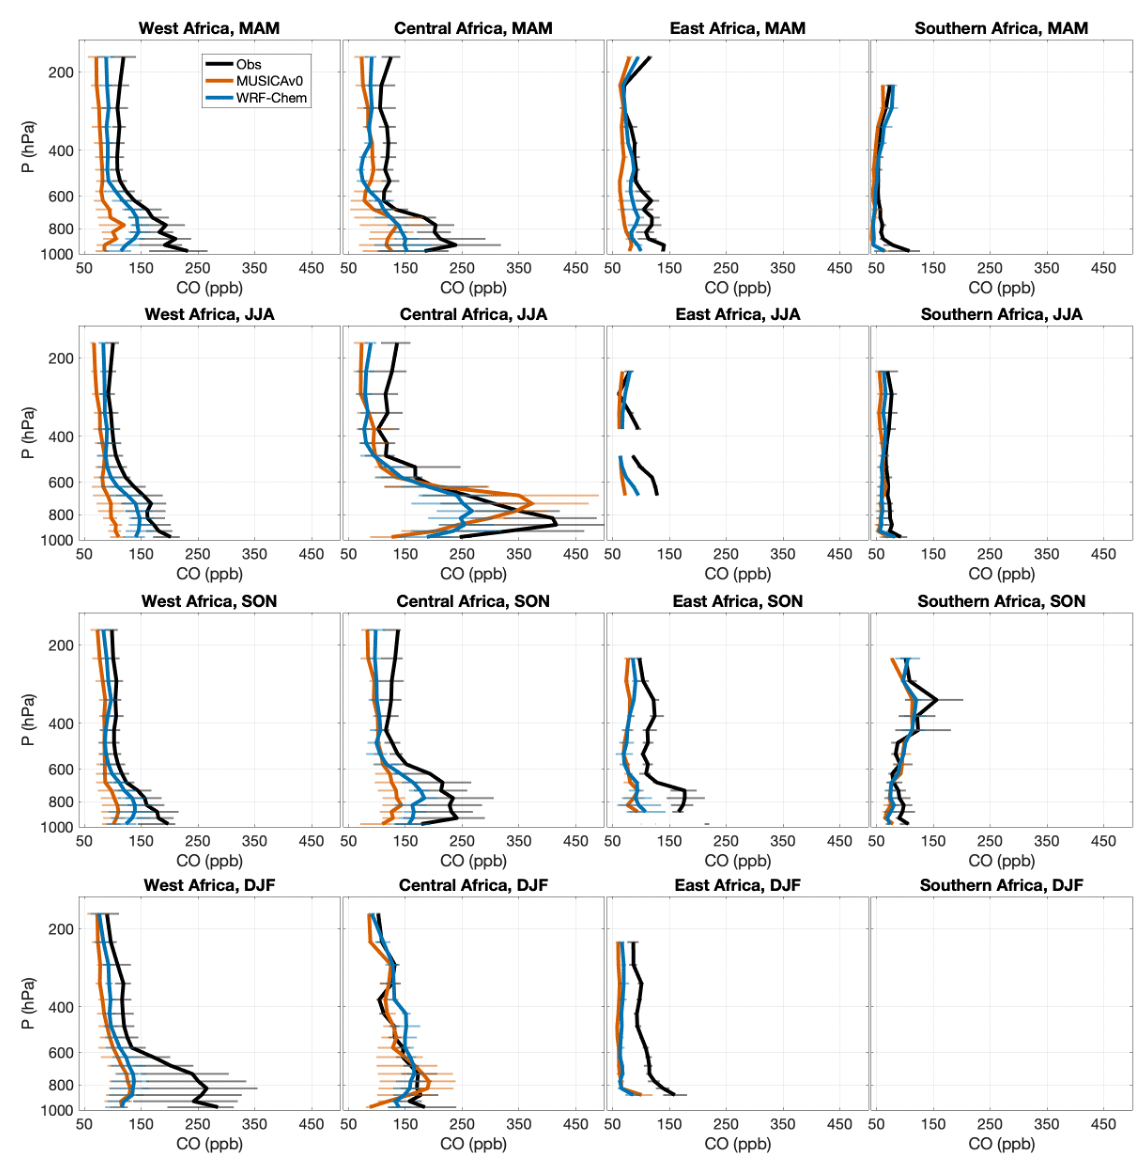
Figure 7Vertical profiles of CO (ppb) from the In-service Aircraft for a Global Observing System (IAGOS) measurements (black) and corresponding model output from MUSICAv0 (red) and WRF-Chem (blue) during different seasons in 2017 over West Africa, Central Africa, East Africa, and Southern Africa. North Africa is not shown due to data availability. Seasonal mean profiles with the variation in the data in the pressure layer (25 % quantile to 75 % quantile) in MAM (March, April, and May), JJA (June, July, and August), SON (September, October, and November), and DJF (December, January, and February) are shown.
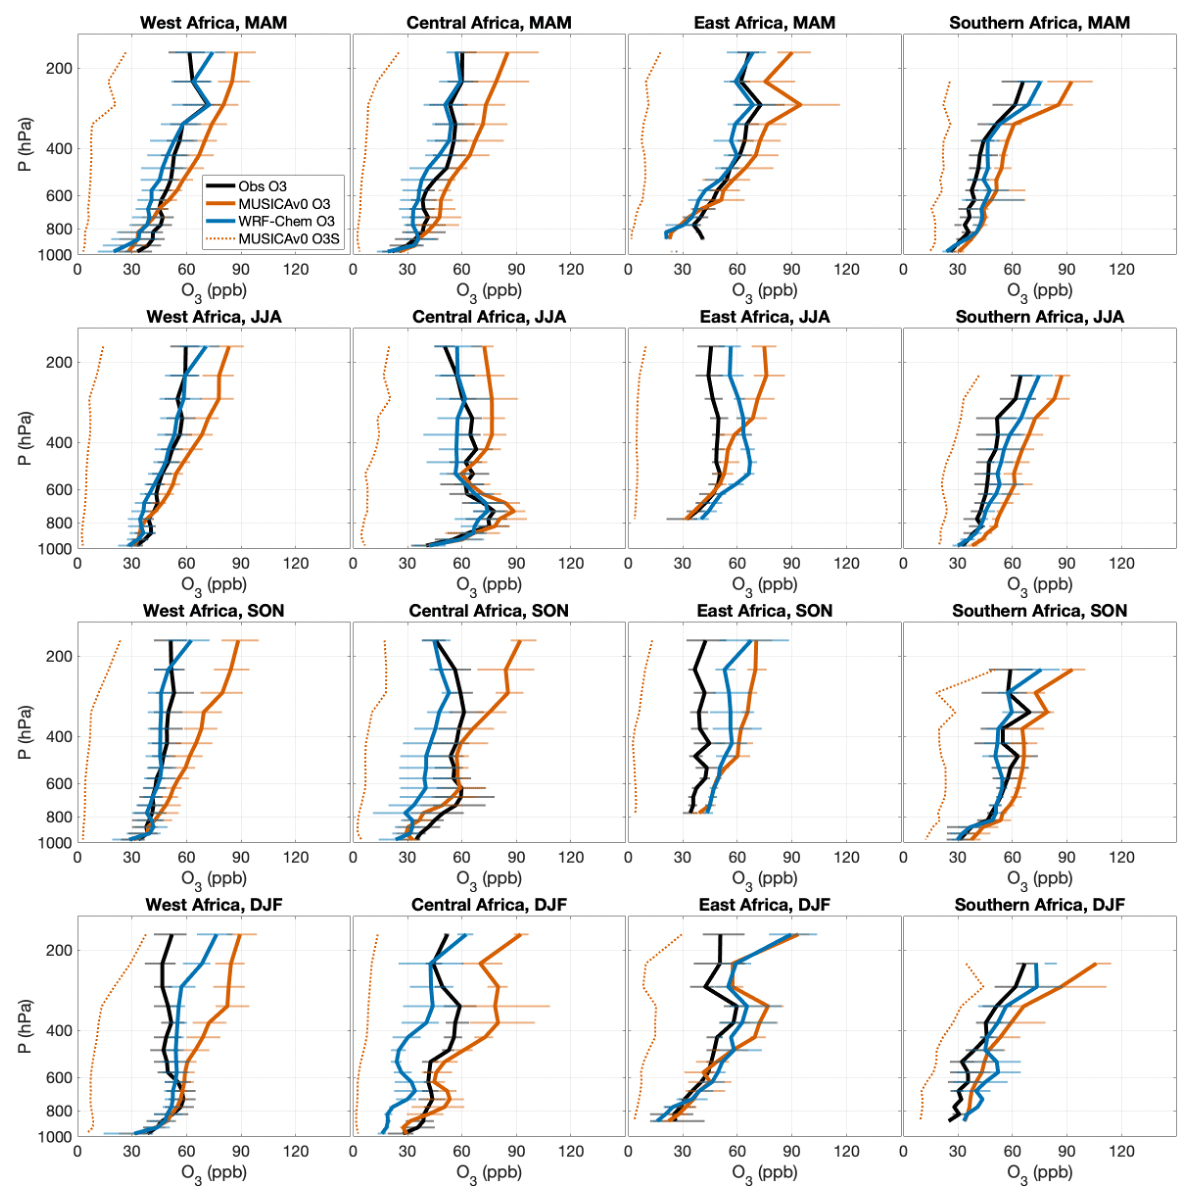
Figure 8Vertical profiles of O3 (ppb) from the In-service Aircraft for a Global Observing System (IAGOS) measurements (black) and corresponding model output from MUSICAv0 (red), and WRF-Chem (blue) during different seasons in 2017 over West Africa, Central Africa, East Africa, and Southern Africa. North Africa is not shown due to data availability. Seasonal mean profiles with the variation in the data in the pressure layer (25 % quantile to 75 % quantile) in MAM (March, April, and May), JJA (June, July, and August), SON (September, October, and November), and DJF (December, January, and February) are shown. The dashed red lines represent O3S (stratospheric ozone tracer) from the MUSICAv0 simulation.
3.2 Western Africa
Over West Africa, fire and anthropogenic emissions are both important for CO pollutant and fire impacts peak in DJF (December, January, and February). Compared to the MOPITT CO column, the mean bias of MUSICAv0 and WRF-Chem for West Africa peak around February – the dry season of the Northern Hemisphere (Fig. 3). In February, the MUSICAv0 mean bias is −1.1 × 10¹⁸ and WRF-Chem mean bias is −7.5 × 10¹⁷ , which are likely driven by fire emission sources (Fig. 5). Model comparisons with IAGOS CO also show a similar bias – both model simulations underestimate CO at all vertical levels. The underestimation peaks during DJF and below 600 hPa (Fig. 7). As for MODIS AOD, WRF-Chem has the mean bias of 0.69, whereas MUSICAv0's mean bias is 0.15. Similar to North Africa, the model biases in AOD over West Africa are also likely driven by dust and biomass burning. We also compare modeled O3 with IAGOS O3 observations (Fig. 8).
Over West Africa, both models agree well with the IAGOS O3 observations below 800 hPa (mean bias ranges from −1 to −4 ppb). Above 800 hPa over West Africa, WRF-Chem underestimates O3, while MUSICAv0 overestimates O3. Overall, MUSICAv0 consistently overestimates O3 above 800 hPa in all seasons, while the direction of WRF-Chem bias changes with seasons (Fig. 8). When MUSICAv0 overestimates O3, the bias is in general larger at the higher altitude of the troposphere. The concentration of the model stratospheric ozone tracer, O3S, is also larger at the higher altitude in DJF (Fig. 10). The correlations of modeled O3 and O3S are 0.54, and the correlations of O3S and model O3 bias (modeled O3 minus IAGOS O3) are 0.35 over West Africa, implying the overestimation of O3 in the upper troposphere could be partially driven by too strong stratosphere-to-troposphere flux of ozone. Previous studies also found impacts of stratosphere-to-troposphere flux of ozone over West Africa (e.g., Oluleye and Okogbue, 2013). Lightning NO emissions can also impact O3 in the upper troposphere. The MUSICAv0 simulation has somewhat (∼ 3 times) higher lightning NO emissions (Fig. S5 in the Supplement) compared to a standard CAM-chem simulation (not shown); therefore, the high ozone in the upper troposphere may be due to an overestimate of lightning NO. We also compared our modeled lightning NO emissions with a multi-year average climatology (2008–2015) from Maseko et al. (2021) over Southern Africa and found that the seasonal cycles from MUSICAv0 and standard CAM-chem are consistent with the climatology. The magnitude of MUSICAv0 lightning NO emissions agree better overall with the climatology compared to that from standard CAM-chem simulation. Impacts of lightning NO emissions on upper troposphere O3 in MUSICAv0 will be investigated and evaluated further in the future. A brief comparison with IAGOS measurements of air temperature and water vapor profiles over West Africa and other sub-regions shows that MUSICAv0 agrees well overall with these meteorological variables (Fig. S6 in the Supplement).
We compare the models with weekly PM2.5 measurements at three sites in Abidjan (representing domestic fires emissions, waste burning at landfill, and traffic) and one site in Cotonou representing traffic emissions (Fig. S7 in the Supplement). Overall, both models underestimate PM2.5 at the three Abidjan sites, especially near the domestic fire emissions where measured PM2.5 exceeded 400 µg m−3. We include open burning emissions in the MUSICAv0 simulation; however, the significant underestimation points to the possibility of missing emissions. Moreover, these three sites in Abidjan are within the same city and near strong emission sources and hence are challenging for both models to resolve. In fact, they fall into the same model grids, and therefore model values at the three sites are the same for both models. This demonstrates the need of higher model resolution to resolve variabilities in air quality in a city.
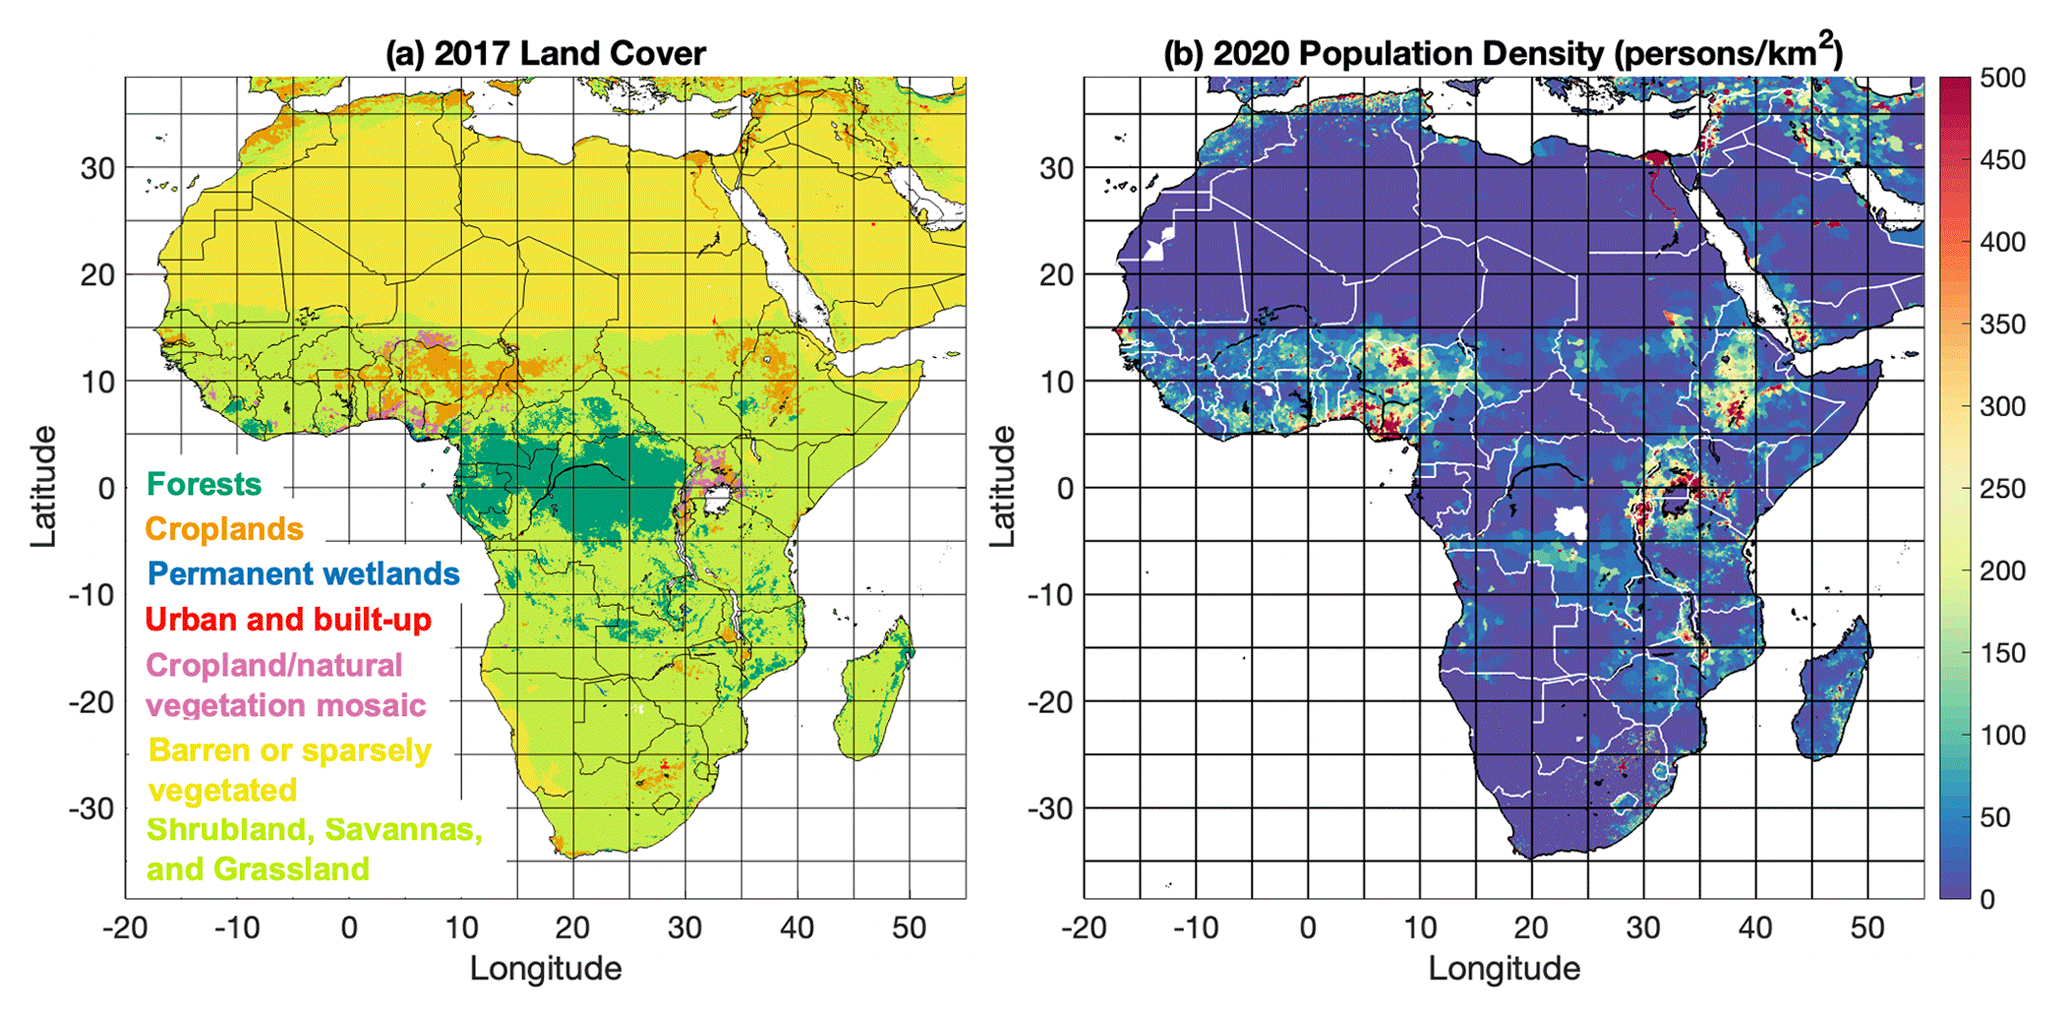
Figure 9(a) Land cover in 2017 and (b) population density (people per square kilometer) in 2020 over Africa. Land cover data are from the MODIS/Terra+Aqua Land Cover Type Yearly L3 Global product (resolution: 0.05∘) (Friedl and Sulla-Menashe, 2022). Cropland and natural vegetation mosaics show mosaics of small-scale cultivation (40 %–60 %) with natural trees, shrubs, or herbaceous vegetation. Population density data are from the Gridded Population of the World, Version 4 (GPWv4), Revision 11 (CIESIN, 2018).
3.3 Central Africa
Compared to MOPITT CO column, the mean bias of MUSICAv0 and WRF-Chem for Central Africa varies with seasons (Fig. 3) but peaks during the dry season in September (MUSICAv0 mean bias of −1.0 × 10¹⁸ ; WRF-Chem mean bias of −1.2 × 10¹⁸ ). The tagged model CO tracers show that in September, local fire emissions are the dominant driver of CO in Central Africa (Fig. 5). Compared to the IAGOS CO profiles (Fig. 7), both models have the largest bias over Central Africa among the sub-regions in Africa – mean bias of MUSICAv0 and WRF-Chem are −46 and −36 ppb, respectively. The high bias over Central Africa mainly occurs during the fire season. In Central Africa, both models also underestimate NO2 (mean biases of MUSICAv0 and WRF-Chem are −1.5 × 10¹⁴ and −5.5 × 10¹⁴ , respectively). The underestimations in both CO and NO2 by the two model simulations are likely driven by the underestimation in fire emissions. Indeed, the emission estimates from the newest version of FINN (FINNv2.5; Wiedinmyer et al., 2023) are higher compared to both QFED (used in the MUSICAv0 simulation) and FINNv1.5 (used in the WRF-Chem simulation) in this region.
Model mean bias of HCHO (−1.3 × 10¹⁶ for the whole 2017) over Central Africa is the largest among the five regions (Fig. 3). The spatial distribution of HCHO bias (Fig. S2) largely co-locates with the vegetation (Fig. 9). Over the barren or sparsely vegetated area in North Africa, HCHO biases are relatively small, while over the vegetated area HCHO bias are relatively large. Over North Africa, the mean bias is −0.66 × 10¹⁶ for the whole of 2017, whereas over the other four regions the mean bias ranges from −0.93 × 10¹⁶ to −1.31 × 10¹⁶ for the whole of 2017. This indicates that the negative bias in MUSICAv0 HCHO could be due to underestimated biogenic emissions in the model. In addition, the underestimation of HCHO in Central Africa (Fig. S2) co-locates with the underestimation of CO in time and space (Fig. S1), implying that fire emissions that contributed to model CO biases may also contribute to the HCHO underestimation in MUSICAv0 during fire season. It is important to note that the uncertainty in OMI tropospheric HCHO column is relatively large compared to other satellite products. Here the averaged retrieval uncertainty (random and systematic) is ∼ 120 %.
When compared to the IAGOS O3 profiles over Central Africa (Fig. 8), both models agree well with the IAGOS O3 observations below 800 hPa (mean bias ranges from −1 to −4 ppb). Above 800 hPa, WRF-Chem underestimates O3 while MUSICAv0 overestimates O3. The correlation of modeled O3 and O3S is 0.67, and the correlations of O3S and model O3 bias is 0.50 over Central Africa, indicating O3 overestimations in Central Africa are more likely to be impacted by stratosphere-to-troposphere flux of ozone than that in West Africa.
3.4 East Africa
CO over East Africa is dominated by local emissions and inflow from outside the continent. Fire and anthropogenic emissions contribute approximately the same to CO over East Africa (Fig. 5). Both MUSICAv0 and WRF-Chem simulations underestimate the CO column compared to MOPITT (Fig. 3), and the WRF-Chem simulation also underestimates the tropospheric NO2 column compared to OMI. The biases in CO column and tropospheric NO2 column peak in September. One possible driver could be fire emissions from other regions (Fig. 5); however, further studies will be needed to address this.
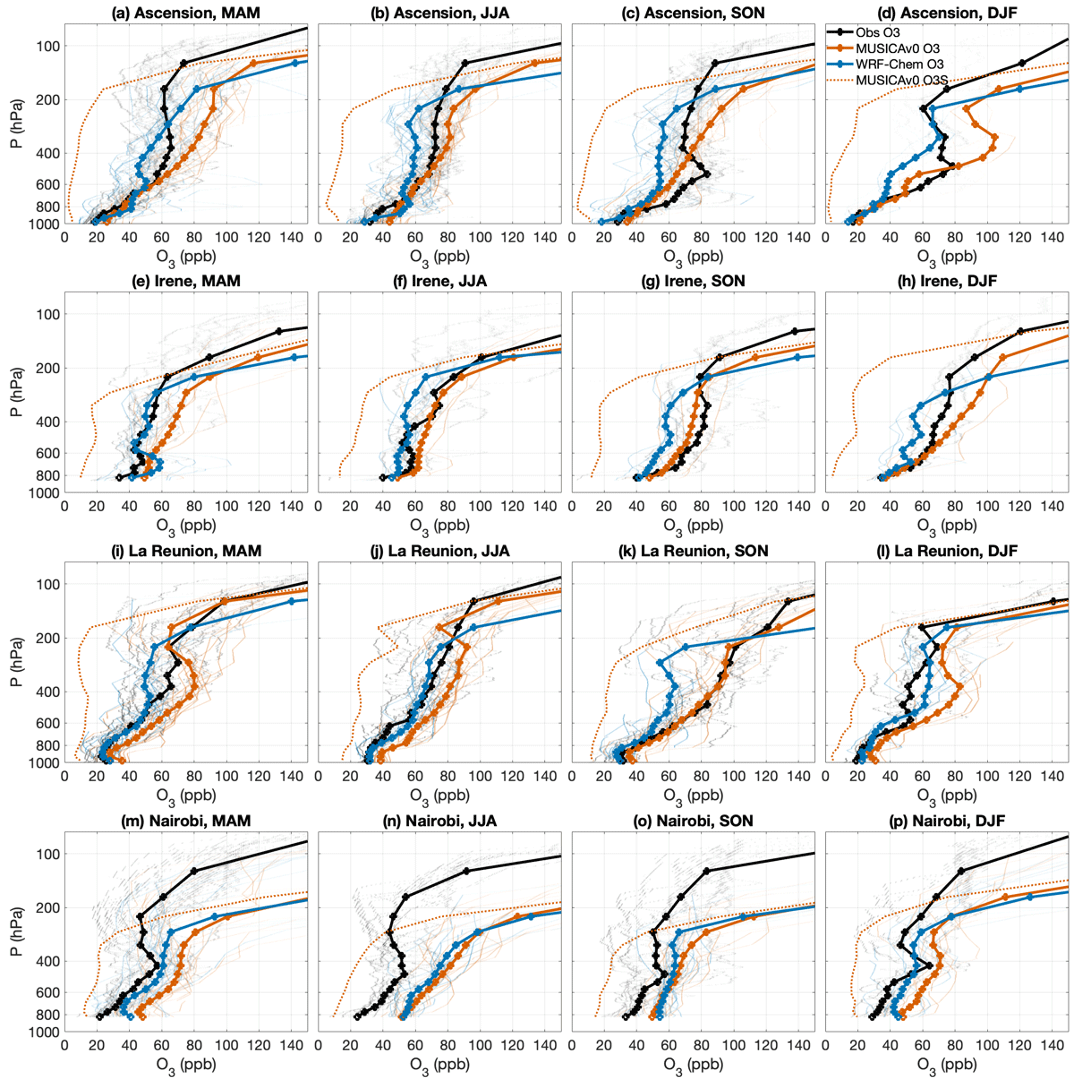
Figure 10Vertical profiles of O3 (ppb) from ozonesondes (black) and corresponding model output from MUSICAv0 (red) and WRF-Chem (blue) for each season of 2017. The thick lines denote the seasonal mean profiles and the thin lines denote the individual profiles. The dashed red lines represent O3S (stratospheric ozone tracer) from the MUSICAv0 simulation. Ozonesonde data at Ascension in (a) MAM (March, April, and May), (b) JJA (June, July, and August), (c) SON (September, October, and November), and (d) DJF (December, January, and February) are shown. Panels (e)–(h), (i)–(l), and (m)–(p) are the same as (a)–(d), except for Irene, La Réunion, and Nairobi, respectively. Locations of the sites are shown in Fig. 1b.
Compared to IAGOS O3 profiles over East Africa, biases of MUSICAv0 below 600 hPa have a seasonal variation, while over 600 hPa they are consistently positive (Fig. 8). The correlations of O3S and model O3 bias against IAGOS data is 0.50 in the region. The correlations between O3S and model O3 bias are highest over Central and East Africa compared to other regions, indicating stratosphere influence are strongest in these two regions among the sub-regions. Central and East Africa are relatively more mountainous; therefore, topography-driven stratospheric intrusions might be expected. The Nairobi ozonesonde site is located in East Africa (Fig. 1b). When comparing to the O3 profiles from ozonesondes (Fig. 10), MUSICAv0 overall overestimates O3 in the troposphere at the four sites, while WRF-Chem tends to underestimate O3 in the free troposphere (below 200 hPa). The Nairobi site is an exception where both MUSICAv0 and WRF-Chem simulations significantly overestimate O3 in all seasons (mean bias of MUSICAv0 and WRF-Chem below 200 hPa are 27 and 20 ppb, respectively). Among the four ozonesonde sites, correlations of model bias of O3 and O3S are highest at the Nairobi site (0.74) where the model significantly overestimates O3. The results of model–ozonesonde comparisons are consistent with the results of model-IAGOS comparisons and indicate a potential issue in modeled stratosphere-to-troposphere flux of ozone.
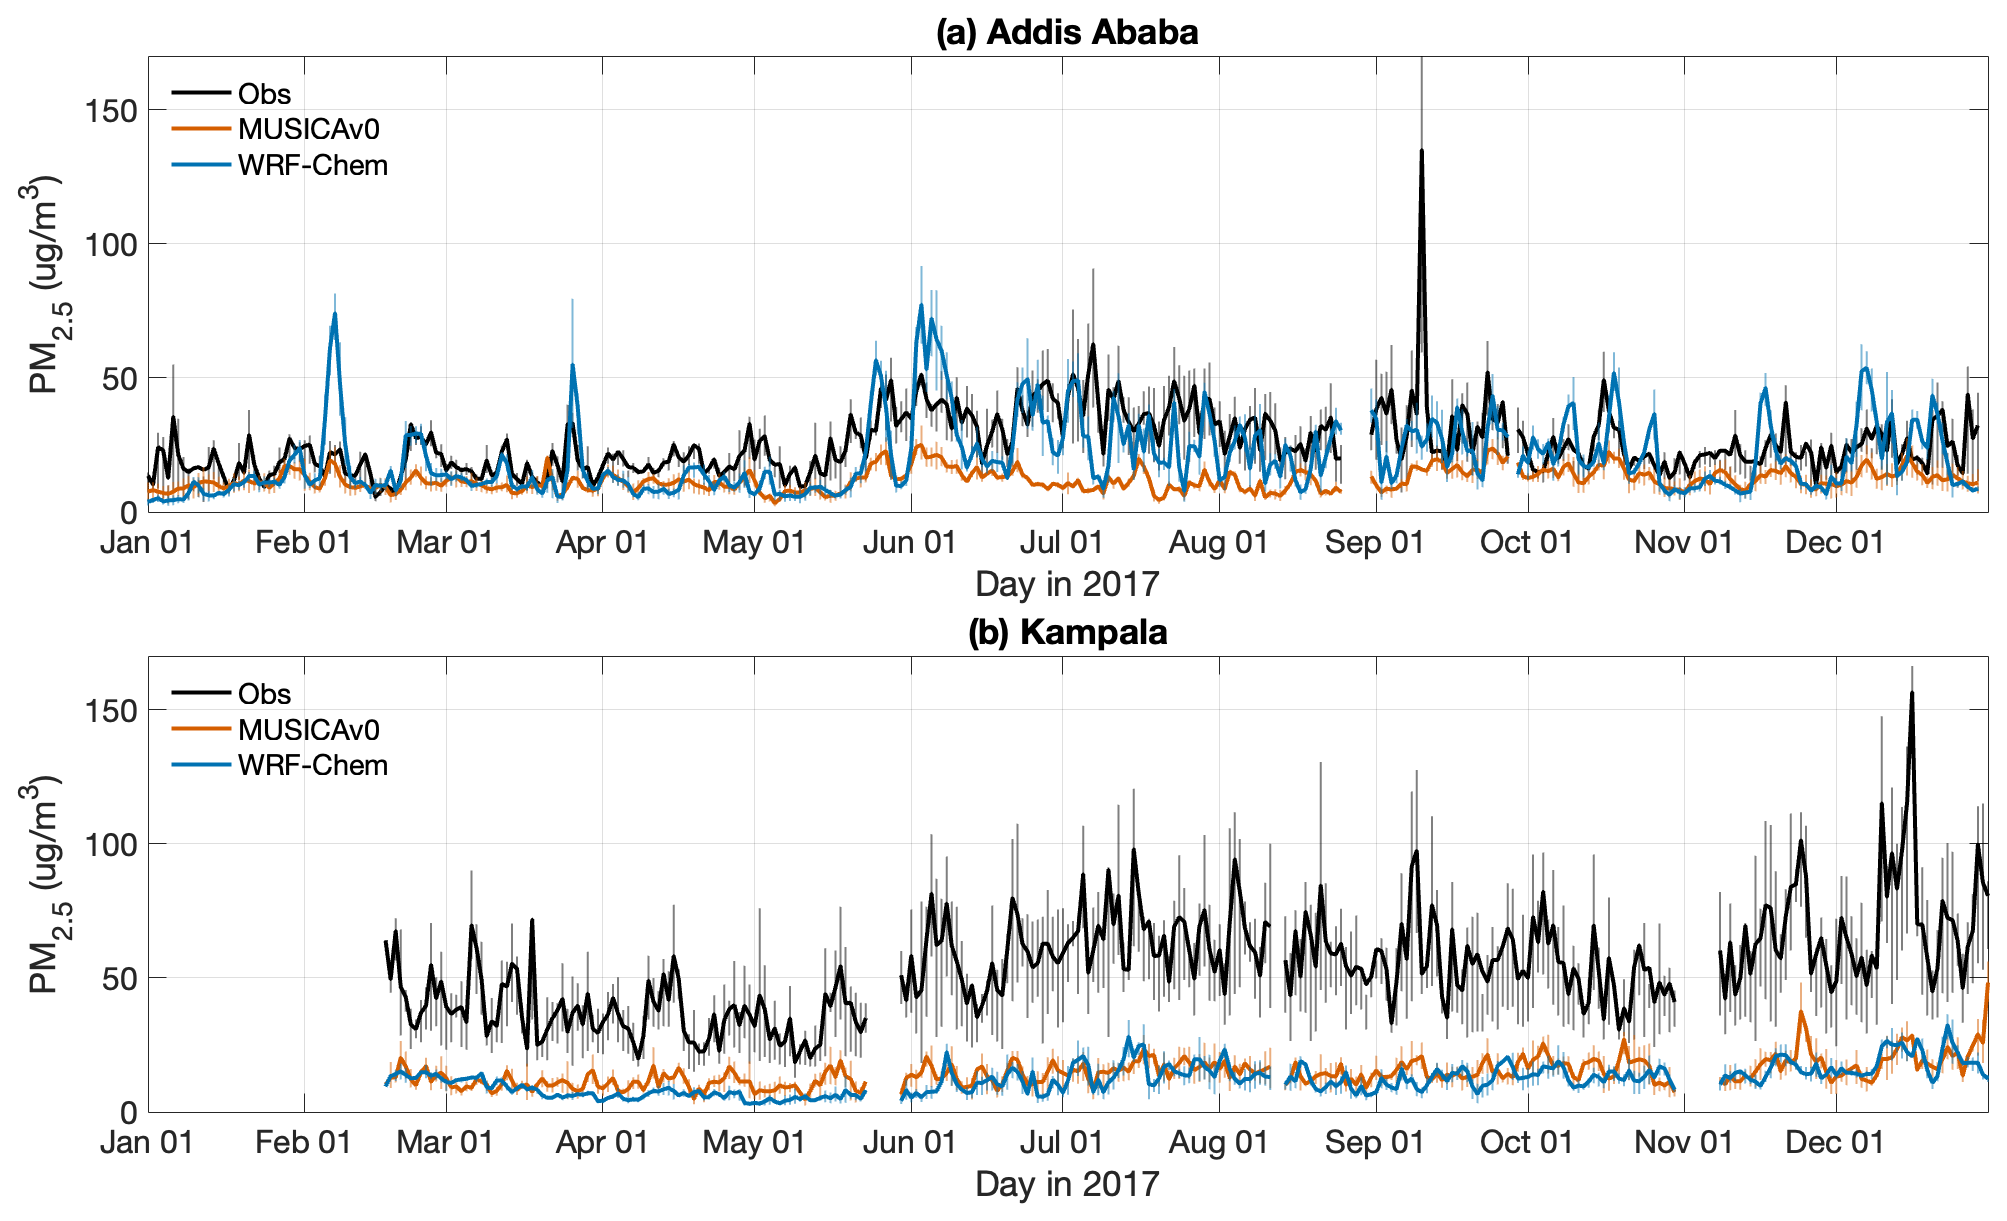
Figure 11Daily mean PM2.5 from in situ observations (black), MUSICAv0 (red), and WRF-Chem (blue) during 2017 at (a) Addis Ababa and (b) Kampala. Daily means are calculated from 3-hourly data. The shown range for each data point shows the variation on that day (25 % quantile to 75 % quantile). Locations of the sites are shown in Fig. 1b.
We compare the model results with PM2.5 measurements from two surface sites in East Africa (Addis Ababa and Kampala; Fig. 1b). Despite using different aerosol methods and emission inventories, both MUSICAv0 and WRF-Chem underestimate surface PM2.5 when compared to observations at the two sites (Fig. 11). The errors in PM2.5 concentrations at the US embassy in Kampala are especially prominent. However, both models approximate the variation in the PM2.5 in both locations. Many factors contribute to the inconsistency in the magnitude of modeled PM2.5 concentrations. For instance, emission inventories in this region require additional improvement. In Uganda, increasing motor vehicle ownership and burning biomass for domestic energy use contribute to ambient PM2.5 levels (Clarke et al., 2022; Petkova et al., 2013; Kinney et al., 2011). Detailed PM2.5 composition measurements would also help to pinpoint the cause of inaccuracies (Kalisa et al., 2018). Model resolutions could also be a potential reason for the underestimation. Over Kampala, high spatial variability in PM2.5 over the urban environment can contribute to model bias (Atuhaire et al., 2022), as also shown by the AirQo low-cost air quality monitors (Sserunjogi et al., 2022; Okure et al., 2022).
3.5 Southern Africa
Among the five regions, MUSICAv0 has the lowest mean bias in CO (−3.2 × 10¹⁷ annually) over Southern Africa (Fig. 3). WRF-Chem also has low mean bias and RMSE in CO over Southern Africa except for the months of September, October, and November (SON) where WRF-Chem has larger CO mean bias (−6.2 × 10¹⁷ ) than MUSICAv0. Tagged model CO tracers indicate that CO over Southern Africa is significantly impacted by CO emissions from Central Africa, East Africa, and Southern Africa and inflow from outside the continent. As for the source types, anthropogenic and fire emissions are both important, and fire impacts peak in September (e.g., Archibald et al., 2009, 2010; Archibald 2016). There are two WDCGG sites located in Southern Africa (Fig. 1b; Gobabeb and Cape Point). When compared to surface CO observations from WDCGG, both models consistently underestimate CO by up to 40 % at most sites. The Cape Point site in Southern Africa is an exception (Fig. 6) where MUSICAv0 overestimates CO by 40 ppb (annual mean; up to 78 ppb in May 2017). CO tracers in the model (Figs. S3 and S4) show that the simulated CO at Cape Point is mainly driven by anthropogenic CO emissions from Southern Africa. Therefore, the overestimation of CO at Cape Point by MUSICAv0 may be due to an overestimation of emissions in Southern Africa. Note that the Cape Point measurement site is located on the tip of Southern Africa and has a strong impact from clean marine air (Labuschagne et al., 2018), which the model likely cannot represent accurately.
As for NO2, WRF-Chem underestimates tropospheric NO2 column in most regions except for Southern Africa (Fig. 3). Over Southern Africa, WRF-Chem overestimates NO2, especially during June, July, and August (JJA). MUSICAv0 also tends to overestimates NO2 at the same location in JJA; however, the bias is not as large as for WRF-Chem.
The MUSICAv0 simulation has an overall lower mean bias (0.14 annually) than the WRF-Chem simulation (mean bias of 0.31 annually) compared to MODIS AOD with Southern Africa being the only exception (Fig. 3). Over Southern Africa, MUSICAv0 overestimates AOD by ∼ 0.21 annually (Fig. 3), and the bias peaks in January (mean bias = 0.45). This overestimation in AOD over Southern Africa is not seen in WRF-Chem. It is likely that the MUSICAv0 overestimation in AOD over Southern Africa is also due to biases in modeled dust as the AOD bias is co-located with the only barren or sparsely vegetated area in Southern Africa (Figs. 9 and S2).
Over Southern Africa, MUSICAv0 tends to overestimate O3 compared to IAGOS at all levels at all seasons in 2017 (Fig. 8). The MUSICAv0 O3 bias is 5–10 ppb below 800 hPa for the four seasons and 23–39 ppb at 225 hPa. The concentration of O3S over Southern Africa is higher than those over other regions. However, the correlation of O3S and model O3 bias is lower than other regions (0.13), indicating stratosphere-to-troposphere flux of ozone may not be the main driver of O3 bias over Southern Africa even though stratosphere-to-troposphere flux of ozone is relatively strong in the region (e.g., Leclair De Bellevue et al., 2006; Clain et al., 2009; Mkololo et al., 2020). The Irene ozonesonde site is located in Southern Africa (Fig. 1b). Compared to the ozonesonde O3 profiles at the Irene site, however, the sign of MUSICAv0 has a seasonal variation (Fig. 10e–h). For example, at 675–725 hPa, MUSICAv0 O3 bias in MAM and JJA is 3–9 ppb, whereas in SON and DJF it is −2 to −6 ppb. The IAGOS measurements and the Irene ozonesonde site are not co-located, so the difference is expected due to the different sampling locations and environment. Compared to other ozonesonde sites, the correlation of O3S and model O3 bias over Southern Africa is lower (0.14) and MUSICAv0 agrees relatively well with observations, which is consistent with the comparison results with IAGOS data (Fig. 8).
We further compare MUSICAv0 and WRF-Chem results with surface PM2.5, CO, NO2, and O3 measurements from SAAQIS in Southern Africa (Figs. S8–S11 in the Supplement). Overall, the performance of MUSICAv0 and WRF-Chem compared to SAAQIS data are similar. Both models underestimate surface CO in most sites (consistent with the comparisons with satellites) with exceptions near Gauteng (industrialized and urbanized region). Compared to SAAQIS sites near Cape Point, MUSICAv0 does not show overestimation, which is the opposite of the overestimation compared to WDCGG Cape Point site. The maximum value of monthly CO observations from WDCGG Cape Point site in 2017 is ∼ 150 ppb, whereas the seasonal mean values of SAAQIS CO measurements near Cape Point site can be up to 600 ppb. SAAQIS CO measurements near Cape Point shows relatively large spatial variability, indicating (1) that there may be a wide range of emission sources that are poorly captured by the model and (2) a large role of local sources and potentially complex meteorology. In addition, uncertainties in observations could also contribute to the difference. Both models tend to overestimate NO2 near Gauteng, which may be related to local emissions. Both models can either overestimate or underestimate PM2.5 and/or O3 at different SAAQIS sites. The model bias in PM2.5 and O3 shows large spatial variability, especially near Gauteng. Higher model resolution is needed to address the highly complex and diverse environment in the region. Lastly, it is worth pointing out that in Southern Africa both models have evident bias in PM2.5 near Gauteng (Fig. S11); however, modeled AOD from both models agrees relatively well with MODIS and AERONET (Fig. 4). More studies are needed to understand this feature.
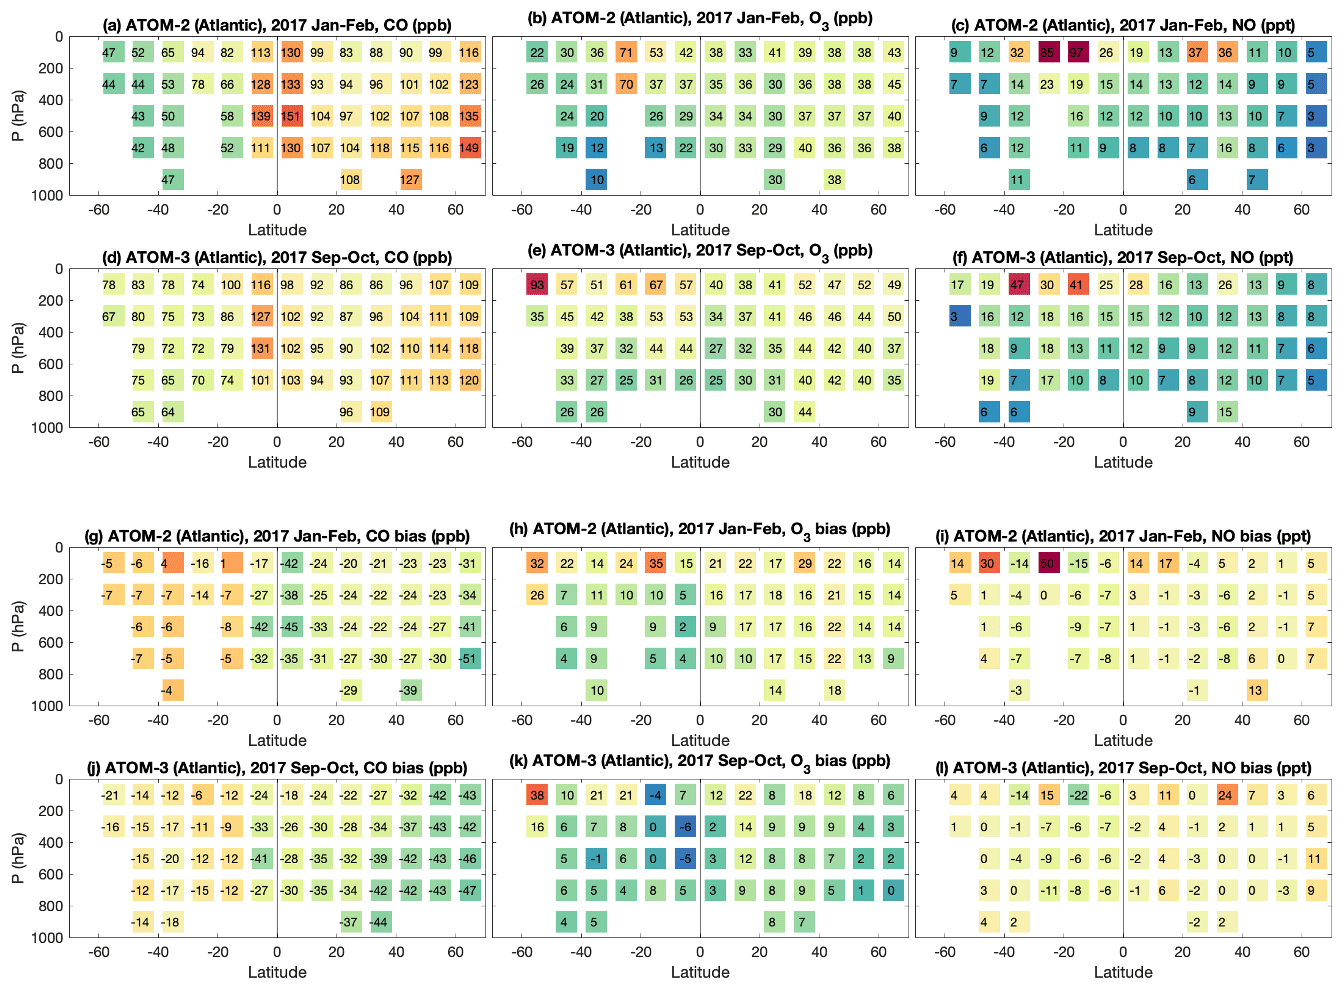
Figure 12Observations of (a) CO (ppb), (b) O3 (ppb), and (c) NO (ppt) over the Atlantic Ocean during ATom-2 and ATom-3 (d–f). (g–l) Corresponding model biases against ATOM observations. The ATom airborne measurements and corresponding MUSICAv0 model results are binned to 10∘ latitude and 200 hPa pressure bins. The values of mean biases for each latitude and pressure bin are labeled in the figure.
3.6 Oceans near Africa
We compare the CO, NO, and O3 from the MUSICAv0 simulation with measurements from ATom-2 and ATom-3 in 2017 (Fig. 1a) to provide a global benchmark. Measurements made over the Atlantic Ocean and Pacific Ocean and in January–February (January–February) and September–October (September–October) are compared separately (Figs. 11 and 12). The comparison was made with data averaged into 10∘ latitude and 200 hPa bins. Overall, the model consistently underestimates CO globally in both seasons. The underestimation of CO is a common issue in atmospheric chemistry models and could be due to various reasons, including emissions, deposition, and chemistry (e.g., Fisher et al., 2017; Shindell et al., 2006; Stein et al., 2014; Tilmes et al., 2015; Tang et al., 2018; Gaubert et al., 2020). Specifically for our MUSICAv0 simulation in this study, the model bias in CO is relatively large (up to 52 ppb) over the Northern Hemisphere (especially at high latitude and near the surface) and small over the Southern Hemisphere (Figs. 11 and 12). Over the Atlantic Ocean, the bias in CO is larger in September–October than January–February in both the Northern Hemisphere (−30 ppb in January–February versus −34 ppb in September–October) and Southern Hemisphere (−11 ppb in January–February versus −14 ppb in September–October). Over the Pacific Ocean, however, the CO bias is similar for both time periods in the Northern Hemisphere (−30 ppb), while in the Southern Hemisphere the CO bias changes significantly from −8 ppb in January–February to −16 ppb in September–October. The changes in CO bias over the Southern Hemisphere are likely due to seasonal change in fire emissions. Overall, the mean biases (Figs. 11 and 12) suggest that the simulation agrees better with ATom observations in the Southern Hemisphere than in the Northern Hemisphere and in January–February than in September–October (Figs. 11 and 12), consistent with Gaubert et al. (2016).
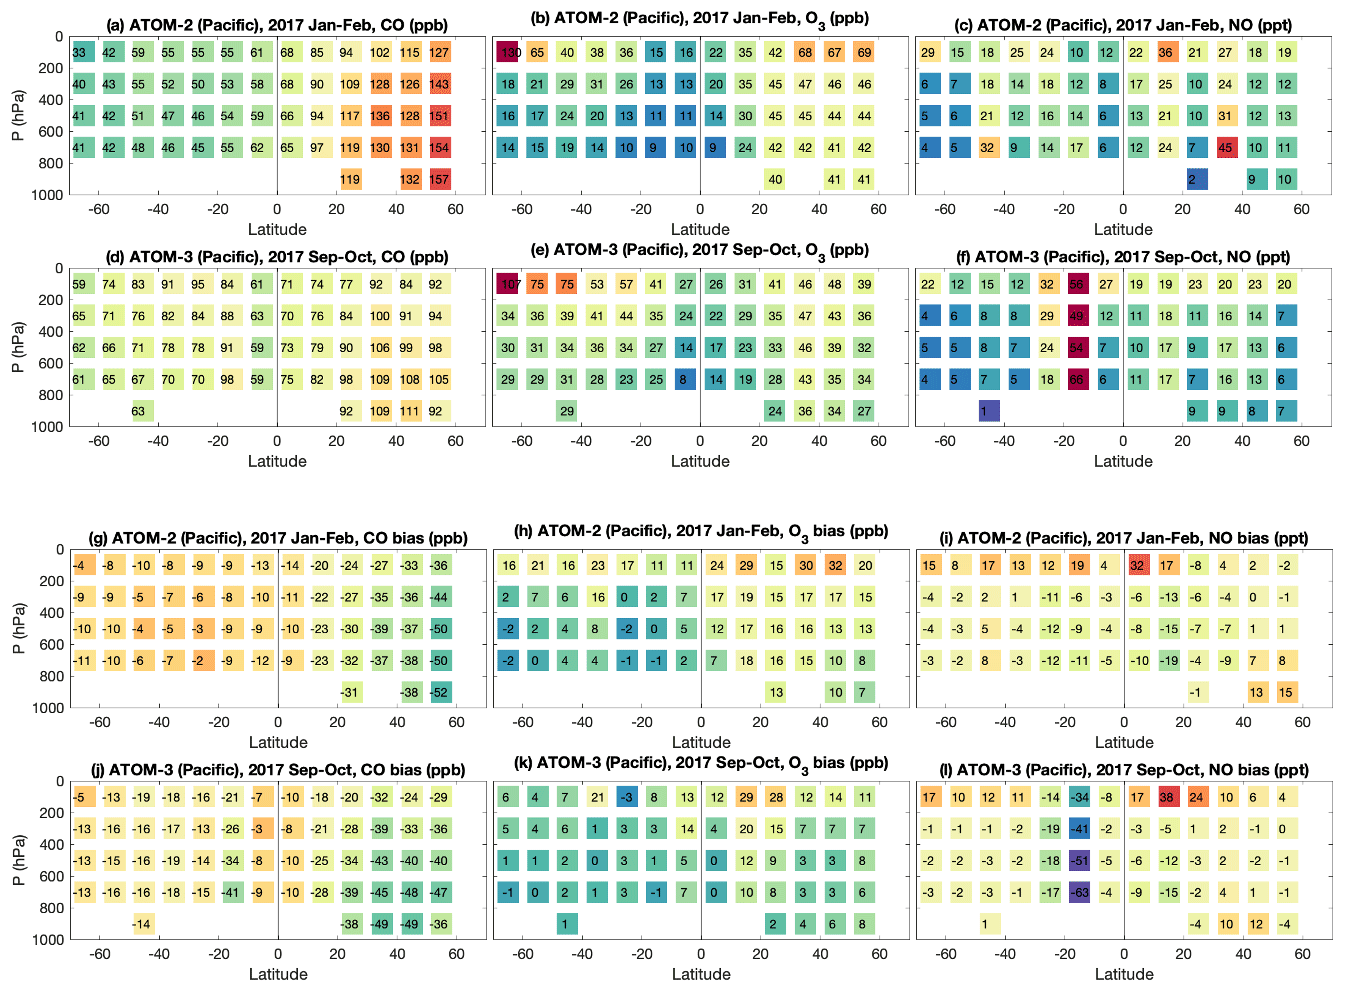
In both seasons and both hemispheres, the model in general overestimates O3 in the stratosphere and UTLS (upper troposphere and lower stratosphere) by up to 38 ppb (above 200 hPa). In the troposphere (below 200 hPa), the model overall agrees well with the ATom data over the Pacific Ocean in the Southern Hemisphere (in most cases the bias is less than ± 5 ppb). However, over the Atlantic Ocean in the Southern Hemisphere, MUSICAv0 tends to overestimate O3, especially in January–February. In the troposphere of the Northern Hemisphere, MUSICAv0 consistently overestimates O3 over both oceans and both seasons. The positive bias in O3 decreases from the upper troposphere towards the surface, indicating that the overestimation of O3 in the troposphere may be due to stratosphere-to-troposphere flux of ozone. This was also noted for other global models (Bourgeois et al., 2021). Thompson et al. (2014) found O3 at the Irene site is also influenced by long-range transport of growing pollution in the Southern Hemisphere, which could also contribute to the model bias. As for NO, the model tends to overestimate NO above 200 hPa (approximately the stratosphere and UTLS) by up to 50 ppt. Overall, the NO biases can be either positive or negative depending on location and season. The distributions of NO bias (Figs. 11 and 12) do not show an overall spatial pattern, unlike those for CO (which changes monotonically with latitude) or O3 (which changes monotonically with altitude).
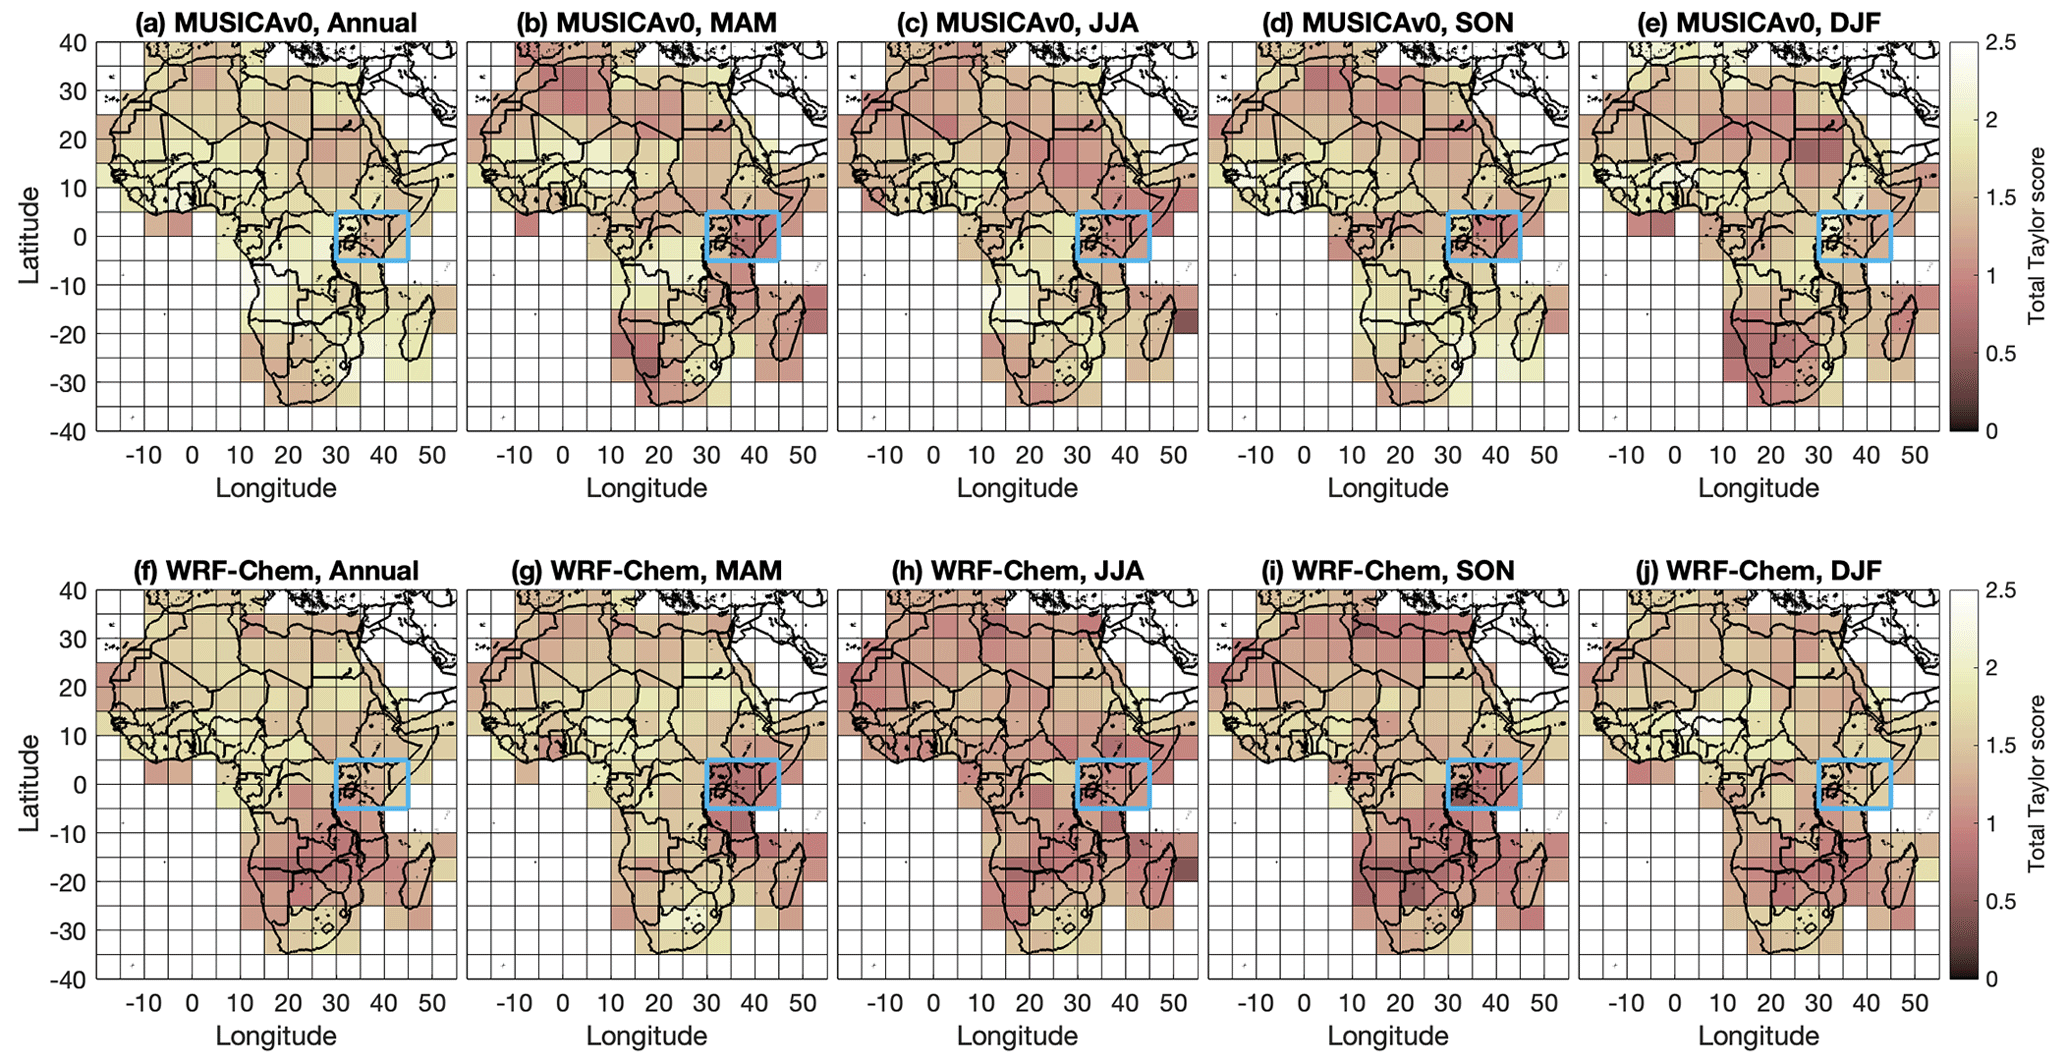
Figure 14Spatial distribution of total Taylor score of MUSICAv0 and (f–j) WRF-Chem compared to satellite retrievals. In each 5∘ × 5∘ (latitude × longitude) pixel, Taylor scores of the model compared to three satellite products (e.g., MOPITT CO column retrievals, OMI tropospheric NO2 column retrievals, and MODIS AOD) are calculated separately (as shown in Fig. S12). Taylor scores against each satellite product range from 0 to 1. Three Taylor scores are then summed up to obtain the shown total Taylor score (ranges from 0 to 3). Total Taylor scores of MUSICAv0 for (a) 2017, (b) MAM (March, April, and May), (c) JJA (June, July, and August), (d) SON (September, October, and November), and (e) DJF (December, January, and February) are shown. The blue box highlights a potential region for future field campaigns and/or in situ observations. Panels (f)–(j) are similar to panels (a)–(e) but are for WRF-Chem.
As a demonstration of the application of MUSICAv0, here we use the results of model–satellite comparisons to identify potential regions where the atmospheric chemistry models need to be improved substantially. More field campaigns and more in situ observations would not only provide an observational benchmark dataset to understand and improve modeling capability in the region but would be also useful for the validation and calibration of satellite products. Here we use Taylor score to quantify model–satellite discrepancies. Taylor score (Taylor, 2001) is defined by
where is the ratio of σf (standard deviation of the model) and σr (standard deviation of observations), R is the correlation between the model and the observations, and R0 is the maximum potentially realizable correlation (= 1 in this study). Taylor score ranges from 0 to 1, and a higher Taylor score indicates better satellite–model agreement. To identify potential locations, we separate the African continent into 5∘ × 5∘ (latitude × longitude) pixels, as shown in Fig. 14. For each pixel, we calculate Taylor scores of MUSICAv0 compared to the three satellite Level 2 products (e.g., MOPITT CO column retrievals, OMI tropospheric NO2 column retrievals, and MODIS AOD) separately. Three Taylor scores are then summed up to obtain the total Taylor score for MUSICAv0 (ranges from 0 to 3) as shown in Fig. 13a–e. A similar calculation is conducted for WRF-Chem (Fig. 13f–j). Note that we did not include Taylor scores for HCHO in the total Taylor score due to the fact that (1) WRF-Chem simulations did not save HCHO output and (2) the HCHO retrievals have relatively high uncertainties (Taylor scores of MUSICAv0 compared to OMI tropospheric HCHO column retrievals are provided separately in Fig. S12 in the Supplement).
Overall, both MUSICAv0 and WRF-Chem have low total Taylor scores in the 5∘ S–5∘ N, 30–45∘ E region in East Africa (a region of 15∘ longitude × 10∘ latitude) during MAM (March, April, and May), JJA (June, July, and August), and SON (September, October, and November), as highlighted in Fig. 14, indicating relatively large model–satellite discrepancies in the region. Besides the 5∘ S–5∘ N, 30–45∘ E region highlighted in Fig. 14, there are a few other regions with low Taylor scores for both MUSICAv0 and WRF-Chem, such as 30∘ S to 20∘ S, 10–20∘ E region and east of Madagascar.
The 5∘ S–5∘ N, 30–45∘ E region (a sub-region in East Africa) is also the region where the Nairobi ozonesonde site and the Kampala surface PM2.5 site are located (Fig. 1b). As discussed above, both MUSICAv0 and WRF-Chem significantly overestimate O3 (Fig. 10) and largely underestimate PM2.5 (Fig. 11) in the region. More in situ observations or future field campaigns in the region can substantially help in the understanding model–satellite and model–in situ observation discrepancies and improving model performance.
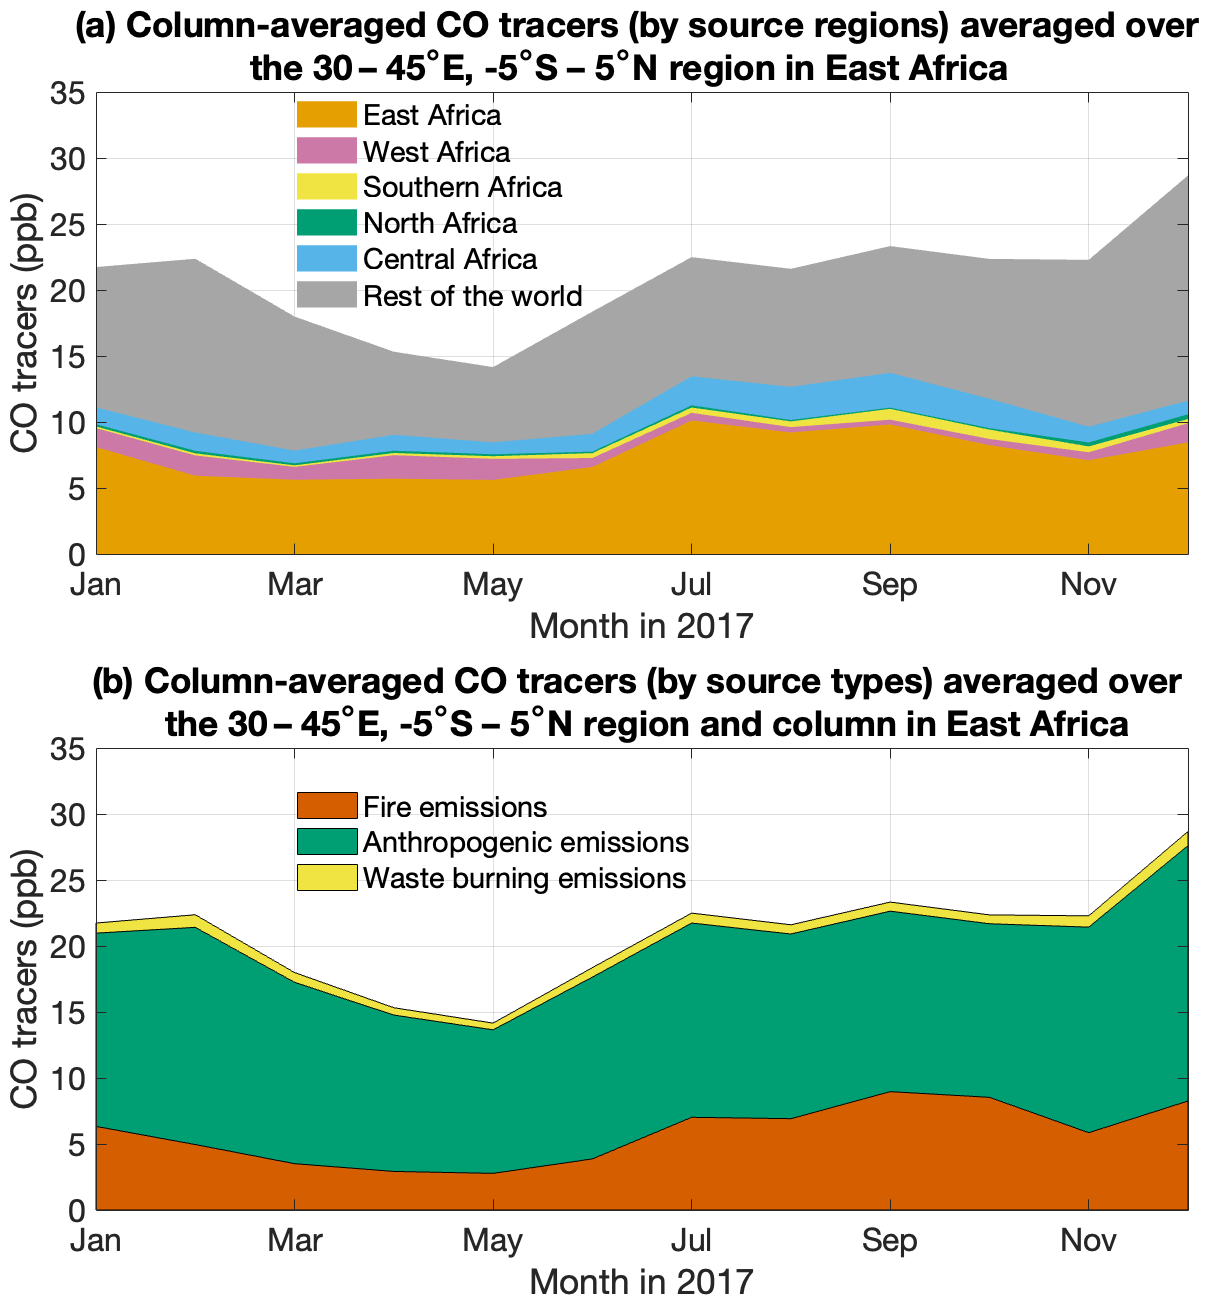
Figure 15Monthly time series of column-averaged CO tracers in the 5∘ S–5∘ N, 30–45∘ E region in East Africa. (a) CO tracers of emissions from North Africa (green), West Africa (pink), East Africa (orange), Central Africa (blue), Southern Africa (yellow), and the rest of the world (grey). (b) CO tracers of fire emissions (red), anthropogenic emissions (green), and waste burning emissions (yellow).
The 5∘ S–5∘ N, 30–45∘ E region (a sub-region in East Africa) is potentially a favorable location for future field campaign(s) not only because of the large model–satellite and model–in situ observation discrepancies but also due to that the population density is high and land cover is diverse in the region (Fig. 9). The relatively high population density in the region indicates that improved air quality modeling in the region can benefit a large population. A diverse land cover indicates more processes and environments can be sampled. CO tracers in the model (Fig. 15) show that CO over the region is mainly driven by both anthropogenic and fire emissions. Anthropogenic emissions play a more important role in the 5∘ S–5∘ N, 30–45∘ E region compared to East Africa in general (Figs. 4 and 14). In terms of source regions, emissions from East Africa and inflow from outside the continent are the dominant source, with some contributions from Central Africa. Note that the source analyses using model tracers may be subject to uncertainties in the emission inventories, in this case CAMSv5.1, QFED, and the waste burning inventory used here. As discussed above (e.g., Sect. 3.4), there might be missing sources in the region. In addition, emission factors used in many emission inventories are based on measurements outside the continent of Africa (e.g., Lamarque et al., 2010; Klimont et al., 2013; Pokhrel et al., 2021). It is not clear so far if these emission factors are applicable to emissions in Africa (e.g., Keita et al., 2018, 2021). Therefore, a field campaign in the region can help address these issues.
We would like to point out that in this analysis, the key area is selected using three satellite products or chemical species and two models. The Taylor score is a comprehensive measure of model performance that accounts for variance and correlation; however, other models and types of comparisons may provide different answers.
Africa is one of the most rapidly changing regions in the world, and air pollution is a growing issue at multiple scales over the continent. MUSICAv0 is a new community modeling infrastructure that enables the study of atmospheric composition and chemistry across all relevant scales. We developed a MUSICAv0 grid with Africa refinement (∼ 28 km × 28 km over Africa and ∼ 110 km × 110 km for the rest of the world) and conducted the simulation for the year 2017. We evaluated the model with in situ observations including ATom-2 and ATom-3 airborne measurements of CO, NO, and O3; IAGOS airborne measurements of CO and O3; O3 profiles from ozonesondes; surface CO observations from WDGCC; and surface PM2.5 observations from two US embassy locations. We then compare MUSICAv0 with satellite products over Africa, namely MOPITT CO column, MODIS AOD, OMI tropospheric NO2 column, and OMI tropospheric HCHO column. Results from a WRF-Chem simulation were also included in the evaluations and comparisons as a reference. Lastly, as an application of the model, we identified potential African regions for in situ observations and field campaign(s) based on model–satellite discrepancies (quantified by Taylor score) with regard to model–in situ observation discrepancies, source analyses, population, and land cover. The main conclusions are as follows.
-
When comparing to ATom-2 and ATom-3, MUSICAv0 consistently underestimates CO globally. Overall, the negative model bias increases with latitude from the Southern Hemisphere to the Northern Hemisphere. MUSICAv0 also tends to overestimate O3 in the stratosphere and UTLS, and the positive model bias overall decreases with altitude.
-
The MUSICAv0 biases in O3 when compared to ATom, IAGOS, and ozonesondes are likely driven by stratosphere-to-troposphere fluxes of O3 and lightning NO emissions.
-
Overall, the performance of MUSICAv0 and WRF-Chem are similar when compared to the surface CO observations from six WDCGG sites in Africa.
-
Both models have negative bias compared to the MOPITT CO column, especially over Central Africa in September, which is likely driven by fires.
-
Overall, MUSICAv0 agrees better with OMI tropospheric NO2 column than WRF-Chem.
-
MUSICAv0 overall has a lower tropospheric HCHO column than OMI retrievals in all regions and seasons. Biogenic and fire emissions are likely to be the main driver of this disagreement.
-
Over Africa, the MUSICAv0 simulation has smaller mean bias and RMSE compared to MODIS AOD than the WRF-Chem simulation.
-
The 5∘ S–5∘ N, 30–45∘ E region in East Africa is potentially a favorable location for future field campaign(s) not only because of the large model–satellite and model–in situ observation discrepancies but also due to the population density, land cover, and pollution source in this region.
Overall, the performance of MUSICAv0 is comparable to WRF-Chem. The underestimation of CO is a common issue in atmospheric chemistry models such as MUSICAv0 and WRF-Chem. The overestimation of O3 in MUSICAv0 is likely driven by too strong stratosphere-to-troposphere fluxes of O3 and perhaps an overestimate of lightning NO emissions; however, future studies are needed to confirm and solve this issue. The significant underestimation in surface PM2.5 at two sites in East Africa and the overall overestimation in AOD in Africa compared to MODIS imply missing local sources and an overestimation of dust emissions and require further study. In addition, lack of data could also contribute to disagreement in model and in situ observations as one site in a city is not representative of the full city. Field campaigns and more in situ observations in the 5∘ S–5∘ N, 30–45∘ E region in East Africa (as well as other regions in Africa) are necessary for the improvement of atmospheric chemistry model(s), as shown by the MUSICAv0 and WRF-Chem simulations.
Fire and dust are important sources of air pollution in Africa. The performance of MUSICAv0 is degraded during fire season and over dust regions. Uncertainties in emission estimates of fire and dust and in the model representation of atmospheric processes could potentially contribute to the model biases. Future studies on fire and dust in Africa are needed to address these uncertainties and air quality modeling over Africa.
Here we divided the continent into five sub-regions to show the overall performance of MUSICAv0 over sub-regions of Africa. This accounted for the diversity in atmospheric chemistry environment to some degree. However, each sub-region is not homogeneous. In fact, different cities in the same sub-region may have different emission characteristics. In the future, when specific scientific questions are studied with MUSICAv0, we will use a higher resolution to address the highly complex and diverse environment. We plan to conduct a model simulation for multiple years and develop additional model grids with potentially higher resolution in African sub-regions based on the current MUSICAv0 Africa grid. Higher resolution will benefit the comparisons of model and in situ observations. The future simulation will be conducted for years after 2017 as there are more in situ observations available in recent years.
The model code used here can be accessed through https://doi.org/10.5281/zenodo.8051435 (Tang, 2023a). The data produced by this study can be accessed through https://doi.org/10.5281/zenodo.8051443 (Tang, 2023b).
The supplement related to this article is available online at: https://doi.org/10.5194/gmd-16-6001-2023-supplement.
WT, LKE, HMW, and PL were involved in the initial design of this study. WT led the analysis. RK and CH conducted the WRF-Chem simulation. ZZ interpreted the PM2.5 results. BG, ST, SEMA, and other coauthors provided discussions. RRB helped with QFED emissions. CG and AS produced CAMSv5.1 emissions. KM, BCD, JP, and CT conducted measurements during ATom. WT prepared the paper with improvements from all coauthors.
The contact author has declared that none of the authors has any competing interests.
Publisher's note: Copernicus Publications remains neutral with regard to jurisdictional claims in published maps and institutional affiliations.
This paper is based upon work partially supported by the National Aeronautics and Space Administration under grant no. 80NSSC23K0181 issued through the NASA Applied Sciences SERVIR program. We thank the ATom, WDCGG, IAGOS, and NASA/GSFC SHADOZ teams and the U.S. State Department and U.S. EPA for providing in situ observations. We thank Anne Thompson and Gonzague Romanens for providing a detailed explanation of the SHADOZ Ozonesonde data format. We thank the MOPITT, MODIS AOD, OMI NO2, and OMI HCHO teams for the satellite products. The NCAR MOPITT project is supported by the National Aeronautics and Space Administration (NASA) Earth Observing System (EOS) program. We thank the QA4ECV project. We thank Sabine Darras for CAMSv5.1 emissions. We would like to acknowledge high-performance computing support from Cheyenne (https://doi.org/10.5065/D6RX99HX, Computational and Information Systems Laboratory, 2019) provided by NCAR's Computational and Information Systems Laboratory, sponsored by the National Science Foundation. This material is based upon work supported by the National Center for Atmospheric Research, which is a major facility sponsored by the National Science Foundation under cooperative agreement no. 1852977. We thank James Hannigan, Ivan Ortega, Siyuan Wang, and all the attendees of ACOM CAM-chem/MUSICA weekly meeting for providing helpful discussions.
This material is based upon work supported by the National Science Foundation under grant no. AGS-1755088. This paper is partially supported by the National Aeronautics and Space Administration under grant no. 80NSSC23K0181 issued through the NASA Applied Sciences SERVIR program.
This paper was edited by David Topping and reviewed by two anonymous referees.
Amegah, A.K. and Agyei-Mensah, S.: Urban air pollution in Sub-Saharan Africa: Time for action, Environ. Pollut., 220, 738–743, 2017.
Archibald, S., Roy, D. P., Van Wilgen, B. W., and Scholes, R. J.: What limits fire? An examination of drivers of burnt area in Southern Africa, Glob. Change Biol., 15, 613–630, https://doi.org/10.1111/j.1365-2486.2008.01754.x, 2009.
Archibald, S.: Managing the human component of fire regimes: lessons from Africa, Philos. T. R. Soc. B, 371, 20150346, https://doi.org/10.1098/rstb.2015.0346, 2016.
Archibald, S., Scholes, R. J., Roy, D. P., Roberts, G., and Boschetti, L.: Southern African fire regimes as revealed by remote sensing, Int. J. Wildland Fire, 19, 861–878, 2010.
Atuhaire, C., Gidudu, A., Bainomugisha, E., and Mazimwe, A.: Determination of Satellite-Derived PM2.5 for Kampala District, Uganda, Geomatics, 2, 125–143, 2022.
Baudoin, M.-A., Vogel, C., Nortje, K., and Naik, M.: Living with drought in South Africa: lessons learnt from the recent El Niño drought period, Int. J. Disast. Risk Re., 23, 128–137, 2017.
Bauer, S. E., Im, U., Mezuman, K., and Gao, C. Y.: Desert dust, industrialization and agricultural fires: Health impacts of outdoor air pollution in Africa, J. Geophys. Res.-Atmos., 124, 4104–4120, https://doi.org/10.1029/2018JD029336, 2019.
Boersma, K. F., Eskes, H., Richter, A., De Smedt, I., Lorente, A., Beirle, S., Van Geffen, J., Peters, E., Van Roozendael, M., and Wagner, T.: QA4ECV NO2 tropospheric and stratospheric vertical column data from OMI (Version 1.1), Royal Netherlands Meteorological Institute (KNMI), https://doi.org/10.21944/qa4ecv-no2-omi-v1.1, 2017a.
Boersma, K. F., van Geffen, J., Eskes, H., van der A, R., De Smedt, I., Van Roozendael, M., Yu, H., Richter, A., Peters, E., Beirle, S., Wagner, T., Lorente, A., Scanlon, T., Compernolle, S., and Lambert, J.-C.: Product Specification Document for the QA4ECV NO2 ECV precursor product, Techreport QA4ECV Deliverable D4.6, KNMI, https://www.temis.nl/qa4ecv/no2col/QA4ECV_NO2_PSD_v1.1.compressed.pdf (last access: 6 October 2023), 2017b.
Boone, A. A., Xue, Y., De Salesm, F., Comer, R. E., Hagos, S., Mahanama, S., Schiro, K., Song, G., Wang, G., Li, S., and Mechoso, C. R.: The regional impact of land-use land-cover change (LULCC) over West Africa from and ensemble of global climate models under the auspices of the WAMME2 project, Clim. Dynam., 47, 3547–3573, https://doi.org/10.1007/s00382-016-3252-y, 2016.
Bourgeois, I., Peischl, J., Thompson, C. R., Aikin, K. C., Campos, T., Clark, H., Commane, R., Daube, B., Diskin, G. W., Elkins, J. W., Gao, R.-S., Gaudel, A., Hintsa, E. J., Johnson, B. J., Kivi, R., McKain, K., Moore, F. L., Parrish, D. D., Querel, R., Ray, E., Sánchez, R., Sweeney, C., Tarasick, D. W., Thompson, A. M., Thouret, V., Witte, J. C., Wofsy, S. C., and Ryerson, T. B.: Global-scale distribution of ozone in the remote troposphere from the ATom and HIPPO airborne field missions, Atmos. Chem. Phys., 20, 10611–10635, https://doi.org/10.5194/acp-20-10611-2020, 2020.
Bourgeois, I., Peischl, J., Neuman, J. A., Brown, S. S., Thompson, C. R., Aikin, K. C., Allen, H. M., Angot, H., Apel, E. C., Baublitz, C. B., Brewer, J. F., Campuzano-Jost, P., Commane, R., Crounse, J. D., Daube, B. C., DiGangi, J. P., Diskin, G. S., Emmons, L. K., Fiore, A. M., Gkatzelis, G. I., Hills, A., Hornbrook, R. S., Huey, L. G., Jimenez, J. L., Kim, M., Lacey, F., McKain, K., Murray, L. T., Nault, B. A., Parrish, D. D., Ray, E., Sweeney, C., Tanner, D., Wofsy, S. C., and Ryerson, T. B.: Large contribution of biomass burning emissions to ozone throughout the global remote troposphere, P. Natl. Acad. Sci. USA, 118, e2109628118, https://doi.org/10.1073/pnas.2109628118, 2021.
Brown, F., Folberth, G. A., Sitch, S., Bauer, S., Bauters, M., Boeckx, P., Cheesman, A. W., Deushi, M., Dos Santos Vieira, I., Galy-Lacaux, C., Haywood, J., Keeble, J., Mercado, L. M., O'Connor, F. M., Oshima, N., Tsigaridis, K., and Verbeeck, H.: The ozone–climate penalty over South America and Africa by 2100, Atmos. Chem. Phys., 22, 12331–12352, https://doi.org/10.5194/acp-22-12331-2022, 2022.
CIESIN: Documentation for the Gridded Population of the World, Version 4 (GPWv4), Revision 11 Data Sets, Center for International Earth Science Information Network, Columbia University, NASA Socioeconomic Data and Applications Center (SEDAC), Palisades, NY, https://doi.org/10.7927/H45Q4T5F, 2018.
Chin, M., Ginoux, P., Kinne, S., Torres, O., Holben, B. N., Duncan, B. N., Martin, R. V., Logan, J. A., Higurashi, A., and Nakajima, T.: Tropospheric aerosol optical thickness from the GOCART model and comparisons with satellite and Sun photometer measurements, J. Atmos. Sci., 59, 461–483, 2002.
Clain, G., Baray, J. L., Delmas, R., Diab, R., Leclair de Bellevue, J., Keckhut, P., Posny, F., Metzger, J. M., and Cammas, J. P.: Tropospheric ozone climatology at two Southern Hemisphere tropical/subtropical sites, (Reunion Island and Irene, South Africa) from ozonesondes, LIDAR, and in situ aircraft measurements, Atmos. Chem. Phys., 9, 1723–1734, https://doi.org/10.5194/acp-9-1723-2009, 2009.
Clarke, K., Ash, K., Coker, E. S., Sabo-Attwood, T., and Bainomugisha, E.: A Social Vulnerability Index for Air Pollution and Its Spatially Varying Relationship to PM2.5 in Uganda, Atmosphere, 13, 1169, https://doi.org/10.3390/atmos13081169, 2022.
Compernolle, S., Verhoelst, T., Pinardi, G., Granville, J., Hubert, D., Keppens, A., Niemeijer, S., Rino, B., Bais, A., Beirle, S., Boersma, F., Burrows, J. P., De Smedt, I., Eskes, H., Goutail, F., Hendrick, F., Lorente, A., Pazmino, A., Piters, A., Peters, E., Pommereau, J.-P., Remmers, J., Richter, A., van Geffen, J., Van Roozendael, M., Wagner, T., and Lambert, J.-C.: Validation of Aura-OMI QA4ECV NO2 climate data records with ground-based DOAS networks: the role of measurement and comparison uncertainties, Atmos. Chem. Phys., 20, 8017–8045, https://doi.org/10.5194/acp-20-8017-2020, 2020.
Computational and Information Systems Laboratory: Cheyenne: HPE/SGI ICE XA System (NCAR Community Computing), National Center for Atmospheric Research, Boulder, CO, https://doi.org/10.5065/D6RX99HX, 2019.
Darmenov, A. and da Silva, A.: The quick fire emissions dataset (QFED) – documentation of versions 2.1, 2.2 and 2.4, NASA Tech. Rep. Ser. Glob. Model. Data Assim., NASA TM-2013-104606, 32, 1–183, https://ntrs.nasa.gov/citations/20180005253 (last access: 20 October 2023), 2013.
Davidson, O., Halsnaes, K., Huq, S., Kok, M., Metz, B., Sokona, Y., and Verhagen, J.: The development and climate nexus: the case of sub-Saharan Africa, Clim. Policy, 3, S97–S113, 2003.
De Smedt, I., Yu, H., Richter, A., Beirle, S., Eskes, H., Boersma, K. F., Van Roozendael, M., Van Geffen, J., Lorente, A., and Peters, E.: QA4ECV HCHO tropospheric column data from OMI (Version 1.1), Royal Belgian Institute for Space Aeronomy, https://doi.org/10.18758/71021031, 2017a.
De Smedt, I., Van Geffen, J., Richter, A., Beirle S., Yu, H., Vlietinck J., Van Roozendael, M. van der A R., Lorente A., Scanlon T., Compernolle S., Wagner T., Boersma, K. F., and Eskes, H.: Product User Guide for HCHO, https://www.temis.nl/qa4ecv/hcho/QA4ECV_HCHO_PSD_v1.0.pdf (last access: 6 October 2023), 2017b.
Deeter, M., Francis, G., Gille, J., Mao, D., Martínez-Alonso, S., Worden, H., Ziskin, D., Drummond, J., Commane, R., Diskin, G., and McKain, K.: The MOPITT Version 9 CO product: sampling enhancements and validation, Atmos. Meas. Tech., 15, 2325–2344, https://doi.org/10.5194/amt-15-2325-2022, 2022.
Deeter, M. N., Worden, H. M., Gille, J. C., Edwards, D. P., Mao, D., and Drummond, J. R.: MOPITT multispectral CO retrievals: Origins and effects of geophysical radiance errors, J. Geophys. Res., 116, D15303, https://doi.org/10.1029/2011JD015703, 2011.
Djossou, J., Léon, J.-F., Akpo, A. B., Liousse, C., Yoboué, V., Bedou, M., Bodjrenou, M., Chiron, C., Galy-Lacaux, C., Gardrat, E., Abbey, M., Keita, S., Bahino, J., Touré N'Datchoh, E., Ossohou, M., and Awanou, C. N.: Mass concentration, optical depth and carbon composition of particulate matter in the major southern West African cities of Cotonou (Benin) and Abidjan (Côte d'Ivoire), Atmos. Chem. Phys., 18, 6275–6291, https://doi.org/10.5194/acp-18-6275-2018, 2018.
Emmons, L. K., Walters, S., Hess, P. G., Lamarque, J.-F., Pfister, G. G., Fillmore, D., Granier, C., Guenther, A., Kinnison, D., Laepple, T., Orlando, J., Tie, X., Tyndall, G., Wiedinmyer, C., Baughcum, S. L., and Kloster, S.: Description and evaluation of the Model for Ozone and Related chemical Tracers, version 4 (MOZART-4), Geosci. Model Dev., 3, 43–67, https://doi.org/10.5194/gmd-3-43-2010, 2010.
Emmons, L. K., Schwantes, R. H., Orlando, J. J., Tyndall, G., Kinnison, D., Lamarque, J.-F., Marsh, D., Mills, M. J., Tilmes, S., Bardeen, C., Buchholz, R. R., Conley, A., Gettelman, A., Garcia, R., Simpson, I., Blake, D. R., Meinardi, S., and Pétron, G.: The Chemistry Mechanism in the Community Earth System Model version 2 (CESM2), J. Adv. Model. Earth Sy., 12, e2019MS001882, https://doi.org/10.1029/2019MS001882, 2020.
Fisher, J. A., Murray, L. T., Jones, D. B. A., and Deutscher, N. M.: Improved method for linear carbon monoxide simulation and source attribution in atmospheric chemistry models illustrated using GEOS-Chem v9, Geosci. Model Dev., 10, 4129–4144, https://doi.org/10.5194/gmd-10-4129-2017, 2017.
Fisher, S., Bellinger, D. C., Cropper, M. L., Kumar, P., Binagwaho, A., Koudenoukpo, J. B., Park, Y., Taghian, G., and Landrigan, P. J.: Air pollution and development in Africa: impacts on health, the economy, and human capital, Lancet Planet. Health, 5, e681–e688, 2021.
Friedl, M. and Sulla-Menashe, D.: MODIS/Terra+Aqua Land Cover Type Yearly L3 Global 0.05Deg CMG V061, distributed by NASA EOSDIS Land Processes DAAC, https://doi.org/10.5067/MODIS/MCD12C1.061, 2022.
Gaubert, B., Arellano, A. F., Barré, J., Worden, H. M., Emmons, L. K., Tilmes, S., Buchholz, R. R., Vitt, F., Raeder, K., Collins, N., Anderson, J. L., Wiedinmyer, C., Martínez-Alonso, S., Edwards, D. P., Andreae, M. O., Hannigan, J. W., Petri, C., Strong, K., and Jones, N.: Toward a chemical reanalysis in a coupled chemistry-climate model: An evaluation of MOPITT CO assimilation and its impact on tropospheric composition, J. Geophys. Res.-Atmos., 121, 7310–7343, https://doi.org/10.1002/2016JD024863, 2016.
Gaubert, B., Emmons, L. K., Raeder, K., Tilmes, S., Miyazaki, K., Arellano Jr., A. F., Elguindi, N., Granier, C., Tang, W., Barré, J., Worden, H. M., Buchholz, R. R., Edwards, D. P., Franke, P., Anderson, J. L., Saunois, M., Schroeder, J., Woo, J.-H., Simpson, I. J., Blake, D. R., Meinardi, S., Wennberg, P. O., Crounse, J., Teng, A., Kim, M., Dickerson, R. R., He, H., Ren, X., Pusede, S. E., and Diskin, G. S.: Correcting model biases of CO in East Asia: impact on oxidant distributions during KORUS-AQ, Atmos. Chem. Phys., 20, 14617–14647, https://doi.org/10.5194/acp-20-14617-2020, 2020.
Gelaro, R., McCarty, W., Suarez, M. J., Todling, R., Molod, A., Takacs, L., Randles, C., Darmenov, A., Bosilovich, M. G., Reichle, R., Wargan, K., Coy, L., Cullather, R., Draper, C., Akella, S., Buchard, V., Conaty, A., da Silva, A., Gu, W., Kim, G. K., Koster, R., Lucchesi, R., Merkova, D., Nielsen, J. E., Partyka, G., Pawson, S., Putman, W., Rienecker, M., Schubert, S. D., Sienkiewicz, M., and Zhao, B.: The Modern-Era Retrospective Analysis for Research and Applications, Version 2 (MERRA-2), J. Climate, 30, 5419–5454, https://doi.org/10.1175/JCLI-D-16-0758.1, 2017.
Ginoux, P., Chin, M., Tegen, I., Prospero, J. M., Holben, B., Dubovik, O., and Lin, S. J.: Sources and distributions of dust aerosols simulated with the GOCART model, J. Geophys. Res., 106, 20255–20273, 2001.
Gordon, J. N., Bilsback, K. R., Fiddler, M. N., Pokhrel, R. P., Fischer, E. V., Pierce, J. R., and Bililign, S.: The effects of trash, residential biofuel, and open biomass burning emissions on local and transported PM2.5 and its attributed mortality in Africa, GeoHealth, 7, e2022GH000673, https://doi.org/10.1029/2022GH000673, 2023.
Güneralp, B., Lwasa, S., Masundire, H., Parnell, S., and Seto, K. C.: Urbanization in Africa: challenges and opportunities for conservation, Environ. Res. Lett., 13, 015002, https://doi.org/10.1088/1748-9326/aa94fe, 2017.
Gwaze, P. and Mashele, S. H.: South African Air Quality Information System (SAAQIS) mobile application tool: Bringing real time state of air quality to South Africans, Clean Air J., 28, https://doi.org/10.17159/2410-972X/2018/v28n1a1, 2018.
Haile, G. G., Tang, Q., Sun, S., Huang, Z., Zhang, X., and Liu, X.: Droughts in East Africa: Causes, impacts and resilience, Earth-Sci. Rev., 193, 146–161, 2019.
Heft-Neal, S., Burney, J., Bendavid, E., and Burke, M.: Robust relationship between air quality and infant mortality in Africa, Nature, 559, 254–258, 2018.
Holben, B. N., Eck, T. F., Slutsker, I. A., Tanré, D., Buis, J. P., Setzer, A., Vermote, E., Reagan, J. A., Kaufman, Y. J., Nakajima, T., and Lavenu, F.: AERONET – A federated instrument network and data archive for aerosol characterization, Remote Sens. Environ., 66, 1–16, https://doi.org/10.1016/S0034-4257(98)00031-5, 1998.
Holben, B. N., Tanre, D., Smirnov, A., Eck, T. F., Slutsker, I., Abuhassan, N., Newcomb, W. W., Schafer, J., Chatenet, B,. Lavenue, F., Kaufman, Y., Vande Castle, J., Setzer, A., Markham, B., Clark, D., Frouin, R., Halthore, R., Karnieli, A., O'Neill, N. T., Pietras, C., Pinker, R. T., Voss, K., and Zibordi, G.: An emerging ground-based aerosol climatology: Aerosol optical depth from AERONET, J. Geophys. Res., 106, 12067–12097, https://doi.org/10.1029/2001JD900014, 2001.
Hsu, N. C., Jeong, M. J., Bettenhausen, C., Sayer, A. M., Hansell, R., Seftor, C. S., Huang, J., and Tsay, S. C.: Enhanced Deep Blue aerosol retrieval algorithm: The second generation, J. Geophys. Res.-Atmos., 118, 9296–9315, 2013.
Jenkins, G. and Gueye, M.: Annual and early summer variability in WRF-CHEM simulated West African PM10 during 1960–2016, Atmos. Environ., 273, 118957, https://doi.org/10.1016/j.atmosenv.2022.118957, 2022.
Jo, D. S., Emmons, L. K., Callaghan, P., Tilmes, S., Woo, J. H., Kim, Y., Kim, J., Granier, C., Soulié, A., Doumbia, T., and Darras, S.: Comparison of Urban Air Quality Simulations During the KORUS-AQ Campaign With Regionally Refined Versus Global Uniform Grids in the Multi-Scale Infrastructure for Chemistry and Aerosols (MUSICA) Version 0, J. Adv. Model. Earth Sy., 15, e2022MS003458, https://doi.org/10.1029/2022MS003458, 2023.
Kalisa, E., Nagato, E. G., Bizuru, E., Lee, K. C., Tang, N., Pointing, S. B., Hayakawa, K., Archer, S. D., and Lacap-Bugler, D. C.: Characterization and risk assessment of atmospheric PM2.5 and PM10 particulate-bound PAHs and NPAHs in Rwanda, Central-East Africa, Environ. Sci. Technol., 52, 12179–12187, 2018.
Kalisa, E., Kuuire, V., and Adams, M.: Children's exposure to indoor and outdoor black carbon and particulate matter air pollution at school in Rwanda, Central-East Africa, Environ. Adv., 11, 100334, https://doi.org/10.1016/j.envadv.2022.100334, 2023.
Keita, S., Liousse, C., Yoboué, V., Dominutti, P., Guinot, B., Assamoi, E.-M., Borbon, A., Haslett, S. L., Bouvier, L., Colomb, A., Coe, H., Akpo, A., Adon, J., Bahino, J., Doumbia, M., Djossou, J., Galy-Lacaux, C., Gardrat, E., Gnamien, S., Léon, J. F., Ossohou, M., N'Datchoh, E. T., and Roblou, L.: Particle and VOC emission factor measurements for anthropogenic sources in West Africa, Atmos. Chem. Phys., 18, 7691–7708, https://doi.org/10.5194/acp-18-7691-2018, 2018.
Keita, S., Liousse, C., Assamoi, E.-M., Doumbia, T., N'Datchoh, E. T., Gnamien, S., Elguindi, N., Granier, C., and Yoboué, V.: African anthropogenic emissions inventory for gases and particles from 1990 to 2015, Earth Syst. Sci. Data, 13, 3691–3705, https://doi.org/10.5194/essd-13-3691-2021, 2021.
Kinney, P. L., Gichuru, M. G., Volavka-Close, N., Ngo, N., Ndiba, P. K., Law, A., Gachanja, A., Gaita, S. M., Chillrud, S. N., and Sclar, E.: Traffic impacts on PM2.5 air quality in Nairobi, Kenya. Environ. Sci. Policy, 14, 369–378, 2011.
Klimont, Z., Smith, S. J., and Cofala, J.: The last decade of global anthropogenic sulfur dioxide: 2000–2011 emissions, Environ. Res. Lett., 8, 014003, https://doi.org/10.1088/1748-9326/8/1/014003, 2013.
Kuik, F., Lauer, A., Beukes, J. P., Van Zyl, P. G., Josipovic, M., Vakkari, V., Laakso, L., and Feig, G. T.: The anthropogenic contribution to atmospheric black carbon concentrations in southern Africa: a WRF-Chem modeling study, Atmos. Chem. Phys., 15, 8809–8830, https://doi.org/10.5194/acp-15-8809-2015, 2015.
Kumar, R., He, C., Bhardwaj, P., Lacey, F., Buchholz, R. R., Brasseur, G. P., Joubert, W., Labuschagne, C., Kozlova, E., and Mkololo, T.: Assessment of regional carbon monoxide simulations over Africa and insights into source attribution and regional transport, Atmos. Environ., 277, 119075, https://doi.org/10.1016/j.atmosenv.2022.119075, 2022.
Labuschagne, C., Kuyper, B., Brunke, E. G., Mokolo, T., Van der Spuy, D., Martin, L., Mbambalala, E., Parker, B., Khan, M. A. H., Davies-Coleman, M. T., and Shallcross, D. E.: A review of four decades of atmospheric trace gas measurements at Cape Point, South Africa, T. Roy. Soc. S. Afr., 73, 113–132, 2018.
Lacey, F. G., Marais, E. A., Henze, D. K., Lee, C. J., van Donkelaar, A., Martin, R. V., Hannigan, M. P., and Wiedinmyer, C.: Improving present day and future estimates of anthropogenic sectoral emissions and the resulting air quality impacts in Africa, Faraday Discuss., 200, 397–412, https://doi.org/10.1039/C7FD00011A, 2017.
Lamarque, J.-F., Bond, T. C., Eyring, V., Granier, C., Heil, A., Klimont, Z., Lee, D., Liousse, C., Mieville, A., Owen, B., Schultz, M. G., Shindell, D., Smith, S. J., Stehfest, E., Van Aardenne, J., Cooper, O. R., Kainuma, M., Mahowald, N., McConnell, J. R., Naik, V., Riahi, K., and van Vuuren, D. P.: Historical (1850–2000) gridded anthropogenic and biomass burning emissions of reactive gases and aerosols: methodology and application, Atmos. Chem. Phys., 10, 7017–7039, https://doi.org/10.5194/acp-10-7017-2010, 2010.
Langerman, K. E., Garland, R. M., Feig, G., Mpanza, M., and Wernecke, B.: South Africa's electricity disaster is an air quality disaster, too, Clean Air J., 33, 1–2, 2023.
Lauritzen, P. H., Nair, R. D., Herrington, A. R., Callaghan, P., Goldhaber, S., Dennis, J. M., Bacmeister, J. T., Eaton, B. E., Zarzycki, C. M., Taylor, M. A., Ullrich, P. A., Dubos, T., Gettelman, A., Neale, R. B., Dobbins, B., Reed, K. A., Hannay, C., Medeiros, B., Benedict, J. J., and Tribbia, J. J.: NCAR Release of CAM-SE in CESM2.0: A Reformulation of the Spectral Element Dynamical Core in Dry-Mass Vertical Coordinates With Comprehensive Treatment of Condensates and Energy, J. Adv. Model. Earth Sy., 10, 1537–1570, 2018.
Leclair De Bellevue, J., Réchou, A., Baray, J. L., Ancellet, G., and Diab, R. D.: Signatures of stratosphere to troposphere transport near deep convective events in the southern subtropics, J. Geophys. Res., 111, D24107, https://doi.org/10.1029/2005JD006947, 2006.
Levelt, P. F., van den Oord, G. H. J., Dobber, M. R., Malkki, A., Visser, H., de Vries, J., Stammes, P., Lundell, J. O. V., and Saari, H.: The ozone monitoring instrument, IEEE T. Geosci. Remote, 44, 1093–1101, https://doi.org/10.1109/TGRS.2006.872333, 2006.
Levy, R. and Hsu, C.: MODIS Atmosphere L2 Aerosol Product, NASA MODIS Adaptive Processing System, Goddard Space Flight Center, USA, https://doi.org/10.5067/MODIS/MOD04_L2.061, 2015.
Levy, R. C., Mattoo, S., Munchak, L. A., Remer, L. A., Sayer, A. M., Patadia, F., and Hsu, N. C.: The Collection 6 MODIS aerosol products over land and ocean, Atmos. Meas. Tech., 6, 2989–3034, https://doi.org/10.5194/amt-6-2989-2013, 2013.
Liousse, C., Assamoi, E., Criqui, P., Granier, C., and Rosset, R.: Explosive growth in African combustion emissions from 2005 to 2030, Environ. Res. Lett., 9, 35003, https://doi.org/10.1088/1748-9326/9/3/035003, 2014.
Liu, J. C., Mickley, L. J., Sulprizio, M. P., Dominici, F., Yue, X., Ebisu, K., Anderson, G. B., Khan, R. F. A., Bravo, M. A., and Bell, M. L.: Particulate air pollution from wildfires in the Western US under climate change, Climatic Change, 138, 655–666, https://doi.org/10.1007/s10584-016-1762-6, 2016.
Longueville, F. D., Hountondji, Y.-C., Henry, S., and Ozer, P.: What do we know about effects of desert dust on air quality and human health in West Africa compared to other regions?, Sci. Total Environ., 409, 1–8, https://doi.org/10.1016/j.scitotenv.2010.09.025, 2010.
Mahowald, N. M., Muhs, D. R., Levis, S., Rasch, P. J., Yoshioka, M., Zender, C. S., and Luo, C.: Change in atmospheric mineral aerosols in response to climate: Last glacial period, preindustrial, modern, and doubled carbon dioxide climates, J. Geophys. Res., 111, D10202, https://doi.org/10.1029/2005JD006653, 2006.
Malings, C., Westervelt, D. M., Hauryliuk, A., Presto, A. A., Grieshop, A., Bittner, A., Beekmann, M., and R. Subramanian: Application of low-cost fine particulate mass monitors to convert satellite aerosol optical depth to surface concentrations in North America and Africa, Atmos. Meas. Tech., 13, 3873–3892, https://doi.org/10.5194/amt-13-3873-2020, 2020.
Marais, E. A., Jacob, D. J., Kurosu, T. P., Chance, K., Murphy, J. G., Reeves, C., Mills, G., Casadio, S., Millet, D. B., Barkley, M. P., Paulot, F., and Mao, J.: Isoprene emissions in Africa inferred from OMI observations of formaldehyde columns, Atmos. Chem. Phys., 12, 6219–6235, https://doi.org/10.5194/acp-12-6219-2012, 2012.
Marais, E. A., Silvern, R. F., Vodonos, A., Dupin, E., Bockarie, A. S., Mickley, L. J., and Schwartz, J.: Air Quality and Health Impact of Future Fossil Fuel Use for Electricity Generation and Transport in Africa, Environ. Sci. Technol., 53, 13524–13534, https://doi.org/10.1021/acs.est.9b04958, 2019.
Maseko, B., Feig, G., and Burger, R.: Estimating lightning NOx production over South Africa, S. Afr. J. Sci., 117, 1–11, 2021.
Mazzeo, A., Burrow, M., Quinn, A., Marais, E. A., Singh, A., Ng'ang'a, D., Gatari, M. J., and Pope, F. D.: Evaluation of the WRF and CHIMERE models for the simulation of PM2.5 in large East African urban conurbations, Atmos. Chem. Phys., 22, 10677–10701, https://doi.org/10.5194/acp-22-10677-2022, 2022.
Menut, L., Flamant, C., Turquety, S., Deroubaix, A., Chazette, P., and Meynadier, R.: Impact of biomass burning on pollutant surface concentrations in megacities of the Gulf of Guinea, Atmos. Chem. Phys., 18, 2687–2707, https://doi.org/10.5194/acp-18-2687-2018, 2018.
Mkololo, T., Mbatha, N., Sivakumar, V., Bègue, N., Coetzee, G., and Labuschagne, C.: Stratosphere–Troposphere exchange and O3 variability in the lower stratosphere and upper troposphere over the irene SHADOZ site, South Africa, Atmosphere, 11, 586, https://doi.org/10.3390/atmos11060586, 2020.
Moss, R. H., Brenkert, A. L., and Malone, E. L.: Vulnerability to climate change: a quantitative approach, Prepared for the US Department of Energy, Pacific Northwest National Laboratory, Richland, https://www.ipcc.ch/apps/njlite/ar5wg2/njlite_download2.php?id=9186 (last access: 20 October 2023), 2001.
Naiker, Y., Diab, R. D., Zunckel, M., and Hayes, E. T.: Introduction of local Air Quality Management in South Africa: overview and challenges, Environ. Sci. Policy, 17, 62–71, 2012.
Nicholson, S. E.: A review of climate dynamics and climate variability in Eastern Africa, Limnology, Climatology and Paleoclimatology of the East African Lakes, 25–56, https://doi.org/10.1201/9780203748978-2, 2019.
Nka, B. N., Oudin, L., Karambiri, H., Paturel, J. E., and Ribstein, P.: Trends in floods in West Africa: analysis based on 11 catchments in the region, Hydrol. Earth Syst. Sci., 19, 4707–4719, https://doi.org/10.5194/hess-19-4707-2015, 2015.
Okure, D., Ssematimba, J., Sserunjogi, R., Gracia, N. L., Soppelsa, M. E., and Bainomugisha, E.: Characterization of ambient air quality in selected urban areas in uganda using low-cost sensing and measurement technologies, Environ. Sci. Technol., 56, 3324–3339, 2022.
Oluleye, A. and Okogbue, E. C.: Analysis of temporal and spatial variability of total column ozone over West Africa using daily TOMS measurements, Atmos. Pollut. Res., 4, 387–397, 2013.
Paton-Walsh, C., Emmerson, K. M., Garland, R. M., Keywood, M., Hoelzemann, J. J., Huneeus, N., Buchholz, R. R., Humphries, R. S., Altieri, K., Schmale, J., Wilson, S. R., Labuschagne, C., Kalisa, E., Fisher, J. A., Deutscher, N. M., van Zyl, P. G., Beukes, J. P., Joubert, W., Martin, L., Mkololo, T., Barbosa, C., Anrade, M. de F., Schofield, R., Mallet, M. D., Harvey, M. J., Formenti, P., Piketh, S. J., and Olivares, G.: Key challenges for tropospheric chemistry in the Southern Hemisphere, Elem. Sci. Anth., 10, 1–35, https://doi.org/10.1525/elementa.2021.00050, 2022.
Petkova, E. P., Jack, D. W., Volavka-Close, N. H., and Kinney, P. L.: Particulate matter pollution in African cities, Air Qual. Atmos. Hlth., 6, 603–614, https://doi.org/10.1007/s11869-013-0199-6, 2013.
Petzold, A., Thouret, V., Gerbig, C., Zahn, A., Brenninkmeijer, C., Gallagher, M., Hermann, M., Pontaud, M., Ziereis, H., Boulanger, D., Marshall, J., Nédélec, P., Smit, H., Friess, U., Flaud, J.-M., Wahner, A., Cammas, J.-P., and Volz-Thomas, A.: Global-scale atmosphere monitoring by in-service aircraft – current achievements and future prospects of the European Research Infrastructure IAGOS, Tellus B, 67, 28452, https://doi.org/10.3402/tellusb.v67.28452, 2015.
Pfister, G., Eastham, S., Arellano, A. F., Aumont, B., Barsanti, K., Barth, M., Conley, A., Davis, N., Emmons, L., Fast, J., Fiore, A., Gaubert, B., Goldhaber, S., Granier, C., Grell, G., Guevara, M., Henze, D., Hodzic, A., Liu, X., Marsh, D., Orlando, J., Plane, J., Polvani, L., Rosenlof, K., Steiner, A., Jacob, D., and Brasseur, G.: The Multi-Scale Infrastructure for Chemistry and Aerosols (MUSICA), B. Am. Meteorol. Soc., 101, E1743–E1760, https://doi.org/10.1175/bams-d-19-0331.1, 2020.
Pokhrel, R. P., Gordon, J., Fiddler, M., and Bililign, S.: Determination of emission factors of pollutants from biomass burning of African fuels in laboratory measurements, J. Geophys. Res., 126, e2021JD034731, https://doi.org/10.1029/2021JD034731, 2021.
Schwantes, R. H., Lacey, F. G., Tilmes, S., Emmons, L. K., Lauritzen, P. H., Walters, S., Callaghan, P., Zarzycki, C. M., Barth, M. C., Jo, D. S., Bacmeister, J. T., Neale, R. B., Vitt, F., Kluzek, E., Roozitalab, B., Hall, S. R., Ullmann, K., Warneke, C., Peischl, J., Pollack, I. B., Flocke, F., Wolfe, G. M., Hanisco, T. F., Keutsch, F. N., Kaiser, J., Bui, T. P. V., Jimenez, J. L., Campuzano-Jost, P., Apel, E. C., Hornbrook, R. S., Hills, A. J., Yuan, B., and Wisthaler, A.: Evaluating the Impact of Chemical Complexity and Horizontal Resolution on Tropospheric Ozone Over the Conterminous US With a Global Variable Resolution Chemistry Model, J. Adv. Model. Earth Sy., 14, e2021MS002889, https://doi.org/10.1029/2021MS002889, 2022.
Shindell, D. T., Faluvegi, G., Stevenson, D. S., Krol, M. C., Emmons, L. K., Lamarque, J. F., Pétron, G., Dentener, F. J., Ellingsen, K., Schultz, M. G., and Wild, O.: Multimodel simulations of carbon monoxide: Comparison with observations and projected near-future changes, J. Geophys. Res., 111, D19306, https://doi.org/10.1029/2006JD007100, 2006.
Soulie, A., Granier, C., Darras, S., Zilbermann, N., Doumbia, T., Guevara, M., Jalkanen, J.-P., Keita, S., Liousse, C., Crippa, M., Guizzardi, D., Hoesly, R., and Smith, S.: Global Anthropogenic Emissions (CAMS-GLOB-ANT) for the Copernicus Atmosphere Monitoring Service Simulations of Air Quality Forecasts and Reanalyses, Earth Syst. Sci. Data Discuss. [preprint], https://doi.org/10.5194/essd-2023-306, in review, 2023.
Sserunjogi, R., Ssematimba, J., Okure, D., Ogenrwot, D., Adong, P., Muyama, L., Nsimbe, N., Bbaale, M., and Bainomugisha, E.: Seeing the air in detail: Hyperlocal air quality dataset collected from spatially distributed AirQo network, Data in Brief, 44, 108512, https://doi.org/10.1016/j.dib.2022.108512, 2022.
Stauffer, R. M., Thompson, A. M., Kollonige, D. E., Witte, J. C., Tarasick, D. W., Davies, J., Vömel, H., Morris, G. A., van Malderen, R., Johnson, B. J., Querel, R. R., Selkirk, H. B., Stübi, R., and Smit, H. G. J.: A Post–2013 Dropoff in Total Ozone at a Third of Global Ozonesonde Stations: Electrochemical Concentration Cell Instrument Artifacts?, Geophys. Res. Lett., 47, e2019GL086791, https://doi.org/10.1029/2019GL086791, 2020.
Stein, O., Schultz, M. G., Bouarar, I., Clark, H., Huijnen, V., Gaudel, A., George, M., and Clerbaux, C.: On the wintertime low bias of Northern Hemisphere carbon monoxide found in global model simulations, Atmos. Chem. Phys., 14, 9295–9316, https://doi.org/10.5194/acp-14-9295-2014, 2014.
Swilling, M., Musango, J., and Wakeford, J.: Developmental states and sustainability transitions: prospects of a just transition in South Africa, J. Environ. Pol. Plan., 18, 650–672, 2016.
Tang, W.: MUSICAv0 model source code for air quality application in Africa, Zenodo [code], https://doi.org/10.5281/zenodo.8051435, 2023a.
Tang, W.: Data produced by the study “Application of the Multi-Scale Infrastructure for Chemistry and Aerosols version 0 (MUSICAv0) for air quality in Africa”, Zenodo [data set], https://doi.org/10.5281/zenodo.8051443, 2023b.
Tang, W., Arellano, A. F., DiGangi, J. P., Choi, Y., Diskin, G. S., Agustí-Panareda, A., Parrington, M., Massart, S., Gaubert, B., Lee, Y., Kim, D., Jung, J., Hong, J., Hong, J.-W., Kanaya, Y., Lee, M., Stauffer, R. M., Thompson, A. M., Flynn, J. H., and Woo, J.-H.: Evaluating high-resolution forecasts of atmospheric CO and CO2 from a global prediction system during KORUS-AQ field campaign, Atmos. Chem. Phys., 18, 11007–11030, https://doi.org/10.5194/acp-18-11007-2018, 2018.
Tang, W., Emmons, L. K., Arellano Jr., A. F., Gaubert, B., Knote, C., Tilmes, S., Buchholz, R. R., Pfister, G. G., Diskin, G. S., Blake, D. R., Blake, N. J., Meinardi, S., DiGangi, J. P., Choi, Y., Woo, J.-H., He, C., Schroeder, J. R., Suh, I., Lee, H.-J., Jo, H.-Y., Kanaya, Y., Jung, J., Lee, Y., and Kim, D.: Source contributions to carbon monoxide concentrations during KORUS-AQ based on CAM-chem model applications, J. Geophys. Res.-Atmos., 124, 1–27, https://doi.org/10.1029/2018jd029151, 2019.
Tang, W., Emmons, L. K., Buchholz, R. R., Wiedinmyer, C., Schwantes, R. H., He, C., Kumar, R., Pfister, G. G., Worden, H. M., Hornbrook, R. S., and Apel, E. C.: Effects of Fire Diurnal Variation and Plume Rise on US Air Quality During FIREX-AQ and WE-CAN Based on the Multi-Scale Infrastructure for Chemistry and Aerosols (MUSICAv0), J. Geophys. Res.-Atmos., 127, e2022JD036650, https://doi.org/10.1029/2022JD036650, 2022.
Tang, W., Pfister, G. G., Kumar, R., Barth, M., Edwards, D. P., Emmons, L. K., and Tilmes, S.: Capturing High-Resolution Air Pollution Features Using the Multi-Scale Infrastructure for Chemistry and Aerosols Version 0 (MUSICAv0) Global Modeling System, J. Geophys. Res.-Atmos., 128, e2022JD038345, https://doi.org/10.1029/2022JD038345, 2023.
Taylor, K. E.: Summarizing multiple aspects of model performance in a single diagram, J. Geophys. Res.-Atmos., 106, 7183–7192, https://doi.org/10.1029/2000JD900719, 2001.
Thompson, A. M., Balashov, N. V., Witte, J. C., Coetzee, J. G. R., Thouret, V., and Posny, F.: Tropospheric ozone increases over the southern Africa region: bellwether for rapid growth in Southern Hemisphere pollution?, Atmos. Chem. Phys., 14, 9855–9869, https://doi.org/10.5194/acp-14-9855-2014, 2014.
Thompson, A. M., Witte, J. C., Sterling, C., Jordan, A., Johnson, B. J., Oltmans, S. J., Fujiwara, M., Vömel, H., Allaart, M., Piters, A., Coetzee, G. J. R., Posny, F., Corrales, E., Andres Diaz, J., Félix, C., Komala, N., Lai, N., Maata, M., Mani, F., Zainal, Z., Ogino, S.-Y., Paredes, F., Luiz Bezerra Penha, T., Raimundo da Silva, F., Sallons-Mitro, S., Selkirk, H. B., Schmidlin, F. J., Stuebi, R., and Thiongo, K.: First reprocessing of Southern Hemisphere Additional Ozonesondes (SHADOZ) Ozone Profiles (1998–2016). 2. Comparisons with satellites and ground-based instruments, J. Geophys. Res., 122, 13000–13025, https://doi.org/10.1002/2017JD027406, 2017.
Thompson, C. R., Wofsy, S. C., Prather, M. J., Newman, P. A., Hanisco, T. F., Ryerson, T. B., Fahey, D. W., Apel, E. C., Brock, C. A., Brune, W. H., Froyd, K., Katich, J. M., Nicely, J. M., Peischl, J., Ray, E., Veres, P. R., Wang, S., Allen, H. M., Asher, E., Bian, H., Blake, D., Bourgeois, I., Budney, J., Bui, T. P., Butler, A., Campuzano-Jost, P., Chang, C., Chin, M., Commane, R., Correa, G., Crounse, J. D., Daube, B., Dibb, J. E., DiGangi, J. P., Diskin, G. S., Dollner, M., Elkins, J. W., Fiore, A. M., Flynn, C. M., Guo, H., Hall, S. R., Hannun, R. A., Hills, A., Hintsa, E. J., Hodzic, A., Hornbrook, R. S., Huey, L. G., Jimenez, J. L., Keeling, R. F., Kim, M. J., Kupc, A., Lacey, F., Lait, L. R., Lamarque, J., Liu, J., McKain, K., Meinardi, S., Miller, D. O., Montzka, S. A., Moore, F. L., Morgan, E. J., Murphy, D. M., Murray, L. T., Nault, B. A., Neuman, J. A., Nguyen, L., Gonzalez, Y., Rollins, A., Rosenlof, K., Sargent, M., Schill, G., Schwarz, J. P., Clair, J. M. S., Steenrod, S. D., Stephens, B. B., Strahan, S. E., Strode, S. A., Sweeney, C., Thames, A. B., Ullmann, K., Wagner, N., Weber, R., Weinzierl, B., Wennberg, P. O., Williamson, C. J., Wolfe, G. M., and Zeng, L.: The NASA Atmospheric Tomography (ATom) Mission: Imaging the Chemistry of the Global Atmosphere, B. Am. Meteorol. Soc., 103, E761–E790, 2022.
Tilmes, S., Lamarque, J.-F., Emmons, L. K., Kinnison, D. E., Ma, P.-L., Liu, X., Ghan, S., Bardeen, C., Arnold, S., Deeter, M., Vitt, F., Ryerson, T., Elkins, J. W., Moore, F., Spackman, J. R., and Val Martin, M.: Description and evaluation of tropospheric chemistry and aerosols in the Community Earth System Model (CESM1.2), Geosci. Model Dev., 8, 1395–1426, https://doi.org/10.5194/gmd-8-1395-2015, 2015.
Tilmes, S., Hodzic, A., Emmons, L. K., Mills, M. J., Gettelman, A., Kinnison, D. E., Park, M., Lamarque, J. -F., Vitt, F., Shrivastava, M., Campuzano Jost, P., Jimenez, J., and Liu, X.: Climate forcing and trends of organic aerosols in the Community Earth System Model (CESM2), J. Adv. Model. Earth Sy., 11, 4323–4351, https://doi.org/10.1029/2019MS001827, 2019.
Tshehla, C. and Wright, C. Y.: 15 years after the National Environmental Management Air Quality Act: Is legislation failing to reduce air pollution in South Africa?, S. Afr. J. Sci., 115, 1–4, 2019.
U.S. EPA: Quality Assurance Guidance Document 2.12: Monitoring PM2.5 in Ambient Air Using Designated Reference or Class I Equivalent Methods, United States Environmental Protection Agency, https://www3.epa.gov/ttnamti1/files/ambient/pm25/qa/m212.pdf (last access: 20 November 2022), 2016.
van der Werf, G. R., Randerson, J. T., Giglio, L., van Leeuwen, T. T., Chen, Y., Rogers, B. M., Mu, M., van Marle, M. J. E., Morton, D. C., Collatz, G. J., Yokelson, R. J., and Kasibhatla, P. S.: Global fire emissions estimates during 1997–2016, Earth Syst. Sci. Data, 9, 697–720, https://doi.org/10.5194/essd-9-697-2017, 2017.
Vohra, K., Marais, E. A., Bloss, W. J., Schwartz, J., Mickley, L. J., Van Damme, M., Clarisse, L., and Coheur, P.-F.: Rapid rise in premature mortality due to anthropogenic air pollution in fast-growing tropical cities from 2005 to 2018, Sci. Adv., 8, eabm4435, https://doi.org/10.1126/sciadv.abm4435, 2022.
Washington, R., Harrison, M., Conway, D., Black, E., Challinor, A., Grimes, D., Jones, R., Morse, A., Kay, G., and Todd, M.: African Climate Change: Taking the Shorter Route, B. Am. Meteorol. Soc., 87, 1355–1366, https://doi.org/10.1175/BAMS-87-10-1355, 2006.
Watson, J. G., Chow, J. C., Moosmüller, H., Green, M., Frank, N., and Pitchford, M.: Guidance for using continuous monitors in PM2.5 monitoring networks, U.S. EPA Office of Air Quality Planning and Standards, Triangle Park, NC, 1998.
Wiedinmyer, C., Akagi, S. K., Yokelson, R. J., Emmons, L. K., Al-Saadi, J. A., Orlando, J. J., and Soja, A. J.: The Fire INventory from NCAR (FINN): a high resolution global model to estimate the emissions from open burning, Geosci. Model Dev., 4, 625–641, https://doi.org/10.5194/gmd-4-625-2011, 2011.
Wiedinmyer, C., Yokelson, R. J., and Gullett, B. K.: Global emissions of trace gases, particulate matter, and hazardous air pollutants from open burning of domestic waste, Environ. Sci. Technol., 48, 9523–9530, https://doi.org/10.1021/es502250z, 2014.
Wiedinmyer, C., Kimura, Y., McDonald-Buller, E. C., Emmons, L. K., Buchholz, R. R., Tang, W., Seto, K., Joseph, M. B., Barsanti, K. C., Carlton, A. G., and Yokelson, R.: The Fire Inventory from NCAR version 2.5: an updated global fire emissions model for climate and chemistry applications, Geosci. Model Dev., 16, 3873–3891, https://doi.org/10.5194/gmd-16-3873-2023, 2023.
Witte, J. C., Thompson, A. M., Smit, H. G. J., Fujiwara, M., Posny, F., Coetzee, G. J. R., Northam, E. T., Johnson, B. J., Sterling, C. W., Mohamad, M., Ogino, S.-Y., Jordan, A., and da Silva, F. R.: First reprocessing of Southern Hemisphere ADditional OZonesondes (SHADOZ) profile records (1998–2015): 1. Methodology and evaluation, J. Geophys. Res.-Atmos., 122, 6611–6636, https://doi.org/10.1002/2016JD026403, 2017.
Witte, J. C., Thompson, A. M., Smit, H. G. J., Vömel, H., Posny, F., and Stuebi, R.: First reprocessing of Southern Hemisphere Additional Ozonesondes (SHADOZ) Profile Records. 3. Uncertainty in ozone profile and total column, J. Geophys. Res., 123, 3243–3268, https://doi.org/10.1002/2017JD027791, 2018.
Wofsy, S. C., Afshar, S., Allen, H. M., Apel, E. C., Asher, E. C., Barletta, B., Bent, J., Bian, H., Biggs, B. C., Blake, D. R., Blake, N., Bourgeois, I., Brock, C. A., Brune, W. H., Budney, J. W., Bui, T. P., Butler, A., Campuzano-Jost, P., Chang, C. S., Chin, M., Commane, R., Correa, G., Crounse, J. D., Cullis, P. D., Daube, B. C., Day, D. A., Dean-Day, J. M., Dibb, J. E., DiGangi, J. P., Diskin, G. S., Dollner, M., Elkins, J. W., Erdesz, F., Fiore, A. M., Flynn, C. M., Froyd, K. D., Gesler, D. W., Hall, S. R., Hanisco, T. F., Hannun, R. A., Hills, A. J., Hintsa, E. J., Hoffman, A., Hornbrook, R. S., Huey, L. G., Hughes, S., Jimenez, J. L., Johnson, B. J., Katich, J. M., Keeling, R. F., Kim, M. J., Kupc, A., Lait, L. R., McKain, K., Mclaughlin, R. J., Meinardi, S., Miller, D. O., Montzka, S. A., Moore, F. L., Morgan, E. J., Murphy, D. M., Murray, L. T., Nault, B. A., Neuman, J. A., Newman, P. A., Nicely, J. M., Pan, X., Paplawsky, W., Peischl, J., Prather, M. J., Price, D. J., Ray, E. A., Reeves, J. M., Richardson, M., Rollins, A. W., Rosenlof, K. H., Ryerson, T. B., Scheuer, E., Schill, G. P., Schroder, J. C., Schwarz, J. P., Clair, J. M. St., Steenrod, S. D., Stephens, B. B., Strode, S. A., Sweeney, C., Tanner, D., Teng, A. P., Thames, A. B., Thompson, C. R., Ullmann, K., Veres, P. R., Wagner, N. L., Watt, A., Weber, R., Weinzierl, B. B., Wennberg, P. O., Williamson, C. J., Wilson, J. C., Wolfe, G. M., Woods, C. T., Zeng, L. H., and Vieznor, N., .: ATom: Merged Atmospheric Chemistry, Trace Gases, and Aerosols, Version 2, ORNL DAAC, Oak Ridge, Tennessee, USA, https://doi.org/10.3334/ORNLDAAC/1925, 2021.
Worden, H. M., Deeter, M. N., Edwards, D. P., Gille, J. C., Drummond, J. R., and Nédélec, P.: Observations of near-surface carbon monoxide from space using MOPITT multispectral retrievals, J. Geophys. Res., 115, D18314, https://doi.org/10.1029/2010JD014242, 2010.
Yoshioka, M., Mahowald, N. M., Conley, A. J., Collins, W. D., Fillmore, D. W., Zender, C. S., and Coleman, D. B.: Impact of desert dust radiative forcing on Sahel precipitation: Relative importance of dust compared to sea surface temperature variations, vegetation changes, and greenhouse gas warming, J. Climate, 20, 1445–1467, 2007.
Zhang, D., Du, L., Wang, W., Zhu, Q., Bi, J., Scovronick, N., Naidoo, M., Garland, R. M., and Liu, Y.: A machine learning model to estimate ambient PM2.5 concentrations in industrialized highveld region of South Africa. Remote Sens. Environ., 266, 112713, https://doi.org/10.1016/j.rse.2021.112713, 2021.
Ziervogel, G., New, M., Archer van Garderen, E., Midgley, G., Taylor, A., Hamann, R., Stuart-Hill, S., Myers, J., and Warburton, M.: Climate change impacts and adaptation in South Africa, WIRES Clim. Change, 5, 605–620, https://doi.org/10.1002/wcc.295, 2014.
- Abstract
- Introduction
- Model and data
- Model comparisons with satellite data and evaluation with in situ observations
- Model application: identifying key regions in Africa for future in situ observations and field campaign(s)
- Conclusions
- Code and data availability
- Author contributions
- Competing interests
- Disclaimer
- Acknowledgements
- Financial support
- Review statement
- References
- Supplement