the Creative Commons Attribution 4.0 License.
the Creative Commons Attribution 4.0 License.
 | 18 Oct 2023
Improving nitrogen cycling in a land surface model (CLM5) to quantify soil N2O, NO, and NH3 emissions from enhanced rock weathering with croplands
Maria Val Martin
Elena Blanc-Betes
Ka Ming Fung
Euripides P. Kantzas
Ilsa B. Kantola
Isabella Chiaravalloti
Lyla L. Taylor
Louisa K. Emmons
William R. Wieder
Noah J. Planavsky
Michael D. Masters
Evan H. DeLucia
Amos P. K. Tai
David J. Beerling
Surficial enhanced rock weathering (ERW) is a land-based carbon dioxide removal (CDR) strategy that involves applying crushed silicate rock (e.g., basalt) to agricultural soils. However, unintended biogeochemical interactions with the nitrogen cycle may arise through ERW increasing soil pH as basalt grains undergo dissolution that may reinforce, counteract, or even offset the climate benefits from carbon sequestration. Increases in soil pH could drive changes in the soil emissions of key non-CO2 greenhouse gases, e.g., nitrous oxide (N2O), and trace gases, e.g., nitric oxide (NO) and ammonia (NH3), that affect air quality and crop and human health. We present the development and implementation of a new improved nitrogen cycling scheme for the Community Land Model v5 (CLM5), the land component of the Community Earth System Model, allowing evaluation of ERW effects on soil gas emissions. We base the new parameterizations on datasets derived from soil pH responses of N2O, NO, and NH3 in ERW field trial and mesocosm experiments with crushed basalt. These new capabilities involve the direct implementation of routines within the CLM5 N cycle framework, along with asynchronous coupling of soil pH changes estimated through an ERW model. We successfully validated simulated “control” (i.e., no ERW) seasonal cycles of soil N2O, NO, and NH3 emissions against a wide range of global emission inventories. We benchmark simulated mitigation of soil N2O fluxes in response to ERW against a subset of data from ERW field trials in the US Corn Belt. Using the new scheme, we provide a specific example of the effect of large-scale ERW deployment with croplands on soil nitrogen fluxes across five key regions with high potential for CDR with ERW (North America, Brazil, Europe, India, and China). Across these regions, ERW implementation led to marked reductions in N2O and NO (both 18 %), with moderate increases in NH3 (2 %). While further developments are still required in our implementations when additional ERW data become available, our improved N cycle scheme within CLM5 has utility for investigating the potential of ERW point-source and regional effects of soil N2O, NO, and NH3 fluxes in response to current and future climates. This framework also provides the basis for assessing the implications of ERW for air quality given the role of NO in tropospheric ozone formation, as well as both NO and NH3 in inorganic aerosol formation.
- Article
(5042 KB) - Full-text XML
-
Supplement
(3545 KB) - BibTeX
- EndNote


Drastic and rapid emission reductions and the use of carbon dioxide (CO2) removal (CDR) technologies are essential for meeting the Paris Agreement on climate and net-zero commitments (IPCC, 2021). Modeled scenarios indicate that 7–15 gigatons (Gt) of CO2 must be removed and safely stored each year to limit warming to 2 ∘C (Riahi et al, 2021). A series of land-based CDR strategies involving the terrestrial biosphere have been proposed, which includes afforestation and reforestation, bioenergy crops, enhanced rock weathering (ERW), and peatland restoration, among others. These land-based CDR strategies and recommendations for their application have been summarized by independent international expert committees (e.g., National Research Council, 2015; Royal Society and Royal Academy of Engineering, 2018; Smith et al., 2023) as well as the IPCC Sixth Assessment Report (AR6) (Canadell et al., 2021). All these reports agree that there are unidentified environmental risks that must be assessed because they may reinforce, counteract, or even offset the climate benefits from carbon sequestration.
Land-based enhanced rock weathering is a CDR strategy, which involves applying crushed silicate rock (e.g., basalt) to soils to sequester carbon and is potentially feasible for large-scale deployment with managed croplands and grazing lands. Basalt is an ideal abundant silicate rock for ERW because of its potential co-benefits for crop yields and capacity to reverse soil acidification (Kantola et al., 2017; Beerling et al., 2018) and supply plant-essential nutrients like phosphorus (Goll et al., 2021). The estimated global net CDR potential for ERW deployed in main crop regions worldwide is 0.5–2 Gt CO2 yr−1 with extraction costs of USD 80–180 per tonne of CO2 and carbon storage timescales of ≥10 000 years (Beerling et al., 2020). However, interactions between ERW, nitrogen (N) cycling, and soil–plant processes lead to changes in the emissions of other greenhouse gases (GHGs), e.g., nitrous oxide (N2O), methane (CH4), and atmospheric pollutants, e.g., nitrogen oxides (NOx = NO + NO2) and ammonia (NH3) from soils.
N2O is an important greenhouse gas and a long-lived stratospheric ozone-depleting substance (Prather et al., 2015). The concentration of atmospheric N2O has increased by more than 20 % during the last centuries and is currently increasing at a rate of 2 % per decade (Tian et al., 2019). Agricultural ecosystems are the largest anthropogenic source of N2O, with about 50 % of the global emissions (Tian et al., 2020). Agricultural ecosystems are also significant sources of NH3 and NOx, comprising about 80 % of global NH3 emissions (Van Damme et al., 2021) and about 10 % of global NOx emissions (IPCC, 2021). Once emitted from soil, NH3 and NOx species can lead to air pollution by increasing N deposition as well as production of other air pollutants, such as ozone (O3) and particulate matter (PM, as PM2.5 with particles with an aerodynamic diameter <2.5 µm and PM10 with diameter <10 µm), which are harmful to human, ecosystem, and crop health. These nitrogen trace gases can also contribute to water eutrophication, soil acidification, and loss of plant species and habitat diversity (e.g., Sutton et al., 2009). In the coming decades, soil nitrogen emissions in croplands are expected to continue to increase because of fertilizer and manure application to meet the growing demand for food, forage, fiber, and energy (e.g., Reay et al., 2012; Davidson and Kanter, 2014; IPCC, 2021).
In agriculture ecosystems, soil N2O and NO fluxes are driven by two main biochemical processes (nitrification and denitrification), while soil NH3 is driven by volatilization. These three processes are controlled by many environmental factors such as temperature, soil pH, water and oxygen content, and N availability (via synthetic fertilizer and manure applications) (e.g., Reay et al., 2012; Tian et al., 2018). Analyses from enhanced weathering field experiments in the US Corn Belt have shown that the application of basalt consistently increases soil pH and reduces soil N2O fluxes with no effects on soil CO2 emissions (Blanc-Betes et al., 2020). It is expected that increases in soil pH will concurrently produce a decrease in soil NOx emissions, by decreasing rates of denitrification and nitrification (Parton et al., 2001), and an increase in NH3 volatilization (Mkhabela et al., 2006). Thus, widespread implementation of ERW holds consequences for air quality and human and crop health as well as for climate mitigation that have so far been overlooked. To date, there is no modeling framework that has the capability to fully quantify the changes in biogeochemical processes and atmospheric trace gas emissions from ERW applications.
In this study, we present the development and implementation of a new improved N cycling scheme for the Community Land Model v5 (CLM5), the land component of the Community Earth System Model, allowing evaluation of ERW effects on soil nitrogen gas emissions. We base the new parameterizations on datasets derived from soil pH responses of N2O, NO, and NH3 in ERW field trial and mesocosm experiments with crushed basalt. Finally, we present a case examining the impact of large-scale deployment of ERW on main croplands across the world on N2O, NO, and NH3 emissions.
2.1 The Community Land Model version 5 (CLM5)
We implemented new parameterizations into the Community Land Model version 5.0.25 (CLM5; Lawrence et al., 2019) to determine N2O and NO fluxes, as well as NH3 volatilized from soil due to basalt amendments in crops. CLM is the terrestrial component of the Community Earth System Model version 2 (CESM2; Danabasoglu et al., 2020). CLM5 represents terrestrial carbon and nitrogen cycling with prognostic vegetation and crop growth. The model uses a sub-grid hierarchy in which grid cells are composed of multiple land units, columns, and patches to represent the spatial land surface heterogeneity and the biogeophysical and biogeochemical differences between various land types within a model grid cell. The CLM5 land units are vegetated, lake, urban, glacier, and crop. Vegetation and crops are represented by plant and crop functional types (PFTs and CFTs), each with its own set of ecophysiological, morphological, phenological, and biogeochemical parameters (Levis et al., 2018). The default PFT distributions of natural vegetation and crops are derived from satellite observations (e.g., MODIS) and agricultural census data (Lawrence and Chase, 2007; Portmann et al., 2010). There are 16 types of natural vegetation (including bare ground) and eight active crops (temperate soybean, tropical soybean, temperate corn, tropical corn, spring wheat, cotton, rice, and sugarcane) (Lombardozzi et al., 2020). In CLM5, natural vegetation and croplands are treated on separate columns and isolate particular management practices; i.e., natural vegetation is handled in single unmanaged soil columns sharing a single pool of water and nutrients, whereas each crop has a dedicated column (Drewniak et al., 2013).
For crops, CLM5 provides nutrients from the mineral N pool in the soil, which is supplied through organic matter decomposition, N deposition, N fixation, and fertilization. The interactive N fertilization scheme in CLM5 simulates fertilization by adding N directly to the soil mineral NH pool to meet crop N demands using both synthetic fertilizer and manure application. Fertilizer is applied to each crop for 20 successive days uniformly as soon as the crops enter the leaf emergence phase and is added in each layer from the ground surface to 0.4 m depth according to the model-defined soil profile (Lawrence et al., 2019). CLM5 simulates the beginning of plant growth stages (seedling, leaf emerging, and grain filling) as well as crop sowing dates and planting durations based on the cumulative warm-enough hours at the beginning of spring. Crops are harvested once they reach maturity or a predefined maximum growing days (typically 150–165 d) (Lawrence et al., 2019; Lombardozzi et al., 2020).
2.2 Updates and implementations in the soil nitrogen scheme
Figure 1 summarizes the main processes of the terrestrial N cycle in CLM5, following the “holes-in-a-pipe” concept (e.g., Firestone and Davidson, 1989; Davidson and Verchot, 2000; Inatomi et al., 2019), highlighting the main implementations in this work. The model tracks N content in soil, plants, and organic matter as a series of distinct N pools, with biogeochemical processes acting as N exchange fluxes across them. Soil N transformations occur in vertically resolved soil profiles in each soil column following a CENTURY-like implementation of soil biogeochemistry (Koven et al., 2013; Lawrence et al., 2019). Plant uptake, microbial immobilization, N mineralization, nitrification, and denitrification compete for soil mineral nitrogen (NH and NO) based on the relative demand from each process. The release of N2O as a by-product of nitrification and denitrification and the leaching of soil nitrate (NO3) result in N losses from terrestrial ecosystems, which are replaced through fertilization, atmospheric N deposition, and biological N fixation (both symbiotic and asymbiotic). In this study, we modify CLM5 to better simulate the terrestrial nitrogen cycle by implementing soil NO fluxes and NH3 from volatilization, integrating regulating functions of soil pH that allow us to evaluate the potential impact of basalt amendments on soil nitrogen gas fluxes, with a weathering option to modify the soil pH.
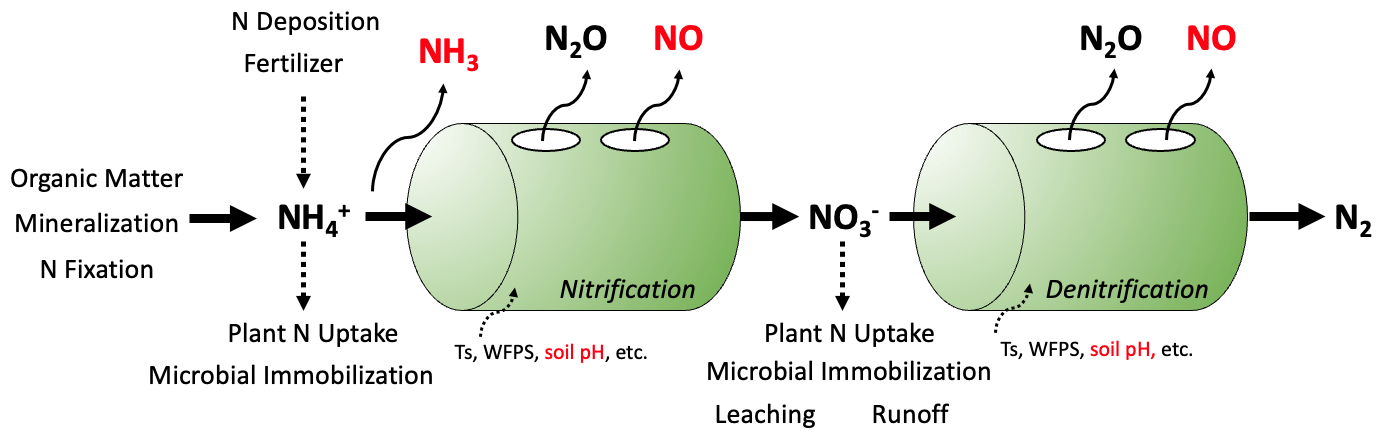
Figure 1Conceptual diagram of nitrogen cycle and the “holes-in-a-pipe” approach. Parameters in red are new additions in the default model. Ts is soil temperature, WFPS is water-filled pore space, and N is nitrogen.
2.2.1 Inorganic N transformations, soil N2O fluxes, and soil pH
Nitrification and denitrification processes in CLM5 are based on the process-based biogeochemical model DAYCENT (Parton et al., 1996; Del Grosso et al., 2000, 2006). For nitrification fluxes, we included the dependency of the N-mineralization-based term on potential nitrification rates that was implemented in Parton et al. (2001), which was missing from previous versions of CLM5 (Nevison et al., 2022a). Under this scheme, 20 % of mineralized nitrogen is nitrified.
CLM5 assumes a constant fraction to be N2O produced from nitrification (fN2Onit = 6 × 10⁻⁴; Li et al., 2000). However, this N2O production depends on environmental conditions like soil temperature, water content, and pH (Inatomi et al., 2019 and references therein). Considering an independent N2O emission fraction linked to environmental conditions provides better estimates of N2O emissions. To incorporate the effect of basalt addition on nitrification N2O fluxes via regulating soil pH, we adopted a modified pH-based function (fN2Onit) proposed by Inatomi et al. (2019) based on a meta-analysis:
The updated fN2Onit function made the nitrification rate in CLM5 go from the global constant average of 0.06 % to 0.3 % and increased the global N2O nitrification to denitrification ratio from 1 % to 14 %, which is more in accordance with previous estimates (Inatomi et al., 2019). It should be noted that fN2Onit values at typical soil pH levels in croplands (5.8 to 6.2) fall within a relatively narrow range of 3 to 7 × 10⁻⁴, which is not significantly different from the original 6 × 10⁻⁴ implemented in the model. Small variations in fN2Onit (e.g., ±20 %) have a negligible impact on the total soil N2O fluxes, with changes ranging from 0.04 % to 0.3 %. However, further work is needed to evaluate the sensitivity of the model to this specific parameterization under other soil conditions, as well as to incorporate the influence of other environmental factors, such as water content and temperature.
As CLM5 uses a fixed pH value of 6.5 across all soils (Lawrence et al., 2019), we implemented the global soil pH from the Harmonized World Soil Database (FAO, 2012; Wieder et al., 2014). This dataset provides the global spatial distribution of soil pH and other soil properties for the surface (0 to 30 cm) and deeper soils (30 to 100 cm) at 0.05∘ spatial resolution regridded to the CLM5 resolution (0.9∘ × 1.25∘) for the nominal year of 2000 (Fig. S1 in the Supplement). We further distributed the topsoil and subsoil soil pH values through the CLM5 soil layers accordingly.
Denitrification also produces N2O as a by-product (Fig. 1). To model the effect of basalt addition on N2O fluxes from denitrification, we included the updated denitrification scheme of Blanc-Betes et al. (2020). As in CLM5, the Blanc-Betes et al. (2020) scheme is a modified version of the DAYCENT denitrification subroutine (Parton et al., 1996; Del Grosso et al., 2000) with the difference that it incorporates the effects of soil pH on gross denitrification rates (N2+ N2O) and on the stoichiometry of denitrification end products ( ratio).
For the total N loss during denitrification, the pH effect function (fpH) was based on Liu et al. (2010) and Rochester (2003):
For the N2 to N2O ratio of the end products, we included the pH effect function (fpH) adapted from Wagena et al. (2017) with adjusted thresholds:
More information about the scheme, model calibration, and validation with basalt observations in crops is provided by Blanc-Betes et al. (2020).
2.2.2 Soil NO fluxes
In addition to the modifications in the N2O scheme, we implemented a new parameterization to calculate NO released as by-products of nitrification and denitrification. We used the ratio of NO to N2O to account for the emission of NO during nitrification and denitrification based on Parton et al. (2001) and Zhao et al. (2017):
where Dr is the soil relative gas diffusivity in soil with respect to air and is calculated as a function of air-filled pore space (AFPS) of soil (Davidson and Trumbore, 1995),
where AFPS is , and θV and θV,sat are instantaneous and saturated volumetric soil water content (in m3 m−3), respectively.
NO emitted from soils is quickly oxidized to NO2 by O3 near the canopy, and the formed NO2 may be deposited onto the plant canopy (Bakwin et al., 1990; Jacob and Wofsy, 1990). To account for the loss of NO to the plant canopy, we applied a canopy reduction scaling factor (CRF; Fig. S2 in SM) based on Yan et al. (2005):
where SAI and LAI are stomatal area index and leaf area index, respectively, and ks and kc have values of 11.6 and 0.32, respectively. The corresponding SAI was derived from the SAI:LAI ratio of Yienger and Levy (1995). NO captured from the atmosphere is taken up by the plant system either by direct incorporation into the leaf tissues or by the roots after absorption into the soil (Yoneyama et al., 1980). Since the precise mechanisms underlying these two routes is uncertain and fall outside the scope of this study, we assumed that all captured NO is returned to the soil directly as NH.
We also included a rain pulse factor to the base NO flux associated with nitrification to simulate the rapid increase in NO fluxes following rain onto a previous dry soil period (e.g., Parton et al., 2001; Yan et al., 2005; Hudman et al., 2012) as
where Ppeak represents the magnitude of the peak flux relative to the pre-wetting flux and the value of ldry is the antecedent dry period in hours. The c term is a rate constant representing the rise and fall time of the pulse (0.068 h−1) and t is time step in hours. Ppeak depends logarithmically on the length of the antecedent dry period and the condition for a pulse is a change in soil moisture. To test for pulsing potential, we employed the two-part condition as in Yan et al. (2005). Dry soil is defined as soils with a moisture content below 17.5 % (). To trigger a pulse, an increase of more than 0.5 % () in the moisture content of soil that experiences dry conditions for at least 3 d is required. This increase of 0.5 % () in 7 cm of surface soil is equivalent to about 3.5 mm of rainfall, which is the rainfall amount previously reported to cause a pulse (e.g., Johansson and Sanhueza, 1988; Martin et al., 1998).
Following Parton et al. (2001), total NO emissions from soils and released above canopy are thus calculated as a function of the simulated N2O fluxes, the function, the factor to account for rain pulses in NO emission initiated by precipitation events (P), and the CRF.
2.2.3 Soil NH3 volatilization
For NH3 volatilization, we used the scheme implemented by Fung et al. (2022) and embedded within the CLM5 N cycle. This scheme is derived from the DeNitrification–DeComposition (DNDC) biogeochemical model (Li et al., 2012) and includes a further parameterization to account for released NH3 that is captured in the plant canopy. As in the soil NO scheme, we assumed that all captured NH3 returns to the soil directly as NH. In this scheme, NH3 is very sensitive to soil pH, as it grows exponentially with pH, of the order of 10pH. As shown by Fung et al. (2022), the use of a spatially distributed soil pH database is not feasible as it overestimates NH3 fluxes in alkaline soils (pH >6.5). This is a well-known limitation in current NH3 schemes (e.g., Sutton et al., 2013; Vira et al., 2020), where functions are not parameterized for global applications, and further work is needed for global models to accurately describe soil pH effects on NH3 fluxes. In this work, we kept the soil pH constant at 6.5 to estimate a consistent NH3 flux baseline and added a unit factor (fpH) as a function of soil pH to model the effect of basalt addition on NH3 fluxes. The new regulating fpH function is based on previous observations of NH3 and soil pH from lime (Mkhabela et al., 2006), biochar (Kim et al., 2022), and basalt applications (Chiaravalloti, 2023) (Fig. S3 in the Supplement).
This function is a first approximation, which allows releasing some NH3 in very acidic crop soils (pH <5.5), whereas increasingly NH3 volatilization losses occur in higher soil pH with a saturation at relatively high soil pH levels (>8). Observations of the magnitude of soil pH in controlling NH3 volatilization fluxes from basalt applications are very scarce. However, our proposed changes in fpH are fairly consistent with soil pH effects in NH3 volatilization observed in field measurements in a marshland soil with lime application (Mkhabela et al., 2006), experimental measurements from basalt application (12.5 t rock ha−1) in a greenhouse setting (Chiaravalloti, 2023), and chamber experiments with 3 % biochar and liquid fertilizers (Kim et al., 2022). Further observations of NH3 volatilization rates from basalt application under wider range of soil pH conditions are urgently needed to verify the actual effect of soil pH.
2.2.4 Weathering
To simulate the impact of basalt addition on soil N2O, NO, and NH3 fluxes, we introduced a weathering option into CLM5. This approach involves incorporating annual or monthly changes in soil pH estimated by an ERW model (Beerling et al., 2020; Kantzas et al., 2022) into the CLM5 N cycle. The coupling of soil pH in CLM5 and the ERW model occurs asynchronously (Kantzas et al., 2022). In the first phase, the ERW model dynamically calculates soil pH using alkalinity mass and flux balances with an adaptive time step controlled by mineral dissolution rates. The alkalinity balance accounts for net acidity input during crop growth for removed biomass cations and secondary mineral precipitation of calcite. Additionally, the N cycle's influence on soil acidity is considered. For that, each nitrogen transformation (e.g., nitrification, denitrification, volatilization) is associated with hydrogen ion production or consumption, leading to stoichiometric acidity fluxes to each nitrogen flux within the ERW model. These calculations begin with initial soil pH values and nitrogen fluxes provided by CLM5 to the ERW model, run individually at each grid cell. Subsequently, in the second phase, spatially distributed changes in soil pH (i.e., delta pH) estimated by the ERW model are integrated into CLM5. This process enables CLM5 to adjust the initial soil pH values accordingly. Detailed descriptions of the soil pH calculations are provided in Beerling et al. (2020) and Kantzas et al. (2022).
2.3 CLM5 ERW simulations
We performed single-point simulations at the Energy Farm field site (University of Illinois, US) to examine the model sensitivity to basalt applications in maize and soybean crops as well as soil and climate conditions. We spun up the model for about 600 years so that all the state variables in the model, especially total ecosystem soil carbon and soil N2O, reached equilibrium. Then, the same initial condition was used for both the soybean and the corn single-point present-day spin-up simulations because a uniform soil condition was achieved for both crop systems. The present-day spin-up was based on a historical simulation for 1850–2014 using historical N and aerosol deposition as well as atmospheric CO2 forcing (Lawrence et al., 2019), with soil texture and soil pH values based on on-site measurements in control and ERW plots at the Energy Farm (Blanc-Betes et al., 2020). The meteorological forcings were from the Global Soil Wetness Project (GSWP3 version 1; http://hydro.iis.u-tokyo.ac.jp/GSWP3/, last access: 1 October 2023), with forcing data available from 1901 to 2014 and cycled from 1901 to 1920 for years prior to 1901.
Following the historical simulation, the Energy Farm simulations were run from 2015 to 2019 with meteorological forcing data retrieved from the North American Land Data Assimilation System (NLDAS) forcing dataset (Xia et al., 2012) and initial conditions starting in 2015 for the two single-point simulations, without basalt (control run) and with basalt (ERW run) application. The use of two different atmospheric forcings, GSWP3 (1901–2014) and NLDAS (1999–2020), was necessary in this study due to their distinct time coverage. Although this approach has the potential to introduce biases and changes in soil dynamics, we conducted a comparison for a coincidental period (2001–2014) and found no significant impacts on vegetation, soil nitrogen fluxes, or soil dynamics (Fig. S4 in the Supplement).
In addition to single-point simulations, we performed global simulations to validate the new implementation at a large scale and assess the regional effects of basalt treatments on soil direct agricultural N fluxes. We first spun up CLM5 with the new implementations to steady state in 1850 using an accelerated decomposition procedure and fixed pre-industrial CO2, land use, and atmospheric N deposition (Lawrence et al., 2019). The accelerated decomposition spin-up was for about 1200 years as the total soil organic matter carbon in the Arctic regions required a longer time frame to reach equilibrium; we considered the model fully spun up when the land surface had more than 97 % of the total ecosystem carbon in equilibrium. After the historical spin-up, we initialized CLM5 simulations for 2000 using fully spun-up conditions. As in the single-point simulations, the present-day spin-up was based on a historical simulation for 1850–2014 using historical N and aerosol deposition, atmospheric CO2 forcing, land use change, and meteorological forcings from GSWP3 (Lawrence et al., 2019).
To include the effect of ERW on the N2O, NO, and NH3 fluxes from soil, we considered the soil pH changes as well as application locations across five key regions with high potential for CDR with ERW (North America, Brazil, Europe, India, and China) required to remove 2 Gt CO2 yr−1 (Beerling et al., 2020). Thus, in the control run soil pH is kept constant at the nominal values provided by the Harmonized World Soil Database, whereas in the ERW run it is modified following the ERW model projection. To test the new scheme at a global scale, we used changes in annual soil pH (Figs. 2 and S5 in the Supplement); dynamic changes in soil pH in monthly time steps were tested in a regional study for the UK (Kantzas et al., 2022).
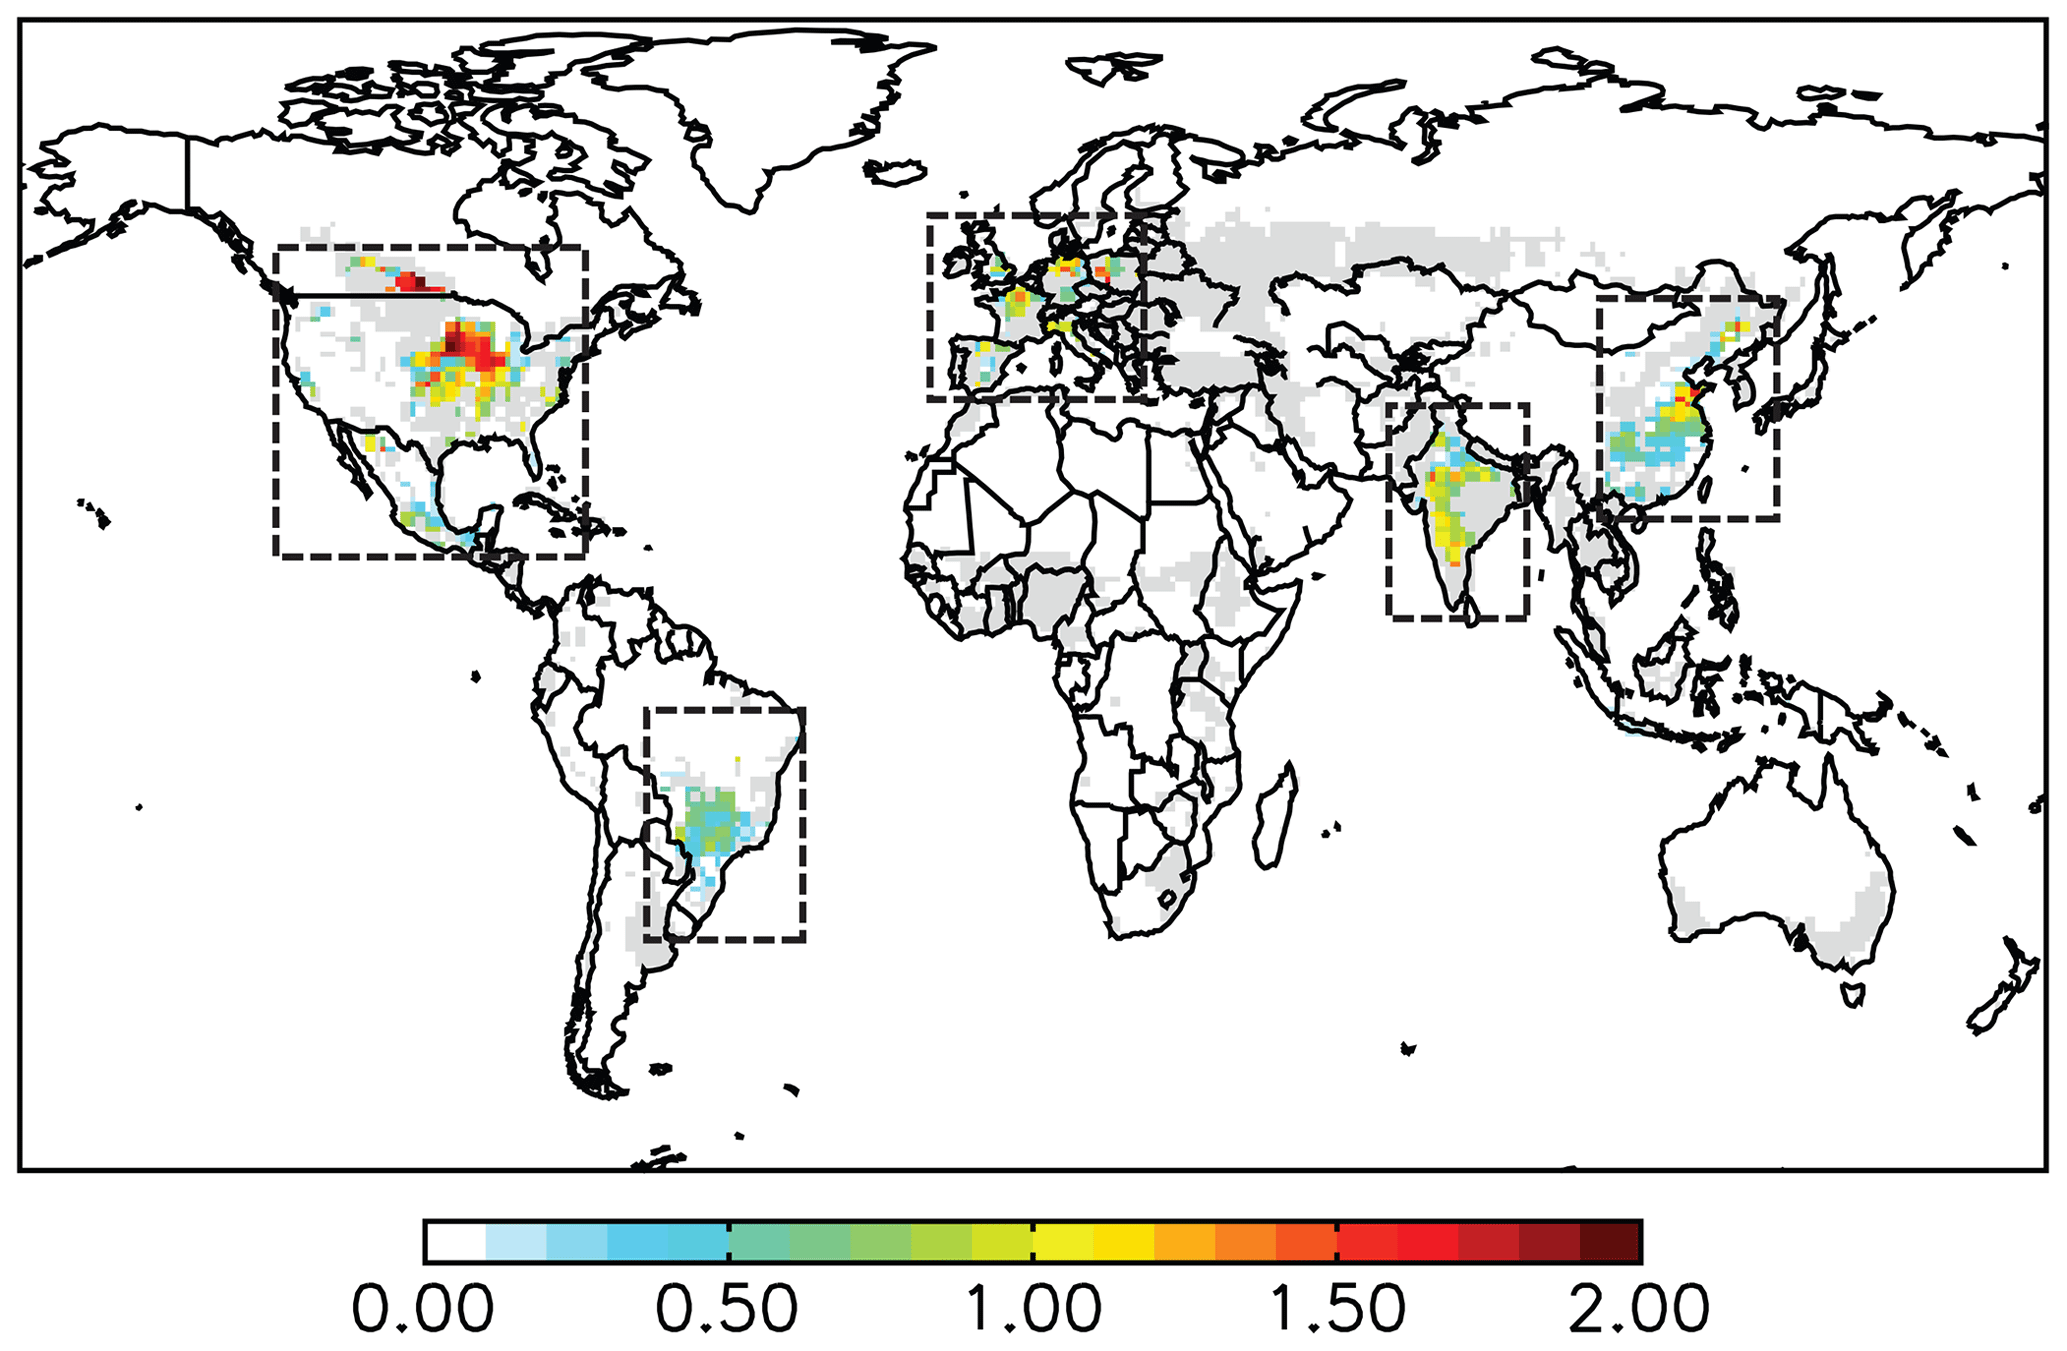
Figure 2Changes in soil pH after annual basalt applications in a 25-year time frame to remove 2 Gt CO2 (Beerling et al., 2020). The five agriculture regions considered in this study are delimited; grid cells with crops (>10 %) to which basalt was not applied are shaded in gray. A close-up view for each region is in Fig. S5 in the Supplement.
Simulations were completed at a resolution of 0.9∘ latitude by 1.25∘ longitude and with a 30 min time step. We used the mean and standard deviation of the last 5 years (2010–2014) of the historical simulations as an approximation of present-day conditions of the modeled N cycle for a control run (without basalt) and an ERW run (with basalt). In both simulations, synthetic fertilizer application was prescribed by crop type based on the Land Use Model Intercomparison Project (Hurtt et al., 2011), and manure fertilizer was applied at a fixed rate for all crops (20 kg N ha−1 yr−1; Lombardozzi et al., 2020).
2.4 Datasets for model validation
We used observational data collected at the University of Illinois Energy Farm in 2016–2019. The Energy Farm is in central Illinois (40.06∘ N, 88.19∘ W), and the historic land use is corn–soy agriculture (Cheng et al., 2020; Blanc-Betes et al., 2020). In the spring of 2016, a pilot ERW experimental study was conducted using 20 2 × 2 m plots in a field of maize; a field-scale experiment was initiated in 2017. This large-scale field experiment consists of several ERW experimental plots of 3.8 ha (200 × 200 m) each in size, with control and basalt-treated plots, each instrumented with an eddy covariance system at the center of the plot to measure surface energy, water, and carbon fluxes (Zeri et al., 2011). Soil pH is measured through surface soil samples (0–10 and 10–30 cm), and N2O fluxes were monitored through static chambers atop PVC collars during the planting season (Blanc-Betes et al., 2020).
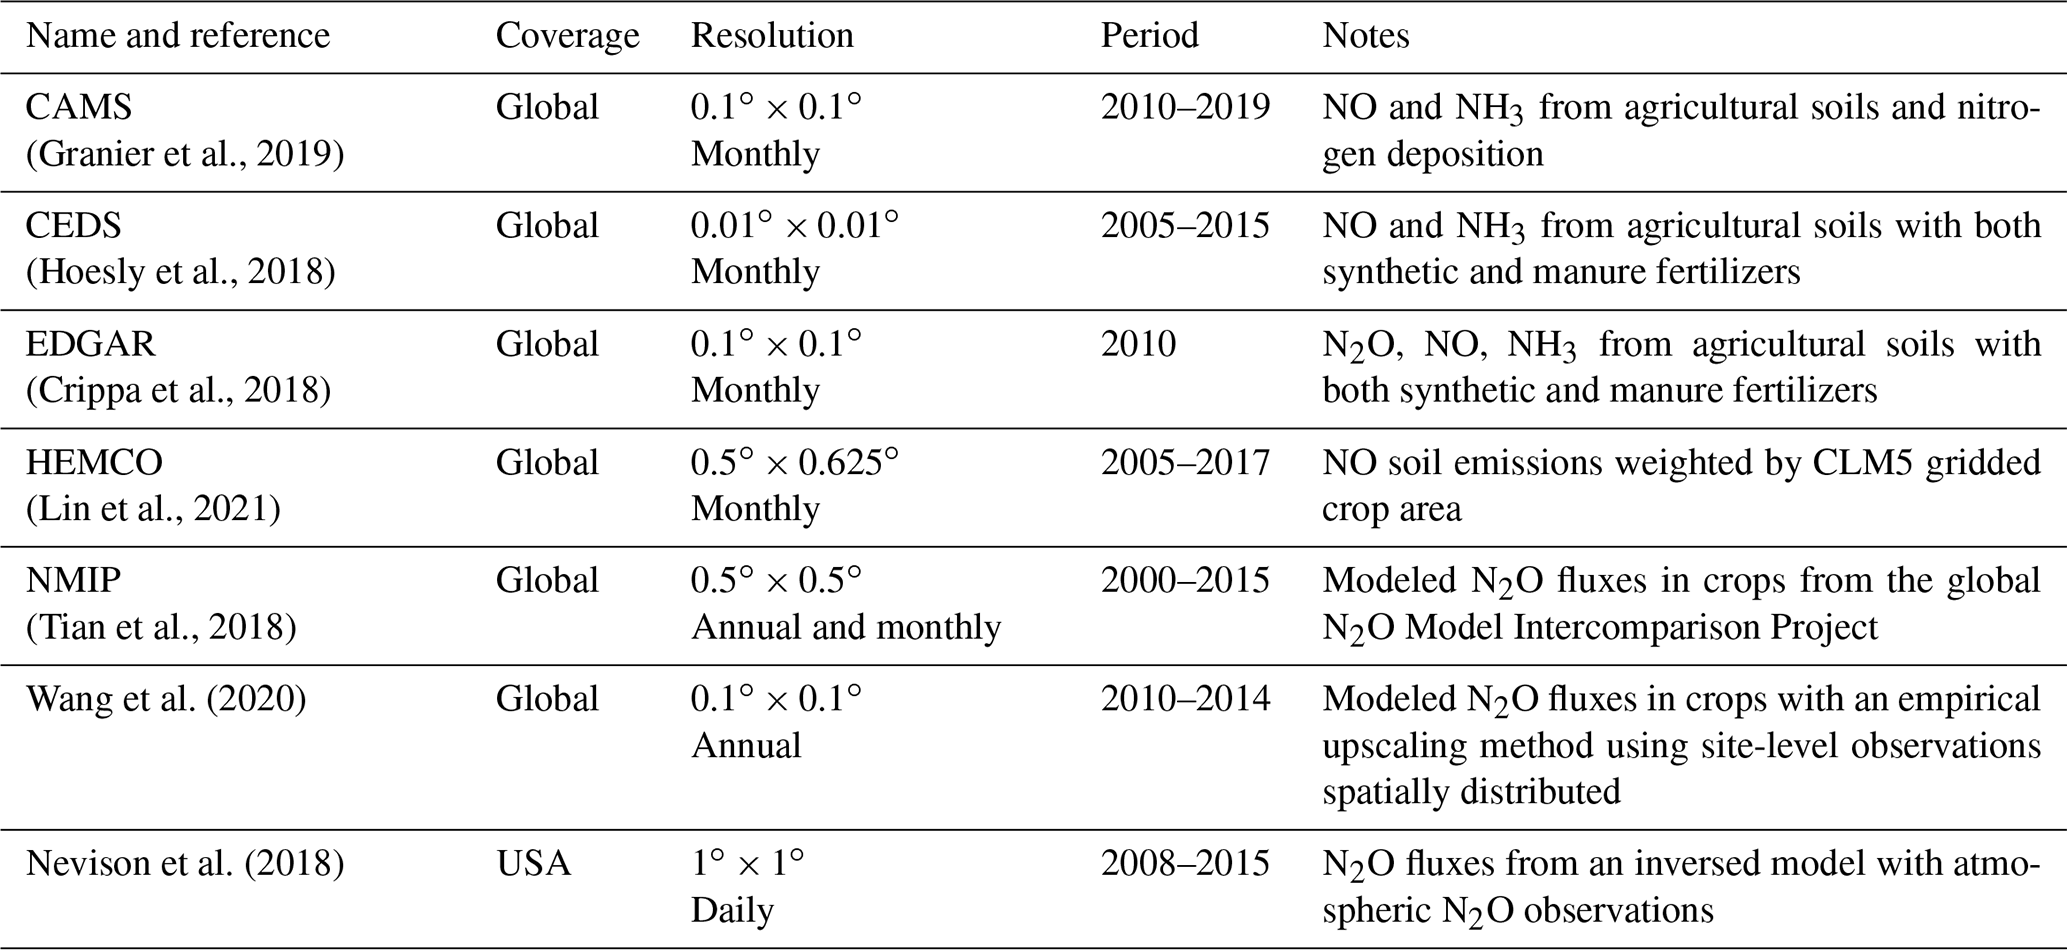
We also compared our global simulation results with available observations and emission inventories. Simulated CLM5 nitrogen emissions are compared with multiple emission inventories, including the Copernicus Atmosphere Monitoring Service (CAMS; Granier et al., 2019), Community Emissions Data System (CEDS; Hoesly et al., 2018), Emission Database for Global Atmospheric Research (EDGAR; Crippa et al., 2018), and Harmonized Emissions Component (HEMCO; Lin et al., 2021). For N2O, we also used results from the global N2O Model Intercomparison Project (NMIP; Tian et al., 2018) and estimates from Wang et al. (2020) and the CarbonTracker-Lagrange North American regional inversion framework (Nevison et al., 2018). Details of all these datasets are presented in Table 1. The datasets were regridded to match our model resolution of 0.9∘ by 1.25∘ using bilinear interpolation. It is important to note that our CLM5 model–inventory comparison should be considered an approximation because our simulations do not match the meteorological years of the inventories and because actual manure and synthetic fertilizer usage in CLM5 may differ from what was assumed in the inventories.
Table 1Summary of observations and emission inventories used in this study for model comparison and validation.
CLM5 simulations have been extensively evaluated by comparison with observations on a global scale (e.g., Lawrence et al., 2019; Lombardozzi et al., 2020; Nevison et al., 2022b) as well as at specific field sites (e.g., Cheng et al., 2020; Nevison et al., 2022a). We focus our evaluation on soil N2O fluxes from croplands at the Energy Farm in the continental US and agriculture N2O, NOx, and NH3 emissions at a global scale as well as the response of the simulated soil N2O to changes in soil pH from basalt applications.
3.1 Soil N2O at the Energy Farm and in the continental US
Figure 3 compares modeled soil N2O in our single-point simulations with available observations at the Energy Farm pre-trial (maize) in 2016 and trial rotation crops (maize, maize, and soybean) in 2017–2019 for control and basalt-treated plots. For daily soil N2O fluxes (Fig. 3a), we found that simulated daily N2O showed generally good agreement with the limited daily observations at the Energy Farm, simulating larger averaged soil N2O fluxes during the growing season in maize (37.2–51.7 g N ha−1 d−1) than soybean (5.4 g N ha−1 d−1), similar to what was observed in the field trials (18.8–62.3 g N ha−1 d−1 for maize and 6.2 g N ha−1 d−1 for soybean). As shown for DAYCENT by Blanc-Betes et al. (2020), CLM5 also simulates the increases in N2O fluxes well following fertilization and precipitation events at the Energy Farm, although with daily fluxes peaking slightly earlier in the growing season compared to observations due to yearly differences in planting schedules and fertilization. We note that in this project CLM5 has not been tuned specifically for the Energy Farm conditions or across the US but rather used as in the released version as the objective is to use the model at a global scale across many crops and regions as well as for future climate projections. As a result, the land management practices, such as planting and harvesting times, as well as fertilizer application frequency and rates employed in our simulations may not precisely match those implemented at the Energy Farm. To facilitate a more direct comparison for soybean, we made an exception and turned off synthetic and manure fertilizers in the soybean simulation because the Energy Farm does not apply nitrogen fertilizers to this crop.
To determine if CLM5 simulates soil N2O changes due to basalt amendments, we compared the relative changes in N2O in the basalt-treated plots with respect to the control plots for each year at the Energy Farm and those simulated by the model in Fig. 3b. The changes in N2O were obtained by comparing the cumulative N2O at the end of the growing season using the measured and simulated N2O flux at the time of the discrete measurements. For the basalt amendment run in CLM5, we considered the same increases in soil pH observed in the field experiments (Sect. 2.3; Blanc-Betes et al., 2020). We found that CLM5 effectively reproduces the decrease in soil N2O in the basalt-treated plots, with soil N2O fluxes 21 %–25 % (maize) and 44 % (soy) smaller than control plots, in line with the observed decreases of 12 %–32 % and 31 % at the Energy Farm.
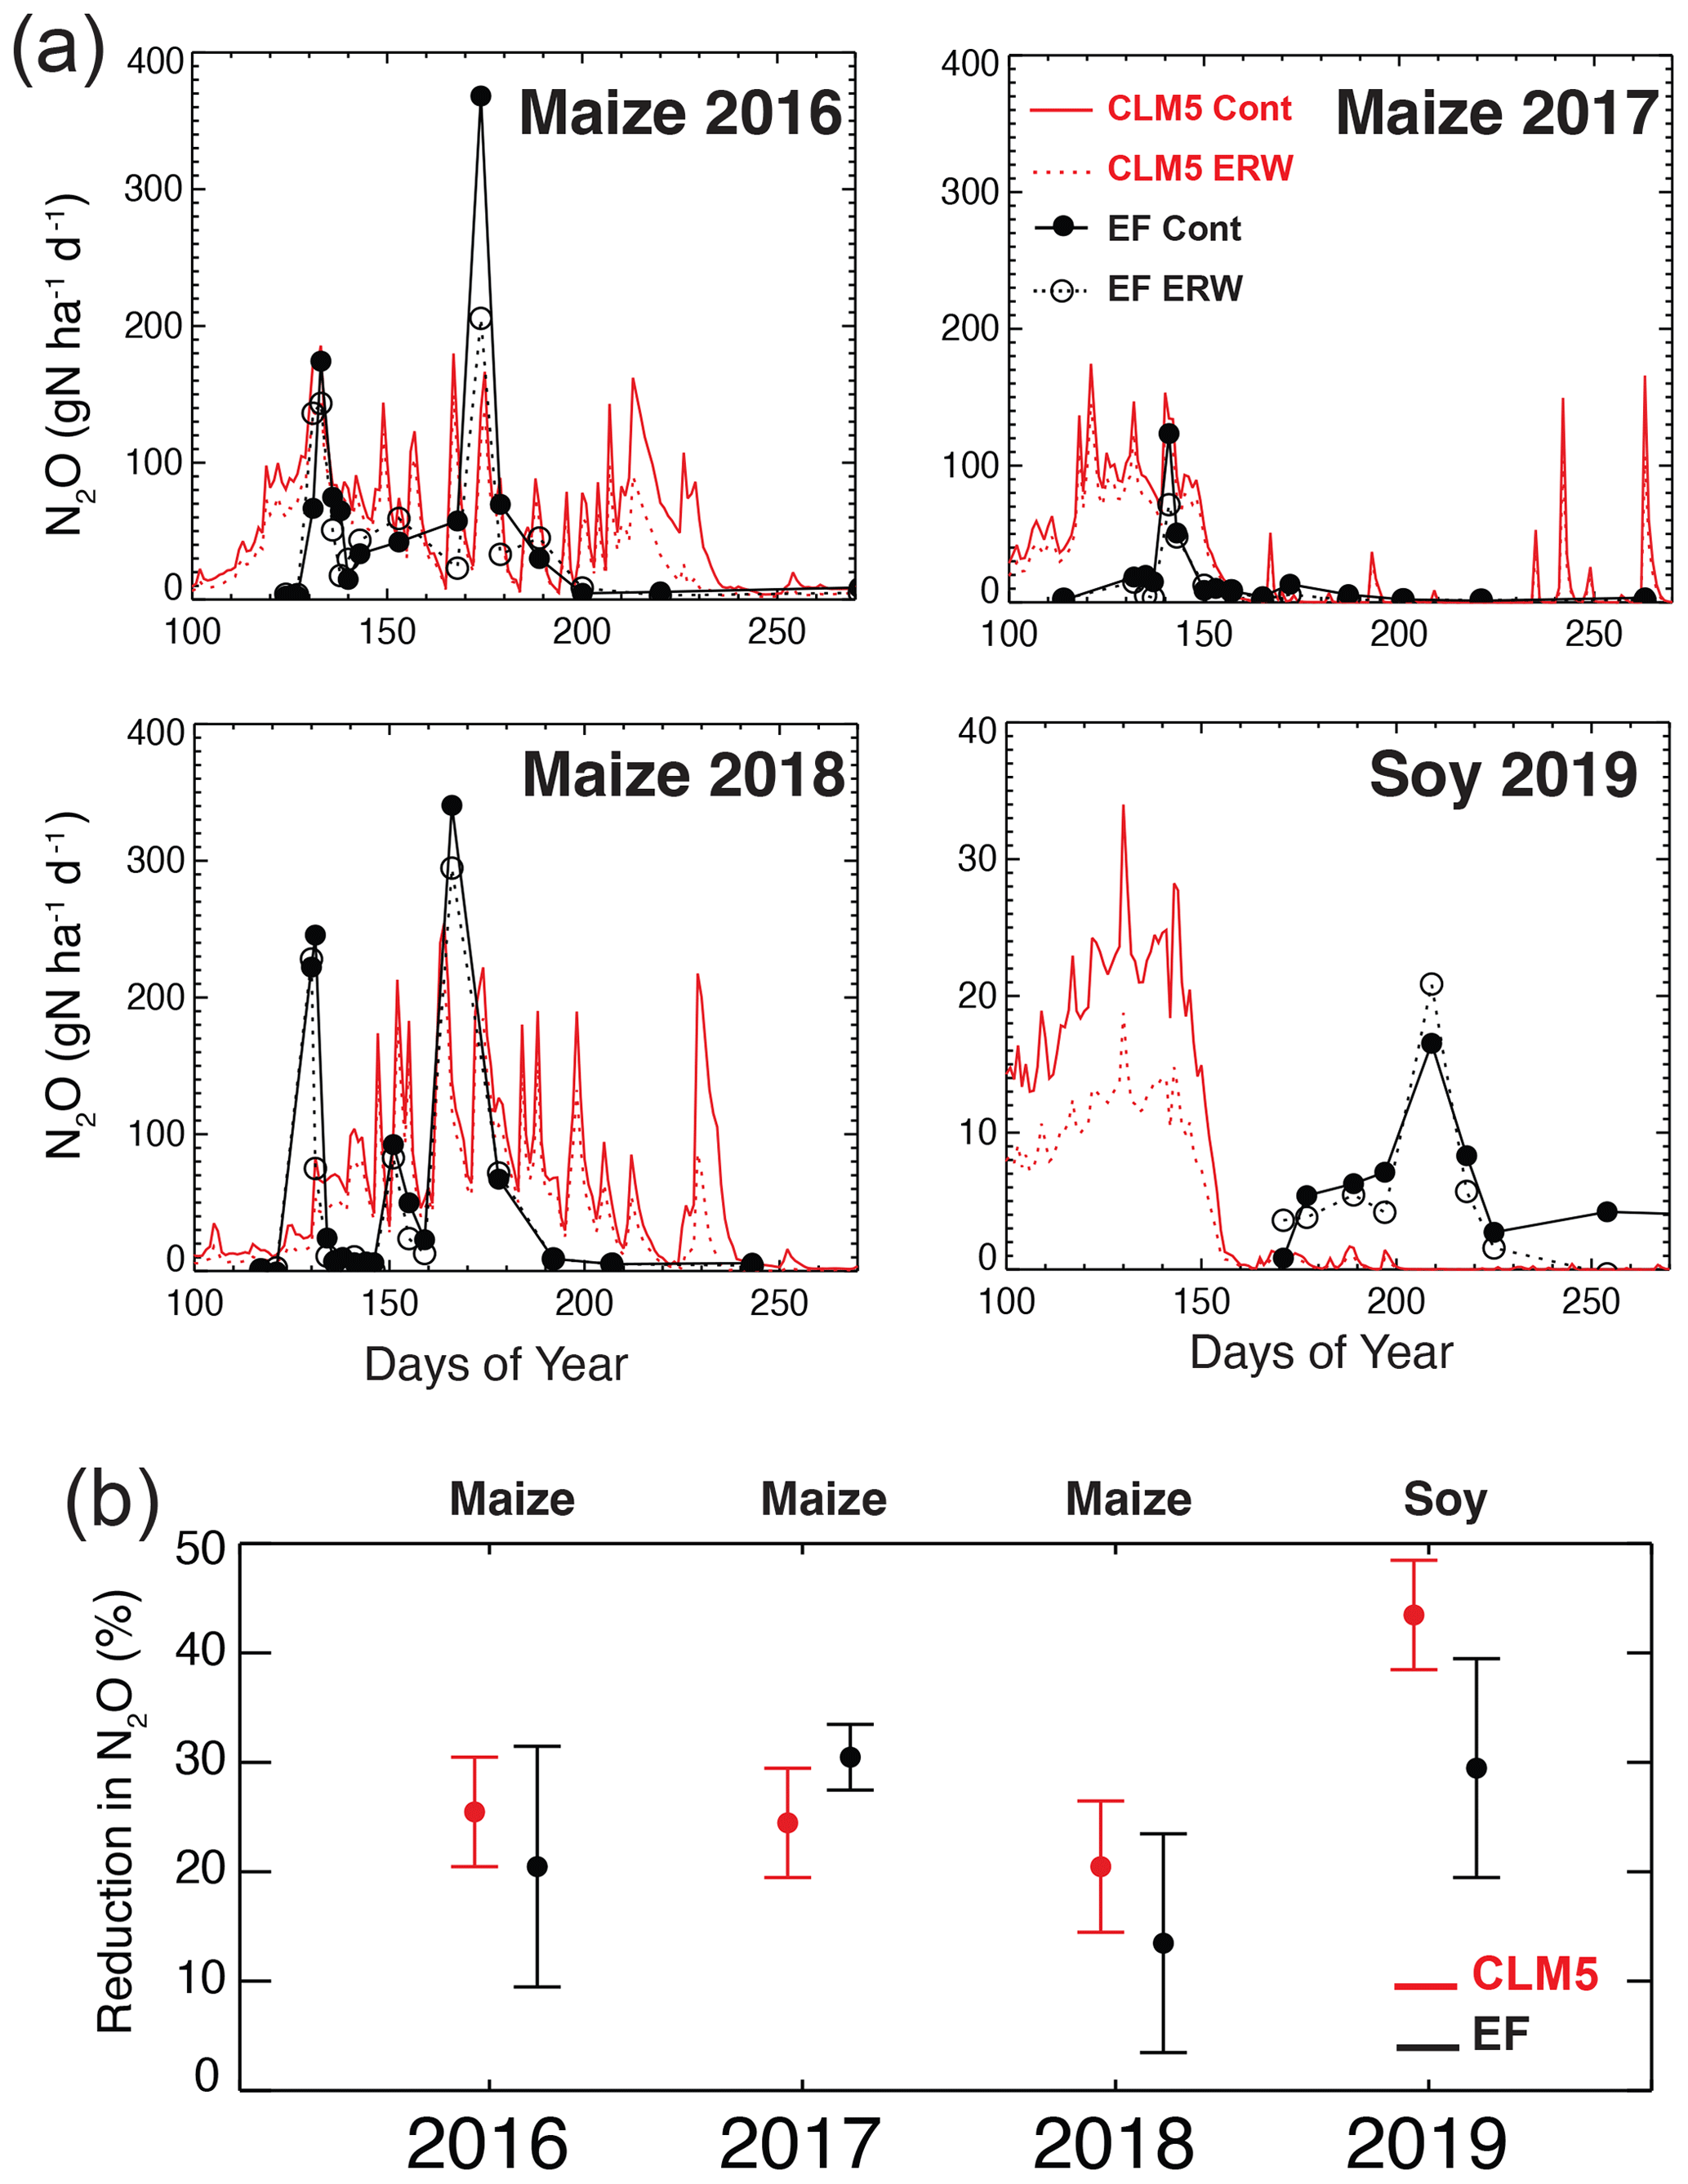
Figure 3Soil N2O fluxes at the Energy Farm for the pilot study (maize; 2016) and the large field trials (rotation crops as maize, maize and soybean; 2017–2019). Simulated (red) and observed (black) daily N2O fluxes (g N ha−1 d−1) are shown for the control (solid lines or solid circles) and basalt-treated plots (dotted lines or open circles) (a) as are reductions in N2O emissions (%) in the basalt-treated plots compared to the control plots as simulated by CLM5 (red) and measured in the field experiments (black) (b). Error bars represent variability in the reduction (%) estimated using propagation of errors.
We used observations of N2O from agricultural fields summarized in published studies (e.g., Stehfest and Bouwman, 2006; Shcherbak et al., 2014; Wang et al., 2018), including the Energy Farm, and N2O emissions estimated across North America using the CarbonTracker-Lagrange regional inversion framework (Nevison et al., 2018) to assess how well CLM5 captures agriculture N2O emissions in the US, an important agricultural region suitable for large-scale ERW deployment (Beerling et al., 2020) (Fig. 4).
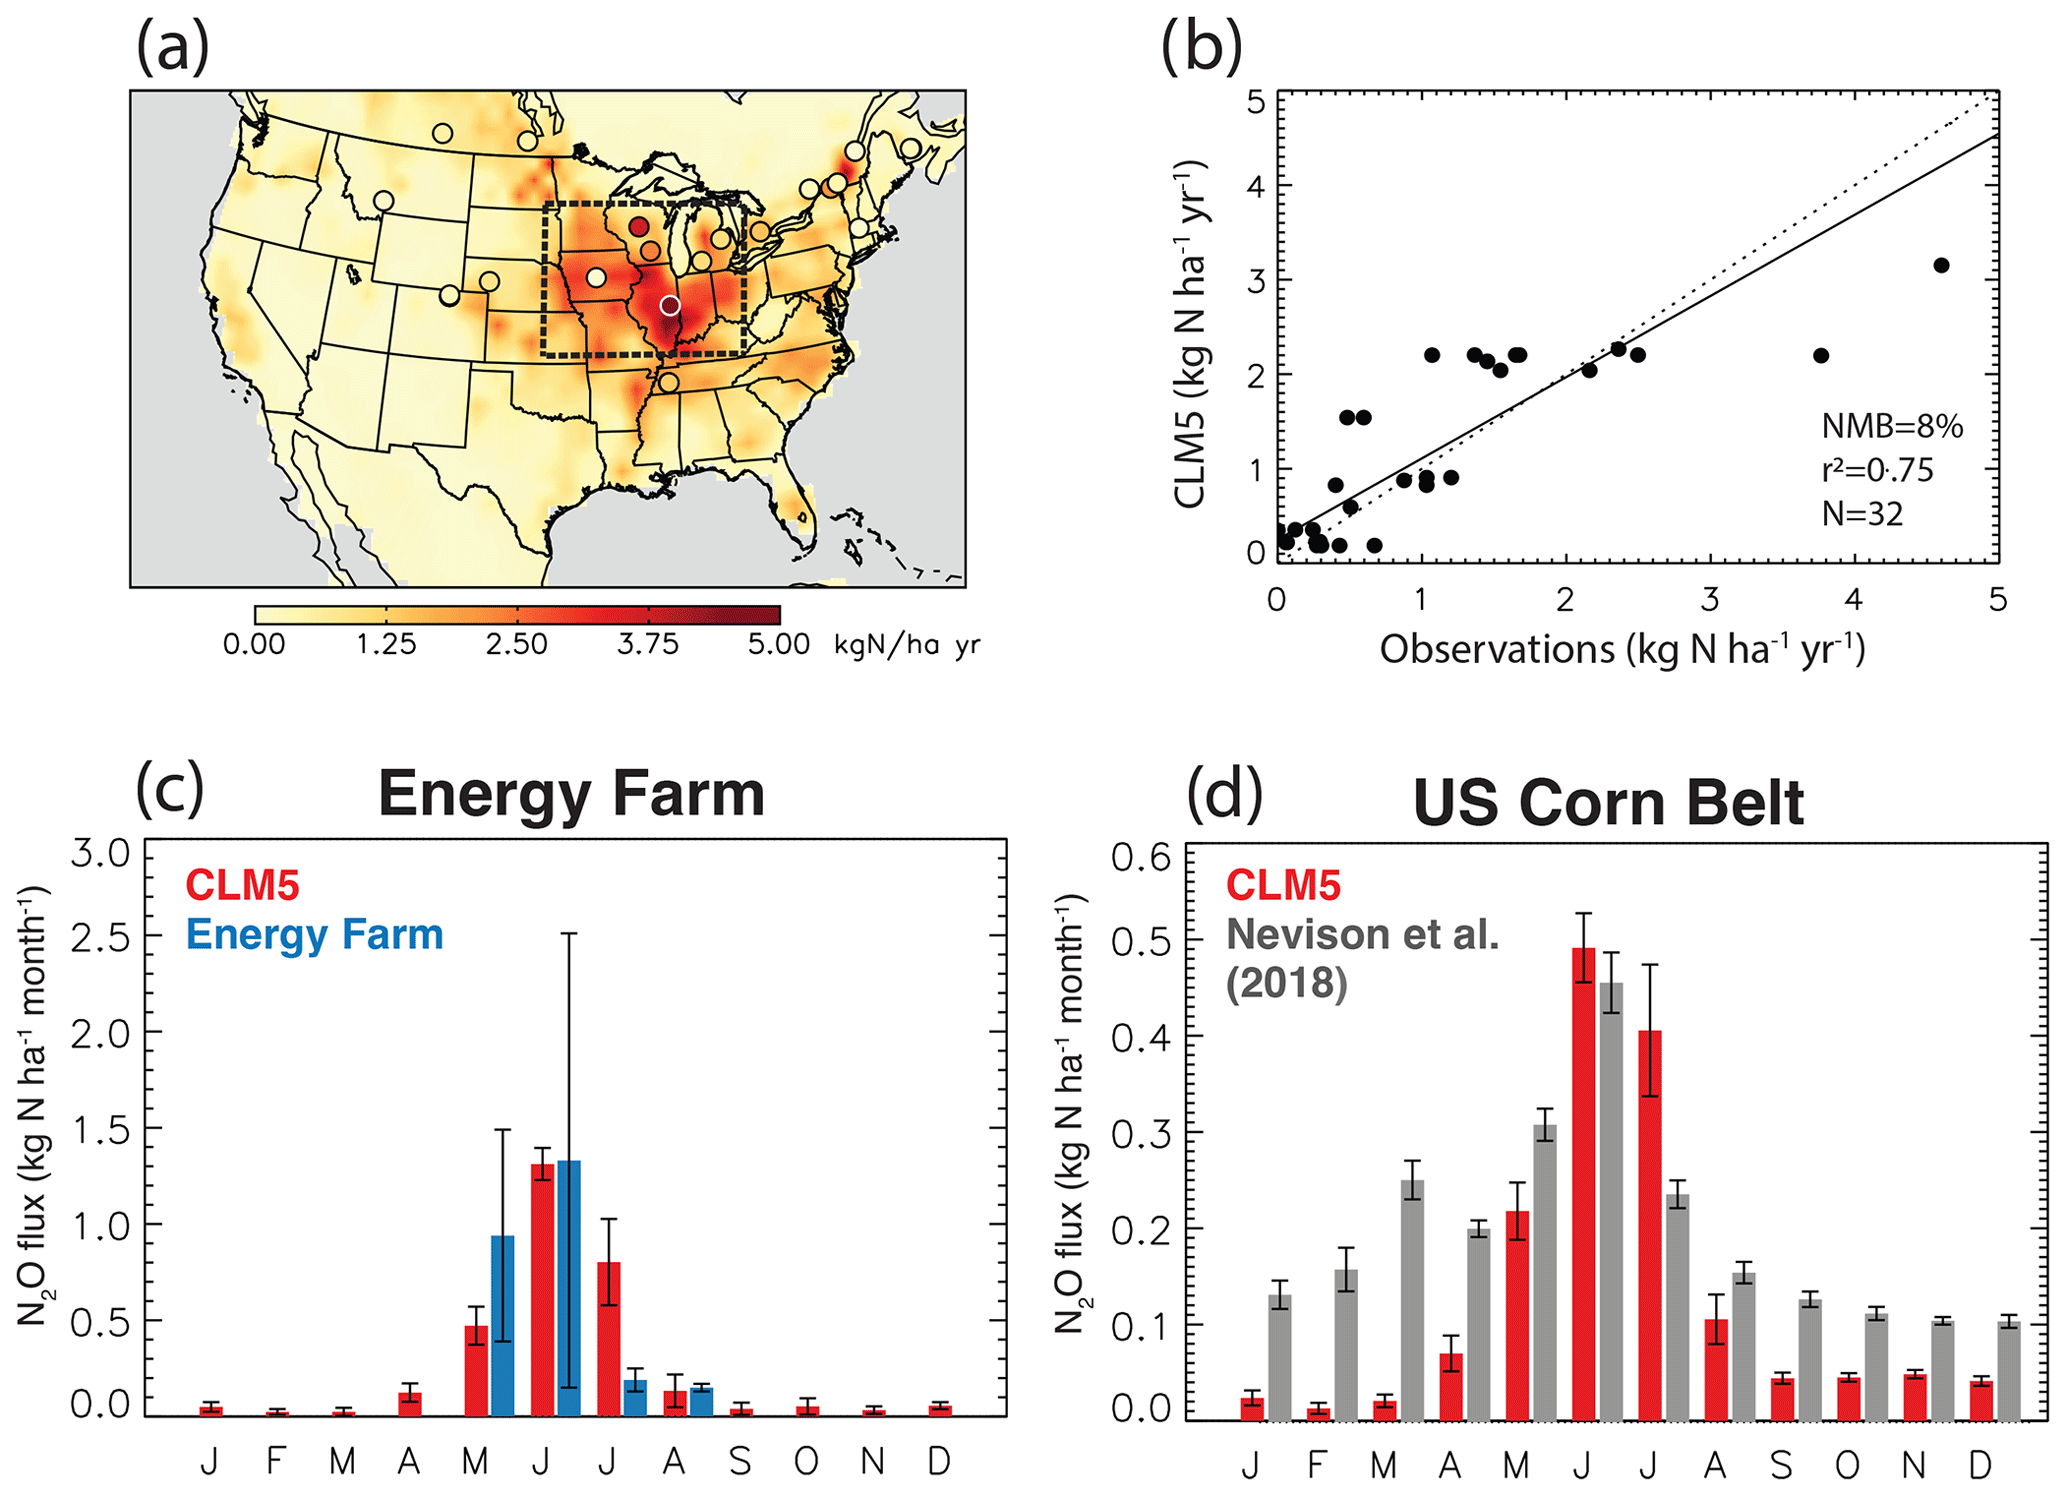
Figure 4Soil N2O fluxes in the US with modeled and observed values at individual measurement sites (a), the scatter plot with modeled and observed values at the individual sites (b), and seasonal variability of monthly soil N2O at the location of the Energy Farm (c) as well as across the US Corn Belt (d). Observations are means from published measurements, including the Energy Farm (2017–2019; Blanc-Betes et al., 2020), or averaged monthly fluxes from the CarbonTracker-Lagrange regional inversion model (2008–2014; Nevison et al., 2018). The squared correlation coefficient (r2), nominal mean bias (NMB, %), and number of observations (N) are shown in the inset. Reduced major axis-regression lines (solid) for croplands and the 1:1 line (dashed) are also shown. The US Corn Belt is represented with a dashed box and the location of the Energy Farm (40.07∘ N, 88.2∘ W) with a white circle in the CLM5 map. Error bars represent the standard deviation of the annual totals.
For our studied period, CLM5 estimates a total N2O emission across continental US croplands of 0.59 ± 0.06 Tg N2O-N yr−1, with more than 50 % emitted in the US Corn Belt. Our soil N2O emissions fall well within the range of previous estimates for direct agriculture emissions in the US (0.3–1.1 Tg N yr−1) reported by the US Environmental Protection Agency (EPA), bottom-up inventories, and other processed-based land models (e.g., Tian et al., 2019; Lu et al., 2022; U.S. EPA, 2022). Similar to other studies, our modeled estimates are lower than those reported from top-down N2O studies (1.6–2.6 Tg N yr−1; Miller et al., 2012; Nevison et al., 2018) as they consider more N2O source types than direct agriculture emissions, e.g., fossil fuel combustion, industry non-combustion processes, biomass burning, and solid waste and sewage water. For the US Corn Belt, dominated by agriculture sources, our annual flux (0.31 ± 0.04 Tg N2O-N yr−1) is comparable to that from top-down estimates (0.32–0.42 Tg N yr−1; Griffis et al., 2013; Chen et al., 2016; Nevison et al., 2018) as well as previous estimates with process-based models (0.26–0.60 Tg N yr1 (e.g., Li et al., 1996; Del Grosso et al., 2006; Lu et al., 2021).
We synthetized a consistent set of field observations representative of long-term means for different croplands across North America and identified a total of 32 observations gathered from 1998 to 2016 (Fig. 4a–b). We summarized the comparison between the model and observations using the normalized mean bias (, where Mi and Oi are modeled and observed) and the squared correlation coefficient (r2). We found that the model captures the spatial distribution of soil N2O well in croplands across the US. Simulated soil N2O fluxes show good agreement with the mean observations over croplands (r2=0.75), although they are slightly overestimated (NMB = 8 %).
We also evaluated the seasonal variability of our simulated soil agriculture N2O fluxes in the US (Fig. 4c–d) using averaged field observations at the Energy Farm (Blanc-Betes et al., 2020) and regionally averaged monthly fluxes in the Corn Belt from the CarbonTracker-Lagrange regional inversion framework (Nevison et al., 2018). Figure 4a shows the location of the Energy Farm and the approximate limits of the US Corn Belt. We found that the model represents the seasonal variability of soil N2O fluxes reasonably well across the Corn Belt as well as at the Energy Farm in Illinois, with direct agriculture N2O emissions peaking early in the growing season (April–May), which coincides with the addition of fertilization, as in the observations.
3.2 Global soil NO, N2O, and NH3
We also evaluated soil NO, N2O, and NH3 emissions simulated by CLM5 in the global control simulation. Figure 5 presents the total annual global N2O, NO, and NH3 agriculture emissions averaged over 5 years (2010–2014) in our simulations. Soil NO and NH3 emissions are above the canopy (Sect. 2.2.2 and 2.2.3). We also compared our soil gas nitrogen emissions with the available estimates reported in a wide range of global emission inventories (CAMS, CEDS, EDGAR, HEMCO) and previously modeled agriculture fluxes (NMIP; Tian et al., 2018, and Wang et al., 2020) (Table 1). NH3 emissions were extensively evaluated in Fung et al. (2022), and we included a follow-up and simpler validation here to assess our small updates in the parameterization (Sect. 2.3.3).
Emission inventories provide monthly estimates from several agriculture sources, such as synthetic and organic fertilizers, manure management, and indirect nitrogen losses, among others, as well as, in some cases, emissions from soils in natural ecosystems. To be able to compare the emissions directly with the CLM5 estimates, we extracted monthly emission estimates and selected the sources to represent as best as possible direct agriculture emissions from synthetic and manure fertilizers. In the case of HEMCO, which provides soil NO emissions from both natural and agricultural soils, we weighted the emissions by the fraction of cropland covering each grid cell in CLM5. For NH3, we considered that one-third of the total agricultural NH3 emission reported by CAMS, CEDS, and EDGAR is attributed to fertilizers, which aligns with the fraction reported in previous studies and environmental assessments (e.g., Paulot et al., 2014; European Environment Agency, 2013; Fung et al., 2022). We conducted a spatial comparison of the annual N2O, NO, and NH3 emissions from CLM5 and each inventory (grid cell by grid cell) by computing the normalized mean bias (NMB) and the Pearson's correlation coefficient (r). Table 2 shows the annual totals and a summary of these statistics. The spatial distributions of total annual N2O emissions estimated by the inventories and differences with CLM5 are shown in Figs. S6–S8 in the Supplement.
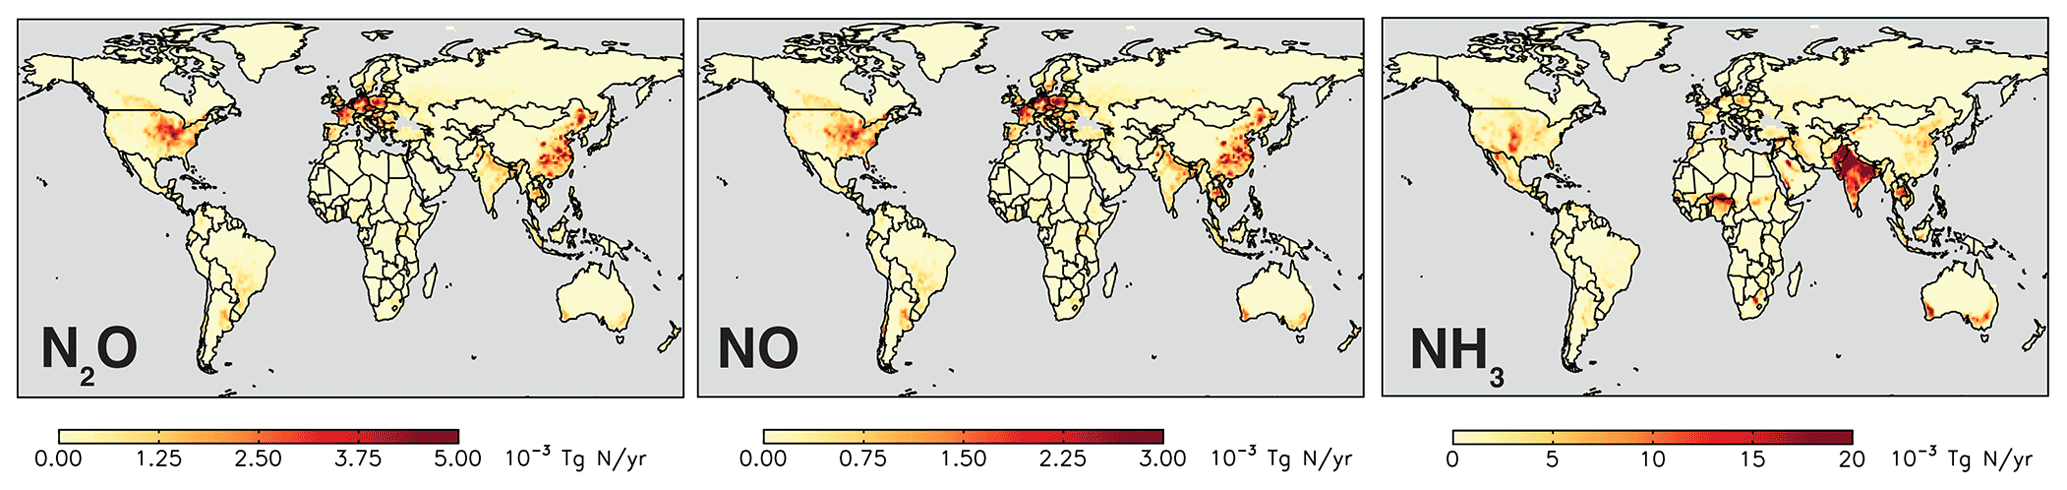
Figure 5Simulated global soil agriculture N2O, NO, and NH3 emissions in CLM5 without basalt (“control run”).
Table 2Summary of agriculture N2O, NO, and NH3 fluxes. The total global emission (average ± standard deviation of the annual totals), nominal mean bias (NMB), and Pearson's correlation coefficient (r) are reported.
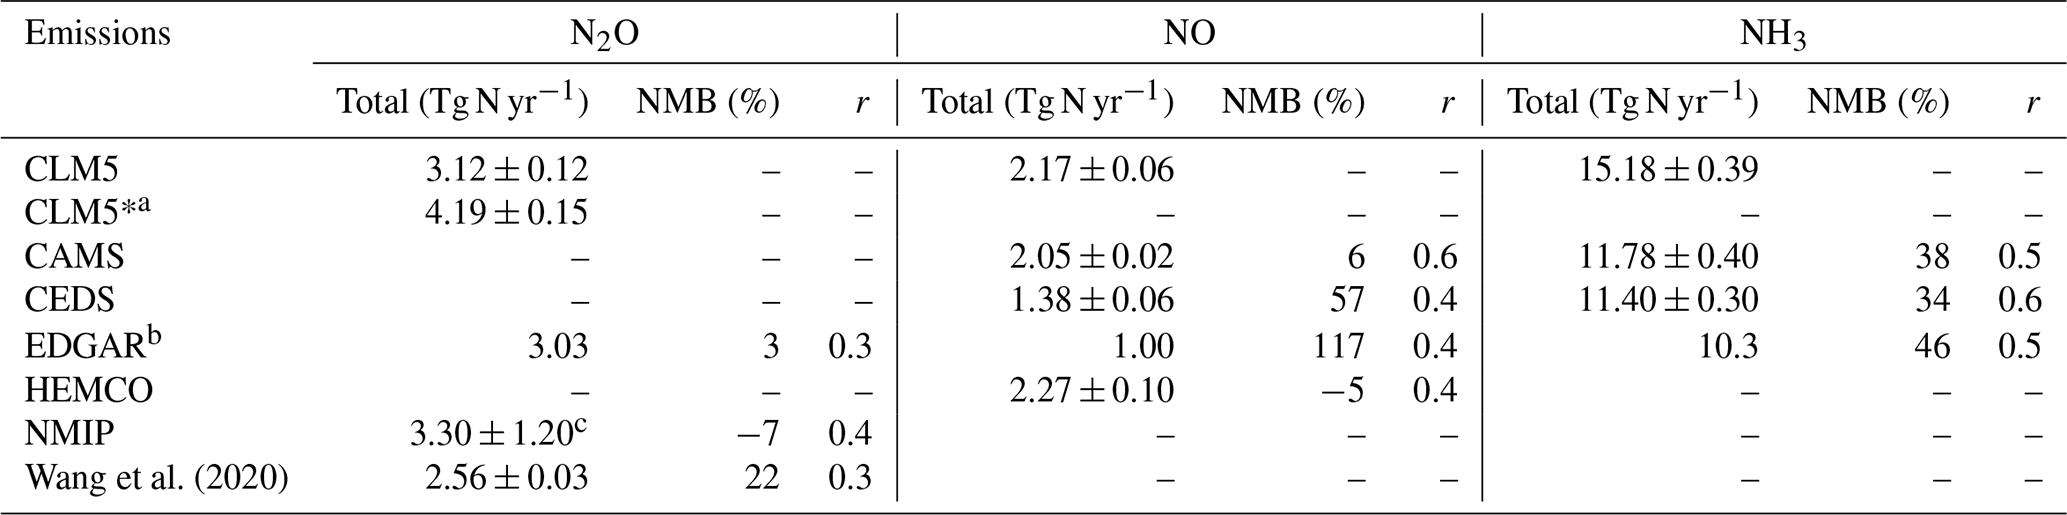
a CLM5* is the default version, without any implementation. b Only monthly data are available for 2010. The reported mean is for 2010. c Reported mean ± standard deviation of seven models.
For N2O, CLM5 estimates global direct agriculture emissions of 3.1 Tg N2O-N yr−1, which is in line with previous annual estimates for agriculture sources (1.7–5.8 Tg N yr−1; e.g., Del Grosso et al., 2006; Syakila and Kroeze, 2011; Saikawa et al., 2014) and the IPCC AR6 reported values for 2007–2016 (3.8 Tg N yr−1) (Canadell et al., 2021). Our updates in the CLM5 N cycle did not significantly alter the global soil N2O flux in agriculture systems compared to the default CLM5 version (4.2 Tg N2O-N yr−1). In addition, our estimate is similar to the widely used EDGAR emission inventory (3.03 Tg N yr−1) and falls within the range of modeled estimates (2.6–3.3 Tg N yr−1; Tian et al., 2018; Wang et al., 2020). The global r values range between 0.3 and 0.4 across the inventory and models, suggesting that CLM5 does not exactly replicate the spatial patterns reported in the emission inventories. The global NMB values are small and range between −7 % and 25 %, showing good agreement with the reported estimates overall.
For global agriculture NO emissions, CLM5 estimates 2.2 Tg NO-N yr−1, which is in line with previously reported fertilizer-induced soil NO emissions (0.4–3.5 Tg N yr−1; e.g., Stehfest and Bouwman, 2006; Crippa et al., 2018; Granier et al., 2019; Lin et al., 2021). Our global r values lie between 0.4 and 0.6 across all inventories, indicating a fair correlation. Our estimate is higher than two emission inventories (CEDS and EDGAR) with a global NMB value between 57 % and 117 % but close to the CAMS (NMB = 6 %) and the adjusted HEMCO (NMB = −5 %) estimates.
Global fertilizer-induced NH3 emissions in CLM5 are 15.2 Tg NH3-N yr−1. This estimate is close to estimates (from synthetic and manure fertilizers) reported by Fung et al. (2022) (14 Tg N yr−1) and Vira et al. (2020) (18 Tg N yr−1) for NH3 schemes also implemented in CLM5. It is important to note that despite using the Fung et al. (2022) NH3 parameterization in CLM5, our estimate is not exactly as it is in that work because we updated the nitrification and denitrification schemes and implemented a dependance on soil pH (Sect. 2.2.3). As indicated by Fung et al. (2022), the CLM5 estimates are slightly higher than three widely used global emissions inventories (10–12 Tg N yr−1; CAMS, CEDS, and EDGAR). The global r values are 0.5–0.6, indicating a fair correlation with CLM5 in all three emission inventories. The high bias in CLM5 is indicated by global NMB values of approximately 34 %–46 % between CLM5 and the emission inventories.
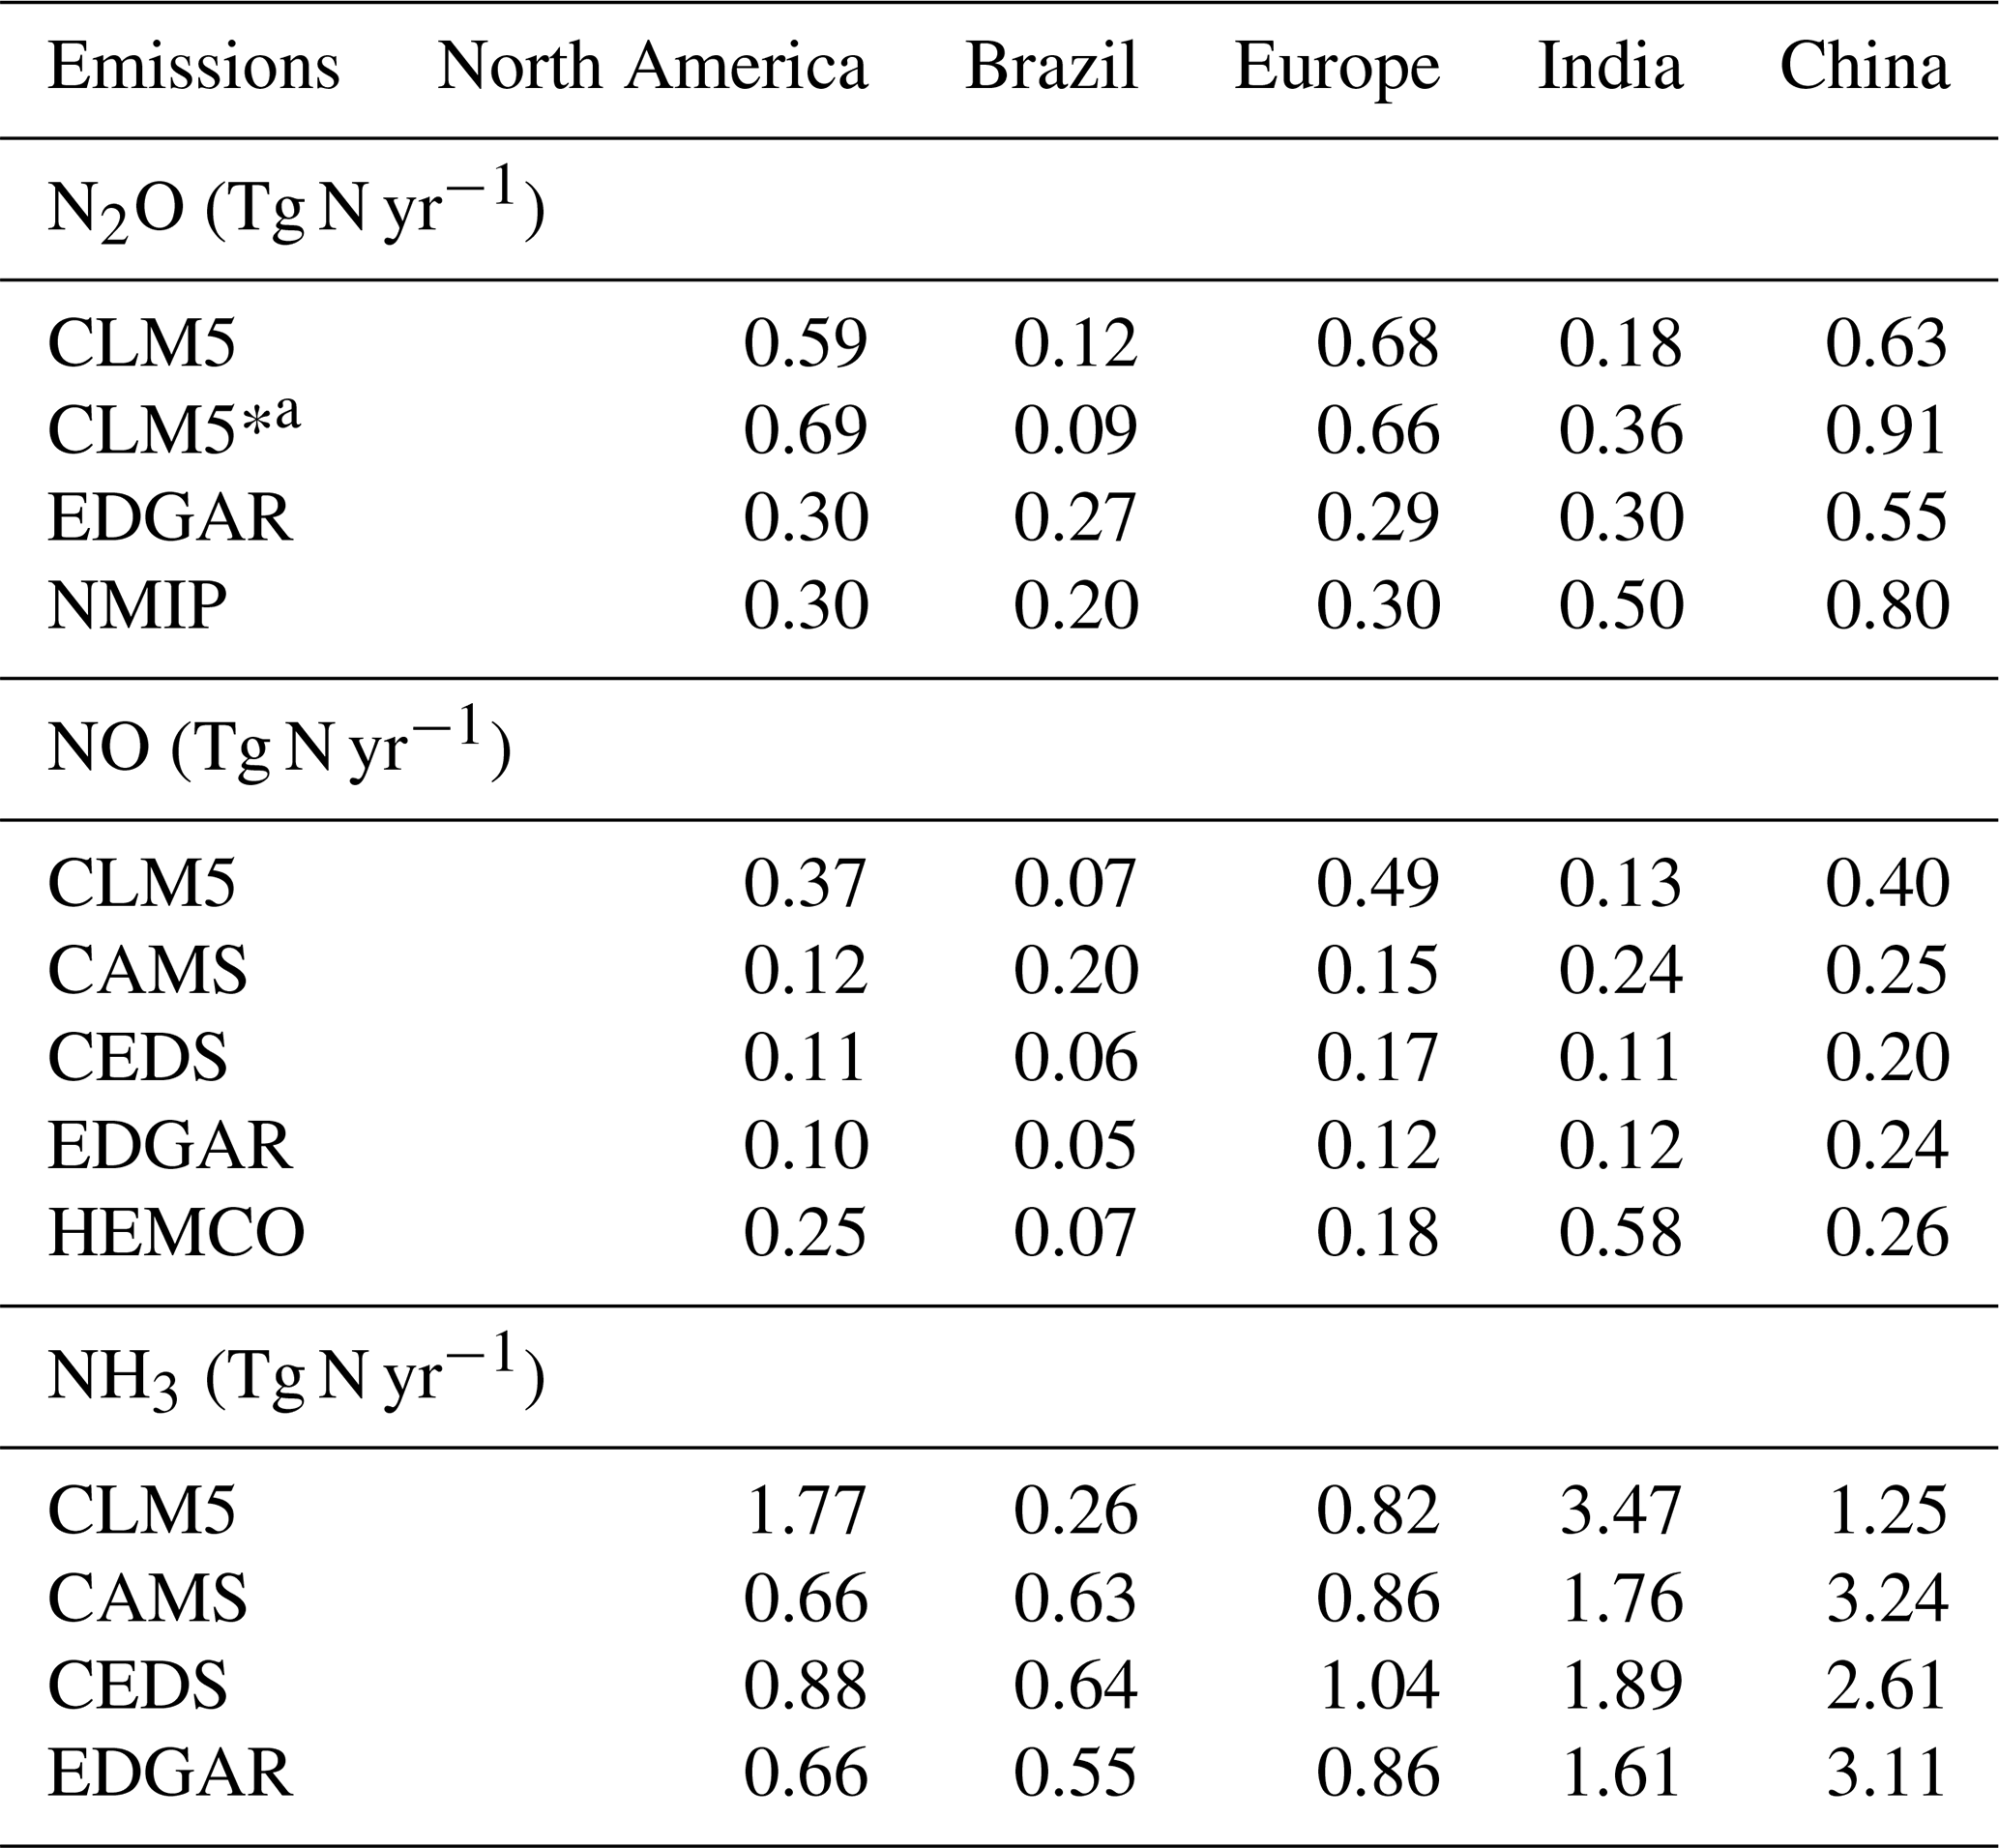
In CLM5 as well as other models and emission inventories, the largest agricultural emissions are found over major cropland regions (Figs. 5 and S6–S8). However, their spatial distribution differs mostly due to differences in fertilization rates, application patterns adopted by the models and emission inventories, and, in some cases, the spatial distribution of soil pH. Table 3 summarizes the regional emission totals in our five studied agricultural regions. These areas are major food-producing regions and are responsible for most of the agriculture N2O (75 %), NO (61 %), and NH3 (55 %) emissions with respect to the global total. In CLM5, major crop N2O emitters are Europe (0.68 Tg N yr−1), China (0.63 Tg N yr−1), and North America (0.59 Tg N yr−1), each with about 19 %–22 % of global emissions. Our modifications to the CLM5 N cycle did not result in significant regional-scale changes in agriculture soil N2O compared to the default version, although they led to lower N2O emissions over India (0.18 vs. 0.36 Tg N yr−1). Soil NO losses are similar, with Europe (0.49 Tg N yr−1; 23 %), North America (0.37 Tg N yr−1; 17 %), and China (0.40 Tg N yr−1; 18 %) as the largest agriculture sources. As reported by Fung et al. (2022), major fertilizer-induced NH3 emissions in CLM5 are from India (3.47 Tg N yr−1; 23 %), followed by North America (1.77 Tg N yr−1; 12 %) and China (1.25 Tg N yr−1; 8 %). Emission inventories show a similar regional distribution of emissions, with a higher proportion of agriculture emissions in China and India. For example, for NH3 emissions, CAMS, CEDS, and EDGAR indicate that India is the largest emitter, accounting for 23 %–30 % of global emissions, followed by China with 16 %–17 %.
Figure 6 shows the seasonality of N2O, NO, and NH3 emissions in these five main crop regions for CLM5, global inventories, and NMIP. In this analysis, for NMIP N2O fluxes we considered the average of only two models as not all seven provided monthly outputs (Hanqin Tian, Auburn University, personal communication, 2019). In CLM5, each crop has fertilizer applied (as NH) evenly over the course of 20 d beginning with leaf emergence (Sect. 2.1). The addition of NH in the soil accelerates plant uptake, microbial immobilization, denitrification, nitrification, and NH3 volatilization, which explains why N2O, NO, and NH3 emissions peak mostly in spring (March–May) in North America, Europe, China, and India and in the fall (October–November) in Brazil. Soil N2O and NO fluxes are also strongly dependent on environmental conditions (e.g., precipitation), which mainly drive the smaller secondary peaks later in the season in North America, Europe, and China. All global emission inventories and NMIP estimates show similar emission variability, with springtime peaks in the Northern Hemisphere (North America, Europe, China, and India) and fall peaks in the Southern Hemisphere (Brazil). For soil N2O, the seasonality in CLM5 is consistent with that given by the NMIP models, although it is significantly lower in magnitude for Brazil and China. However, annual estimates in CLM5 for Brazil (0.12 Tg N yr−1) and China (0.63 Tg N yr−1) are in line with the average from the seven-model ensemble (0.20 and 0.80 Tg N yr−1, respectively) (Table 3).
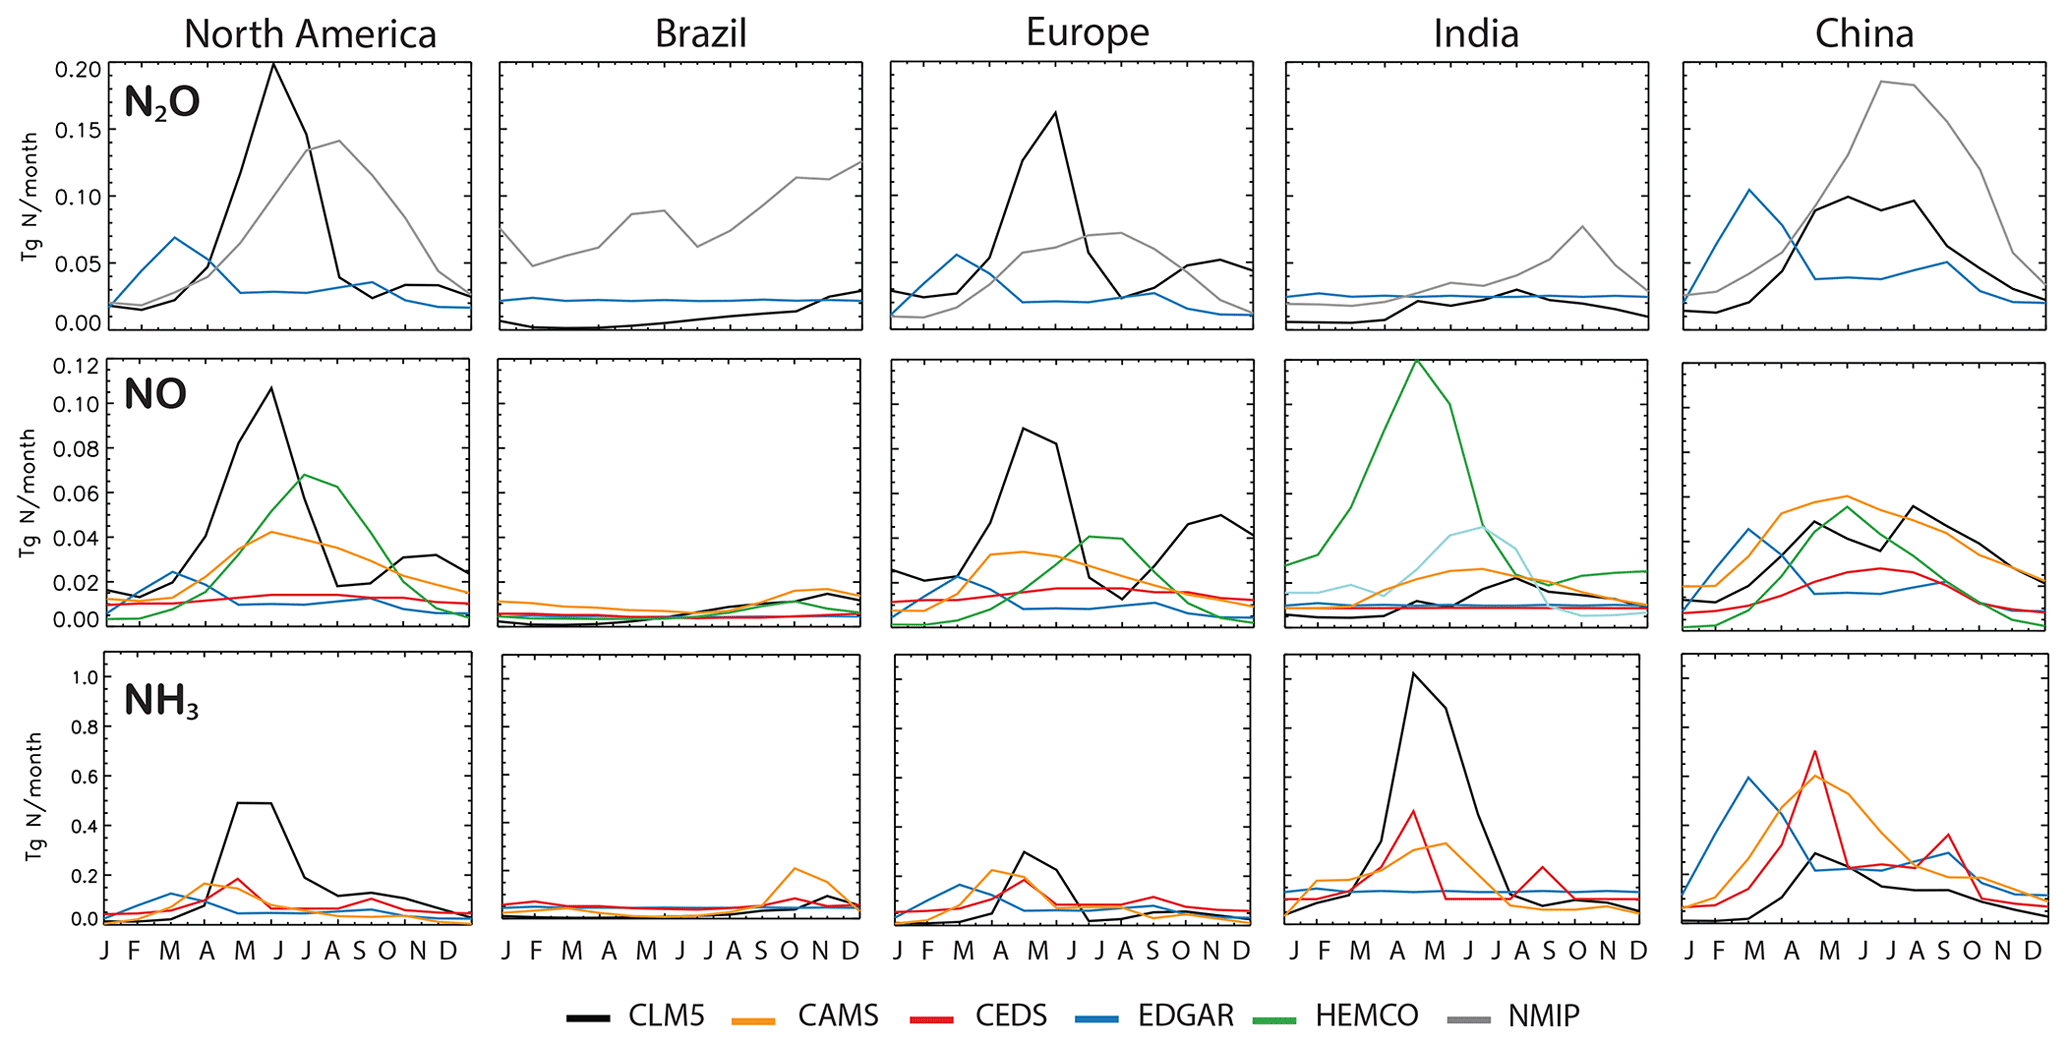
Figure 6Monthly agriculture N2O, NO, and NH3 emissions in the main crop regions considered in the study (North America, Brazil, Europe, India, and China) estimated by CLM5, CAMS, CEDS, EDGAR, HEMCO, and NMIP (Table 1). Soil NO emissions in HEMCO were weighted by cropland fraction; soil N2O in NMIP is the average of only two models that provided monthly output.
Table 3Summary of regional agriculture N2O, NO, and NH3 fluxes in CLM5 and emission inventories.
a CLM5* is the default version without any implementation.
It is important to acknowledge that substantial differences among emission inventories also exist in terms of their magnitude, spatial distribution, and seasonality. For example, soil N2O, NO, and NH3 emissions in EDGAR always peak about 1 month earlier in the season than the other emission inventories and CLM5; soil NH3 emissions in CEDS have two seasonal peaks compared to CAMS, CLM5, and EDGAR. As discussed by Fung et al. (2022), these disparities are primarily caused by differences in the planting season and length of fertilization considered within the inventories as well as the agriculture sources included (e.g., synthetic and/or manure application, manure management). In addition, there are systematic uncertainties in the global inventories (e.g., emission factors, environmental conditions, fertilizer types and rates) (Hoesly et al., 2018; Fung et al., 2022). Here we did not intend to understand these differences and rather use the model–inventory comparison to assess the CLM5 performance. We concluded that CLM5 provides a reasonable representation of the magnitude and seasonality of direct agriculture nitrogen emissions across the major hotspot regions (North America, Brazil, Europe, India, and China), which are relevant for our study. We note that there may be some limitations and uncertainties associated with the model's performance as well as current emission inventories in capturing the full complexity of these emissions. Further investigations and validation efforts are warranted to enhance our understanding of regional variations in agricultural nitrogen emissions.
We assessed the regional impact of amending cropland soils with basalt by estimating changes in the nitrogen cycling. We performed this case study by using the soil pH increases after 25 years of repeated annual basalt application as well as optimized deployment locations required to remove 2 Gt CO2 yr−1 projected by the ERW model in Beerling et al. (2020) (Figs. 2 and S5). Figure 7 shows the changes in soil N2O, NO, and NH3 emissions due to large-scale deployment of ERW on croplands and summarizes the regional changes across the five agricultural regions (North America, Brazil, Europe, India, and China). A close-up view of changes in these five regions is included in Fig. S9 in the Supplement; regional emissions in the control and ERW runs are summarized in Table 4.
Table 4Soil N2O, NO, and NH3 fluxes in the control and basalt treatment CLM5 runs for main cropland regions. The total emission as average ± standard deviation of the annual totals is reported.
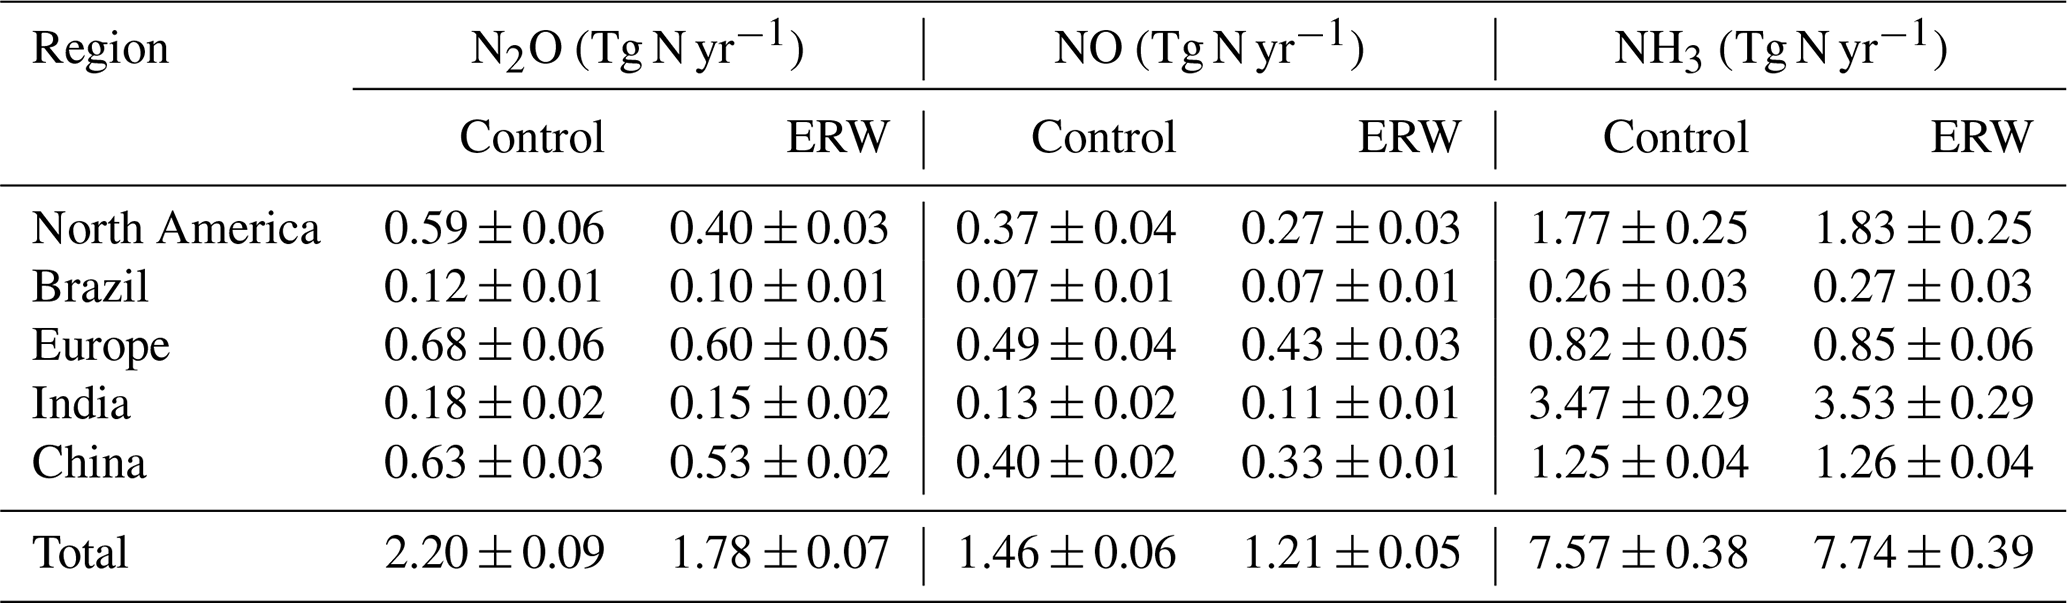
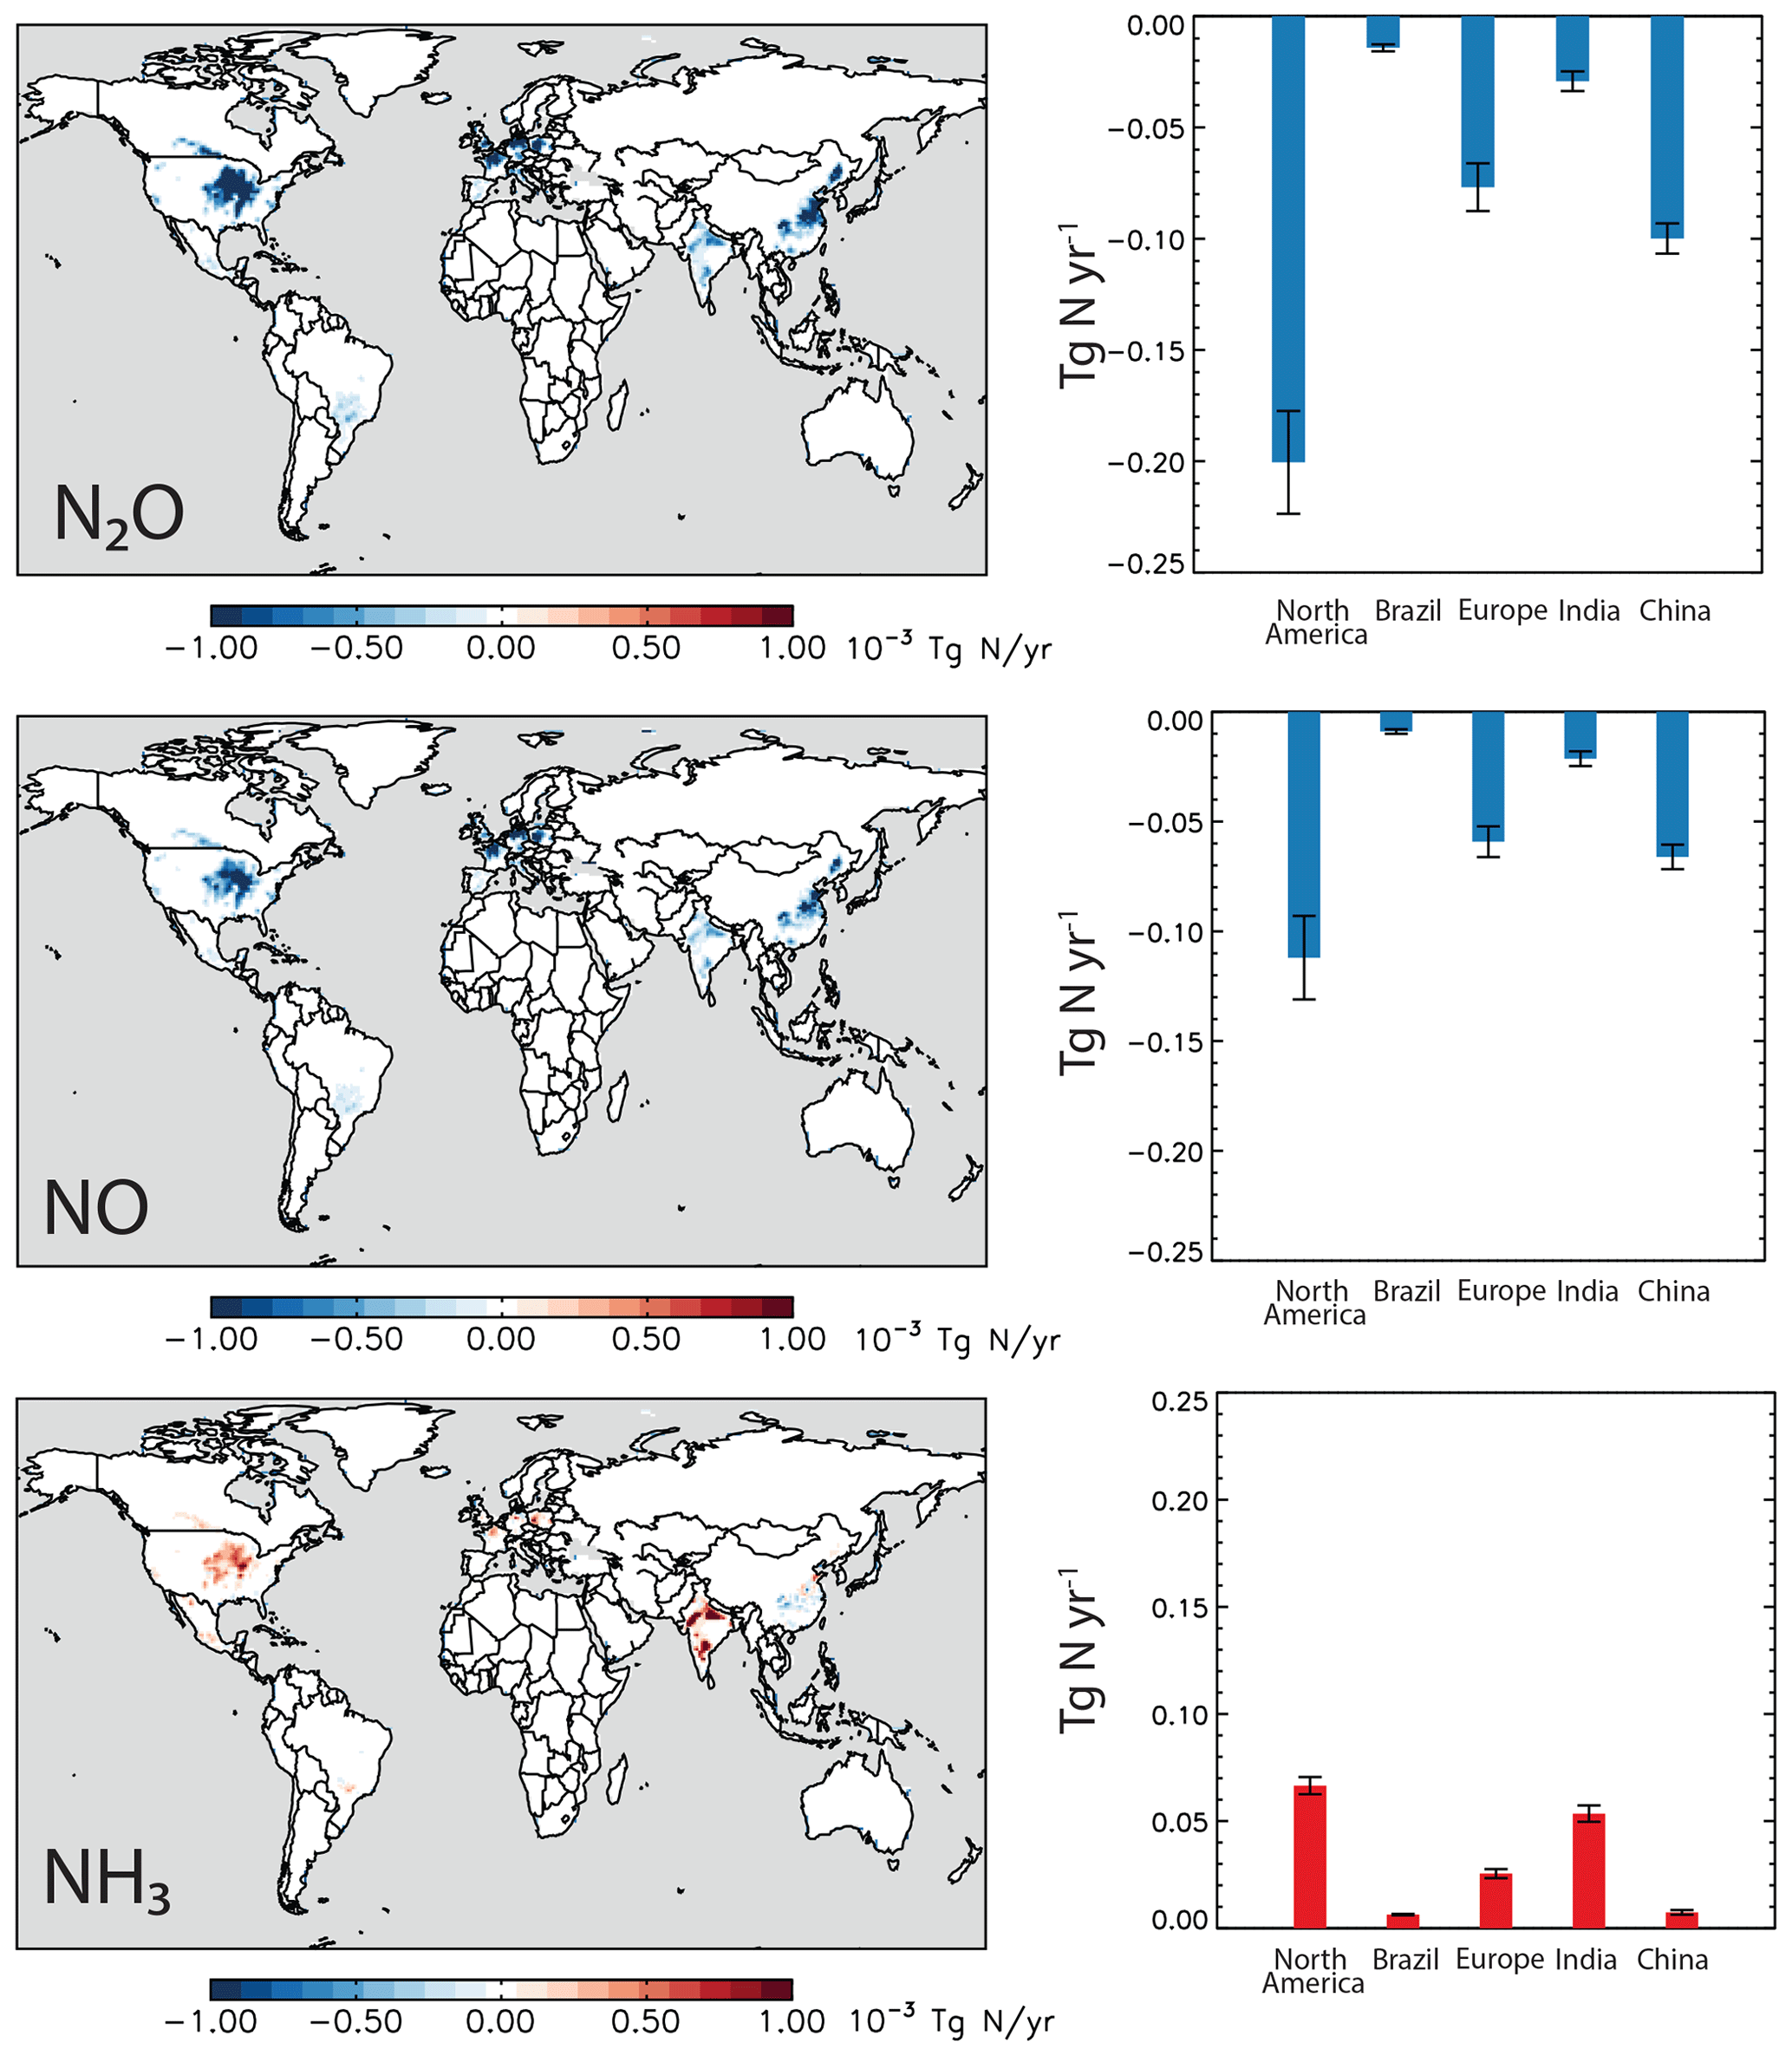
Figure 7Changes in annual soil N2O, NO, and NH3 fluxes across the five main agriculture regions (North America, Brazil, Europe, India, and China) based on increases in soil pH resulting from basalt treatment required to sequester 2 Gt CO2 yr−1 (Fig. 2). The spatial distribution of changes in soil N2O, NO, and NH3 (Δ ERW-Control) as well as the summary of the regional changes (Tg N yr−1) are shown. Error bars indicate the standard deviation of the annual total changes.
Large-scale basalt application consistently decreases soil N2O and NO emissions over the five main agriculture regions, with a total decrease of 0.42 Tg N2O-N yr−1 and 0.25 Tg NO-N yr−1. These changes are substantial and correspond to 19 % for N2O and 17 % for NO of the total agricultural emissions in those five regions, with 13 % for N2O and 12 % for NO of the global total. Major reductions in N2O and NO occurred in North America (28 % for N2O and 24 % for NO), followed by China (16 % and 18 %) and Europe (13 % and 12 %).
Our new modeling framework only simulates changes in direct soil N2O emissions in croplands. Indirect soil nitrogen emissions occur through degassing of N2O from aquifers and surface waters via the leaching and runoff of applied N (NO3 and NH4) in aquatic systems and the volatilization of applied N as NH3 and NOx followed by deposition of NH4 and NOx on soils and water (Nevison, 2021). ERW field trials in the US have reported nitrogen losses (in the form of NO3 and NH4) to leaching in the basalt-treated plots that are substantially larger than the control plots in maize (40 %) and Miscanthus (17 %) (Blanc-Betes et al., 2020). However, this indirect contribution to the overall emissions is expected to be small, given that indirect emissions account for less than 5 % of total agricultural N2O emissions (Nevison, 2021; Lu et al., 2022).
Basalt applications increased soil NH3 emissions as expected, with a total increase of 0.17 Tg NH3-N yr−1, which is about 2 % of agriculture emissions in our five regions and 1 % of the global total. The increasing effect on NH3 is not as consistent across all soils as for N2O and NO, and some grid cells with acidic soils (pH <5.5) displayed decreases in NH3, especially in regions across Brazil and China (Fig. S8). Increases in soil pH favor nitrification and subsequent denitrification processes (Parton et al., 1996), which reduces N in the NH form in the soils available for NH3 volatilization. Overall, relatively major increases in NH3 occurred in North America, Brazil, and Europe (3 %–4 %), followed by India (1.5 %) with marginal increases in China (0.8 %). Regions with more neutral and alkaline soils have more significant increases (8 %–12 %), such as croplands in the US with soil pH ranging 6.5–7.5, which showed increases up to 10 %.
We present the development and implementation of new updates and schemes for the CLM5 nitrogen cycle to evaluate the potential impact of ERW on croplands. In particular, new updates in N2O focus on the gross denitrification and denitrification end product rates described by Blanc-Betes et al. (2020) based on observations of ERW field trials in the US and the N2O nitrification rate. In addition, we implement a new parameterization to calculate NO release from nitrification and denitrification processes, considering rain pulses in nitrification and losses of NO to the plant canopy. Finally, for NH3 we use the volatilization scheme (Fung et al., 2022), with a regulating pH function based on observations of basalt, lime, and biochar applications.
Using our global simulations, we successfully validated simulated “control” (i.e., no ERW) seasonal cycles of soil N2O, NO, and NH3 emissions against a wide range of global emission inventories and previously reported estimates. For N2O, we also use results from the N2O Model Intercomparison Project, the CarbonTracker-Lagrange North American regional inversion framework, and a compilation of long-term observations in different croplands across North America. We also benchmarked simulated mitigation of soil N2O fluxes in response to ERW against a subset of data from ERW field trials in the US Corn Belt with single-point simulations at the Energy Farm in Illinois (US) and provide a case study of the effect of large-scale ERW deployment on soil nitrogen fluxes across five key regions with high potential for CDR with ERW (North America, Brazil, Europe, India, and China).
We acknowledge the need for further improvement in the CLM5 nitrogen cycling representation and the ERW parameterization. In a comprehensive evaluation of CLM5 nitrification and denitrification processes, Nevison et al. (2022b) emphasized that the nitrification:denitrification ratio (2:1) in CLM5 is likely to be unrealistically low, even when considering the missing N mineralization term in potential nitrification (Sect. 2.2.1). Consequently, CLM5 underestimates the fraction of gross mineralization leading to nitrification and overestimates NH uptake by plants. Additionally, CLM5 underestimates NO3 assimilation by immobilizing bacteria. To enhance the confidence in our land model simulations, it is thus crucial to gather more experimental data from ERW field trials as well as observational constraints on soil nitrogen fluxes and flux ratios.
Our study represents a first implementation of an ERW parameterization in a land model N cycling, which has enabled us to understand the implication of the large-scale deployment of ERW on croplands for direct soil nitrogen trace gas emissions. Our modeling framework simulates important reductions in both N2O (19 %) and NO (17 %) as well as moderate increases in NH3 (2 %) across five main cropland regions using the soil pH increases that would occur after 25-year basalt application to remove 2Gt CO2 yr−1 (Beerling et al., 2020). Reductions are most marked over North America, with decreases of 28 % in N2O and 24 % in NO as well as increases of about 10 % in NH3 (for neutral and alkaline agriculture soils).
Given that agricultural N2O emissions account for more than 50 % of the total N2O emissions (Tian et al., 2020) and these emissions are expected to continue to grow due to increases in fertilizer usage (IPCC, 2021), regional decreases in N2O emissions from basalt amendments in croplands are significant and may impact stratospheric ozone. Our study highlights the additional potential of ERW for climate change mitigation through reducing emissions of a non-CO2 greenhouse gas.
Simulated decreases in soil NO emissions and moderate increases in NH3 from basalt treatments in our five cropland regions have further implications for regional air quality. Once emitted from soil, NH3 undergoes rapid reactions in the atmosphere, forming inorganic NO and NH aerosols, which contributes to PM2.5 formation. Agriculture NH3 emissions are responsible for 30 % of all PM2.5 in the US, 50 % in Europe, and 20 % in China (e.g., Wyer et al., 2022). Similarly, soil NO is rapidly oxidized, generating tropospheric O3 and secondary organic aerosol (SOA). Ozone is a strong oxidant, which causes harm to human health and to crops, and SOA also contributes to PM2.5. These past decades, significant government attention has been focused on regulating NH3 emissions as a strategy for reducing PM2.5 (e.g., U.S. EPA, 2004; UK DEFRA, 2019). However, in future emission projections, it is unclear whether controlling NH3 may be an effective strategy for reducing PM2.5, particularly given that NOx can also act as the primary limiting precursor for the formation of secondary NH aerosols (e.g., Vieno et al., 2016). Our study thus provides a scientific modeling tool to aid stakeholders in evaluating global and regional ERW proposals as an additional strategy to mitigate climate change and ensuring a clean and sustainable environment.
CLM5.0 is publicly available through the Community Terrestrial System Model (CTSM) GitHub repository (https://github.com/ESCOMP/ctsm, last access: 8 October 2023). Results presented in this paper were obtained using CLM5.0.25 with an updated version of the nitrogen cycling scheme, which is publicly available through the Zenodo repository (https://doi.org/10.5281/zenodo.8111541, Val Martin, 2023). All emission inventory and published observational data used in the study are available from the provided references. Unpublished soil N2O fluxes from the Energy Farm ERW field trials as well as CLM5 output data and metadata to recreate the analysis are available through the Zenodo repository (https://doi.org/10.5281/zenodo.8119634, Val Martin and Beerling, 2023).
The supplement related to this article is available online at: https://doi.org/10.5194/gmd-16-5783-2023-supplement.
MVM developed and implemented the new code, performed the modeling experiments, and analyzed the output. EBB, KMF, LLT, LKE, WRW, and APKT provided input for the model development. MVM, EPK, and DJB designed the modeling experiment. IBK, MDM, EHD, IC, and NJP provided observations collected in ERW field experiments. MVM prepared the paper with contributions from all co-authors.
The contact author has declared that none of the authors has any competing interests.
Publisher's note: Copernicus Publications remains neutral with regard to jurisdictional claims in published maps and institutional affiliations.
This work was supported by the UKRI Future Leaders Fellowship Programme through an award to Maria Val Martin (MR/T019867/1) and the Leverhulme Research Centre Award (RC-2015–02) to David J. Beerling. Development of the NH3 emission model was supported in part by the General Research Fund (grant no. 14307722) through the Research Grants Council of Hong Kong via an award to Amos P. K. Tai. We thank Cynthia Nevison (INSTAAR), Hanqin Tian (Auburn University), Julius Vira (Finnish Meteorological Institute), and Anthony Wong (University of Boston, now MIT) for helpful discussions. We would like to acknowledge high-performance computing support from Cheyenne (https://doi.org/10.5065/D6RX99HX) provided by NCAR's Computational and Information Systems Laboratory, sponsored by the National Science Foundation.
This research has been supported by UK Research and Innovation (grant no. MR/T019867/1) and the Leverhulme Trust (grant no. RC-2015–02).
This paper was edited by Christian Folberth and reviewed by three anonymous referees.
Bakwin, P. S., Wofsy, S. C., Fan, S. M., Keller, M., Trumbore, S. E., and Da Costa, J. M.: Emission of nitric oxide from tropical forest soils and exchange of NO between the forest canopy and atmospheric boundary layers, J. Geophys. Res., 95, 16755–16764, 1990.
Beerling, D. J., Leake, J. R., Long, S. P., Scholes, J. D., Ton, J., Nelson, P. N., Bird, M. I., Kantzas, E., Taylor, L. L., Sarkar, B., Kelland, M., DeLucia, E., Kantola, I., Müller, C., Rau, G., and Hansen, J.: Farming with crops and rocks to address global climate, food and soil security, Nat. Plants, 4, 138–147, https://doi.org/10.1038/s41477-018-0108-y, 2018.
Beerling, D. J., Kantzas, E. P., Lomas, M. R., Wade, P., Eufrasio, R. M., Renforth, P., Sarkar, B., Andrews, M. G., James, R. H., Pearce, C. R., Mercure, J.-F., Pollitt, H., Holden, P. B., Edwards, N. R., Khanna, M. , Koh, L., Quegan, S., Pidgeon, N. F. , Janssens, I. A., Hansen, J., and Banwart, S. A.: Potential for large-scale CO2 removal via enhanced rock weathering with croplands, Nature, 583, 242–248, https://doi.org/10.1038/s41586-020-2448-9, 2020.
Blanc-Betes, E., Kantola, I. B., Gomez-Casanovas, N., Hartman, M. D., Parton, W. J., Lewis, A. L., Beerling, D. J., and DeLucia, E. H.: In silico assessment of the potential of basalt amendments to reduce N2O emissions from bioenergy crops, GCB Bioenergy, 13, 224–241, https://doi.org/10.1111/gcbb.12757, 2020.
Canadell, J. G., Monteiro, P. M. S., Costa, M. H.,Cotrim da Cunha, L., Cox, P. M., Eliseev, A. V., Henson, S., Ishii, M., Jaccard, S., Koven, C., Lohila, A., Patra, P. K., Piao, S.,x Rogelj, S., Syampungani, S., Zaehle, S., and Zickfeld, K.: Global Carbon and other Biogeochemical Cycles and Feedbacks. In Climate Change 2021: The Physical Science Basis. Contribution of Working Group I to the Sixth Assessment Report of the Intergovernmental Panel on Climate Change, edited by: Masson-Delmotte, V., Zhai, P., Pirani, A., Connors, S. L., Péan, C., Berger, S., Caud, N., Chen, Y., Goldfarb, L., Gomis, M. I., Huang, M., Leitzell, K., Lonnoy, E., Matthews, J. B. R., Maycock, T. K., Waterfield, T., Yelekçi, O., Yu, R., and Zhou, B., Cambridge University Press, Cambridge, United Kingdom and New York, NY, USA, 673–816, https://doi.org/10.1017/9781009157896.007, 2021.
Chen, Z., Griffis, T. J., Millet, D. B., Wood, J. D., Lee, X., Baker, J. M., Xiao, K., Turner, P. A., Chen, M., Zobitz, J., and Wells, K. C.: Partitioning N2O emissions within the U.S. Corn Belt using an inverse modeling approach, Global Biogeochem. Cy., 30, 1192–1205, https://doi.org/10.1002/2015GB005313, 2016.
Cheng, Y., Huang, M., Chen, M., Guan, K., Bernacchi, C., Peng, B., and Tan, Z.: Parameterizing perennial bioenergy crops in Version 5 of the Community Land Model based on site-level observations in the Central Midwestern United States, J. Adv. Model. Earth Sy., 12, e2019MS001719. https://doi.org/10.1029/2019MS001719, 2020.
Chiaravalloti, I.: Observed ammonia fluxes during maize production in mesocosms with basalt amendments, ESS Open Archive, https://doi.org/10.22541/essoar.167751584.47065180/v1, 2023.
Crippa, M., Guizzardi, D., Muntean, M., Schaaf, E., Dentener, F., van Aardenne, J. A., Monni, S., Doering, U., Olivier, J. G. J., Pagliari, V., and Janssens-Maenhout, G.: Gridded emissions of air pollutants for the period 1970–2012 within EDGAR v4.3.2, Earth Syst. Sci. Data, 10, 1987–2013, https://doi.org/10.5194/essd-10-1987-2018, 2018.
Danabasoglu, G., Lamarque, J.-F., Bacmeister, J., Bailey, D. A., DuVivier, A. K., Edwards, J., Emmons, L. K., Fasullo, J., Garcia, R., Gettelman, A., Hannay, C., Holland, M. M., Large, W. G., Lauritzen, P. H., Lawrence, D. M., Lenaerts, J. T. M., Lindsay, K., Lipscomb, W. H., Mills, M. J., Neale, R., Oleson, K. W., Otto-Bliesner, B., Phillips, A. S., Sacks, W., Tilmes, S., van Kampenhout, L., Vertenstein, M., Bertini, A., Dennis, J., Deser, C., Fischer, C., Fox-Kemper, B., Kay, J. E., Kinnison, D., Kushner, P. J., Larson, V. E., Long, M. C., Mickelson, S., Moore, J. K., Nienhouse, E., Polvani, L., Rasch, P. J., and Strand, W. G.: The Community Earth System Model Version 2 (CESM2), J. Adv. Model. Earth Sy., 12, e2019MS001916. https://doi.org/10.1029/2019MS001916, 2020.
Davidson, E. A. and Kanter, D.: Inventories and scenarios of nitrous oxide emissions, Environ. Res. Lett. 9, 105012, https://doi.org/10.1088/1748-9326/9/10/105012, 2014.
Davidson, E. A. and Trumbore, S. E.: Gas diffusivity and production of CO2 in deep soils of the eastern Amazon, Tellus B, 47, 550–565, https://doi.org/10.1034/j.1600-0889.47.issue5.3.x, 1995
Davidson, E. A. and Verchot, L. V.: Testing the hole-in-the-pipe model of nitric and nitrous oxide emissions from soils using the TRAGNET data base, Global Biogeochem. Cycles, 14, 1035–1043, 2000.
Del Grosso, S. J., Parton, W. J., Mosier, A. R., Ojima, D. S., Kulmala, A. E., and Phongpan, S.: General model for N2O and N2 gas emissions from soils due to denitrification, Global Biogeochem. Cy., 14, 1045–1060, https://doi.org/10.1029/1999GB001225, 2000.
Del Grosso, S. J., Parton, W. J., Mosier, A. R., Walsh, M. K., Ojima, D. S., and Thornton, P. E.: DAYCENT national-scale simulations of nitrous oxide emissions from cropped soils in the United States, J. Environ. Qual., 35, 1451–1460, https://doi.org/10.2134/jeq2005.0160, 2006.
Drewniak, B., Song, J., Prell, J., Kotamarthi, V. R., and Jacob, R.: Modeling agriculture in the Community Land Model, Geosci. Model Dev., 6, 495–515, https://doi.org/10.5194/gmd-6-495-2013, 2013.
European Environment Agency: EMEP/EEA air pollutant emission inventory guidebook 2013 – Technical guidance to prepare national emission inventories, Publications Office, https://data.europa.eu/doi/10.2800/92722, 2013
Food and Agriculture organization (FAO) of the United Nations: Harmonized World Soil Database (version 1.2), Food Agriculture Organization, Rome, Italy and IIASA, Laxenburg, Austria, http://webarchive.iiasa.ac.at/Research/LUC/External-World-soil-database/HTML/ (last access: 1 October 2023), 2012.
Firestone, M. K. and Davidson, E. A.: Microbiological Basis of NO and N2O Production and Consumption in Soils, in: Exchange of Trace Gases between Terrestrial Ecosystems and the Atmosphere, edited by: Andreae, M. O. and Schimel, D. S., John Willey and Sons, New York, 7–21, 1989.
Fung, K. M., Val Martin, M., and Tai, A. P. K.: Modeling the interinfluence of fertilizer-induced NH3 emission, nitrogen deposition, and aerosol radiative effects using modified CESM2, Biogeosciences, 19, 1635–1655, https://doi.org/10.5194/bg-19-1635-2022, 2022.
Griffis, T. J., Lee, X., Baker, J. M., Russelle, M. P., Zhang, X., Venterea, R., and Millet, D. B.: Reconciling the differences between top-down and bottom-up estimates of nitrous oxide emissions for the U.S. Corn Belt, Global Biogeochem. Cy., 27, 746–754, https://doi.org/10.1002/gbc.20066, 2013.
Goll, D. S., Ciais, P., Amann, T., Buermann, W., Chang, J., Eker, S., Hartmann, J., Janssens, I., Li, W., Obersteiner, M., Penuelas, J., Tanaka, K., and Vicca, S.: Potential CO2 removal from enhanced weathering by ecosystem responses to powdered rock, Nat. Geosci., 14, 545–549, https://doi.org/10.1038/s41561-021-00798-x, 2021.
Granier, C., Darras, S., Denier van der Gon, H., Doubalova, J., Elguindi, N., Galle, B., Gauss, M., Guevara, M., Jalkanen, J.-P., Kuenen, J., Liousse, C., Quack, B., Simpson, D., and Sindelarova, K.: The Copernicus Atmosphere Monitoring Service global and regional emissions (April 2019 version), Copernicus Atmosphere Monitoring Service (CAMS) report, https://doi.org/10.24380/d0bn-kx16, 2019.
Hoesly, R. M., Smith, S. J., Feng, L., Klimont, Z., Janssens-Maenhout, G., Pitkanen, T., Seibert, J. J., Vu, L., Andres, R. J., Bolt, R. M., Bond, T. C., Dawidowski, L., Kholod, N., Kurokawa, J.-I., Li, M., Liu, L., Lu, Z., Moura, M. C. P., O'Rourke, P. R., and Zhang, Q.: Historical (1750–2014) anthropogenic emissions of reactive gases and aerosols from the Community Emissions Data System (CEDS), Geosci. Model Dev., 11, 369–408, https://doi.org/10.5194/gmd-11-369-2018, 2018.
Hudman, R. C., Moore, N. E., Mebust, A. K., Martin, R. V., Russell, A. R., Valin, L. C., and Cohen, R. C.: Steps towards a mechanistic model of global soil nitric oxide emissions: implementation and space based-constraints, Atmos. Chem. Phys., 12, 7779–7795, https://doi.org/10.5194/acp-12-7779-2012, 2012.
Hurtt, G. C., Chini, L. P., Frolking, S., Betts, R. A., Feddema, J., Fischer, G., Fisk, J. P., Hibbard, K., Houghton, R. A., Janetos, A., Jones, C. D., Kindermann, G., Kinoshita, T., Klein Goldewijk, K., Riahi, K., Shevliakova, E., Smith, S., Stehfest, E., Thomson, A., Thornton, P., van Vuuren, D. P., and Wang, Y. P.: Harmonization of land-use scenarios for the period 1500–2100: 600 years of global gridded annual land-use transitions, wood harvest, and resulting secondary lands, Climatic Change, 109, 117–161, https://doi.org/10.1007/s10584-011-0153-2, 2011.
Inatomi, M., Hajima, T., and Ito, A.: Fraction of nitrous oxide production in nitrification and its effect on total soil emission: A meta-analysis and global-scale sensitivity analysis using a process-based model, PLoS ONE, 14, e0219159, https://doi.org/10.1371/journal.pone.0219159, 2019.
Intergovernmental Panel on Climate Change (IPCC): Climate Change 2021 – The Physical Science Basis: Working Group I Contribution to the Sixth Assessment Report of the Intergovernmental Panel on Climate Change, edited by: Masson-Delmotte, V., Zhai, P., Pirani, A., Connors, S. L., Péan, C., Berger, S., Caud, N., Chen, Y., Goldfarb, L., Gomis, M. I., Huang, M., Leitzell, K., Lonnoy, E., Matthews, J. B. R., Maycock, T. K., Waterfield, T., Yelekçi, O., Yu, R., and Zhou, B., Cambridge University Press, Cambridge, https://doi.org/10.1017/9781009157896, 2023.
Jacob, D. J. and Wofsy, S. C.: Budgets of reactive nitrogen, hydrocarbons and ozone over the Amazon forest during the wet season, J. Geophys. Res., 95, 16737–16754, 1990.
Johansson, C., Rodhe, H., and Sanhuenza, E.: Emission of NO in a tropical savanna and a cloud forest during the dry season, J. Geophys.Res., 93, 7180–7192, 1988.
Kantola, I. B., Masters, M.D., Beerling, D. J., Long, S. P., and DeLucia, E. H.: Potential of global croplands and bioenergy crops for climate change mitigation through deployment for enhanced weathering, Biol. Lett., 13, 20160714, https://doi.org/10.1098/rsbl.2016.0714, 2017.
Kantzas, E. P., Val Martin, M., Lomas, M. R., Eufrasio, R. M., Renforth, P.l, Lewis, A. L., Taylor, L. L., Mecure, J.-F., Pollitt, H., Vercoulen, P. V., Vakilifard, N., Holden, P. B., Edwards, N. R., Koh, L., Pidgeon, N. F., Banwart, S. A., and Beerling, D. J.: Substantial carbon drawdown potential from enhanced rock weathering in the United Kingdom, Nat. Geosci., 15, 382–389, https://doi.org/10.1038/s41561-022-00925-2, 2022.
Kim, M.-S., Min, H.-G., Koo, N., and Kim, J.-G.: Response to Ammonia Emission Flux to different pH Conditions under Biochar and Liquid Fertilizer Application, Agriculture, 11, 136, https://doi.org/10.3390/agriculture11020136, 2022.
Koven, C. D., Riley, W. J., Subin, Z. M., Tang, J. Y., Torn, M. S., Collins, W. D., Bonan, G. B., Lawrence, D. M., and Swenson, S. C.: The effect of vertically resolved soil biogeochemistry and alternate soil C and N models on C dynamics of CLM4, Biogeosciences, 10, 7109–7131, https://doi.org/10.5194/bg-10-7109-2013, 2013.
Lawrence, D. M., Fisher, R. A., Koven, C. D., Oleson, K. W., Swenson, S. C., Bonan, G., Collier, N., Ghimire, B., Kampenhout, L., Kennedy, D., Kluzek, E., Lawrence, P. J., Li, F., Li, H., Lombardozzi, D., Riley, W. J., Sacks, W. J., Shi, M., Vertenstein, M., Wieder, W. R., Xu, C., Ali, A. A., Badger, A. M., Bisht, G., Broeke, M., Brunke, M. A., Burns, S. P., Buzan,J., Clark, M., Craig, A., Dahlin, K., Drewniak, B., Fisher, J.B., Flanner, M., Fox, A. M., Gentine, P., Hoffman, F., Keppel-Aleks, G., Knox, R., Kumar, S., Lenaerts, J., Leung, L. R., Lipscomb,W. H., Lu, Y., Pandey, A., Pelletier, J. D., Perket, J., Randerson, J. T., Ricciuto, D. M., Sanderson, B. M., Slater, A., Subin, Z. M., Tang, J., Thomas, R. Q., Val Martin, M., and Zeng, X.: The Community Land Model Version 5: Description of New Features, Benchmarking, and Impact of Forcing Uncertainty, J. Adv. Model. Earth Syst., 11, 4245–4287, https://doi.org/10.1029/2018MS001583, 2019.
Lawrence, P. J. and Chase, T. N.: Representing a new MODIS consistent land surface in the Community Land Model (CLM 3.0), J. Geophys. Res., 112, G01023, https://doi.org/10.1029/2006JG000168, 2007.
Levis, S., Badger, A., Drewniak, B., Nevison, C., and Ren, X.: CLM crop yields and water requirements: avoided impacts by choosing RCP 4.5 over 8.5, Climatic Change, 146, 501–515, https://doi.org/10.1007/s10584-016-1654-9, 2018.
Li, C., Narayanan, V., and Harriss, R. C.: Model estimates of nitrous oxide emissions from agricultural lands in the United States, Global Biogeochem. Cy., 10, 297–306, https://doi.org/10.1029/96GB00470, 1996.
Li, C., Aber, J., Stange, F., Butterbach-Bahl, K., and Papen, H.: A process-oriented model of N2O and NO emissions from forest soils: 1. Model development, J. Geophys. Res., 105, 4369–4384, 2000.
Li, C., Salas, W., Zhang, R., Krauter, C., Rotz, A., and Mitloehner, F.: Manure-DNDC: a biogeochemical process model for quantifying greenhouse gas and ammonia emissions from livestock manure systems, Nutr. Cycl. Agroecosyst., 93, 163–200, https://doi.org/10.1007/s10705-012-9507-z, 2012.
Lin, H., Jacob, D. J., Lundgren, E. W., Sulprizio, M. P., Keller, C. A., Fritz, T. M., Eastham, S. D., Emmons, L. K., Campbell, P. C., Baker, B., Saylor, R. D., and Montuoro, R.: Harmonized Emissions Component (HEMCO) 3.0 as a versatile emissions component for atmospheric models: application in the GEOS-Chem, NASA GEOS, WRF-GC, CESM2, NOAA GEFS-Aerosol, and NOAA UFS models, Geosci. Model Dev., 14, 5487–5506, https://doi.org/10.5194/gmd-14-5487-2021, 2021.
Liu, B., Mørkved, P. T., Frostegård, A., and Bakken, L. R.: Denitrification gene pools, transcription and kinetics of NO, N2O and N2 production as affected by soil pH, FEMS Microbiol. Ecol., 72, 407–417, https://doi.org/10.1111/j.1574-6941.2010.00856.x, 2010.
Lombardozzi, D. L., Lu, Y., Lawrence, P. J., Lawrence, D. M., Swenson, S., Oleson, K. W., Wieder, W. R., and Ainsworth, E. A.: Simulating Agriculture in the Community Land Model Version 5, J. Geophys. Res.-Biogeo., 125, e2019JG005529, https://doi.org/10.1029/2019JG005529, 2020.
Lu, C., Yu, Z., Zhang, J., Cao, P., Tian, H., and Nevison, C.: Century-long changes and drivers of soil nitrous oxide (N2O) emissions across the contiguous United States, Glob. Change Biol., 28, 2505–2524, https://doi.org/10.1111/gcb.16061, 2022.
Martin, R. E., Scholes, M. C., Mosier, A. R., Ojima, D. S., Holland, E. A., and Parton, W. J.: Controls on annual emissions of nitric oxide from soils of the Colorado shortgrass steppe, Global Biogeochem. Cycles, 12, 81–91, 1998.
Miller, S. M., Kort, E. A., Hirsch, A. I., Dlugokencky, E. J., Andrews, A. E., Xu, X., Tian, H., Nehrkorn, T., Eluszkiewicz, J., Michalak, A. M., and Wofsy, S. C.: Regional sources of nitrous oxide over the United States: Seasonal variation and spatial distribution, J. Geophys. Res.-Atmos., 117, D06310, https://doi.org/10.1029/2011JD016951, 2012.
Mkhabela, M. S., Gordon, R., Burton, D., Madani, A., and Hart, W.: Effect of lime, dicyandiamide and soil water content on ammonia and nitrous oxide emissions following application of liquid hog manure to a marshland soil, Plant Soil, 284, 351–361, https://doi.org/10.1007/s11104-006-0056-6, 2006.
National Research Council: Climate Intervention: Carbon Dioxide Removal and Reliable Sequestration, The National Academies Press, Washington, DC, https://doi.org/10.17226/18805, 2015.
Nevison, C.: IPCC Good Practice Guidance and Uncertainty Management in National Greenhouse Gas Inventories, Indirect N2O emissions from nitrogen used in agriculture, https://www.ipcc-nggip.iges.or.jp/public/gp/english/4_Agriculture.pdf (last access: 9 February 2023), 2021.
Nevison, C., Andrews, A., Thoning, K., Dlugokencky, E., Sweeney, C., Miller, S., Saikawa, E., Benmergui, J., Fischer, M., Mountain, M., and Nehrkorn, T.: Nitrous oxide emissions estimated with the carbontracker-Lagrange North American regional inversion framework, Global Biogeochem. Cy., 32, 463–485, https://doi.org/10.1002/2017GB005759, 2018.
Nevison, C., Goodale, C., Hess, P., Wieder, W. R., Vira, J., and Groffman, P. M.: Nitrification and Denitrification in the Community Land Model Compared with Observations at Hubbard Brook Forest, Ecol. Appl., 32, e2530, https://doi.org/10.1002/eap.2530, 2022a.
Nevison, C., Hess, P., Goodale, C., Zhu, Q., and Vira, J.: Nitrification, Denitrification, and Competition for Soil N: Evaluation of Two Earth System Models against Observations, Ecol. Appl., 32, e252, https://doi.org/10.1002/eap.2528, 2022b.
Parton, W. J., Mosier, A. R., Ojima, D. S., Valentine, D. W., Schimel, D. S., Weier, K., and Kulmala, A. E.: Generalized model for N2 and N2O production from nitrification and denitrification, Global Biogeochem. Cy., 10, 401–412, https://doi.org/10.1029/96GB01455, 1996.
Parton, W. J., Holland, E. A., Del Grosso, S. J., Hartman, M. D., Martin, R. E., Mosier, A. R., Ojima, D. S., and Schimel, D. S.: Generalized model for NOx and N2O emissions from soils, J. Geophys. Res.-Atmos., 106, 17403–17419, https://doi.org/10.1029/2001JD900101, 2001.
Paulot, F., Jacob, D. J., Pinder, R. W., Bash, J. O., Travis, K., and Henze, D. K.: Ammonia emissions in the United States, European Union, and China derived by highresolution inversion of ammonium wet deposition data: Interpretation with a new agricultural emissions inventory (MASAGE_NH3), J. Geophys. Res.-Atmos., 119, 4343–4364, https://doi.org/10.1002/2013JD021130, 2014.
Portmann, F. T., Siebert, S., and Döll, P.: MIRCA2000-Global monthly irrigated and rainfed crop areas around the year 2000: A new high-resolution data set for agricultural and hydrological modelling: Monthly Irrigated and Rainfed Crop Areas, Global Biogeochem. Cy., 24, GB1011, https://doi.org/10.1029/2008GB003435, 2010.
Prather, M. J., Hsu, J., DeLuca, N. M., Jackman, C. H., Oman, L. D., Douglass, A. R., Fleming, E. L., Strahan, S. E., Steenrod, S. D., Søvde, O. A., Isaksen, I. S. A., Froidevaux, L., and Funke, B.: Measuring and modeling the lifetime of nitrous oxide including its variability, J. Geophys. Res.-Atmos., 120, 5693–5705, https://doi.org/10.1002/2015JD023267, 2015.
Reay, D. S., Davidson, E. A., Smith, K. A. Smith, P., Melillo, J. M., Dentener, F., and Crutzen, P. J.: Global agriculture and nitrous oxide emissions, Nat. Clim. Change, 2, 410–416, https://doi.org/10.1038/nclimate1458, 2012.
Riahi, K., Bertram, C., Huppmann, D. et al.: Cost and attainability of meeting stringent climate targets without overshoot, Nat. Clim. Change, 11, 1063–1069, https://doi.org/10.1038/s41558-021-01215-2, 2021.
Rochester, I. J.: Estimating nitrous oxide emissions from flood-irrigated alkaline grey clays, Soil Res., 41, 197–206, https://doi.org/10.1071/sr02068, 2003.
Royal Society and Royal Academy of Engineering: Greenhouse gas removal, ISBN 978-1-78252-349-9, https://royalsociety.org/topics-policy/projects/greenhouse-gas-removal/ (last access: 31 January 2023), 2018.
Saikawa, E., Prinn, R. G., Dlugokencky, E., Ishijima, K., Dutton, G. S., Hall, B. D., Langenfelds, R., Tohjima, Y., Machida, T., Manizza, M., Rigby, M., O'Doherty, S., Patra, P. K., Harth, C. M., Weiss, R. F., Krummel, P. B., van der Schoot, M., Fraser, P. J., Steele, L. P., Aoki, S., Nakazawa, T., and Elkins, J. W.: Global and regional emissions estimates for N2O, Atmos. Chem. Phys., 14, 4617–4641, https://doi.org/10.5194/acp-14-4617-2014, 2014.
Shcherbak I., Millar, N., and Robertson, G. P.: Global metaanalysis of the nonlinear response of soil nitrous oxide (N2O) emissions to fertilizer nitrogen, P. Natl. Acad. Sci. USA, 111, 9199–9204, 2014.
Smith, S. M., Geden, O., Nemet, G., Gidden, M., Lamb, W. F., Powis, C., Bellamy, R., Callaghan, M., Cowie, A., Cox, E., Fuss, S., Gasser, T., Grassi, G., Greene, J., Lück, S., Mohan, A., Müller-Hansen, F., Peters, G., Pratama, Y., Repke, T., Riahi, K., Schenuit, F., Steinhauser, J., Strefler, J., Valenzuela, J. M., and Minx, J. C.: The State of Carbon Dioxide Removal, 1st Edition, The State of Carbon Dioxide Removal, https://doi.org/10.17605/OSF.IO/W3B4Z, 2023.
Stehfest, E. and Bouwman, L.: N2O and NO Emission from Agricultural Fields and Soils under Natural Vegetation: Summarizing Available Measurement Data and Modeling of Global Annual Emissions, Nutr. Cycl. Agroecosys., 74, 207–228, https://doi.org/10.1007/s10705-006-9000-7, 2006.
Syakila, A. and Kroeze, C.: The global nitrous oxide budget revisited, Greenhouse Gas Measurement and Management, 1, 17–26, https://doi.org/10.3763/ghgmm.2010.0007, 2011.
Sutton, M. A., Reis, S., Baker, S. M. H. (Eds.): Atmospheric Ammonia – Detecting Emission Changes and Environmental Impacts, Springer, Berlin, 71–86, ISBN 978-1-4020-9120-9, 2009.
Sutton, M. A., Reis, S., Riddick, S. N., Dragosits, U., Nemitz, E., Theobald, M. R., Tang, Y. S., Braban, C. F., Vieno, M., Dore, A. J., Mitchell, R. F., Wanless, S., Daunt, F., Fowler, D., Blackall, T. D., Milford, C., Flechard, C. R., Loubet, B., Massad, R., Cellier, P., Personne, E., Coheur, P. F., Clarisse, L., Van Damme, M., Ngadi, Y., Clerbaux, C., Skjøth, C. A., Geels, C., Hertel, O., Wichink Kruit, R. J., Pinder, R. W., Bash, J. O., Walker, J. T., Simpson, D., Horváth, L., Misselbrook, T. H., Bleeker, A., Dentener, F., and de Vries, W.: Towards a climate-dependent paradigm of ammonia emission and deposition, Philos. T. Roy. Soc. B, 368, 20130166, https://doi.org/10.1098/rstb.2013.0166, 2013.
Tian, H., Yang, J., Lu, C., Xu, R., Canadell, J. G., Jackson, R. B., Arneth, A., Chang, J., Chen, G., Ciais, P., Gerber, S., Ito, A., Huang, Y., Joos, F., Lienert, S., Messina, P., Olin, S., Pan, S., Peng, C., and Zhu, Q.: The global N2O model intercomparison project, B. Am. Meteorol. Soc., 99, 1231–1251, https://doi.org/10.1175/BAMS-D-17-0212.1, 2018.
Tian, H., Yang, J., Xu, R., Lu, C., Canadell, J. G., Davidson, E. A., Jackson, R. B., Arneth, A., Chang, J., Ciais, P., Gerber, S., Ito, A., Joos, F., Lienert, S., Messina, P., Olin, S., Pan, S., Peng, C., Saikawa, E., and Zhang, B.: Global soil nitrous oxide emissions since the preindustrial era estimated by an ensemble of terrestrial biosphere models: Magnitude, attribution, and uncertainty, Glob. Change Biol., 25, 640–659, https://doi.org/10.1111/gcb.14514, 2019.
U.K. Department for Environment, Food and Rural Affairs (DEFRA): Clean Air Strategy 2019, https://www.gov.uk/government/publications/clean-air-strategy-2019, last access: 25 January 2023.
U.S. Environmental Protection Agency (EPA): The Particle Pollution Report: Current Understanding of Air Quality and Emissions through 2003, EPA 454-R-04-002, U.S. Government Printing Office, Washington, DC, https://www.epa.gov/sites/default/files/2017-11/documents/pp_report_2003.pdf (last access: 1 October 2023), 2004.
U.S. Environmental Protection Agency (EPA): Inventory of U.S. Greenhouse Gas Emissions and Sinks: 1990–2020, U.S. Environmental Protection Agency, EPA 430-R-22-003, https://www.epa.gov/system/files/documents/2022-04/us-ghg-inventory-2022-main-text.pdf (last access: 8 October 2023), 2022.
Val Martin, M.: CLM5.0.25 with improved N cycling to quantify soil N2O, NO and NH3 emissions from enhanced rock weathering with croplands, Zenodo [code], https://doi.org/10.5281/zenodo.8111541, 2023.
Val Martin, M. and Beerling, D.: Improving nitrogen cycling in a land surface model (CLM5) to quantify soil N2O, NO and NH3 emissions from enhanced rock weathering with croplands, Zenodo [data set], https://doi.org/10.5281/zenodo.8119634, 2023.
Van Damme, M., Clarisse, L., Franco, B., Sutton, M. A., Willem Erisman, J., Wichink Kruit, R., van Zanten, M., Whitburn, S., Hadji-Lazaro, J., Hurtmans, D., Clerbaux, C., and Coheur, P.-F: Global, regional, and national trends of atmospheric ammonia derived from a decadal (2008–2018) satellite record, Environ. Res. Lett., 16, 055017, https://doi.org/10.1088/1748-9326/abd5e0, 2021.
Vieno, M., Heal, M. R., Williams, M. L., Carnell, E. J., Nemitz, E., Stedman, J. R., and Reis, S.: The sensitivities of emissions reductions for the mitigation of UK PM2.5, Atmos. Chem. Phys., 16, 265–276, https://doi.org/10.5194/acp-16-265-2016, 2016.
Vira, J., Hess, P., Melkonian, J., and Wieder, W. R.: An improved mechanistic model for ammonia volatilization in Earth system models: Flow of Agricultural Nitrogen version 2 (FANv2), Geosci. Model Dev., 13, 4459–4490, https://doi.org/10.5194/gmd-13-4459-2020, 2020.
Wagena, M. B., Bock, E. M., Sommerlot, A. R., Fuka, D. R., and Easton, Z. M.: Development of a nitrous oxide routine for the SWAT model to assess greenhouse gas emissions from agroecosystems, Environ. Modell. Softw., 89, 131–143, https://doi.org/10.1016/j.envsoft.2016.11.013, 2017.
Wang, Q., Zhou, F., Shang, Z., Ciais, P., Winiwarter, W., Jackson, R. B., Tubiello, F. N., Janssens-Maenhout, G., Tian, H., Cui, X., Canadell, J. G., Piao, S., and Tao, S.: Data-driven estimates of global nitrous oxide emissions from croplands, Natl. Sci. Rev., 7, 2, 441–452, https://doi.org/10.1093/nsr/nwz087, 2020.
Wang, Y., Guo, J., Vogd, R.D., Mulder, J., Wang, J., and Zhang, X: Soil pH as the chief modifier for regional nitrous oxide emissions: New evidence and implications for global estimates and mitigation, Glob. Change Biol. 24, 617–626, 2018.
Wieder, W. R., Boehnert, J., Bonan, G. B., and Langseth, M.: Regridded Harmonized World Soil Database v1.2, Oak Ridge National Laboratory Distributed Active Archive Center, Oak Ridge, Tennessee, USA [data set], https://doi.org/10.3334/ORNLDAAC/1247, 2014.
Wyer, K. E., Kelleghan, D. B., Blanes-Vidal, V., Schauberger, G., and Curran, T. P.: Ammonia emissions from agriculture and their contribution to fine particulate matter: A review of implications for human health, J. Environ. Manage.,323, 116285, https://doi.org/10.1016/j.jenvman.2022.116285, 2022.
Xia, Y., Mitchell, K., Ek, M., Sheffield, J., Cosgrove, B., Wood, E., Luo, L., Alonge, C., Wei, H., Meng, J., Livneh, B., Lettenmaier, D., Koren, V., Duan, Q., Mo, K., Fan, Y., and Mocko, D.: Continental-scale water and energy flux analysis and validation for the North American Land Data Assimilation System project phase 2 (NLDAS-2): 1. Intercomparison and application of model products, J. Geophys. Res., 117, D03109, https://doi.org/10.1029/2011JD016048, 2012.
Yan, X., Ohara, T., and Akimoto, H.: Statistical modelling of global soil NOx emissions, Global Biogeochem. Cy., 19, GB3019, https://doi.org/10.1029/2004GB002276, 2005.
Yienger, J. J. and Levy II, H.: Empirical model of global soil biogenic NOx emissions, J. Geophys. Res., 100, 11447–11464, 1995.
Yoneyama, T., Hashimoto, A., and Totsuka, T.: Absorption of atmospheric NO2 by plants and soils, Soil Sci. Plant Nutr., 26, 1–7, https://doi.org/10.1080/00380768.1980.10433207, 1980.
Zeri, M., Anderson-Teixeira, K., Hickman, G., Masters, M., DeLucia, E., and Bernacchi, C. J.: Carbon exchange by establishing biofuel crops in Central Illinois, Agr. Ecosyst. Environ., 144, 319–329, https://doi.org/10.1016/j.agee.2011.09.006, 2011.
Zhao, Y., Zhang, L., Tai, A. P. K., Chen, Y., and Pan, Y.: Responses of surface ozone air quality to anthropogenic nitrogen deposition in the Northern Hemisphere, Atmos. Chem. Phys., 17, 9781–9796, https://doi.org/10.5194/acp-17-9781-2017, 2017.