the Creative Commons Attribution 4.0 License.
the Creative Commons Attribution 4.0 License.
 | 25 Jan 2023
Comparing Sentinel-5P TROPOMI NO2 column observations with the CAMS regional air quality ensemble
Henk Eskes
Jos van Geffen
K. Folkert Boersma
Steven Compernolle
Gaia Pinardi
Anne-Marlene Blechschmidt
Vincent-Henri Peuch
Augustin Colette
Pepijn Veefkind
The Sentinel-5P TROPOspheric Monitoring Instrument (TROPOMI) instrument, launched in October 2017, provides unique observations of atmospheric trace gases at a high resolution of about 5 km, with near-daily global coverage, resolving individual sources like thermal powerplants, industrial complexes, fires, medium-scale towns, roads, and shipping routes. Even though Sentinel-5P (S5P) is a global mission, these datasets are especially well suited to test high-resolution regional-scale air quality (AQ) models and provide valuable input for emission inversion systems.
In Europe, the Copernicus Atmosphere Monitoring Service (CAMS) has implemented an operational regional AQ forecasting capability based on an ensemble of several European models, available at a resolution of 0.1∘ × 0.1∘. In this paper, we present comparisons between TROPOMI observations of nitrogen dioxide (NO2) and the CAMS AQ forecasts and analyses of NO2. We discuss the different ways of making these comparisons and present quantitative results in the form of maps for individual days, summer and winter months, and a time series for European subregions and cities between May 2018 and March 2021.
The CAMS regional products generally capture the fine-scale daily and averaged features observed by TROPOMI in much detail. In summer, the comparison shows a close agreement between TROPOMI and the CAMS ensemble NO2 tropospheric columns with a relative difference of up to 15 % for most European cities. In winter, however, we find a significant discrepancy in the column amounts over much of Europe, with relative differences up to 50 %. The possible causes for these differences are discussed, focusing on the possible impact of retrieval and modeling errors. Apart from comparisons with the CAMS ensemble, we also present results for comparisons with the individual CAMS models for selected months.
Furthermore, we demonstrate the importance of the free tropospheric contribution to the estimation of the tropospheric column and thus include profile information from the CAMS configuration of the ECMWF's (European Centre for Medium-Range Weather Forecasts) global integrated model above 3 km altitude in the comparisons. We also show that replacing the global 1∘ × 1∘ a priori information in the retrieval by the regional 0.1∘ × 0.1∘ resolution profiles of CAMS leads to significant changes in the TROPOMI-retrieved tropospheric column, with typical increases at the emission hotspots up to 30 % and smaller increases or decreases elsewhere. As a spinoff, we present a new TROPOMI NO2 level 2 (L2) data product for Europe, based on the replacement of the original TM5-MP generated global a priori profile by the regional CAMS ensemble profile. This European NO2 product is compared with ground-based remote sensing measurements of six Pandora instruments of the Pandonia Global Network and nine Multi-AXis Differential Optical Absorption Spectroscopy (MAX-DOAS) instruments. As compared to the standard S5P tropospheric NO2 column data, the overall bias of the new product for all except two stations is 5 % to 12 % smaller, owing to a reduction in the multiplicative bias. Compared to the CAMS tropospheric NO2 columns, dispersion and correlation parameters with respect to the standard data are, however, superior.
- Article
(18031 KB) - Full-text XML
-
Supplement
(1148 KB) - BibTeX
- EndNote


Nitrogen dioxide (NO2) is a key component of air pollution. In combination with hydrocarbons and sunlight, NO2 produces ozone and also contributes to the formation of secondary aerosol, which has significant health effects. It is also associated with acidification and the eutrophication of the environment. Monitoring of NO2 is therefore of major importance, and space-based observations complement dedicated air quality (AQ) networks of surface air quality monitoring stations in areas with poor coverage, also providing valuable measurements above the surface which are otherwise very scarce.
Monitoring of atmospheric NO2 from space has a long history, starting with the launch of the Global Ozone Monitoring Experiment (GOME) instrument. More recently, a new generation of space spectrometers was developed to provide observations at kilometer scale. The Sentinel-5P TROPOspheric Monitoring Instrument (TROPOMI) instrument (Veefkind et al., 2012), launched in October 2017, is providing unprecedented detail and, thanks to its high spatial resolution, is able to identify emissions from individual sources.
A geostationary constellation of three satellites which combines high resolution with diurnal sampling of NO2 is also being set up, with the Geostationary Environment Monitoring Spectrometer (GEMS; Choi et al., 2018) instrument on the Korean Aerospace Research Institute GEO-KOMPSAT-2B satellite being the first one (launched in February 2020). The other two are TEMPO over the U.S. (Zoogman et al., 2017) and Sentinel-4 (Ingmann et al., 2012) over Europe. The main mission objective for this new generation of satellites is the detailed monitoring of the spatial and temporal distribution of emissions. Apart from NO2, these instruments, including TROPOMI, measure a number of key air pollutants, including CO (Borsdorff et al., 2018), HCHO (De Smedt et al., 2018), and SO2 (Theys et al., 2017). In the past few decades, satellite NO2 observations have been compared with global (e.g., Noije et al., 2006) and regional models (e.g., Huijnen et al., 2010a). Because of their high resolution, this new generation of satellite instruments, like TROPOMI, provides enough detail to contribute to air pollution and emission monitoring at the regional and local scales.
The European Copernicus Atmosphere Monitoring Service (CAMS; https://atmosphere.copernicus.eu, last access: 20 May 2022), provides operational daily analyses, forecasts, and reanalyses of the atmospheric composition at the global and regional scale. CAMS makes direct use of satellite atmospheric composition observations (including reactive gases like ozone (Inness et al., 2019b), CO, and NO2, aerosol properties, and greenhouse gases), with a special focus on the Copernicus Sentinel satellites. Combining models and satellite data using advanced data assimilation techniques leads to daily analyses and reanalyses of concentrations and emissions, consistent with the observations in the literature (Inness et al., 2015, 2019a; Miyazaki et al., 2020a).
In 2020, the satellite observations of TROPOMI attracted massive attention, both in science and in the media. As a positive side effect of the lockdown measures worldwide, several sectors have experienced strong reductions in activity and emission levels (road traffic, air transport, and industry), which induced considerable decreases in the levels of certain pollutants over several regions of the globe (Gkatzelis et al., 2021). In some cases, these decreases were clearly observed from space (Bauwens et al., 2020; Ding et al., 2020; Sun et al., 2021; Stavrakou et al., 2021). Also, within CAMS, dedicated studies have been performed to investigate the emission (Guevara et al., 2021) and concentration (Barré et al., 2021) changes in Europe, accounting for the variability introduced by weather changes.
Satellite instruments like Ozone Monitoring Instrument (OMI) and TROPOMI have clearly demonstrated the capability to measure detailed NO2 distributions on a near-daily basis, but improving the quantitative aspects of the vertical column uncertainties remains a major challenge. The absolute vertical column amount is influenced by the assumed a priori profile shape, surface radiative properties, cloud aspects, free tropospheric NO2, and stratospheric NO2. All of these aspects need to be accounted for. In particular, the spatial resolution of the a priori is recognized as an important factor to improve the tropospheric column, and several groups have developed regional satellite data products for China, Europe, and the USA based on high-resolution regional air quality modeling systems (Lin et al., 2014; Liu et al., 2021; M. Liu et al., 2020; Zhou et al., 2009; McLinden et al., 2014; Griffin et al., 2019; Laughner et al., 2019).
The aim of this paper is to explore the different ways of making comparisons between TROPOMI observations and model results. We approach this from two different angles. First, we present a comparison between the CAMS regional ensemble and the TROPOMI NO2 observations for an extended measurement period (2018–2021), with a closer look at specific days and months. Second, we present a novel European TROPOMI level 2 (L2) NO2 product based on NO2 a priori profiles of the CAMS regional AQ analyses, which have a 10 times (or 100 times in terms of model cell area) better spatial resolution than the global TM5-MP model (Williams et al., 2017) which is used as a priori in the operational retrieval. This new European TROPOMI NO2 product is then validated against European surface remote sensing Multi-AXis Differential Optical Absorption Spectroscopy (MAX-DOAS) and Pandora instruments.
The TROPOspheric Monitoring Instrument (TROPOMI) is the single instrument payload on the Sentinel-5P satellite, which is one of the Sentinel instruments of the European Copernicus Program dedicated to monitoring atmospheric composition. TROPOMI is a spectrometer measuring in the UV, visible, near-infrared, and shortwave infrared, which allows the retrieval of a large number of trace gases and aerosol properties (Veefkind et al., 2012). The TROPOMI instrument is unique in several ways because it combines near-daily global coverage with a wide spectral range, footprints of 3.5×5.5 km2 at nadir (since 6 August 2019 and 3.5×7 km2 before that) and a very large signal-to-noise ratio. Because of the small footprints, TROPOMI is able to distinguish medium-sized pollution sources such as cities, powerplants, industrial complexes, major highways, individual fires, and even individual large ships (Goldberg et al., 2019; Miyazaki et al., 2020b; F. Liu et al., 2020; Georgoulias et al., 2020).
The operational TROPOMI NO2 product is described in van Geffen et al. (2020), which focuses on the DOAS slant column retrieval, van Geffen et al. (2022), which describes the tropospheric vertical column retrieval and air mass factor aspects up to processor version 1.4.0, van Geffen et al. (2022), which discusses the upgrade to version 2.2.0 on July 2021, and Riess et al. (2022), which discusses the improvement in the cloud pressure product and how that improves NO2 air mass factors and retrievals. Users of the data are advised to first consult the product README file (PRF; Eskes and Eichmann, 2021) which provides a short introduction to the processor versions, data quality remarks, algorithm changes, and links to the relevant documentation and routine validation. The product user manual (PUM; Eskes et al., 2022) describes the content and use of the L2 data files. The Algorithm Theoretical Basis Document (ATBD; van Geffen et al., 2021) provides a detailed description of the implementation of the NO2 retrieval.
As explained in the ATBD and in van Geffen et al. (2022), the NO2 retrieval consists of three steps, namely spectral fitting, estimation of the stratospheric column, and computation of the tropospheric air mass factor. Integrated in the retrieval are daily forecast and analysis runs with the global TM5-MP (Huijnen et al., 2010b; Williams et al., 2017) chemistry transport model. The second step involves an assimilation of the total columns of TROPOMI in TM5-MP to force the modeled characteristics of the stratosphere to be consistent with TROPOMI. The assimilation is set up in such a way that the forcing happens predominantly in regions with low boundary-layer pollution levels (ocean and remote land regions). In the third step, use is made of space–time co-located TM5-MP NO2 tropospheric profiles to compute the tropospheric column. It is relevant to note that the assimilation step does not distinguish between spread-out free-tropospheric background NO2 and stratospheric NO2, and a possible free-tropospheric bias in TM5-MP will translate to a background bias in the retrieval of the tropospheric column (Dirksen et al., 2011). Unfortunately, there is very little in situ observational (aircraft) data to validate the free troposphere, which is one relevant aspect for which the retrieval may be improved.
For this work, we have processed the full TROPOMI data record up to March 2021, based on the following versions of the processor (i.e., retrieval algorithm; see also the PRF): the reprocessing dataset v1.2.2 from 30 April 2018 to 17 October 2018, the offline v1.2.0 from 17 October 2018 to 28 November 2018, the offline v1.2.2 from 28 November 2018 to 20 March 2019, v1.3.x from 20 March 2019 to 29 November 2020, and v1.4.0 from 29 November 2020 until March 2021, inclusive. The changes introduced from processor v1.2.0 to v1.3.2 are relatively minor and do not have a large impact on NO2.
Therefore, we consider the time series from April 2018 to October 2020 as being rather stable. The upgrade to version 1.4.0 on 29 November 2020 (for the offline product) brought only one change, namely an update of the FRESCO cloud retrieval, which led to an overall decrease in the effective cloud pressure of about 5 %. Because of the large sensitivity of the NO2 retrieval to this quantity, this resulted in a considerable change and general increase in NO2 in the more polluted regions (van Geffen et al., 2022; Riess et al., 2022). The datasets were filtered with the “qa_value” quality parameter provided in the data product, and only observations with a qa_value >0.75 were kept to produce the results described below. This filtering choice can be seen as a cloud mask, since it removes the cloud-covered scenes (with a cloud radiance fraction >0.5) and some more uncertain retrievals.
The TROPOMI mission includes a routine validation effort (http://mpc-vdaf.tropomi.eu, last access: 20 May 2022) with 3-monthly updates of the validation report for the operational products (Lambert et al., 2021). The main results of the validation against MAX-DOAS, Pandora, and Système D'Analyse par Observations Zénithales (SAOZ) instruments is summarised in Verhoelst et al. (2021), although the averaging kernel is not used in that work. For versions 1.2.x and 1.3.x, Lambert et al. (2021) find a negative bias against surface-based remote sensing observations of the tropospheric column of −34 % on average against MAX-DOAS and −24 % against Pandora total column observations in polluted regions. Note that especially the MAX-DOAS comparisons are sensitive to the NO2 vertical profile, and improvements in the comparison by up to 20 % are reported when Sentinel-5P averaging kernels are used (Lambert et al., 2021). Comparing TROPOMI versions 1.2.x and 1.3.x with the OMI QA4ECV retrieval product (Boersma et al., 2018) showed also that TROPOMI retrievals were lower than OMI, especially over polluted regions (with large aerosol concentrations) and especially in winter (Lambert et al., 2021). In Europe, TROPOMI NO2 from versions 1.2.x and 1.3.x are about 3 %–20 % lower than OMI-QA4ECV in winter, but the products are highly correlated (Lambert et al., 2021). These differences between OMI and TROPOMI are largely attributed to differences in the cloud pressure retrievals and thus, with version 1.4.0, the two products were much more consistent, with the regional monthly mean observations agreeing to within 10 %, and with version 2.2.0 agreeing to within 5 % for the European region (Lambert et al., 2021).
To summarize, a negative bias in tropospheric NO2 of the order of −30 % has been found in ground-based column observations in polluted regions, which is largely attributed to systematic errors in the profile shapes, the retrieved cloud pressure, and surface albedo used. Cloud-related biases in versions 1.2.x and 1.3.x seem to show a strong seasonality, from around −20 % in Europe in winter, to only small impacts in summer. With version 1.4.0, we observe an increase in tropospheric NO2 columns of around 20 % in winter over Europe and with version 2.2 between 10 % and 40 % (van Geffen et al., 2022).
The Copernicus Atmosphere Monitoring Service (CAMS) is one of the six thematic services of the flagship European space program of Copernicus. CAMS was built to provide the capacity to continuously monitor the composition of Earth's atmosphere at global and regional scales (Hollingsworth et al., 2008; http://atmosphere.copernicus.eu, last access: 20 May 2022).
Flemming et al. (2015)Marécal et al. (2015)Menut et al. (2013)Brandt et al. (2012)Simpson et al. (2012)Memmesheimer et al. (2004)Kaminski et al. (2008)Robertson et al. (1999)Guth et al. (2016)Manders et al. (2017)Sofiev et al. (2015)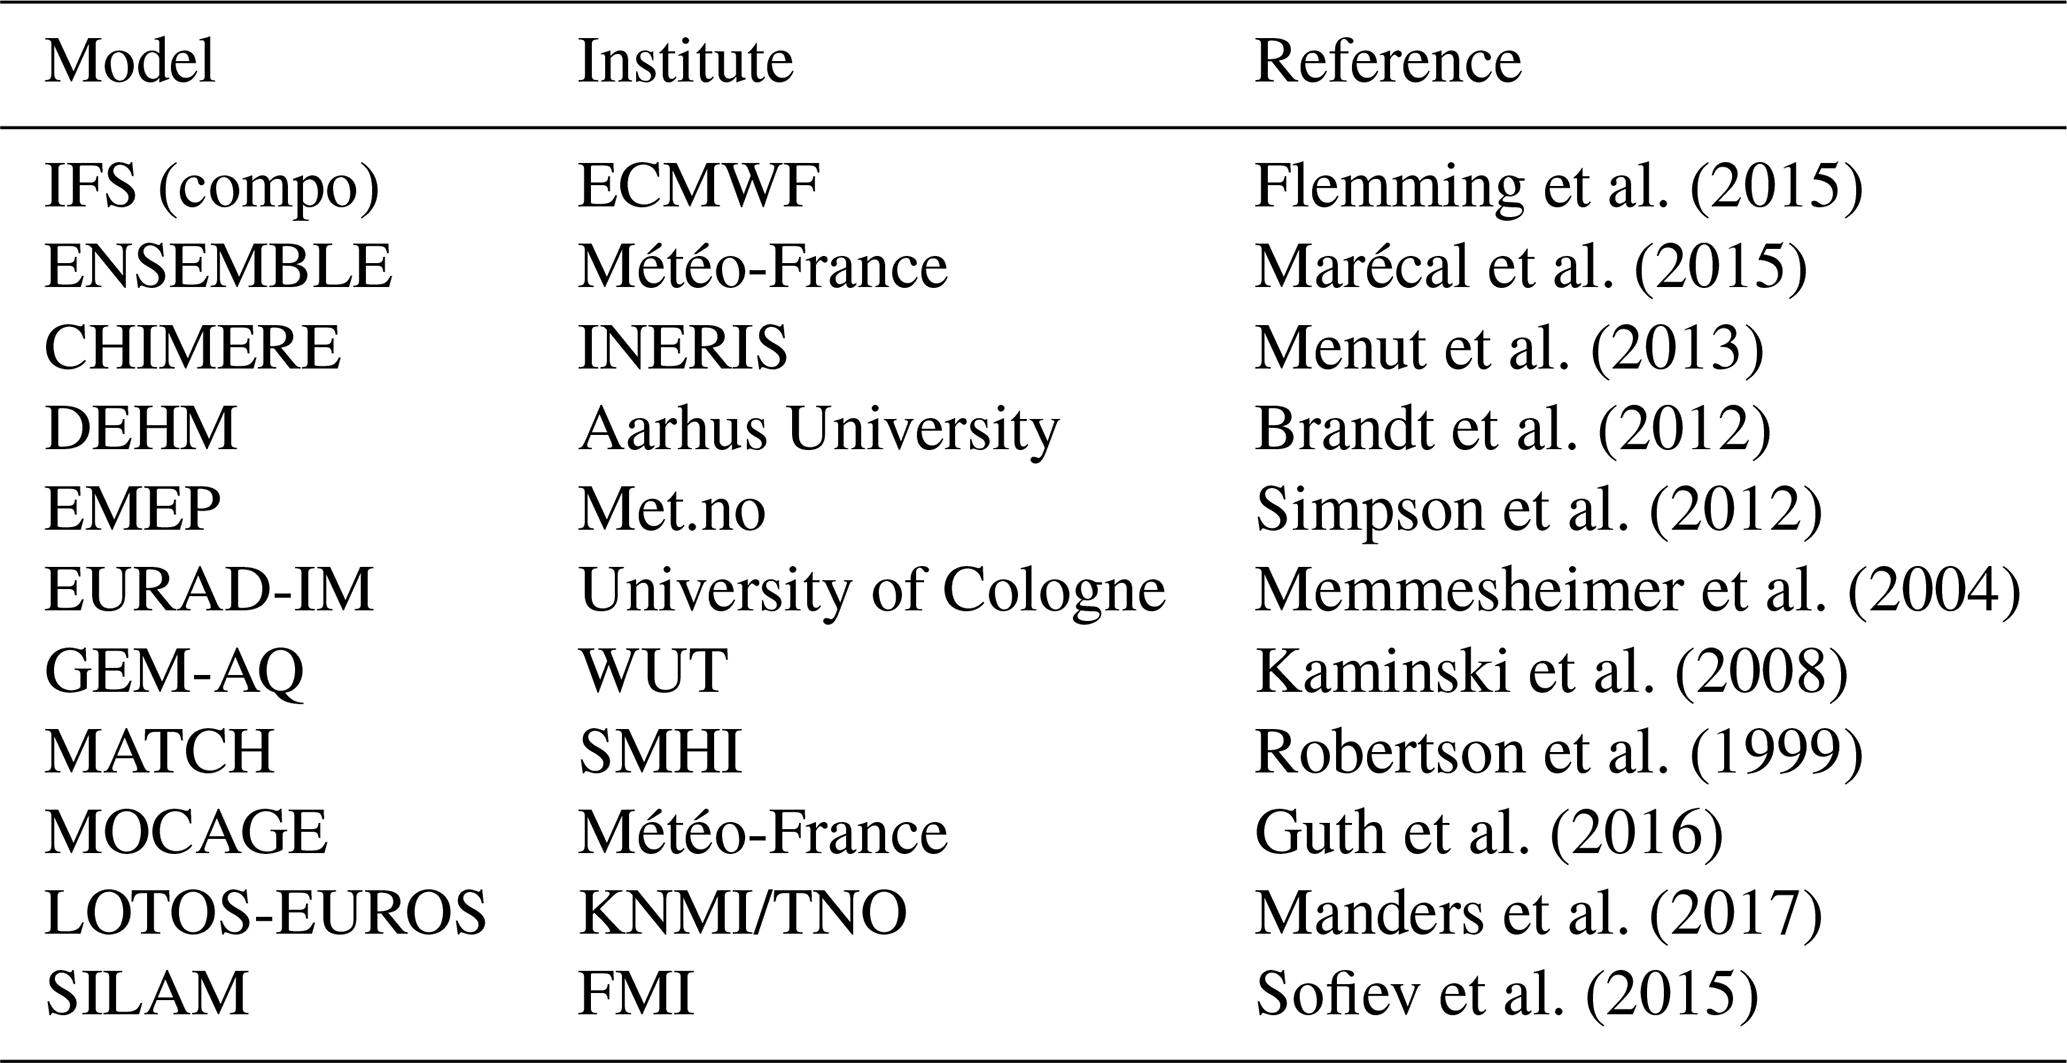
CAMS is comprised of two distinct atmospheric composition components for the global and regional scales. A global forecast system is used to produce operational daily forecasts of reactive gases, aerosols, and greenhouse gases across the globe at a resolution of about 40 km. This is based on the European Centre for Medium-Range Weather Forecasts (ECMWF) Integrated Forecasting System (IFS), forming the compo (which stands for composition) configuration of the system, which integrates online a representation of the relevant physicochemical processes. Analyses, based on the assimilation of satellite observations of atmospheric composition and the subsequent forecasts, are produced twice a day (Flemming et al., 2015; Eskes et al., 2015; Huijnen et al., 2019). ECMWF's 4-D data assimilation system for aerosol and reactive gases is described in Inness et al. (2015, 2019a). For NO2, the CAMS global system assimilates a number of satellite retrievals, including GOME-2 and OMI (see https://confluence.ecmwf.int/display/CKB/CAMS%3A+ Global+atmospheric+composition+forecast+data+ documentation#CAMS:Globalatmosphericcompositionfore castdatadocumentation-Satelliteobservations, last access: 20 May 2022). The TROPOMI NO2 data assimilation became operational in October 2021.
The CAMS regional production system for the European domain is operated by Météo-France (Marécal et al., 2015) and provides daily 4 d forecasts and analyses, for the day before, of the main air pollutants and pollen species from seven (9 from October 2019 to May 2022 and 11 since May 2022) state-of-the-art European regional atmospheric chemistry models (see https://atmosphere.copernicus.eu/regional-air-quality-production-systems, last access: 20 May 2022). An ensemble product (henceforth, ENSEMBLE, which is used extensively in this paper) is calculated from the regional model outputs and is currently the median of all individual models, but new ensemble processing methodologies have been tested and will replace the current one and become operationally available in 2022.
Both the 4 d forecasts and daily analyses for the previous day are made available in an hourly temporal resolution and a spatial resolution of 0.1∘ up to 5 km above the surface (at 0, 50, 250, 500, 1000, 2000, 3000, and 5000 m above the surface). The ENSEMBLE up until October 2019 was calculated using the following seven regional models: CHIMERE, EMEP, EURAD-IM, LOTOS-EUROS, MATCH, MOCAGE, and SILAM. Since then, DEHM and GEM-AQ have also been used (Table 1). All regional model data, plus the ENSEMBLE, are provided on a European domain of 25∘ W–45∘ E, 30–70∘ N, up until 12 June 2019, when the northern boundary was extended to 72∘ N, with a horizontal resolution of 0.1∘ × 0.1∘. Anthropogenic emissions used are the TNO MACC-III (Kuenen et al., 2014) and CAMS-REG_AP/GHG (Granier et al., 2019) emission inventories over Europe. Successive improved versions of the latter have been used over the years.
All models are driven by the operational IFS meteorological forecasts (HIGHRES), which have a horizontal resolution of about 9 km and use the gas and aerosol concentrations from CAMS global as lateral boundary conditions, which are intended to make the regional model output consistent with the global model output (Douros et al., 2020). Any differences between individual models may thus be attributed to different representations of the physical and dynamical atmospheric processes, chemistry and aerosol dynamics, or the natural emissions inside the domain. Moreover, regional models are updated generally once per year, all at the same time. This allows for models to keep up to date, very much like it is done for Numerical Weather Prediction. A drawback of this practice is that it introduces slight discontinuities that are not connected with changes in weather or emissions.
The evaluation of the regional services is based on the routine European AQ surface observations, operated by the individual countries and collected by the European Environmental Agency (EEA; e.g., https://regional.atmosphere.copernicus.eu/evaluation.php?interactive=cdf, last access: 20 May 2022). Apart from this, CAMS also has a dedicated validation activity for concentrations above the surface (Douros et al., 2020). This activity includes also a comparison with satellite NO2 and MAX-DOAS remote sensing observations (Blechschmidt et al., 2018). An early comparison of the CAMS ENSEMBLE with OMI tropospheric columns is discussed in Huijnen et al. (2010a).
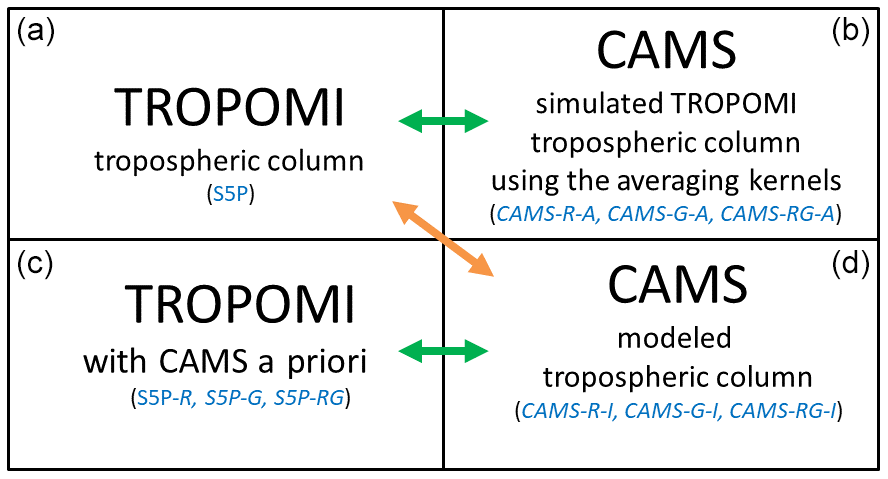
Figure 1The three ways of comparing the CAMS NO2 forecasts with TROPOMI. In the top row, the TROPOMI tropospheric retrieval (a) is compared with the CAMS profiles multiplied by the kernels (b). In the bottom row, the CAMS profile is used a priori in the TROPOMI retrieval (c), and this is compared with the CAMS vertical column (d). The third option is a direct comparison of the TROPOMI and CAMS tropospheric columns (a, c), but this is suboptimal, since it depends on the TROPOMI a priori. The meaning of all acronyms in blue is described in Sect. 4.1.
4.1 Three approaches to compare model and satellite observations
NO2 total column retrievals are implicitly dependent on an a priori tracer profile. The retrieval algorithm accounts for the fact that the sensitivity of the instrument is different at different altitudes i.e., the sensitivity is higher in the free troposphere and lower in the boundary layer. This information is encoded in the averaging kernel which is proportional to the measurement sensitivity and depends on the viewing geometry, cloud properties, aerosols, and surface albedo (Eskes and Boersma, 2003).
Based on these considerations, several possible approaches of comparing model output and satellite observations exist, which are presented in Fig. 1. Figure 1a indicates the standard TROPOMI retrieval, as provided in the TROPOMI L2 data files, henceforth denoted as S5P. As explained in the TROPOMI PUM (Eskes et al., 2022), the a priori profiles xtm5 in the retrieval may be replaced by any other model NO2 profile information xmodel, which is, in our case, CAMS or xcams, resulting in a new retrieved tropospheric NO2 column Vtrop,cams (Fig. 1c). The method makes use of the tropospheric averaging kernel Atrop and the air mass factors M provided by the TROPOMI L2 data files, as follows (Eskes et al., 2022):
Here, M(xtm5) is the tropospheric air mass factor provided in the TROPOMI product, depending on the TM5-MP a priori profile xtm5, and M′(xcams) is a new air mass factor computed with the alternative model profile xcams. The summation over l is over the tropospheric model levels.
The tropospheric averaging kernel vector Atrop of the TROPOMI product is obtained by scaling the total averaging kernel by , where M is the total air mass factor, and Mtrop is the tropospheric air mass factor (Eskes et al., 2022). All elements of the kernel are set to zero above the tropopause layer , or,
All the above quantities are provided in the TROPOMI product.
We therefore also discuss three distinct ways of recomputing the TROPOMI tropospheric column using CAMS NO2 profiles by using the profile solely from the regional ensemble of CAMS, solely from the global CAMS NO2 model, or the combined global–regional profile using IFS (compo) above 3 km altitude and CAMS–regional below. These alternative TROPOMI products are indicated by the acronyms S5P-R (R as in regional), S5P-G (G as in global) and S5P-RG (RG as in regional–global), respectively (Fig. 1c). Please note that all references to CAMS–regional in this section or the following sections can refer to either the ENSEMBLE or individual regional models and should be clearly indicated in each case. The same goes for derived columns containing the “-R” suffix, which indicates the use of either the ENSEMBLE or individual models.
The CAMS model simulation of the measured NO2 column, denoted as CA in Eq. (3), is obtained by multiplying the CAMS model partial column profile xcams with the tropospheric averaging kernel Atrop, or
This equation requires a vertical interpolation between the levels for which the model data are available and the TROPOMI data product levels (in which the averaging kernel is defined), which should ideally conserve the total column amount. As above, we distinguish three different CAMS profiles; so CAMS-A can be CAMS-R-A, CAMS-G-A, or CAMS-RG-A ( Fig. 1b).
A direct comparison of the NO2 tropospheric column as provided in the TROPOMI product (S5P) and a model-generated column would introduce extra uncertainties and biases, as the TROPOMI tropospheric columns depend on the retrieval a priori and therefore on the quality of the TM5-MP profiles used. This comparison approach is depicted in Fig. 1 with an orange arrow. The most common approach for comparing models and satellite retrievals is the comparison of the two upper boxes of Fig. 1 (upper green arrow). As explained in Eskes and Boersma (2003), the relative comparison becomes independent of the a priori profile shape of the TM5-MP model used in the S5P retrieval.
An equally valid comparison approach is the replacement of the a priori profile used in the retrieval by the air quality model a priori and subsequent direct comparison with the modeled tropospheric column (lower green arrow in Fig. 1). In this way, any relative comparison also becomes independent of the a priori profile shape from the TM5-MP model, since this is removed from the retrieval product. The vertical model column can be seen as a multiplication with the identity matrix I. Hence, the notation CAMS-R-I, CAMS-G-I, or CAMS-RG-I is used for this modeled vertical tropospheric column (Fig. 1d).
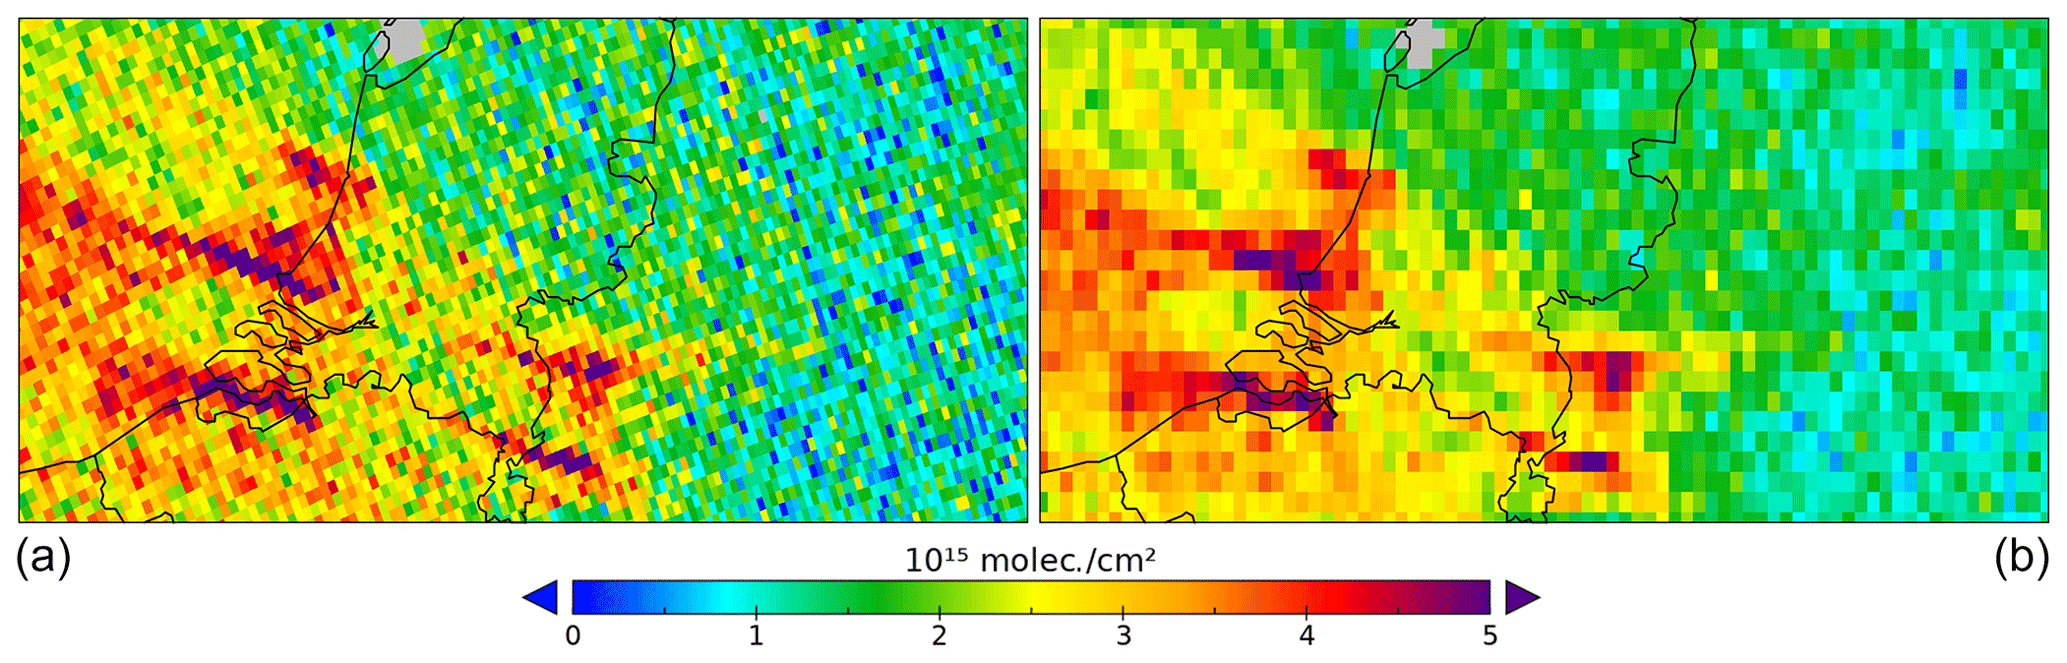
Figure 2TROPOMI retrieval field of orbit 3704 (one of the orbits on 1 July 2018), plotted on the native grid (a) for the Netherlands area, compared to the regridded field in the CAMS regional grid (0.1∘ × 0.1∘ resolution) for the same retrieval (b).
4.2 Implementation of the comparisons
Proper temporal and spatial sampling of the satellite observations and model output fields is essential in order to minimize representativity errors during the comparison. To this end, all available data were regridded to the CAMS regional grid (see Sect. 3). In this process, source grids were either the TROPOMI footprint (i.e., the native grid of TROPOMI, which is different for each orbit), the IFS (compo) grid, or the TM5-MP grid. See Table 2 for the characteristics of each of those grids.
Horizontal regridding is performed by means of an area-weighted average of source cells that correspond to target (i.e., CAMS–regional) cells. For example, a target grid cell o containing retrieval columns will acquire the value , where weights wi are given by the retrieval column pixel area. In the case of regridded TROPOMI observations, these may be called superobservations, as typically about three TROPOMI observations are averaged to construct one observation for a CAMS grid cell.
Moreover, to minimize spatial representativeness errors, we imposed an additional constraint regarding the satellite data, i.e., a value for a target grid cell was calculated and assigned only if the coverage of valid source data for this cell were above 50 %. This is on top of the filtering based on the quality assurance parameter qa_value >0.75, following the suggestion of the TROPOMI PUM (Eskes et al., 2022). This area-weighted regridding of a single TROPOMI orbit to the target grid can be seen in Fig. 2. Intensive variables (temperatures, pressures, averaging kernels, tropopause layer index, etc.) are interpolated horizontally using bilinear regridding. Modeled fields were sampled in time at the satellite overpass time over central Europe using the closest available time, based on the temporal resolution of each data source (see Table 2).
Table 2Input data characteristics.
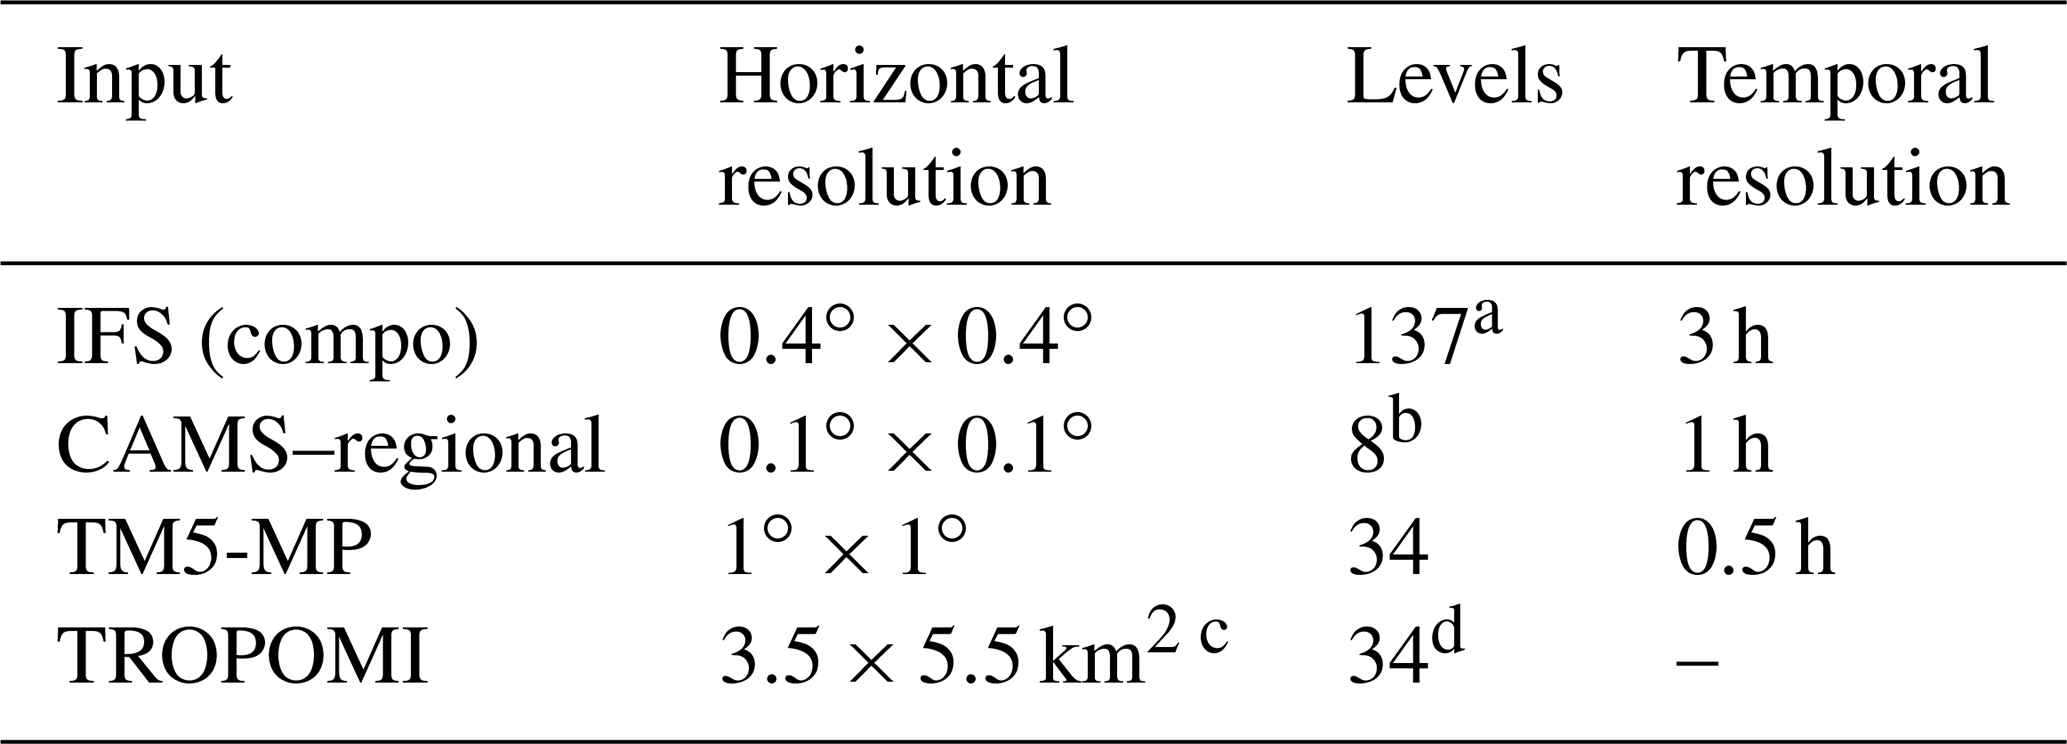
a There were 60 levels before 10 July 2019. b Number of sampling altitudes. Individual models and the ENSEMBLE data have the exact same characteristics. c Horizontal resolution at nadir and 3.5×7 km2 before 6 August 2019. d Levels of the averaging kernels.
In the vertical, the approach followed was to transform all available data in the TM5-MP vertical levels, i.e., the levels of the TROPOMI product averaging kernel. So, CAMS regional model data were linearly interpolated to the TM5-MP levels from the eight sampling altitudes (Table 2), while, for the global model where data were available in the native model levels, data were interpolated in mass conservative fashion.
All integrations to columns were performed on the TM5-MP vertical levels, and we consider the three possible options mentioned in Sect. 4.1. The first one is taking into account only the CAMS–regional ENSEMBLE (or, for that matter, any individual regional model) for reconstructing the column. In this case, the last TM5-MP level considered was the one which lies just below 5000 m above the surface, which means that a large part of the free troposphere is not accounted for (concentration is assumed to be zero). The second option involves using only IFS (compo) data, where the last TM5-MP level considered is the one assigned to the tropopause, as provided in the form of the tropopause layer index in the TROPOMI product. Finally, we also consider a merger between CAMS–regional and IFS (compo) in the vertical, where we use the regional profile up to about 3000 m above the surface and complement it with IFS (compo) data up to the tropopause. All concentrations are converted to densities (molec. m−3) based on temperature profiles provided by TM5-MP (in the case of CAMS–regional data) and pressure profiles from either IFS (compo) or TM5-MP. Comparisons between CAMS and TROPOMI are presented for several regions, indicated in Fig. 3, and for major European cities using boxes of 7×5 (CAMS–regional) grid cells.
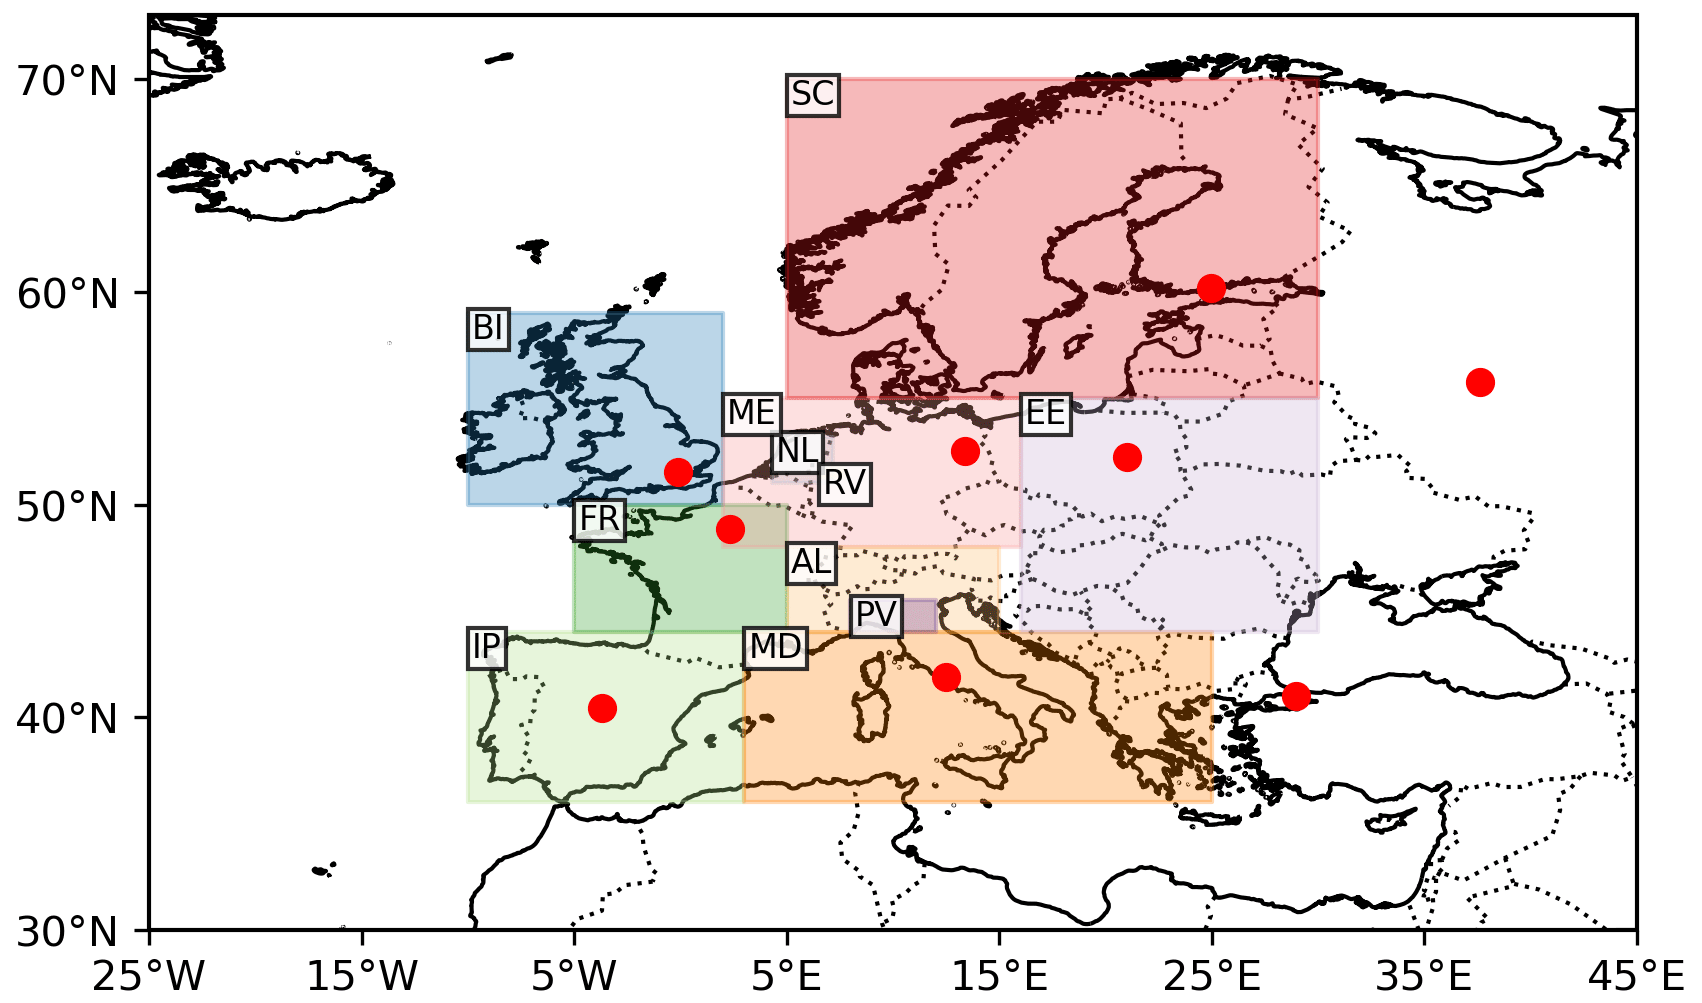
Figure 3Definition of the regions of interest for the calculation of column comparison statistics.
By averaging the regridded maps of all TROPOMI orbits and model data within a given period, we are able to perform comparisons of tropospheric columns for that period. Note that the maps presented in the figures in this section do not correspond to the whole CAMS regional domain of the target grid, but are magnified to a more central part of the European domain, and all figures include cells that contain valid TROPOMI observations, based on the criteria defined in Sect. 4.2. Moreover, regional modeled NO2 fields in this section originate from the first forecast day and the near-real-time (NRT) analyses for the day before.
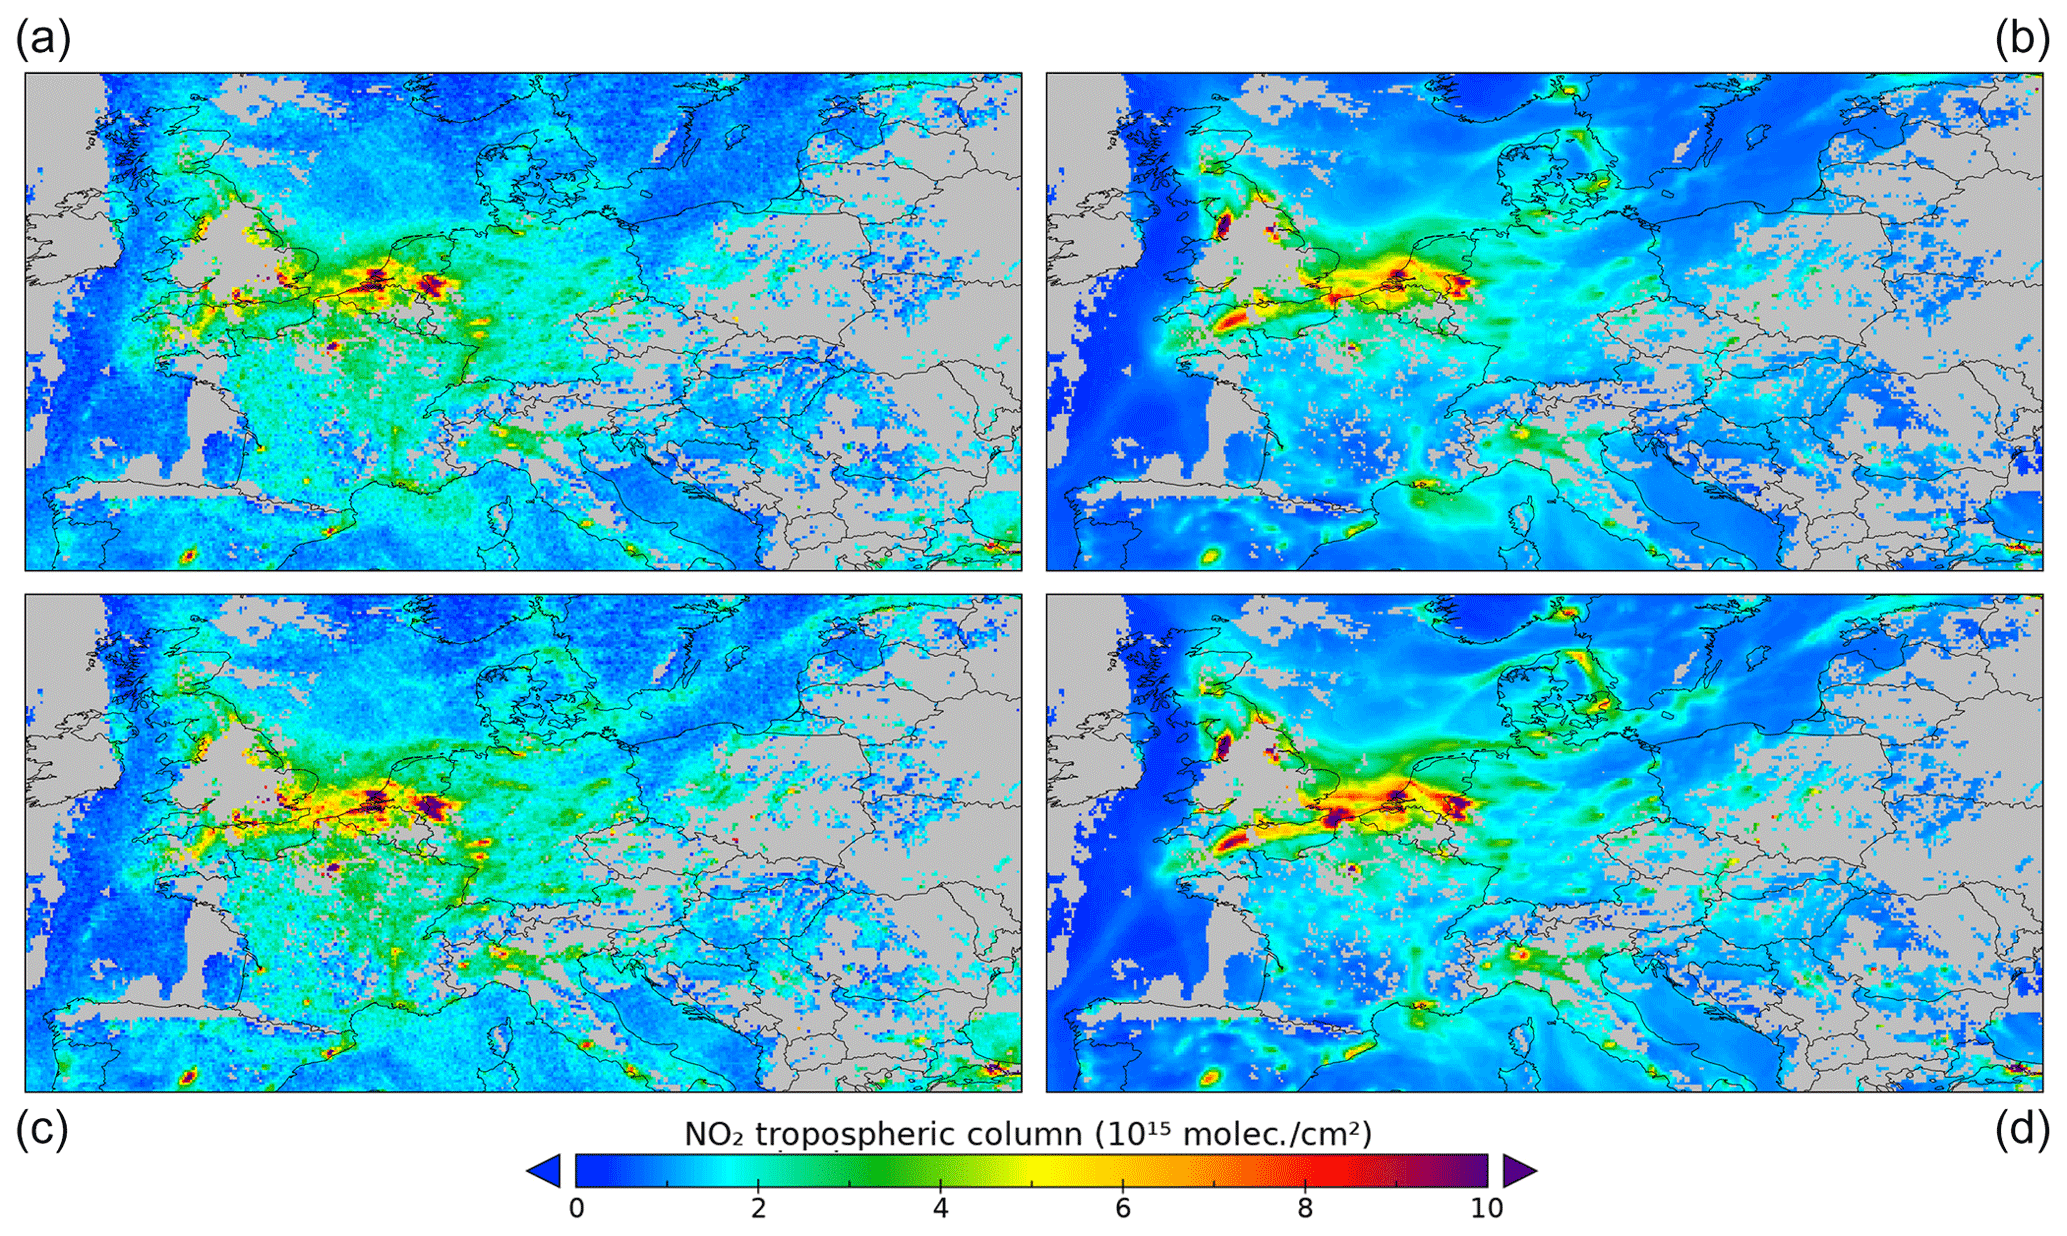
Figure 4Comparison of S5P (a), CAMS-RG-A (b), S5P-RG (c), and CAMS-RG-I (d) columns, based on the scheme of Fig. 1, for 26 July 2018.
5.1 Comparisons for individual days and monthly means
Maps of daily TROPOMI columns and CAMS model mean tropospheric NO2 columns using CAMS-RG are given in Figs. 4 and 5, for 26 July 2018 and 15 February 2019, respectively. Figure 4 follows the scheme of Fig. 1; thus, columns with S5P, CAMS-RG-A, S5P-RG, and CAMS-RG-I are presented, while in Fig. 5 only S5P-RG and CAMS-RG-I are shown. CAMS–regional data used in this section are the first day forecasts. Based on an inspection of those maps which are based on two largely cloud-free days over central Europe, we can already draw some important conclusions regarding how the two products compare. Most emission hotspots are clearly identifiable in both S5P- and CAMS-RG-based maps. This includes the large- and medium-sized cities and whole areas with increased pollution burden, as in the Po Valley or southwestern Germany. Advection characteristics also agree qualitatively, such as the strong transport of NO2 from England, the Netherlands, Belgium, and Germany to the North Sea on 15 February 2019 (Fig. 5). Differences, however, are seen in the quantitative details, with the model-based maps leading to longer and more pronounced plumes. This is quite evident in the case of the Liverpool (UK) and English Channel areas (26 July) and in the North Sea (15 February). Some hotspots seem to be absent altogether in the TROPOMI retrieval, for example, the powerplants in the Lusatia region in eastern Germany, possibly related to inaccurate assumptions in the emissions used in the CAMS models (e.g., differences in activity during the examined days or in the emission injection characteristics). Ship tracks can be seen in both TROPOMI and CAMS fields but are generally more prominent in the CAMS fields (e.g., in the Bay of Biscay or the North Sea). TROPOMI also seems to indicate higher background values in summer.
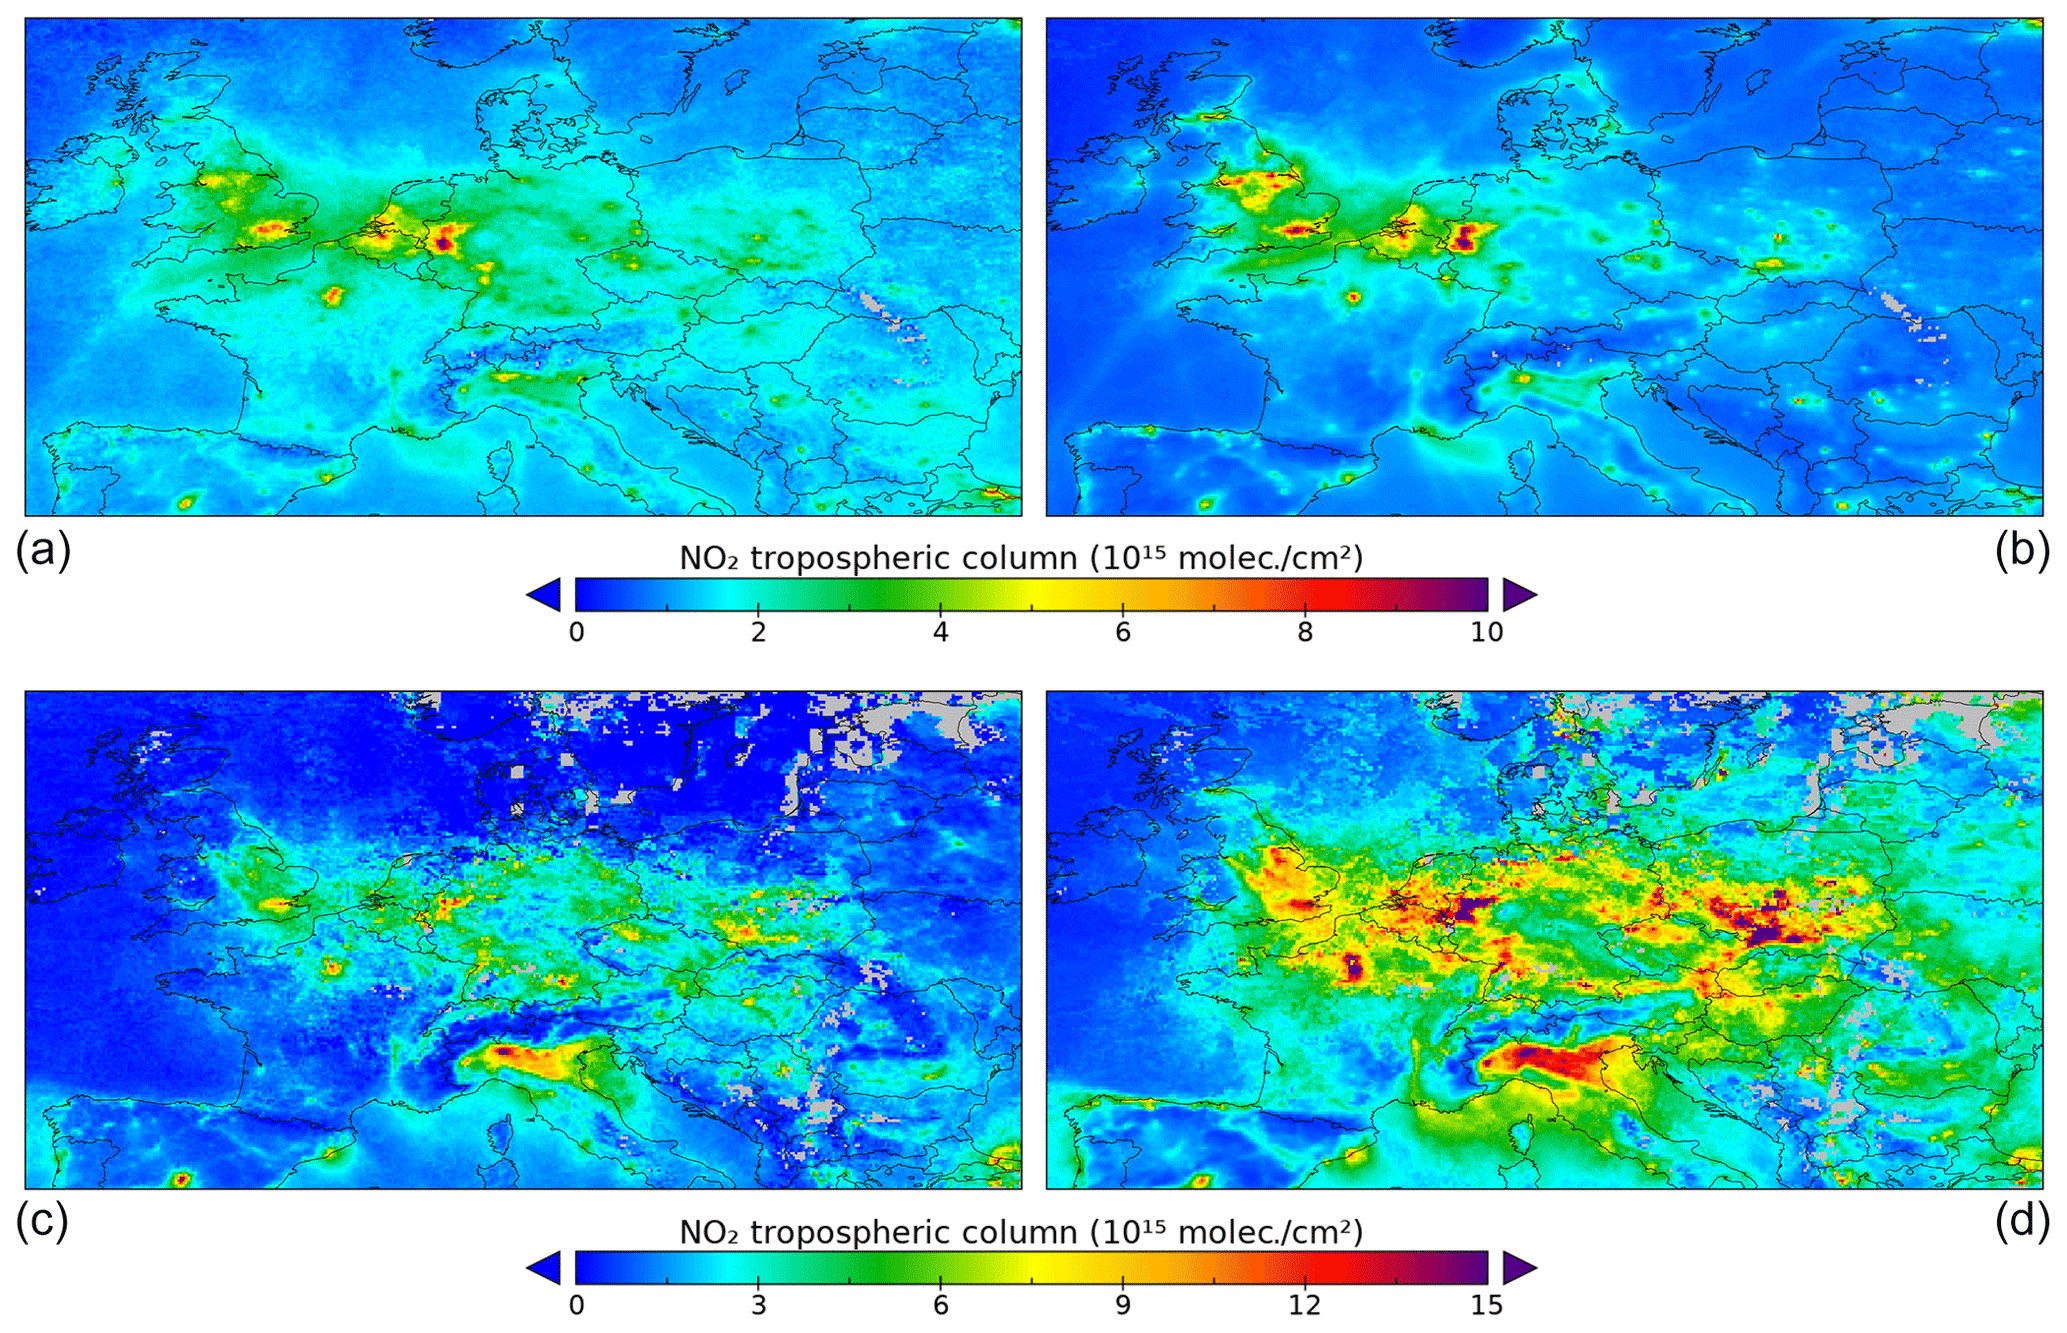
Figure 6Monthly averaged S5P and CAMS-RG-A columns for July 2018 (a, b) and January 2019 (c, d).
Monthly averages of regridded column fields offer wider spatial coverage and a qualitatively different view of the observed and modeled features. The maps in Fig. 6 present the comparison of the mean TROPOMI tropospheric NO2 columns S5P with CAMS-RG-A for the months of July 2018 and January 2019. Similar to the daily fields, CAMS–regional data in this section are also based on the first day of the 4 d forecasts. CAMS columns appear to be capturing the observed locations of high NO2 columns well over densely populated regions like the Benelux area, Po Valley, and other large European cities. For July, absolute values at the hotspots seem to be comparable, but background values are higher in the case of S5P. The situation is considerably different in January, where CAMS-RG-A columns are significantly higher over the hotspots. Naturally, these much higher values also seem to affect through advection rural land areas or even areas over the sea.
5.2 Time series
Figure 7 depicts the time series of monthly mean S5P and CAMS-RG-A vertical column densities for nine major European cities, while Fig. 8 shows the corresponding time series for the domains of Fig. 3 from May 2018 to March 2021. For this long time series, the CAMS–regional data utilized were the NRT analyses, as this is the regional product used in the European L2 TROPOMI product, as detailed in Sect. 6.
The spatial averaging required for the time series of the cities (Fig. 7) was performed for 7×5 cell domains (0.7∘ × 0.5∘) for all the cities, which corresponds to areas of roughly 70×50 km2 centered at the respective city centers. This comparison reveals remarkably similar values between the S5P and CAMS-RG-A columns for some of the cities in southern Europe (Madrid, Rome, and Istanbul), while discrepancies are larger in most of the rest, especially in the wintertime when CAMS-derived column densities almost always acquire higher values. The domain-averaged monthly mean time series of Fig. 8 present a similar picture, where comparison is much more favorable during the summertime, but the two column densities differ substantially during the wintertime in practically all of the examined domains.
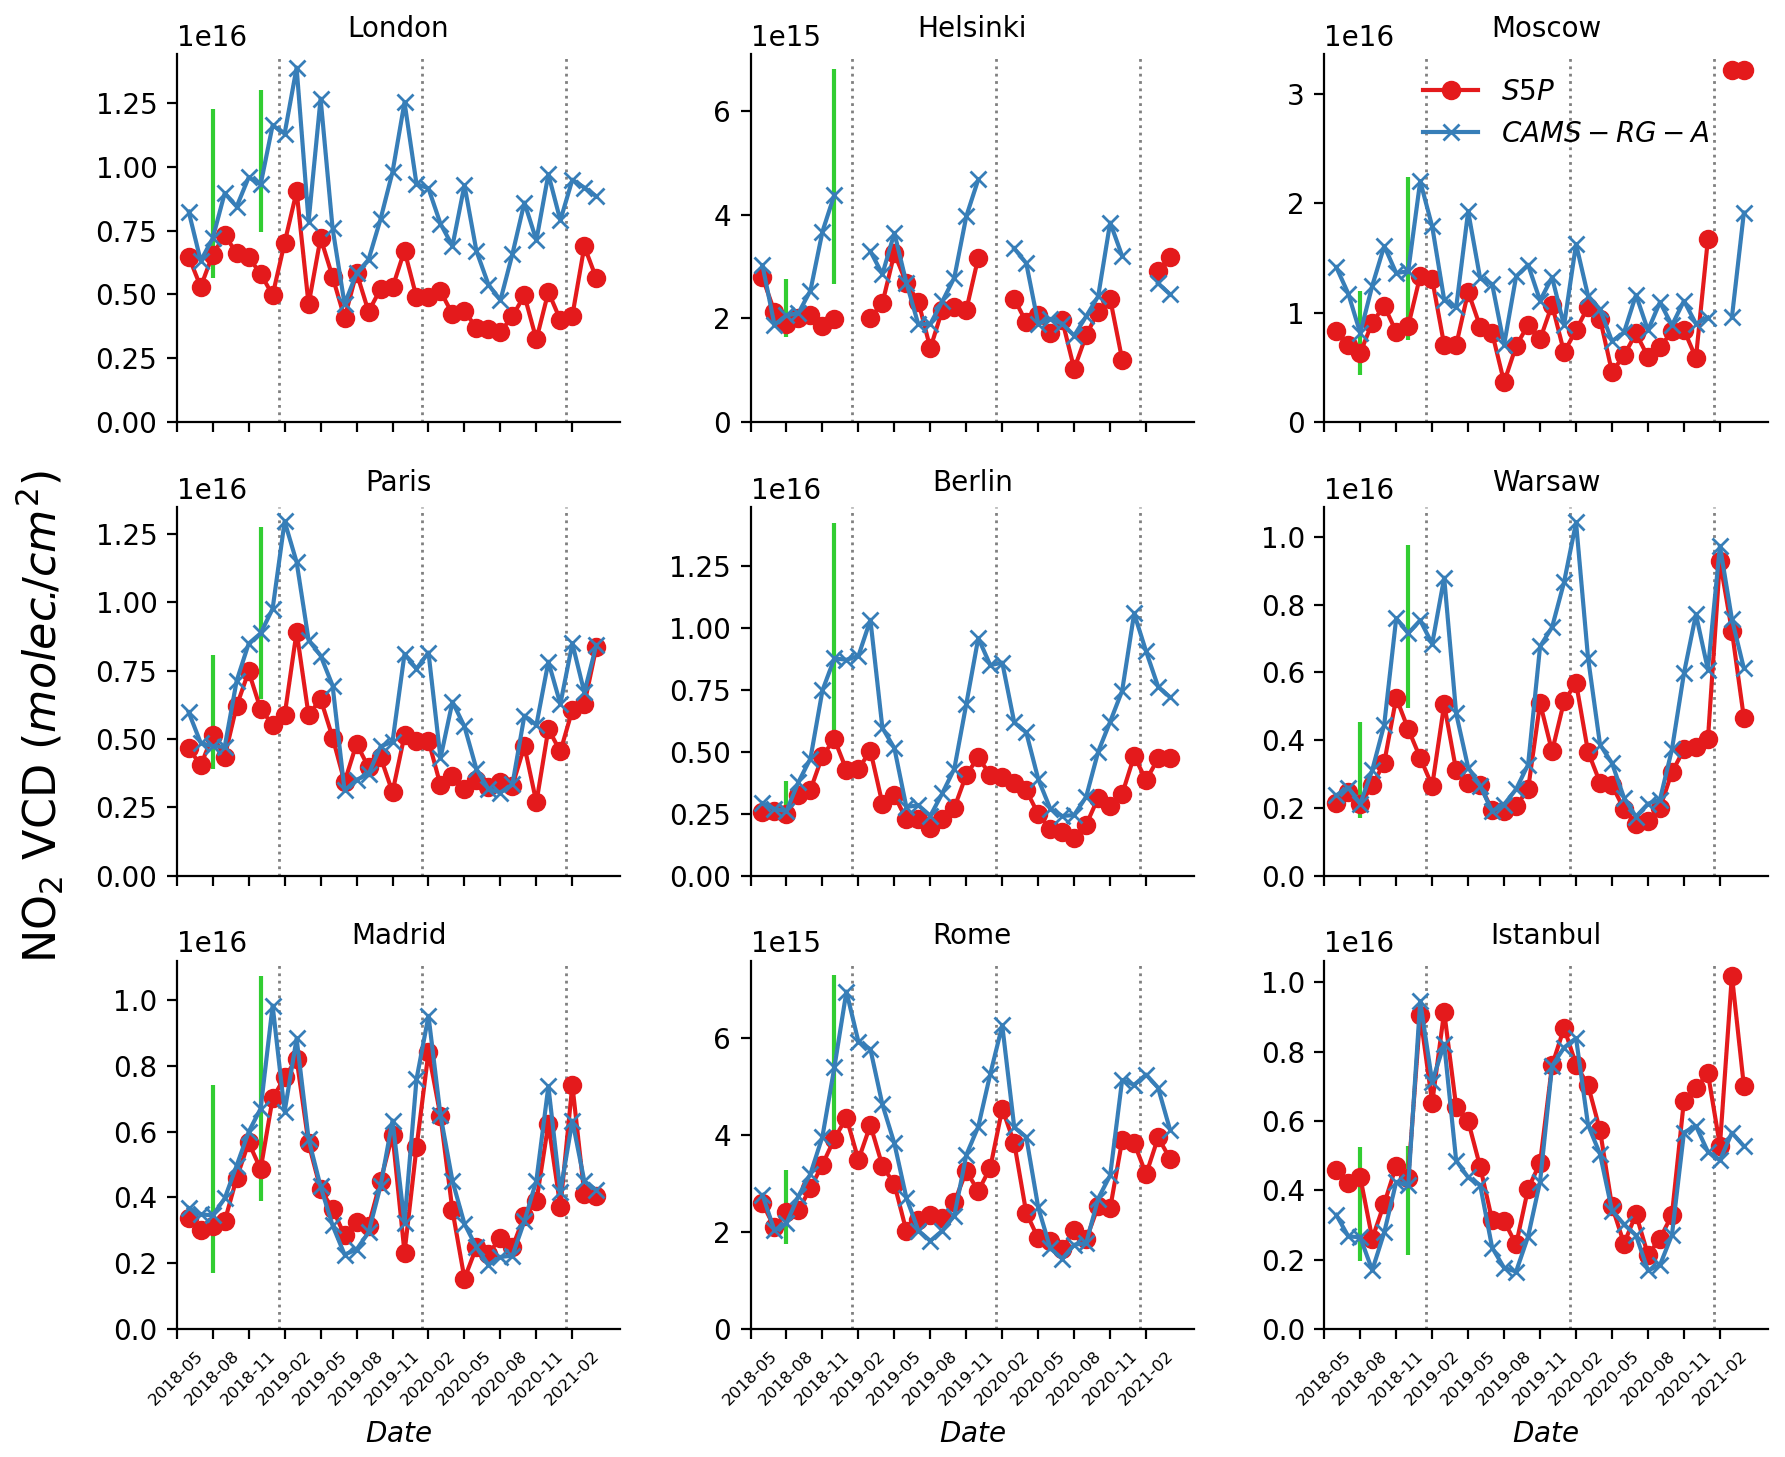
Figure 7Time series of monthly mean original TROPOMI columns (S5P; red) and the CAMS combined columns (CAMS-RG-A; blue), with averaging kernels applied for nine major European cities. The retrieval algorithm versions used are as described in Sect. 2. The panels are ordered according to the geographical location. Vertical axes are different for each city. Green vertical bars in July and November 2018 represent the model spread for those 2 months.
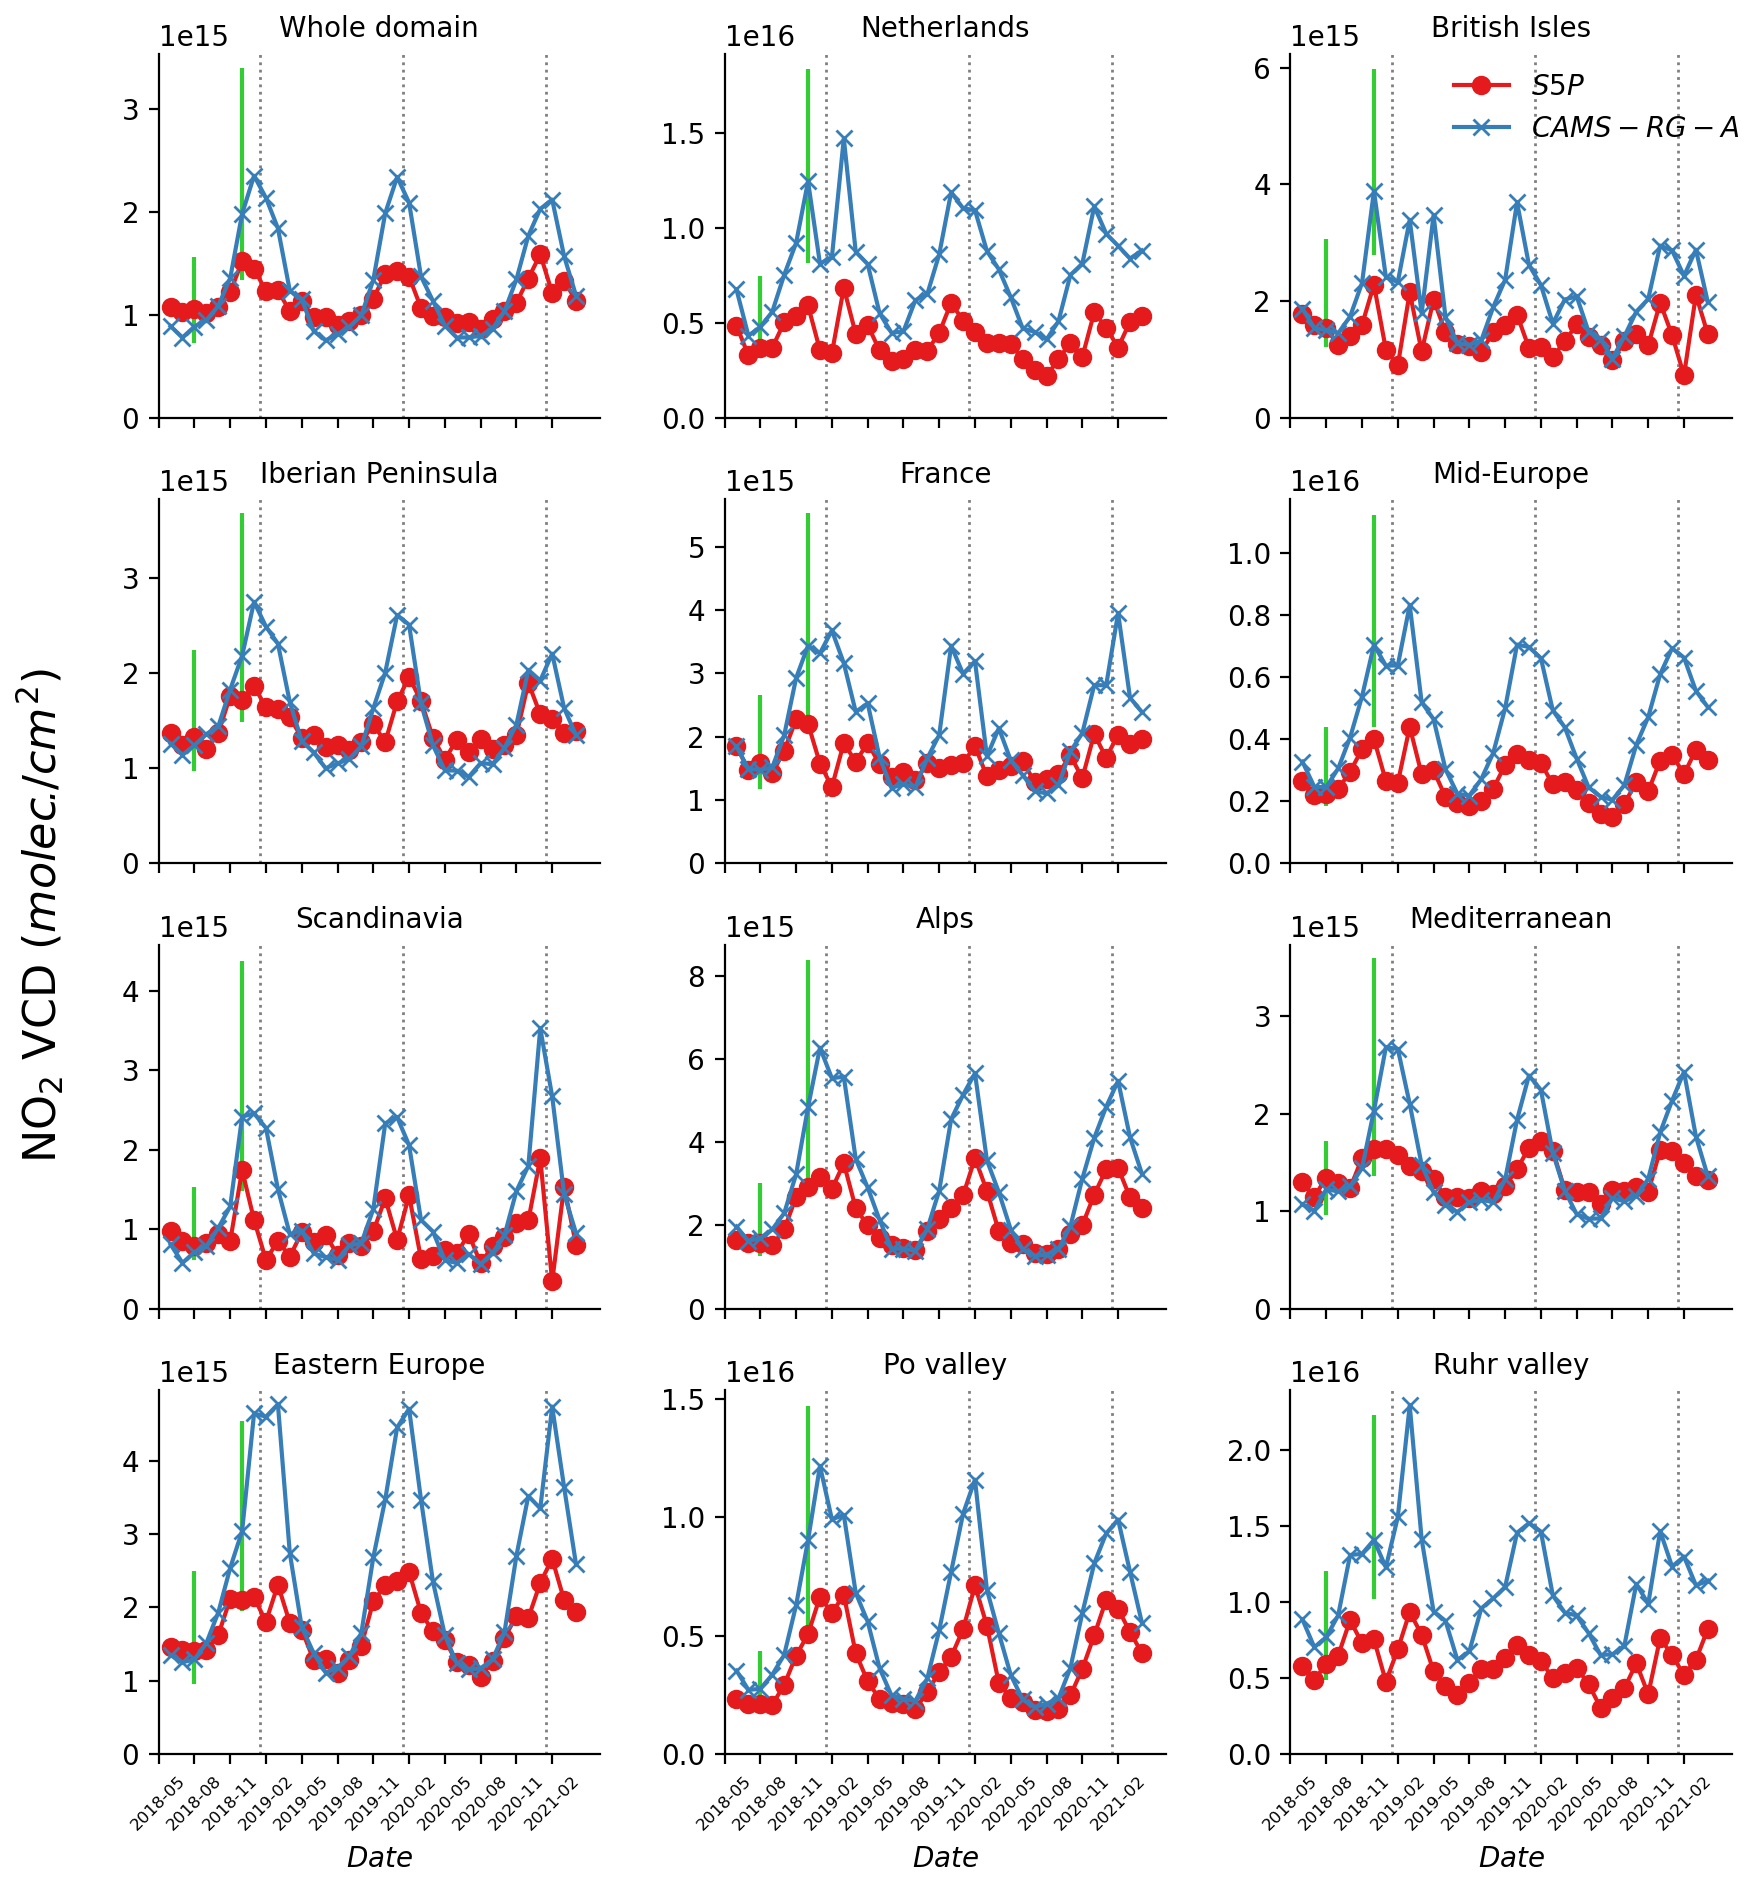
Figure 8Time series of the TROPOMI original columns (S5P; red) and the CAMS combined columns (CAMS-RG-A; blue), with averaging kernels applied for the domains as defined in Fig. 3. The retrieval algorithm versions used are as described in Sect. 2. Vertical axes are different for each domain. Green vertical bars in July and November 2018 represent the model spread for those 2 months.
5.3 Discussion of the CAMS-TROPOMI differences
The wintertime discrepancies identified in the previous sections may be due to uncertainties in both the satellite retrieval (Lorente et al., 2017) (see also Sect. 2) and chemical transport modeling. Note, however, that the January fields presented above (Sect. 5.1) are unavoidably based on a much fewer observations compared to the July ones due to increased cloud coverage, snow cover, and low solar zenith angles.
As mentioned before, TROPOMI validation indicates a negative bias in tropospheric NO2 in polluted regions. Part of this may be attributed to the (horizontal resolution of the) global TM5-MP a priori, but in our comparisons, the averaging kernels are accounted for, which removes this source of error. Furthermore, biases in versions 1.2.x and 1.3.x of the retrieval algorithm seem to show a seasonality compared to OMI, from around −20 % in Europe in winter to only small impacts in summer. With version 1.4.0, this difference largely disappears (van Geffen et al., 2022), especially due to increases in TROPOMI columns in wintertime. The large solar zenith angle in winter leads to small sensitivities near the surface, which will enhance potential biases. The presence of snow, on the other hand, will strongly enhance the sensitivity and may reduce retrieval errors. These considerations are broadly in line with the observed TROPOMI-CAMS differences, and it seems likely that part of the systematic seasonal effects is caused by retrieval uncertainties.
Modeling deficiencies can, on the other hand, be related to uncertainties in the input data (primarily, emissions) and also to the modeling of processes such as the injection of emissions into the atmosphere, especially from point sources, chemistry, vertical mixing, or advection. Past studies have indicated that total anthropogenic emissions in the TNO emissions inventory may be overestimated or not properly distributed in time. For example, Petetin et al. (2015) showed that anthropogenic NOx emissions in the TNO inventory, which is the basis for the MACC-III emissions inventory (used by the CAMS regional models before September 2018) and the CAMS-REG-AP v1.1 emissions inventory (September 2018 to June 2019), were overestimated for the Paris area. Moreover, MACC-III emissions were based on 2011 as a reference year, while CAMS-REG-AP v1.1 was based on 2015, which means that the downward trend in NOx emissions that prevailed during the preceding decade (e.g., Lorente et al., 2019; Zara et al., 2021) may not have been properly accounted for in the model simulations, leading to overestimations in NO2 concentrations. Biogenic soil NOx emissions are also known to be underestimated (Vinken et al., 2014; Visser et al., 2019), which can be one of the reasons behind the lower modeled background columns levels.
In the comparison between regional air quality models and OMI retrievals performed by Huijnen et al. (2010a), the seasonal cycle was found to be overestimated by the model simulations, which is in agreement with results by Blechschmidt et al. (2018) for MAX-DOAS locations in Bremen and Observatoire de Haute-Provence (OHP). However, in Huijnen et al. (2010a), there was a stronger discrepancy between columns from the regional model simulations and satellite retrievals during the summer, while the comparison was more favorable during winter, unlike in Blechschmidt et al. (2018) and the current work.
From a process-based modeling point of view, the discrepancy in question may indicate deficiencies in the treatment of wintertime chemistry. The NOx lifetime is much longer during winter because of the lower concentrations of OH and RO2 radicals which act as sinks for NO2. Thus, a possible underprediction of OH production, via the photolysis of O3 when less light is available, could lead to higher NO2 (Shah et al., 2020; Stavrakou et al., 2008). Difficulties in the description of wintertime chemistry may also be related to heterogeneous chemistry, as the conversion of N2O5 to aerosol is more sensitive and inherently more uncertain compared to summer conditions. In addition to these, even mild overpredictions of NOx emissions can, due to the longer NO2 lifetime, be amplified to produce a larger impact on tropospheric concentrations.
The treatment of vertical mixing can also affect the modeled NO2 vertical profile shape. Enhanced mixing will tend to lead to lower NO2 concentrations near the surface and a less steep vertical gradient in the boundary layer. The accurate prediction of the boundary layer development under the often stable wintertime conditions, let alone temperature inversions, is an outstanding challenge for atmospheric models. Under such conditions, turbulent diffusion will often be overestimated, subsequently leading to an overestimation of the boundary layer height (Sandu et al., 2013). This overestimation of vertical mixing has, in turn, been shown to lead to increases in the calculated vertical columns (Huijnen et al., 2010a). NOx lifetime also generally increases with height. Enhanced transport to higher altitudes will therefore lead to an increase in the column amounts for the same number of emissions. Similarly, the overestimation of injection heights from point sources may lead to higher concentrations aloft, leading to an overestimation of column amounts.
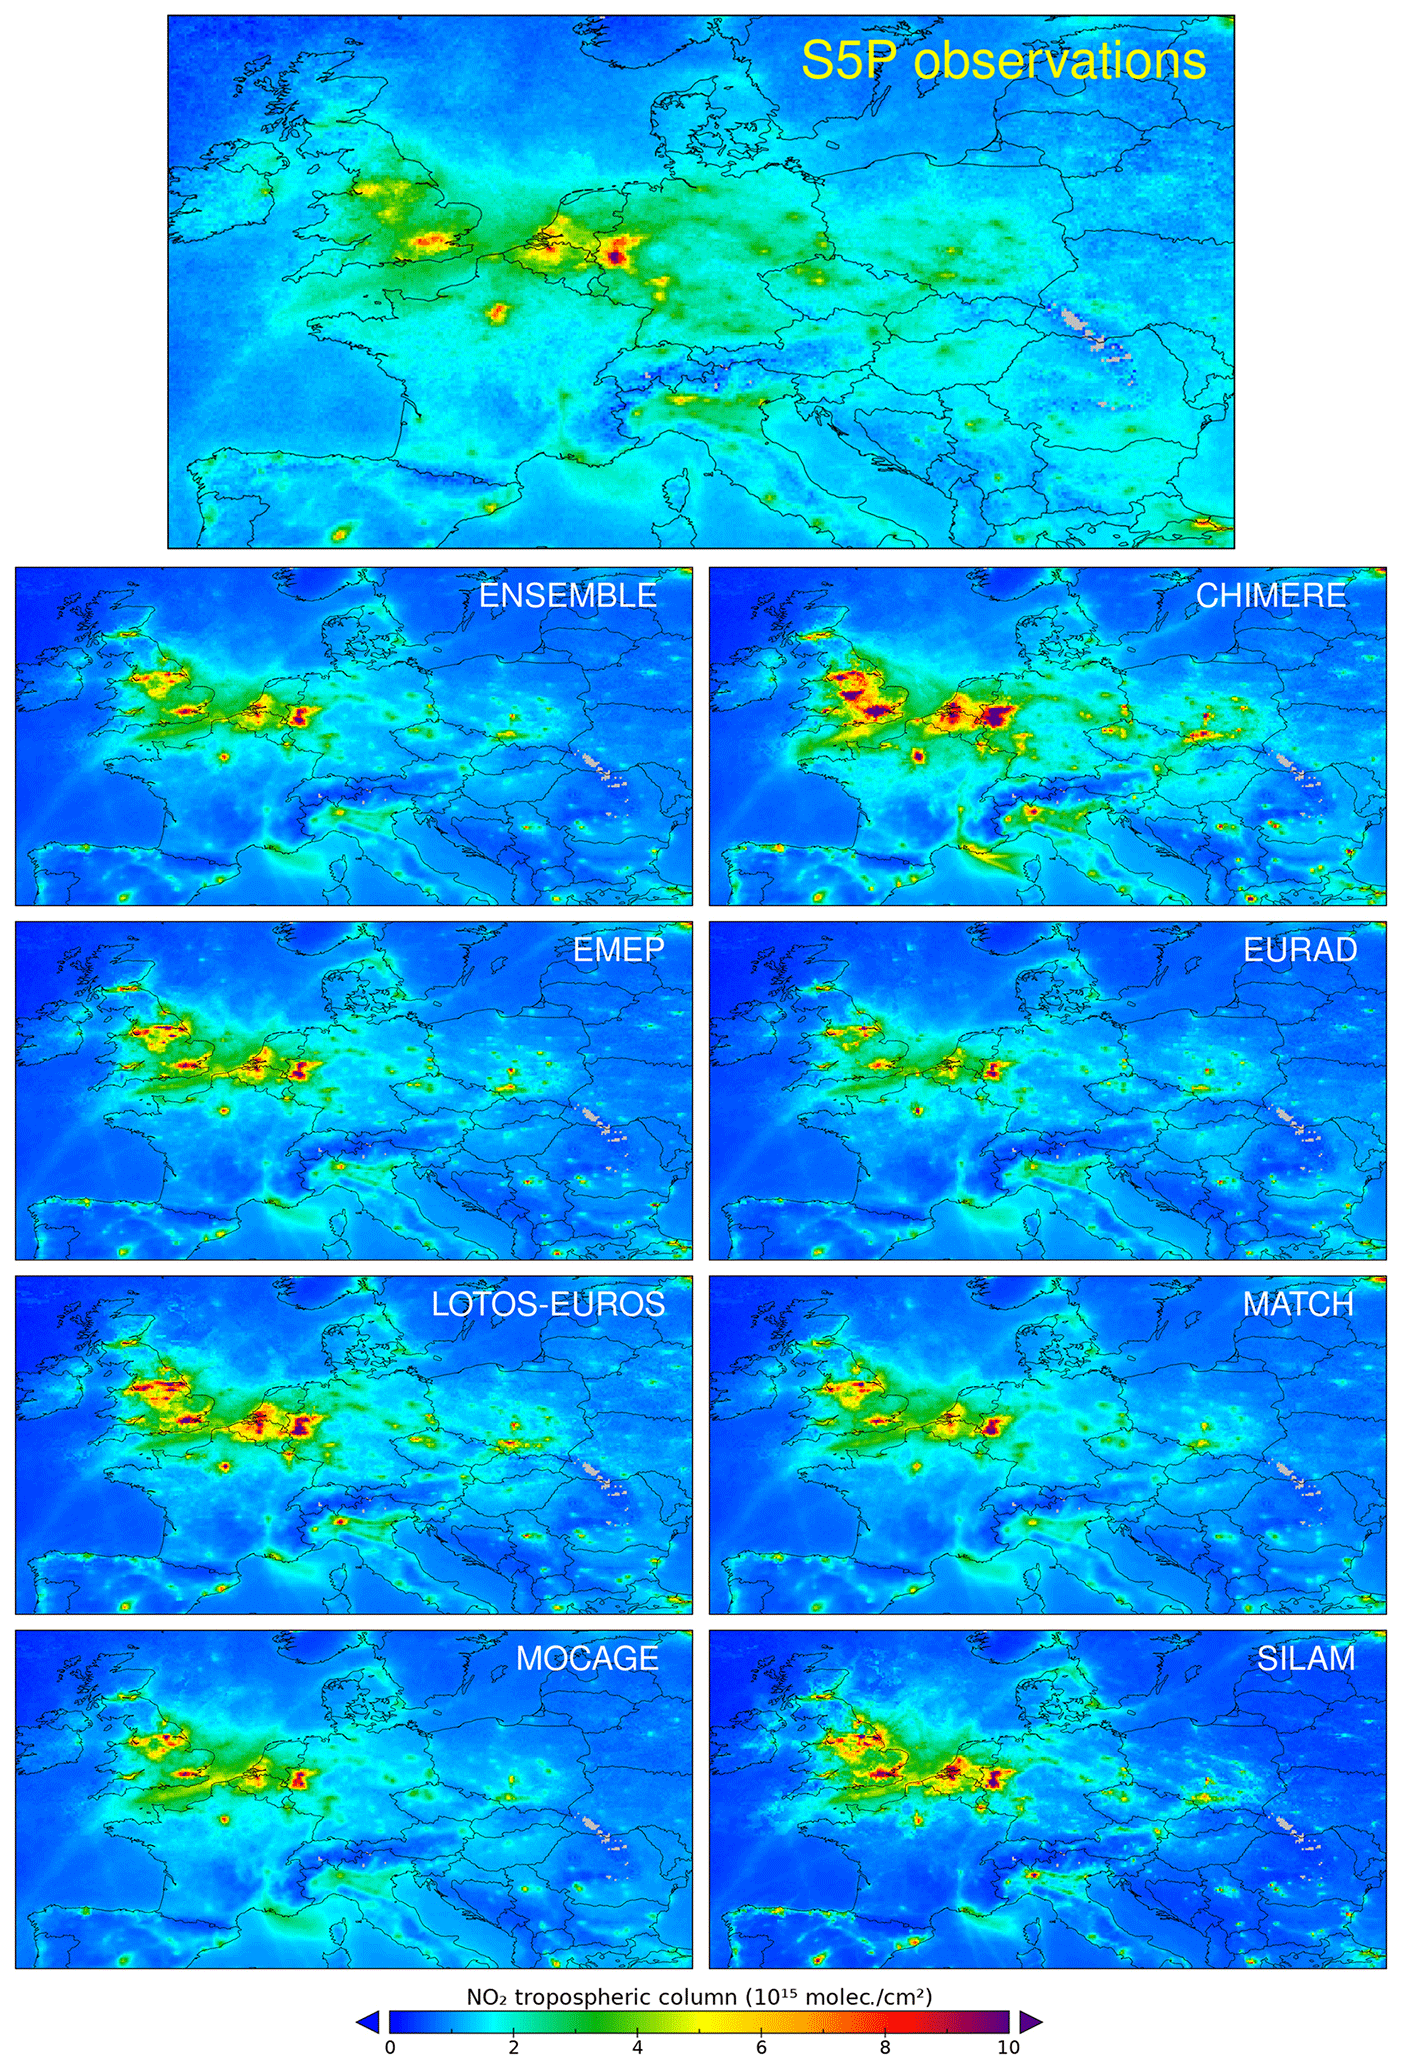
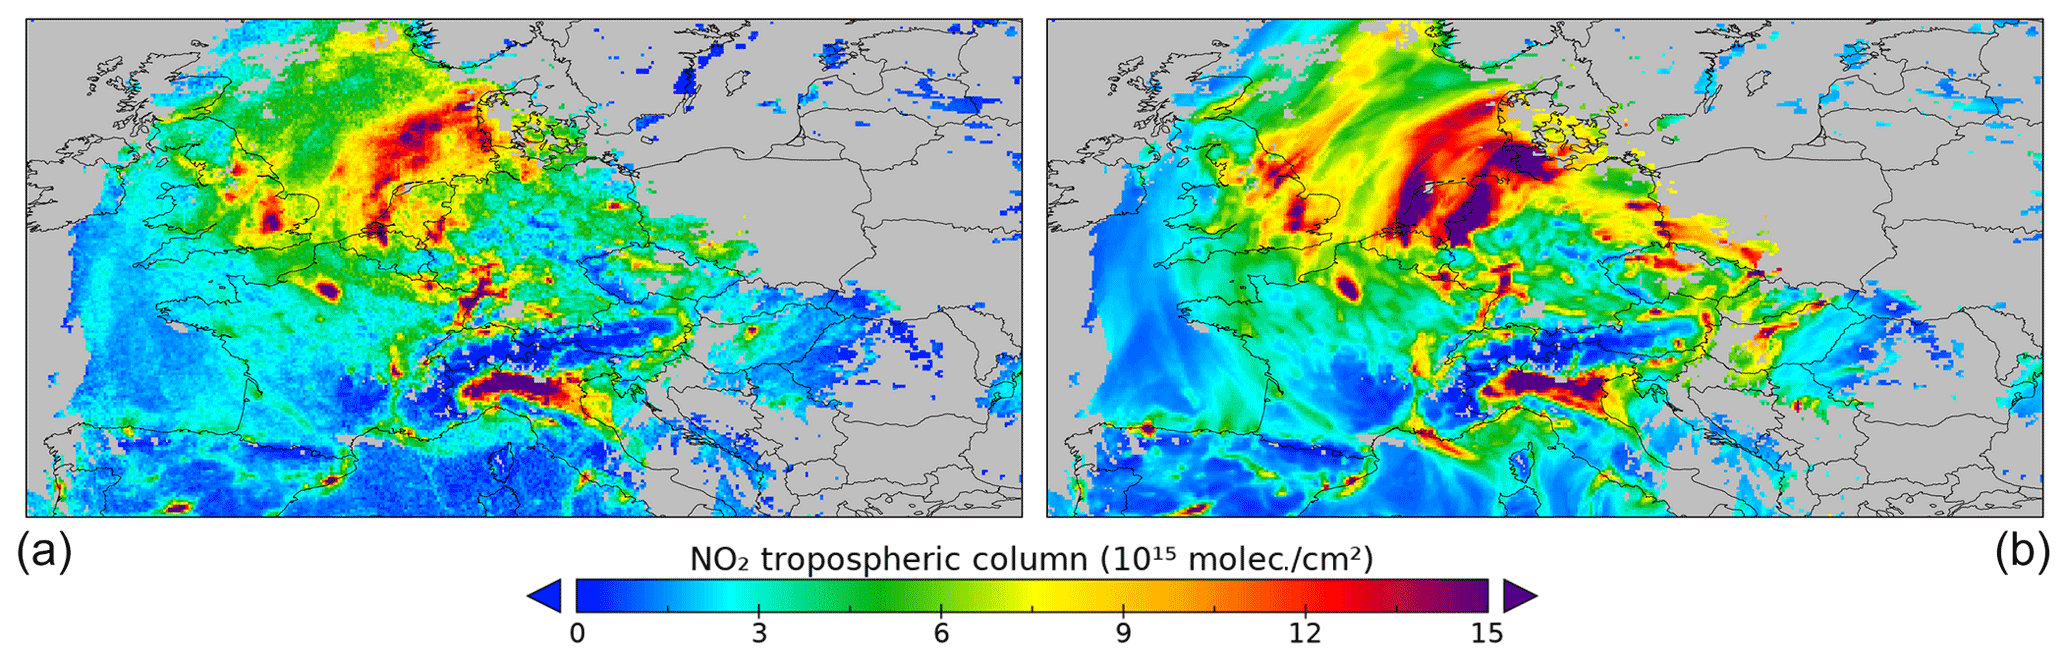
Figure 9Comparison of S5P and CAMS-RG-A columns for seven CAMS regional production models based on the first day forecasts for July 2018.
5.4 Results for the individual regional models
Figure 9 shows the S5P and CAMS-RG-A columns for the ENSEMBLE and for each of CAMS regional production models, based on the available first day forecasts for the month of July 2018. At that time, there were seven operational models providing daily forecasts. As already identified in Sect. 5.1, background values appear higher for S5P columns, but hotspots seem to be comparable. Since the same emissions are, in principle, used by all models, differences between the modeled columns should be attributed to differences in the treatment of transport (both in the horizontal and the vertical), chemistry, or NO2 removal processes.
Differences between the individual models are further examined in Fig. 10, which depicts maps for the average monthly CAMS-RG-A and S5P-RG column spread, for July and November 2018. These spreads are calculated on the basis of the difference between the minimum and maximum values for these quantities, as calculated by using any of the seven regional models, and can be considered to be a measure of the uncertainty in the CAMS ENSEMBLE-based columns. As expected, the spread is significantly higher (by a factor of almost 5) for the actual modeled columns (CAMS-RG-A) than for the TROPOMI columns when using the CAMS model a priori from the individual models (S5P-RG). Moreover, the spread is considerably larger for November, by a factor of almost 2, compared to the summer month of July. In July, the CAMS-RG-A spread is the largest at urban areas all over Europe but more so in Benelux, the Ruhr area, and England, while for winter CAMS-RG-A is more homogeneous across the domain but prominently high in the Po Valley. A similar behavior arises for S5P-RG, with the largest values of the spread over high activity areas during summer and higher, more homogeneous values during winter.
Some basic statistics for individual cities for July and November 2018 are provided in Table 3, which shows the monthly mean values of S5P and CAMS-RG-A columns, the lowest and highest model values for CAMS-RG-A, ratios between the S5P-RG and S5P columns, the relative difference, and the spatial (Pearson's R) correlation coefficient between S5P and CAMS-RG-A, which is also based on the monthly mean values. We base the calculation of the relative difference on the arithmetic mean of S5P and CAMS-RG-A, using the formula. The table shows that TROPOMI lies within the model spread for July, but this is not the case for most cities in November. Relative differences are up to 15 % for most cities in July but up to 50 % for most cities in November. Correlations are typically high, except for London in July and Helsinki in November.
For the months of July and November 2018, Figs. 7 and 8 also depict the model spread of the CAMS-RG-A columns in the form of solid green vertical bars. Note that the amount of data involved in the actual regional model output, download time, storage space, and the computational cost required for processing 7 to 11 models has prevented us from calculating the spread for the full length of the time series in these plots. Furthermore, for cities, the spread is also clearly lower in July than in November in the selected domains, but the S5P column values still mostly lie within the range since the comparison is in any case more favorable during the summer. The larger November spread does include the S5P column values for some of the cities/domains, but the wintertime discrepancy discussed above appears to be generally larger than what could be explained by model variability and is thus more systematic in nature. To conclude, both model results and retrievals seem to be more uncertain in winter.
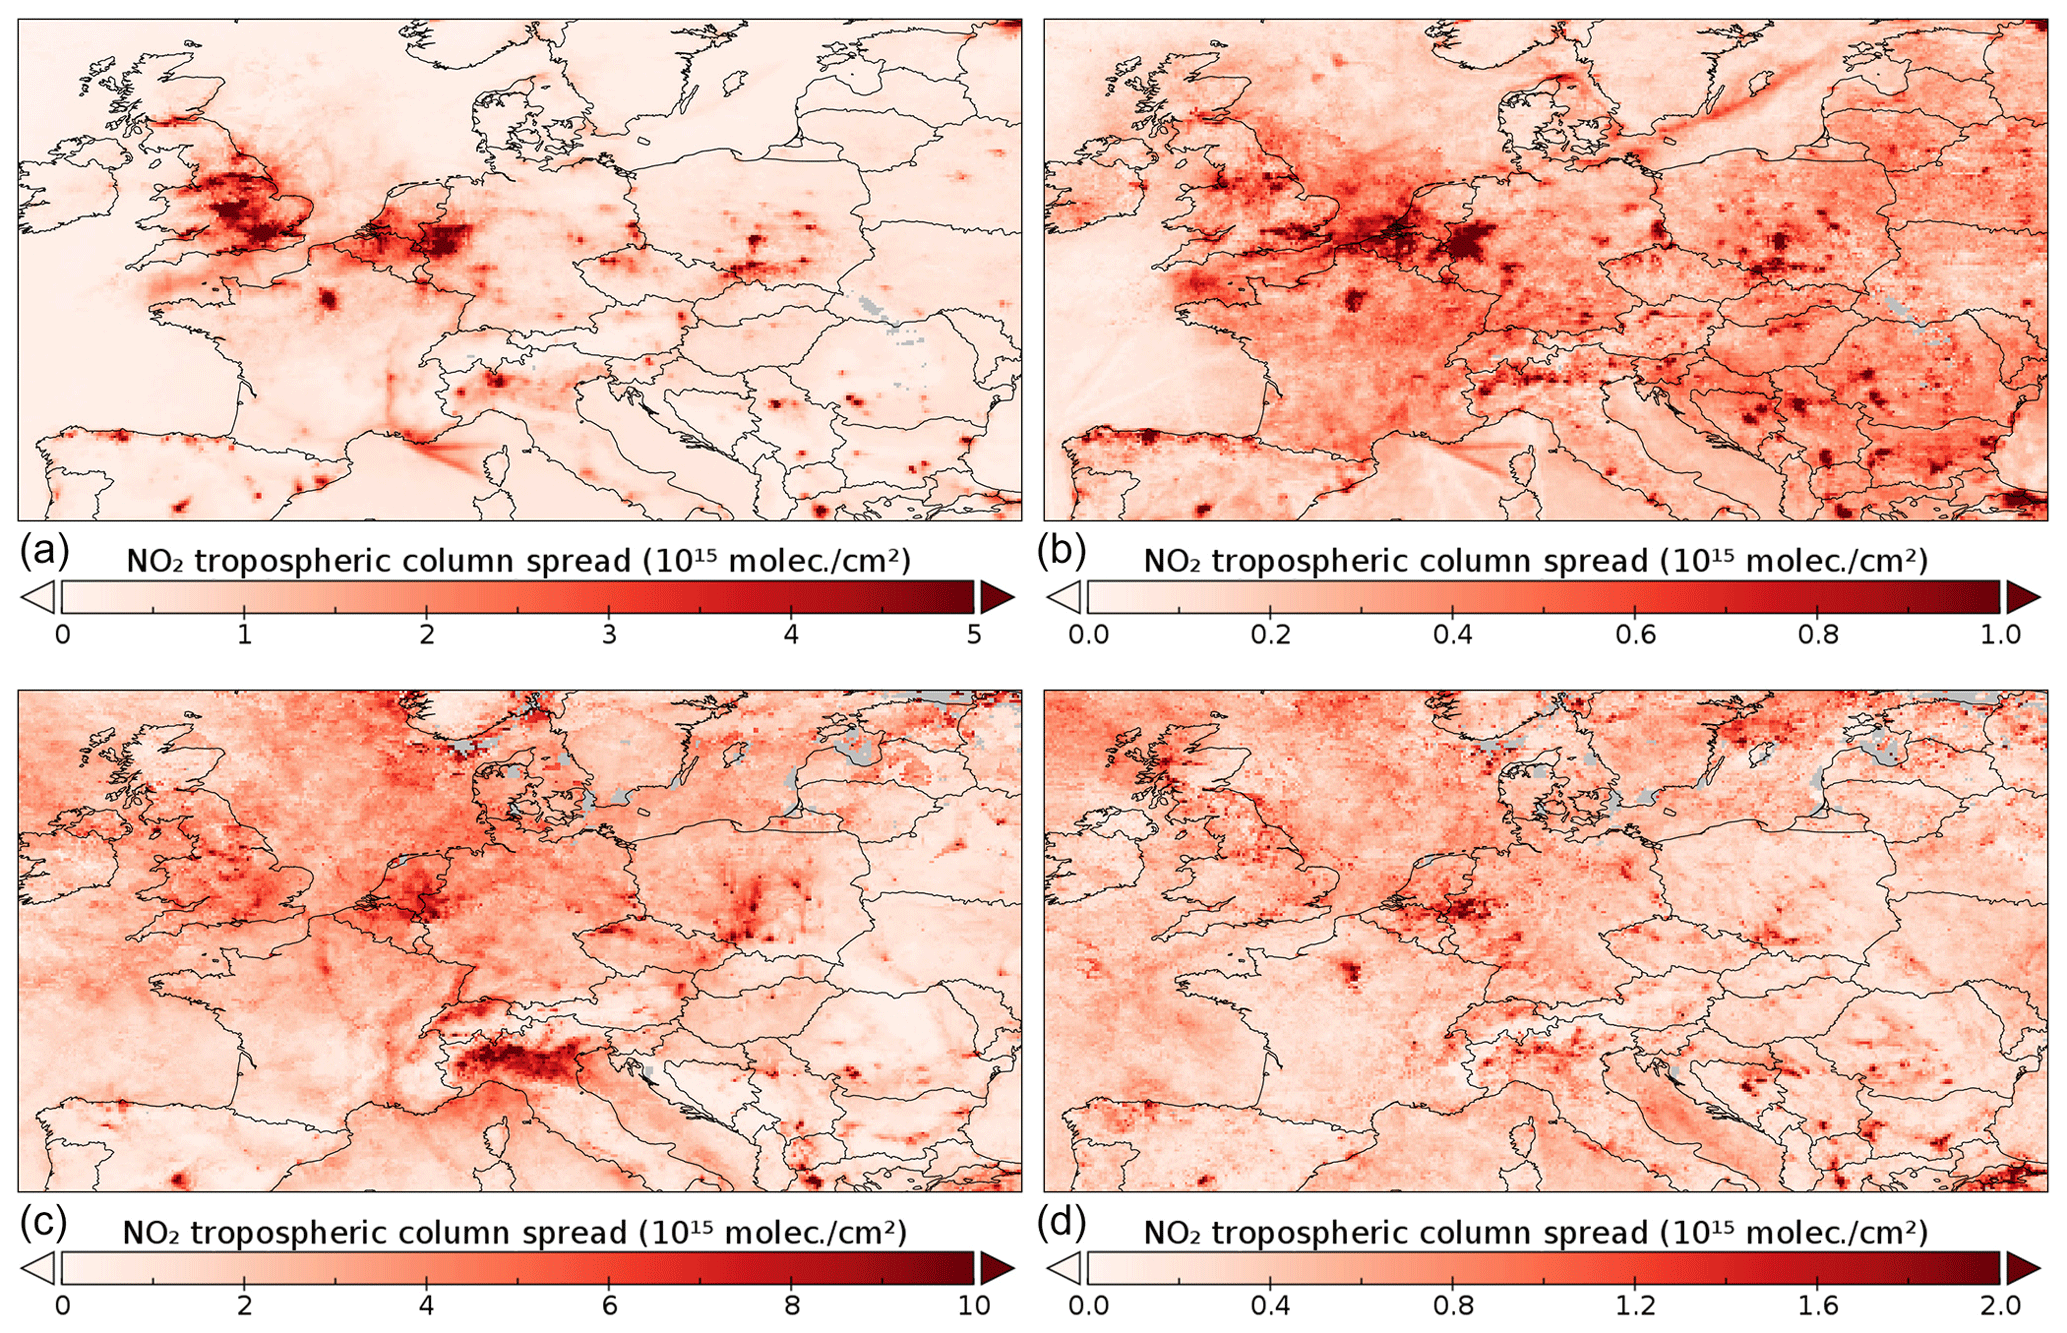
Figure 10Model spread (for a definition, see Sect. 5.4) for tropospheric NO2 columns. The first row depicts CAMS-RG-A (a, c) and S5P-RG (b, d) for July 2018, while the second row is the same for November 2018. Note the different scales.
Table 3S5P and CAMS-RG-A column statistics at various European cities for July and November 2018, including the S5P-RG S5P ratio.

* Relative difference and correlation coefficient between S5P and CAMS-RG-A.
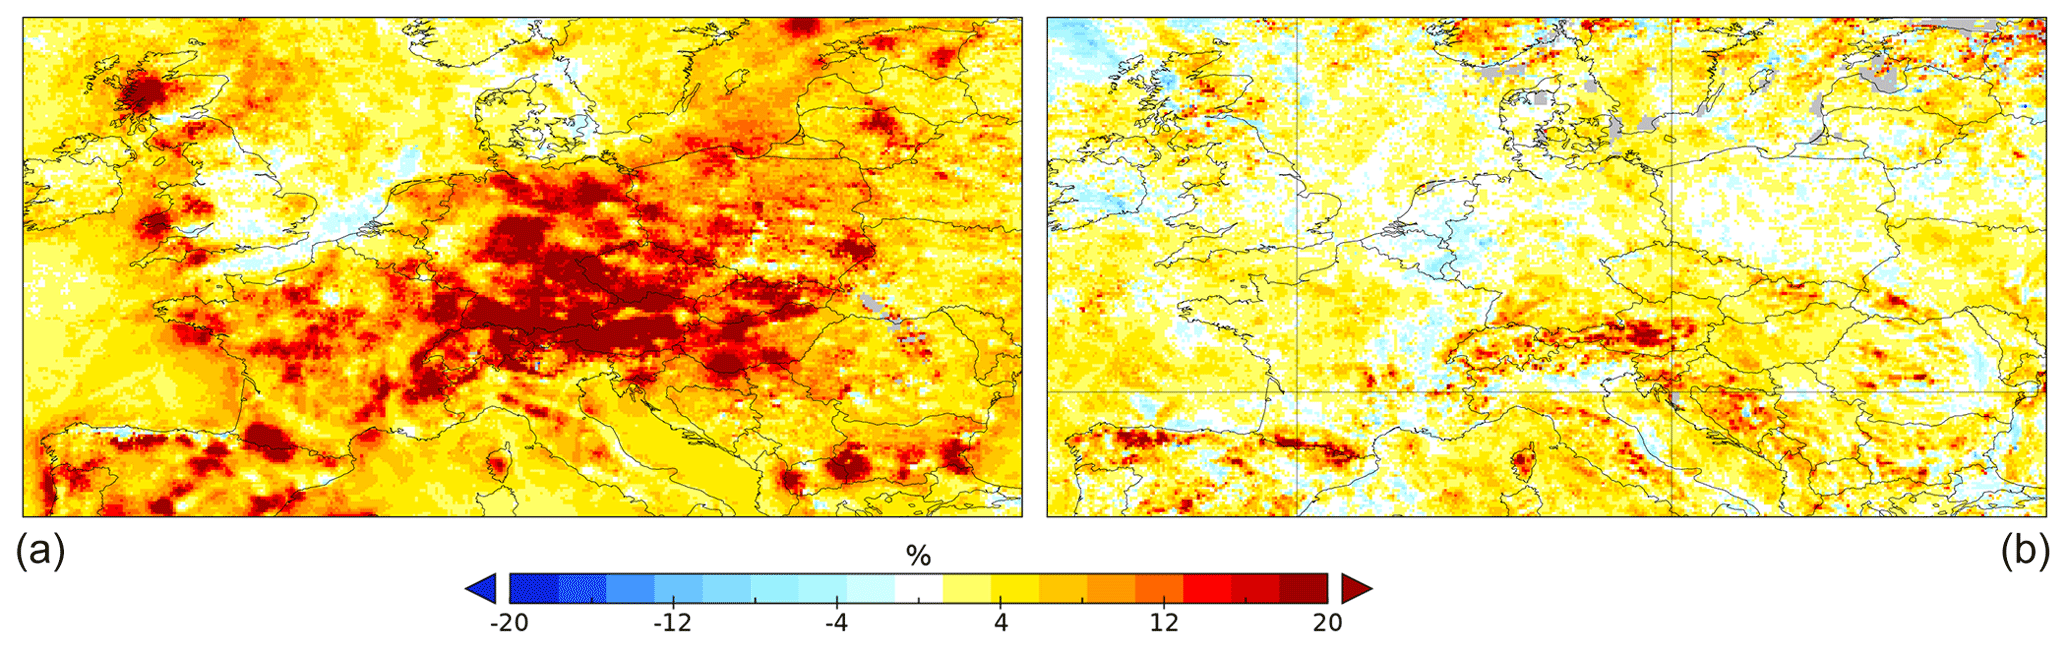
Figure 11Percentile relative change between TROPOMI tropospheric NO2 columns derived using a merged CAMS a priori (S5P-RG) based on the regional NRT analysis and regional forecast and averaged over the months of July 2018 (a) and January 2019 (b).
5.5 Results for the regional models – analysis vs. forecast
The assimilation of (primarily surface) observations by the CAMS regional models has been demonstrated to lead to improved assessments of the 3-D concentration fields for NO2 (Douros et al., 2020). The hypothesis would thus be that, when using analyzed CAMS regional profiles to replace the default TM5-MP a priori, this would lead to improved TROPOMI (S5P-RG) columns. In this section, we aim to investigate the differences introduced by the use of the analyses as compared to the first day forecasts.
Figure 11 depicts the percentage of relative change for July 2018 and January 2019 using the formula. Positive values indicate higher values for the analyses, while negative values indicate higher values for the forecasts. For July, most areas in mainland Europe show higher values when using analyzed profiles, with the exception of some areas in the North Sea and the English channel, where the columns based on the forecasts seem higher. The situation for January is much more ambiguous, as differences are generally smaller, and there are no distinct patterns on the relative change map. The noisy features in the northern part of the map are probably due to the noise in the TROPOMI retrievals, as the values in this part of the domain are very low.
The importance of using high-resolution realistic profiles as a priori has been recognized by several groups, resulting in dedicated regional retrieval products (M. Liu et al., 2020; Griffin et al., 2019; Laughner et al., 2019) for the USA and East Asia. Based on the combination of the CAMS–regional NO2 profiles up to 3000 m altitude and IFS (compo) above, we have generated a new S5P-RG level 2 TROPOMI NO2 product, using the approach described in Sect. 4.2. For this product, we chose to use the regional ENSEMBLE for the NRT analysis rather than the forecasts in order to benefit from its better performance (Douros et al., 2020). For this new product, horizontal regridding is performed with the TROPOMI grid for the orbit as the target.
This new product is an extension of the L2 product files with three new fields added to the existing data product. The most relevant extra field is the one containing the S5P-RG data but the original (S5P) is also still available. Data files have been cropped to remove parts of the orbits with no overlap with the CAMS European domain, reducing the size of the dataset by about a factor 15 compared to the original L2 dataset.
In general, we find that the 0.1∘ high-resolution CAMS–regional a priori profile increases the dynamical range in NO2 vertical column density (VCD) values. More specifically, in the emission hotspots, NO2 values are typically increased by between 5 % and 30 %, but the increase strongly depends on the location and time.
6.1 Impact of the free tropospheric column on the retrievals and comparisons
A way to evaluate the impact of the free tropospheric column on the retrievals is by comparing TROPOMI retrievals using either CAMS-RG or CAMS-R a priori profiles (S5P-RG and S5P-R, respectively) with the respective CAMS-RG and CAMS-R modeled columns (CAMS-RG-I and CAMS-R-I). Monthly mean maps for July 2018 based on this scheme are shown in Fig. 12.
Modeled columns (CAMS-RG-I and CAMS-R-I; Fig. 12b, d) appear to be quite similar in these maps, while TROPOMI columns (S5P-RG and S5P-R) are considerably different, with background values being fairly higher for S5P-R compared to S5P-RG. Though the free tropospheric column is relatively small, even in summer, the TROPOMI-CAMS comparison nevertheless appears to be very sensitive to it. When the free troposphere is removed, the model columns will be somewhat smaller. The air mass factor in the TROPOMI retrieval, however, will also be significantly lower due to the shape of the averaging kernel, leading to a noticeable increase in the TROPOMI retrieval. These effects are opposite, thus leading to a cumulative increase in the difference between TROPOMI and model-derived columns when the free tropospheric column is too low or missing.
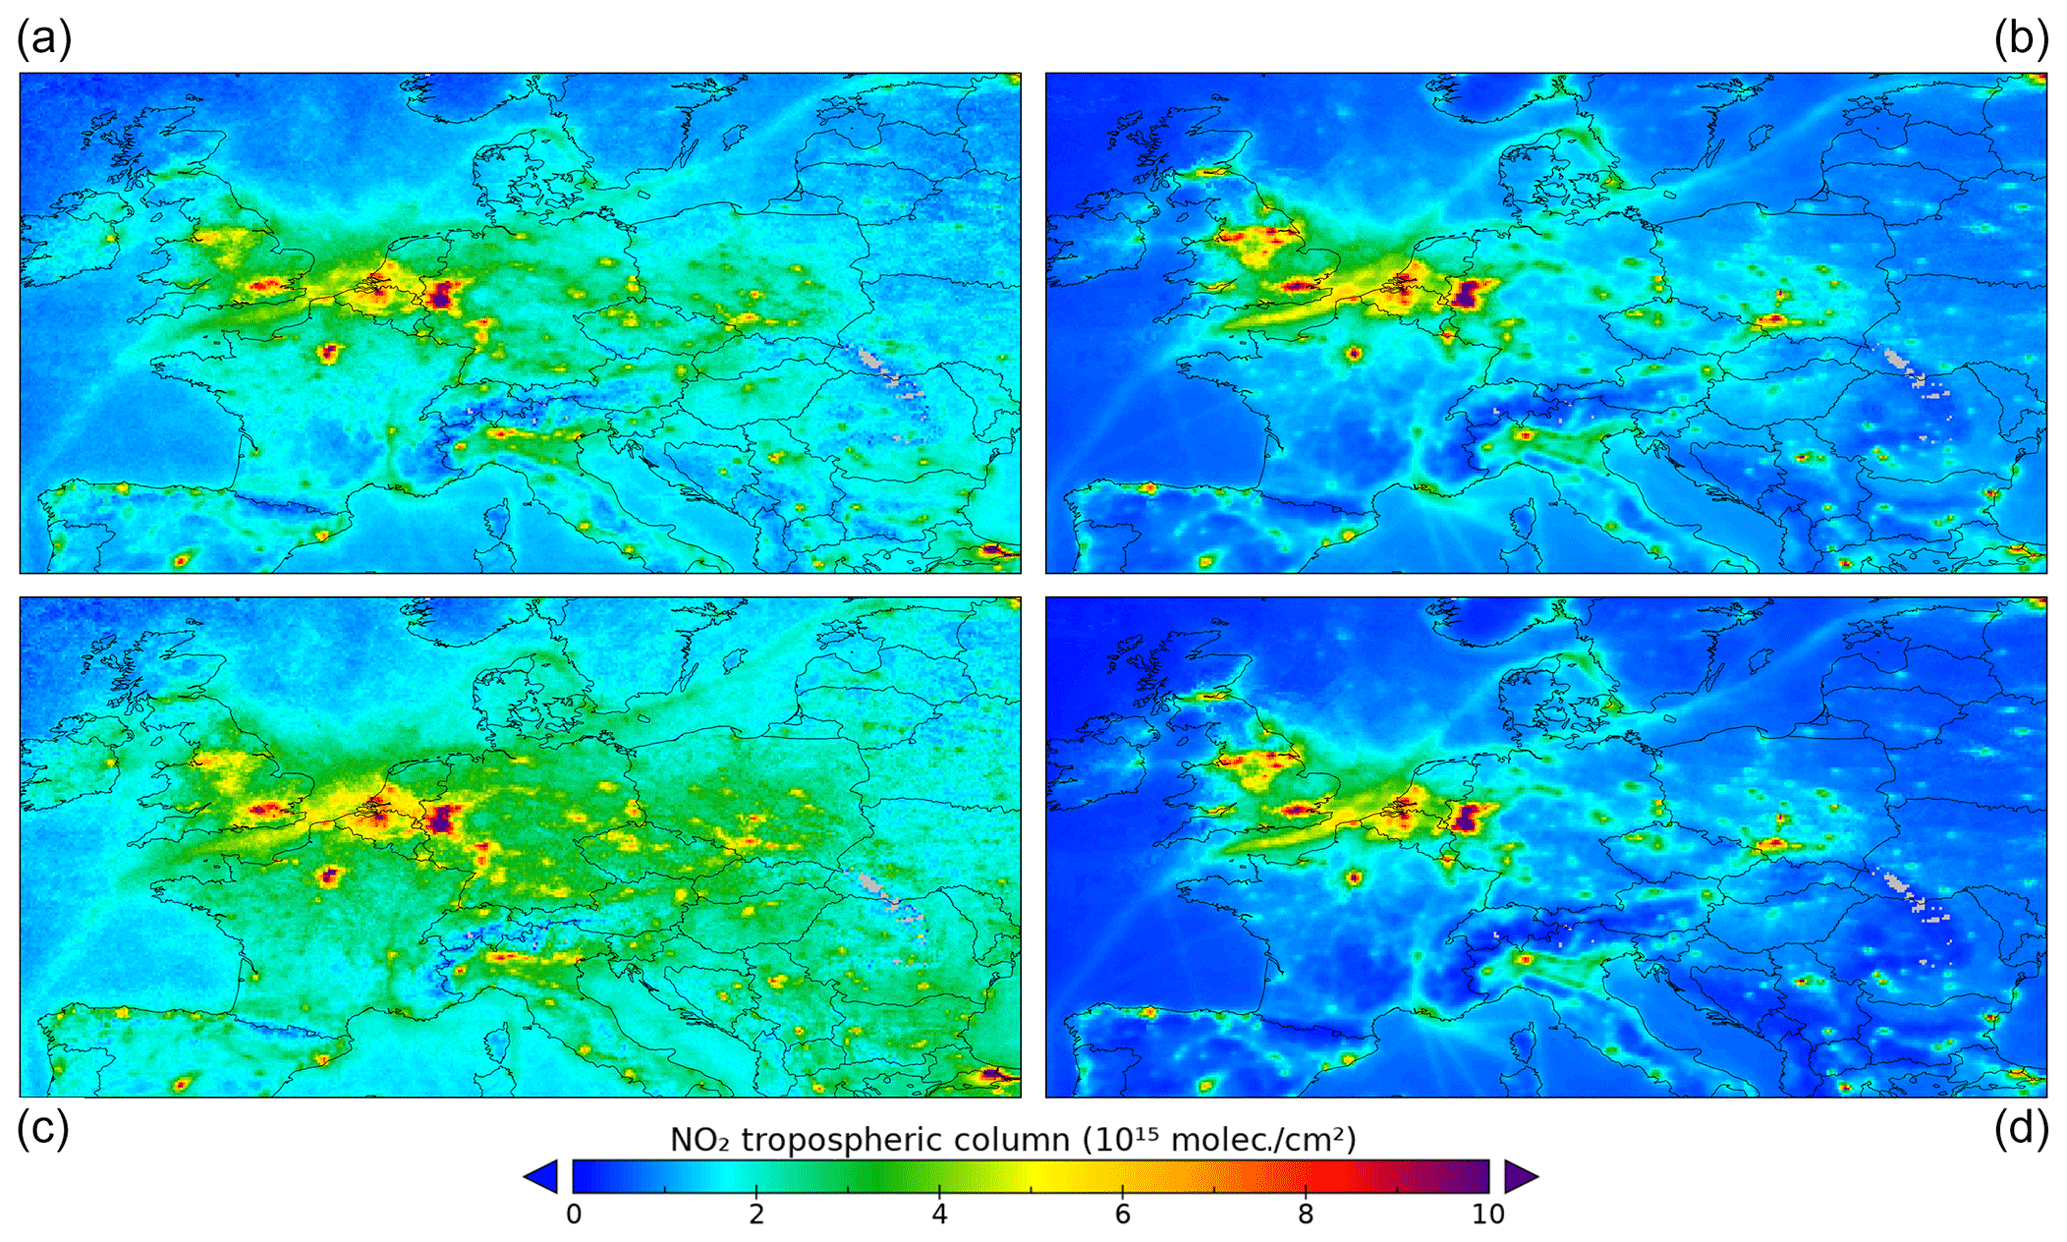
Figure 12Monthly averaged S5P-RG (a), CAMS-RG-I (b), S5P-R (c), and CAMS-R-I (d) columns for July 2018.
An alternative way of investigating the impact of the free troposphere is by calculating the ratios between S5P-CAMS for all available combinations of a priori profiles (S5P-RG, S5P-R, S5P-G) and the native TROPOMI tropospheric column. Figure 13 shows maps of those three ratios averaged over the summer months (June–August, JJA) of 2019. In order to take full advantage of the high resolution of the TROPOMI data, these maps were produced by regridding column fields to a regular lat–long grid of 0.02∘ × 0.02∘.
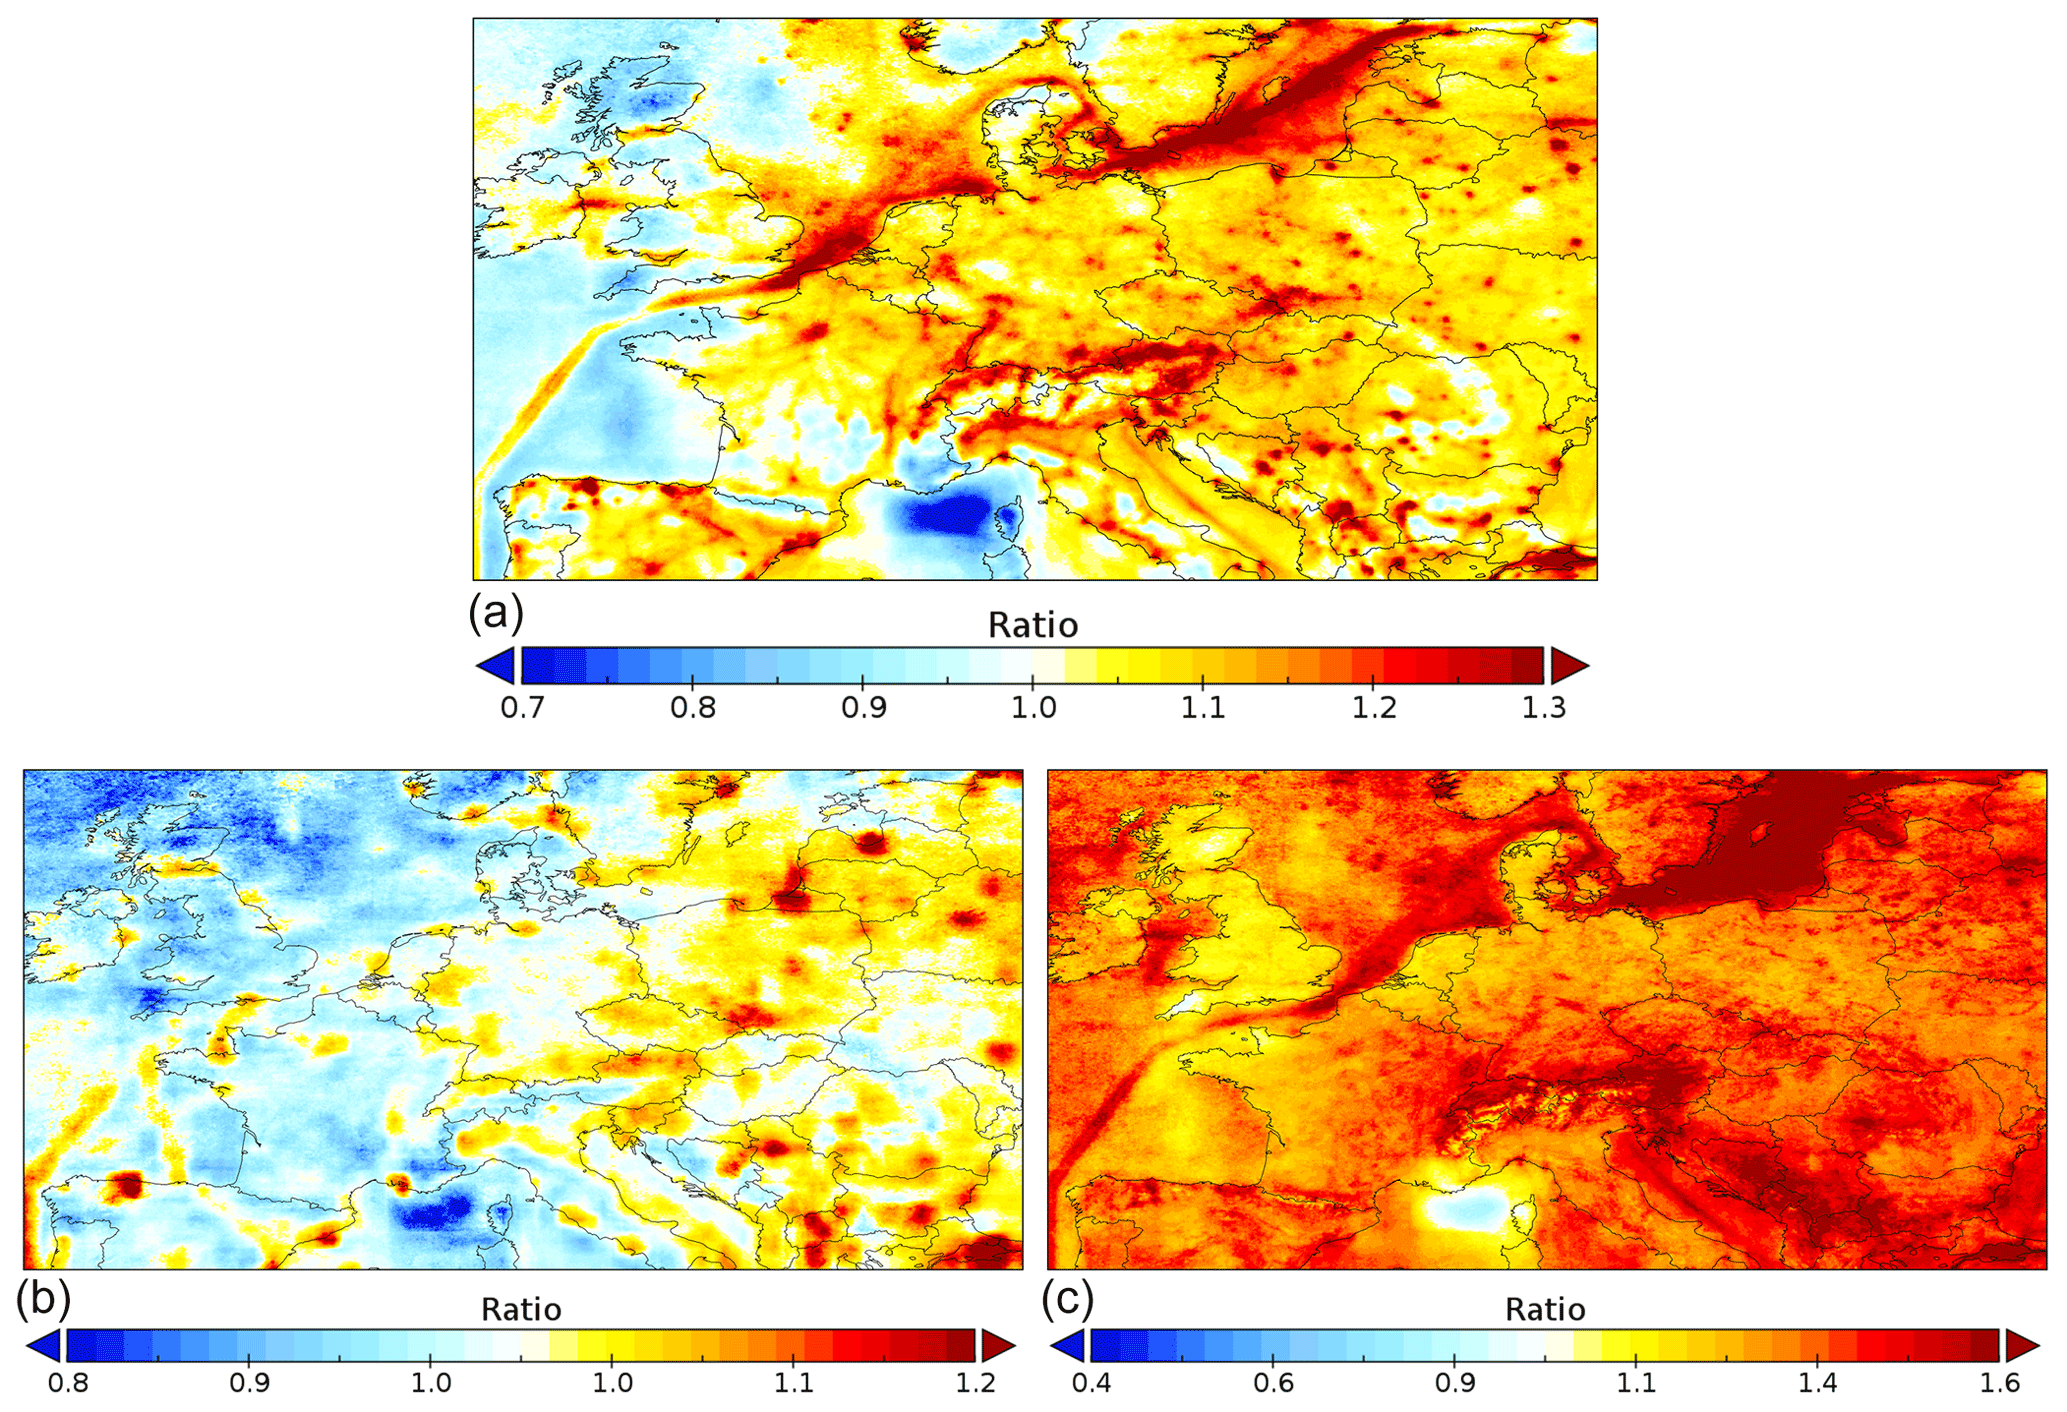
Figure 13The ratio of the retrievals performed with CAMS a priori profiles and the original TROPOMI retrievals. (a) S5P-RG/S5P, (b) S5P-G/S5P, and (c) S5P-R/S5P. Data regridded from the L2 product to a 0.02∘ × 0.02∘ grid and averaged over the summer months (JJA) of 2019. Note the different scales.
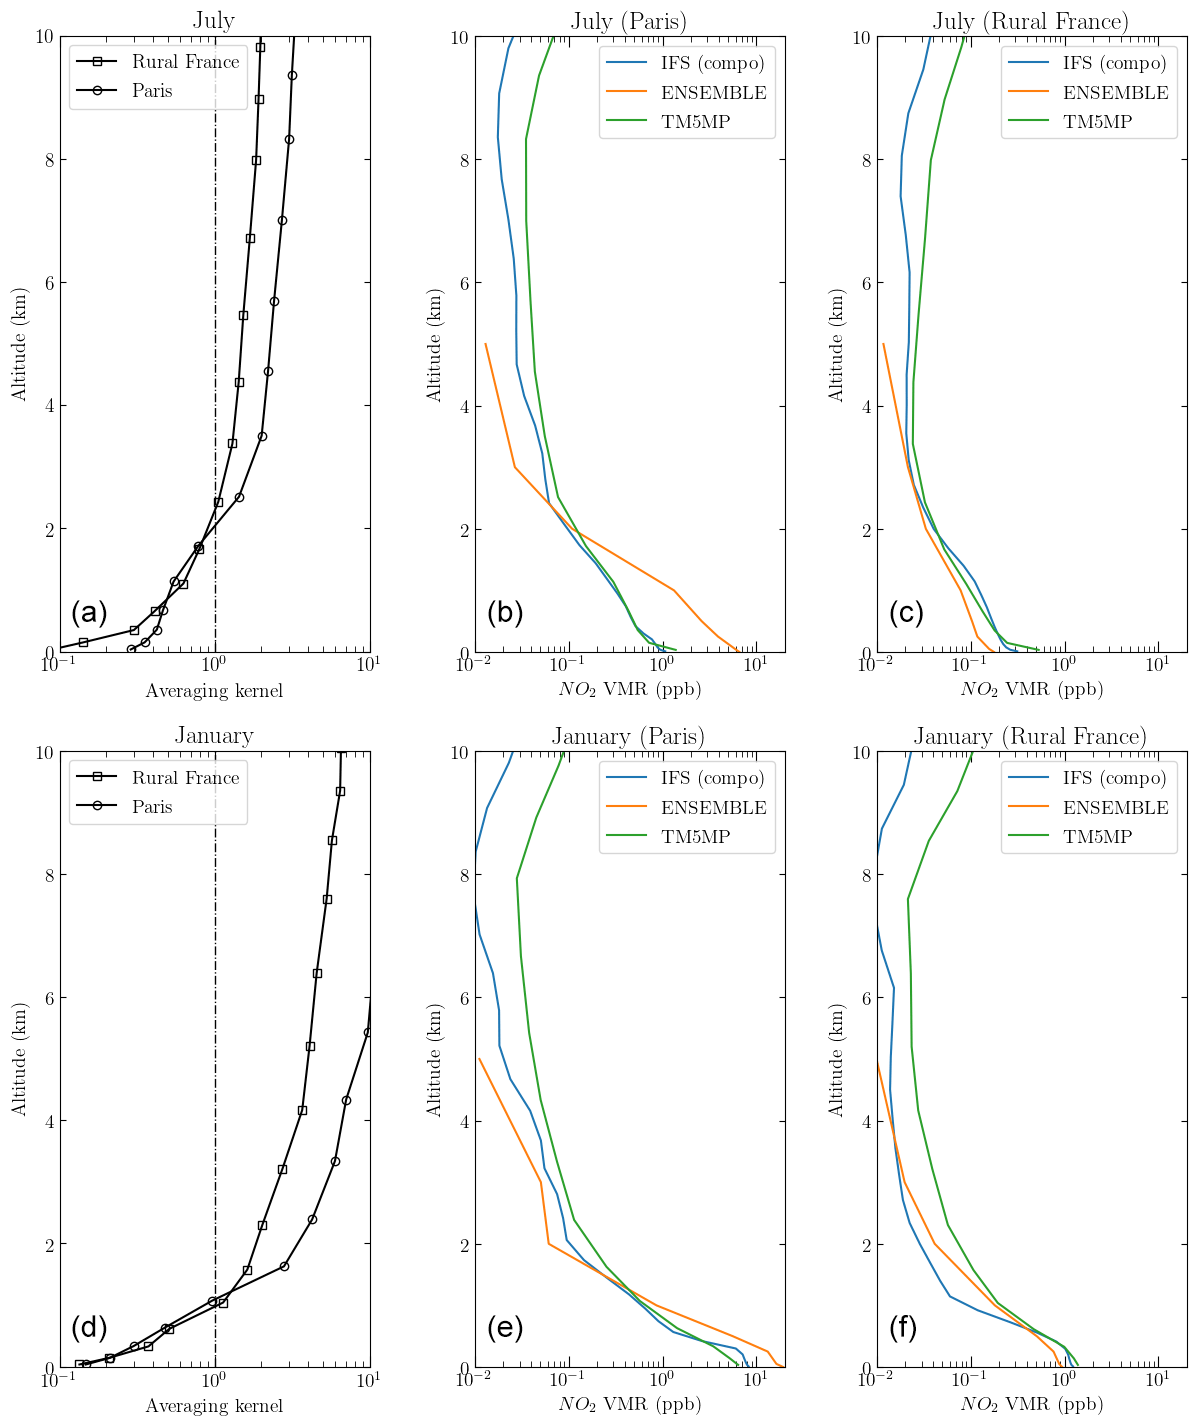
Figure 14Mean averaging kernel profiles (a, d) and NO2 profiles for Paris (b, e) and a rural location in France (c, f) during July (a–c) and January (d–f) 2018. Mean NO2 profiles are plotted based on data from CAMS regional (ENSEMBLE), IFS (compo), and TM5-MP.
What is quite evident from Fig. 13 is that the S5P-R / S5P ratio is larger than unity almost everywhere in the domain. For S5P-G / S5P, the values are much closer to unity, while for S5P-RG / S5P, the values are larger at most emission hotspots, e.g., at urban areas and across ship tracks in the North Sea but closer to unity for most other areas. A ratio larger than 1 reflects the fact that tropospheric columns are larger when replacing the default TM5-MP a priori with a CAMS modeled profile. But, in order to better understand why this is the case, averaged profiles for both a summer month (July 2018) and a winter one (January 2019) were calculated at two locations, namely the distinctly urban environment of Paris and a fairly remote rural location in the Cantal region of France, away from large emission sources. Those profiles are shown in Fig. 14, together with the respective averaging kernels, and are calculated only for the times of valid TROPOMI observations.
The averaging kernel, which describes the vertical structure of the impact of the a priori information assumed in the retrieval, clearly acquires lower values near the surface for the rural case due to lower albedo values at this location. For July, the averaging kernel is close to unity at about 2 km over the surface, while for January this altitude is much lower, at about 1 km, indicating a shallower boundary layer.
Comparisons between the modeled NO2 profiles reveal higher mixing ratios as expected near the surface for the regional ENSEMBLE in the urban location, but the ratios are somewhat lower for the rural location. This difference is more prominent during July and is possibly related to a more efficient photochemical conversion of NOx to NO2, the shorter lifetime, and higher resolution of the regional models. IFS (compo) mixing ratios near the surface are, in any case, not expected to be representative of most hotspot regions in Europe due to the relatively coarse horizontal resolution of the model. The ENSEMBLE tends to produce very low concentrations at 5 km altitude compared to IFS (compo) and TM5-MP but more similar concentrations around 3 km. IFS (compo) and TM5-MP agree reasonably well in summer, but larger differences are seen in winter.
What is clear from the mean NO2 profiles for July is that, for urban areas, the CAMS regional ENSEMBLE has a much larger fraction of its column in the boundary layer compared to either TM5-MP or IFS (compo). Moreover, as the averaging kernel provides the contribution of different altitudes to the signal observed by TROPOMI, a large part of this signal is normally interpreted as being representative of the free troposphere, which, in the case of the ENSEMBLE, is largely missing. This skews the S5P-R (and thus the ratio) to higher values. TM5-MP and IFS (compo) have fairly similar profiles, leading to a more balanced ratio when examining the ratio for CAMS-G. The most interesting behavior appears to be when using the CAMS-RG a priori. In urban areas, CAMS-R values are higher close to the surface, mainly due to the higher horizontal resolution of the regional models and the underlying emissions, which is something that leads to higher S5P-RG columns and thus ratios. In rural areas, the averaging kernel has somewhat lower values, and at the same time, the free troposphere now also contributes to the full tropospheric column, leading to lower S5P-RG columns and ratios. The overall impact is therefore a notable increase in the dynamic range of S5P-RG VCDs.
6.2 Validation of the TROPOMI-CAMS regional L2 product against ground-based data
The routine validation of the operational TROPOMI satellite NO2 tropospheric and total column retrievals largely relies on the global network of MAX-DOAS remote-sensing instruments and the Pandora instruments from the Pandonia Global Network (PGN; Verhoelst et al., 2021; Lambert et al., 2021). Both instrument types are commonly used for the validation of satellite NO2 data (Celarier et al., 2008; Herman et al., 2009, 2019; Chan et al., 2020; Compernolle et al., 2020; Pinardi et al., 2020) Here we focus on the European S5P-RG product discussed in Sect. 6. We note that earlier validation of S5P NO2 with regional CAMS profiles was done by Ialongo et al. (2020), using the Pandora instrument at Helsinki. In this study, we have used nine MAX-DOAS and six Pandora stations (see Table 4) that are within the spatial scope of the S5P-RG product. In addition, we compare the operational TROPOMI product and the CAMS-RG-I product with the same reference dataset. This allows for a double-delta validation, i.e., S5P-RG vs. S5P and S5P-RG vs. CAMS-RG-I. Practically, the CAMS-RG-I tropospheric columns can be reconstructed from the fields in the new product by multiplying the smoothed CAMS column (CAMS-RG-A) with the ratio of the operational S5P tropospheric air mass factor (AMF) over the S5P-RG tropospheric AMF, with all the relevant information made available in the new product. This follows that, by rearranging the second line of Eq. (1), we obtain
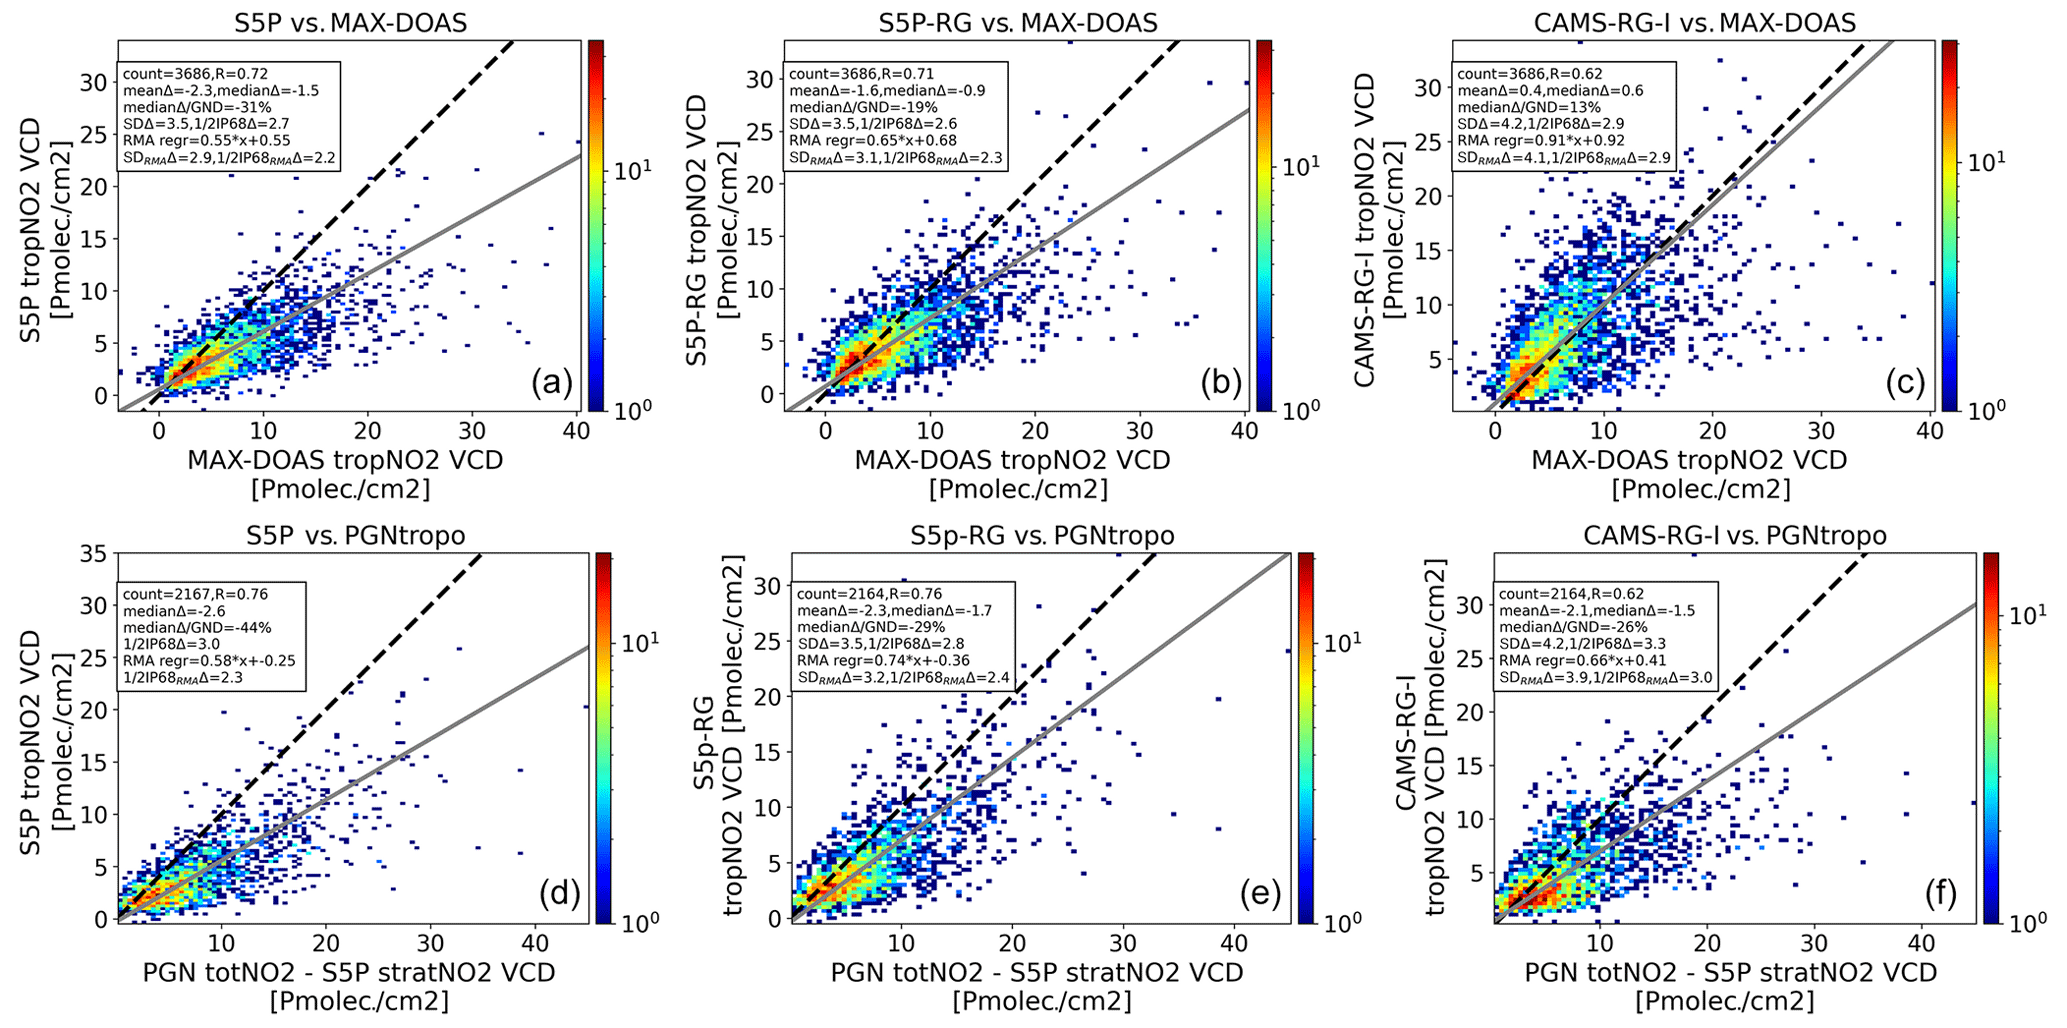
Figure 15Correlation density plots of S5P, S5P-RG, and CAMS-RG-I (columns 1 to 3) vs. MAX-DOAS (a–c) and vs. PGNtropo (d–f). Quality indicators for bias (mean and median difference and median relative difference), difference dispersion (standard deviation and IP68) are provided, in addition to the Pearson's (R) correlation coefficient, the reduced major axis (RMA) regression slope and intercept, and the residual dispersion (standard deviation, SD, and IP68) from the RMA regression line.
Table 4Overview of the stations contributing to the TROPOMI-CAMS tropospheric NO2 validation in this study.
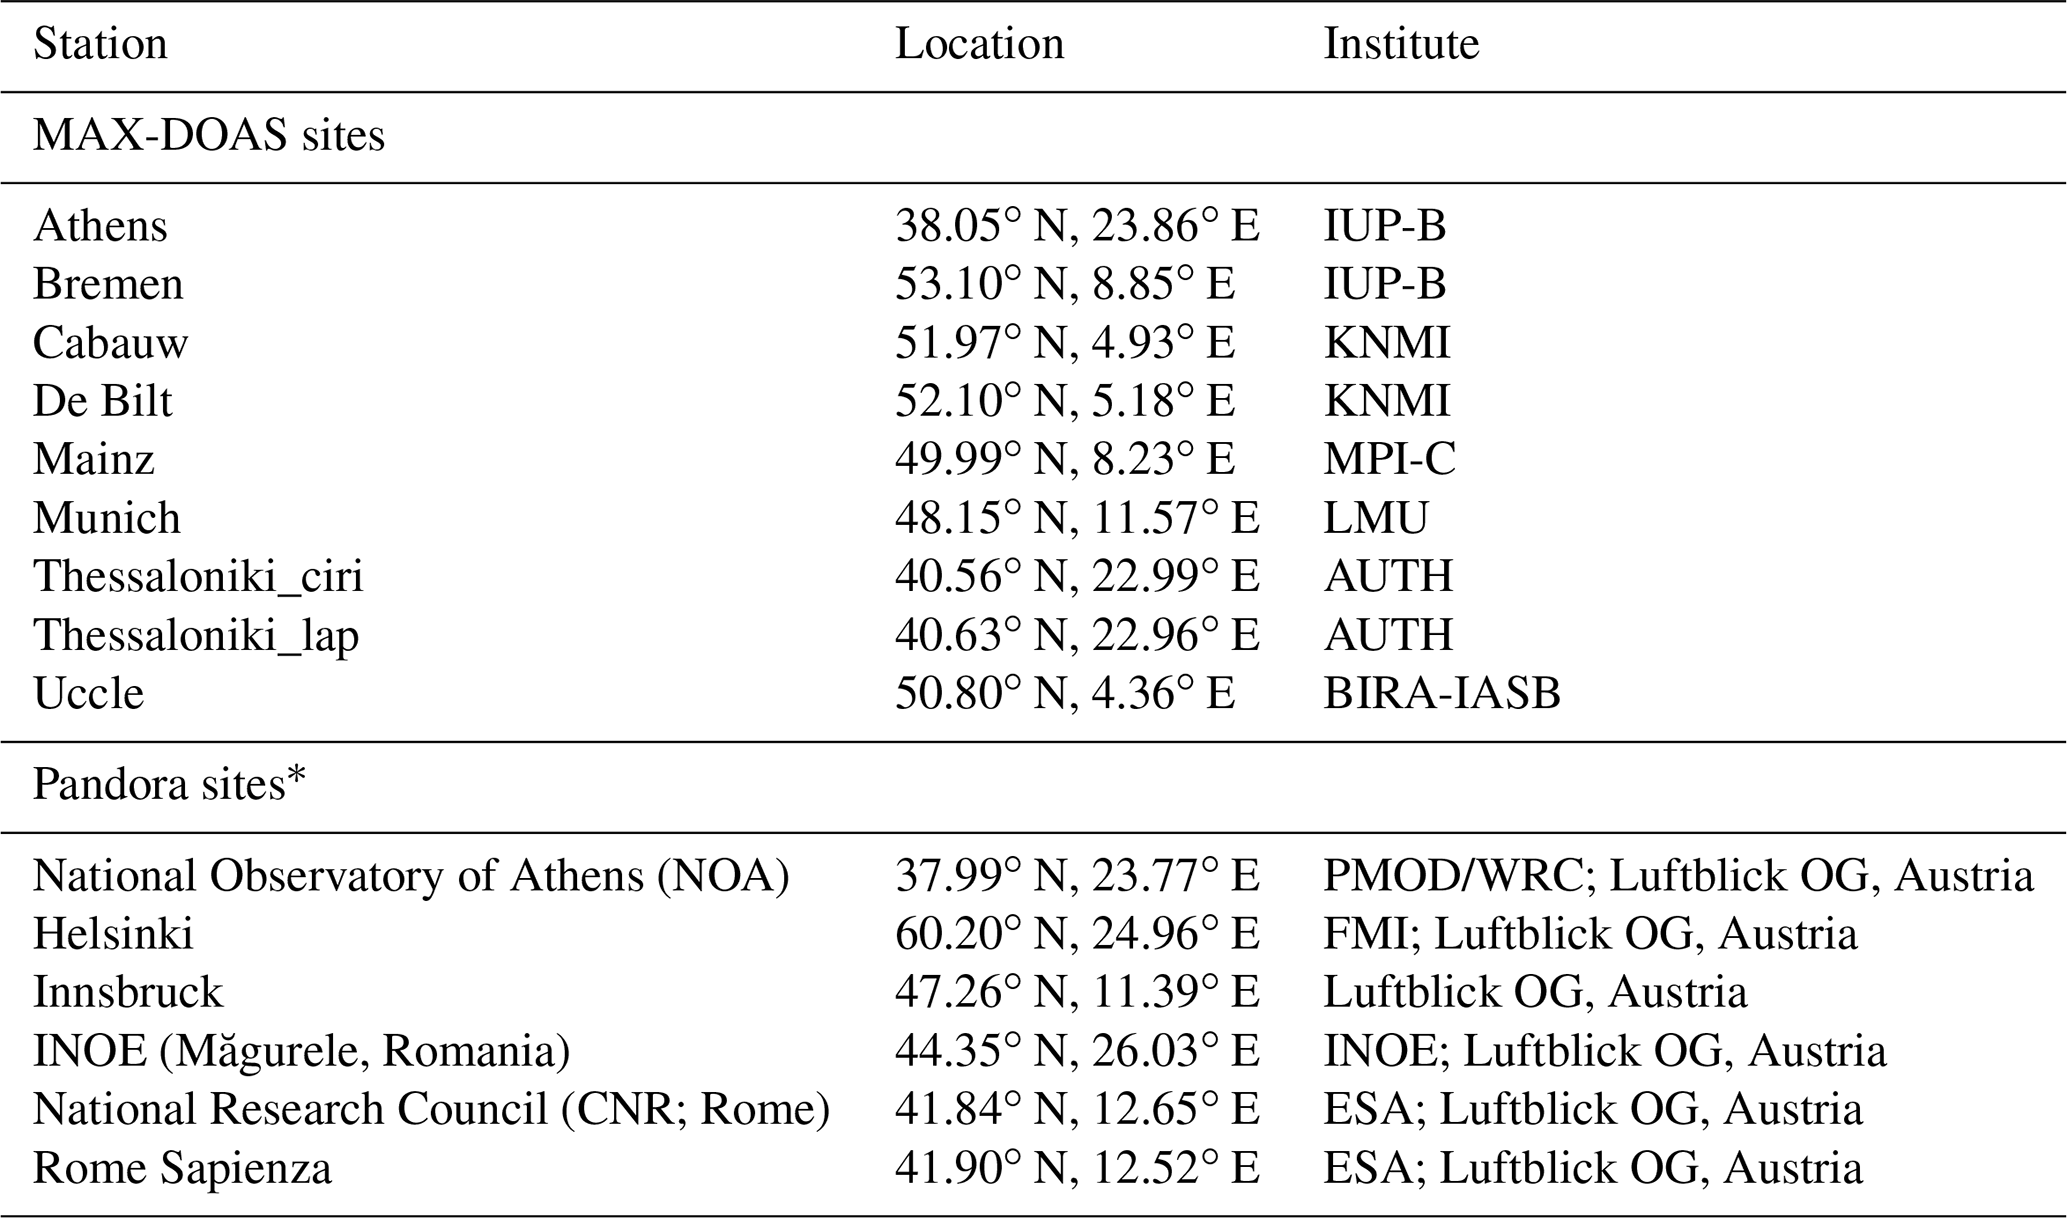
IUP-B is the Institute of Environmental Physics, University of Bremen. KNMI is the Royal Netherlands Meteorological Institute. MPI-C is the Max-Planck-Institut für Chemie. LMU is the Ludwig-Maximilians-Universität München. AUTH is the Aristotle University of Thessaloniki. BIRA-IASB is the Royal Belgian Institute for Space Aeronomy. PMOD/WRC is the Physical Meteorological Observatory of Davos. FMI is the Finnish Meteorological Institute. INOE is the National Institute for Research and Development in Optoelectronics, Romania. ESA is the European Space Agency. * Note that, although the Pandora site of Ny-Ålesund (Svalbard) is within the range of truncated orbits of the S5P-RG product, the product has fill values for the CAMS-specific fields, so this location was not considered.
In order to focus on the tropospheric VCD, tropospheric columns are estimated from the Pandora total columns by subtracting the S5P stratospheric estimation, as done in Pinardi et al. (2020). This is indicated by PGNtropo. The filter and colocation processing follows Verhoelst et al. (2021). Only satellite pixels with qa_value >0.75 and covering the ground-based instrument location are kept. Regarding PGN data, only the highest-quality label (0 and 10) is used. MAX-DOAS data are retained if the data within ±1 h of overpass time are available; the interpolated value at overpass time is then used. PGN data are retained if the data within ±0.5 h of overpass time are available; the average value is then used. Figure 15 presents the results of the validation as density scatterplots of the three datasets (the operational S5P, the S5P-RG, and the CAMS-RG-I shown as columns in the figure) versus the MAX-DOAS data (upper row) and the PGN data (lower row), where the co-located data are merged over all stations. Quality indicators for the bias (mean and median difference and median relative difference) and difference dispersion (standard deviation, SD, and one-half of the 68 inter-percentile, IP68) are provided, in addition to the Pearson's (R) correlation coefficient, the reduced major axis (RMA) regression slope and intercept, and the residual dispersion (SD and IP68) from the RMA regression line. For both the comparisons with MAX-DOAS and with PGN, one can conclude the following:
-
The overall bias (both absolute scale and relative) of S5P is more negative than that of S5P-RG, which in turn is more negative than that of CAMS-RG-I.
-
The bias of S5P clearly has a multiplicative component, as indicated by the low RMA regression slope. This component is reduced for S5P-RG.
-
Data are more scattered, with higher difference dispersion parameters, in the case of CAMS-RG-I, while the dispersion parameters are comparable for S5P and S5P-RG. The correlation is slightly better for S5P than for S5P-RG, while it is decidedly lower for CAMS-RG-I.
-
The dispersion from the regression line is lower for S5P than for S5P-RG, which in turn is lower than for CAMS-RG-I.
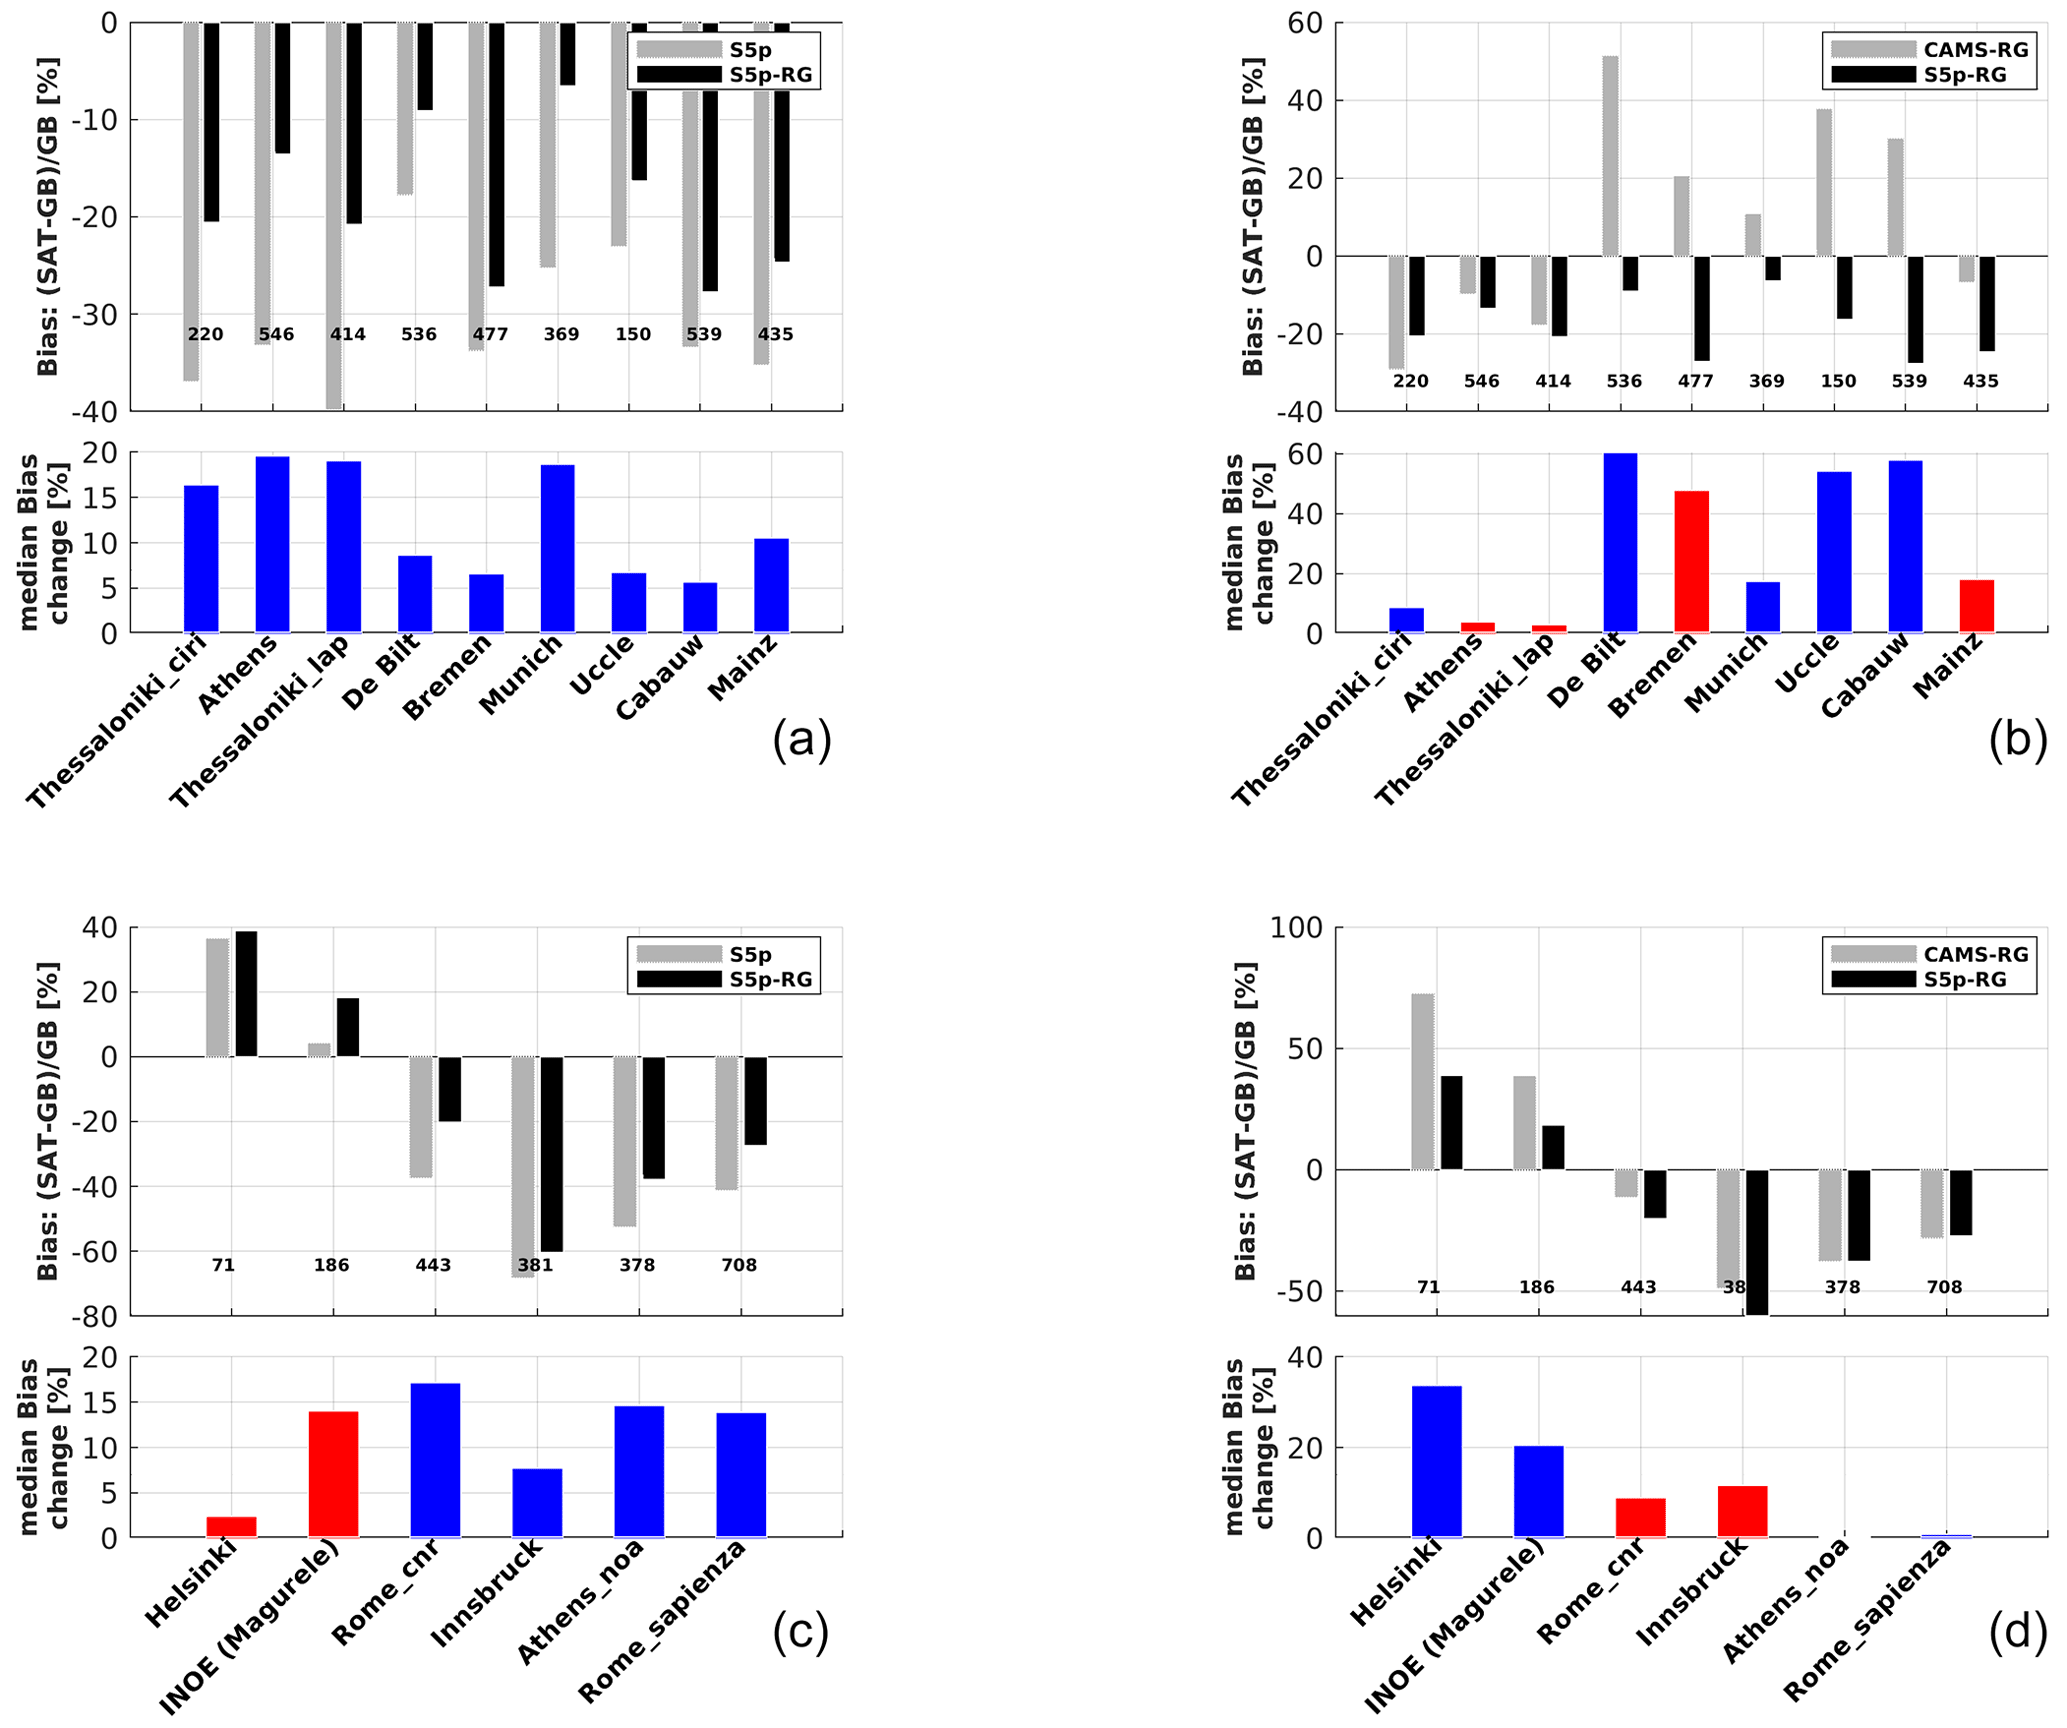
Figure 16Median biases and relative bias changes for the different comparisons at all the MAX-DOAS (a, b) and Pandora (c, d) stations. The left column (a, c) presents the comparison between SP5 (gray) and SP5-RG (black), while the right column (b, d) presents the comparison between CAMS-RG-I (gray) and S5P-RG (black).
Figure 16 is based on the same data, separated per station, that shows both the relative bias (median relative difference) for each dataset and the bias change with respect to S5P or CAMS-RG-I. Blue bars indicate a reduction in the bias, while red bars indicate an increase in the bias. At all stations, except the PGN sites of INOE, S5P-RG presents a reduction in the bias from 5 % to 18 % compared to S5P, showing the impact of the a priori profile shapes used in the satellite retrievals. Bias changes in S5P-RG compared to CAMS-RG-I can be positive or negative, are highly station dependent, and can be much larger in absolute value. The largest discrepancies (over 40 %) are found at the MAX-DOAS sites of De Bilt, Cabauw, Bremen, and Uccle. Difference dispersions per station (not shown) are mostly comparable between S5P and S5P-RG, while they are higher for CAMS-RG-I.
One should be aware that, even when a better a priori profile is used, it will still be different from the true profile. In combination with the different vertical sensitivity between the satellite and the reference data, a discrepancy will remain. Therefore, when profiles retrieved by MAX-DOAS are available, an alternative approach is the application of the satellite averaging kernels to the NO2 lower tropospheric profiles derived from the MAX-DOAS observations. This latter approach removes the TROPOMI a priori dependence from the relative comparison, and it has been shown in the recent quarterly validation report for the TROPOMI products (Lambert et al., 2021) that the (negative) bias estimate is reduced by up to 20 % when the MAX-DOAS profile data are smoothed vertically using S5P averaging kernels, indicating a significant impact of the profile shape due to the different vertical sensitivity profiles of MAX-DOAS versus the satellite retrievals. It was also shown in Liu et al. (2021) that using the S5P averaging kernel reduced the bias of about 16 % in Munich for their regional TROPOMI product. It is therefore likely that application of the satellite averaging kernel would remove part of the residual bias of S5P-RG. However, as there are profile measurements available for only one MAX-DOAS of the stations in Table 4, this topic is not pursued in this study.
In summary, one can conclude that the bias of the tropospheric NO2 of S5P-RG is improved compared to that of the operational S5P product for almost all stations by 5 %–18 %, while the overall dispersion of both products is similar, but the dispersion from the RMA regression line is better for the standard S5P. The difference dispersion and correlation parameters are superior for S5P and S5P-RG compared to CAMS-RG-I.
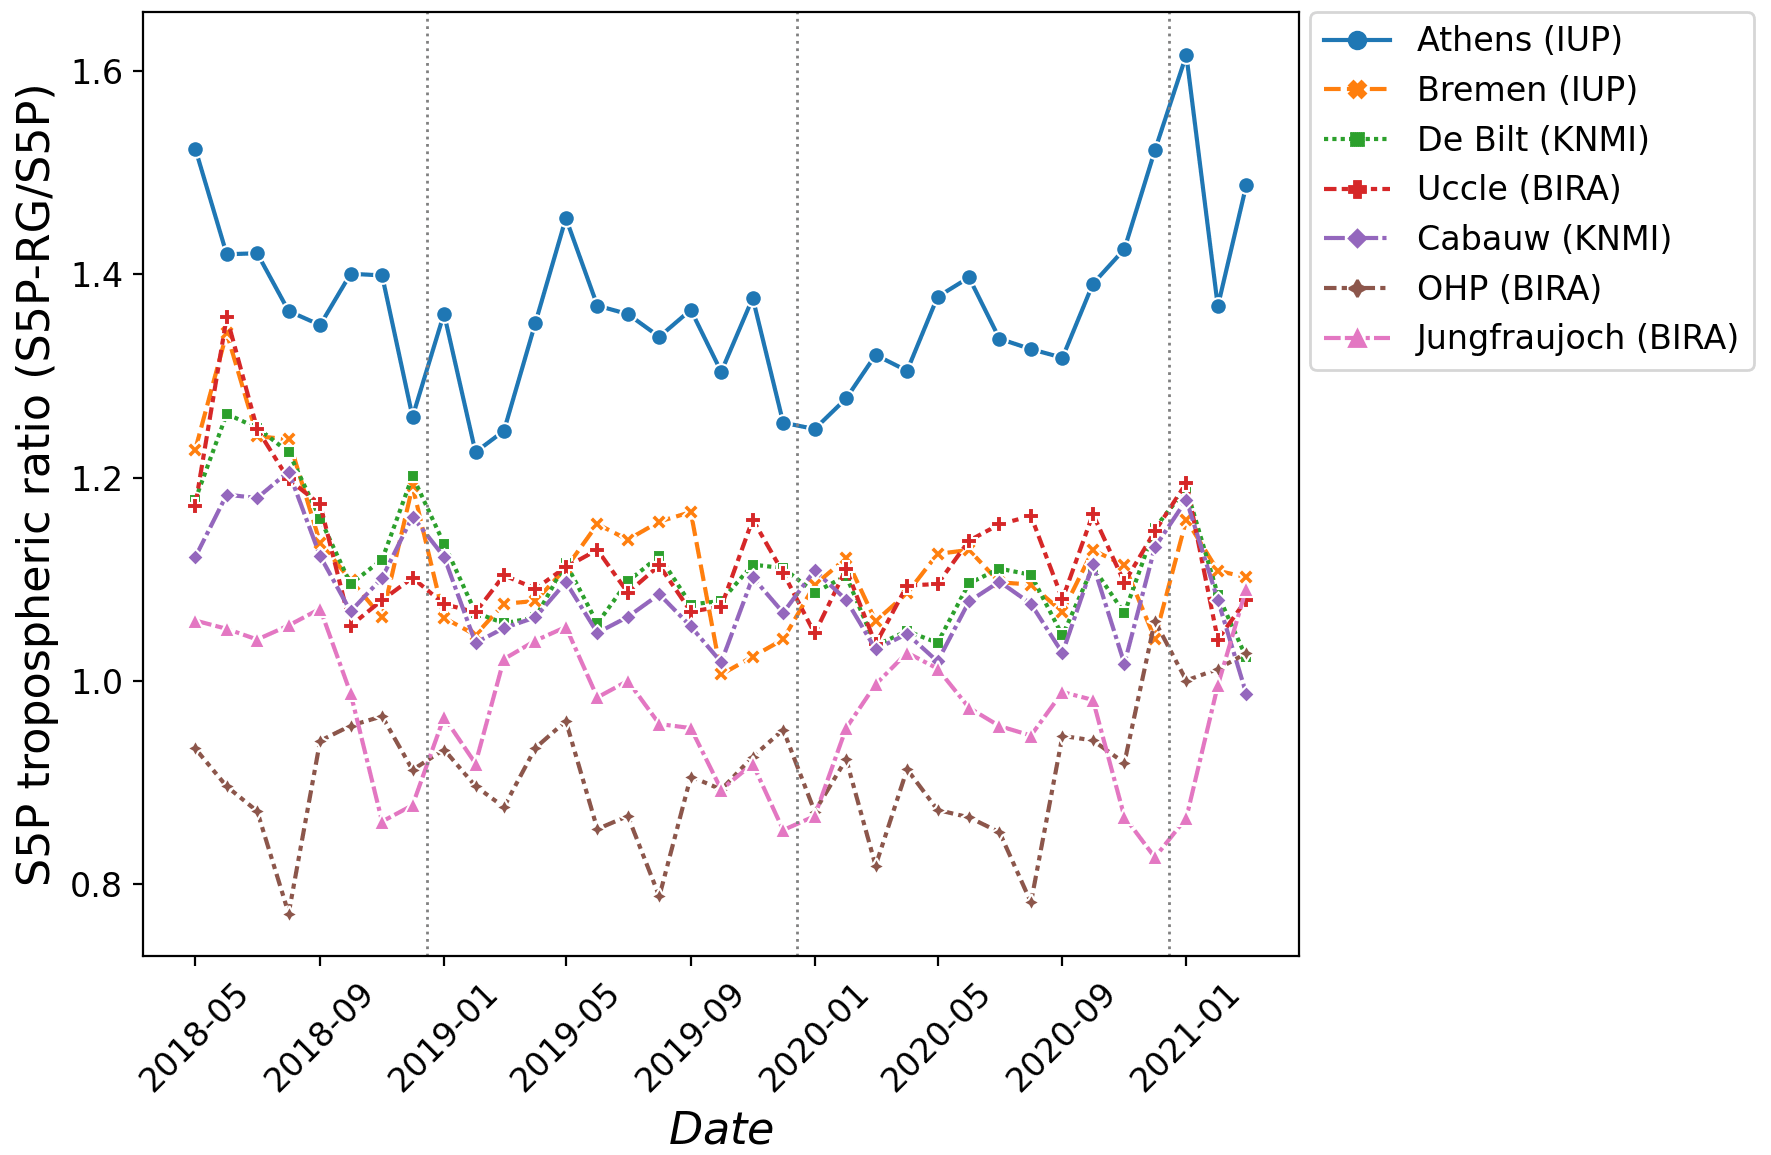
Figure 17Time series from May 2018 to March 2021 of the ratio of TROPOMI NO2 retrievals at sites with a MAX-DOAS instrument. The ratio is defined as the retrieval using the CAMS a priori profiles divided by the operational retrieval. The seven sites are Athens in Greece, Bremen in Germany, De Bilt in the Netherlands, Uccle in Belgium (urban), Cabauw in the Netherlands (close to urban areas), Observatoire de Haute-Provence (OHP) in France, and Jungfraujoch in Switzerland (remote).
In Fig. 17, we present the ratio of the CAMS a-priori-based retrieval by the original retrieval at the MAX-DOAS locations. Most locations show values of around 1.1, indicating that the coarse resolution of the TROPOMI a priori may lead to a 10 % underestimation of the tropospheric column in urban regions. For Athens, this is about 30 %, showing that the exact ratio will depend strongly on the location of the MAX-DOAS instrument. The remote locations show values smaller than unity, as discussed above. Interestingly, the ratio is relatively constant over the whole time period, with no obvious seasonality.
In this work, we present a comparison of tropospheric NO2 from TROPOMI observations over Europe with the median (ENSEMBLE) and seven individual models included in the CAMS regional air quality ensemble for various selected periods from May 2018 to March 2021. A methodological scheme was introduced to elucidate approaches for model–satellite comparisons, which builds on the fact that relative differences can be made independent of the a priori profile shape used in the satellite retrieval. We suggest that optimal model–satellite comparisons can be done in two ways, namely either by applying the satellite averaging kernels to the modeled profiles or by replacing the a priori in the retrieval with the modeled profiles, thus making use of the averaging kernel and air mass factor information in the original TROPOMI NO2 L2 files.
During summer, the tropospheric NO2 columns, based on the CAMS ENSEMBLE having applied the satellite averaging kernels, agree quantitatively to the corresponding columns from TROPOMI, especially over major European cities. Background values in summer, however, are found to be significantly higher in the TROPOMI dataset, either indicating issues with the modeling of soil emissions in the CAMS models or with the separation of troposphere from the stratosphere in the retrieval. In winter, the average ENSEMBLE-based column amount is found to be significantly and systematically higher, and the difference seems to increase with latitude. Possible reasons for this, including both larger retrieval uncertainties and modeling deficiencies of NO2 simulations in winter, were discussed. Validation against surface NO2 concentrations performed within CAMS does not confirm, however, this different behavior depending on latitude, a fact which points to the complementary value of satellite-derived tropospheric columns as a means for validating atmospheric composition models. Moreover, a well-documented negative bias in TROPOMI has been partly addressed in processor version 1.4.0 of the NO2 retrieval that became operational in December 2020, and this has led to an increase in the column amounts compared to previous versions, especially in winter. This development has the potential to reduce the aforementioned difference between TROPOMI and CAMS.
Qualitatively, the majority of all modeled NO2 local enhancements over cities, industries, powerplants, highways, and shipping routes, derived from the underlying emission maps, are also observed by TROPOMI. Transient features such as city plumes are also comparable, although the differences there appear more pronounced, as the characteristics of the modeled plumes are very sensitive to the modeling of advection. An examination of the spatial aspects of the columns derived on the basis of the individual CAMS regional models during a summer month mostly reveals similarities with those of the ENSEMBLE, but values, especially at hotspots, acquire quite different values, signifying a considerable model spread. TROPOMI columns in summertime are thus found to lie within that model spread in all examined areas. The spread is much more sizable during autumn–winter, but this increased model variability in wintertime conditions is apparently not enough to explain the large discrepancies between the satellite- and model-based columns. The spatial correlation in European cities, on the other hand, does not exhibit clear signs of seasonality, and in most cases, we obtain values larger than 0.8.
Comparisons of TROPOMI retrievals using the CAMS a priori based on the forecasts of analyses indicate that, in most areas of mainland Europe, retrievals based on analyzed profiles have up to ∼20 % higher values compared to those based on the forecasts, especially during the summertime. This indicates that the assimilation of NO2 observations by the models, mainly in the form of surface observations, can considerably modify the shape and values of the CAMS vertical profile. The difference in winter is significantly reduced.
By making use of the averaging kernel and air mass factor information in the original TROPOMI NO2 L2 files, we were also able to estimate the impact of the free troposphere on the model–satellite comparison, and despite the relatively small contribution of the free troposphere to the total tropospheric column, the effect on the comparison was found to be substantial, suggesting that the free troposphere should be invariably considered. This is of special interest as free tropospheric NO2 concentrations were generally found to be very low in the regional models at altitudes above 3 km, partly because processes like lightning, deep convection, and aircraft emissions are not consistently described in the regional models the way they are in the CAMS global system. TROPOMI tropospheric columns derived using alternative configurations of the CAMS profiles to replace the a priori of the retrieval were also compared, and while the use of the CAMS regional ENSEMBLE for the boundary layer systematically leads to higher urban area values due to the higher resolution of the underlying emissions and models, the use of the IFS (compo) model for the free troposphere was found to lead to more balanced or even decreased columns at rural areas.
We also introduce a new European TROPOMI L2 product utilizing a priori profiles from the CAMS models, building on the methodology and tools developed for the model–satellite comparisons. This new product makes use of a vertically merged CAMS regional ENSEMBLE and global model profile to replace the a priori used in the retrieval and thus takes advantage of the substantially higher horizontal resolution of the CAMS regional models, leading to an increase in the dynamical range of the NO2 columns compared to the operational retrieval product, with typically increased tropospheric columns of up to 30 % over emission hotspots and slight decreases over background areas.
This characteristic is further supported by calculating the ratio of the TROPOMI column with the replaced a priori over the native TROPOMI column at the locations of the global MAX-DOAS network of remote sensing instruments. Most urban locations indicate a column enhancement of at least 10 % when replacing the TM5-MP a priori of the retrieval with the merged CAMS profile.
Remote locations, however, point to values of the ratio being lower than unity, which means that the replacement of the a priori corrects to lower column values. These corrections seem to be robust in time, with no obvious seasonality. Comparisons with MAX-DOAS and PANDORA data indicate that the overall bias of tropospheric NO2 when replacing the a priori is improved when compared to that of the standard, operational S5P product. This is not the case for the correlation coefficient, suggesting that the CAMS profiles may not match the true profile variation well.
The findings of this paper reveal a generally favorable comparison between TROPOMI and the CAMS regional models, although certain aspects of the comparison expose some of the intrinsic uncertainties in both the TROPOMI product and the CAMS models. Noteworthy improvements are expected from the TROPOMI side, with the introduction of version 2.2.0 of the retrieval algorithm in July 2021, but these will unlikely be enough to bridge the gap with the wintertime modeled columns, as identified in our comparison. Identifying the reasons behind these discrepancies in NO2 columns might probably also require model sensitivity studies, with alternative chemistry and vertical mixing schemes, and further improvements in the input data, such as emissions and their injection heights.
The bulk of the code used in this paper is available on Zenodo (https://doi.org/10.5281/zenodo.7016483; Douros, 2022). Horizontal interpolation was done using the regridding capabilities of the Earth System Modeling Framework (ESMF; https://earthsystemmodeling.org/regrid, last access: 20 May 2022). TROPOMI L2 datasets used in this paper are made available operationally through the ESA Sentinel-5P data hub (https://s5phub.copernicus.eu, last access: 20 May 2022), while the new L2 product described in Sect. 6 is made available through the TEMIS portal (https://www.temis.nl/airpollution/no2col/no2_euro_tropomi_cams.php, last access: 20 May 2022). Since the conception and writing of this paper, the data in TEMIS have been updated using the S5P-PAL NO2 dataset (https://data-portal.s5p-pal.com/products/no2.html, last access: 20 October 2022), which is based on version 2.3.1 of the processor. Data for the new L2 product used in this paper have, however, been retained and can be made available, upon request to the corresponding author, to interested users.
CAMS model data, both for the regional models and IFS (compo) were retrieved from the CAMS Atmosphere Data Store (https://ads.atmosphere.copernicus.eu, last access: 20 May 2022) and its predecessor hosted by Météo-France.
The supplement related to this article is available online at: https://doi.org/10.5194/gmd-16-509-2023-supplement.
JD developed the code for the comparisons between TROPOMI and CAMS and for the production of the new L2 product. JD and HE were responsible for the development of the proposed methodology and are the main authors of the paper. SC and GP were responsible for the comparison with the MAX-DOAS and the Pandora observations. VHP and AC contributed to the CAMS modeling part. All authors reviewed and improved on the paper.
The contact author has declared that none of the authors has any competing interests.
Publisher's note: Copernicus Publications remains neutral with regard to jurisdictional claims in published maps and institutional affiliations.
Sentinel-5 Precursor is a European Space Agency (ESA) mission on behalf of the European Commission (EC). The TROPOMI payload is a joint development by ESA and the Netherlands Space Office (NSO). The Sentinel-5 Precursor ground segment development has been funded by ESA and with national contributions from the Netherlands, Germany, and Belgium. This work contains modified Copernicus Sentinel-5P TROPOMI data (2018–2021), processed in the operational framework or locally at KNMI, with post-processing for validation purposes performed by BIRA-IASB.
Part of the reported work was carried out in the framework of the Copernicus Sentinel-5 Precursor Mission Performance Centre (S5P MPC), contracted by the European Space Agency (ESA/ESRIN; contract no. 4000117151/16/I-LG) and supported by the Belgian Federal Science Policy Office (BELSPO), the Royal Belgian Institute for Space Aeronomy (BIRA-IASB), the Netherlands Space Office (NSO), and the German Aerospace Center (DLR). Part of this work was also carried out in the framework of the nationally funded S5P Validation Team (S5PVT) AO projects NIDFORVAL (ID no. 28607; principal investigator Gaia Pinardi, BIRA-IASB) and CESAR (ID no. 28596, principal investigator Arnoud Apituley, KNMI), which are acknowledged in particular for the collection of ground-based data tailored to the S5P validation. Steven Compernolle and Gaia Pinardi have been supported partly by BELSPO and ESA through the ProDEx project TROVA-E2 (grant no. PEA 4000116692).
The authors are indebted to the instrument principal investigators, staff at the stations, and supporting agencies for the acquisition and fast delivery of the MAX-DOAS and Pandora measurements contributing to this paper. The authors are especially grateful to ESA/ESRIN, for running the FRM4DOAS and Pandonia FRM projects of the Fiducial Reference Measurements (FRM) program, and for supporting the ESA Atmospheric Validation Data Centre (EVDC) established at NILU. The MAX-DOAS data used in this publication were obtained from Alkiviadis Bais (AUTH), for Thessaloniki, Ankie Piters (KNMI), for Cabauw and De Bilt, John P. Burrows and Andreas Richter (IUP-B), for Bremen and Athens (Athens instrument hosted by NOA), Ka Lok Chan (DLR), for Munich, Michel Van Roozendael (BIRA-IASB), for Uccle, and Thomas Wagner (MPIC), for Mainz. Part of the MAX-DOAS data contributes to the Network for the Detection of Atmospheric Composition Change (NDACC) and is publicly available. The PGN data were collected from Stelios Kazadzis (PMOD/WRC), for Athens, Jari Hovila (FMI), for Helsinki, Anca Nemuc (INOE), for Măgurele, Martin Tiefengraber (Luftblick), for Innsbruck, and Stefano Casadio (ESA), for Rome CNR and Rome Sapienza, while central data processing is done by Martin Tiefengraber (Luftblick). PGN is a bilateral project supported with funding from ESA and NASA, and the data are available publicly.
The authors express special thanks to Ann Mari Fjæraa (NILU), Sander Niemeijer (s[&]t), José Granville, and Olivier Rasson (BIRA-IASB), for post-processing of the network and satellite data and for their dedication to the S5P TROPOMI operational validation. The authors are also thankful to Tijl Verhoelst (BIRA-IASB), for in-depth discussions on NO2 validation methods and uncertainties. Copernicus Atmosphere Monitoring Service (CAMS) is implemented by the European Centre for Medium-Range Weather Forecasts and its contractors on behalf of the European Commission Directorate-General for Defence Industry and Space sector (DG DEFIS) as a component of the European Union's flagship Space program Copernicus.
This research has been supported by the European Space Agency (ESA/ESRIN; contract no. 4000117151/16/I-LG) and BELSPO and ESA through the ProDEx project TROVA-E2 (grant no. PEA 4000116692).
This paper was edited by Slimane Bekki and reviewed by two anonymous referees.
Barré, J., Petetin, H., Colette, A., Guevara, M., Peuch, V.-H., Rouil, L., Engelen, R., Inness, A., Flemming, J., Pérez García-Pando, C., Bowdalo, D., Meleux, F., Geels, C., Christensen, J. H., Gauss, M., Benedictow, A., Tsyro, S., Friese, E., Struzewska, J., Kaminski, J. W., Douros, J., Timmermans, R., Robertson, L., Adani, M., Jorba, O., Joly, M., and Kouznetsov, R.: Estimating lockdown-induced European NO2 changes using satellite and surface observations and air quality models, Atmos. Chem. Phys., 21, 7373–7394, https://doi.org/10.5194/acp-21-7373-2021, 2021. a
Bauwens, M., Compernolle, S., Stavrakou, T., Müller, J. F., van Gent, J., Eskes, H., Levelt, P. F., van der A, R., Veefkind, J. P., Vlietinck, J., Yu, H., and Zehner, C.: Impact of coronavirus outbreak on NO2 pollution assessed using TROPOMI and OMI observations, Geophys. Res. Lett., 47, e2020GL087978, https://doi.org/10.1029/2020GL087978, 2020. a
Blechschmidt, A.-M., Arteta, J., Coman, A., Curier, L., Eskes, H., Foret, G., Gielen, C., Hendrick, F., Marécal, V., Meleux, F., Parmentier, J., Peters, E., Pinardi, G., Piters, A. J. M., Plu, M., Richter, A., Segers, A., Sofiev, M., Valdebenito, Á. M., Van Roozendael, M., Vira, J., Vlemmix, T., and Burrows, J. P.: Comparison of tropospheric NO2 columns from MAX-DOAS retrievals and regional air quality model simulations, Atmos. Chem. Phys., 20, 2795–2823, https://doi.org/10.5194/acp-20-2795-2020, 2020. a, b, c
Boersma, K. F., Eskes, H. J., Richter, A., De Smedt, I., Lorente, A., Beirle, S., van Geffen, J. H. G. M., Zara, M., Peters, E., Van Roozendael, M., Wagner, T., Maasakkers, J. D., van der A, R. J., Nightingale, J., De Rudder, A., Irie, H., Pinardi, G., Lambert, J.-C., and Compernolle, S. C.: Improving algorithms and uncertainty estimates for satellite NO2 retrievals: results from the quality assurance for the essential climate variables (QA4ECV) project, Atmos. Meas. Tech., 11, 6651–6678, https://doi.org/10.5194/amt-11-6651-2018, 2018. a
Borsdorff, T., Aan de Brugh, J., Hu, H., Aben, I., Hasekamp, O., and Landgraf, J.: Measuring carbon monoxide with TROPOMI: First results and a comparison with ECMWF-IFS analysis data, Geophys. Res. Lett., 45, 2826–2832, https://doi.org/10.1002/2018GL077045, 2018. a
Brandt, J., Silver, J. D., Frohn, L. M., Geels, C., Gross, A., Hansen, A. B., Hansen, K. M., Hedegaard, G. B., Skjøth, C. A., Villadseni, H., Zare, A., and Christensen, J. H.: An integrated model study for Europe and North America using the Danish Eulerian Hemispheric Model with focus on intercontinental transport of air pollution, Atmos. Environ., 53, 156–176, https://doi.org/10.1016/j.atmosenv.2012.01.011, 2012. a
Celarier, E. A., Brinksma, E. J., Gleason, J. F., Veefkind, J. P., Cede, A., Herman, J. R., Ionov, D., Pommereau, J.-P., Goutail, F., Lambert, J.-C., Pinardi, G., Van Roozendael, M., Wittrock, F., Schonhardt, A., Richter, A., Ibrahim, O. W., Wagner, T., Bojkov, B., Mount, G., Spine, E., Chen, C. M., Pongett, T. J., Sander, S. P., Bucsela, E. J., Wenig, M., Swart, D. P. J., Volten, H., Levelt, P. F., and Kroon, M.: Validation of Ozone Monitoring Instrument nitrogen dioxide columns, J. Geophys. Res., 113, D15S15, https://doi.org/10.1029/2007JD008908, 2008. a
Chan, K. L., Wiegner, M., van Geffen, J., De Smedt, I., Alberti, C., Cheng, Z., Ye, S., and Wenig, M.: MAX-DOAS measurements of tropospheric NO2 and HCHO in Munich and the comparison to OMI and TROPOMI satellite observations, Atmos. Meas. Tech., 13, 4499–4520, https://doi.org/10.5194/amt-13-4499-2020, 2020. a
Choi, W. J., Moon, K. J., Yoon, J., Cho, A., Kim, S. K., Lee, S., Ko, D. H., Kim, J., Ahn, M. H., Kim, D. R., Kim, S. M., Kim, J. Y., Nicks, D., and Kim, J. S.: Introducing the Geostationary Environment Monitoring Spectrometer, J. Appl. Remote Sens., 13, 044005, https://doi.org/10.1117/1.JRS.12.044005, 2018. a
Compernolle, S., Verhoelst, T., Pinardi, G., Granville, J., Hubert, D., Keppens, A., Niemeijer, S., Rino, B., Bais, A., Beirle, S., Boersma, F., Burrows, J. P., De Smedt, I., Eskes, H., Goutail, F., Hendrick, F., Lorente, A., Pazmino, A., Piters, A., Peters, E., Pommereau, J.-P., Remmers, J., Richter, A., van Geffen, J., Van Roozendael, M., Wagner, T., and Lambert, J.-C.: Validation of Aura-OMI QA4ECV NO2 climate data records with ground-based DOAS networks: the role of measurement and comparison uncertainties, Atmos. Chem. Phys., 20, 8017–8045, https://doi.org/10.5194/acp-20-8017-2020, 2020. a
De Smedt, I., Theys, N., Yu, H., Danckaert, T., Lerot, C., Compernolle, S., Van Roozendael, M., Richter, A., Hilboll, A., Peters, E., Pedergnana, M., Loyola, D., Beirle, S., Wagner, T., Eskes, H., van Geffen, J., Boersma, K. F., and Veefkind, P.: Algorithm theoretical baseline for formaldehyde retrievals from S5P TROPOMI and from the QA4ECV project, Atmos. Meas. Tech., 11, 2395–2426, https://doi.org/10.5194/amt-11-2395-2018, 2018. a
Ding, J., van der A, R., Eskes, H., Mijling, B., Stavrakou, R., van Geffen, J., and Veefkind, P.: NOx emissions reduction and rebound in China due to the COVID-19 crisis, Geophys. Res. Lett., 46, e2020GL089912, https://doi.org/10.1029/2020GL089912, 2020. a
Dirksen, R. J., Boersma, K. F., Eskes, H. J., Ionov, D. V., Bucsela, E. J., Levelt, P. F., and Kelder, H. M.: Evaluation of stratospheric NO2 retrieved from the Ozone Monitoring Instrument: Intercomparison, diurnal cycle, and trending, J. Geophys. Res., 116, D08305, https://doi.org/10.1029/2010JD014943, 2011. a
Douros, J.: CAMSvsTROPOMI: Comparison of CAMS regional models with TROPOMI NO2 (v0.2), Zenodo [code], https://doi.org/10.5281/zenodo.7016484, 2022. a
Douros, J., Eskes, H. J., Akritidis, D., Antonakaki, T., Bennouna, Y., Blechschmidt, A.-M., Bösch, T., Clark, H., Gielen, C., Hendrick, F., Kapsomenakis, J., Kartsios, S., Katragkou, E., Melas, D., Mortier, A., Peters, E., Petersen, K., Piters, A., Richter, A., van Roozendael, M., Schulz, M., Sudarchikova, N., Wagner, A., Zanis, P., and Zerefos, C.: Validation of CAMS regional services: concentrations above the surface, Status update for June–August 2020, Copernicus Atmosphere Monitoring Service (CAMS) report, CAMS84_2018SC2_D4.1.1-JJA2020, https://doi.org/10.24380/jwv9-qs38, 2020. a, b, c, d
Eskes, H., Huijnen, V., Arola, A., Benedictow, A., Blechschmidt, A.-M., Botek, E., Boucher, O., Bouarar, I., Chabrillat, S., Cuevas, E., Engelen, R., Flentje, H., Gaudel, A., Griesfeller, J., Jones, L., Kapsomenakis, J., Katragkou, E., Kinne, S., Langerock, B., Razinger, M., Richter, A., Schultz, M., Schulz, M., Sudarchikova, N., Thouret, V., Vrekoussis, M., Wagner, A., and Zerefos, C.: Validation of reactive gases and aerosols in the MACC global analysis and forecast system, Geosci. Model Dev., 8, 3523–3543, https://doi.org/10.5194/gmd-8-3523-2015, 2015. a
Eskes, H., van Geffen, J., Boersma, F., Eichmann, K.-U., Apituley, A., Pedergnana, M., Sneep, M., Veefkind, J. P., and Loyola, D.: Sentinel-5 precursor/TROPOMI Level 2 Product User Manual Nitrogendioxide, Tech. Rep. S5P-KNMI-L2- 0021-MA, Koninklijk Nederlands Meteorologisch Instituut (KNMI), CI-7570-PUM, issue 4.1.0, https://sentinels.copernicus.eu/documents/247904/2474726/Sentinel-5P-Level-2-Product-User-Manual-Nitrogen-Dioxide.pdf (last access: 23 January 2023), 11 July 2022. a, b, c, d, e
Eskes, H. J. and Boersma, K. F.: Averaging kernels for DOAS total-column satellite retrievals, Atmos. Chem. Phys., 3, 1285–1291, https://doi.org/10.5194/acp-3-1285-2003, 2003. a, b
Eskes, H. J. and Eichmann, K. U.: S5P Mission Performance Centre Nitrogen Dioxide [L2__NO2___] Readme, Rep. 02.02.00, S5P-MPC-KNMI-PRF-NO2, https://sentinel.esa.int/documents/247904/3541451/Sentinel-5P-Nitrogen-Dioxide-Level-2-Product-Readme-File (last access: 22 January 2023), 2021. a
Flemming, J., Huijnen, V., Arteta, J., Bechtold, P., Beljaars, A., Blechschmidt, A.-M., Diamantakis, M., Engelen, R. J., Gaudel, A., Inness, A., Jones, L., Josse, B., Katragkou, E., Marecal, V., Peuch, V.-H., Richter, A., Schultz, M. G., Stein, O., and Tsikerdekis, A.: Tropospheric chemistry in the Integrated Forecasting System of ECMWF, Geosci. Model Dev., 8, 975–1003, https://doi.org/10.5194/gmd-8-975-2015, 2015. a, b
Gkatzelis, G. I., Gilman, J. B., Brown, S. S., Eskes, H., Gomes, A. R., Lange, A. C., McDonald, B. C., Peischl, J., Petzold, A., Thompson, C. R., and Kiendler-Scharr, A.: The global impacts of COVID-19 lockdowns on urban air pollution: A critical review and recommendations, Elementa: Science of the Anthropocene, 9, 00176, https://doi.org/10.1525/elementa.2021.00176, 2021. a
Goldberg, D. L., Lu, Z., Streets, G. D., de Foy, B., Griffin, D., McLinden, A. C., Lamsal, N. L., Krotkov, A. N., and Eskes, H.: Enhanced Capabilities of TROPOMI NO2: Estimating NOx from North American Cities and Power Plants, Environ. Sci. Technol., 53, 12594–12601, https://doi.org/10.1021/acs.est.9b04488, 2019. a
Granier, C., Darras, S., Denier van der Gon, H. A. C., Doubalova, J., Elguindi, N., Galle, B., Gauss, M., Guevara, M., Jalkanen, J.-P., Kuenen, J., Liousse, C., Quack, B., Simpson, D., and Sindelarova, K.: The Copernicus Atmosphere Monitoring Service global and regional emissions (April 2019 version), Copernicus Atmosphere Monitoring Service (CAMS) report, 2019, https://doi.org/10.24380/d0bn-kx16, 2019. a
Griffin, D., McLinden, C. A., Boersma, F., Bourassa, A., Dammers, E., Degenstein, D., Eskes, H., Fehr, L., Fioletov, V., Hayden, K., Li, S.-M., Makar, P., Martin, R., Mihele, C., Krotkov, N., Sneep, M., ter Linden, M., van Geffen, J., Veefkind, P., Wolde, M., and Zhao, X.: High resolution mapping of nitrogen dioxide with TROPOMI: First results and validation over the Canadian oil sands, Geophys. Res. Lett., 46, 1049–1060, https://doi.org/10.1029/2018GL081095, 2019. a, b
Georgoulias, K. A., Boersma, K. F., van Vliet, J., Zhang, X., van der A, R., Zanis, P., and de Laat, J.: Detection of NO2 pollution plumes from individual ships with the TROPOMI/S5P satellite sensor, Environ. Res. Lett., 15, 124037, https://doi.org/10.1088/1748-9326/abc445, 2020. a
Guevara, M., Jorba, O., Soret, A., Petetin, H., Bowdalo, D., Serradell, K., Tena, C., Denier van der Gon, H., Kuenen, J., Peuch, V.-H., and Pérez García-Pando, C.: Time-resolved emission reductions for atmospheric chemistry modelling in Europe during the COVID-19 lockdowns, Atmos. Chem. Phys., 21, 773–797, https://doi.org/10.5194/acp-21-773-2021, 2021. a
Guth, J., Josse, B., Marécal, V., Joly, M., and Hamer, P.: First implementation of secondary inorganic aerosols in the MOCAGE version R2.15.0 chemistry transport model, Geosci. Model Dev., 9, 137–160, https://doi.org/10.5194/gmd-9-137-2016, 2016. a
Herman, J. R., Cede, A., Spinei, E., Mount, G. H., Tzortziou, M., and Abuhassan, N.: NO2 column amounts from ground‐based Pandora and MFDOAS spectrometers using the direct‐sun DOAS technique: Intercomparisons and application to OMI validation, J. Geophys. Res., 114, D13307, https://doi.org/10.1029/2009JD011848, 2009. a
Herman, J., Abuhassan, N., Kim, J., Kim, J., Dubey, M., Raponi, M., and Tzortziou, M.: Underestimation of column NO2 amounts from the OMI satellite compared to diurnally varying ground-based retrievals from multiple PANDORA spectrometer instruments, Atmos. Meas. Tech., 12, 5593–5612, https://doi.org/10.5194/amt-12-5593-2019, 2019. a
Hollingsworth, A., Engelen, R. J., Textor, C., Benedetti, A., Boucher, O., Chevallier, F., Dethof, A., Elbern, H., Eskes, H., Flemming, J., Granier, C., Kaiser, J. W., Morcrette, J.-J., Rayner, P., Peuch, V.-H., Rouil, L., Schultz, M. G., Simmons, A. J., and the GEMS Consortium 2008: Toward a monitoring and forecasting system for atmospheric composition: The Gems Project, B. Am. Meteorol. Soc., 89, 1147–1164, https://doi.org/10.1175/2008BAMS2355.1, 2008. a
Huijnen, V., Eskes, H. J., Poupkou, A., Elbern, H., Boersma, K. F., Foret, G., Sofiev, M., Valdebenito, A., Flemming, J., Stein, O., Gross, A., Robertson, L., D'Isidoro, M., Kioutsioukis, I., Friese, E., Amstrup, B., Bergstrom, R., Strunk, A., Vira, J., Zyryanov, D., Maurizi, A., Melas, D., Peuch, V.-H., and Zerefos, C.: Comparison of OMI NO2 tropospheric columns with an ensemble of global and European regional air quality models, Atmos. Chem. Phys., 10, 3273–3296, https://doi.org/10.5194/acp-10-3273-2010, 2010a. a, b, c, d, e
Huijnen, V., Williams, J., van Weele, M., van Noije, T., Krol, M., Dentener, F., Segers, A., Houweling, S., Peters, W., de Laat, J., Boersma, F., Bergamaschi, P., van Velthoven, P., Le Sager, P., Eskes, H., Alkemade, F., Scheele, R., Nédélec, P., and Pätz, H.-W.: The global chemistry transport model TM5: description and evaluation of the tropospheric chemistry version 3.0, Geosci. Model Dev., 3, 445–473, https://doi.org/10.5194/gmd-3-445-2010, 2010b. a
Huijnen, V., Pozzer, A., Arteta, J., Brasseur, G., Bouarar, I., Chabrillat, S., Christophe, Y., Doumbia, T., Flemming, J., Guth, J., Josse, B., Karydis, V. A., Marécal, V., and Pelletier, S.: Quantifying uncertainties due to chemistry modelling – evaluation of tropospheric composition simulations in the CAMS model (cycle 43R1), Geosci. Model Dev., 12, 1725–1752, https://doi.org/10.5194/gmd-12-1725-2019, 2019. a
Ialongo, I., Virta, H., Eskes, H., Hovila, J., and Douros, J.: Comparison of TROPOMI/Sentinel-5 Precursor NO2 observations with ground-based measurements in Helsinki, Atmos. Meas. Tech., 13, 205–218, https://doi.org/10.5194/amt-13-205-2020, 2020. a
Ingmann, P., Veihelmann, B., Langen, J., Lamarre, D., Stark, H., and Courrèges-Lacoste, G. B.: Requirements for the GMES atmosphere service and ESA's implementation concept: Sentinels-4/-5 and -5p, Remote Sens. Environ., 120, 58–69, https://doi.org/10.1016/j.rse.2012.01.023, 2012. a
Inness, A., Blechschmidt, A.-M., Bouarar, I., Chabrillat, S., Crepulja, M., Engelen, R. J., Eskes, H., Flemming, J., Gaudel, A., Hendrick, F., Huijnen, V., Jones, L., Kapsomenakis, J., Katragkou, E., Keppens, A., Langerock, B., de Mazière, M., Melas, D., Parrington, M., Peuch, V. H., Razinger, M., Richter, A., Schultz, M. G., Suttie, M., Thouret, V., Vrekoussis, M., Wagner, A., and Zerefos, C.: Data assimilation of satellite-retrieved ozone, carbon monoxide and nitrogen dioxide with ECMWF's Composition-IFS, Atmos. Chem. Phys., 15, 5275–5303, https://doi.org/10.5194/acp-15-5275-2015, 2015. a, b
Inness, A., Ades, M., Agustí-Panareda, A., Barré, J., Benedictow, A., Blechschmidt, A.-M., Dominguez, J. J., Engelen, R., Eskes, H., Flemming, J., Huijnen, V., Jones, L., Kipling, Z., Massart, S., Parrington, M., Peuch, V.-H., Razinger, M., Remy, S., Schulz, M., and Suttie, M.: The CAMS reanalysis of atmospheric composition, Atmos. Chem. Phys., 19, 3515–3556, https://doi.org/10.5194/acp-19-3515-2019, 2019a. a, b
Inness, A., Flemming, J., Heue, K.-P., Lerot, C., Loyola, D., Ribas, R., Valks, P., van Roozendael, M., Xu, J., and Zimmer, W.: Monitoring and assimilation tests with TROPOMI data in the CAMS system: near-real-time total column ozone, Atmos. Chem. Phys., 19, 3939–3962, https://doi.org/10.5194/acp-19-3939-2019, 2019b. a
Kaminski, J. W., Neary, L., Struzewska, J., McConnell, J. C., Lupu, A., Jarosz, J., Toyota, K., Gong, S. L., Côté, J., Liu, X., Chance, K., and Richter, A.: GEM-AQ, an on-line global multiscale chemical weather modelling system: model description and evaluation of gas phase chemistry processes, Atmos. Chem. Phys., 8, 3255–3281, https://doi.org/10.5194/acp-8-3255-2008, 2008. a
Kuenen, J. J. P., Visschedijk, A. J. H., Jozwicka, M., and Denier van der Gon, H. A. C.: TNO-MACC_II emission inventory; a multi-year (2003–2009) consistent high-resolution European emission inventory for air quality modelling, Atmos. Chem. Phys., 14, 10963–10976, https://doi.org/10.5194/acp-14-10963-2014, 2014. a
Lambert, J.-C., Compernolle, S., Eichmann, K.-U., de Graaf, M., Hubert, D., Keppens, A., Kleipool, Q., Langerock, B., Sha, M. K., Verhoelst, T., Wagner, T., Ahn, C., Argyrouli, A., Balis, D., Chan, K. L., De Smedt, I., Eskes, H., Fjæraa, A. M., Garane, K., Gleason, J. F., Goutail, F., Granville, J., Hedelt, P., Heue, K.-P., Jaross, G., Koukouli, M. L., Landgraf, J., Lutz, R., Nanda, S., Niemeijer, S., Pazmiño, A., Pinardi, G., Pommereau, J.-P., Richter, A., Rozemeijer, N., Sneep, M., Stein Zweers, D., Theys, N., Tilstra, G., Torres, O., Valks, P., van Geffen, J., Vigouroux, C., Wang, P., and Weber, M.: Quarterly Validation Report of the Copernicus Sentinel-5 Precursor Operational Data Products #10: April 2018–March 2021, S5P MPC Routine Operations Consolidated Validation Report series, Issue 10, Version 10.00.10, 170 pp., 15 March 2021. a, b, c, d, e, f, g, h
Laughner, J. L., Zhu, Q., and Cohen, R. C.: Evaluation of version 3.0B of the BEHR OMI NO2 product, Atmos. Meas. Tech., 12, 129–146, https://doi.org/10.5194/amt-12-129-2019, 2019. a, b
Lin, J.-T., Martin, R. V., Boersma, K. F., Sneep, M., Stammes, P., Spurr, R., Wang, P., Van Roozendael, M., Clémer, K., and Irie, H.: Retrieving tropospheric nitrogen dioxide from the Ozone Monitoring Instrument: effects of aerosols, surface reflectance anisotropy, and vertical profile of nitrogen dioxide, Atmos. Chem. Phys., 14, 1441–1461, https://doi.org/10.5194/acp-14-1441-2014, 2014. a
Liu, F., Page, A., Strode, S. A., Yoshida, Y., Choi, S., Zheng, B., Lamsal, L. N., Li, C., Krotkov, N. A., Eskes, H., van der A, R., Veefkind, P., Levelt, P. F., Hauser, O. P., Joiner, J.: Abrupt decline in tropospheric nitrogen dioxide over China after the outbreak of COVID-19, Sci. Adv., 6, eabc2992, https://doi.org/10.1126/sciadv.abc2992, 2020. a
Liu, M., Lin, J., Kong, H., Boersma, K. F., Eskes, H., Kanaya, Y., He, Q., Tian, X., Qin, K., Xie, P., Spurr, R., Ni, R., Yan, Y., Weng, H., and Wang, J.: A new TROPOMI product for tropospheric NO2 columns over East Asia with explicit aerosol corrections, Atmos. Meas. Tech., 13, 4247–4259, https://doi.org/10.5194/amt-13-4247-2020, 2020. a, b
Liu, S., Valks, P., Pinardi, G., Xu, J., Chan, K. L., Argyrouli, A., Lutz, R., Beirle, S., Khorsandi, E., Baier, F., Huijnen, V., Bais, A., Donner, S., Dörner, S., Gratsea, M., Hendrick, F., Karagkiozidis, D., Lange, K., Piters, A. J. M., Remmers, J., Richter, A., Van Roozendael, M., Wagner, T., Wenig, M., and Loyola, D. G.: An improved TROPOMI tropospheric NO2 research product over Europe, Atmos. Meas. Tech., 14, 7297–7327, https://doi.org/10.5194/amt-14-7297-2021, 2021. a, b
Lorente, A., Folkert Boersma, K., Yu, H., Dörner, S., Hilboll, A., Richter, A., Liu, M., Lamsal, L. N., Barkley, M., De Smedt, I., Van Roozendael, M., Wang, Y., Wagner, T., Beirle, S., Lin, J.-T., Krotkov, N., Stammes, P., Wang, P., Eskes, H. J., and Krol, M.: Structural uncertainty in air mass factor calculation for NO2 and HCHO satellite retrievals, Atmos. Meas. Tech., 10, 759–782, https://doi.org/10.5194/amt-10-759-2017, 2017. a
Lorente, A., Boersma, K. F., Eskes, H. J., Veefkind, J. P., van Geffen, J. H. G. M., de Zeeuw, M. B., Denier van der Gon, H. A. C., Beirle, S., and Krol, M. C.: Quantification of nitrogen oxides emissions from build-up of pollution over Paris with TROPOMI, Sci. Rep.-UK, 9, 20033, https://doi.org/10.1038/s41598-019-56428-5, 2019. a
Manders, A. M. M., Builtjes, P. J. H., Curier, L., Denier van der Gon, H. A. C., Hendriks, C., Jonkers, S., Kranenburg, R., Kuenen, J. J. P., Segers, A. J., Timmermans, R. M. A., Visschedijk, A. J. H., Wichink Kruit, R. J., van Pul, W. A. J., Sauter, F. J., van der Swaluw, E., Swart, D. P. J., Douros, J., Eskes, H., van Meijgaard, E., van Ulft, B., van Velthoven, P., Banzhaf, S., Mues, A. C., Stern, R., Fu, G., Lu, S., Heemink, A., van Velzen, N., and Schaap, M.: Curriculum vitae of the LOTOS–EUROS (v2.0) chemistry transport model, Geosci. Model Dev., 10, 4145–4173, https://doi.org/10.5194/gmd-10-4145-2017, 2017. a
Marécal, V., Peuch, V.-H., Andersson, C., Andersson, S., Arteta, J., Beekmann, M., Benedictow, A., Bergström, R., Bessagnet, B., Cansado, A., Chéroux, F., Colette, A., Coman, A., Curier, R. L., Denier van der Gon, H. A. C., Drouin, A., Elbern, H., Emili, E., Engelen, R. J., Eskes, H. J., Foret, G., Friese, E., Gauss, M., Giannaros, C., Guth, J., Joly, M., Jaumouillé, E., Josse, B., Kadygrov, N., Kaiser, J. W., Krajsek, K., Kuenen, J., Kumar, U., Liora, N., Lopez, E., Malherbe, L., Martinez, I., Melas, D., Meleux, F., Menut, L., Moinat, P., Morales, T., Parmentier, J., Piacentini, A., Plu, M., Poupkou, A., Queguiner, S., Robertson, L., Rouïl, L., Schaap, M., Segers, A., Sofiev, M., Tarasson, L., Thomas, M., Timmermans, R., Valdebenito, Á., van Velthoven, P., van Versendaal, R., Vira, J., and Ung, A.: A regional air quality forecasting system over Europe: the MACC-II daily ensemble production, Geosci. Model Dev., 8, 2777–2813, https://doi.org/10.5194/gmd-8-2777-2015, 2015. a, b
McLinden, C. A., Fioletov, V., Boersma, K. F., Kharol, S. K., Krotkov, N., Lamsal, L., Makar, P. A., Martin, R. V., Veefkind, J. P., and Yang, K.: Improved satellite retrievals of NO2 and SO2 over the Canadian oil sands and comparisons with surface measurements, Atmos. Chem. Phys., 14, 3637–3656, https://doi.org/10.5194/acp-14-3637-2014, 2014. a
Memmesheimer, M., Friese, E., Ebel, A., Jakobs, H. J., Feldmann, H., Kessler, C., and Piekorz, G.: Long-term simulations of partic-ulate matter in Europe on different scales using sequential nesting of a regional model, Int. J. Environ. Pollut., 22, 108–132, 2004. a
Menut, L., Bessagnet, B., Khvorostyanov, D., Beekmann, M., Blond, N., Colette, A., Coll, I., Curci, G., Foret, G., Hodzic, A., Mailler, S., Meleux, F., Monge, J.-L., Pison, I., Siour, G., Turquety, S., Valari, M., Vautard, R., and Vivanco, M. G.: CHIMERE 2013: a model for regional atmospheric composition modelling, Geosci. Model Dev., 6, 981–1028, https://doi.org/10.5194/gmd-6-981-2013, 2013. a
Miyazaki, K., Bowman, K., Sekiya, T., Eskes, H., Boersma, F., Worden, H., Livesey, N., Payne, V. H., Sudo, K., Kanaya, Y., Takigawa, M., and Ogochi, K.: Updated tropospheric chemistry reanalysis and emission estimates, TCR-2, for 2005–2018, Earth Syst. Sci. Data, 12, 2223–2259, https://doi.org/10.5194/essd-12-2223-2020, 2020a. a
Miyazaki, K., Bowman, K., Sekiya, T., Jiang, Z., Chen, X., Eskes, H., Ru, M., Zhang, Y., and Shindell, D.: Air quality response in China linked to the 2019 novel coronavirus (COVID-19) lockdown, Geophys. Res. Lett., 47, e2020GL089252, https://doi.org/10.1029/2020GL089252, 2020b. a
van Noije, T. P. C., Eskes, H. J., Dentener, F. J., Stevenson, D. S., Ellingsen, K., Schultz, M. G., Wild, O., Amann, M., Atherton, C. S., Bergmann, D. J., Bey, I., Boersma, K. F., Butler, T., Cofala, J., Drevet, J., Fiore, A. M., Gauss, M., Hauglustaine, D. A., Horowitz, L. W., Isaksen, I. S. A., Krol, M. C., Lamarque, J.-F., Lawrence, M. G., Martin, R. V., Montanaro, V., Müller, J.-F., Pitari, G., Prather, M. J., Pyle, J. A., Richter, A., Rodriguez, J. M., Savage, N. H., Strahan, S. E., Sudo, K., Szopa, S., and van Roozendael, M.: Multi-model ensemble simulations of tropospheric NO2 compared with GOME retrievals for the year 2000, Atmos. Chem. Phys., 6, 2943–2979, https://doi.org/10.5194/acp-6-2943-2006, 2006. a
Petetin, H., Beekmann, M., Colomb, A., Denier van der Gon, H. A. C., Dupont, J.-C., Honoré, C., Michoud, V., Morille, Y., Perrussel, O., Schwarzenboeck, A., Sciare, J., Wiedensohler, A., and Zhang, Q. J.: Evaluating BC and NOx emission inventories for the Paris region from MEGAPOLI aircraft measurements, Atmos. Chem. Phys., 15, 9799–9818, https://doi.org/10.5194/acp-15-9799-2015, 2015. a
Pinardi, G., Van Roozendael, M., Hendrick, F., Theys, N., Abuhassan, N., Bais, A., Boersma, F., Cede, A., Chong, J., Donner, S., Drosoglou, T., Dzhola, A., Eskes, H., Frieß, U., Granville, J., Herman, J. R., Holla, R., Hovila, J., Irie, H., Kanaya, Y., Karagkiozidis, D., Kouremeti, N., Lambert, J.-C., Ma, J., Peters, E., Piters, A., Postylyakov, O., Richter, A., Remmers, J., Takashima, H., Tiefengraber, M., Valks, P., Vlemmix, T., Wagner, T., and Wittrock, F.: Validation of tropospheric NO2 column measurements of GOME-2A and OMI using MAX-DOAS and direct sun network observations, Atmos. Meas. Tech., 13, 6141–6174, https://doi.org/10.5194/amt-13-6141-2020, 2020. a, b
Riess, T. C. V. W., Boersma, K. F., van Vliet, J., Peters, W., Sneep, M., Eskes, H., and van Geffen, J.: Improved monitoring of shipping NO2 with TROPOMI: decreasing NOx emissions in European seas during the COVID-19 pandemic, Atmos. Meas. Tech., 15, 1415–1438, https://doi.org/10.5194/amt-15-1415-2022, 2022. a, b
Robertson, L., Langner, J., and Engardt, M.: An Eulerian limited-area atmospheric transport model, J. Appl. Met., 38, 190–210, 1999. a
Sandu, I., Beljaars, A., Bechtold, P., Mauritsen, T., and Balsamo, G.: Why is it so difficult to represent stably stratified conditions in numerical weather prediction (NWP) models?, J. Adv. Model. Earth Syst., 5, 117–133, https://doi.org/10.1002/jame.20013, 2013. a
Shah, V., Jacob, D. J., Li, K., Silvern, R. F., Zhai, S., Liu, M., Lin, J., and Zhang, Q.: Effect of changing NOx lifetime on the seasonality and long-term trends of satellite-observed tropospheric NO2 columns over China, Atmos. Chem. Phys., 20, 1483–1495, https://doi.org/10.5194/acp-20-1483-2020, 2020. a
Simpson, D., Benedictow, A., Berge, H., Bergström, R., Emberson, L. D., Fagerli, H., Flechard, C. R., Hayman, G. D., Gauss, M., Jonson, J. E., Jenkin, M. E., Nyíri, A., Richter, C., Semeena, V. S., Tsyro, S., Tuovinen, J.-P., Valdebenito, Á., and Wind, P.: The EMEP MSC-W chemical transport model – technical description, Atmos. Chem. Phys., 12, 7825–7865, https://doi.org/10.5194/acp-12-7825-2012, 2012. a
Sofiev, M., Vira, J., Kouznetsov, R., Prank, M., Soares, J., and Genikhovich, E.: Construction of the SILAM Eulerian atmospheric dispersion model based on the advection algorithm of Michael Galperin, Geosci. Model Dev., 8, 3497–3522, https://doi.org/10.5194/gmd-8-3497-2015, 2015. a
Stavrakou, T., Müller, J.-F., Boersma, K. F., De Smedt, I., and van der A, R. J.: Assessing the distribution and growth rates of NOx emission sources by inverting a 10-year record of NO2 satellite columns, Geophys. Res. Lett., 35, L10801, https://doi.org/10.1029/2008GL033521, 2008. a
Stavrakou, T., Müller, J.-F., Bauwens, M., Doumbia, T., Elguindi, N., Darras, S., Granier, C., Smedt, I. D., Lerot, C., Van Roozendael, M., Franco, B., Clarisse, L., Clerbaux, C., Coheur, P.-F., Liu, Y., Wang, T., Shi, X., Gaubert, B., Tilmes, S., and Brasseur, G.: Atmospheric Impacts of COVID-19 on NOx and VOC Levels over China Based on TROPOMI and IASI Satellite Data and Modeling, Atmosphere, 12, 946, https://doi.org/10.3390/atmos12080946, 2021. a
Sun, W., Zhu, L., De Smedt, I., Bai, B., Pu, D., Chen, Y., Shu, L., Wang, D., Fu, T.-M., Wang, X., and Yang, X.: Global significant changes in formaldehyde (HCHO) columns observed from space at the early stage of the COVID-19 pandemic, Geophys. Res. Lett., 48, e2020GL091265, https://doi.org/10.1029/2020GL091265, 2021. a
Theys, N., De Smedt, I., Yu, H., Danckaert, T., van Gent, J., Hörmann, C., Wagner, T., Hedelt, P., Bauer, H., Romahn, F., Pedergnana, M., Loyola, D., and Van Roozendael, M.: Sulfur dioxide retrievals from TROPOMI onboard Sentinel-5 Precursor: algorithm theoretical basis, Atmos. Meas. Tech., 10, 119–153, https://doi.org/10.5194/amt-10-119-2017, 2017. a
van Geffen, J., Boersma, K. F., Eskes, H., Sneep, M., ter Linden, M., Zara, M., and Veefkind, J. P.: S5P TROPOMI NO2 slant column retrieval: method, stability, uncertainties and comparisons with OMI, Atmos. Meas. Tech., 13, 1315–1335, https://doi.org/10.5194/amt-13-1315-2020, 2020. a
van Geffen, J. H. G. M., Eskes, H. J., Boersma, K. F., and Veefkind, J. P.: TROPOMI ATBD of the total and tropospheric NO2 data products, Tech. Rep. S5P-KNMI-L2-0005-RP, Koninklijk Nederlands Meteorologisch Instituut (KNMI), https://sentinels.copernicus.eu/documents/247904/2476257/Sentinel-5P-TROPOMI-ATBD-NO2-data-products (last access: 22 January 2023), CI-7430-ATBD, issue 2.2.0, 16 June 2021. a
van Geffen, J., Eskes, H., Compernolle, S., Pinardi, G., Verhoelst, T., Lambert, J.-C., Sneep, M., ter Linden, M., Ludewig, A., Boersma, K. F., and Veefkind, J. P.: Sentinel-5P TROPOMI NO2 retrieval: impact of version v2.2 improvements and comparisons with OMI and ground-based data, Atmos. Meas. Tech., 15, 2037–2060, https://doi.org/10.5194/amt-15-2037-2022, 2022. a, b, c, d, e, f
Veefkind, J., Aben, I., McMullan, K., Förster, H., de Vries, J., Otter, G., Claas, J., Eskes, H., de Haan, J., Kleipool, Q., van Weele, M., Hasekamp, O., Hoogeveen, R., Landgraf, J., Snel, R., Tol, P., Ingmann, P., Voors, R., Kruizinga, B., Vink, R., Visser, H., and Levelt, P.: TROPOMI on the ESA Sentinel-5 Precursor: A GMES mission for global observations of the atmospheric composition for climate, air quality and ozone layer applications, Remote Sens. Environ., 120, 70–83, https://doi.org/10.1016/j.rse.2011.09.027, 2012. a, b
Verhoelst, T., Compernolle, S., Pinardi, G., Lambert, J.-C., Eskes, H. J., Eichmann, K.-U., Fjæraa, A. M., Granville, J., Niemeijer, S., Cede, A., Tiefengraber, M., Hendrick, F., Pazmiño, A., Bais, A., Bazureau, A., Boersma, K. F., Bognar, K., Dehn, A., Donner, S., Elokhov, A., Gebetsberger, M., Goutail, F., Grutter de la Mora, M., Gruzdev, A., Gratsea, M., Hansen, G. H., Irie, H., Jepsen, N., Kanaya, Y., Karagkiozidis, D., Kivi, R., Kreher, K., Levelt, P. F., Liu, C., Müller, M., Navarro Comas, M., Piters, A. J. M., Pommereau, J.-P., Portafaix, T., Prados-Roman, C., Puentedura, O., Querel, R., Remmers, J., Richter, A., Rimmer, J., Rivera Cárdenas, C., Saavedra de Miguel, L., Sinyakov, V. P., Stremme, W., Strong, K., Van Roozendael, M., Veefkind, J. P., Wagner, T., Wittrock, F., Yela González, M., and Zehner, C.: Ground-based validation of the Copernicus Sentinel-5P TROPOMI NO2 measurements with the NDACC ZSL-DOAS, MAX-DOAS and Pandonia global networks, Atmos. Meas. Tech., 14, 481–510, https://doi.org/10.5194/amt-14-481-2021, 2021. a, b, c
Vinken, G. C. M., Boersma, K. F., Maasakkers, J. D., Adon, M., and Martin, R. V.: Worldwide biogenic soil NOx emissions inferred from OMI NO2 observations, Atmos. Chem. Phys., 14, 10363–10381, https://doi.org/10.5194/acp-14-10363-2014, 2014. a
Visser, A. J., Boersma, K. F., Ganzeveld, L. N., and Krol, M. C.: European NOx emissions in WRF-Chem derived from OMI: impacts on summertime surface ozone, Atmos. Chem. Phys., 19, 11821–11841, https://doi.org/10.5194/acp-19-11821-2019, 2019. a
Williams, J. E., Boersma, K. F., Le Sager, P., and Verstraeten, W. W.: The high-resolution version of TM5-MP for optimized satellite retrievals: description and validation, Geosci. Model Dev., 10, 721–750, https://doi.org/10.5194/gmd-10-721-2017, 2017. a, b
Zara, M., Boersma, K. F., Eskes, H., Denier van der Gon, H., Vilà-Guerau de Arellano, J., Krol, M., Swaluw, E., Schuch, W., and Velders Guus, J. M.: Reductions in nitrogen oxides over the Netherlands between 2005 and 2018 observed from space and on the ground: Decreasing emissions and increasing O3 indicate changing NOx chemistry, Atmos. Environ., 9, 1–12, https://doi.org/10.1016/J.AEAOA.2021.100104, 2021. a
Zhou, Y., Brunner, D., Boersma, K. F., Dirksen, R., and Wang, P.: An improved tropospheric NO2 retrieval for OMI observations in the vicinity of mountainous terrain, Atmos. Meas. Tech., 2, 401–416, https://doi.org/10.5194/amt-2-401-2009, 2009. a
Zoogman, P., Liu, X., Suleiman, R. M., Pennington, W. F., Flittner, D. E., Al-Saadi, J. A., Hilton, B. B., Nicks, D. K., Newchurch, M. J., Carr, J. L., Janz, S. J., Andraschko, M. R., Arola, A., Baker, B. D., Canova, B. P., Chan Miller, C., Cohen, R. C., Davis, J. E., Dussault, M. E., Edwards, D. P., Fishman, J., Ghulam, A., González Abad, G., Grutter, M., Herman, J. R., Houck, J., Jacob, D. J., Joiner, J., Kerridge, B. J., Kim, J., Krotkov, N. A., Lamsal, L., Li, C., Lindfors, A., Martin, R. V., McElroy, C. T., McLinden, C., Natraj, V., Neil, D. O., Nowlan, C. R., O'Sullivan, E. J., Palmer, P. I., Pierce, R. B., Pippin, M. R., Saiz-Lopez, A., Spurr, R. J. D., Szykman, J. J., Torres, O., Veefkind, J. P., Veihelmann, B., Wang, H., Wang, J., and Chance, K.: Tropospheric Emissions: Monitoring of Pollution (TEMPO), J. Quant. Spectrosc. Radiat. Transfer, 186, 17–39, https://doi.org/10.1016/j.jqsrt.2016.05.008, 2017. a
- Abstract
- Introduction
- The TROPOMI NO2 measurements
- The CAMS European air quality forecasts and model ensemble
- Intercomparison approach
- Comparisons between TROPOMI and CAMS
- A European TROPOMI NO2 level 2 product
- Conclusions
- Code and data availability
- Author contributions
- Competing interests
- Disclaimer
- Acknowledgements
- Financial support
- Review statement
- References
- Supplement