the Creative Commons Attribution 4.0 License.
the Creative Commons Attribution 4.0 License.
 | 06 Jun 2023
MEDFATE 2.9.3: a trait-enabled model to simulate Mediterranean forest function and dynamics at regional scales
Miquel De Cáceres
Roberto Molowny-Horas
Antoine Cabon
Jordi Martínez-Vilalta
Maurizio Mencuccini
Raúl García-Valdés
Daniel Nadal-Sala
Santiago Sabaté
Nicolas Martin-StPaul
Xavier Morin
Francesco D'Adamo
Enric Batllori
Aitor Améztegui
Regional-level applications of dynamic vegetation models are challenging because they need to accommodate the variation in plant functional diversity, which requires moving away from broadly defined functional types. Different approaches have been adopted in the last years to incorporate a trait-based perspective into modeling exercises. A common parametrization strategy involves using trait data to represent functional variation between individuals while discarding taxonomic identity. However, this strategy ignores the phylogenetic signal of trait variation and cannot be employed when predictions for specific taxa are needed, such as in applications to inform forest management planning. An alternative strategy involves adapting the taxonomic resolution of model entities to that of the data source employed for large-scale initialization and estimating functional parameters from available plant trait databases, adopting diverse solutions for missing data and non-observable parameters. Here we report the advantages and limitations of this second strategy according to our experience in the development of MEDFATE (version 2.9.3), a novel cohort-based and trait-enabled model of forest dynamics, for its application over a region in the western Mediterranean Basin. First, 217 taxonomic entities were defined according to woody species codes of the Spanish National Forest Inventory. While forest inventory records were used to obtain some empirical parameter estimates, a large proportion of physiological, morphological, and anatomical parameters were matched to measured plant traits, with estimates extracted from multiple databases and averaged at the required taxonomic level. Estimates for non-observable key parameters were obtained using meta-modeling and calibration exercises. Missing values were addressed using imputation procedures based on trait covariation, taxonomic averages or both. The model properly simulated observed historical changes in basal area, with a performance similar to an empirical model trained for the same region. While strong efforts are still required to parameterize trait-enabled models for multiple taxa, and to incorporate intra-specific trait variability, estimation procedures such as those presented here can be progressively refined, transferred to other regions or models and iterated following data source changes by employing automated workflows. We advocate for the adoption of trait-enabled and population-structured models for regional-level projections of forest function and dynamics.
- Article
(9824 KB) - Full-text XML
-
Supplement
(424 KB) - BibTeX
- EndNote


Dynamic vegetation models are essential tools to anticipate future function and dynamics of terrestrial ecosystems. However, forest responses to changes in climate and disturbance regimes are complex and non-linear, as they involve multiple processes operating at various scales, which makes forecasting a challenging task (Adams et al., 2013). Global-scale assessments of the effects of climatic changes on terrestrial ecosystems and their feedbacks require physically based mechanistic approaches, given the need to evaluate energy, water and carbon exchanges between the biosphere and the atmosphere (Prentice and Cowling, 2013). At the regional scale, however, the assessment of climate change impacts on forest function and dynamics often do not include feedbacks to the atmosphere system. Thus, at this scale a much broader range of modeling approaches can be used, differing in the way vegetation structure is represented and including different degrees of mechanistic detail of process representation (Bugmann and Seidl, 2022; Maréchaux et al., 2021; Blanco et al., 2020; Mahnken et al., 2022). Some models are very detailed in terms of biophysical, biogeochemical and physiological processes, but they have a missing or limited representation of vegetation structure and demographic processes (Running and Coughlan, 1988; Dufrêne et al., 2005; Gracia et al., 2004). These models are better suited for predicting vegetation function than structural and/or compositional forest dynamics. At the opposite end, growth and yield models calibrated using empirical individual data allow simulating forest structural and compositional dynamics arising from the birth, growth and death of tree individuals (Dixon, 2013; Stadelmann et al., 2019; Trasobares et al., 2022), but they are unable to project vegetation function properly and are often not suited to simulate unprecedented environmental conditions, such as increased atmospheric [CO2]. Forest gap models combine an individual- or cohort-based representation of vegetation with an intermediate level of mechanistic detail. In such models, demographic processes depend on competition for light, water and nutrients, but the impact of these factors on demographic processes is modeled with a low degree of mechanistic detail (Bugmann, 2001; Morin et al., 2021; Thrippleton et al., 2020; García-Valdés et al., 2020). Finally, hybrid models exist that combine a detailed mechanistic approach to energy, water and carbon balances with the ability to represent vegetation structure and simulate demographic processes (Fisher et al., 2018; Maréchaux and Chave, 2017; Liu et al., 2021). These kinds of models have the advantage of allowing a good representation of the interaction between vegetation function and dynamics, often at the cost of increased parametrization complexity and computational requirements.
Regardless of model type, one of the common challenges when modeling forest function and dynamics at large scales is to appropriately represent plant functional diversity (Maréchaux and Chave, 2017), as functional traits display a wide spectrum of variation at multiple spatial scales (Funk et al., 2017). First, not all vegetation models are “trait-enabled”, in the sense that their parameters can be conceptually and quantitatively matched to measurable plant traits. Second, it is common in many models to reduce functional diversity into a manageable set of dominant tree species or a lumped set of plant functional types (Vanderwel et al., 2013; Morin et al., 2021; Prentice and Cowling, 2013; Dufrêne et al., 2005), with the corresponding decrease in ecological realism. However, including functional trait variation has been proven to substantially impact simulation outcomes (Verheijen et al., 2015) and comprehensive global trait databases represent a key source of information to boost parameter estimation (Kattge et al., 2020). Different strategies have been adopted to incorporate plant functional diversity into vegetation modeling exercises (Zakharova et al., 2019; Berzaghi et al., 2020). One possibility is to sample individual-level trait values from the distribution observed in a given forest area (Fyllas et al., 2014). This stochastic sampling of trait combinations can preserve trait covariation and relies on competition processes implemented in the model to filter trait distributions in each simulated patch (Sakschewski et al., 2015; Thonicke et al., 2020; Pavlick et al., 2013). Another approach consists of combining a trait-based description of individuals with genetic and demographic processes included in the model to simulate trait inheritance and, hence, eco-evolutionary processes (Scheiter et al., 2013; Scheiter and Higgins, 2009). For simulations over large spatial extents, yet another possibility is to use climate–trait relationships, calibrated using global trait databases, to prescribe the variation across space of parameter values (Verheijen et al., 2013, 2015). All these approaches focus on representing the continuum of traits at the individual level, either ignoring plant taxonomy for parametrization, or using broadly defined functional types. Even though models implementing these approaches are valuable tools, disregarding the information provided by species taxonomic identity entails some trade-offs. Importantly, many plant traits exhibit a phylogenetic signal (Sanchez-Martinez et al., 2020; Anderegg et al., 2022) and trait covariation frequently differs within and among species (Rosas et al., 2019; Anderegg et al., 2018). Hence, it is unclear how a model without explicit taxonomic entities can deal with functional diversity in a realistic way, which explains why recent approaches sample parameter combinations within species-defined boundaries (Buotte et al., 2021). In addition, there are many applications at local to regional scales that require species identity. An example would be the evaluation of future climatic and socioeconomic scenarios for forest management planning or biodiversity conservation purposes (Morán-Ordóñez et al., 2020; Augustynczik et al., 2020).
Accounting for taxonomy in trait-enabled model simulations requires using as many trait data sources as possible to obtain taxon-specific estimates of model parameters (Maréchaux and Chave, 2017; Schmitt et al., 2020; Morin et al., 2021; Ruffault et al., 2022). While not solving the issue of intra-specific trait variability, a taxon-based parameter estimation strategy can be employed for large-scale simulation exercises in combination with systematic forest inventory data, the latter defining the maximum resolution of taxonomic entities (Vanderwel et al., 2013; Caspersen et al., 2011; Dijak et al., 2017; Morin et al., 2021). To date, however, there are few examples of trait-enabled models of vegetation dynamics including parameterization for a large number of taxa based on plant trait databases (Christoffersen et al., 2016). Hence, it is important to appropriately examine the different challenges to address if this approach is adopted because, even with the current wealth of plant trait data sources, information is still insufficient for less common species that have not received much attention and for key model parameters that are difficult to measure or cannot be matched to any observable trait.
The main objectives of this manuscript are as follows: (1) to present MEDFATE (version 2.9.3), a cohort-based and trait-enabled model of forest function and dynamics designed for regional-scale applications, and (2) to illustrate the challenges encountered in the process of estimating parameter values for multiple taxa in trait-enabled models and provide suggestions to address them. We begin by describing the design and formulation of MEDFATE, which evolved from two preceding models (De Cáceres et al., 2015, 2021) that now constitute alternative sub-models for transpiration and photosynthesis processes. We then detail the different procedures we adopted to estimate taxon parameter values for the application of MEDFATE over a target region in the Mediterranean Basin, including the imputation procedures used to address missing values. Once fully parameterized, we evaluate the model in terms of predicted forest dynamics at the regional level and compare its performance with that of an empirical model (García-Callejas et al., 2017), recently calibrated for the main species in the same target region. We then illustrate the potential of MEDFATE to assess the impact of expected climate changes on forest function and dynamics in the target region. Finally, we discuss the challenges that we encountered, the transferability of the adopted parameter estimation procedures and the overall value of trait-enabled forest models for regional-scale applications.
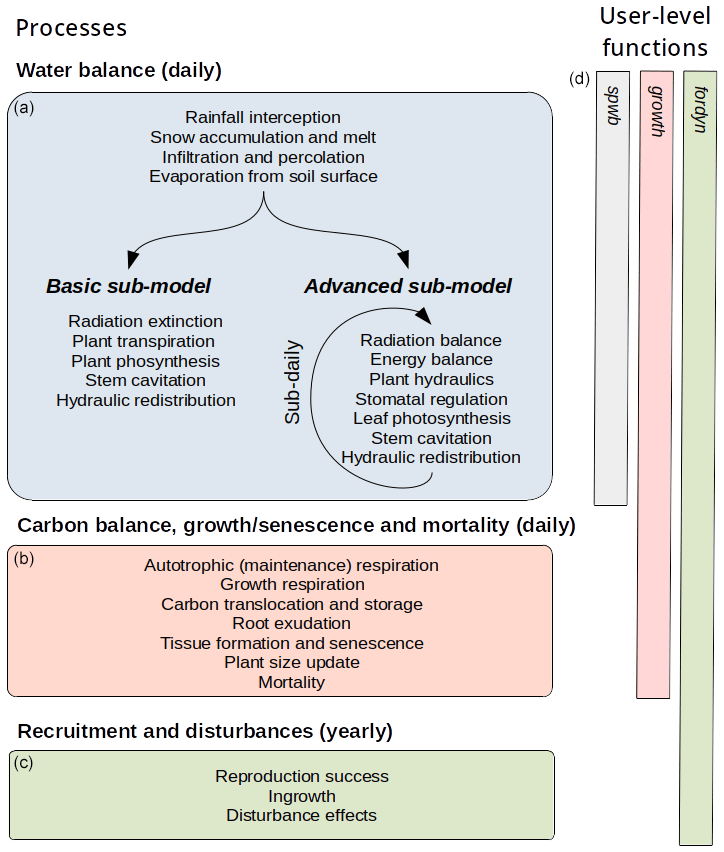
Figure 1MEDFATE (version 2.9.3) model processes (a–c), with their temporal resolution, and user-level R simulation functions (d), with the extension of the corresponding bars indicating the set of processes included.
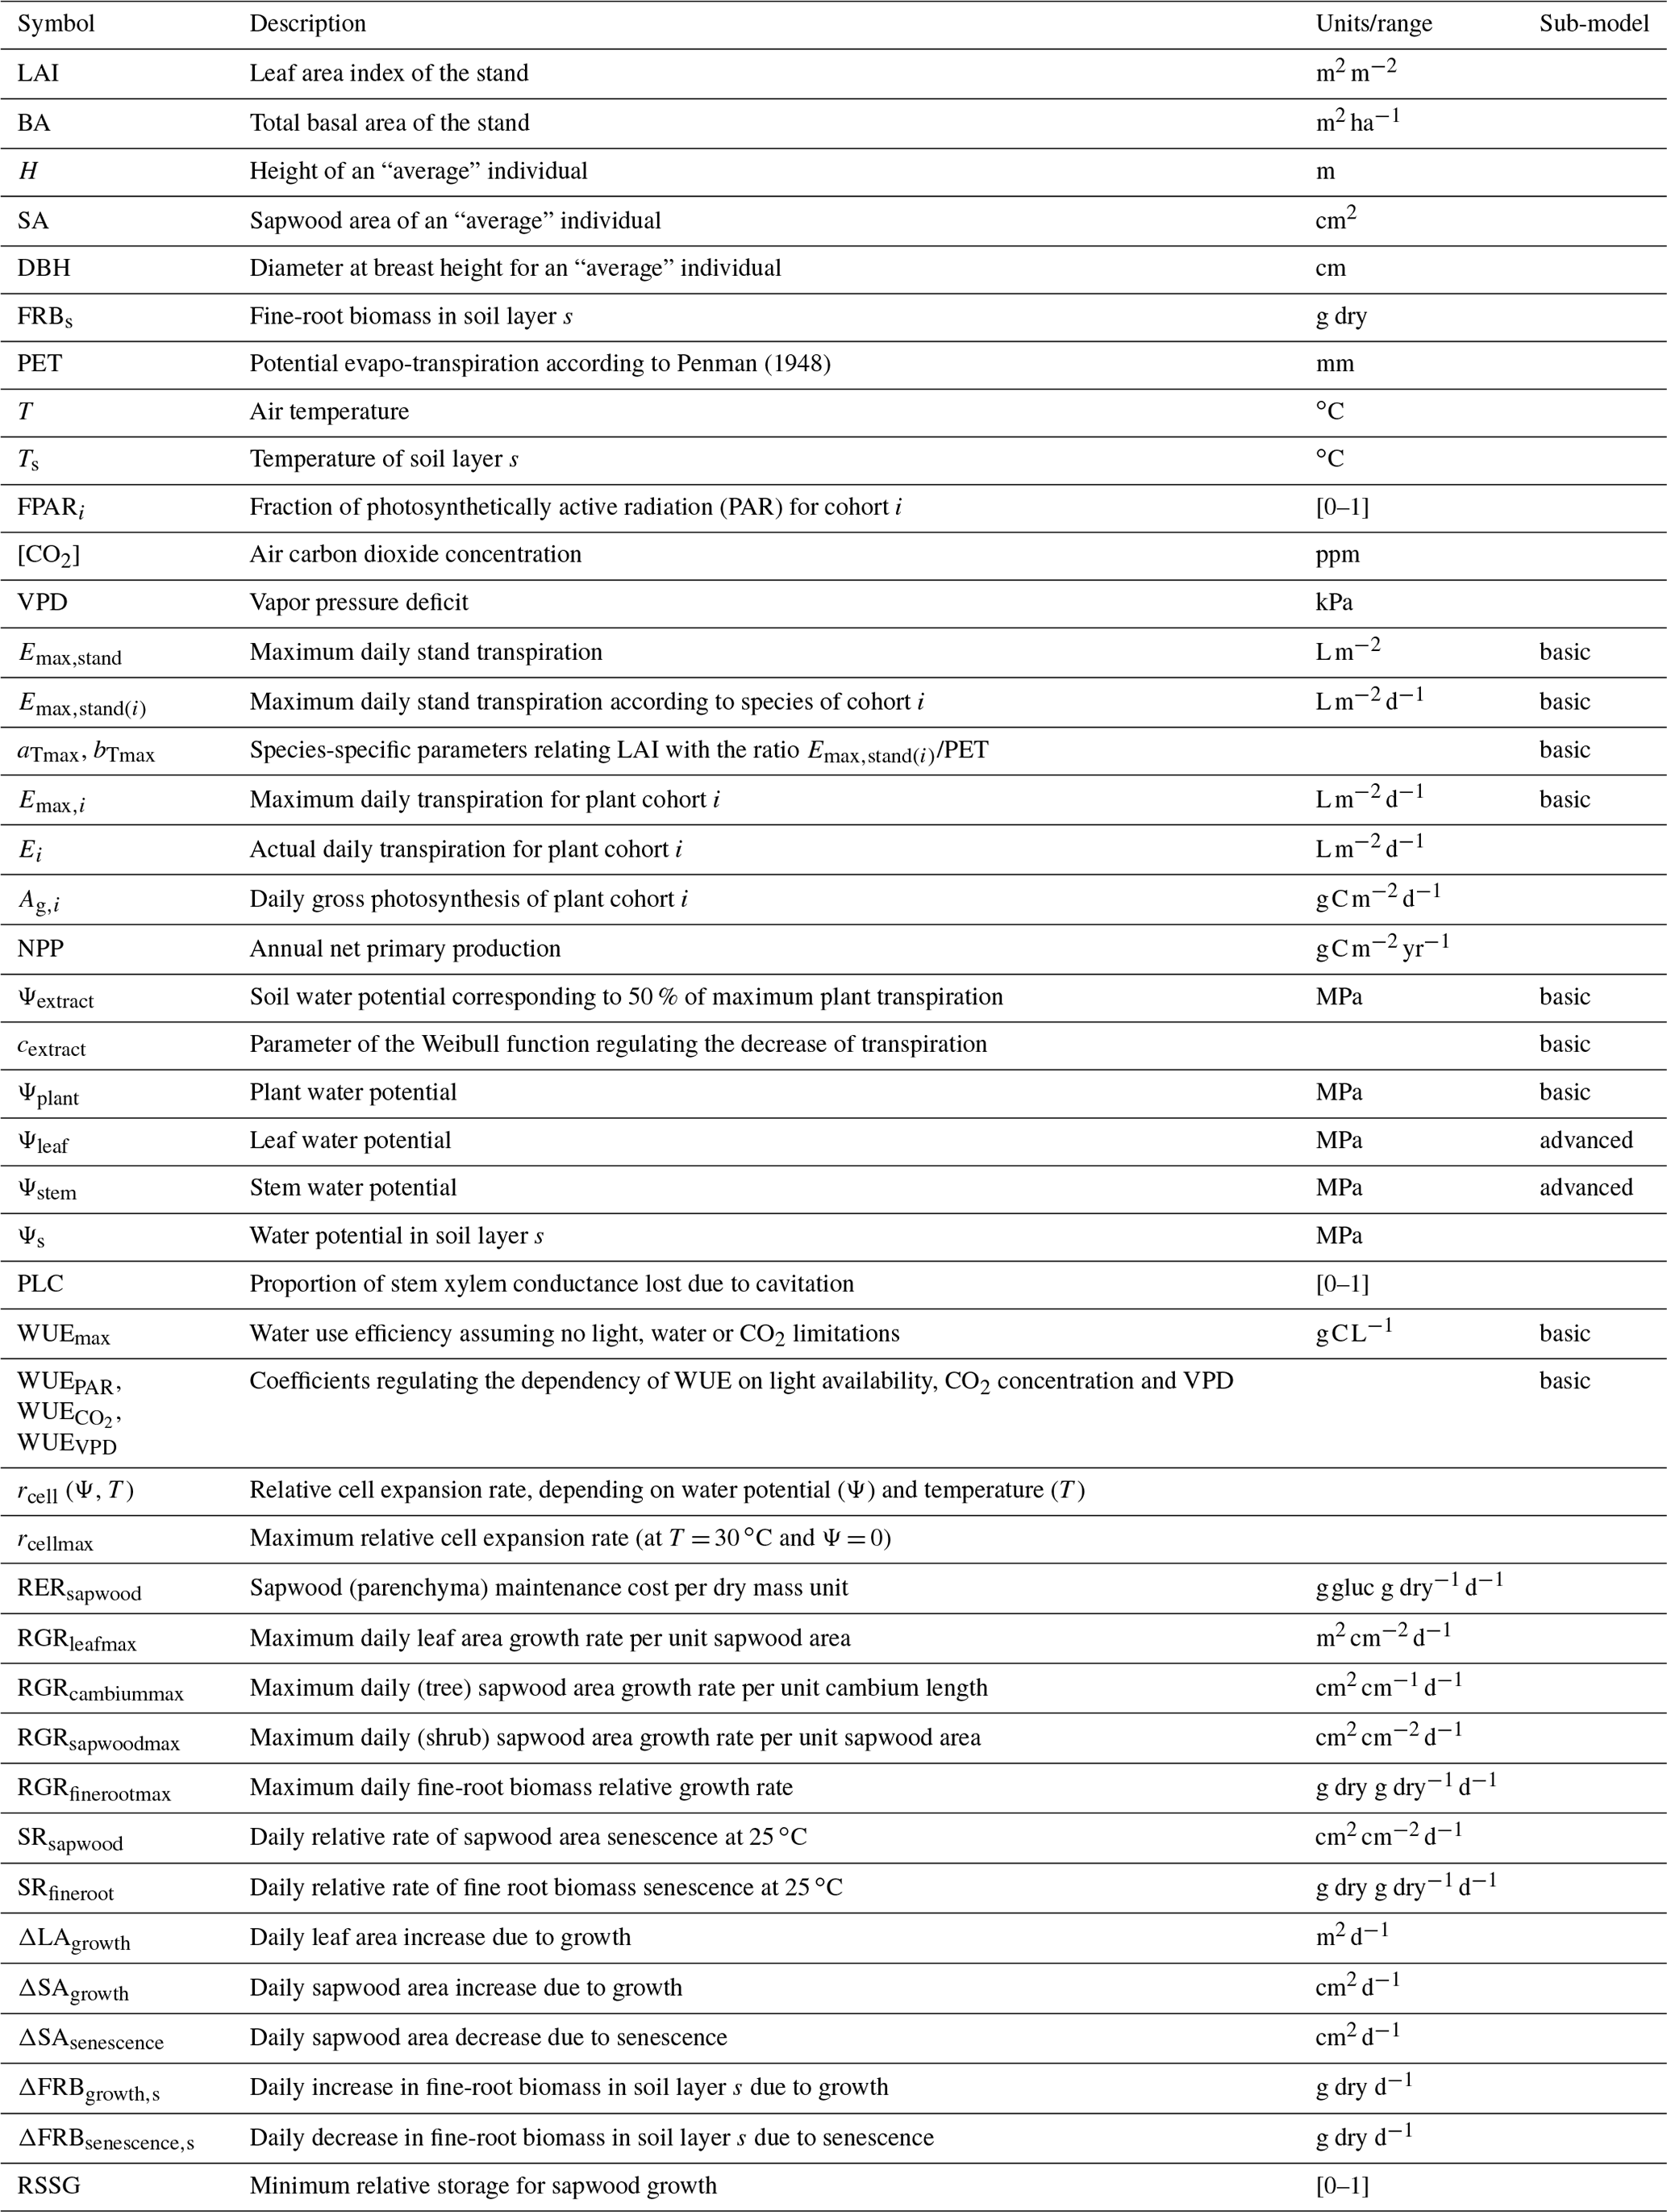
MEDFATE simulates energy, water and carbon balances and ultimately forest dynamics for a set of woody plants (i.e., trees or shrubs) in a given forest stand using daily weather data as input. The above- and below-ground vertical structure of the stand is explicitly represented, but the spatial location of plants within the stand is not considered. Importantly, the model is cohort-based, meaning that plants considered similar (e.g., in size and taxonomic identity) are represented using a single entity with average characteristics (e.g., tree height and diameter, or shrub height), and a cohort density variable (i.e., individuals per hectare) is used to upscale quantities from the individual to the cohort level. Figure 1 summarizes the main processes in the model. Most of the processes involved in water and energy balances are implemented at the stand level, whereas transpiration, photosynthesis, mortality and recruitment are implemented at the cohort level. Labile carbon balance, structural growth and senescence are implemented at the individual level. Hydrological processes (i.e., rainfall interception, soil infiltration, percolation and evaporation from bare soil) were already described in De Cáceres et al. (2015). MEDFATE can be run using two different levels of complexity, depending on the sub-model employed to estimate plant transpiration and photosynthesis (De Cáceres et al., 2015, 2021), hereafter referred to as the “basic” and “advanced” sub-models (Fig. 1). Although the basic sub-model is limited in its assumptions and includes key parameters that cannot be matched to plant traits, the finer detail in process representation of the advanced sub-model easily leads to computational limitations when processing thousands of stands. Section 2.1 and 2.2 briefly describe the design of the two sub-models. Design and formulation of the carbon balance, growth, mortality and recruitment processes are described with more detail (Sect. 2.3 to 2.5), because they are newly introduced in the model version presented here. Table 1 includes a description of all symbols mentioned in the text. MEDFATE has been coded in C and linked to a R user interface (R Core Team, 2023). The model is implemented in a modular way, so that different R functions can be used to execute different sub-models (Fig. 1). An extended model description, including process formulation, can be found at https://emf-creaf.github.io/medfatebook/ (last access: 30 May 2023).
Table 1Description and units of input variables, state variables, and model parameters mentioned in the text and Appendix B. Column “sub-model” indicates when a given state variable or parameter is specific to one of the two transpiration/photosynthesis sub-models. A complete list of model parameter definitions and units is given in Table S1 in the Supplement.
2.1 Transpiration, photosynthesis and drought impacts in the basic sub-model
The basic sub-model of MEDFATE was first described in De Cáceres et al. (2015) but has recently undergone modifications that are detailed in Appendix B1. All sub-model processes are represented at daily time steps. Extinction of shortwave radiation and photosynthetically active radiation through the canopy follows Beer–Lambert's equation. The model first derives a separate estimate of whole-stand maximum transpiration – i.e., before accounting for soil water deficit – for each taxon, which accounts for atmospheric evaporative demand and requires two taxon-specific parameters (see Eq. B2). Actual cohort transpiration depends on stand's maximum transpiration calculated for the corresponding taxon and the fraction of shortwave radiation absorbed by the plant cohort (Korol et al., 1995). It also depends on the vertical distribution of fine roots, soil moisture profile and two taxon-specific parameters, Ψextract and cextract, namely the soil water potential corresponding to 50 % of maximum transpiration and the slope of a Weibull function regulating the steepness of transpiration decrease, respectively (De Cáceres et al., 2015) (see Eq. B3). The sub-model also simulates hydraulic redistribution of water among soil layers via circulation through plant roots (Neumann and Cardon, 2012). The basic sub-model assumes a linear relationship between plant transpiration and gross photosynthesis, but it accounts for the dependency of water use efficiency on the fraction of photosynthetically active radiation, air CO2 concentration and vapor pressure deficit. Overall, the estimation of gross photosynthesis requires four taxon-specific parameters (see Eq. B4). Plant water status is represented by a plant water potential, Ψplant, defined as an “average” of soil water potential in the rhizosphere. The sub-model keeps track of drought legacies using the proportion of hydraulic conductance lost due to stem cavitation, PLC. Increases in PLC occur whenever Ψplant decreases, following a xylem vulnerability curve. PLC limits actual transpiration rates and does not decrease following increases in Ψplant. Cavitation effects can only be reversed (i.e., PLC decreased) via new sapwood formation (Choat et al., 2018).
2.2 Transpiration, photosynthesis and drought impacts in the advanced sub-model
The advanced sub-model simulates radiation balance, canopy, soil and leaf energy balances, plant hydraulics, stomatal regulation, and photosynthesis at hourly time steps. We provide a brief description here, but a more detailed description can be found in De Cáceres et al. (2021). Radiation balance and sunlit/shade leaf energy balance are estimated assuming a multi-layer canopy (Anten and Bastiaans, 2016), but canopy energy balance equations are evaluated assuming a single layer that exchanges energy with the atmosphere and the soil (Best et al., 2011). The “supply function” approach of Sperry and Love (2015) is used to model the relationship between steady-state instantaneous water flow and water status along the soil–plant–atmosphere hydraulic network, which includes rhizosphere, root, stem and leaf segments (Sperry et al., 1998). The advanced sub-model, thus, requires parameters describing maximum hydraulic conductance and hydraulic vulnerability curves for these three plant segments. Gross photosynthesis is approximated following the sunlit/shade model of De Pury and Farquhar (1997), which requires estimates for the usual photosynthetic parameters. Namely, the maximum RuBisCO carboxylation rate and the maximum electron transport rate, which are considered taxon-specific, are dependent on leaf temperature. Stomatal regulation follows the “profit maximization” approach of Sperry et al. (2017), where an optimum stomatal conductance is determined by comparing the risks associated with hydraulic damage against photosynthetic gains, subject to the limits imposed by minimum and maximum stomatal conductance. Hydraulic redistribution of soil water is an emergent outcome in the advanced sub-model, derived from its formulation of plant hydraulics. Like the basic sub-model, the advanced sub-model keeps track of drought legacy effects through their cumulative effects on stem PLC, which feeds back on stem vulnerability curves and, hence, transpiration rates. As in the basic sub-model, its effects are only reversed via new sapwood area growth.
2.3 C pools and labile C balance
Three different carbon compartments are represented in MEDFATE: leaves, sapwood – including stem, branches and coarse roots – and fine roots. We differentiate two main forms of C pools: structural and labile. Structural C corresponds to membranes, walls and the cytosolic organelles of living cells, whereas labile C occurs in leaves and sapwood compartments only, and it is divided between metabolic and storage (Richardson et al., 2013; Dietze et al., 2014). Metabolic C is assumed to correspond to dissolved sugars (e.g., glucose or fructose) that are used to directly sustain cell functioning, whereas storage C is assumed to correspond to starch. We chose this design because structural growth and photosynthesis are frequently uncoupled (Dietze et al., 2014; Fatichi et al., 2014; Cabon et al., 2022), which points to the need of including storage compartments when modeling tree growth at daily to seasonal resolution (Richardson et al., 2013; Jones et al., 2020).
Initial values of leaf structural C are obtained by dividing leaf area by specific leaf area, whereas sapwood structural C depends on sapwood area, plant height, coarse root length and wood density. Finally, fine-root structural C is estimated assuming a constant relationship between leaf area and fine-root area. Leaf and sapwood C storage capacity is determined by tissue volume and density, assuming that a maximum of 50 % of cell volume is available for starch accumulation. Sapwood storage constitutes the largest C pool, depending on sapwood volume and the fraction of sapwood corresponding to xylem parenchyma.
The balance of leaf labile C includes gross photosynthesis, leaf maintenance respiration, sugar–starch conversion and phloem transport processes. Sapwood labile C balance includes phloem transport, sugar–starch conversion, maintenance respiration of sapwood and fine roots, growth costs, senescence and root exudation. Sapwood maintenance applies to the xylem parenchyma only, because dead xylem conduits are assumed to be inexpensive. Maintenance respiration rates per dry mass unit are estimated from tissue nitrogen content in the case of leaf and fine-root compartments (Reich et al., 2008), but not for sapwood because of the lower knowledge in the factors affecting wood respiration, which results in a species-specific parameter (RERsapwood) to be calibrated. Maintenance respiration is temperature-dependent and is subtracted from metabolic C pools, whereas C used for growth is withdrawn from the sapwood storage C pool. Storage accumulation is considered a passive consequence of sugar–starch dynamics and reduced C use by other sinks (Palacio et al., 2014; Le Roux et al., 2001). Sugar–starch dynamics are modeled to maintain a constant metabolic C concentration in leaves and sapwood tissues, whereas phloem transport decreases leaf-versus-sapwood differences in sugar concentration. Root exudation is not modeled as an active process competing for metabolic C, but as a consequence of plant C storage capacity being surpassed (Prescott et al., 2020; but see Williams and de Vries, 2020), which can happen when temperature or plant water status limits growth more than photosynthesis. During leaf senescence, labile C pools are recycled and relocated to sapwood storage. Analogously, when sapwood is converted into heartwood, labile C in the protoplasm of parenchyma cells is assumed to be re-absorbed by neighboring living cells as storage.
2.4 Growth and senescence
In many mechanistic dynamic vegetation models, structural growth is proportional to the amount of C fixed by photosynthesis or is determined by the difference between photosynthesis and respiration (Körner, 2015; Fatichi et al., 2019). Following the C sink limitation hypothesis, which posits that for trees growing under environmental constraints direct restrictions on tissue formation can occur before any C shortage comes into play (Körner, 2003), formation of new plant tissues in MEDFATE also considers biophysical constraints on plant tissue expansion (Schiestl-Aalto et al., 2015; Lempereur et al., 2015; Hayat et al., 2017; Potkay et al., 2022; Eckes-Shephard et al., 2021). Specifically, temperature and turgor limitations on cell expansion are implemented following Cabon et al. (2020a, b), although these authors developed their approach for tracheid production/enlargement and we apply it to model growth of all kinds of plant tissues.
A leaf phenology sub-model controls the duration of phenophases corresponding to budburst, leaf development and senescence (Chuine et al., 2013; Delpierre et al., 2009). During bud formation periods, the model updates the maximum leaf area that can be achieved, as the product of current sapwood area and a target leaf area to sapwood area ratio, following the pipe model (Shinozaki et al., 1964). Assuming no allocation or C limitations, daily leaf area increase due to growth is estimated using the following:
where RGRleafmax is the maximum leaf area growth rate per unit sapwood area, rcell is the relative cell expansion rate, depending on leaf water potential (Ψleaf) and temperature (T) (Cabon et al., 2020a), and rcellmax is a reference cell expansion rate at T = 30 ∘C and Ψleaf = 0. Leaf senescence occurs due to leaf aging in evergreen species, programmed leaf senescence in deciduous species or as defoliation triggered by cavitation (i.e., following increases in PLC).
The maximum fine-root biomass that a given individual can have depends on its leaf area target, the root area to leaf area ratio and specific root surface area. Thus, fine-root biomass is constrained by allocation parameters in a similar way as leaf area. Assuming no allocation or C limitations, daily fine-root biomass increment in a given soil layer s (ΔFRBgrowth,s) is modeled analogously to Eq. (1):
where FRBs is the current fine-root biomass in layer s, RGRfinerootmax is the maximum relative growth rate for fine roots, and rcell depends here on the water potential (Ψs) and temperature (Ts) in soil layer s. Fine-root senescence is estimated assuming a linear temperature dependence:
where SRfineroot is the daily relative rate of fine-root senescence at 25 ∘C.
Unlike leaves and fine roots, formation of new sapwood area is not constrained by allocation parameters. On the contrary, sapwood growth and senescence are the processes that constrain the target biomass of the other organs. This lack of an explicit allocation rule does not imply continuous sapwood growth, because it is regulated by temperature/turgor limitations and two additional constraints: first, formation of sapwood area can only occur if unfolded leaves are present, assuming that hormonal signals controlling cambium division and sapwood development are mainly synthesized within leaves. Second, sapwood formation does not occur if C storage levels are below a given threshold, so that the maintenance of metabolic functioning and replacement of leaves/fine roots are prioritized over plant growth whenever C storage levels are low (Martínez-Vilalta et al., 2016), helping to maintain a safety margin against the risk of carbon starvation (Huang et al., 2019). This threshold is specified in relative terms via species parameter RSSG, the minimum relative starch for sapwood growth. When the former two constraints do not operate, daily sapwood area increases (ΔSAgrowth) are modeled analogously to the other tissues:
where DBH is the current diameter at breast height (for a tree cohort), SA is the current sapwood area (for a shrub cohort), rcell now depends on stem water potential (Ψstem) and temperature (T), RGRcambiummax is the maximum growth rate relative to the current cambium perimeter and RGRsapwoodmax is the maximum growth rate relative to the current area of sapwood (note that diameter is not available in multi-stemmed shrubs). Unlike other models where height-to-diameter variations arise from an explicit regulation of the activity of apical and lateral (i.e., cambium) meristems (e.g., Hayat et al., 2017), in MEDFATE tree height increases are estimated as a function of diameter increases and a height-to-diameter ratio varying with FPAR (Rasche et al., 2012).
Sapwood area senescence (i.e., conversion to heartwood) is assumed to occur with aging, although evidence points towards a plant-controlled developmental process (Spicer, 2005). Most process-based forest models assume a fixed rate of sapwood turnover (Collalti et al., 2020). Like in Eq. (3), we assume that the rate of conversion to heartwood is faster under warmer conditions and, similarly to 3PG (Landsberg and Waring, 1997), that the relative turnover rate of sapwood is smallest for young plants, and it progressively increases with size:
where SRsapwood is the daily rate of sapwood conversion to heartwood at 25 ∘C and H is plant height (m).
When using the advanced sub-model, leaf, stem and soil water balances provide the water status for Eqs. (1)–(5), while the soil and canopy energy balances provide temperature values. Leaf and sapwood area changes feed back on maximum stem hydraulic conductance, and fine-root biomass changes feed back on rhizosphere conductance. Moreover, recovery from stem embolism is assumed to be the result of new xylem formation (Choat et al., 2018; Rehschuh et al., 2020). Specifically, formation of new sapwood reduces the proportion of conductance loss (PLC) between time steps t and t+1:
When using the basic sub-model, it is assumed that Ts=T and . In this case, changes in sapwood area affect maximum transpiration rates per unit of leaf area via reduction of PLC only.
2.5 Mortality and recruitment
Dynamic vegetation models implement mortality in very different ways, from purely empirical to entirely mechanistic approaches (Hawkes, 2000; Keane et al., 2001; Bugmann et al., 2019). In MEDFATE, woody plants are assumed to die at a constant basal rate due to processes not explicitly included in the model (e.g., biotic attacks or windstorms), but mortality rates increase whenever physiological stress thresholds presumed to lead to plant mortality are surpassed (McDowell et al., 2022). The model allows plants to die explicitly from either starvation (if metabolic carbon is exhausted) or desiccation (extreme tissue dehydration) (McDowell et al., 2008, 2011). Starvation is assumed to occur whenever the size of the sapwood metabolic C pool decreases below 30 % of its maximum value (Martínez-Vilalta et al., 2016). Plant desiccation occurs when stem symplastic relative water content decreases below 30 % (Mantova et al., 2021; Kursar et al., 2009). Although the two thresholds are applied independently, drought-driven starvation and desiccation processes are strongly coupled in the model: decreases in soil water potential cause stomatal closure and cavitation-induced defoliation, both reducing carbon assimilation and, in turn, reduced carbon storage impacts the capacity of plants to produce new tissues and, hence, recover hydraulic conductance and normal gas exchange rates (McDowell et al., 2022).
Although recruitment is known to be the result of a number of processes (e.g., flowering and pollination, fruit/seed production, dispersal, storage, seed predation, germination, seedling establishment and survival until the sapling stage), they are challenging to include in models (Price et al., 2001; König et al., 2022). Recruitment in MEDFATE is thus modeled using a single aggregated process that estimates the appearance of young plants, as done in other models (Hanbury-Brown et al., 2022). Dispersal is not considered and local seed production is considered as a binary process; namely plants are fertile and able to produce viable seeds if they reach a given taxon-specific height (different for shrubs and trees). Recruitment of species with available seeds is further constrained by three species-specific thresholds, including minimum temperature, maximum aridity and minimum FPAR, that are used to determine whether recruitment (i.e., ingrowth into an initial plant size) is possible, similarly to FORCLIM (Bugmann, 1996). A constant probability of recruitment determines actual recruitment within these bioclimatic limits.
Our target region for parameter estimation, model evaluation and application was Catalonia (32 108 km2, NE Spain). Most of the region has a Mediterranean climate, with hot and dry summers, but it includes strong climatic variation due to its complex orography. Mean annual temperature ranges between +3 and +17 ∘C (average +12.3 ∘C), and annual rainfall ranges between 344 and 1587 mm (average 684 mm). Abandonment of rural areas during the second half of the 20th century led to a remarkable increase in the area covered by forests. Nowadays, forests cover around 47 % of Catalonia and are increasing in density and wood volume stock. Among forested areas, 52 % are dominated by conifers, 36 % by broadleaves, and 13 % are considered mixed forests (Ministerio de Agricultura y Pesca and Alimentación y Medio Ambiente, 2017).
Three surveys of Spanish National Forest Inventory (SNFI) are available for the region (SNFI2, 1989–1991; SNFI3, 2000–2001; and SNFI4, 2013–2016). These were conducted using a systematic sampling scheme, with 10 820 plots in SNFI2, 11 314 plots in SNFI3 (average density of 1 plot per km2 in both cases) and 5500 plots in SNFI4 (0.5 plot per km2). Plot sampling involves a variable radius with circular nested subplots, where trees of different diameter classes are identified to the species level and their DBH and height is measured. Shrub sampling consists in determining mean height and percent cover by species. Since field soil data are absent in forest inventory plots, soil physical properties (i.e., texture, bulk density, organic matter content) in plot locations were drawn from the global database SoilGrids (Hengl et al., 2017), complemented by rock fragment content estimates derived from surface stoniness measurements made during SNFI surveys. Soil water retention and conductivity curves followed the van Genuchten (1980) model, with parameters estimated following Tóth et al. (2015). Historical daily weather data used for parameter estimation and model evaluation exercises were obtained via interpolation of weather records from Catalan and Spanish surface station networks on forest plot locations using the R package “meteoland” (De Cáceres et al., 2018).
Table 2Summary of procedures used for taxon parameter estimation (a) and model-inbuilt imputation of missing values (b). The number of parameters is indicated as well as the percentage with respect to the 117 parameters in MEDFATE.
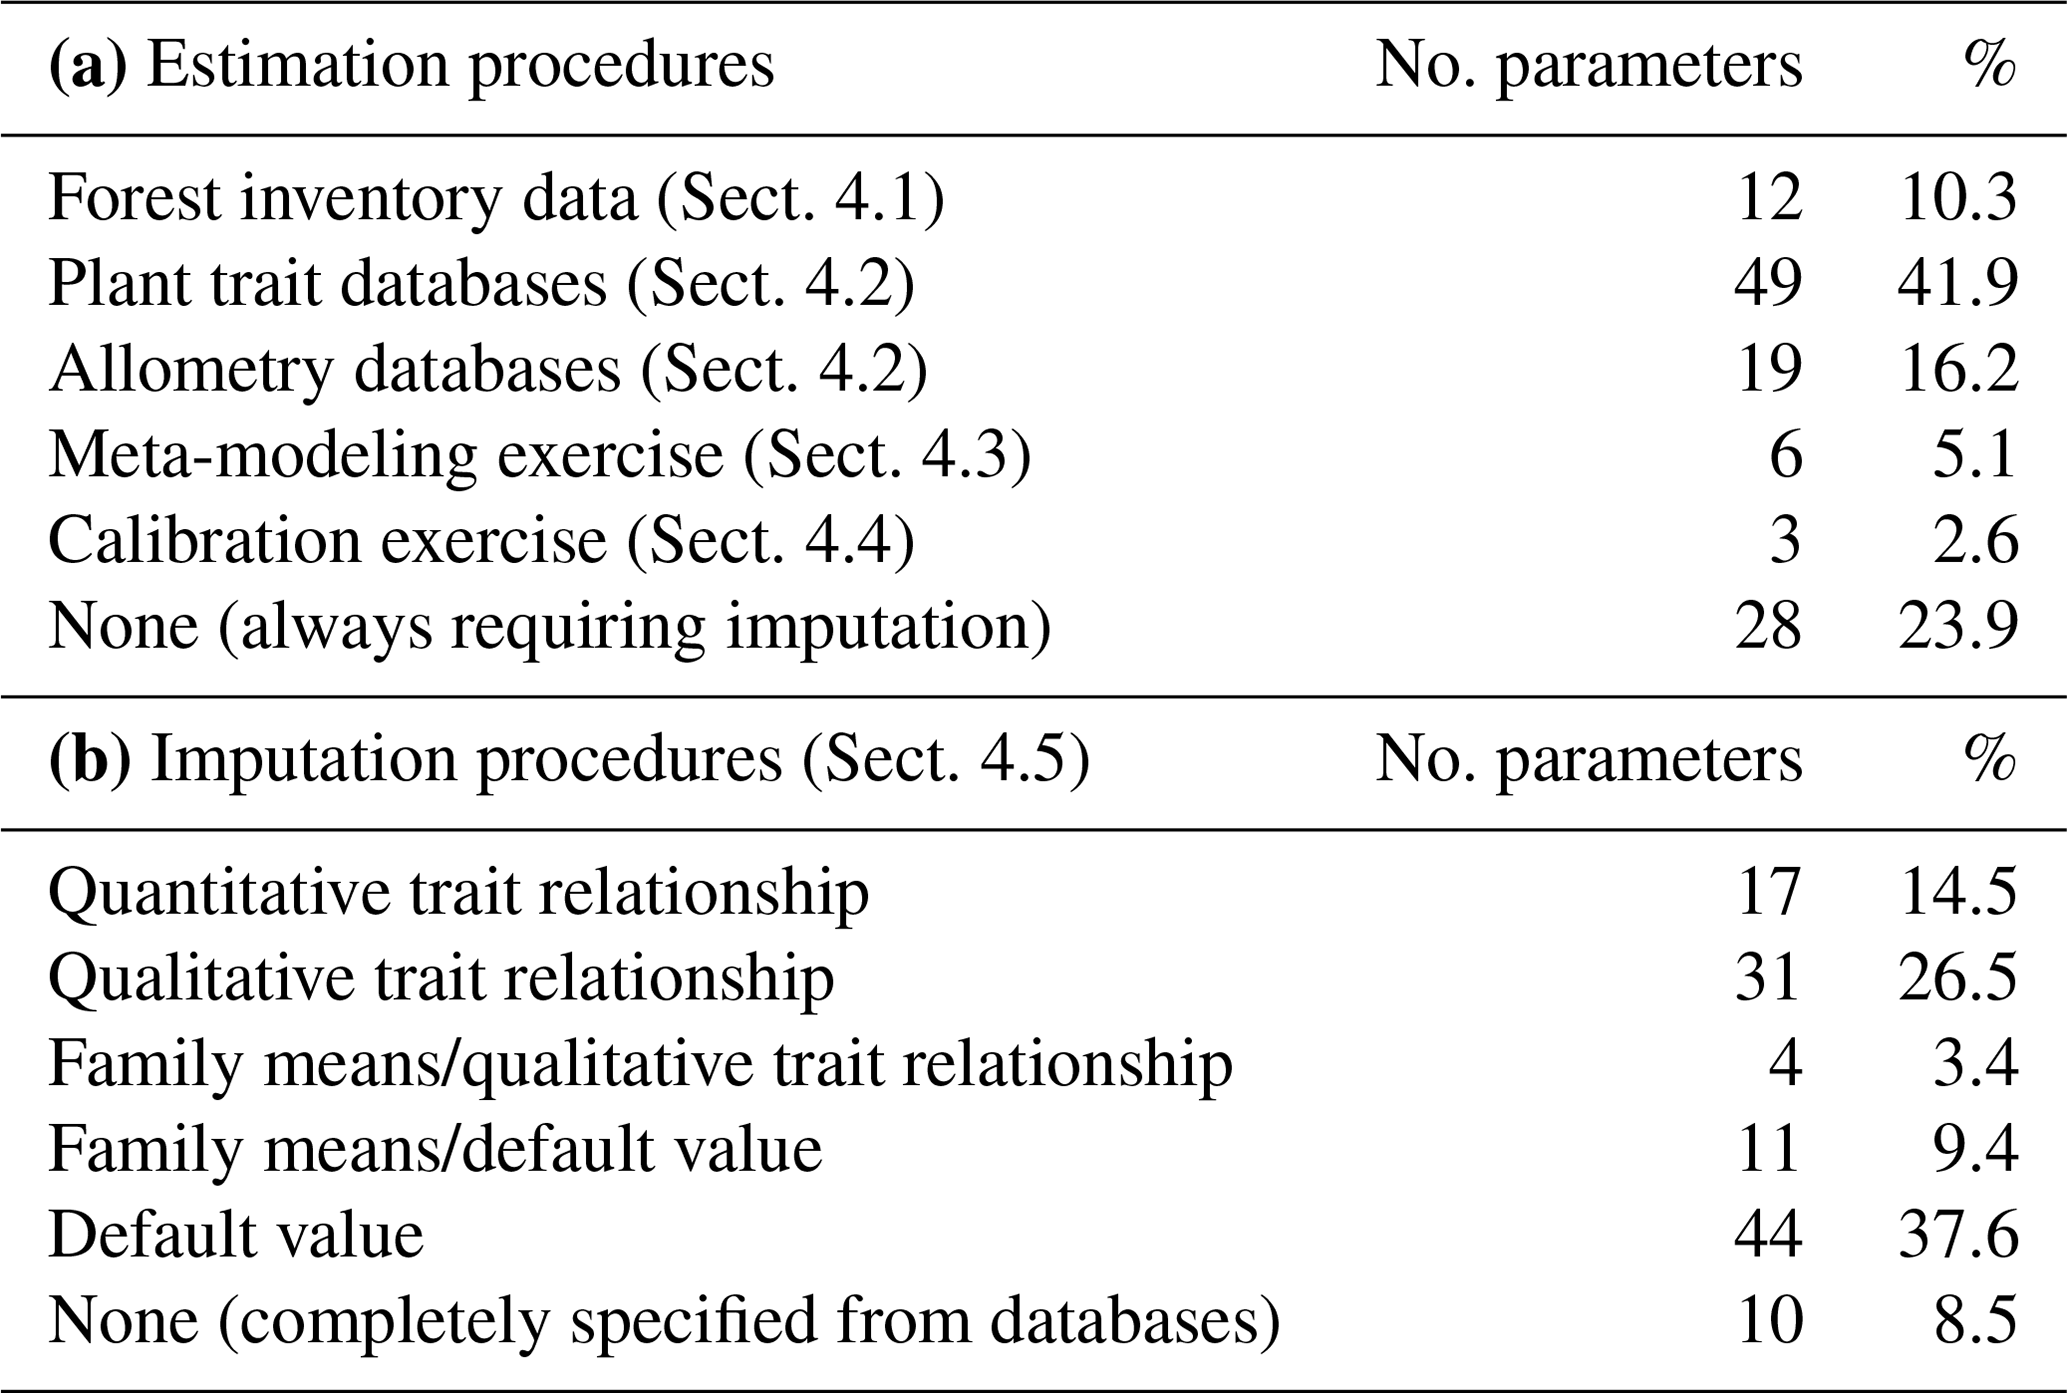
We reduced the tree and shrub species classification codes included in the SNFI to 217 taxon entities, of which 144 taxa were at the species level and 73 were aggregated at the genus level based on their frequency and the availability of species-specific data. Upper taxonomic levels (genus, family, order) were filled using the R package “taxize” (Chamberlain and Szocs, 2013). MEDFATE (version 2.9.3) requires taxon-specific estimates for 117 different parameters (including qualitative variables and allometric coefficients) to be run. The different procedures employed for parameter estimation are summarized in Table 2 and are detailed in the following subsections. Table S1 includes the strategy used to estimate taxon values for each parameter. The final taxon parameter estimates are given in Table S3.
4.1 Parameter estimates obtained from forest inventory data
We used SNFI data from the entire Spanish territory to find suitable values for 12 parameters. A number of quantitative traits, such as maximum and median plant heights and tree diameter–height relationships under shade and sunlit conditions, were directly calculated from SNFI shrub and tree records (Morin et al., 2021). We also used permanent forest inventory plot data corresponding to the SNFI2–3 and SNFI3–4 periods and the entire Spanish territory to estimate tree mortality and recruitment parameters, to maximize the amount of data available for each taxon. We first estimated observed tree mortality rates, excluding those plots where management effects (i.e., stumps) were detected (observed mortality rates for different SNFI periods are provided in Table S5). Since the model incorporates mortality due to carbon starvation and desiccation explicitly, using observed mortality rates as estimates of model's basal mortality rates leads to overestimation of mortality. Following preliminary tests, we defined tree basal mortality rates for all species as one-third of observed mortality rates. We then manually modified basal mortality rates for the main tree species to obtain an acceptable bias in basal area mortality predictions when evaluating the model at the regional level for the SNFI3–4 period (see Sect. 5.1). To obtain species-specific recruitment parameter estimates we first calculated three bioclimatic variables (minimum monthly temperature, moisture index and ground FPAR) for each forest plot. For tree taxa, we fitted a non-linear model by maximum likelihood for the probability of ingrowth into the 7.5 < DBH < 12.5 cm class between inventory surveys, based on plots where the species was present in the initial survey, and where the parameters to be calibrated were the thresholds for the three bioclimatic variables mentioned in Sect. 2.5 and the probability of ingrowth within those limits (ingrowth probabilities estimated for different SNFI periods are provided in Table S6). For shrub taxa, bioclimatic thresholds were determined using 1 % percentiles among plots where the species was found and we assumed a constant 5 % probability of annual recruitment within these limits.
4.2 Parameter estimates obtained from allometric and plant trait databases
We used available allometric relationships for shrub and tree leaf biomass and crown base height assembled from multiple sources (Hasenauer, 1997; Burriel et al., 2004; De Cáceres et al., 2019) to populate 19 (16 %) model parameters. In turn, 49 (42 %) model parameters were matched to plant trait definitions from existing plant trait databases (see Table S1). Among those, 23 (47 %) model parameters were matched to plant traits drawn from TRY public data sets (version 5.0; https://www.try-db.org/, last access: 30 May 2023) (Kattge et al., 2020). TRY data sets were complemented by additional databases, global analysis papers and personal compilations for phenology, anatomy and morphology (Tavşanoglu and Pausas, 2018; Zanne et al., 2009; Morris et al., 2016), plant hydraulics (Mencuccini et al., 2019; Sanchez-Martinez et al., 2020; Martin-StPaul et al., 2017; Choat et al., 2012), tissue water content (Bartlett et al., 2012), and stomatal or cuticular conductance (Hoshika et al., 2018; Duursma et al., 2018) (see Table S2). Transpiration and photosynthesis functions of the advanced sub-model were readily parameterizable with measured traits, although hydraulic parameters were often missing for leaf and root segments. In the case of the basic sub-model, xylem vulnerability curves were taken as estimates of the parameters regulating stem PLC, but eight other parameters regulating transpiration and photosynthesis (Eqs. B2–B4) could not be conceptually matched to plant traits.
Most plant traits were mapped directly, sometimes requiring homogenizing measurement units, whereas a few required the use of transforming functions. While most parameters were estimated from measurable plant traits, the minimum relative storage for sapwood growth (RSSG) was estimated by monotonically re-scaling an ordinal (0–5) shade tolerance index (Niinemets and Valladares, 2006) to a proportion [0–1], relying on the expectation that a higher degree of shade tolerance implies a stronger prioritization of leave/fine-root maintenance over stem growth. Parameters for plant taxa were estimated using species-level averages or genus-level averages (for genus taxa or when the target species was not found in the source database).
4.3 Estimation of transpiration and photosynthesis parameters of the basic sub-model
As indicated above, eight key parameters regulating transpiration and photosynthesis in the basic sub-model could not be estimated from plant trait databases. To make transpiration, gross photosynthesis and growth predictions obtained by the basic sub-model as similar as possible to those produced by the advanced sub-model, we conducted a meta-modeling exercise in which the results of simulations with the advanced sub-model were used to provide estimates for the eight parameters of the basic sub-model. The meta-modeling exercise was conducted separately for each of 12 prioritized species on the basis of their importance in the study area. These were Pinus halepensis Mill. (Aleppo pine), Pinus nigra subsp. salzmannii J. F. Arnold (black pine), Pinus sylvestris L. (Scots pine), Pinus pinea L. (stone pine), Pinus uncinata Ramond ex A. DC. (mountain pine), Fagus sylvatica L. (European beech), Abies alba (white fir), Quercus ilex L. (holm oak), Quercus faginea Lam. (Portuguese oak), Quercus pubescens Mill. (downy oak) and Quercus suber (cork oak), which altogether represent 87 % of the total number of stems (Ministerio de Agricultura y Pesca and Alimentación y Medio Ambiente, 2017). Transpiration and photosynthesis parameters of each species were carefully revised by experts prior to conducting the meta-modeling exercise. Furthermore, for 6 out of the 12 taxa an evaluation of the performance of the advanced sub-model had been conducted previously using observed data from experimental forest plots, which revealed and good predictive ability in terms of soil moisture dynamics and transpiration rates, but a more limited ability to accurately predict plant water status (De Cáceres et al., 2021). Details of the meta-modeling procedure and results are provided in Appendix Sect. B2.
4.4 Calibration of sapwood respiration, growth and senescence parameters
We conducted calibration exercises to obtain suitable estimates for three key parameters regulating sapwood respiration, growth and senescence. Given the large amount of sapwood biomass in trees, the daily maintenance respiration rate of sapwood parenchyma (RERsapwood) is an important parameter determining C availability for growth. Maximum daily sapwood growth rates relative to cambium perimeter (RGRcambiummax) represent optimum growth rates, and, since leaf and fine-root allocation targets depend on sapwood area, it determines whole-tree growth rates. Finally, maximum daily sapwood senescence rate (SRsapwood) defines the rate of sapwood-to-heartwood conversion and contributes to modulate sapwood biomass and its maintenance costs. Parameters regulating the maximum growth rates of leaves and fine roots were deemed less important, given the allocation constraints to the formation of these organs. Tree ring data have been previously used for the calibration of growth parameters in other models (Fyllas et al., 2017), so we adopted the same approach. The tree ring data set used for the calibration exercise was sampled in 75 SNFI plots, located in pure stands whose dominant species are F. sylvatica, P. halepensis, P. nigra, P. sylvestris or Q. pubescens, and selected to encompass a range of climatic aridity (Rosas et al., 2019). We took annual basal area increments of each tree as the observations to be matched by model predictions of sapwood growth. Simulations of the calibration exercise were performed using the basic sub-model only, for computational reasons, but we compared the performance of the two sub-models with calibrated parameter values. Further details of the calibration procedure and results are given in Appendix Sect. B3. We did not find any significant independent effect of species identity on RGRcambiummax and RERsapwood and only moderately for SRsapwood. In contrast, plots where the trees grew faster resulted in larger calibrated values of RGRcambiummax (Table B4). This result allowed us to devise a strategy to obtain estimates of this parameter for all tree species. Assuming that RGRcambiummax should scale proportionally to observed growth rates, we fitted a regression through the origin for the observed relationship between observed mean annual relative growth rates and RGRcambiummax (Fig. 2). We then estimated mean annual growth rates relative to cambium perimeter for all tree species using re-measured tree records in SNFI permanent plots by solving for the annual rate leading to the observed diameter increment between consecutive surveys. These growth rate estimates were obtained using data from both the SNFI2–3 and SNFI3–4 periods in the Catalan territory (but estimates for different SNFI periods and the entire Spain are provided in Table S4). We finally obtained estimates of RGRcambiummax for all tree taxa by using the calculated mean annual relative growth rates as input in the fitted linear models. We took the averages of calibrated SRsapwood and RERsapwood values as defaults for all taxa.
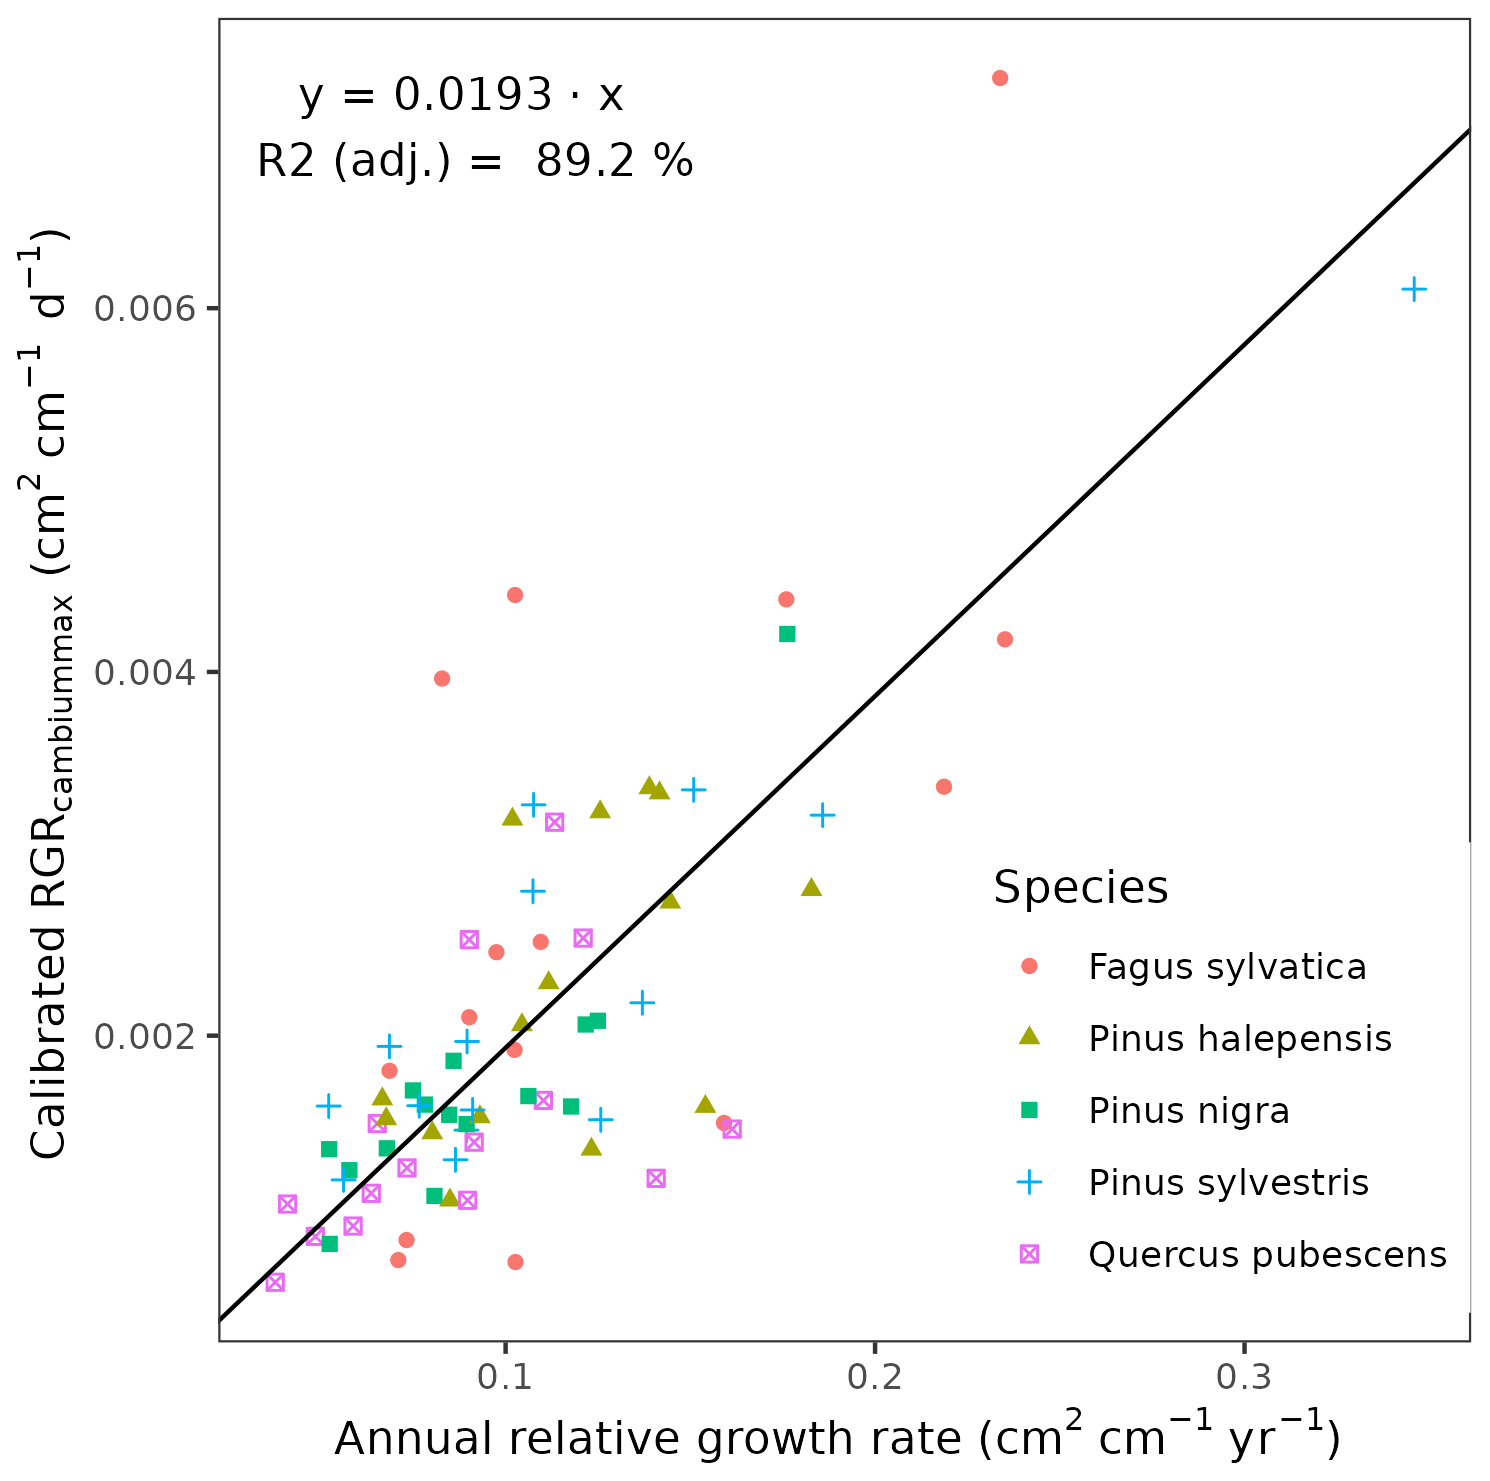
Figure 2Linear relationships, fitted using regression through the origin, between observed mean annual relative growth rates in calibration plots and calibrated RGRcambiummax. Symbols represent individual forest plots. The adjusted R2 value of regressions through the origin cannot be compared to those of ordinary linear regression models.
4.5 Inbuilt parameter estimation procedures
Altogether, the previous estimation procedures provided suitable values for 89 parameters, still leaving 28 (24 %) model parameters to be populated (Table 2). Moreover, only for 10 (8.5 %) parameters estimates were obtained for all 217 taxa. Therefore, large amounts of missing values remained after previous estimation procedures (Tables S1 and S3). Different imputation strategies were adopted to address this issue (Tables 2b and S1). Trait–trait relationships are frequently employed for parameter estimation, most often following functional syndromes (Maréchaux and Chave, 2017; Sakschewski et al., 2015). Following this strategy, we defined trait-to-trait mappings between parameters with low missing rates and parameters with higher missing rates (see Fig. A1). Quantitative trait–trait relationships were adopted for 17 (15 %) parameters, based on functional spectra, mainly to estimate parameters of hydraulic conductivity curves, pressure–volume curves, photosynthetic parameters and tissue respiration rates. Relationships with qualitative traits were adopted to populate 31 (26.5 %) quantitative parameters, with average values for combinations of leaf shape, life size and/or life form being frequently used as a source for the estimation of other parameters. For 15 (13 %) parameters we estimated family-level averages, but we combined this strategy with other imputation strategies whenever family-level values were missing. Finally, we provided single value defaults for 44 (38 %) parameters where we felt that taxonomic resolution was not critical. Among them, 13 parameters had not been estimated by any procedure and, therefore, can be considered as constants in the current model version. Instead of filling imputed values in the taxon parameter table, we implemented inbuilt parameter imputation procedures within MEDFATE initialization routines.
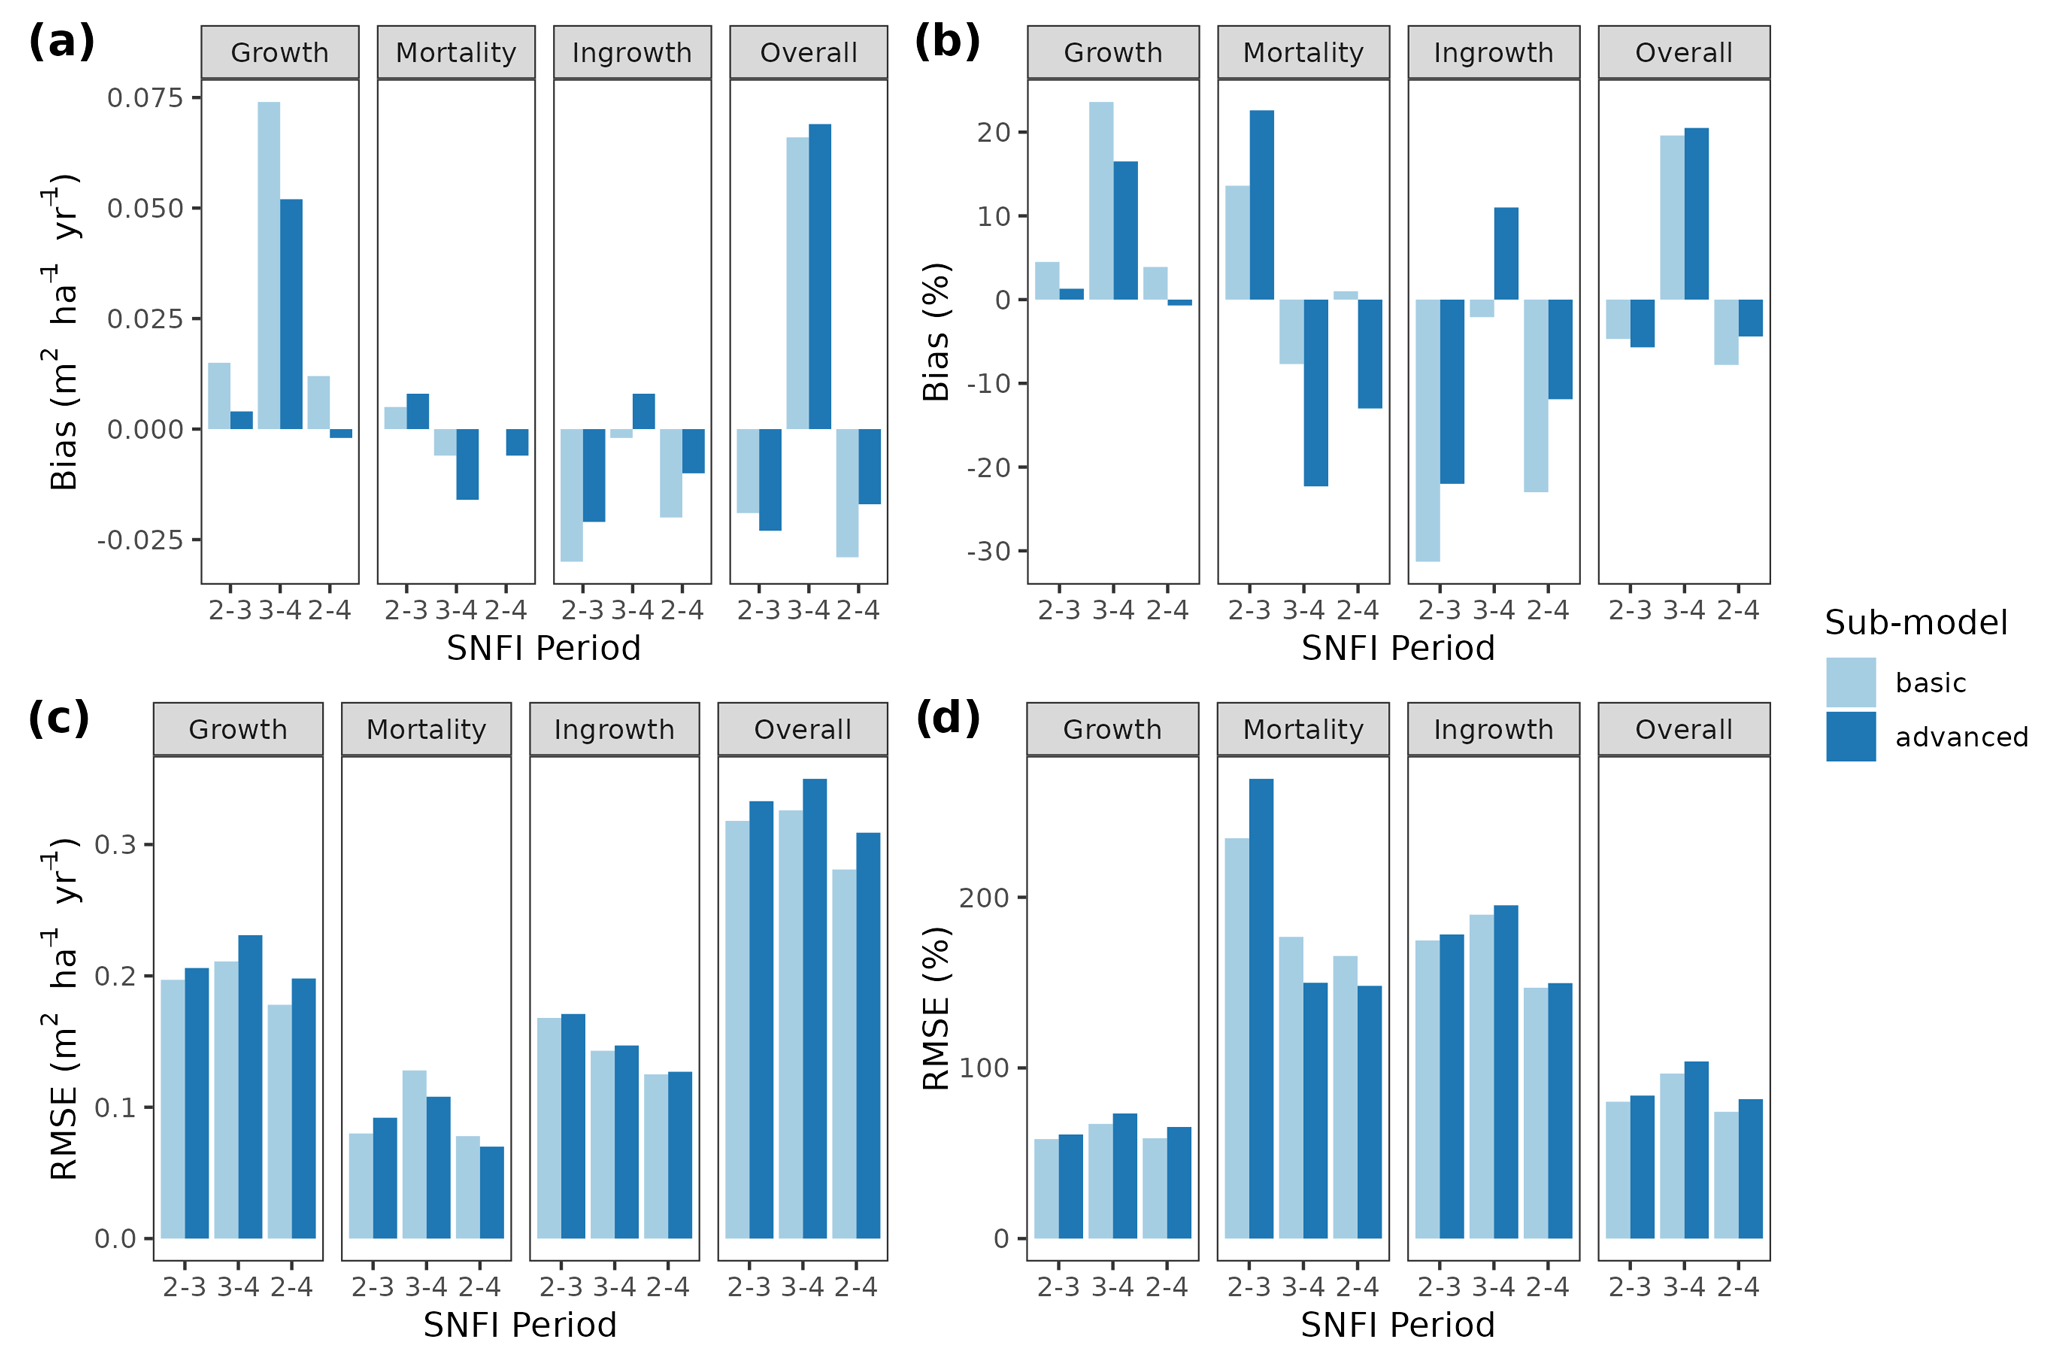
Figure 3Model evaluation results with respect to annual rates of basal area (BA) changes () predicted for different processes (growth, mortality, ingrowth) and taking into account all of them (overall). Results are shown for the two sub-models and for simulations spanning different periods between forest inventory surveys (SNFI2–3, SNFI3–4 and SNFI2–4). Note that calibration of growth, mortality and recruitment parameters was performed using data for the SNFI2–3 and SNFI3–4 periods. Figure A5 shows model evaluation results for the SNFI2–3 and SNFI3–4 periods with parameters calibrated using data from a different period.
5.1 Evaluation with SNFI data
While complex models can be applied to a range of purposes, model suitability should be assessed with respect to intended application (Planque et al., 2022). Our aim to use MEDFATE to project forest dynamics at the regional level required evaluating the capacity of the model to reproduce observed changes in forest dynamics. We therefore compared simulated forest dynamics between surveys of the SNFI in Catalonia against observations from repeated SNFI plots. Specifically, we selected 1779 permanent plots (i.e., common to all three surveys) without signs of management and avoiding large decreases (i.e., > 10 %) in stand basal area, which could indicate the effect of disturbances. Three sets of simulations were performed: (i) between SNFI2 and SNFI3 (∼ 10 years), (ii) between SNFI3 and SNFI4 (∼ 15 years), and (iii) between SNFI2 and SNFI4 (∼ 25 years). Since the model simulates ingrowth at DBH = 7.5 cm, smaller trees were excluded from the initial forest state. Both the basic and advanced sub-models were tested, taking 5 and 120 h of computation on 20 parallel threads, respectively, for the longest period. Evaluation focused on predictions of the following: (a) changes in stand basal area due to growth of surviving trees, (b) stand basal area losses due to tree mortality, (c) stand basal area increases due to ingrowth into the first diameter class (ingrowth into large size classes can occur in the observed data due to the variable radius sampling, but these were not included), and (d) overall changes in stand basal area. With the aim of comparing the performance of MEDFATE with that of an empirical alternative, we used an integral projection model (IPM) calibrated using SNFI data for the whole of Spain and evaluated its predictive performance over the same target region. Unlike matrix-based models, the IPM methodology does not classify the population of trees into discrete stage classes. Rather, each tree population is described by a continuous distribution as a function of a continuous variable-like size (Easterling et al., 2000). A brief description of the IPM implemented in this work is given in Appendix C. For further details, see García-Callejas et al. (2017).
Overall annual changes in stand basal area for the SNFI2–4 period (∼ 25 years) had a mean bias of −0.03 (−7.8 %) for the basic sub-model, and −0.02 (−4.4 %) for the advanced sub-model (Fig. 3), whereas the empirical IPM over the same region exhibited a larger mean bias, +0.18 (+46 %), likely because it was calibrated for the whole of Spain (Table D1). RMSE was 0.28 (74 %) for the basic sub-model and 0.31 (82 %) for the advanced sub-model, whereas RMSE for IPM was 0.30 (80 %), indicating a comparable prediction capacity of MEDFATE and IPM at the plot level. When inspecting the error distribution of overall basal area change predictions we observed a small tendency to under-predict basal area increases in the coldest areas of the Pyrenees (Figs. A2 and A3). Overall, MEDFATE performed better for the SNFI2–3 and SNFI2–4 periods than for the SNFI3–4 period (Fig. 3). This seems to be a consequence of observed growth rates being different for SNFI2–3 and SNFI3–4, which cause growth biases when the model is calibrated with one period and evaluated with the other (Fig. A5). Consequently, future projections may be affected by the additional uncertainty derived from growth rate estimations. Predicted stand basal area increments due to growth had slightly larger error rates when using the advanced sub-model than when using the basic sub-model, but, conversely, the advanced sub-model yielded slightly more accurate predictions of mortality than the basic sub-model for SNFI3–4 and SNFI2–4 periods (Fig. 3; Table D1). Simulations using the two sub-models performed similarly with respect to ingrowth.
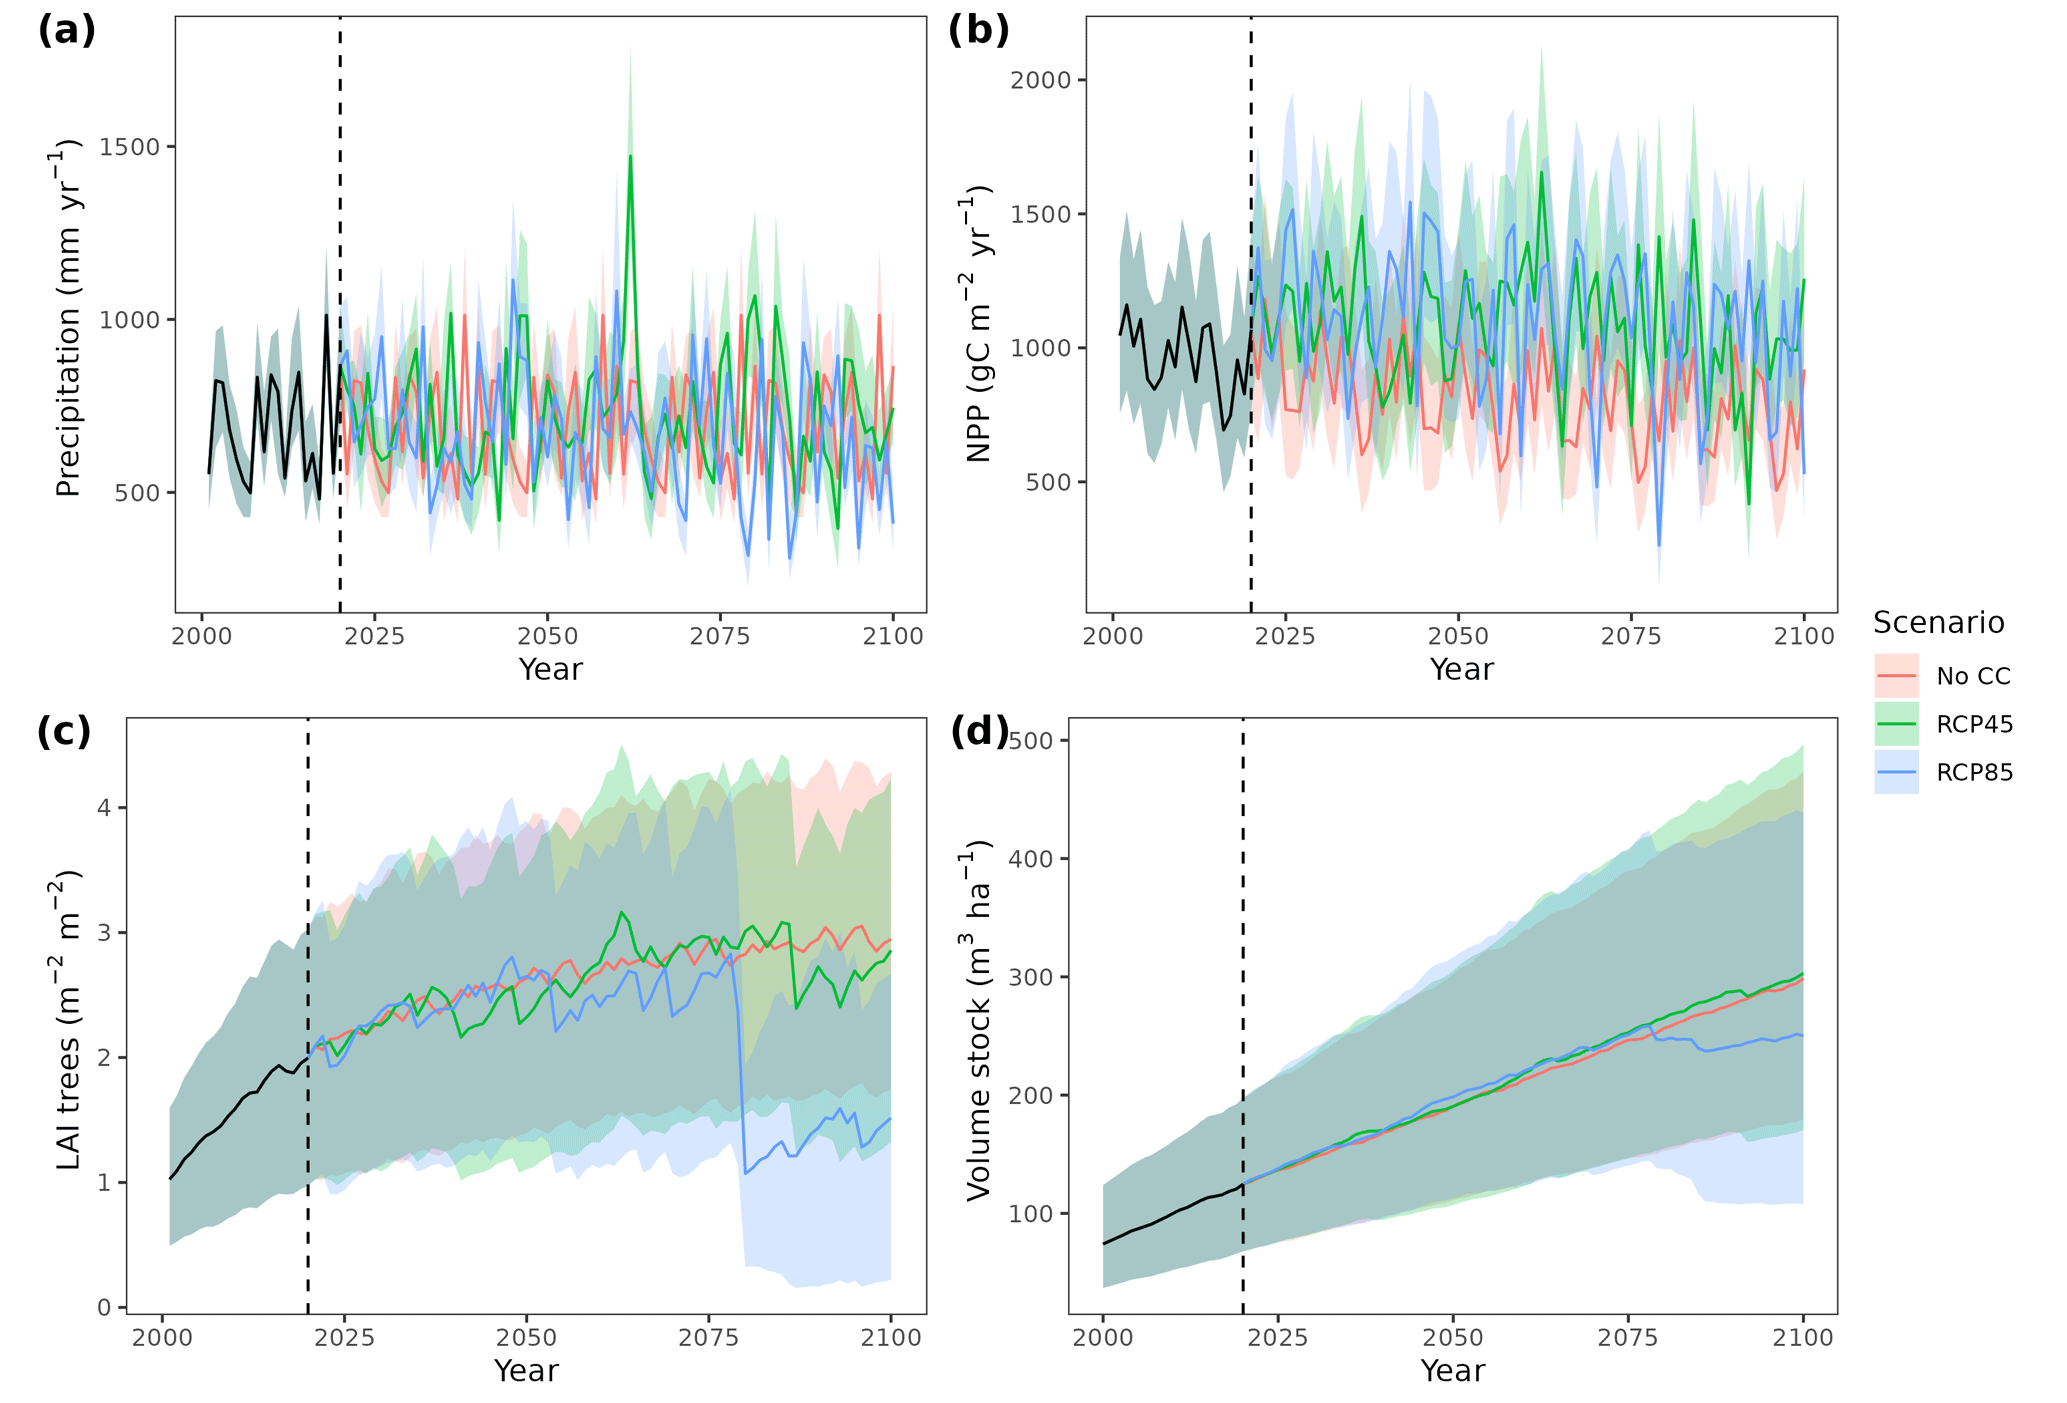
Figure 4Precipitation input (a) and model predictions of annual net primary production (b), canopy leaf area index (c) and wood volume stock (d) for the 21st century under a scenario without climate change (No CC) and two climate change scenarios (RCP 4.5 and RCP 8.5) in Catalan forests. Results for the period 2000–2020 correspond to historic climate. Continuous lines correspond to median values, and shaded areas indicate the 25 %–75 % quantile range, all of them estimated across all forest plots.
5.2 Application
To illustrate the potential of the fully parameterized model to project future forest functioning and dynamics at the regional level, we took all forest plots surveyed in Catalonia during SNFI3 (year ∼ 2000) and projected them for the 21st century. We took interpolated historical records for the 2001–2020 period and climate projections for the 2021–2100 period, corresponding to the 5th phase of the Coupled Model Intercomparison Project (CMIP5) under Representative Concentration Pathways (RCPs) 4.5 and 8.5. We obtained daily weather projections from the EURO-CORDEX project (Kotlarski et al., 2014), corresponding to a single global/regional climate model couple (i.e., MPI-ESM/RCA4), which has been deemed appropriate to describe future climate change in Catalonia (Altava-Ortiz and Barrera-Escoda, 2020). Since the spatial resolution of climate model predictions was 0.1 ‰ (∼ 9 km), we used empirical quantile mapping to bias-correct and downscale weather to the forest plot scale, taking interpolated historical records (1976–2005 period) as reference data (De Cáceres et al., 2018). Annual [CO2] series under RCP 4.5 and RCP 8.5 scenarios were obtained from Meinshausen et al. (2011). A climate scenario assuming constant climate (No CC) was also evaluated for comparison with RCP scenarios, by repeating historical 2001–2020 weather over the century and assuming [CO2] = 386 ppm. Forest management and natural disturbances such as wildfires or biotic attacks were not considered for simplicity. MEDFATE runs were conducted using the basic sub-model, which nevertheless required 72 h of computation on 20 parallel threads to process each scenario (a graphical comparison of results obtained with the two sub-models is provided in Fig. A4 for a small subset of plots).
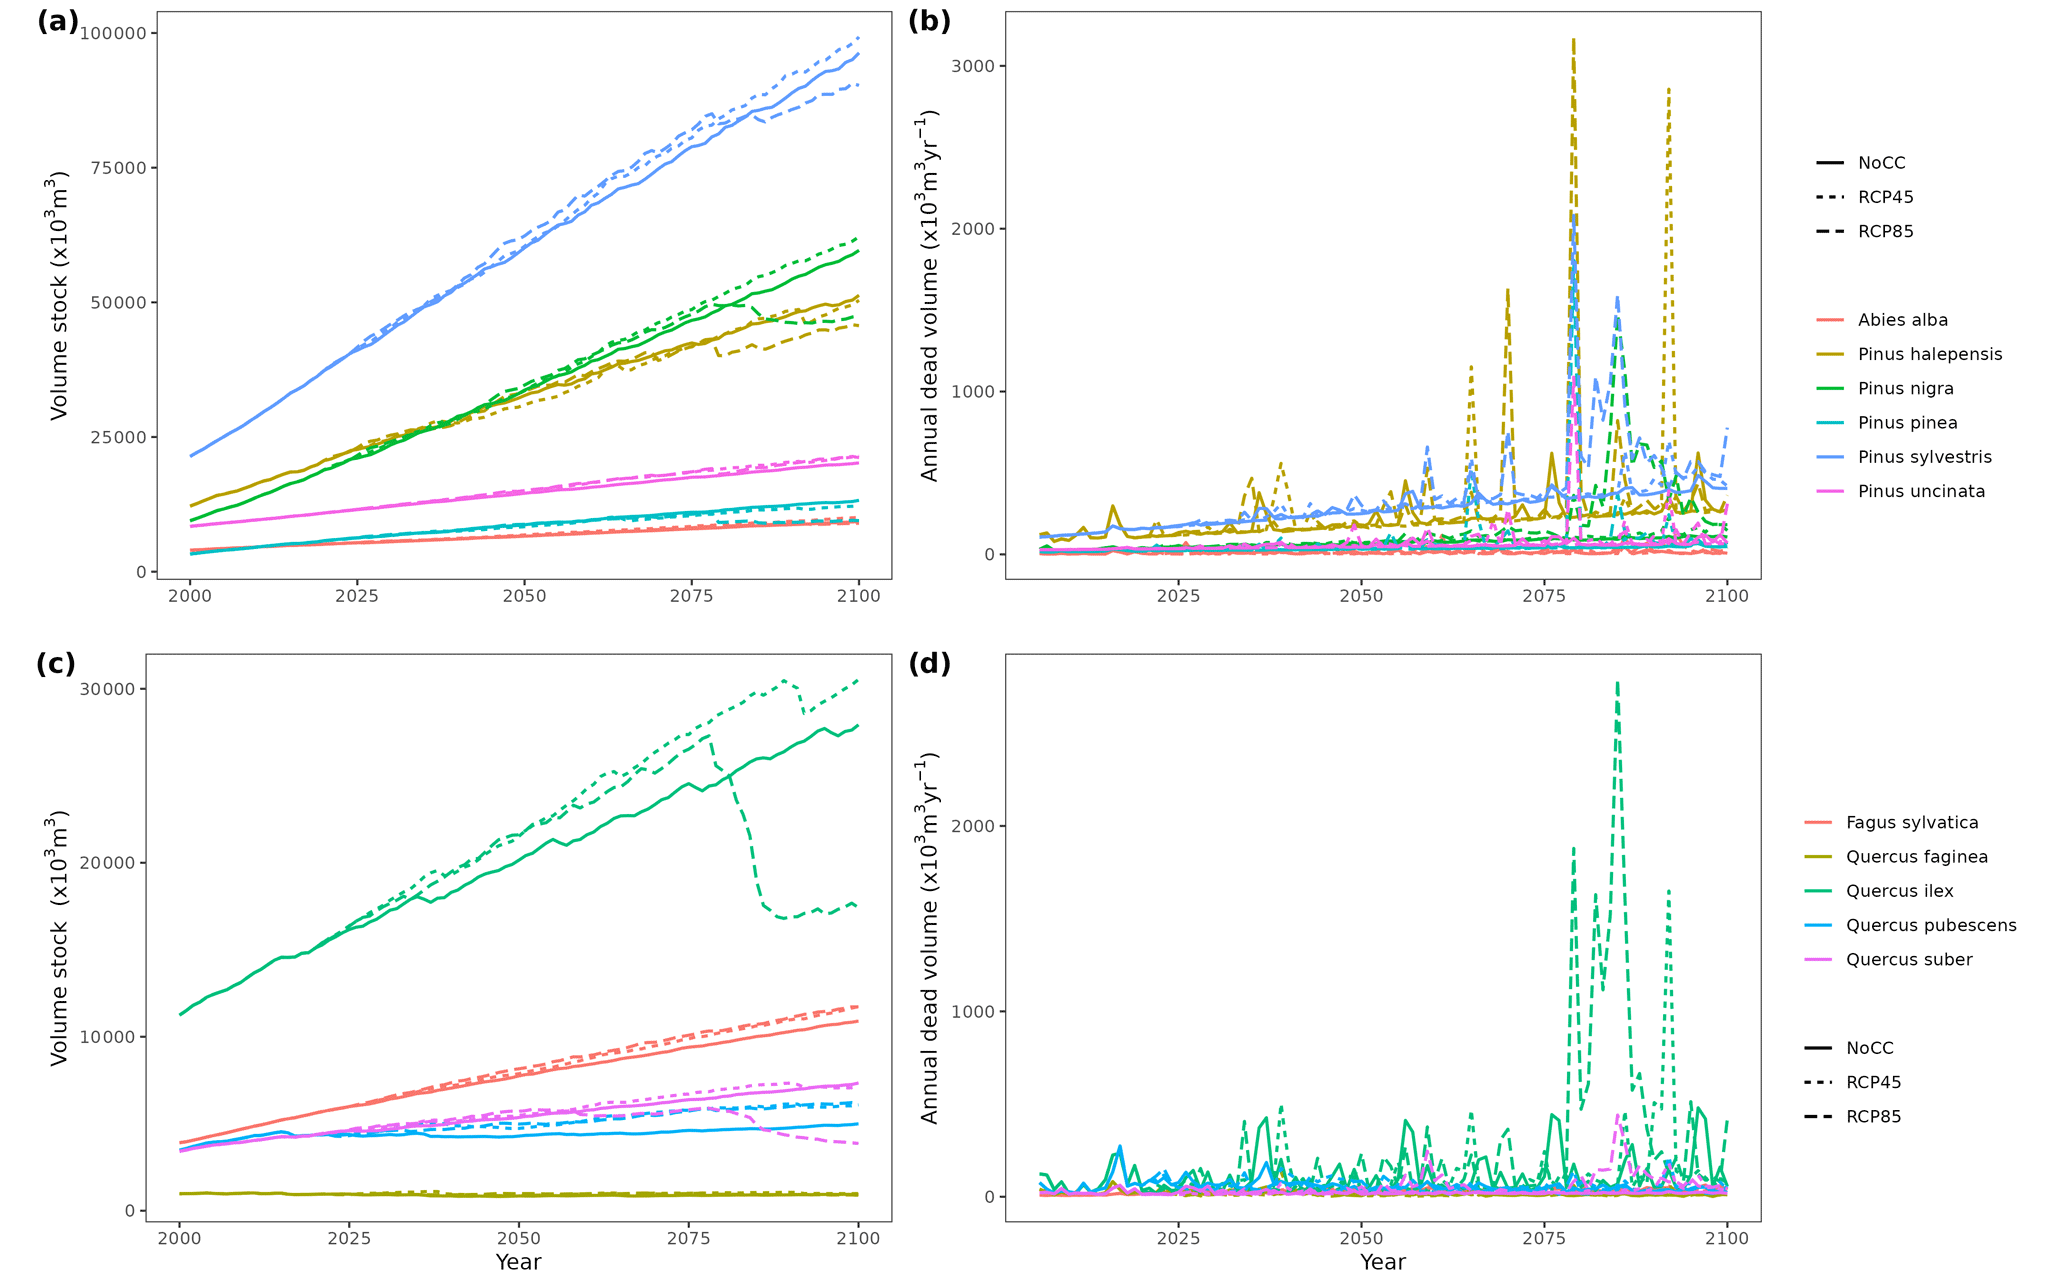
Figure 5Regional-level timber accumulation (a, c) and annual mortality loss (b, d) predicted by MEDFATE under a scenario of constant climate (No CC) and two climate change scenarios (RCP 4.5 and RCP 8.5) for the 10 main tree species in Catalonia, grouped into conifer (a, b) and broad-leaf species (c, d). Results for period 2000–2020 correspond to historic climate.
Climate projections for Catalonia include a steady increase in temperature (+3.5 ∘C under RCP 8.5) and, while much more uncertain, a 40 % reduction in annual precipitation during the second half of the 21st century under RCP 8.5 (Fig. 4a) (Altava-Ortiz and Barrera-Escoda, 2020). Despite these trends, the most important regional-level pattern predicted by the model was a steady increase in wood volume stock throughout the century under all three scenarios and for all main tree species (Figs. 4d and 5). This is largely because most forests in Catalonia are relatively young as a consequence of abandonment of agricultural lands and reduction of forest management during the second half of the 20th century (Vilà-Cabrera et al., 2017). Net primary production (NPP) decreased steadily along the century under a stable climate due to the increase in respiration costs needed to sustain an increasing forest biomass (Fig. 4b). Under two climate change scenarios, however, the progressive increase in temperatures and air [CO2] resulted in higher NPP and slightly larger timber accumulation during the central part of the 21st century, compared to predictions under stable climate. The continuation of ongoing forest densification caused LAI to increase asymptotically under stable climate (Fig. 4c). Nevertheless, strong decreases in NPP and LAI were predicted between 2070 and 2100 under RCP 4.5 and RCP 8.5, as a result of years with very low rainfall which, together with the increased VPD, caused widespread drought-induced defoliation. Increased mortality rates were also predicted under RCP 8.5 for this last period, as shown by the lower rates of wood volume stock accumulation (Fig. 4d). We found differences among species in the effect of extreme drought events on tree mortality, being Pinus nigra, P. sylvestris and P. halepensis the most affected species among pines (Fig. 5). We also found increased drought-related mortality rates in oak species (Quercus ilex and Q. suber), but, since the model does not account for resprouting at present, these predictions should be interpreted as above-ground mortality.
6.1 Accounting for functional diversity in regional-level forest models
Species-specific parameter estimation in complex dynamic vegetation models is often done by focusing on one species at a time (e.g., Davi and Cailleret, 2017; Guillemot et al., 2017), but this becomes impractical when the number of taxonomic entities increases. The wealth of information in global plant trait databases and forest inventory data facilitates dealing with functional diversity, but our experience shows that model parametrization using these resources has its own challenges. Clearly, this strategy becomes more useful the larger the fraction is of taxon-specific parameters that can be conceptually matched to observable traits, which needs to be accounted for during model design and formulation. In other words, the model should be “trait-enabled”. The design of MEDFATE allowed us to match up to 49 parameters with functional trait definitions, which correspond to 50 % of parameters if we exclude allometric coefficients. Even in “trait-enabled” models there will always be parameters that are not observable or are only seldom measured, even for the most common species, which requires adopting alternative parameter estimation procedures. Calibration of key, but non-observable, parameters using field data from particular stands can be employed in some cases. For example, we used calibration and tree ring series from 75 SNFI plots to address the estimation of growth/senescence parameters. However, this approach implies the possibility that taxon-average estimates across calibration plots led to biased predictions in the application at the regional level. Moreover, it is unlikely to have the appropriate calibration data (e.g., tree ring series) for all woody taxa occurring in the target region. We circumvented these problems by fitting a relationship between calibrated growth or senescence rates (RGRcambiummax and SRsapwood) and observed annual growth rates relative to cambium perimeter, which can be empirically estimated using resampled plot data for all species included in the forest inventory. Another alternative estimation procedure that we adopted to populate non-observable key parameters was meta-modeling. The strong computational requirements of the advanced sub-model for regional applications led us to conduct improvements in the basic sub-model (including an increased sensitivity to environmental variables) and a meta-modeling exercise to obtain estimates for non-observable transpiration and photosynthesis parameters. This estimation procedure can be applied to any taxon but requires confidence in the trait parameter estimates of the model used as reference (here, the advanced sub-model). We partially built this confidence from previous stand-level evaluation exercises (De Cáceres et al., 2021), but the meta-modeling exercise should be repeated if current parameter values were deemed incorrect for some species. Developers should always avoid manual tuning, due to its non-reproducibility and slowness of application. We only resorted on this procedure for baseline mortality rates, forced by the mixture of mechanistic and empirical design in mortality modeling, although we acknowledge that calibration exercises should be preferred (e.g., Hartig et al., 2012).
Another important limitation when estimating parameters for multiple taxa is, obviously, plant trait data availability. Even though plant trait databases continue to increase in size (Kattge et al., 2020), the finer the taxonomic resolution is, the less information there is available. This leads to a trade-off between the taxonomic resolution of the model entities vs. the amount of missing parameter values in the final parameter table. When parsing trait databases we took both species- or genus-level averages as valid estimates to reduce the frequency of missing values in the parameter table, but this entails a potential loss of accuracy at the species level. Regardless of this decision, and no matter how much effort is put in parameter estimation procedures, parameter imputation will always be needed to fill information gaps in models representing multiple taxa. We recommend implementing imputation procedures in initialization routines, keeping them separated from taxon parameter tables because the large number of missing values in the table reveals information gaps to be addressed with additional data gathering. A range of parameter imputation procedures is possible for observable traits. Models often use quantitative–quantitative trait relationships from functional syndromes and averages across levels of qualitative traits to obtain suitable species parameter estimates (Thonicke et al., 2020; Sakschewski et al., 2015). Assuming taxonomic families bear a trait phylogenetic signal, we complemented the information provided by functional covariation with family-level averages (Anderegg et al., 2022), but more sophisticated phylogenetically informed approaches would also be possible (Sanchez-Martinez et al., 2020). Note that models can also use known relationships between measured traits and demographic rates (i.e., between wood density and mortality rates) for the imputation of the latter (Fyllas et al., 2017; Thonicke et al., 2020). In our opinion, more research is needed around the imputation procedures to fill in missing taxon parameter values. For example, future research could evaluate the phylogenetic signal of multiple traits, compare the relative performance of different imputation alternatives, analogously to the comparison of alternative biomass allometries (Ameztegui et al., 2022), or evaluate the loss of accuracy of model predictions caused by imputations. As for databases of biomass or volume allometric equations, the development of databases documenting bi- or multivariate trait relationships and their domain of application could help modelers to implement adequate imputation strategies.
We addressed specific- and supra-specific trait variability in our study, but we did not consider intra-specific variability, which can amount to 25 % of overall phenotypic variation (Funk et al., 2017; Siefert et al., 2015). Berzaghi et al. (2020) describe three main strategies to account for intra-specific trait variability in vegetation models, among which the first two could be combined with our parameter estimation approach. First, prescribed (e.g., non-plastic) intra-specific trait variation may be approximated in models using within-species environmental-trait relationships or trait covariation (Rosas et al., 2019; Poyatos et al., 2007). To implement this strategy, intra-specific functional trait databases are needed, but they are presently scarce (López et al., 2021). These relationships may be implemented as inbuilt estimation rules to be applied at the time of initialization. Second, intra-specific variation can be considered in vegetation models by dynamically changing parameter values (e.g., photosynthesis) depending on transient environmental conditions (i.e., nitrogen content, average temperature or light availability) (Prentice et al., 2014; Crous et al., 2022). This strategy can also be combined with our parameter estimation approach, but it requires implementing equations internally while acknowledging trade-offs between traits and limits to phenotypic plasticity. Finally, trait inheritance and, therefore, eco-evolutionary dynamics can be simulated (Oddou-Muratorio and Davi, 2014), but we believe this approach to be computationally too demanding for regional-level applications.
6.2 Reproducibility and transferability of parameter estimation strategies
Given the iterative nature of model development, taxon-specific model parameters need to be re-estimated (and model performance re-evaluated) in many situations, such as when the design or mathematical formulation of the model is modified, when taxonomic entities are redefined, or when updates of existing trait data sources occur. Unlike models developed for single or few species, parameter re-estimation for multiple-taxa requires that procedures are reproducible and automated. All the procedures mentioned in the previous section, except manual tuning, are reproducible and were repeated several times during the development of MEDFATE. The code to implement parameter estimation and evaluation procedures should be continuously integrated into workflows coupled to modeling development cycles, in the same way as model evaluation procedures for all the key outputs related to the most important applications. In our opinion, this aspect of trait-enabled model development deserves more attention and should be one of the foci of collaboration efforts between modelers, with the long-term aim of achieving community modeling cyber infrastructures (Fer et al., 2021).
Another practical issue is the transferability of parameter estimates and estimation procedures, initially developed for a given trait-enabled model and region, to new target regions and/or other models. Even though intra-taxon variability is neglected, taxon-average estimates derived from global plant trait databases are, in principle, as valid for our target region as they are for other regions, assuming that processes where they operate have been represented in a proper way. Moreover, trait-enabled forest models could share databases of taxon-based parameter estimates thanks to parameter definitions being matched to the same measurable entities. Since they derive from global data, imputation procedures based on among-species trait covariation or family-level averages should be equally valid in different regions. Procedures for extracting taxon-specific parameter estimates from (global) trait databases could also be used for new taxa or other models, which points to the possibility of sharing these procedures among developers, although the information available will differ widely depending on the target region. In contrast, empirical parameters obtained from forest inventory data are unlikely to be valid in different areas (Thonicke et al., 2020), and the procedures to derive them may need to be tailored to idiosyncratic aspects of national forest inventories (e.g., plot spatial arrangement and temporal replication, taxonomic treatment, field sampling protocols), unless harmonized forest inventory data are used. Calibration and meta-analyses procedures, or relationships between growth/senescence parameters and observed annual relative growth rates, could be applied to other target regions or species, but they are specific to MEDFATE.
6.3 The value of trait-enabled models for the projection of forest dynamics at the regional level
Mechanistic models are often regarded as having a larger degree of uncertainty than empirical models – due to their larger number of parameters (Adams et al., 2013), but mechanistic models of vegetation dynamics can achieve good performance when calibrated for specific stands, and parameter estimates are carefully chosen for target species (de Wergifosse et al., 2022; Forrester et al., 2021). In the case of mechanistic trait-enabled models, one can expect substantial biases with respect to the prediction of forest dynamics because key parameters of demographic processes are unlikely to be matched by available plant database traits. We achieved a relatively small bias in overall basal area changes by introducing key empirical elements in the model design and parameter estimation – annual relative growth rates, mortality rates, bioclimatic limits and probabilities of ingrowth – all of them estimated from SNFI data. The accuracy of MEDFATE was similar to that of the IPM over Catalonia and to that reported in Trasobares et al. (2022) for an empirical forest projection system developed for the entire Spanish territory. This increases our confidence in MEDFATE for applications like projecting regional standing timber volume in the target region. However, this does not mean that MEDFATE should be preferred to more empirical approaches, which will be much faster, robust and equally predictive, when the purpose is to predict forest dynamics. Highly resolved models like MEDFATE can potentially better represent the effect of extreme climatic events on forest dynamics, but process and input data uncertainties can substantially increase prediction errors. The use of a global soil product for soil properties, as opposed to regional data sources, and the lack of information on rock content and the topographic context of forest inventory plots surely contributes to larger errors. The fact that estimates of rock fragment content obtained in the calibration exercise were different across species (Fig. B3d and Table B4) is an indication of the importance of these factors for accurate growth (and mortality) predictions. We did not account for spatial variation in nutrient availability either, which is known to influence growth rates. At present, MEDFATE is unbalanced in the detail accorded to water, carbon and growth processes, with respect to mortality and recruitment processes. The approach taken to model baseline mortality rates and ingrowth was even simpler than many forest gap models (Bugmann and Seidl, 2022), which may explain the relatively poor results regarding those processes and points to future development efforts. For example, mortality predictions could be improved by fitting more complex empirical models that account for tree size or recent growth (Vanoni et al., 2019). However, these equations may be difficult to parameterize in a model that also includes explicit mortality mechanisms based on water and carbon levels (i.e., desiccation and carbon starvation). Mechanistic modeling of drought-induced mortality is an active field of research (Venturas et al., 2021; Liu et al., 2021; Trugman et al., 2021; McDowell et al., 2022), but important developments are still required to address multiple interactions between drivers. In our opinion, hybrid mechanistic and empirical approaches are thus needed to produce unbiased predictions of tree mortality currently. Recruitment prediction could benefit from considering additional refinements, such as accounting for resprouting capacity or mechanistically dealing with seedling and sapling mortality (König et al., 2022), at the potential cost of increasing the number of non-observable model parameters.
It is also interesting to discuss the differences between MEDFATE simulations conducted using the basic vs. advanced sub-models. Mechanistic models are expected to perform well under novel environmental conditions, due to their ability to separate the causal effects of different climatic variables. MEDFATE with the advanced sub-model is clearly a better choice than with the basic sub-model in this respect, but the advanced sub-model is computationally too demanding for large-scale applications. Like other models before (e.g., Landsberg and Sands, 2011), the modifications made to the basic, yet faster, sub-model show that it is possible to design and parameterize simpler approaches while fully retaining the ecophysiological responsiveness to key climate change variables such as [CO2] or VPD. However, further work would be necessary to compare the performance of the two sub-models in terms of key stand level E, gross primary production (GPP) or NPP fluxes under different conditions. In terms of forest dynamics, the advanced sub-model produced somewhat less accurate growth estimates than the basic sub-model. We attribute this different performance to the fact that calibration of growth parameters was conducted using the basic sub-model and to differences in the predictions of soil moisture and plant water status yielded by the two sub-models.
Given this its lower computational requirements and better evaluation results, we recommend using MEDFATE with the basic sub-model for regional-scale joint projections of Mediterranean forest function and dynamics under a coherent set of mechanistic assumptions, although calibration and evaluation exercises may need to be repeated for novel target regions. In our application to Catalonia we illustrated the projection of structural variables of interest for forest management planning (such as basal area, density or volume stock per tree species) as well as variables directly related to ecosystem function (such as LAI, E, GPP or NPP). Future work should focus on the evaluation of MEDFATE's performance with respect to this second set of variables.
Here we presented the design, parameter estimation and evaluation of the MEDFATE model, coupled with forest inventory data, for its application at the regional level in Catalonia. Our model is similar to many forest gap models in terms of its representation of population structure, but it has a higher degree of detail in the representation of water and carbon processes, much like other hybrid models (Fisher et al., 2018; Liu et al., 2021). Models that are similar to MEDFATE have been previously developed to simulate regional forest dynamics in the Mediterranean Basin (Fyllas et al., 2007; Mouillot et al., 2001; Fyllas and Troumbis, 2009). However, the detail on plant hydraulics of the advanced sub-model is similar to more specialized models focusing on drought-induced plant desiccation (Cochard et al., 2021; Ruffault et al., 2022). MEDFATE has some unique features (i.e., the link between xylem cavitation and leaf defoliation, together with the need to build new sapwood tissue to recover water transport capacity) that make it suitable to study drought legacy effects. Overall, we think that MEDFATE is an attractive tool to study forest function and dynamics under projections of increased water limitations, such as those of Mediterranean climate. Besides the value of the model, we illustrated the process, challenges and potential strategies to determine parameter estimates for a large number of taxa by extensively using plant trait databases, which can be useful for the parametrization of other trait-enabled models.
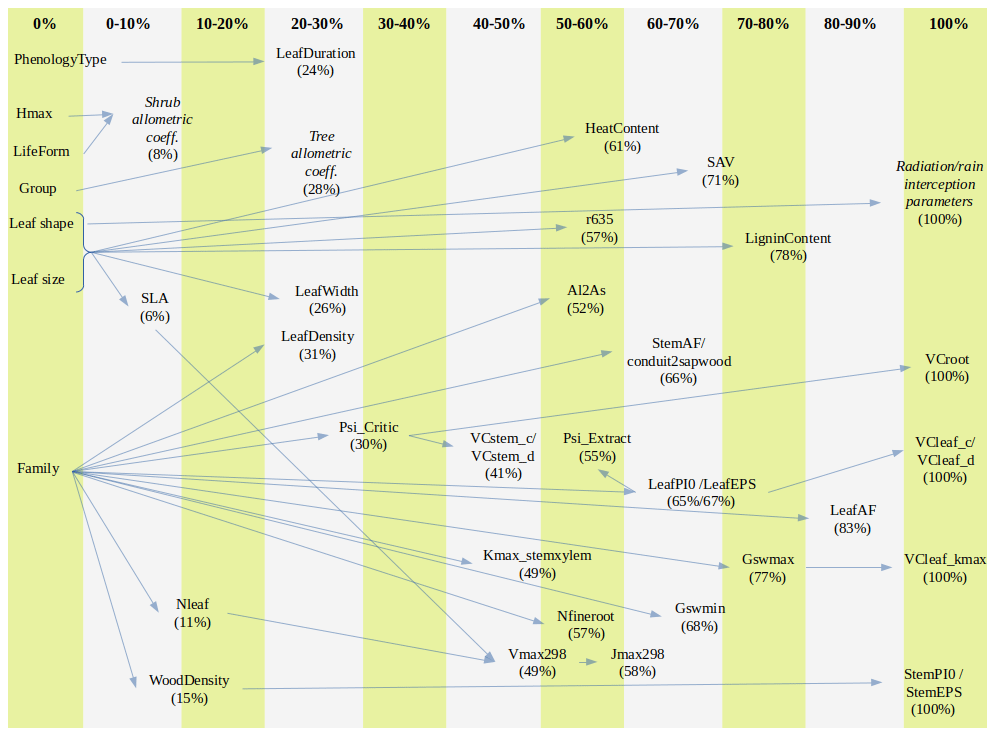
Figure A1Percentage of missing values for model parameters across species and parameter relationship (arrow) from which imputation is performed (trait–trait quantitative relationship, averages for combinations of categorical traits or imputation from family means). Parameters that are given constant values when missing are not shown. The definition of parameters is given in Table S1.
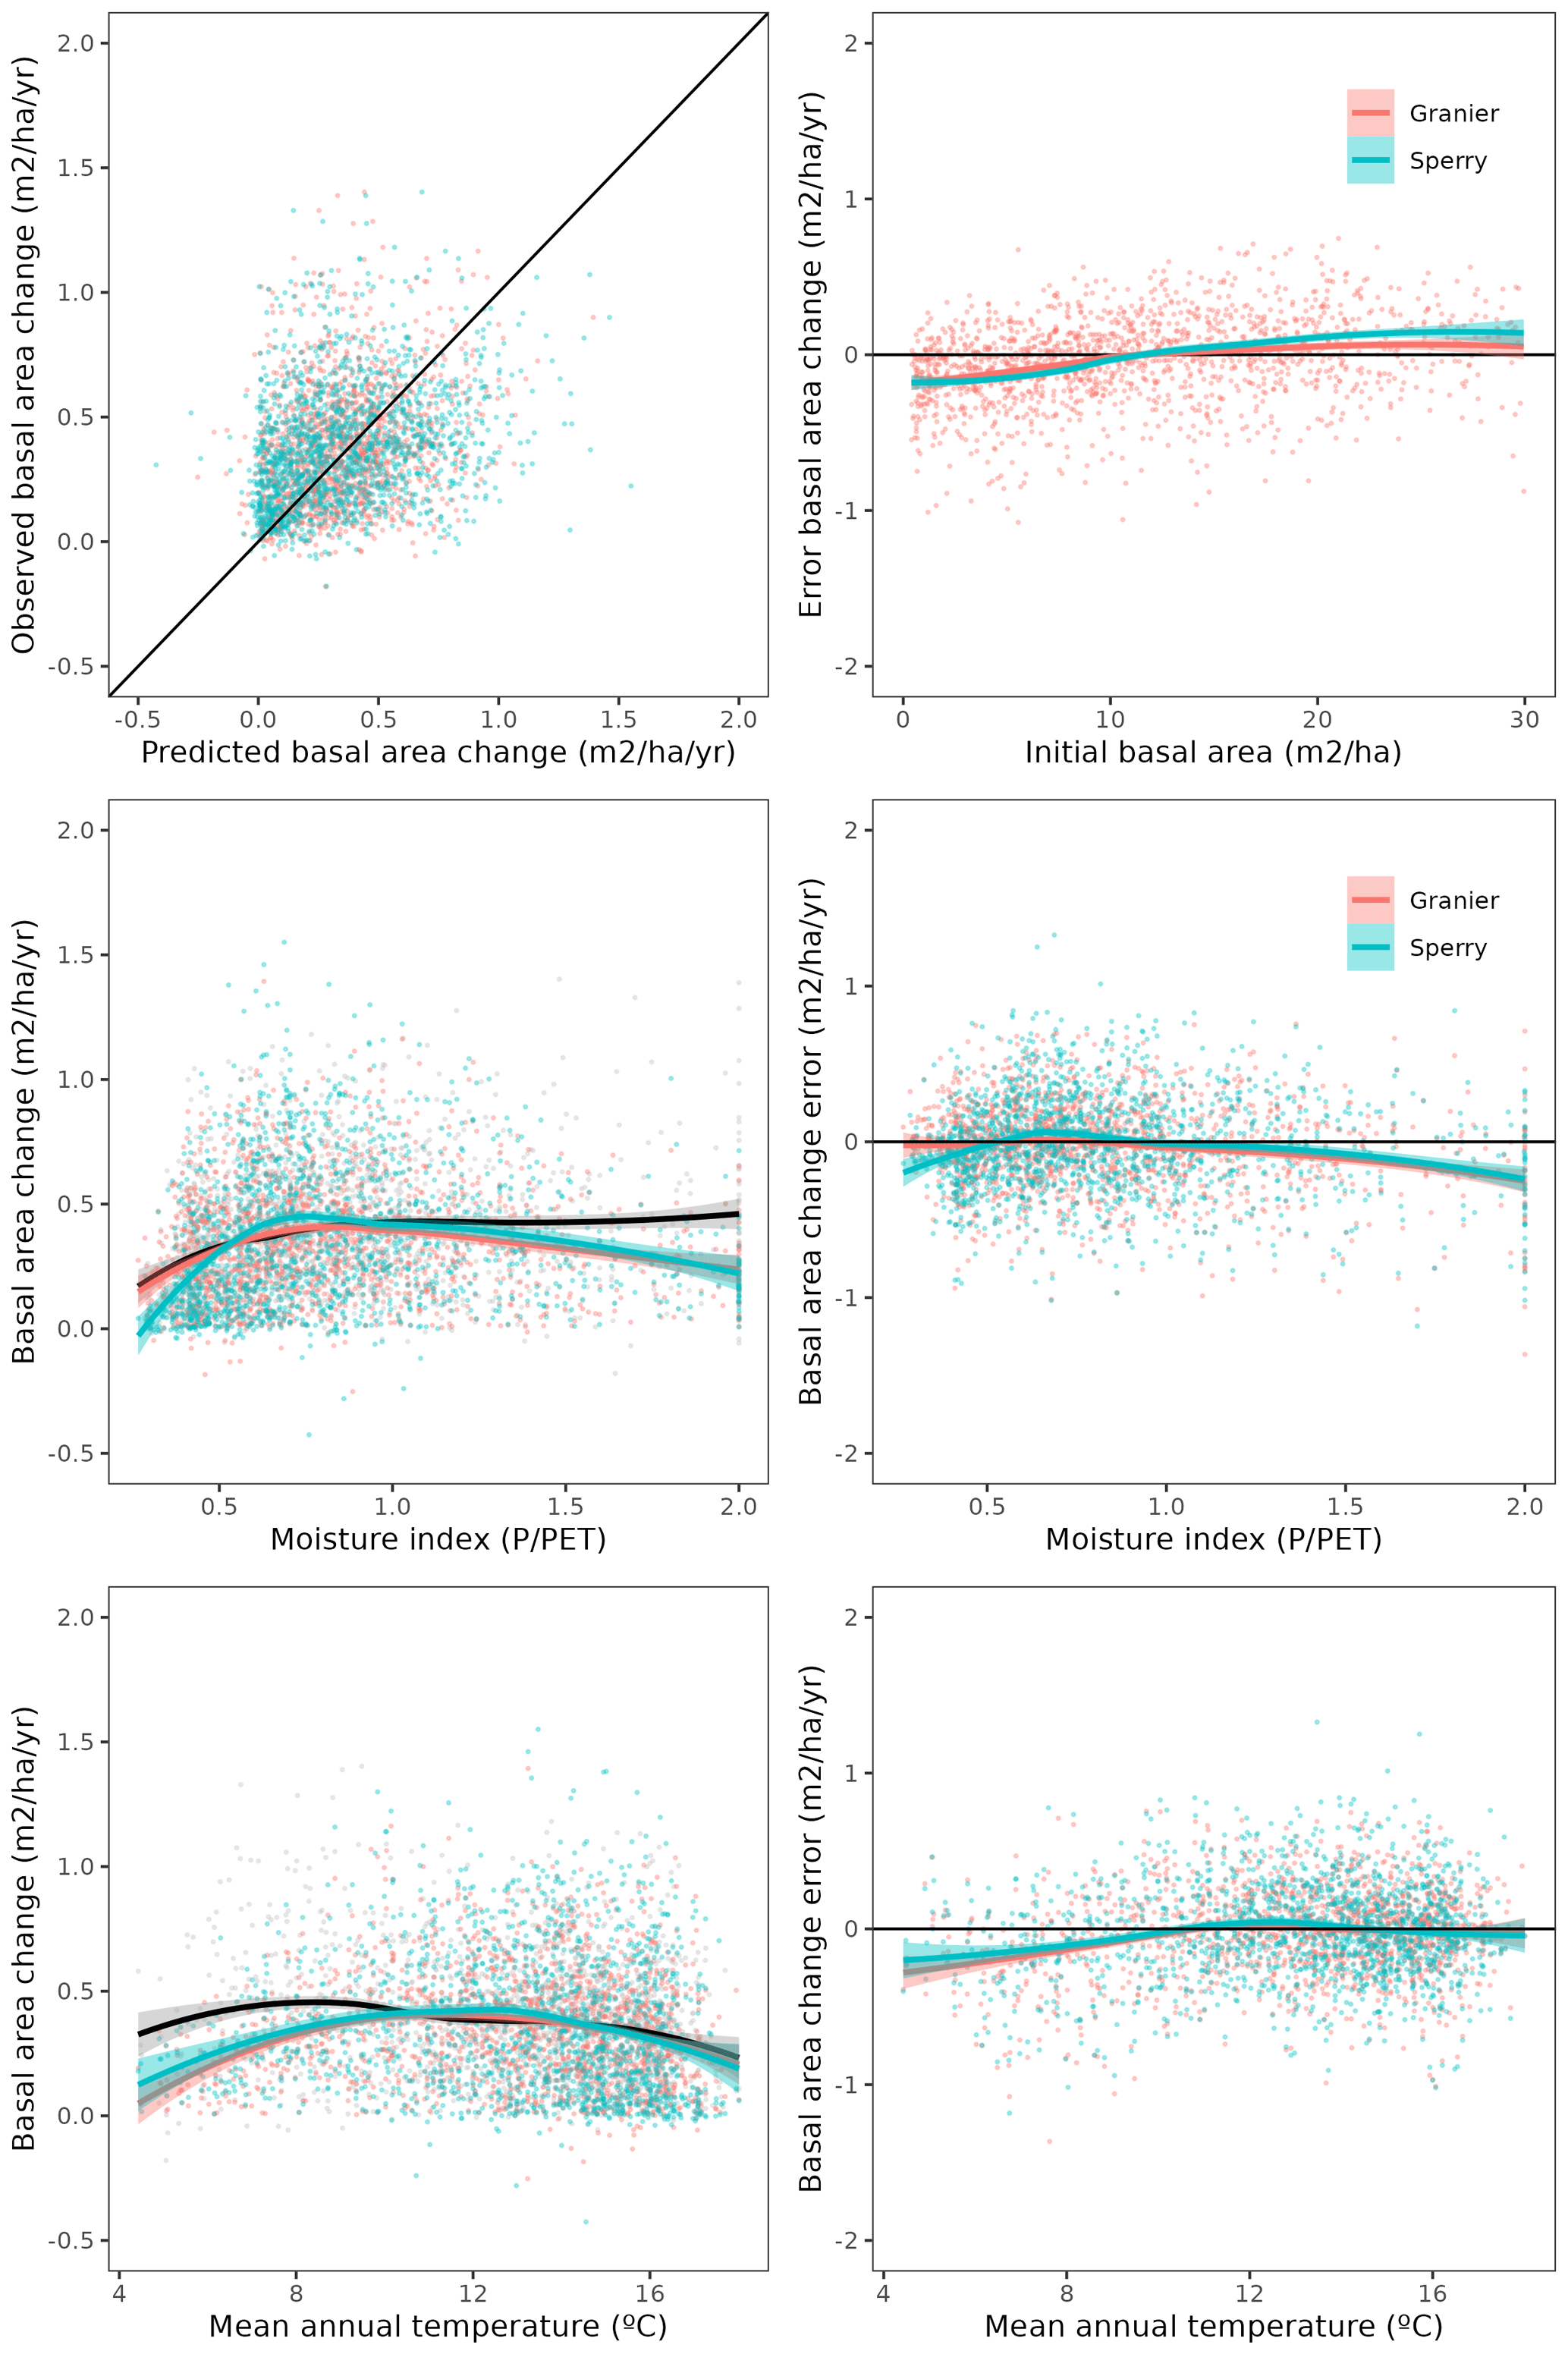
Figure A2Comparison of predicted vs. observed overall basal area changes and the distribution of model errors depending on initial basal area, moisture index and mean annual temperature. Gray dots and black lines correspond to observations, orange dots and red lines predictions with the basic sub-model, and light blue dots and blue lines to predictions with the advanced sub-model.
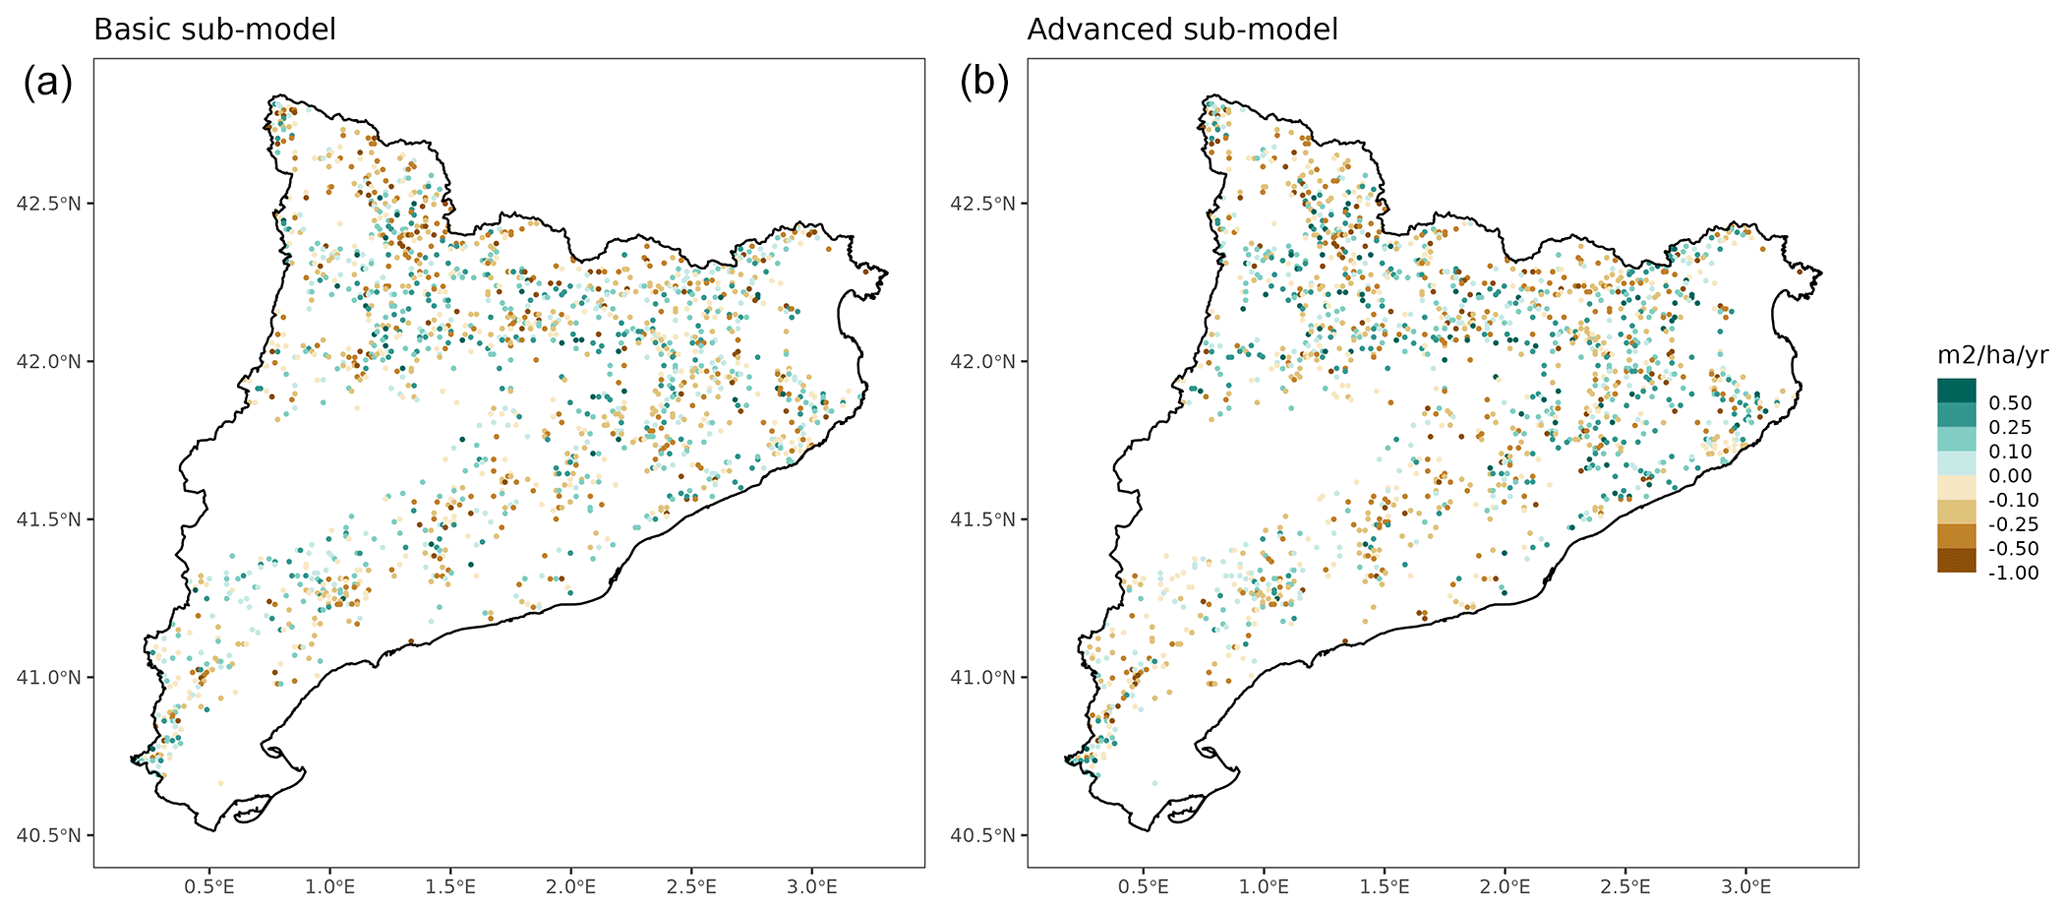
Figure A3Spatial distribution of prediction errors in overall basal area changes for simulations using the basic sub-model (a) or the advanced sub-model (b).
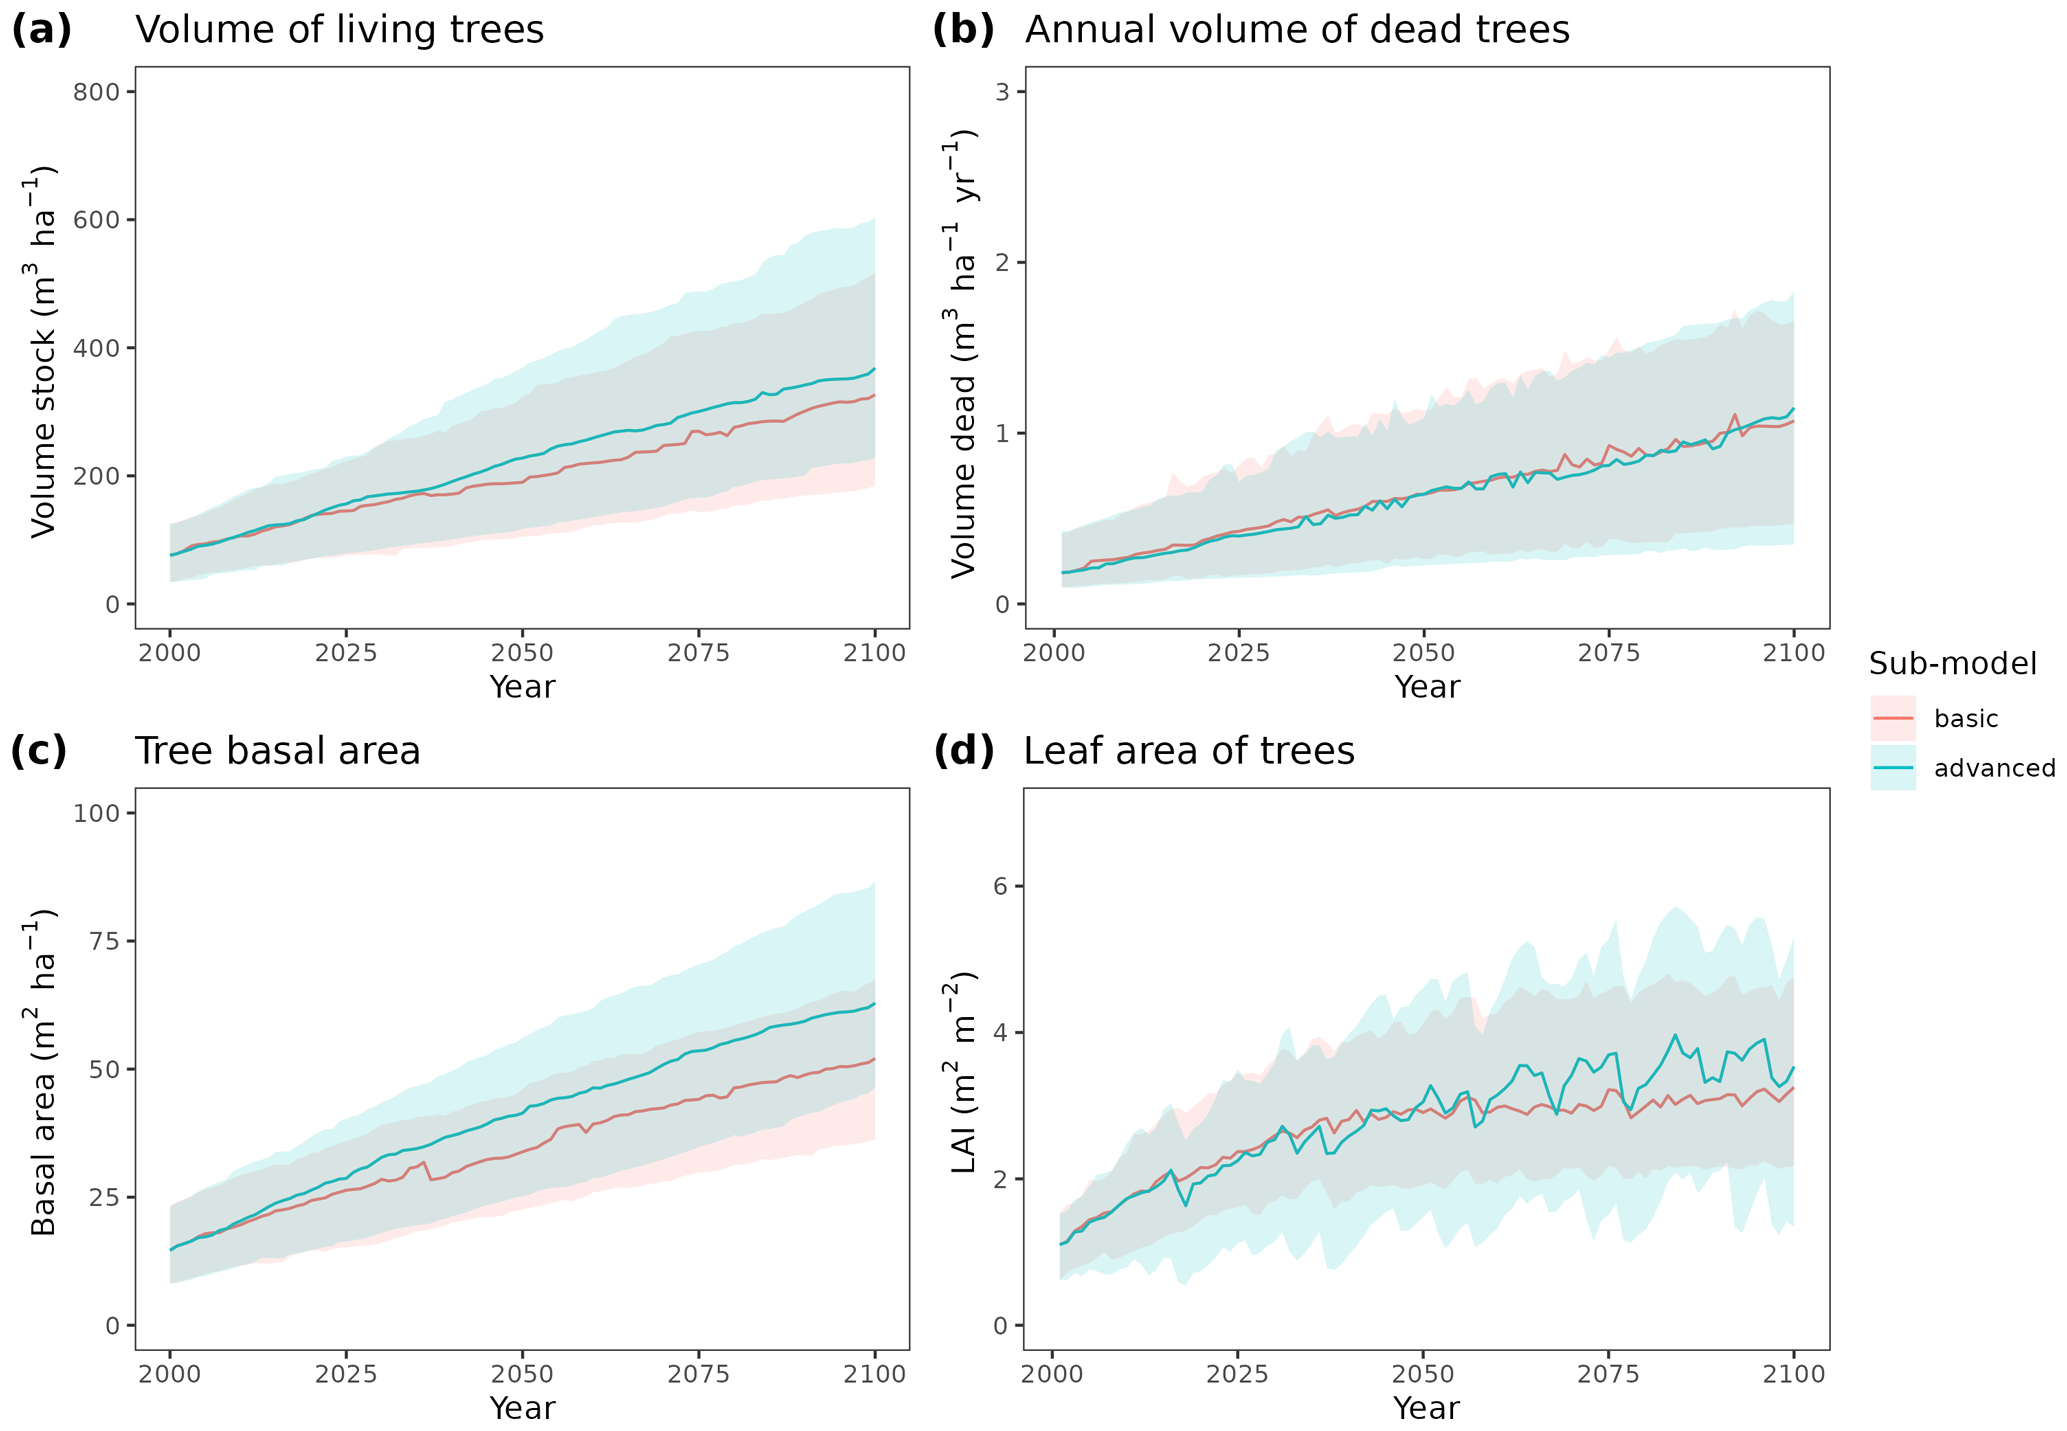
Figure A4Comparison of predictions obtained by MEDFATE using either the basic or advanced sub-models, for the 21st century under a scenario of constant climate and a subset of 120 forest inventory plots. Continuous lines correspond to median values and shaded areas indicate the 25 %–75 % quantile range, estimated across all forest plots.
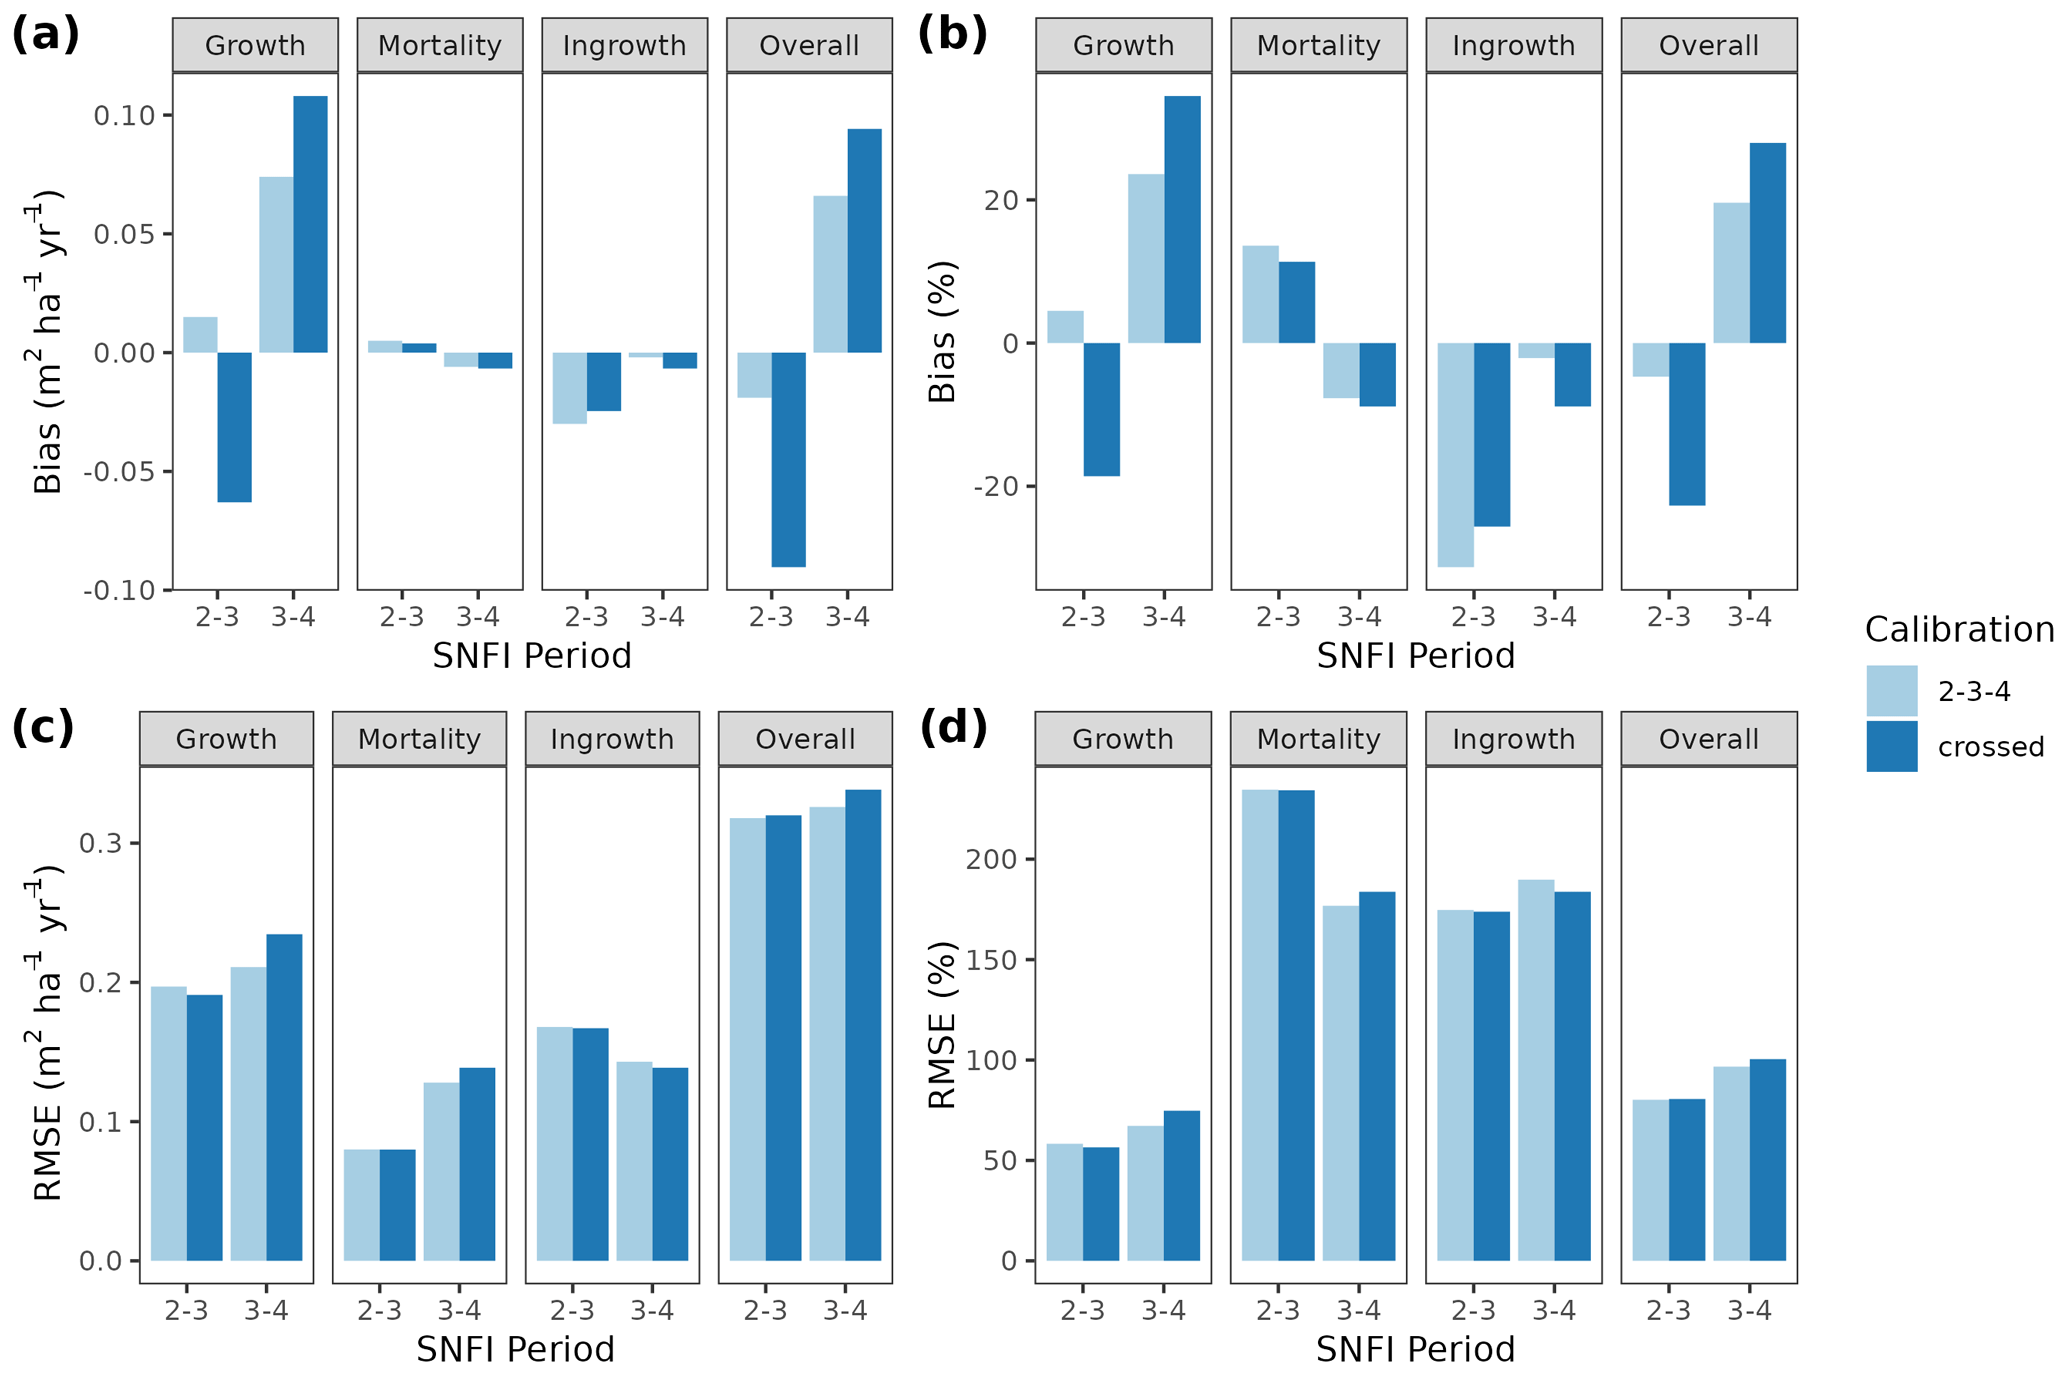
Figure A5Model evaluation results with respect to annual rates of basal area (BA) changes () predicted for different processes (growth, mortality, ingrowth) and taking into account all of them (overall). Results are shown for simulations with the basic sub-model and spanning either the SNFI2–3 or SNFI3–4 periods. Bar colors indicate the period used for calibration of growth, mortality and recruitment parameters: “2–3–4” corresponds to calibration using data for the SNFI2–3 and SNFI3–4 periods; “crossed” corresponds to SNFI2–3 simulations with parameters calibrated using data from SNFI3–4 periods, and SNFI3–4 simulations with parameters calibrated using data from SFNI2–3.
All mathematical symbols used here are described in Table 1. Parameter definitions and units are given in Table S1.
B1 Transpiration and photosynthesis in the basic sub-model
We describe here the modifications of transpiration and photosynthesis processes included in recent versions of the sub-model, with respect to the description given in De Cáceres et al. (2015). Radiation extinction, transpiration and photosynthesis processes are represented at a daily timescale in the basic sub-model. Extinction of shortwave radiation (SWR) and photosynthetically active radiation (PAR) through the canopy follows Beer–Lambert's equation with parameters currently depending on leaf shape. Maximum transpiration – i.e., before accounting for soil water deficit – for the whole stand (Emax,stand) is estimated using daily Penman's potential evapotranspiration (PET) and an empirical relationship developed by Granier et al. (1999):
where LAI is the leaf area index of the stand. While Granier et al. (1999) estimated the coefficients of the Eq. (B1) by pooling empirical data from different forest stands, species differ in the relationship between leaf area and maximum transpiration. Hence, we modified the estimation of Emax,stand implemented in the original sub-model (De Cáceres et al., 2015) as follows. If one neglects the intercept (so that transpiration is zero for a bare stand) and assumes that all leaf area of a stand corresponds to a single cohort i, Eq. (B1) becomes
where aTmax and bTmax are species-specific parameters for cohort i. Assuming that reasonable species-specific estimates are available for aTmax and bTmax, Eq. (B2) can be used to estimate Emax,stand(i), the maximum stand transpiration if dominated by the species of cohort i. Once Emax,stand(i) has been estimated for each species in the stand, the fraction of SWR absorbed by a given cohort i is used to estimate its maximum transpiration (Emax,i) from Emax,stand(i) (Korol et al., 1995). Actual cohort transpiration (Ei) is a function of Emax,i, the vertical distribution of its fine roots and Ki,s, a Weibull function representing the relative reduction of transpiration in response to edaphic drought in each soil layer s. In turn, Ki,s depends on the soil water potential (Ψs) and two taxon-specific parameters, Ψextract and cextract, representing the soil water potential corresponding to 50 % of maximum transpiration and the coefficient regulating the steepness of transpiration decrease, respectively (De Cáceres et al., 2015):
Ki,s values corresponding to different soil layers are averaged using the distribution of fine roots as weights. In contrast to the original formulation of the basic sub-model (De Cáceres et al., 2015), however, in the current MEDFATE version actual transpiration does not decrease to zero under severe drought conditions, since water losses can still occur via leaf cuticular conductance and incomplete stomatal closure (Duursma et al., 2018).
The basic sub-model assumes a linear relationship between plant transpiration and gross photosynthesis. However, it accounts for the dependency of water use efficiency on light availability, air CO2 concentration ([CO2]) and vapor pressure deficit (VPD):
where FPARi is the fraction of PAR at the mid-crown level of cohort i, and WUEPAR, and WUEVPD are empirical parameters modulating WUE depending on environmental conditions (i.e., FPAR, [CO2] and VPD, respectively). Given the formulation of Eq. (B4), WUEmax is interpreted as the water use efficiency of the species at VPD = 1 kPa and without air [CO2] or light limitations to photosynthesis.
B2 Details of the estimation of transpiration and photosynthesis parameters of the basic sub-model
Eight key parameters regulating transpiration (aTmax and bTmax from Eq. B2; Ψextract and cextract from Eq. B3) and photosynthesis (WUEmax, WUEPAR, and WUEVPD; Eq. B4) in the basic sub-model could not be estimated from plant trait databases. Assuming that predictions of the advanced sub-model are more accurate than those of the basic sub-model, we adopted a meta-modeling approach to make transpiration (E), gross photosynthesis (Ag) and soil moisture predictions obtained by the basic sub-model as similar as possible to those produced by the advanced sub-model (both for present-day and projected climate). Increasing the similarity of the two sub-models was important because growth and senescence parameters were, later in the parametrization process, calibrated using simulations of the basic sub-model only (see Sect. C3); therefore potential mismatches in E and Ag or plant water status could translate in a mismatch of growth (and hence, forest dynamics) predictions.
Table B1Revised estimates of the parameters regulating photosynthesis and transpiration in the advanced sub-model, for the set of 12 prioritized species. Parameter definitions and units are provided in Table B1. Species with an asterisk indicate those for which the performance of the advanced sub-model had been evaluated previously.
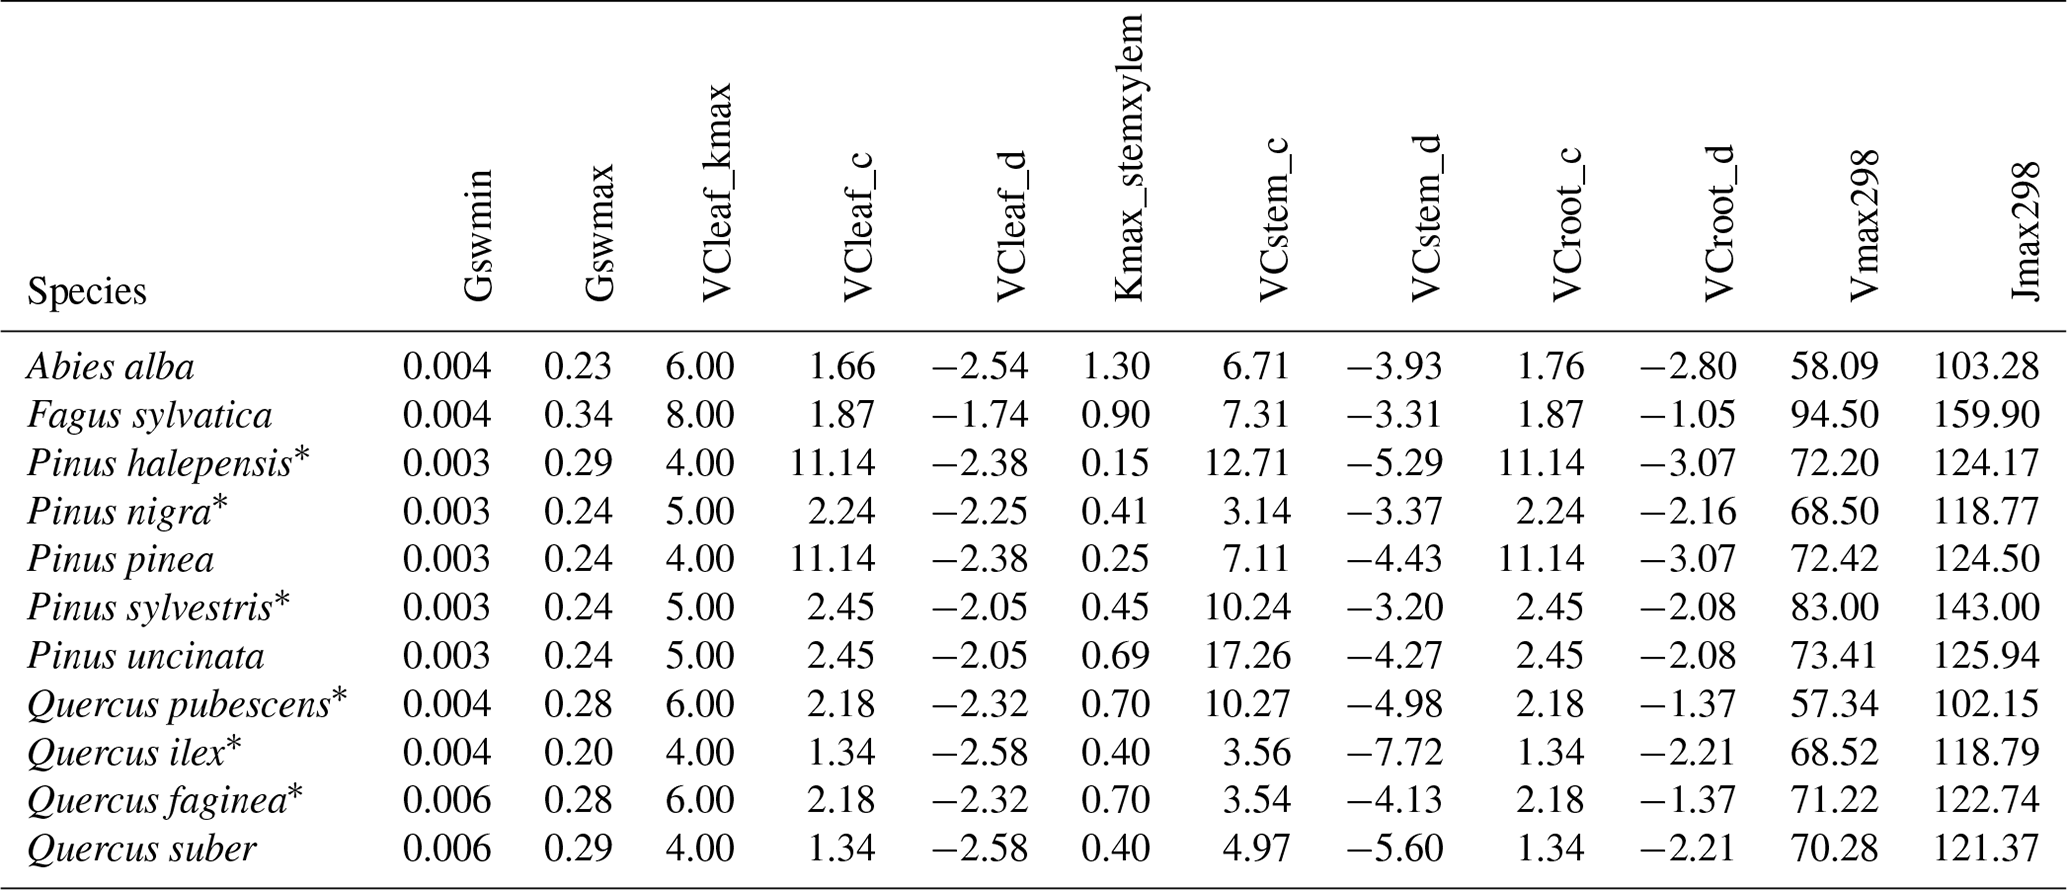
For each of the 12 species most important in the study area, the meta-modeling exercise was as follows. We first revised the parameters of the advanced sub-model that regulated plant transpiration and photosynthesis (Table B1). Note that an evaluation of the performance of the advanced sub-model had been conducted previously (De Cáceres et al., 2021), using data from experimental forest plots which altogether encompassed 6 out of the 12 species.
After revising the parameters of the advanced sub-model, we randomly selected up to 60 SNFI3 plots with a minimum stand basal area of 3 m2 ha−1 and where the target species was dominant (> 80 % in basal area). Tree records corresponding to species different from the target species were discarded. Using daily weather corresponding to a single year (year 2001), we then ran the two sub-models with unlimited water supply (i.e., maintaining soils always at field capacity), so that transpiration and photosynthesis estimates were not affected by soil water deficit. The basic sub-model was run with default values for aTmax and bTmax, i.e., using coefficients of Eq. (B1). We found that the cohort's annual ratio was rather unaffected by FPAR, on average, but we found substantial differences across species in this ratio (Fig. B1a). We used the ratio, averaged across cohorts and plots, to scale coefficients of Eq. (B1), obtaining estimates for aTmax and bTmax.
To obtain estimates of Ψextract and cextract, the parameters regulating the decrease of transpiration with soil drought, we repeated the simulations with the advanced model, this time allowing soil water extraction and removing any water supply (i.e., without precipitation) so that transpiration decreased following the progression of edaphic drought. Daily Eadvanced values were divided by the corresponding Eadvanced values under unlimited water supply, and we used non-linear least-squares regression to fit a Weibull model (Eq. B3) to the resulting ratio as a function of layer-averaged soil water potential (Fig. B1b).
To estimate parameter WUEPAR, we began by calculating annual WUEg (i.e., annual Ag over annual E) for each cohort under the advanced sub-model (and unlimited water supply). We then calculated the ratio between WUEg of each cohort and the plot's maximum WUEg value. For each species, we fitted a model of this ratio as a power function of FPAR and took the exponent as an estimate of WUEPAR (Fig. B1c).
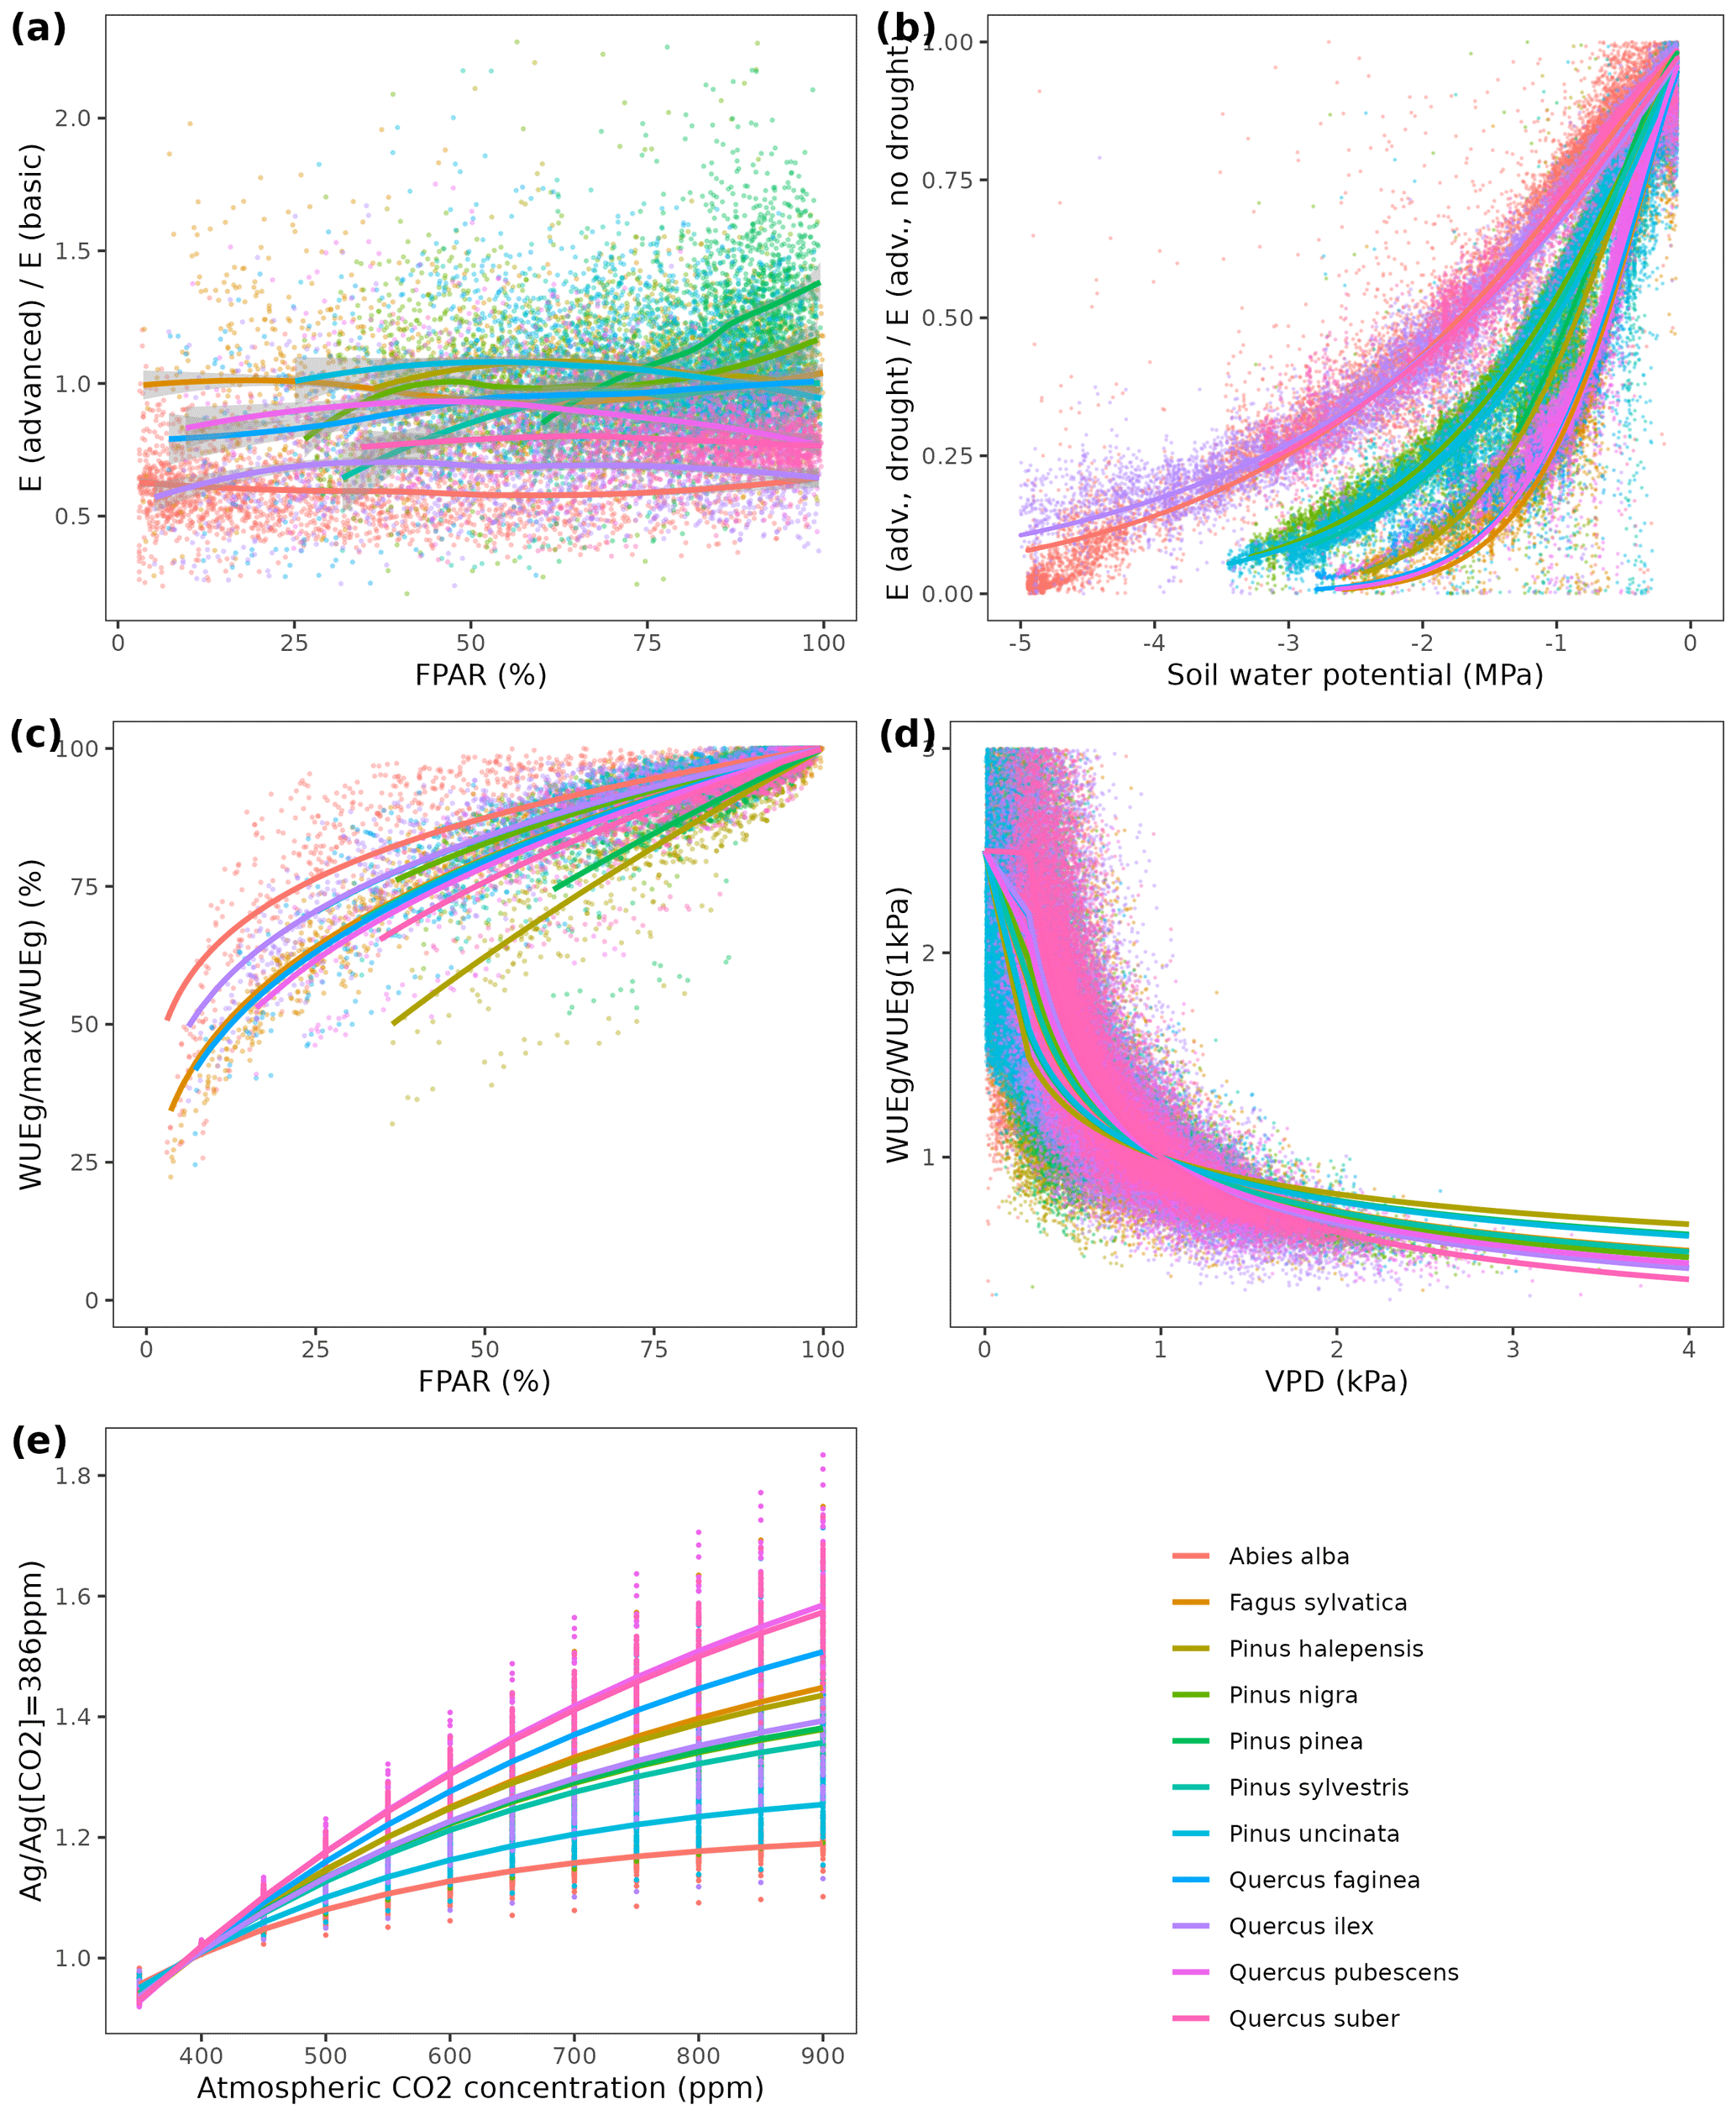
Figure B1(a) Cohort values against their available FPAR; (b) ratio of daily Eadvanced values between simulations with no water supply and simulations with unlimited water supply, as a function of soil water potential in the former case; (c) annual WUEg values (relative to the maximum WUEg value obtained for each plot) against available FPAR; (d) daily WUEg values (relative to WUEg at VPD = 1 kPa) against VPD; (e) plot-level ratios between gross photosynthesis under increasing [CO2] values and gross photosynthesis under [CO2] = 386 ppm. Lines of panel (a) correspond to smoothed splines, whereas those of panels (b)–(e) indicate the non-linear models fitted for each species.
We then analyzed the relationship between daily WUEg values and VPD under the advanced sub-model (and unlimited water supply). Specifically, a power relationship was fitted between VPD and WUEg relative to its value at VPD = 1 kPa, except for 0 < VPD < 0.25 kPa range, where a linear relationship was assumed to avoid unrealistic values (Fig. B1d).
To estimate we conducted additional sets of simulations with the advanced model under increasing values of [CO2], from 350 to 900 ppm (and unlimited water supply), and fitted negative exponential models to the ratio between Ag at each given [CO2] and of Ag under [CO2] = 386 ppm (Fig. C1e). Finally, WUEmax estimates were obtained by dividing annual Ag estimates over those obtained from the sum of daily E values multiplied by f1(FPAR), f2(VPD) and f3([CO2]) terms of Eq. (B4).
Table B2Parameter estimates obtained from the meta-modeling exercise, corresponding to Eqs. (B2)–(B4), for the 12 prioritized species.
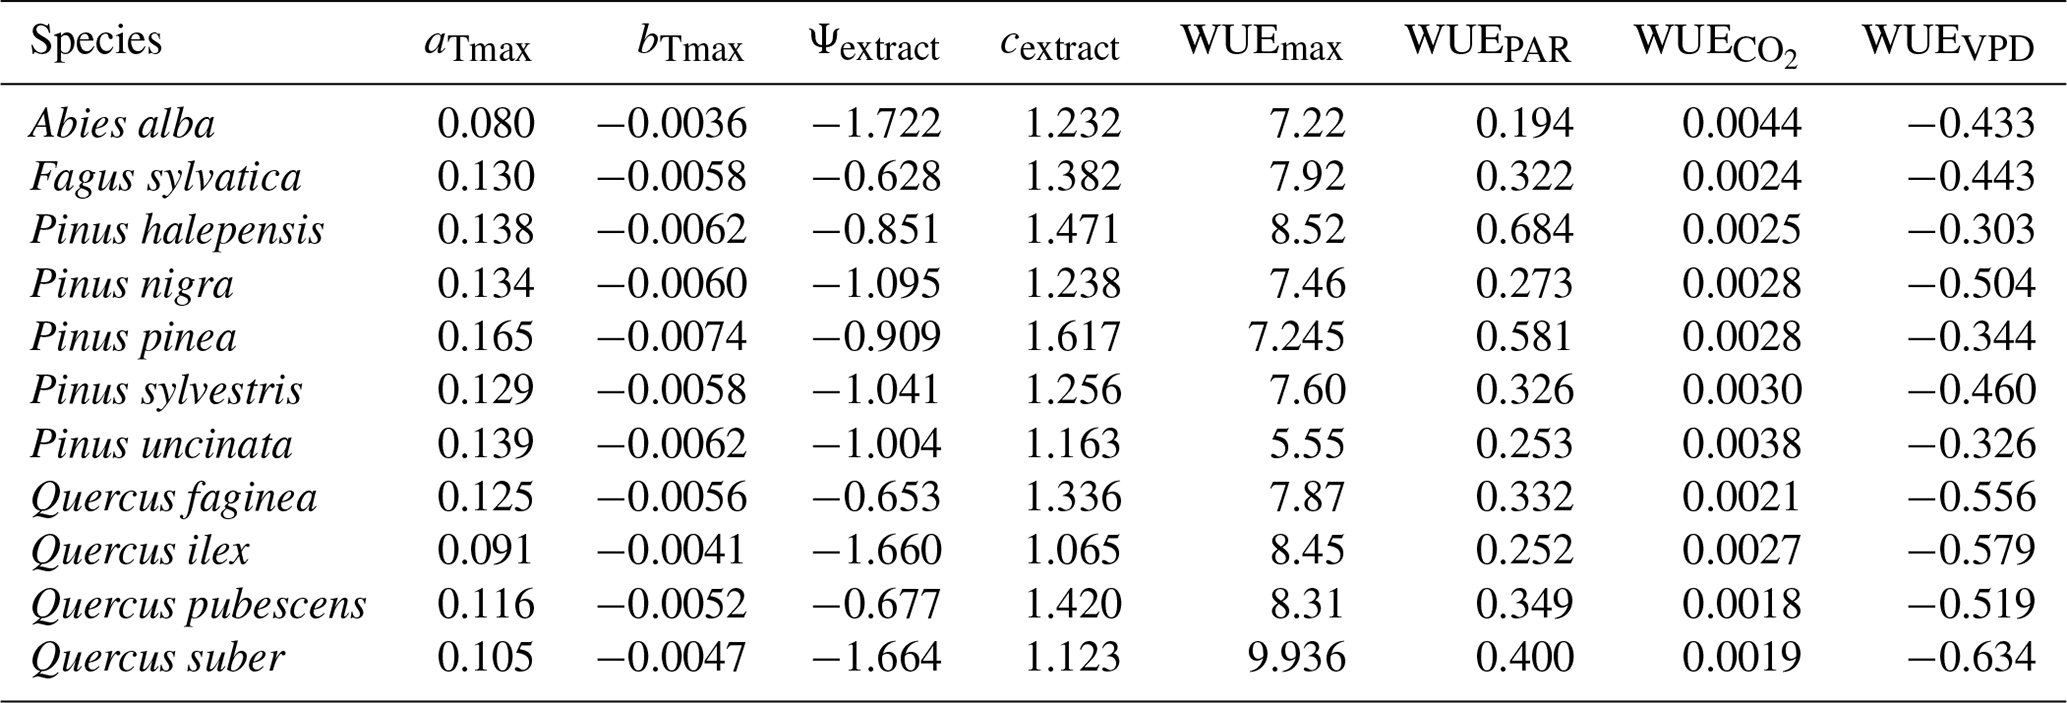
Table B3Linear correlation between calibrated parameters across the 75 forest plots. Upper right triangle contains Pearson's r statistics, and the lower left triangle contains p values (in italics).
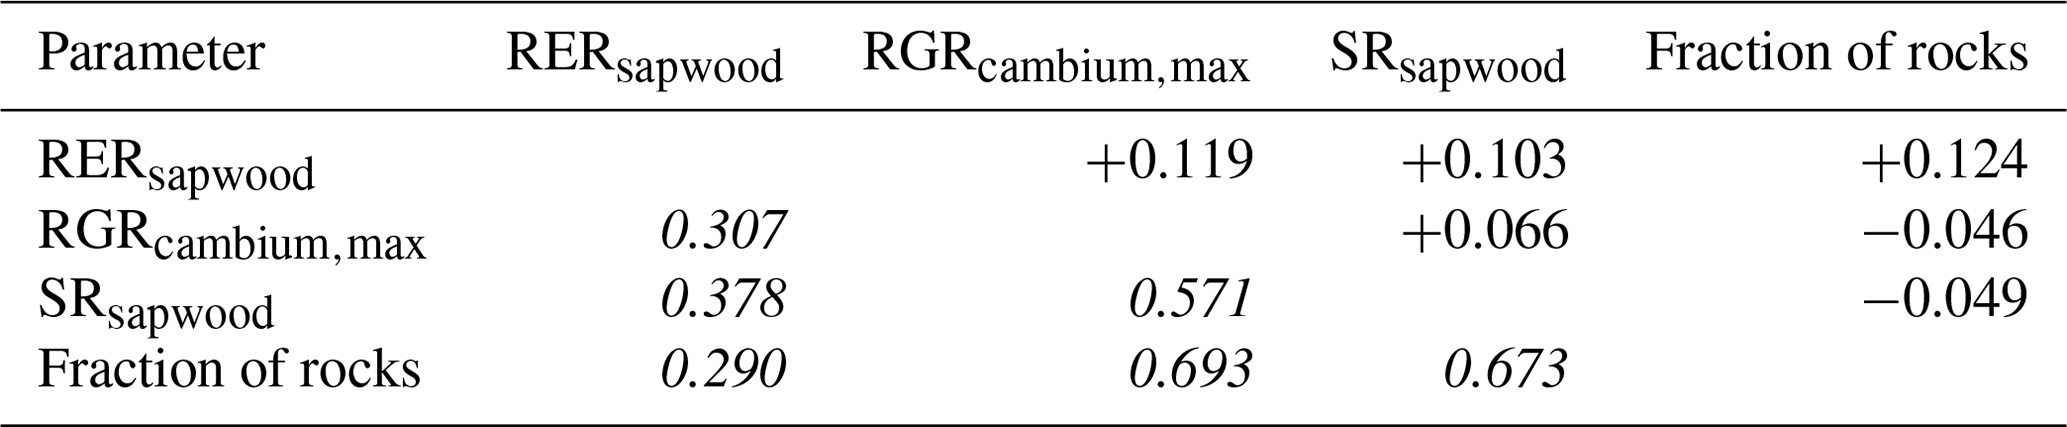
Table B4Results of an analysis of covariance (ANCOVA) for the four calibrated parameters, using the mean annual relative growth rate, species identity and their interaction as tested effects. Significant relationships are highlighted in bold.
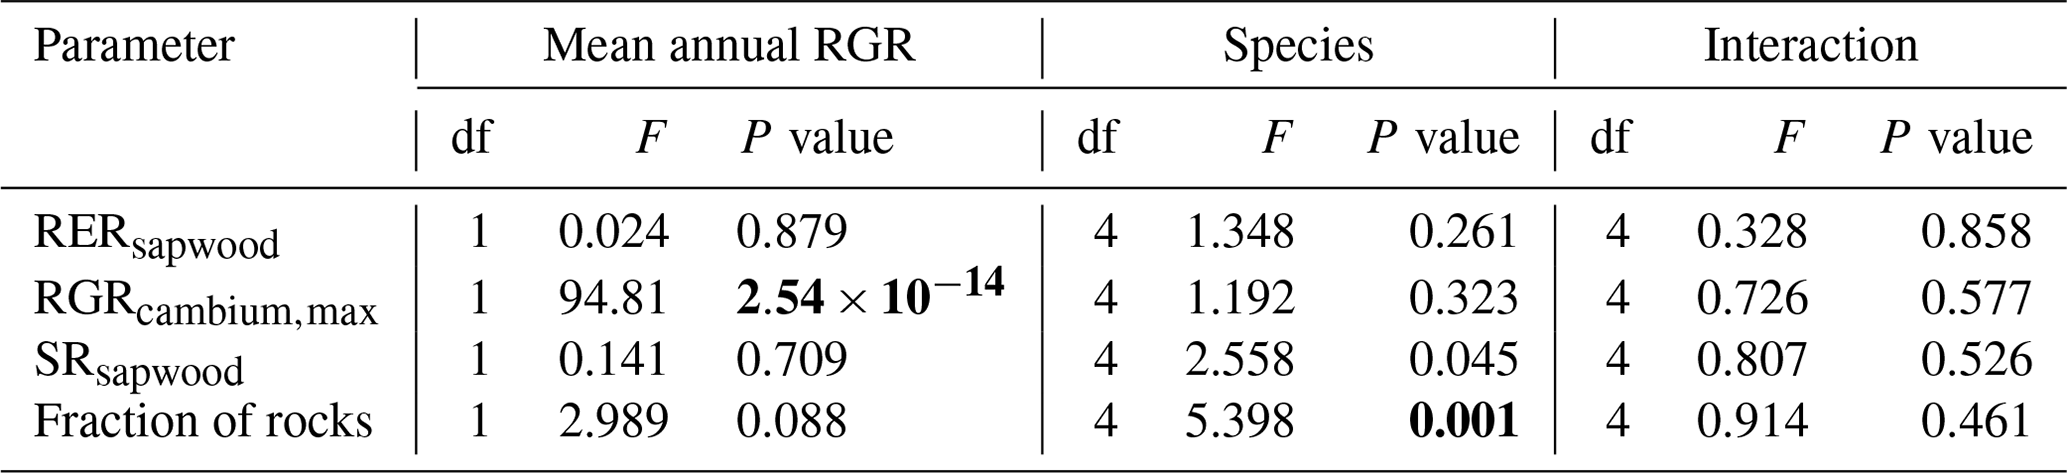
Final parameter estimates resulting from the meta-modeling exercise are shown in Table B2. To evaluate the improvement in sub-model similarity achieved by the meta-modeling exercise, we repeated simulations of both the basic (default and new parameter values) and advanced sub-models, this time under real water supply and accounting for soil water dynamics. When replacing default parameter values with those obtained from the meta-modeling exercise, annual E and Ag estimates produced by the basic sub-model resembled more closely those produced by the advanced sub-model, although overestimation remained in some cases (Fig. B2a–d). Soil moisture dynamics predicted by the basic sub-model under the new parameter values also matched more closely the dynamics predicted by the advanced sub-model (Fig. B2e and f).
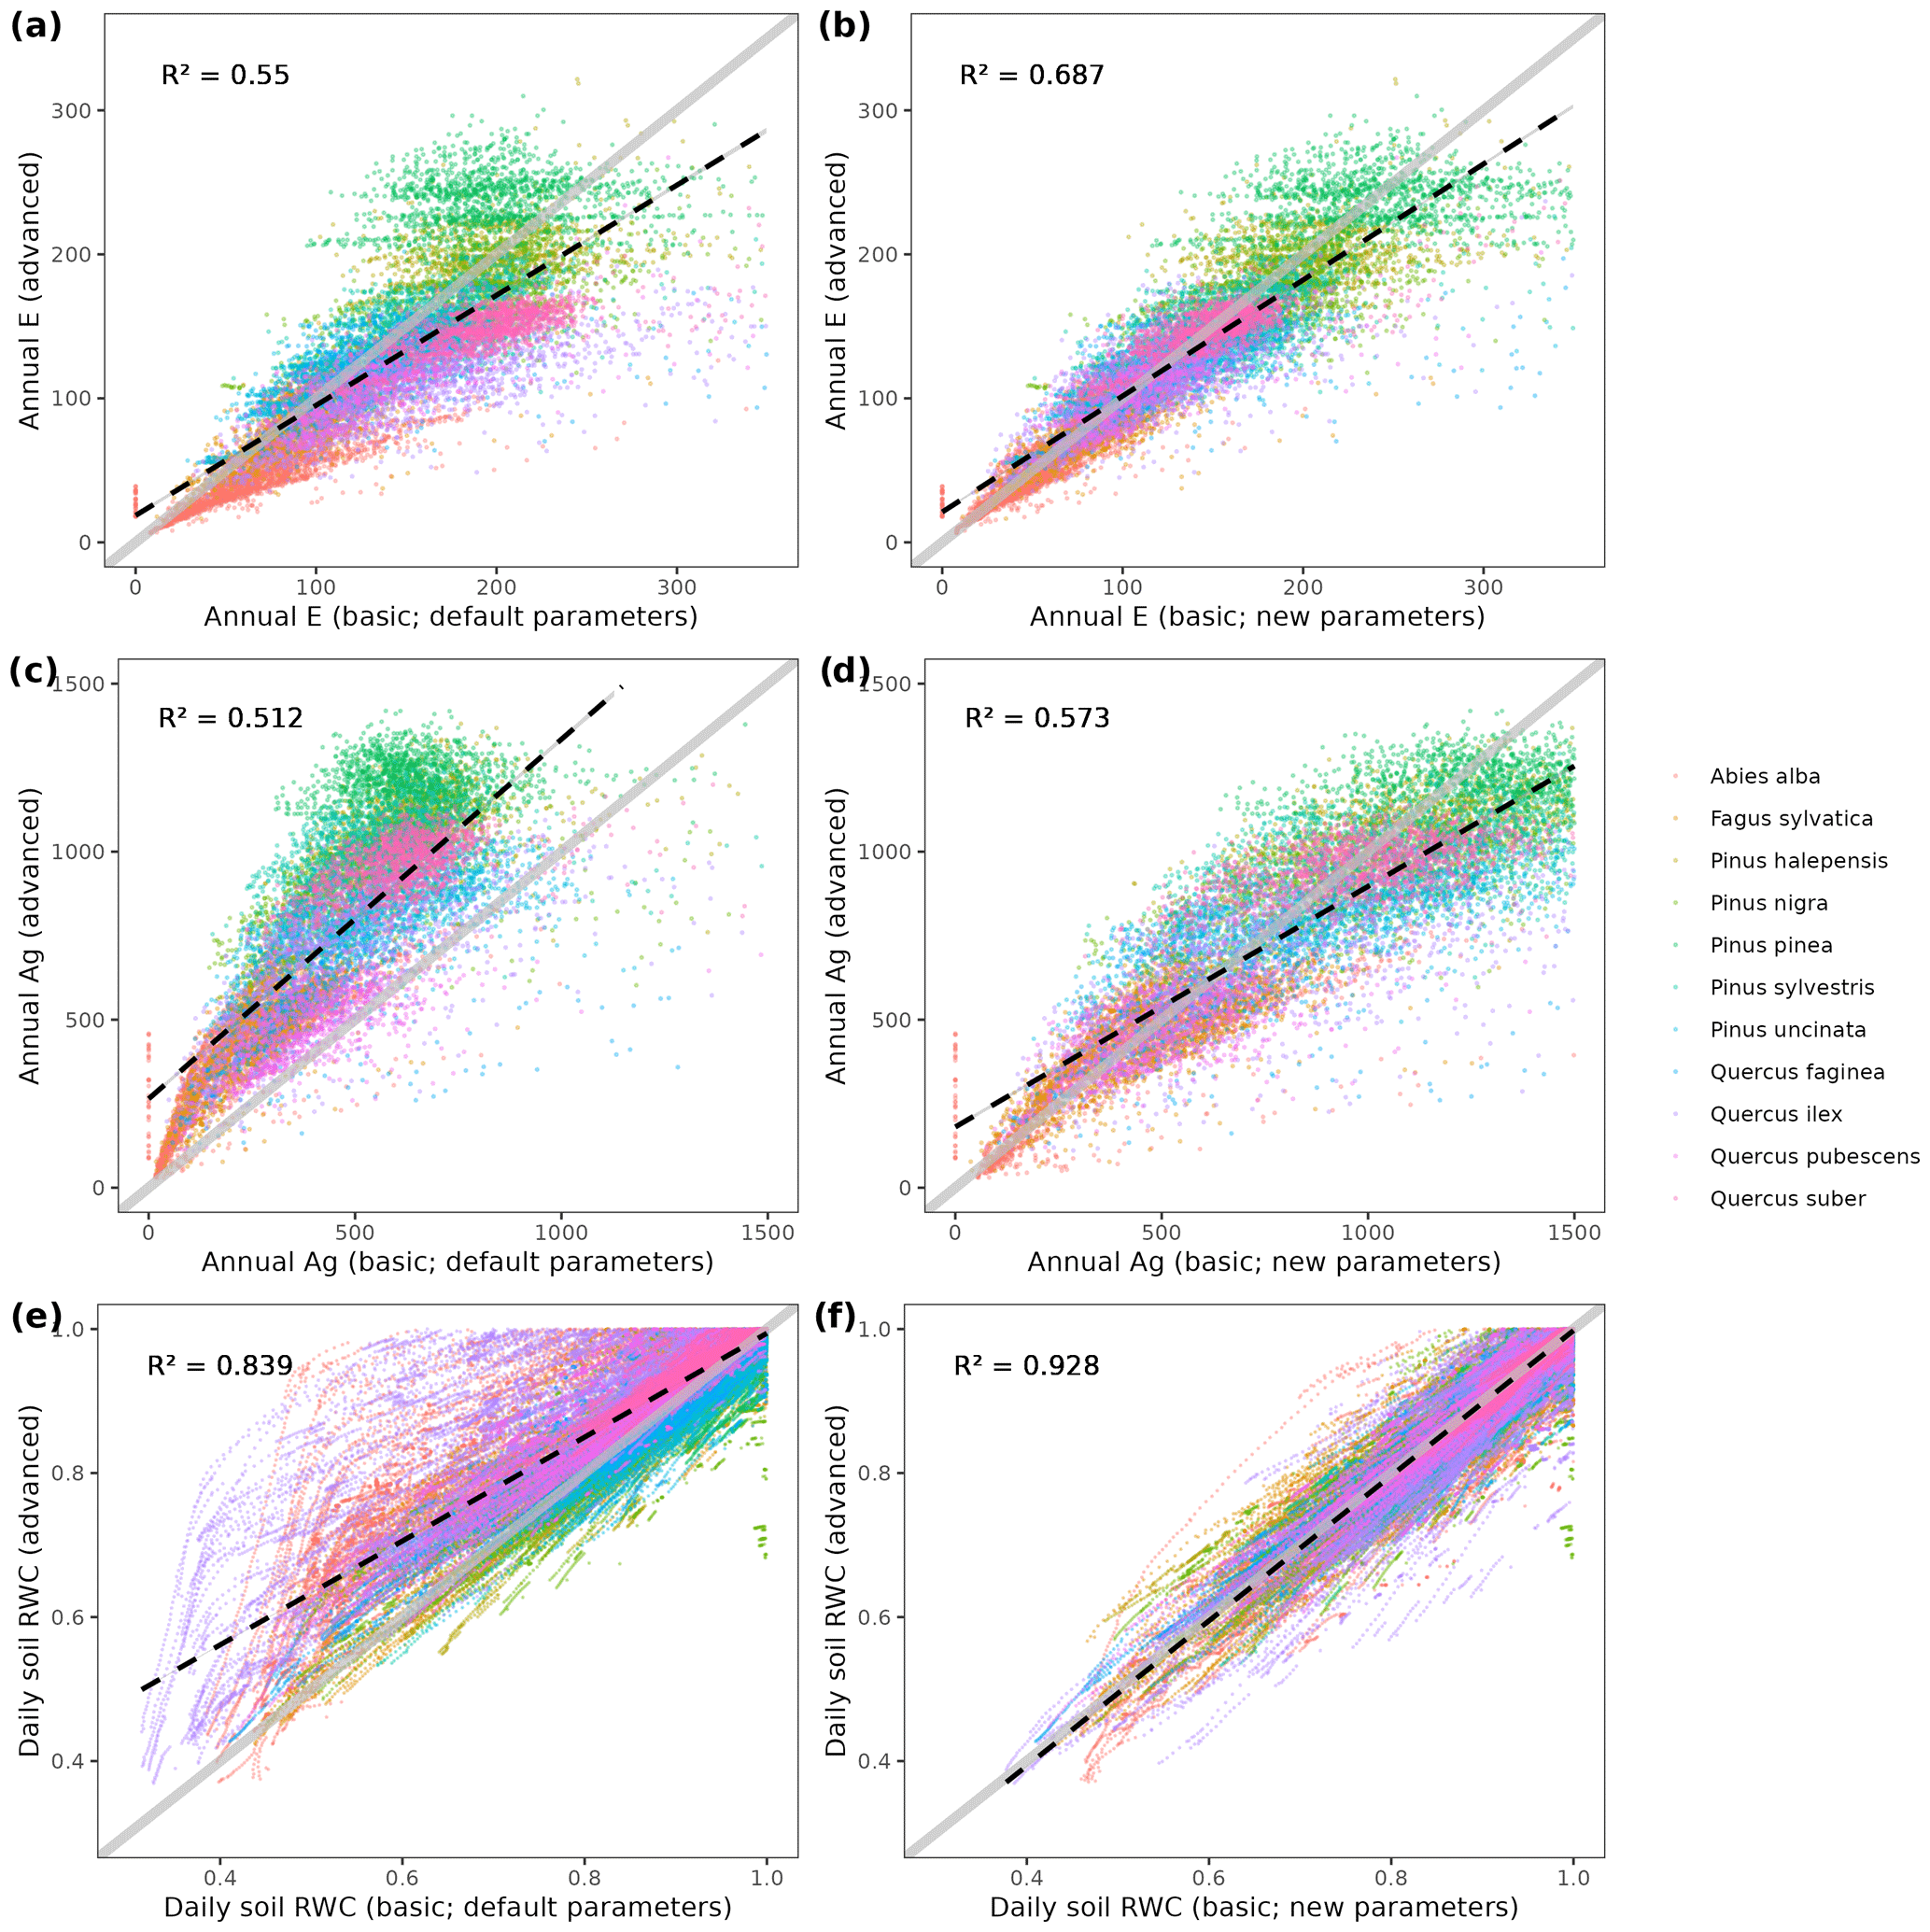
Figure B2Comparison of annual E (l m2 yr−1; panels a and b), annual Ag (g C m2 yr−1; panels c and d) and daily soil relative water content (panels e and f) obtained by the basic sub-model, using the default parameter values (panels a, c, and e) or the new parameter values (panels b, d, and f), against E predictions of the advanced sub-model. Linear relationships (dashed black lines) and the corresponding R2 values are indicated.
B3 Details of the calibration of growth and senescence parameters
The tree ring data set used for the calibration exercise was sampled in 75 SNFI plots, located in pure stands whose dominant species are F. sylvatica, P. halepensis, P. nigra, P. sylvestris or Q. pubescens, and selected to encompass a range of climatic aridity (Rosas et al., 2019). Tree ring series were available for five trees per plot, with samples taken in December 2015. More information on tree-ring methods can be found in Serra-Maluquer et al. (2018) and González de Andrés et al. (2021). We took annual basal area increments of each tree as the observations to be matched by model predictions of sapwood growth. Simulations were performed using the basic sub-model (with parameter values issued from the meta-modeling exercise) and daily weather data for each target plot for the 2001–2015 period. We calibrated the three target parameters for the dominant species and rock fragment content in each plot using a genetic algorithm implemented in the R package “GA” (Scrucca, 2013). The objective function to be minimized was the average, across cohorts with tree ring data, of the relative mean absolute error resulting from comparing observed and predicted annual BAI series. Population size for the genetic algorithm was set to 40 individuals, a maximum of 25 iterations were allowed, and the procedure stopped if the best parameter combination did not change during 5 consecutive iterations. The distribution of final values of the objective function is shown in Fig. B3. We did not find significant correlations between pairs of calibrated parameters (Table B3). Estimates for RERsapwood and RGRcambiummax were not statistically different across species, whereas SRsapwood was slightly significant (Table B4; Fig. B4). In contrast, we found the calibrated rock fraction to strongly differ across tree species, indicating differences in soil characteristics of the habitat where the species grow. To obtain growth parameter estimates for all tree species in the region, we examined the relationship between calibrated values and the mean annual growth rates relative to tree perimeter, a variable that is easy to derive using data from permanent plots. The relationship turned out to be strongly significant for RGRcambiummax (Table B4; Fig. 2).
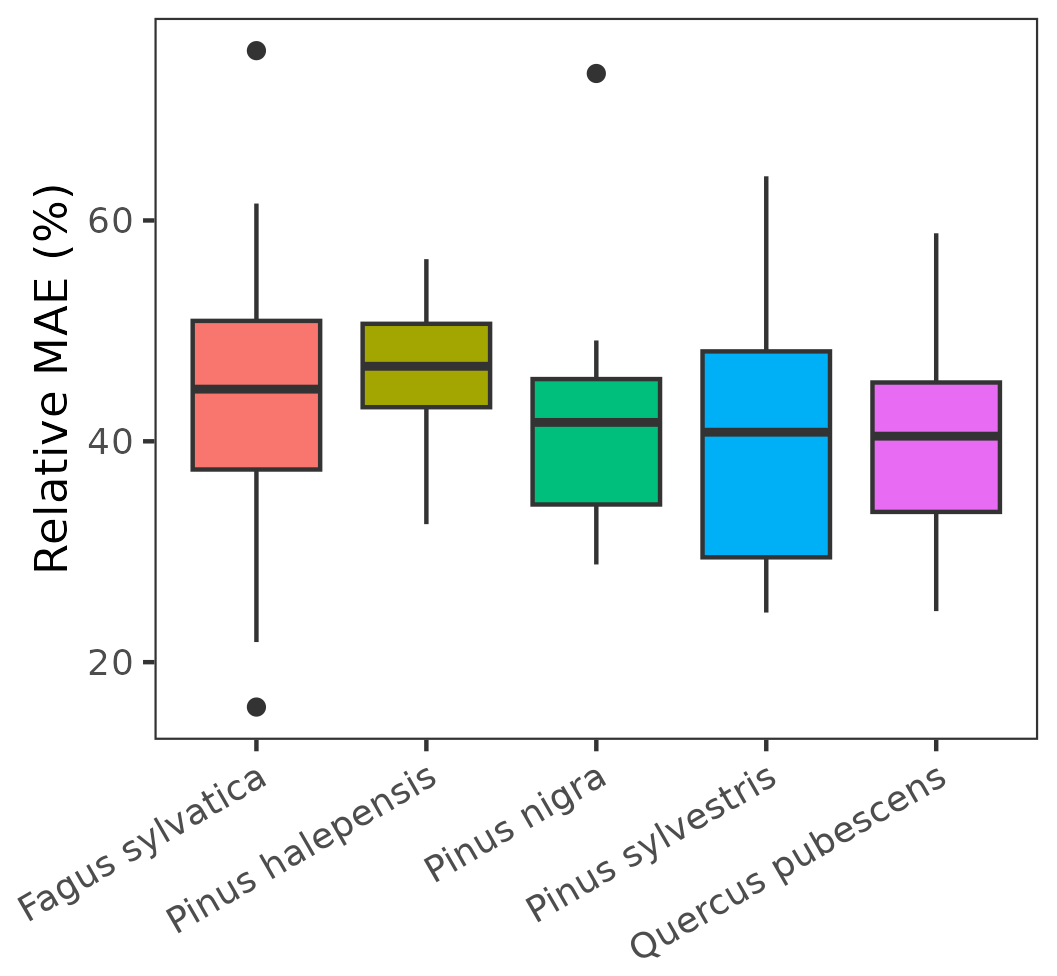
Figure B3Distribution of the minimum value of relative mean absolute error (MAE) obtained by calibration against tree ring data for the 15 plots of each species.
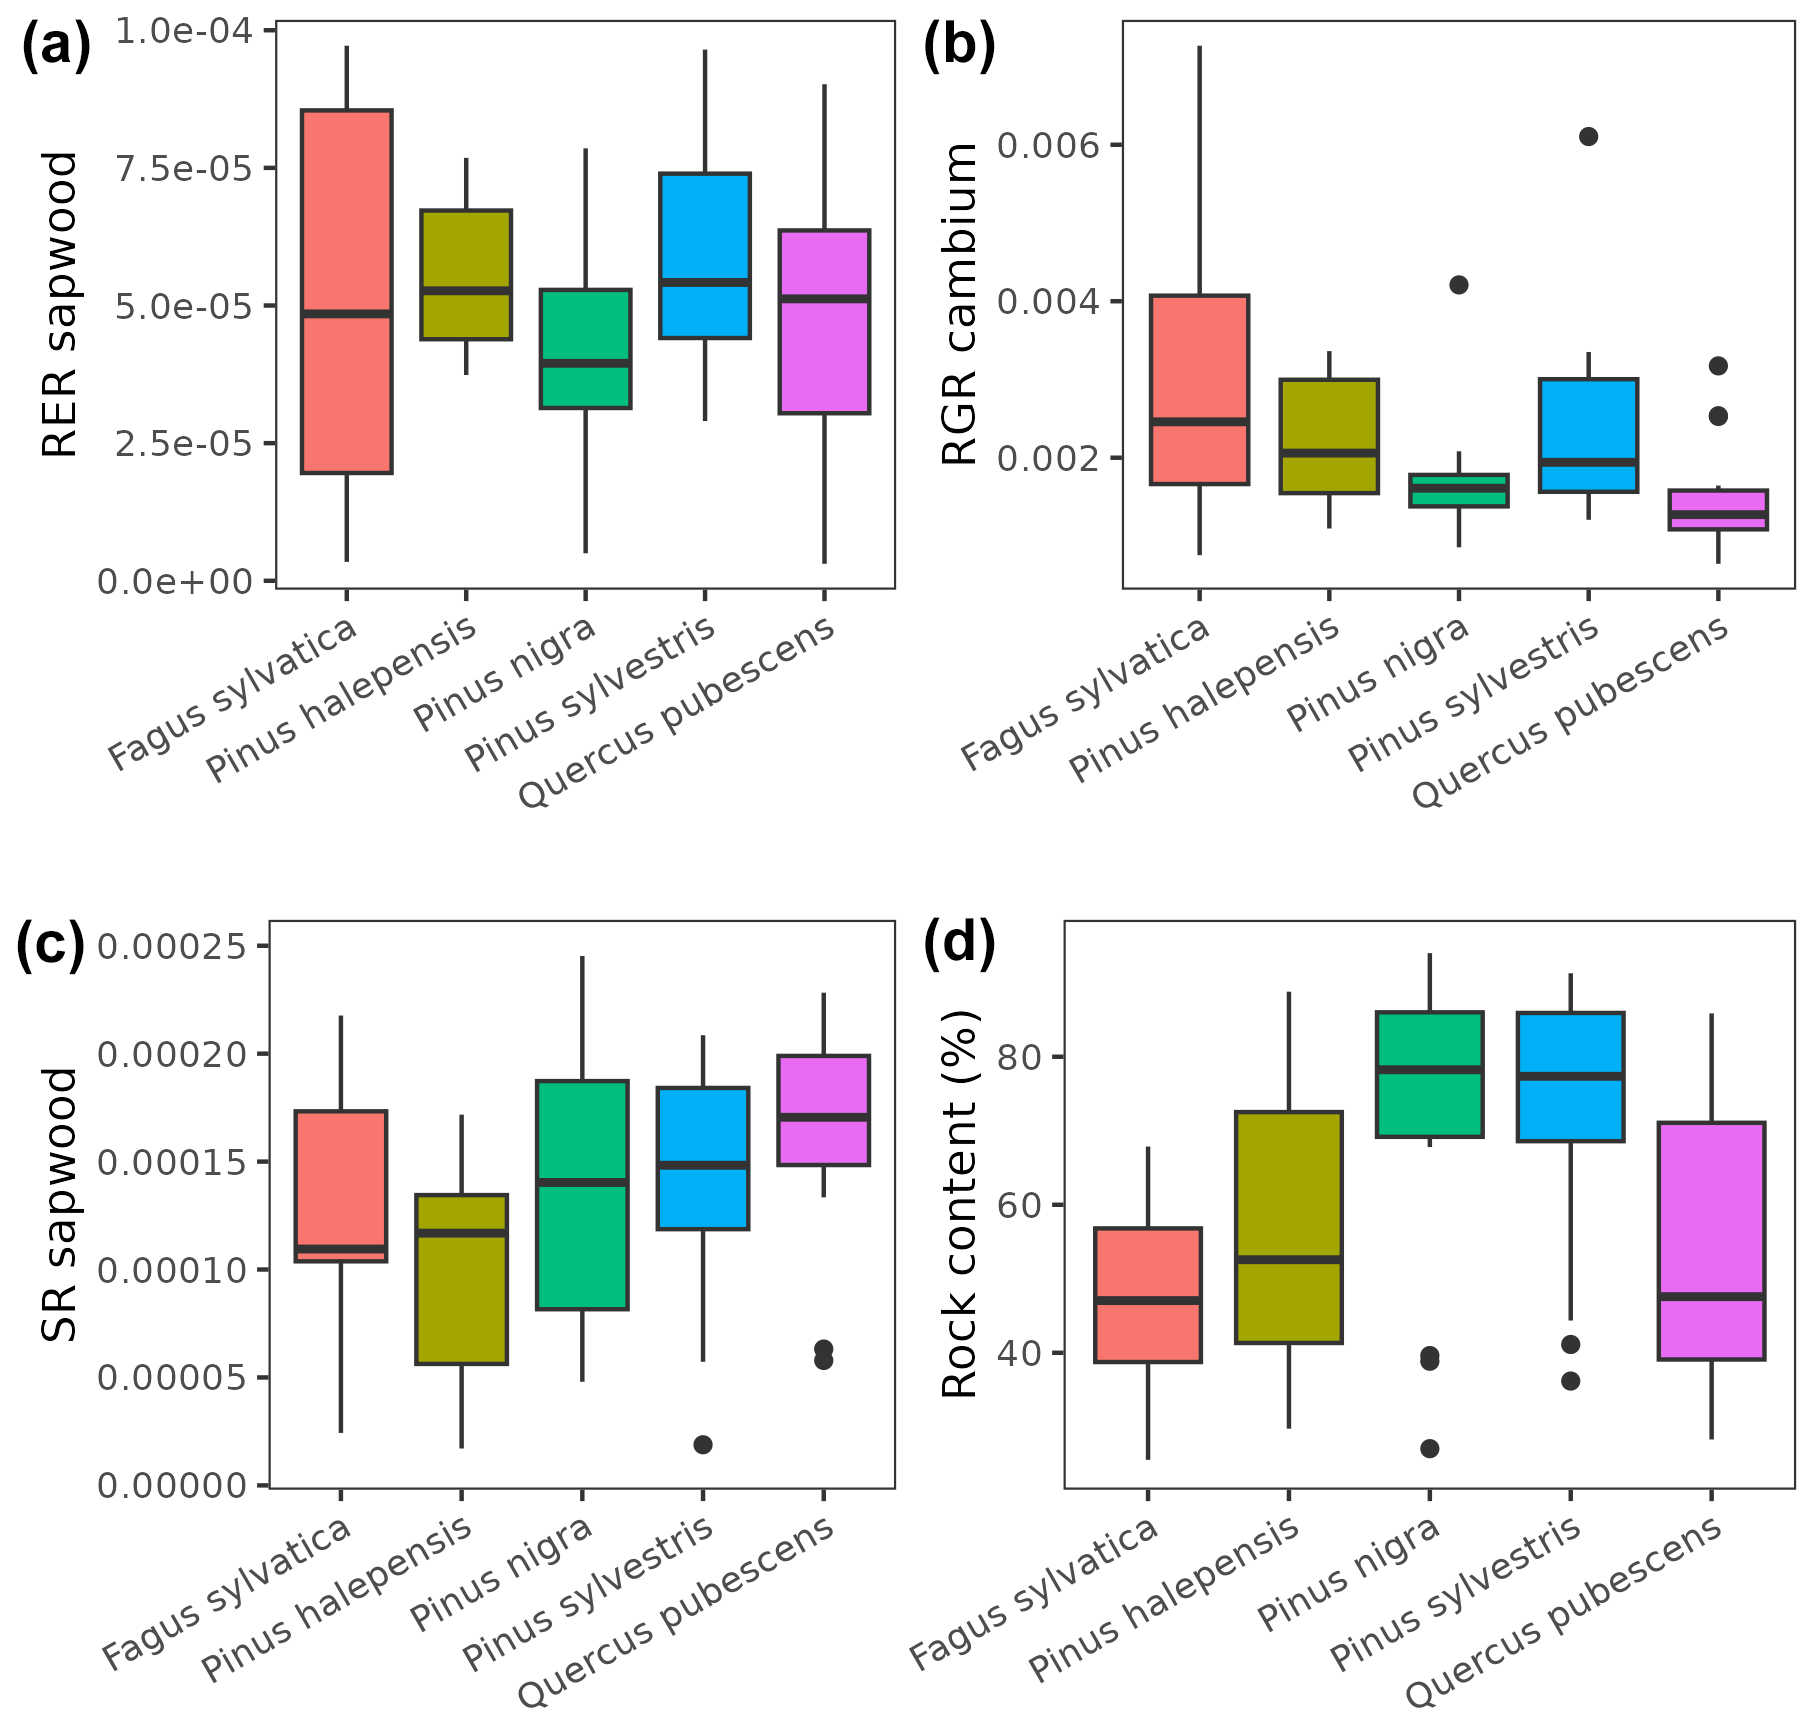
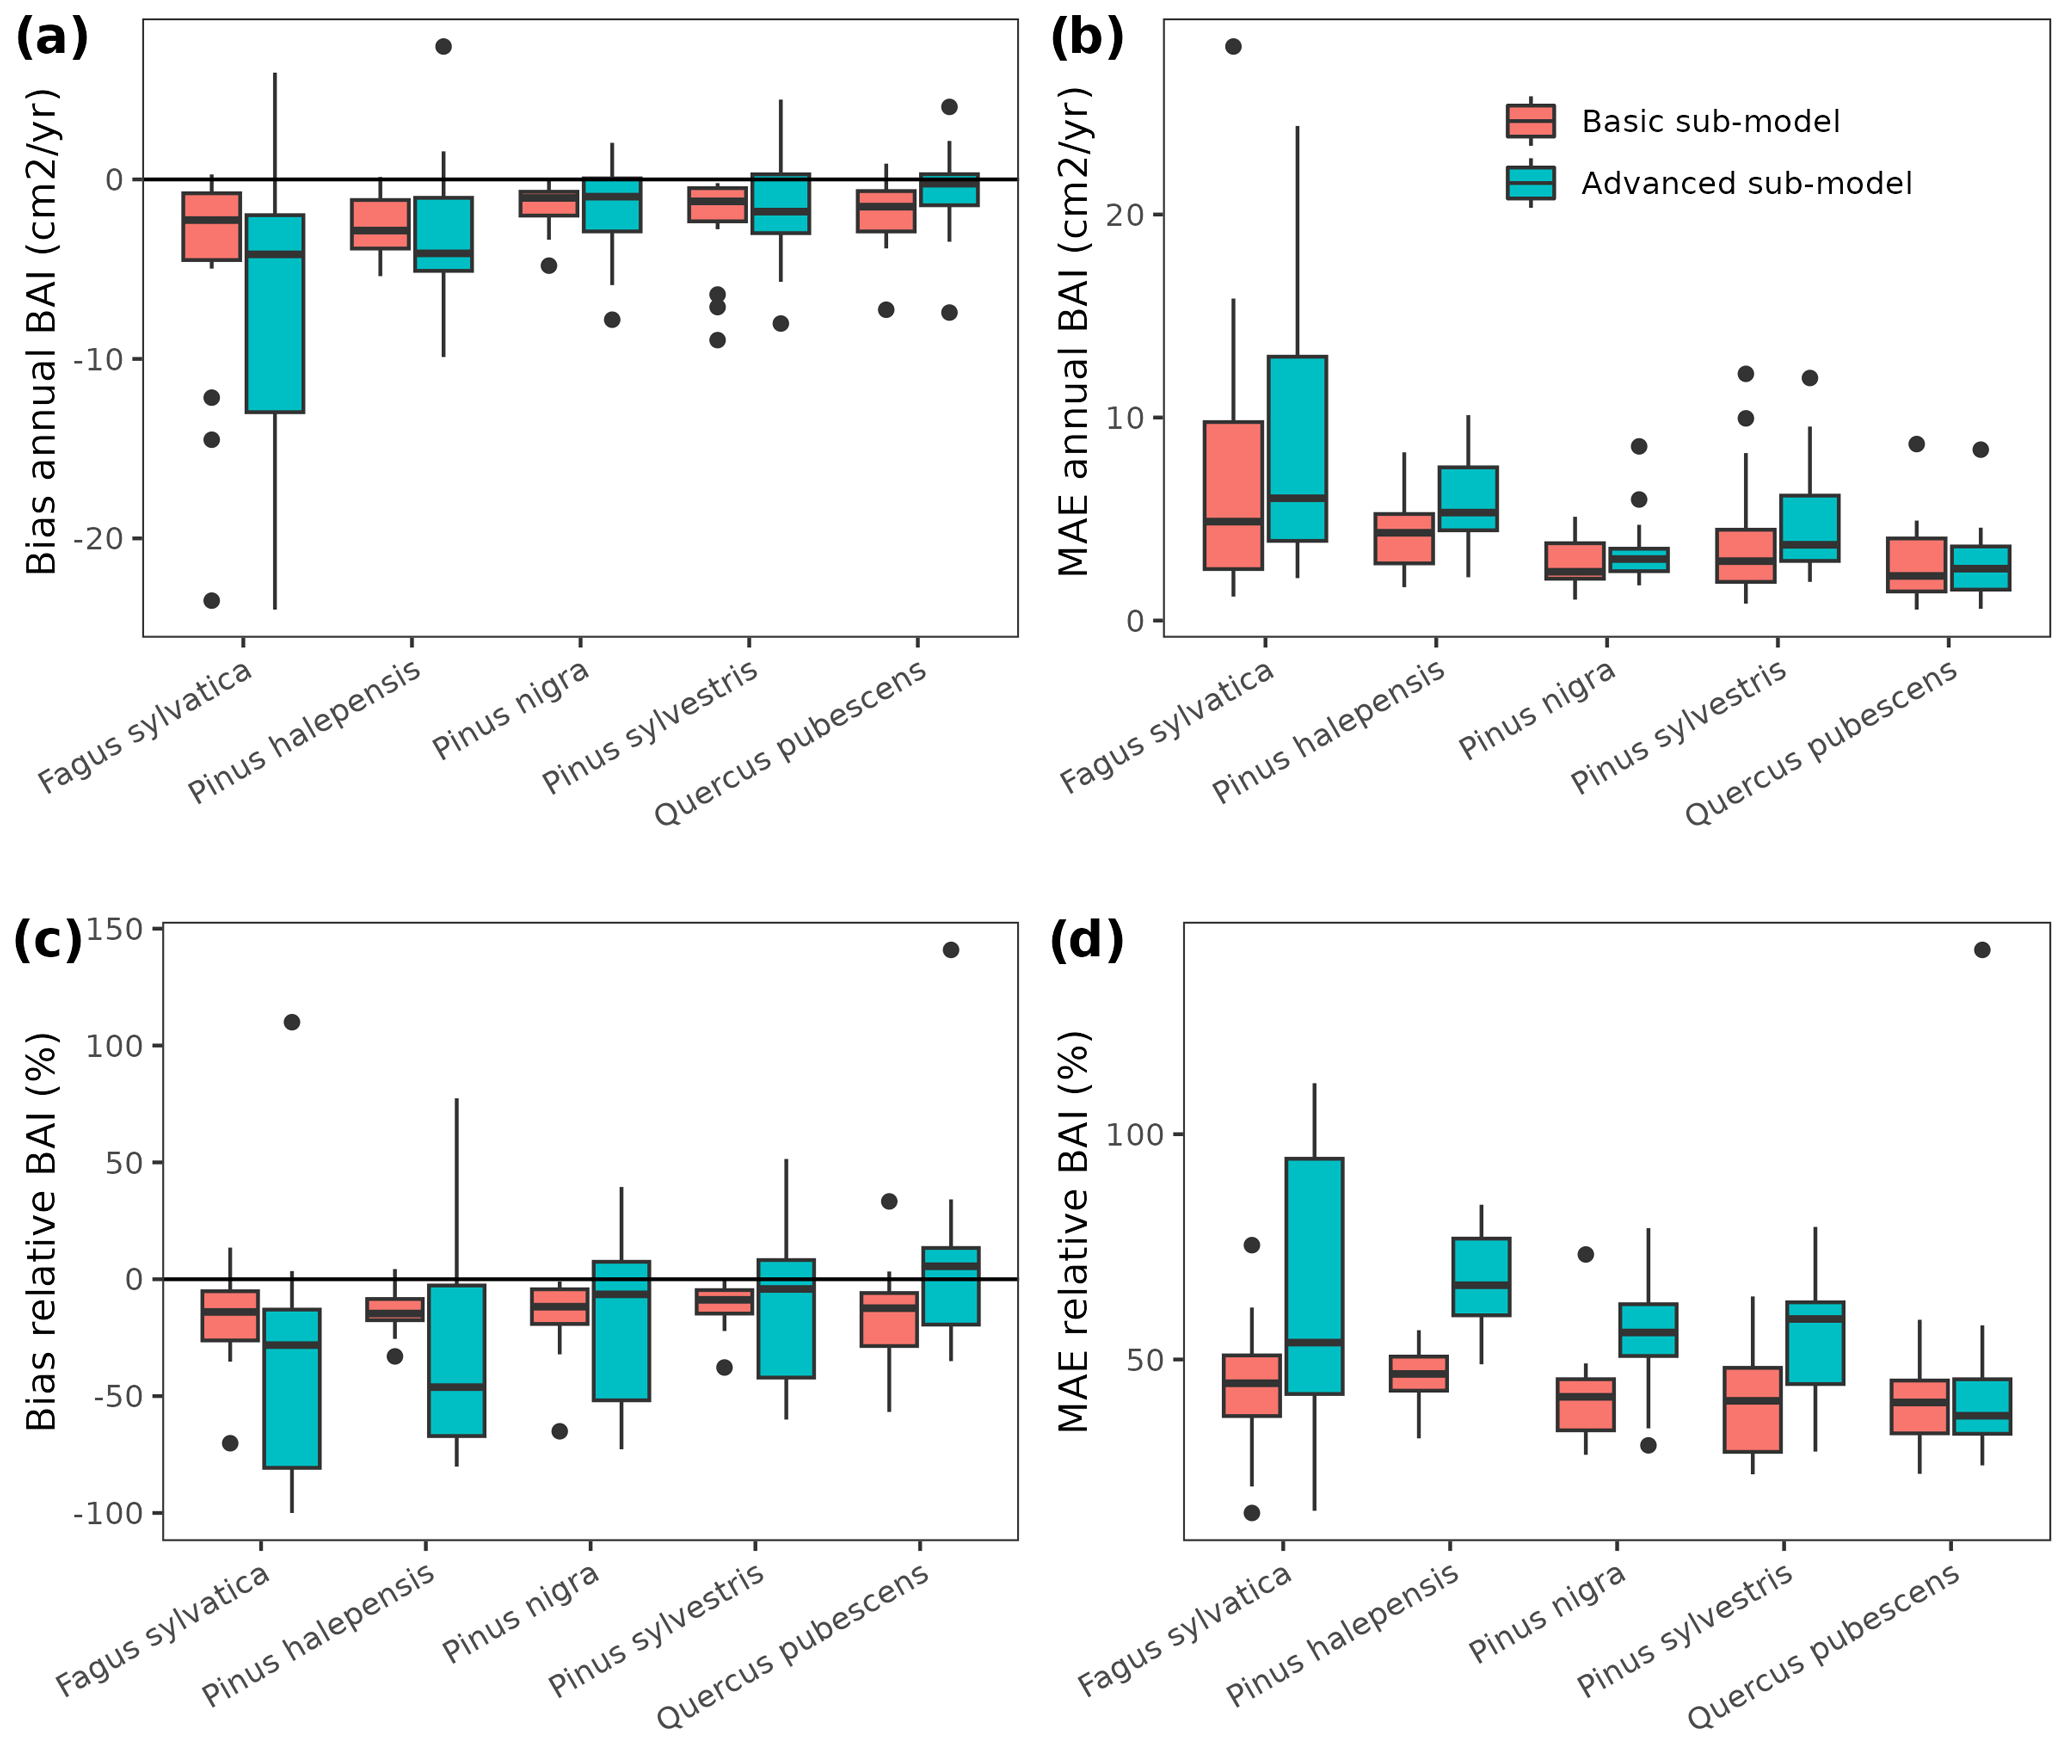
Figure B5Distribution of mean bias and mean absolute error (MAE) of annual basal area increment predictions, obtained from simulations with the basic and advanced sub-models and the calibrated parameters, across the 15 plots of each species. Panels (a, b) indicate mean bias and MAE of absolute growth, whereas panels (c, d) indicate mean bias and MAE of predicted growth relative to observed values.
Since the calibration exercise had been conducted using the basic sub-model, it is expected that growth simulations with the advanced sub-model have larger error rates and, potentially, larger bias. To check this, we repeated growth simulations using the advanced sub-model, with the calibrated parameters specific to each plot. Figure B5 shows a comparison of the performance of the two sub-models. Both sub-models slightly under-predicted observed growth, on average, although mean bias had larger variation across forest plots when using the advanced model. Whereas MAE of the basic model was often below 50 % of observed growth, error rates between 50 % and 75 % were often obtained with the advanced model.
The formulation of the IPM used in this work followed closely that of Easterling et al. (2000) with regard to adult trees, whereas it differed substantially for ingrowth and small trees. Below we will briefly describe the main characteristics of the methodology as we implemented it. For further details, see García-Callejas et al. (2017).
Models were developed for 16 main species and 5 functional types, the latter including species less abundant in the target area. We determined, for each target species or functional type, the number of adult individual trees at a future time t+Δ from the number of adult individual trees at a previous time t plus tree ingrowth from saplings. In our simulations, time interval Δ = 10 years, which approximately corresponded to the mean time difference between SNFI2 and SNFI3.
In the model, the number of adult trees at any time t+Δ, , was determined by two contributions: (a) the dynamics of adult trees that survived and growth from t to t+Δ and (b) the ingrowth of saplings (i.e., DBH < 7.5 cm) into the adult tree class:
Contribution (a) is represented by the integral term on the right-hand side, whereas contribution (b) consists of an additional term NIngrowth. In Eq. (C1), variables x and y indicate the DBH of adult trees at t and t+Δ, respectively. Functions S(x,…) and correspond to tree survival and tree growth, respectively. They were calculated independently for each target tree species or functional type with data from SNFI2 and SNFI3. Their dependence on variables other than DBH (i.e., annual mean temperature, total annual precipitation, anomalies of temperature and precipitation, and basal area of the stand) is expressed in Eq. (C1) with an ellipsis (…).
Tree ingrowth was not included within the IPM integral, unlike the formulation in Easterling et al. (2000), due to limitations imposed by the SNFI sampling methodology. Instead, we assumed that NIngrowth did not depend on DBH at time t and took it out of the integral. We then expressed it as
Here, I indicates the number of new adult trees. It depended on the number of saplings at t, the basal area of the stand and the climatic variables described above, but not on previous size. In turn, term φ(y) consisted of a truncated (i.e., y ≥ 7.5 cm) exponential distribution that determined the size distribution of the new cohort of adult trees. Finally, modeling of smaller trees (DBH < 7.5 cm) was carried out by means of a zero-inflated Poisson linear regression with the same predictor variables as I above.
Table D1Results of model evaluation at the regional level in terms of annual rates of basal area (BA) changes () predicted for different processes and taking into account all of them. Results are shown for the two sub-models and for simulations spanning different periods between forest inventory surveys. We also include the evaluation results of an integral projection model (IPM) calibrated using SNFI data, for the same simulation periods and the same set of forest plots. Bias % and RMSE % result from expressing mean bias and root mean squared error (RMSE) as percentage of the mean observed value.
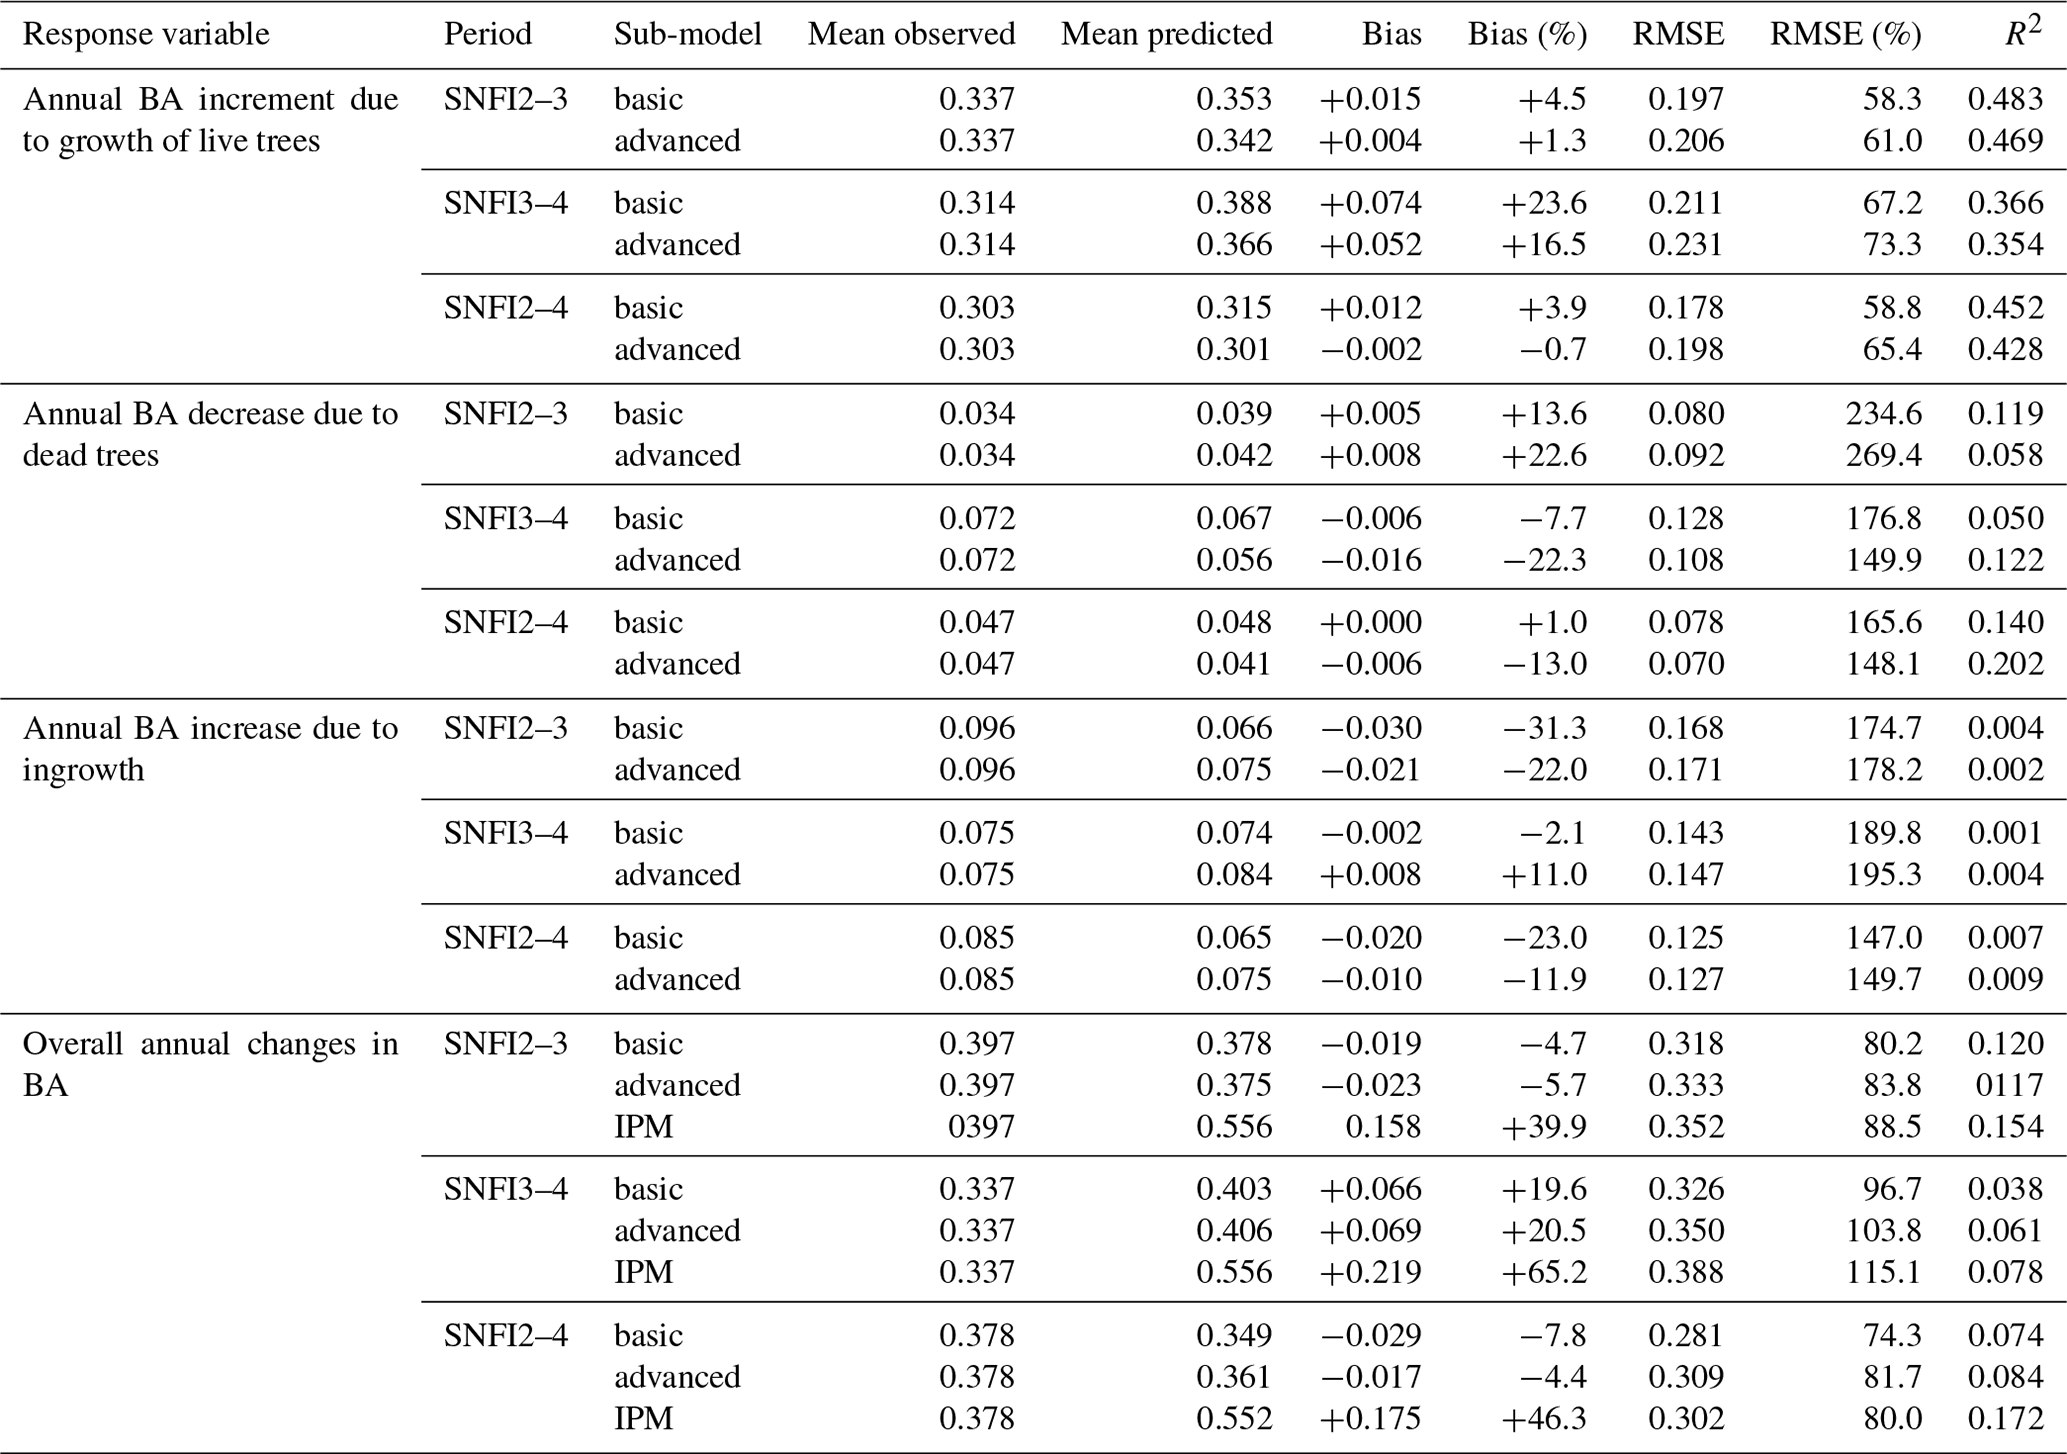
Core model functions are coded in C and linked to an R user interface. MEDFATE is distributed via the R package “medfate”, which is available at CRAN (https://cran.r-project.org/package=medfate, last access: 30 May 2023). The model code to run MEDFATE (version 2.9.3) is available at https://doi.org/10.5281/zenodo.7695331 (De Cáceres et al., 2022).
Weather simulation data of simulation model used in this study are available from the EURO-CORDEX initiative at https://www.euro-cordex.net/index.php.en (Kotlarski et al., 2014) for noncommercial research and educational purposes. Spanish forest inventory data are available at https://www.miteco.gob.es/es/biodiversidad/temas/inventarios-nacionales/inventario-forestal-nacional/ (Ministerio de Agricultura y Pesca and Alimentación y Medio Ambiente, 2017).
The supplement related to this article is available online at: https://doi.org/10.5194/gmd-16-3165-2023-supplement.
MDC designed and implemented the model and led the writing of the manuscript, with input from all authors. MDC, FD'A and RMH conducted model simulations. AC, JMV, MM, NMS, AA, RGV, DNS and SS contributed to model design. All authors read and approved the manuscript.
The contact author has declared that none of the authors has any competing interests.
Publisher's note: Copernicus Publications remains neutral with regard to jurisdictional claims in published maps and institutional affiliations.
We thank the Agencia Estatal de Meteorología (AEMET) and Servei Meteorològic de Catalunya (SMC) for providing daily weather station data.
This research has been supported by the Spanish “Ministerio de Ciencia e Innovación” (MCIN/AEI/10.13039/501100011033) and the European Union’s Next Generation EU/PRTR (grant nos. CGL2017–89149-C2–2-R, PID2021-126679OB-I00 and CEX-2018-000828-S).
This paper was edited by Sam Rabin and reviewed by Harald Bugmann and Nikolaos Fyllas.
Adams, H. D., Park Williams, A., Xu, C., Rauscher, S. A., Jiang, X., and McDowell, N. G.: Empirical and process-based approaches to climate-induced forest mortality models, Front. Plant Sci., 4, 1–5, https://doi.org/10.3389/fpls.2013.00438, 2013.
Altava-Ortiz, V. and Barrera-Escoda, A.: Escenaris Climàtics Regionalitzats a Catalunya (Escat-2020), Servei Meteorologic de Catalunya, Generalitat de Catalunya, Barcelona, 2020.
Ameztegui, A., Rodrigues, M., and Granda, V.: Uncertainty of biomass stocks in Spanish forests: a comprehensive comparison of allometric equations, Eur. J. For. Res., 141, 395–407, https://doi.org/10.1007/s10342-022-01444-w, 2022.
Anderegg, L. D. L., Berner, L. T., Badgley, G., Sethi, M. L., Law, B. E., and HilleRisLambers, J.: Within-species patterns challenge our understanding of the leaf economics spectrum, Ecol. Lett., 21, 734–744, https://doi.org/10.1111/ele.12945, 2018.
Anderegg, L. D. L., Griffith, D. M., Cavender-Bares, J., Riley, W. J., Berry, J. A., Dawson, T. E., and Still, C. J.: Representing plant diversity in land models: An evolutionary approach to make “Functional Types” more functional, Glob. Change Biol., 28, 2541–2554, https://doi.org/10.1111/gcb.16040, 2022.
Anten, N. P. R. and Bastiaans, L.: The use of canopy models to analyze light competition among plants, in: Canopy photosynthesis: from basics to application, edited by: Hikosaka, K., Niinemets, Ü., and Anten, N. P. R., Springer, the Netherlands, 379–398, https://doi.org/10.1007/978-94-017-7291-4_14, 2016.
Augustynczik, A. L. D., Gutsch, M., Basile, M., Suckow, F., Lasch, P., Yousefpour, R., Hanewinkel, M.: Socially optimal forest management and biodiversity conservation in temperate forests under climate change, Ecol. Econ., 169, 106504, https://doi.org/10.1016/j.ecolecon.2019.106504, 2020.
Bartlett, M. K., Scoffoni, C., and Sack, L.: The determinants of leaf turgor loss point and prediction of drought tolerance of species and biomes: a global meta-analysis, Ecol. Lett., 15, 393–405, https://doi.org/10.1111/j.1461-0248.2012.01751.x, 2012.
Berzaghi, F., Wright, I. J., Kramer, K., Oddou-Muratorio, S., Bohn, F. J., Reyer, C. P. O., Sabaté, S., Sanders, T. G. M., and Hartig, F.: Towards a New Generation of Trait-Flexible Vegetation Models, Trends in Ecology and Evolution, 35, 191–205, https://doi.org/10.1016/j.tree.2019.11.006, 2020.
Best, M. J., Pryor, M., Clark, D. B., Rooney, G. G., Essery, R. L. H., Ménard, C. B., Edwards, J. M., Hendry, M. A., Porson, A., Gedney, N., Mercado, L. M., Sitch, S., Blyth, E., Boucher, O., Cox, P. M., Grimmond, C. S. B., and Harding, R. J.: The Joint UK Land Environment Simulator (JULES), model description – Part 1: Energy and water fluxes, Geosci. Model Dev., 4, 677–699, https://doi.org/10.5194/gmd-4-677-2011, 2011.
Blanco, J. A., Ameztegui, A., and Rodríguez, F.: Modelling Forest Ecosystems: a crossroad between scales, techniques and applications, Ecol. Model., 425, 109030, https://doi.org/10.1016/j.ecolmodel.2020.109030, 2020.
Bugmann, H.: A review of forest gap models, Climatic Change, 51, 259–305, https://doi.org/10.1023/A:1012525626267, 2001.
Bugmann, H. and Seidl, R.: The evolution, complexity and diversity of models of long-term forest dynamics, J. Ecol., 110, 2288–2307, https://doi.org/10.1111/1365-2745.13989, 2022.
Bugmann, H., Seidl, R., Hartig, F., Bohn, F., Brůna, J., Cailleret, M., François, L., Heinke, J., Henrot, A. J., Hickler, T., Hülsmann, L., Huth, A., Jacquemin, I., Kollas, C., Lasch-Born, P., Lexer, M. J., Merganič, J., Merganičová, K., Mette, T., Miranda, B. R., Nadal-Sala, D., Rammer, W., Rammig, A., Reineking, B., Roedig, E., Sabaté, S., Steinkamp, J., Suckow, F., Vacchiano, G., Wild, J., Xu, C., and Reyer, C. P. O.: Tree mortality submodels drive simulated long-term forest dynamics: assessing 15 models from the stand to global scale, Ecosphere, 10, e02616, https://doi.org/10.1002/ecs2.2616, 2019.
Bugmann, H. K. M.: A simplified forest model to study species composition along climate gradients, Ecology, 77, 2055–2074, https://doi.org/10.2307/2265700, 1996.
Buotte, P. C., Koven, C. D., Xu, C., Shuman, J. K., Goulden, M. L., Levis, S., Katz, J., Ding, J., Ma, W., Robbins, Z., and Kueppers, L. M.: Capturing functional strategies and compositional dynamics in vegetation demographic models, Biogeosciences, 18, 4473–4490, https://doi.org/10.5194/bg-18-4473-2021, 2021.
Burriel, J. A., Gracia, C., Ibàñez, J. J., Mata, T., and Vayreda, J.: Inventari Ecològic i Forestal de Catalunya, 10 volumes, CREAF, Bellaterra, Spain, 2004.
Cabon, A., Peters, R. L., Fonti, P., Martínez-Vilalta, J., and De Cáceres, M.: Temperature and water potential co-limit stem cambial activity along a steep elevational gradient, New Phytol., 226, 1325–1340, https://doi.org/10.1111/nph.16456, 2020a.
Cabon, A., Fernández-de-Uña, L., Gea-Izquierdo, G., Meinzer, F. C., Woodruff, D. R., Martínez-Vilalta, J., and De Cáceres, M.: Water potential control of turgor-driven tracheid enlargement in Scots pine at its xeric distribution edge, New Phytol., 225, 209–221, https://doi.org/10.1111/nph.16146, 2020b.
Cabon, A., Kannenberg, S. A., Arain, A., Babst, F., Baldocchi, D., Belmecheri, S., Delpierre, N., Guerrieri, R., Maxwell, J. T., McKenzie, S., Meinzer, F. C., Moore, D. J. P., Pappas, C., Rocha, A. V., Szejner, P., Ueyama, M., Ulrich, D., Vincke, C., Voelker, S. L., Wei, J., Woodruff, D., and Anderegg, W. R. L.: Cross-biome synthesis of source versus sink limits to tree growth, Science, 376, 758–761, https://doi.org/10.1126/science.abm4875, 2022.
Caspersen, J. P., Vanderwel, M. C., Cole, W. G., and Purves, D. W.: How stand productivity results from size- and competition-dependent growth and mortality, PLoS ONE, 6, e28660, https://doi.org/10.1371/journal.pone.0028660, 2011.
Chamberlain, S. and Szocs, E.: taxize – taxonomic search and retrieval in R, F1000Research, 2, 191, https://f1000research.com/articles/2-191/v2 (last access: 30 May 2023), 2013.
Choat, B., Jansen, S., Brodribb, T. J., Cochard, H., Delzon, S., Bhaskar, R., Bucci, S. J., Feild, T. S., Gleason, S. M., Hacke, U. G., Jacobsen, A. L., Lens, F., Maherali, H., Martínez-Vilalta, J., Mayr, S., Mencuccini, M., Mitchell, P. J., Nardini, A., Pittermann, J., Pratt, R. B., Sperry, J. S., Westoby, M., Wright, I. J., and Zanne, A. E.: Global convergence in the vulnerability of forests to drought, Nature, 491, 752–755, https://doi.org/10.1038/nature11688, 2012.
Choat, B., Brodribb, T. J., Brodersen, C. R., Duursma, R. A., López, R., and Medlyn, B. E.: Triggers of tree mortality under drought, Nature, 558, 531–539, https://doi.org/10.1038/s41586-018-0240-x, 2018.
Christoffersen, B. O., Gloor, M., Fauset, S., Fyllas, N. M., Galbraith, D. R., Baker, T. R., Kruijt, B., Rowland, L., Fisher, R. A., Binks, O. J., Sevanto, S., Xu, C., Jansen, S., Choat, B., Mencuccini, M., McDowell, N. G., and Meir, P.: Linking hydraulic traits to tropical forest function in a size-structured and trait-driven model (TFS v.1-Hydro), Geosci. Model Dev., 9, 4227–4255, https://doi.org/10.5194/gmd-9-4227-2016, 2016.
Chuine, I., Garcia de Cortazar-Atauri, I., Kramer, K., and Hänninen, H.: Plant Development Models, in: Phenology: An Integrative Environmental Science, edited by: Schwartz, M. D., Springer Science, Dordrecht, the Netherlands, 275–293, https://doi.org/10.1007/978-94-007-6925-0, 2013.
Cochard, H., Pimont, F., Ruffault, J., and Martin-StPaul, N.: SurEau: a mechanistic model of plant water relations under extreme drought, Ann. For. Sci., 78, https://doi.org/10.1007/s13595-021-01067-y, 2021.
Collalti, A., Tjoelker, M. G., Hoch, G., Mäkelä, A., Guidolotti, G., Heskel, M., Petit, G., Ryan, M. G., Battipaglia, G., Matteucci, G., and Prentice, I. C.: Plant respiration: Controlled by photosynthesis or biomass?, Glob. Change Biol., 26, 1739–1753, https://doi.org/10.1111/gcb.14857, 2020.
Crous, K. Y., Uddling, J., and De Kauwe, M. G.: Temperature responses of photosynthesis and respiration in evergreen trees from boreal to tropical latitudes, New Phytol., 234, 353–374, https://doi.org/10.1111/nph.17951, 2022.
Davi, H. and Cailleret, M.: Assessing drought-driven mortality trees with physiological process-based models, Agr. Forest Meteorol., 232, 279–290, https://doi.org/10.1016/j.agrformet.2016.08.019, 2017.
De Cáceres, M., Martínez-Vilalta, J., Coll, L., Llorens, P., Casals, P., Poyatos, R., Pausas, J. G., and Brotons, L.: Coupling a water balance model with forest inventory data to predict drought stress: the role of forest structural changes vs. climate changes, Agr. Forest Meteorol., 213, 77–90, https://doi.org/10.1016/j.agrformet.2015.06.012, 2015.
De Cáceres, M., Martin-StPaul, N., Turco, M., Cabon, A., and Granda, V.: Estimating daily meteorological data and downscaling climate models over landscapes, Environ. Model. Softw., 108, 186–196, https://doi.org/10.1016/j.envsoft.2018.08.003, 2018.
De Cáceres, M., Casals, P., Gabriel, E., and Castro, X.: Scaling-up individual-level allometric equations to predict stand-level fuel loading in Mediterranean shrublands, Ann. For. Sci., 76, 87, https://doi.org/10.1007/s13595-019-0873-4, 2019.
De Cáceres, M., Mencuccini, M., Martin-StPaul, N., Limousin, J.-M., Coll, L., Poyatos, R., Cabon, A., Granda, V., Forner, A., Valladares, F., and Martínez-Vilalta, J.: Unravelling the effect of species mixing on water use and drought stress in Mediterranean forests: A modelling approach, Agr. Forest Meteorol., 296, 108233, https://doi.org/10.1016/j.agrformet.2020.108233, 2021.
De Cáceres, M., Granda, V., Cabon, A., and Ameztegui, A.: emf-creaf/medfate: MEDFATE v.2.9.3, Zenodo [code], https://doi.org/10.5281/zenodo.7695331, 2022.
Delpierre, N., Dufrêne, E., Soudani, K., Ulrich, E., Cecchini, S., Boé, J., and François, C.: Modelling interannual and spatial variability of leaf senescence for three deciduous tree species in France, Agr. Forest Meteorol., 149, 938–948, https://doi.org/10.1016/j.agrformet.2008.11.014, 2009.
De Pury, D. G. G. and Farquhar, G. D.: Simple scaling of photosynthesis from leaves to canopies without the errors of big-leaf models, Plant Cell Environ., 20, 537–557, https://doi.org/10.1111/j.1365-3040.1997.00094.x, 1997.
de Wergifosse, L., André, F., Goosse, H., Boczon, A., Cecchini, S., Ciceu, A., Collalti, A., Cools, N., D'Andrea, E., De Vos, B., Hamdi, R., Ingerslev, M., Knudsen, M. A., Kowalska, A., Leca, S., Matteucci, G., Nord-Larsen, T., Sanders, T. G., Schmitz, A., Termonia, P., Vanguelova, E., Van Schaeybroeck, B., Verstraeten, A., Vesterdal, L., and Jonard, M.: Simulating tree growth response to climate change in structurally diverse oak and beech forests, Sci. Total Environ., 806, 150422, https://doi.org/10.1016/j.scitotenv.2021.150422, 2022.
Dietze, M. C., Sala, A., Carbone, M. S., Czimczik, C. I., Mantooth, J. A., Richardson, A. D., and Vargas, R.: Nonstructural Carbon in Woody Plants, Annu. Rev. Plant Biol., 65, 667–687, https://doi.org/10.1146/annurev-arplant-050213-040054, 2014.
Dijak, W. D., Hanberry, B. B., Fraser, J. S., He, H. S., Wang, W. J., and Thompson, F. R.: Revision and application of the LINKAGES model to simulate forest growth in central hardwood landscapes in response to climate change, Landscape Ecol., 32, 1365–1384, https://doi.org/10.1007/s10980-016-0473-8, 2017.
Dixon, G.: Essential FVS: A User's Guide to the Forest Vegetation Simulator, U. S. Department of Agriculture, Forest Service, Fort Collins, Colorado, 226 pp., https://www.fs.usda.gov/fvs/documents/guides.shtml (last access: 31 May 2023), 2013.
Dufrêne, E., Davi, H., François, C., Le Maire, G., Le Dantec, V., and Granier, A.: Modelling carbon and water cycles in a beech forest. Part I: Model description and uncertainty analysis on modelled NEE, Ecol. Model., 185, 407–436, https://doi.org/10.1016/j.ecolmodel.2005.01.004, 2005.
Duursma, R. A., Blackman, C. J., Lopéz, R., Martin-StPaul, N. K., Cochard, H., and Medlyn, B. E.: On the minimum leaf conductance: its role in models of plant water use, and ecological and environmental controls, New Phytol., 221, 693–705, https://doi.org/10.1111/nph.15395, 2018.
Easterling, M. R., Ellner, S. P., and Dixon, P. M.: Size-specific sensitivity: Applying a new structured population model, Ecology, 81, 694–708, https://doi.org/10.1890/0012-9658(2000)081[0694:SSSAAN]2.0.CO;2, 2000.
Eckes-Shephard, A. H., Tiavlovsky, E., Chen, Y., Fonti, P., and Friend, A. D.: Direct response of tree growth to soil water and its implications for terrestrial carbon cycle modelling, Glob. Change Biol., 27, 121–135, https://doi.org/10.1111/gcb.15397, 2021.
Fatichi, S., Leuzinger, S., and Körner, C.: Moving beyond photosynthesis: From carbon source to sink-driven vegetation modeling, New Phytol., 201, 1086–1095, https://doi.org/10.1111/nph.12614, 2014.
Fatichi, S., Pappas, C., Zscheischler, J., and Leuzinger, S.: Modelling carbon sources and sinks in terrestrial vegetation, New Phytol., 221, 652–668, https://doi.org/10.1111/nph.15451, 2019.
Fer, I., Gardella, A. K., Shiklomanov, A. N., Campbell, E. E., Cowdery, E. M., De Kauwe, M. G., Desai, A., Duveneck, M. J., Fisher, J. B., Haynes, K. D., Hoffman, F. M., Johnston, M. R., Kooper, R., LeBauer, D. S., Mantooth, J., Parton, W. J., Poulter, B., Quaife, T., Raiho, A., Schaefer, K., Serbin, S. P., Simkins, J., Wilcox, K. R., Viskari, T., and Dietze, M. C.: Beyond ecosystem modeling: A roadmap to community cyberinfrastructure for ecological data-model integration, Glob. Change Biol., 27, 13–26, https://doi.org/10.1111/gcb.15409, 2021.
Fisher, R. A., Koven, C. D., Anderegg, W. R. L., Christoffersen, B. O., Dietze, M. C., Farrior, C. E., Holm, J. A., Hurtt, G. C., Knox, R. G., Lawrence, P. J., Lichstein, J. W., Longo, M., Matheny, A. M., Medvigy, D., Muller-Landau, H. C., Powell, T. L., Serbin, S. P., Sato, H., Shuman, J. K., Smith, B., Trugman, A. T., Viskari, T., Verbeeck, H., Weng, E., Xu, C., Xu, X., Zhang, T., and Moorcroft, P. R.: Vegetation demographics in Earth System Models: A review of progress and priorities, Glob. Change Biol., 24, 35–54, https://doi.org/10.1111/gcb.13910, 2018.
Forrester, D. I., Mathys, A. S., Stadelmann, G., and Trotsiuk, V.: Effects of climate on the growth of Swiss uneven-aged forests: Combining >100 years of observations with the 3-PG model, Forest Ecol. Manag., 494, 119271, https://doi.org/10.1016/j.foreco.2021.119271, 2021.
Funk, J. L., Larson, J. E., Ames, G. M., Butterfield, B. J., Cavender-Bares, J., Firn, J., Laughlin, D. C., Sutton-Grier, A. E., Williams, L., and Wright, J.: Revisiting the Holy Grail: using plant functional traits to understand ecological processes, Biol. Rev., 92, 1156–1173, https://doi.org/10.1111/brv.12275, 2017.
Fyllas, N. M. and Troumbis, A. Y.: Simulating vegetation shifts in north-eastern Mediterranean mountain forests under climatic change scenarios, Global Ecol. Biogeogr., 18, 64–77, https://doi.org/10.1111/j.1466-8238.2008.00419.x, 2009.
Fyllas, N. M., Phillips, O. L., Kunin, W. E., Matsinos, Y. G., and Troumbis, A. I.: Development and parameterization of a general forest gap dynamics simulator for the North-eastern Mediterranean Basin (GREek FOrest Species), Ecol. Model., 204, 439–456, https://doi.org/10.1016/j.ecolmodel.2007.02.006, 2007.
Fyllas, N. M., Gloor, E., Mercado, L. M., Sitch, S., Quesada, C. A., Domingues, T. F., Galbraith, D. R., Torre-Lezama, A., Vilanova, E., Ramírez-Angulo, H., Higuchi, N., Neill, D. A., Silveira, M., Ferreira, L., Aymard C., G. A., Malhi, Y., Phillips, O. L., and Lloyd, J.: Analysing Amazonian forest productivity using a new individual and trait-based model (TFS v.1), Geosci. Model Dev., 7, 1251–1269, https://doi.org/10.5194/gmd-7-1251-2014, 2014.
Fyllas, N. M., Christopoulou, A., Galanidis, A., Michelaki, C. Z., Giannakopoulos, C., Dimitrakopoulos, P. G., Arianoutsou, M., and Gloor, M.: Predicting species dominance shifts across elevation gradients in mountain forests in Greece under a warmer and drier climate, Reg. Environ. Change, 17, 1165–1177, https://doi.org/10.1007/s10113-016-1093-1, 2017.
García-Callejas, D., Molowny-Horas, R., and Retana, J.: Projecting the distribution and abundance of Mediterranean tree species under climate change: a demographic approach, J. Plant Ecol., 10, rtw081, https://doi.org/10.1093/jpe/rtw081, 2017.
García-Valdés, R., Estrada, A., Early, R., Lehsten, V., and Morin, X.: Climate change impacts on long-term forest productivity might be driven by species turnover rather than by changes in tree growth, Global Ecol. Biogeogr., 29, 1360–1372, https://doi.org/10.1111/geb.13112, 2020.
Genuchten, M. V.: A closed-form equation for predicting the hydraulic conductivity of unsaturated soils, Soil Sci. Soc. Am. J., 44, 892–898, 1980.
Gracia, C. A., Pla, E., Sánchez, A., and Sabaté, S.: GOTILWA+: Un modelo de crecimiento forestal basado en procesos ecofisiológicos, Cuadernos de la Sociedad Española de Ciencias Forestales, 18, 21–28, 2004.
Granier, A., Bréda, N., Biron, P., and Villette, S.: A lumped water balance model to evaluate duration and intensity of drought constraints in forest stands, Ecol. Model., 116, 269–283, https://doi.org/10.1016/S0304-3800(98)00205-1, 1999.
González de Andrés, E., Rosas, T., Camarero, J. J., and Martínez-Vilalta, J.: The intraspecific variation of functional traits modulates drought resilience of European beech and pubescent oak, J. Ecol., 109, 3652–3669, https://doi.org/10.1111/1365-2745.13743, 2021.
Guillemot, J., Francois, C., Hmimina, G., Dufrêne, E., Martin-StPaul, N. K., Soudani, K., Marie, G., Ourcival, J. M., and Delpierre, N.: Environmental control of carbon allocation matters for modelling forest growth, New Phytol., 214, 180–193, https://doi.org/10.1111/nph.14320, 2017.
Hanbury-Brown, A. R., Ward, R. E., and Kueppers, L. M.: Forest regeneration within Earth system models: current process representations and ways forward, New Phytol., 235, 20–40, https://doi.org/10.1111/nph.18131, 2022.
Hartig, F., Dyke, J., Hickler, T., Higgins, S. I., O'Hara, R. B., Scheiter, S., and Huth, A.: Connecting dynamic vegetation models to data - an inverse perspective, J. Biogeogr., 39, 2240–2252, https://doi.org/10.1111/j.1365-2699.2012.02745.x, 2012.
Hasenauer, H.: Dimensional relationships of open-grown trees in Austria, Forest Ecol. Manag., 96, 197–206, https://doi.org/10.1016/S0378-1127(97)00057-1, 1997.
Hawkes, C.: Woody plant mortality algorithms: Description, problems and progress, Ecol. Model., 126, 225–248, https://doi.org/10.1016/S0304-3800(00)00267-2, 2000.
Hayat, A., Hacket-Pain, A. J., Pretzsch, H., Rademacher, T. T., and Friend, A. D.: Modeling Tree Growth Taking into Account Carbon Source and Sink Limitations, Front. Plant Sci., 8, 1–15, https://doi.org/10.3389/fpls.2017.00182, 2017.
Hengl, T., Mendes De Jesus, J., Heuvelink, G. B. M., Gonzalez, M. R., Kilibarda, M., Blagotí, A., Shangguan, W., Wright, M. N., Geng, X., Bauer-Marschallinger, B., Guevara, M. A., Vargas, R., Macmillan, R. A., Batjes, N. H., Leenaars, J. G. B., Ribeiro, E., Wheeler, I., Mantel, S., and Kempen, B.: SoilGrids250m: Global Gridded Soil Information Based on Machine Learning, PLOS ONE, 12, e0169748, https://doi.org/10.1371/journal.pone.0169748, 2017.
Hoshika, Y., Osada, Y., de Marco, A., Peñuelas, J., and Paoletti, E.: Global diurnal and nocturnal parameters of stomatal conductance in woody plants and major crops, Global Ecol. Biogeogr., 27, 257–275, https://doi.org/10.1111/geb.12681, 2018.
Huang, J., Hammerbacher, A., Weinhold, A., Reichelt, M., Gleixner, G., Behrendt, T., van Dam, N. M., Sala, A., Gershenzon, J., Trumbore, S., and Hartmann, H.: Eyes on the future – evidence for trade-offs between growth, storage and defense in Norway spruce, New Phytol., 222, 144–158, https://doi.org/10.1111/nph.15522, 2019.
Jones, S., Rowland, L., Cox, P., Hemming, D., Wiltshire, A., Williams, K., Parazoo, N. C., Liu, J., da Costa, A. C. L., Meir, P., Mencuccini, M., and Harper, A. B.: The impact of a simple representation of non-structural carbohydrates on the simulated response of tropical forests to drought, Biogeosciences, 17, 3589–3612, https://doi.org/10.5194/bg-17-3589-2020, 2020.
Kattge, J., Bönisch, G., Díaz, S., et al.: TRY plant trait database – enhanced coverage and open access, Glob. Change Biol., 26, 119–188, https://doi.org/10.1111/gcb.14904, 2020.
Keane, R., Austin, M., Field, C., and Huth, A.: Tree mortality in gap models: Application to climate change, Climatic Change, 51, 509–540, 2001.
König, L. A., Mohren, F., Schelhaas, M.-J., Bugmann, H., and Nabuurs, G.-J.: Tree regeneration in models of forest dynamics – Suitability to assess climate change impacts on European forests, Forest Ecol. Manag., 520, 120390, https://doi.org/10.1016/j.foreco.2022.120390, 2022.
Körner, C.: Carbon limitation in trees, J. Ecol., 91, 4–17, https://doi.org/10.1046/j.1365-2745.2003.00742.x, 2003.
Körner, C.: Paradigm shift in plant growth control, Curr. Opin. Plant Biol., 25, 107–114, https://doi.org/10.1016/j.pbi.2015.05.003, 2015.
Korol, R. L., Running, S. W., and Milner, K. S.: Incorporating intertree competition into an ecosystem model, Can. J. Forest Res., 25, 413–424, https://doi.org/10.1139/x95-046, 1995.
Kotlarski, S., Keuler, K., Christensen, O. B., Colette, A., Déqué, M., Gobiet, A., Goergen, K., Jacob, D., Lüthi, D., van Meijgaard, E., Nikulin, G., Schär, C., Teichmann, C., Vautard, R., Warrach-Sagi, K., and Wulfmeyer, V.: Regional climate modeling on European scales: a joint standard evaluation of the EURO-CORDEX RCM ensemble, Geosci. Model Dev., 7, 1297–1333, https://doi.org/10.5194/gmd-7-1297-2014, 2014 (data available at: https://www.euro-cordex.net/index.php.en, last access: 30 May 2023).
Kursar, T. A., Engelbrecht, B. M. J., Burke, A., Tyree, M. T., El Omari, B., and Giraldo, J. P.: Tolerance to low leaf water status of tropical tree seedlings is related to drought performance and distribution, Funct. Ecol., 23, 93–102, https://doi.org/10.1111/j.1365-2435.2008.01483.x, 2009.
Landsberg, J. and Sands, P.: Chapter 9 – The 3-PG Process-Based Model, Terrestrial Ecology, 4, 241–282, https://doi.org/10.1016/B978-0-12-374460-9.00009-3, 2011.
Landsberg, J. J. and Waring, R. H.: A generalised model of forest productivity using simplified concepts of radiation-use efficiency, carbon balance and partitioning, Forest Ecol. Manag., 95, 209–228, https://doi.org/10.1016/S0378-1127(97)00026-1, 1997.
Le Roux, X., Lacointe, A., Escobar-Gutiérrez, A., and Le Dizès, S.: Carbon-based models of individual tree growth: A critical appraisal, Ann. For. Sci., 58, 469–506, https://doi.org/10.1051/forest:2001140, 2001.
Lempereur, M., Martin-Stpaul, N. K., Damesin, C., Joffre, R., Ourcival, J. M., Rocheteau, A., and Rambal, S.: Growth duration is a better predictor of stem increment than carbon supply in a Mediterranean oak forest: Implications for assessing forest productivity under climate change, New Phytol., 207, 579–590, https://doi.org/10.1111/nph.13400, 2015.
Liu, Q., Peng, C., Schneider, R., Cyr, D., Liu, Z., Zhou, X., and Kneeshaw, D.: TRIPLEX-Mortality model for simulating drought-induced tree mortality in boreal forests: Model development and evaluation, Ecol. Model., 455, 109652, https://doi.org/10.1016/j.ecolmodel.2021.109652, 2021.
López, R., Cano, F. J., Martin-StPaul, N. K., Cochard, H., and Choat, B.: Coordination of stem and leaf traits define different strategies to regulate water loss and tolerance ranges to aridity, New Phytol., 230, 497–509, https://doi.org/10.1111/nph.17185, 2021.
Mahnken, M., Cailleret, M., Collalti, A., Trotta, C., Biondo, C., D'Andrea, E., Dalmonech, D., Marano, G., Mäkelä, A., Minunno, F., Peltoniemi, M., Trotsiuk, V., Nadal-Sala, D., Sabaté, S., Vallet, P., Aussenac, R., Cameron, D. R., Bohn, F. J., Grote, R., Augustynczik, A. L. D., Yousefpour, R., Huber, N., Bugmann, H., Merganičová, K., Merganic, J., Valent, P., Lasch-Born, P., Hartig, F., Vega del Valle, I. D., Volkholz, J., Gutsch, M., Matteucci, G., Krejza, J., Ibrom, A., Meesenburg, H., Rötzer, T., van der Maaten-Theunissen, M., van der Maaten, E., and Reyer, C. P. O.: Accuracy, realism and general applicability of European forest models. Glob. Change Biol., 28, 6921–6943, https://doi.org/10.1111/gcb.16384, 2022.
Mantova, M., Menezes-Silva, P. E., Badel, E., Cochard, H., and Torres-Ruiz, J. M.: The interplay of hydraulic failure and cell vitality explains tree capacity to recover from drought, Physiol. Plantarum, 172, 247–257, https://doi.org/10.1111/ppl.13331, 2021.
Maréchaux, I. and Chave, J.: An individual-based forest model to jointly simulate carbon and tree diversity in Amazonia: description and applications, Ecol. Monogr., 87, 632–664, https://doi.org/10.1002/ecm.1271, 2017.
Maréchaux, I., Langerwisch, F., Huth, A., Bugmann, H., Morin, X., Reyer, C. P. O., Seidl, R., Collalti, A., Dantas de Paula, M., Fischer, R., Gutsch, M., Lexer, M. J., Lischke, H., Rammig, A., Rödig, E., Sakschewski, B., Taubert, F., Thonicke, K., Vacchiano, G., and Bohn, F. J.: Tackling unresolved questions in forest ecology: The past and future role of simulation models, Ecol. Evol., 11, 3746–3770, https://doi.org/10.1002/ece3.7391, 2021.
Martin-StPaul, N., Delzon, S., and Cochard, H.: Plant resistance to drought depends on timely stomatal closure, Ecol. Lett., 20, 1437–1447, https://doi.org/10.1111/ele.12851, 2017.
Martínez-Vilalta, J., Sala, A., Asensio, D., Galiano, L., Hoch, G., Palacio, S., Piper, F. I., and Lloret, F.: Dynamics of non-structural carbohydrates in terrestrial plants: a global synthesis, Ecol. Monogr., 86, 495–516, https://doi.org/10.1002/ecm.1231, 2016.
McDowell, N., Pockman, W. T., Allen, C. D., Breshears, D. D., Cobb, N., Kolb, T., Plaut, J., Sperry, J. S., West, A., Williams, D. G., and Yepez, E. A.: Mechanisms of plant survival and mortality during drought: why do some plants survive while others succumb to drought?, New Phytol., 178, 719–39, https://doi.org/10.1111/j.1469-8137.2008.02436.x, 2008.
McDowell, N. G., Beerling, D. J., Breshears, D. D., Fisher, R. A., Raffa, K. F., and Stitt, M.: The interdependence of mechanisms underlying climate-driven vegetation mortality, Trends in Ecology and Evolution, 26, 523–532, https://doi.org/10.1016/j.tree.2011.06.003, 2011.
McDowell, N. G., Sapes, G., Pivovaroff, A., Adams, H. D., Allen, C. D., Anderegg, W. R. L., Arend, M., Breshears, D. D., Brodribb, T., Choat, B., Cochard, H., De Cáceres, M., De Kauwe, M. G., Grossiord, C., Hammond, W. M., Hartmann, H., Hoch, G., Kahmen, A., Klein, T., Mackay, D. S., Mantova, M., Martínez-Vilalta, J., Medlyn, B. E., Mencuccini, M., Nardini, A., Oliveira, R. S., Sala, A., Tissue, D. T., Torres-Ruiz, J. M., Trowbridge, A. M., Trugman, A. T., Wiley, E., and Xu, C.: Mechanisms of woody-plant mortality under rising drought, CO2 and vapour pressure deficit, Nature Reviews Earth & Environment, 0123456789, 41–44, https://doi.org/10.1038/s43017-022-00272-1, 2022.
Meinshausen, M., Smith, S. J., Calvin, K., Daniel, J. S., Kainuma, M. L. T., Lamarque, J.-F., Matsumoto, K., Montzka, S. A., Raper, S. C. B., Riahi, K., Thomson, A., Velders, G. J. M., and van Vuuren, D. P. P.: The RCP greenhouse gas concentrations and their extensions from 1765 to 2300, Climatic Change, 109, 213–241, https://doi.org/10.1007/s10584-011-0156-z, 2011.
Mencuccini, M., Rosas, T., Rowland, L., Choat, B., Cornelissen, H., Jansen, S., Kramer, K., Lapenis, A., Manzoni, S., Niinemets, Ü., Reich, P., Schrodt, F., Soudzilovskaia, N., Wright, I. H., and Martínez-Vilalta, J.: Leaf economics and plant hydraulics drive leaf: wood area ratios, New Phytol., 224, 1544–1556, https://doi.org/10.1111/nph.15998, 2019.
Ministerio de Agricultura y Pesca and Alimentación y Medio Ambiente: Cuarto inventario forestal nacional, Cataluña, Ministerio de Agricultura y Pesca, Alimentación y Medio Ambiente, Centro de Publicaciones, Madrid [data set], https://www.miteco.gob.es/es/biodiversidad/temas/inventarios-nacionales/inventario-forestal-nacional/ (last access: 30 May 2023), 2017.
Morán-Ordóñez, A., Ameztegui, A., De Cáceres, M., De-Miguel, S., Lefèvre, F., Brotons, L., and Coll, L.: Future trade-offs and synergies among ecosystem services in Mediterranean forests under global change scenarios, Ecosyst. Serv., 45, 101174, https://doi.org/10.1016/j.ecoser.2020.101174, 2020.
Morin, X., Bugmann, H., de Coligny, F., Martin-StPaul, N., Cailleret, M., Limousin, J. M., Ourcival, J. M., Prevosto, B., Simioni, G., Toigo, M., Vennetier, M., Catteau, E., and Guillemot, J.: Beyond forest succession: A gap model to study ecosystem functioning and tree community composition under climate change, Funct. Ecol., 35, 955–975, https://doi.org/10.1111/1365-2435.13760, 2021.
Morris, H., Plavcová, L., Cvecko, P., Fichtler, E., Gillingham, M. A. F., Martínez-Cabrera, H. I., Mcglinn, D. J., Wheeler, E., Zheng, J., Ziemińska, K., and Jansen, S.: A global analysis of parenchyma tissue fractions in secondary xylem of seed plants, New Phytol., 209, 1553–1565, https://doi.org/10.1111/nph.13737, 2016.
Mouillot, F., Rambal, S., and Lavorel, S.: A generic process-based SImulator for meditERRanean landscApes (SIERRA): design and validation exercises, Forest Ecol. Manag., 147, 75–97, https://doi.org/10.1016/S0378-1127(00)00432-1, 2001.
Neumann, R. B. and Cardon, Z. G.: The magnitude of hydraulic redistribution by plant roots: A review and synthesis of empirical and modeling studies, New Phytol., 194, 337–352, https://doi.org/10.1111/j.1469-8137.2012.04088.x, 2012.
Niinemets, Ü. and Valladares, F.: Tolerance to shade, drought, and waterlogging of temperate Northern Hemisphere trees and shrubs, Ecol. Monogr., 76, 521–547, 2006.
Oddou-Muratorio, S. and Davi, H.: Simulating local adaptation to climate of forest trees with a Physio-Demo-Genetics model, Evol. Appl., 7, 453–467, https://doi.org/10.1111/eva.12143, 2014.
Palacio, S., Hoch, G., Sala, A., Körner, C., and Millard, P.: Does carbon storage limit tree growth?, New Phytol., 201, 1096–1100, https://doi.org/10.1111/nph.12602, 2014.
Pavlick, R., Drewry, D. T., Bohn, K., Reu, B., and Kleidon, A.: The Jena Diversity-Dynamic Global Vegetation Model (JeDi-DGVM): a diverse approach to representing terrestrial biogeography and biogeochemistry based on plant functional trade-offs, Biogeosciences, 10, 4137–4177, https://doi.org/10.5194/bg-10-4137-2013, 2013.
Penman, H. L.: Natural evaporation from open water, bare soil and grass, P. Roy. Soc. Lond. A Mat., 193, 129–145, 1948.
Planque, B., Aarflot, J. M., Buttay, L., Carroll, J., Fransner, F., Hansen, C., Husson, B., Langangen, Ø., Lindstrøm, U., Pedersen, T., Primicerio, R., Sivel, E., Skogen, M. D., Strombom, E., Stige, L. C., Varpe, Ø., and Yoccoz, N. G.: A standard protocol for describing the evaluation of ecological models, Ecol. Model., 471, 110059, https://doi.org/10.1016/j.ecolmodel.2022.110059, 2022.
Potkay, A., Hölttä, T., Trugman, A. T., and Fan, Y.: Turgor-limited predictions of tree growth, height and metabolic scaling over tree lifespans, Tree Physiol., 42, 229–252, https://doi.org/10.1093/treephys/tpab094, 2022.
Poyatos, R., Martínez-Vilalta, J., Cermák, J., Ceulemans, R., Granier, a, Irvine, J., Köstner, B., Lagergren, F., Meiresonne, L., Nadezhdina, N., Zimmermann, R., Llorens, P., and Mencuccini, M.: Plasticity in hydraulic architecture of Scots pine across Eurasia, Oecologia, 153, 245–59, https://doi.org/10.1007/s00442-007-0740-0, 2007.
Prentice, I. C. and Cowling, S. A.: Dynamic Global Vegetation Models, in: Encyclopedia of Biodiversity, second edn., Academic Press, 670–689, ISBN 9780123847201, https://doi.org/10.1016/B978-0-12-384719-5.00412-3, 2013.
Prentice, I. C., Dong, N., Gleason, S. M., Maire, V., and Wright, I. J.: Balancing the costs of carbon gain and water transport: Testing a new theoretical framework for plant functional ecology, Ecol. Lett., 17, 82–91, https://doi.org/10.1111/ele.12211, 2014.
Prescott, C. E., Grayston, S. J., Helmisaari, H.-S., Kaštovská, E., Körner, C., Lambers, H., Meier, I. C., Millard, P., and Ostonen, I.: Surplus Carbon Drives Allocation and Plant–Soil Interactions, Trends in Ecology & Evolution, 35, 1110–1118, https://doi.org/10.1016/j.tree.2020.08.007, 2020.
Price, D., Zimmermann, N., and Van Der Meer, P.: Regeneration in gap models: Priority issues for studying forest responses to climate change, Climatic Change, 51, 475–508, 2001.
R Core Team: R: A language and environment for statistical computing, R Foundation for Statistical Computing, Vienna, Austria, https://www.R-project.org (last access: 30 May 2023), 2023.
Rasche, L., Fahse, L., Zingg, A., and Bugmann, H.: Enhancing gap model accuracy by modeling dynamic height growth and dynamic maximum tree height, Ecol. Model., 232, 133–143, https://doi.org/10.1016/j.ecolmodel.2012.03.004, 2012.
Rehschuh, R., Cecilia, A., Zuber, M., Faragó, T., Baumbach, T., Hartmann, H., Jansen, S., Mayr, S., and Ruehr, N.: Drought-induced xylem embolism limits the recovery of leaf gas exchange in scots pine, Plant Physiol., 184, 852–864, https://doi.org/10.1104/pp.20.00407, 2020.
Reich, P. B., Tjoelker, M. G., Pregitzer, K. S., Wright, I. J., Oleksyn, J., and Machado, J. L.: Scaling of respiration to nitrogen in leaves, stems and roots of higher land plants, Ecol. Lett., 11, 793–801, https://doi.org/10.1111/j.1461-0248.2008.01185.x, 2008.
Richardson, A. D., Carbone, M. S., Keenan, T. F., Czimczik, C. I., Hollinger, D. Y., Murakami, P., Schaberg, P. G., and Xu, X.: Seasonal dynamics and age of stemwood nonstructural carbohydrates in temperate forest trees, New Phytol., 197, 850–861, https://doi.org/10.1111/nph.12042, 2013.
Rosas, T., Mencuccini, M., Barba, J., Cochard, H., Saura-Mas, S., and Martínez-Vilalta, J.: Adjustments and coordination of hydraulic, leaf and stem traits along a water availability gradient, New Phytol., 223, 632–646, https://doi.org/10.1111/nph.15684, 2019.
Ruffault, J., Pimont, F., Cochard, H., Dupuy, J.-L., and Martin-StPaul, N.: SurEau-Ecos v2.0: a trait-based plant hydraulics model for simulations of plant water status and drought-induced mortality at the ecosystem level, Geosci. Model Dev., 15, 5593–5626, https://doi.org/10.5194/gmd-15-5593-2022, 2022.
Running, S. W. and Coughlan, J. C.: A general model of forest ecosystem processes for regional applications I. Hydrologic balance, canopy gas exchange and primary production processes, Ecol. Model., 42, 125–154, https://doi.org/10.1016/0304-3800(88)90112-3, 1988.
Sakschewski, B., von Bloh, W., Boit, A., Rammig, A., Kattge, J., Poorter, L., Peñuelas, J., and Thonicke, K.: Leaf and stem economics spectra drive diversity of functional plant traits in a dynamic global vegetation model, Glob. Change Biol., 21, 2711–2725, https://doi.org/10.1111/gcb.12870, 2015.
Sanchez-Martinez, P., Martínez-Vilalta, J., Dexter, K. G., Segovia, R. A., and Mencuccini, M.: Adaptation and coordinated evolution of plant hydraulic traits, Ecol. Lett., 23, 1599–1610, https://doi.org/10.1111/ele.13584, 2020.
Scheiter, S. and Higgins, S. I.: Impacts of climate change on the vegetation of Africa: An adaptive dynamic vegetation modelling approach, Glob. Change Biol., 15, 2224–2246, https://doi.org/10.1111/j.1365-2486.2008.01838.x, 2009.
Scheiter, S., Langan, L., and Higgins, S.: Next-generation dynamic global vegetation models: learning from community ecology, New Phytol., 198, 957–969, 2013.
Schiestl-Aalto, P., Kulmala, L., Mäkinen, H., Nikinmaa, E., and Mäkelä, A.: CASSIA - a dynamic model for predicting intra-annual sink demand and interannual growth variation in Scots pine, New Phytol., 206, 647–659, https://doi.org/10.1111/nph.13275, 2015.
Schmitt, S., Maréchaux, I., Chave, J., Fischer, F. J., Piponiot, C., Traissac, S., and Hérault, B.: Functional diversity improves tropical forest resilience: Insights from a long-term virtual experiment, J. Ecol., 108, 831–843, https://doi.org/10.1111/1365-2745.13320, 2020.
Scrucca, L.: GA: A Package for Genetic Algorithms in R, J. Stat. Softw., 53, 1–37, https://doi.org/10.18637/jss.v053.i04, 2013.
Serra-Maluquer, X., Mencuccini, M., and Martínez-Vilalta, J.: Changes in tree resistance, recovery and resilience across three successive extreme droughts in the northeast Iberian Peninsula, Oecologia, 187, 343–354, https://doi.org/10.1007/s00442-018-4118-2, 2018.
Shinozaki, K., Yoda, K., Hozumi, K., and Kira, T.: A quantitative analysis of plant form – the pipe model theory. I. Basic analysis, Japanese Journal of Ecology, 14, 97–105, 1964.
Siefert, A., Violle, C., Chalmandrier, L., Albert, C. H., Taudiere, A., Fajardo, A., Aarssen, L. W., Baraloto, C., Carlucci, M. B., Cianciaruso, M. V., de L. Dantas, V., de Bello, F., Duarte, L. D. S., Fonseca, C. R., Freschet, G. T., Gaucherand, S., Gross, N., Hikosaka, K., Jackson, B., Jung, V., Kamiyama, C., Katabuchi, M., Kembel, S. W., Kichenin, E., Kraft, N. J. B., Lagerström, A., Bagousse-Pinguet, Y. L., Li, Y., Mason, N., Messier, J., Nakashizuka, T., Overton, J. McC., Peltzer, D. A., Pérez-Ramos, I. M., Pillar, V. D., Prentice, H. C., Richardson, S., Sasaki, T., Schamp, B. S., Schöb, C., Shipley, B., Sundqvist, M., Sykes, M. T., Vandewalle, M., and Wardle, D. A.: A global meta-analysis of the relative extent of intraspecific trait variation in plant communities, Ecol. Lett., 18, 1406–1419, https://doi.org/10.1111/ele.12508, 2015.
Sperry, J. S. and Love, D. M.: What plant hydraulics can tell us about responses to climate-change droughts, New Phytol., 207, 14–27, https://doi.org/10.1111/nph.13354, 2015.
Sperry, J. S., Adler, F. R., Campbell, G. S., and Comstock, J. P.: Limitation of plant water use by rhizosphere and xylem conductance: results from a model, Plant Cell Environ., 21, 347–359, https://doi.org/10.1046/j.1365-3040.1998.00287.x, 1998.
Sperry, J. S., Venturas, M. D., Anderegg, W. R. L., Mencuccini, M., Mackay, D. S., Wang, Y., and Love, D. M.: Predicting stomatal responses to the environment from the optimization of photosynthetic gain and hydraulic cost, Plant Cell Environ., 40, 816–830, https://doi.org/10.1111/pce.12852, 2017.
Spicer, R.: 22 – Senescence in Secondary Xylem: Heartwood Formation as an Active Developmental Program, in: Vascular Transport in Plants, in: Physiological Ecology, Vascular Transport in Plants, edited by: Holbrook, N. M. and Zwieniecki, M. A., Academic Press, 457–475, https://doi.org/10.1016/B978-012088457-5/50024-1, 2005.
Stadelmann, G., Temperli, C., Rohner, B., Didion, M., Herold, A., Rösler, E., and Thürig, E.: Presenting MASSIMO: A Management Scenario Simulation Model to Project Growth, Harvests and Carbon Dynamics of Swiss Forests, Forests, 10, 94, https://doi.org/10.3390/f10020094, 2019.
Tavşanoglu, Ç. and Pausas, J. G.: A functional trait database for Mediterranean Basin plants, Scientific Data, 5, 1–18, https://doi.org/10.1038/sdata.2018.135, 2018.
Thonicke, K., Billing, M., von Bloh, W., Sakschewski, B., Niinemets, Ü., Peñuelas, J., Cornelissen, J. H. C., Onoda, Y., van Bodegom, P., Schaepman, M. E., Schneider, F. D., and Walz, A.: Simulating functional diversity of European natural forests along climatic gradients, J. Biogeogr., 47, 1069–1085, https://doi.org/10.1111/jbi.13809, 2020.
Thrippleton, T., Lüscher, F., and Bugmann, H.: Climate change impacts across a large forest enterprise in the Northern Pre-Alps: dynamic forest modelling as a tool for decision support, Eur. J. For. Res., 139, 483–498, https://doi.org/10.1007/s10342-020-01263-x, 2020.
Tóth, B., Weynants, M., Nemes, A., Makó, A., Bilas, G., and Tóth, G.: New generation of hydraulic pedotransfer functions for Europe, Eur. J. Soil Sci., 66, 226–238, https://doi.org/10.1111/ejss.12192, 2015.
Trasobares, A., Mola-Yudego, B., Aquilué, N., Ramón González-Olabarria, J., Garcia-Gonzalo, J., García-Valdés, R., and De Cáceres, M.: Nationwide climate-sensitive models for stand dynamics and forest scenario simulation, Forest Ecol. Manag., 505, 119909, https://doi.org/10.1016/j.foreco.2021.119909, 2022.
Trugman, A. T., Anderegg, L. D. L., Anderegg, W. R. L., Das, A. J., and Stephenson, N. L.: Why is Tree Drought Mortality so Hard to Predict?, Trends in Ecology and Evolution, 36, 520–532, https://doi.org/10.1016/j.tree.2021.02.001, 2021.
Vanderwel, M. C., Lyutsarev, V. S., and Purves, D. W.: Climate-related variation in mortality and recruitment determine regional forest-type distributions, Global Ecol. Biogeogr., 22, 1192–1203, https://doi.org/10.1111/geb.12081, 2013.
Vanoni, M., Cailleret, M., Hülsmann, L., Bugmann, H., and Bigler, C.: How do tree mortality models from combined tree-ring and inventory data affect projections of forest succession?, Forest Ecol. Manag., 433, 606–617, https://doi.org/10.1016/j.foreco.2018.11.042, 2019.
Venturas, M. D., Todd, H. N., Trugman, A. T., and Anderegg, W. R. L.: Understanding and predicting forest mortality in the western United States using long-term forest inventory data and modeled hydraulic damage, New Phytol., 230, 1896–1910, https://doi.org/10.1111/nph.17043, 2021.
Verheijen, L. M., Brovkin, V., Aerts, R., Bönisch, G., Cornelissen, J. H. C., Kattge, J., Reich, P. B., Wright, I. J., and van Bodegom, P. M.: Impacts of trait variation through observed trait–climate relationships on performance of an Earth system model: a conceptual analysis, Biogeosciences, 10, 5497–5515, https://doi.org/10.5194/bg-10-5497-2013, 2013.
Verheijen, L. M., Aerts, R., Brovkin, V., Cavender-Bares, J., Cornelissen, J. H. C., Kattge, J., and van Bodegom, P. M.: Inclusion of ecologically based trait variation in plant functional types reduces the projected land carbon sink in an earth system model, Glob. Change Biol., 21, 3074–3086, https://doi.org/10.1111/gcb.12871, 2015.
Vilà-Cabrera, A., Espelta, J. M., Vayreda, J., and Pino, J.: “New Forests” from the Twentieth Century are a Relevant Contribution for C Storage in the Iberian Peninsula, Ecosystems, 20, 130–143, https://doi.org/10.1007/s10021-016-0019-6, 2017.
Williams, A. and de Vries, F. T.: Plant root exudation under drought: implications for ecosystem functioning, New Phytol., 225, 1899–1905, https://doi.org/10.1111/nph.16223, 2020.
Zakharova, L., Meyer, K. M., and Seifan, M.: Trait-based modelling in ecology: A review of two decades of research, Ecol. Model., 407, 108703, https://doi.org/10.1016/j.ecolmodel.2019.05.008, 2019.
Zanne, A. E., Lopez-Gonzalez, G., Coomes, D. A., Ilic, J., Jansen, S., Lewis, S. L., Miller, R. B., Swenson, N. G., Wiemann, M. C., and Chave, J.: Data from: Towards a worldwide wood economics spectrum, Dryad [data set], https://doi.org/10.5061/dryad.234, 2009.
- Abstract
- Introduction
- Model description
- Study area, forest, soil and historic weather data
- Parameter estimation
- Evaluation and application at the regional level
- Discussion
- Conclusion
- Appendix A: Supplementary figures
- Appendix B: Details of the design of the basic sub-model and parameter estimation procedures
- Appendix C: Details of the integral projection model (IPM)
- Appendix D: Detailed model evaluation results
- Code availability
- Data availability
- Author contributions
- Competing interests
- Disclaimer
- Acknowledgements
- Financial support
- Review statement
- References
- Supplement