the Creative Commons Attribution 4.0 License.
the Creative Commons Attribution 4.0 License.
 | 27 Mar 2023
The second Met Office Unified Model–JULES Regional Atmosphere and Land configuration, RAL2
Mike Bush
Ian Boutle
John Edwards
Anke Finnenkoetter
Charmaine Franklin
Kirsty Hanley
Aravindakshan Jayakumar
Huw Lewis
Adrian Lock
Marion Mittermaier
Saji Mohandas
Rachel North
Aurore Porson
Belinda Roux
Stuart Webster
Mark Weeks
In this paper we define RAL2 – the second Regional Atmosphere and Land (RAL) science configuration for regional modelling. RAL2 uses the Unified Model (UM) as the basis for the atmosphere and the Joint UK Land Environment Simulator (JULES) for the land. RAL2 defines the science configuration of the dynamics and physics schemes of the atmosphere and land and builds on the baseline of RAL1. There are two RAL2 sub-releases, one for mid-latitudes (RAL2-M) and one for tropical regions (RAL2-T). We document the differences between them and where appropriate discuss how RAL2 relates to RAL1 and the corresponding configuration of the global forecasting model. Our results show an increase in medium and low cloud amounts in the mid-latitudes leading to improved cloud forecasts. The increase in cloud amount leads to a reduced diurnal cycle of screen temperature. There is also a reduction in the frequency of heavier precipitation rates. RAL2 is expected to be the last RAL science configuration with two sub-releases as research effort is focused on producing a single defined configuration of the model that performs effectively in all regions of the world.


The works published in this journal are distributed under the Creative Commons Attribution 4.0 License. This licence does not affect the Crown copyright work, which is re-usable under the Open Government Licence (OGL). The Creative Commons Attribution 4.0 License and the OGL are interoperable and do not conflict with, reduce or limit each other.
© Crown copyright 2022
Regional atmospheric and land models with grid lengths of the order of a kilometre provide valuable information on local and high-impact weather and are critical to the core function of many national meteorological and hydrological services (NMHSs) (e.g. Baldauf et al., 2011; Brousseau et al., 2016; Bengtsson et al., 2017; Klasa et al., 2018).
NMHSs have to constantly maintain and upgrade their operational systems and make improvements to the skill of their modelling systems in order to fulfil their public service obligations and to demonstrate value for money when investments are made in (for example) high-performance (super)computing (HPC). Sometimes these model upgrades will be large and take many years to pull through from research to operations. On other occasions, the upgrades will be more incremental in nature.
The Unified Model (UM) partnership consists of a number of institutions that includes the Met Office, the National Centre for Medium Range Weather Forecasting (NCMRWF) in India and the Bureau of Meteorology (BoM) in Australia. The regional model is run with the Regional Atmosphere and Land (RAL) science configuration (Bush et al., 2020) for kilometre-scale modelling using the Met Office Unified Model (UM; Brown et al., 2012) as the basis for the atmosphere and the Joint UK Land Environment Simulator (JULES; Best et al., 2011; Clark et al., 2011) for the land. The regional model is run in areas of interest in different parts of the world, and it is our goal to have a single defined configuration of the model that performs effectively in all regions.
The Met Office Research and Innovation Strategy sets out aims for the next 10 years across science, technology and operations. One of the key themes is pulling through science into services and this includes RAL science configurations. The Met Office has an Operational Science Assurance Group (OSAG) that monitors the planned upgrades to operational systems (known as the “Operational Suite”). The science upgrades are run and validated in a test environment (known as the “Parallel Suite”) before being made operational and OSAG signs off proposed operational changes and determines whether these can be included in an upcoming Parallel Suite. This sign-off process requires results to be presented showing objective verification scores and subjective assessment (carried out with operational meteorologists/forecasters), demonstrating the performance of the proposed science changes across a number of standard tests. The computational cost of the proposed change is also an important consideration.
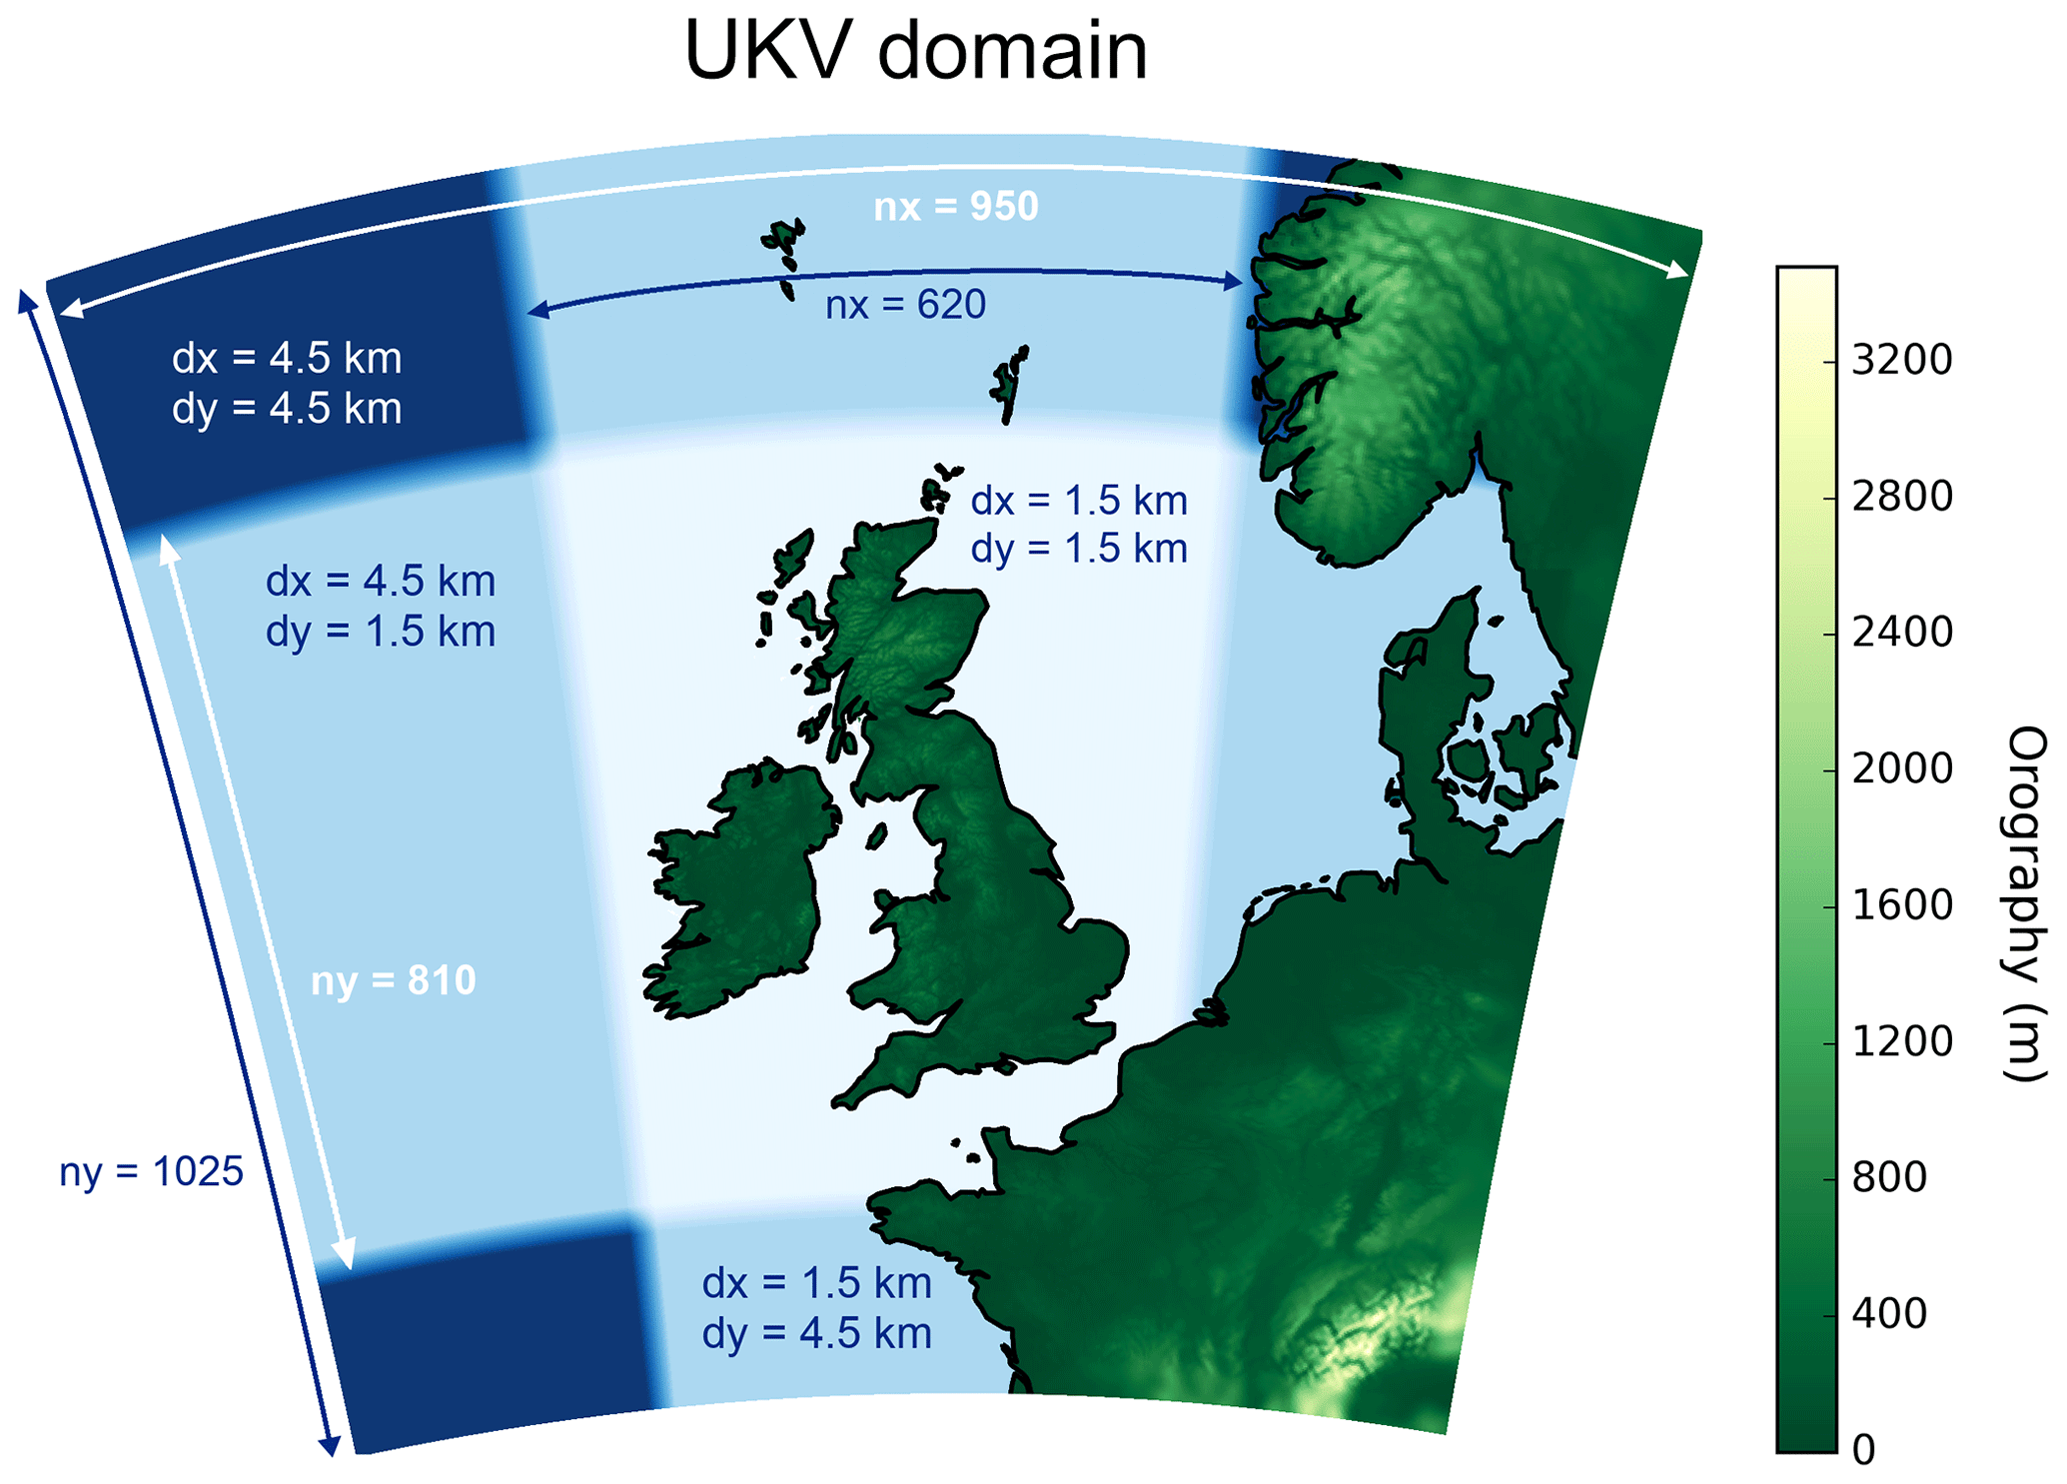
Figure 1 Domain for UK case studies.
The Operational Suite includes the Met Office's deterministic numerical weather prediction (NWP) weather forecast system (the UKV; Tang et al., 2013) and ensemble prediction system (MOGREPS-UK; Hagelin et al., 2017). These systems are run in variable-resolution mode, with horizontal grid lengths in the central regions of their domains of 1.5 and 2.2 km respectively. For climate projection, regional kilometre-scale simulations are run with horizontal grid lengths of 1.5 km over a domain covering the southern part of the UK (Kendon et al., 2014), 2.2 km over Europe (Berthou et al., 2018) and 4.4 km over Africa (Stratton et al., 2018).
In this paper we define the second RAL science configuration (RAL2) for kilometre-scale modelling using the UM and JULES. RAL2 defines the science configuration of the dynamics and physics schemes of the atmosphere and land. This configuration has two sub-releases, one for mid-latitudes (RAL2-M) and one for tropical regions (RAL2-T), and builds on the baseline of RAL1 (Bush et al., 2020). Where appropriate, we define how the model configuration relates to the corresponding configuration of the Met Office Unified Model Global Atmosphere and JULES Global Land configuration (GA/GL; Walters et al., 2019).
In Sect. 2, we document the RAL2 science configuration. In Sect. 3 we evaluate the performance of RAL2-M and RAL2-T configurations in five parts of the world with different meteorology, highlighting the impact of RAL2 developments on performance. Finally, in Sect. 4 we provide some concluding remarks.
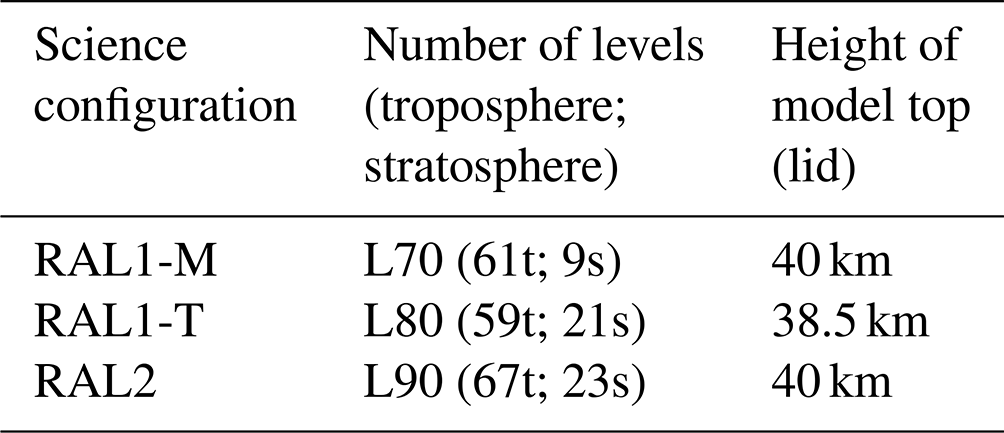
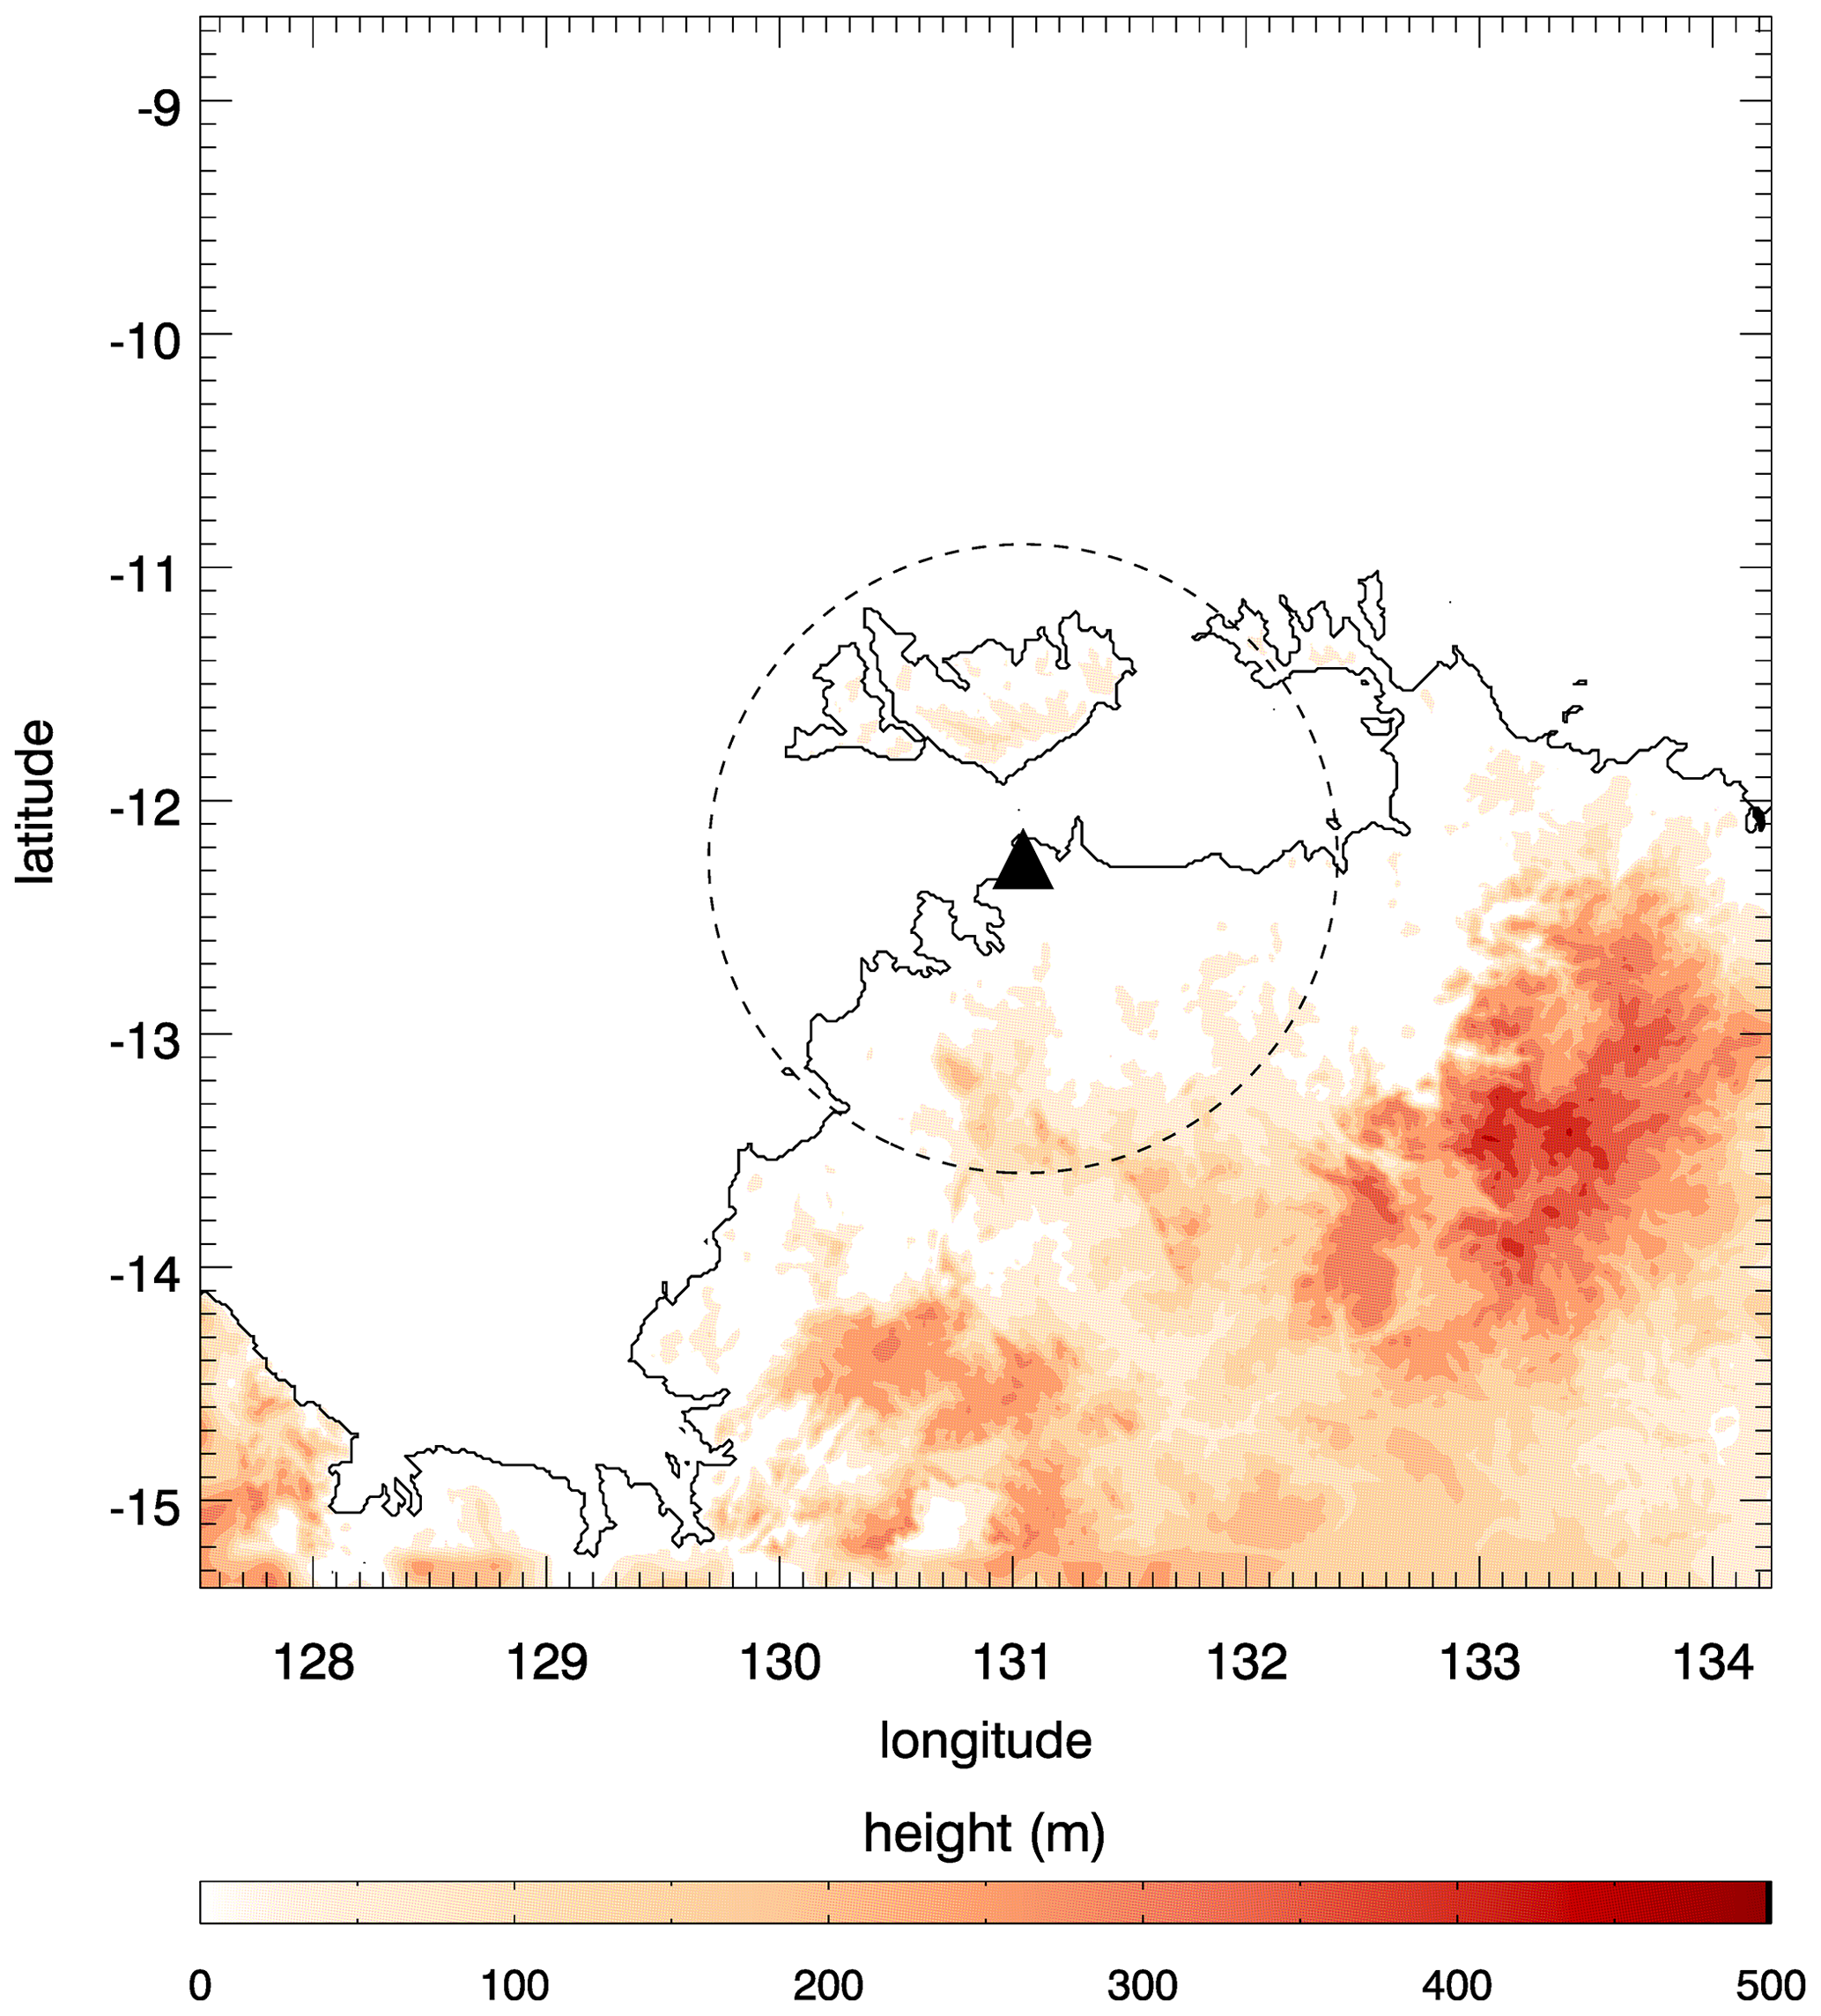
Figure 2 Domain for Australian case studies over Darwin showing the Top End of Australia's Northern Territory (which includes Darwin) and the Tiwi Islands. The C-band polarisation (CPOL) radar location is denoted by the black triangle and its coverage by the area within the circle of dashed lines, which is the area used for the analysis presented in Fig. 12.
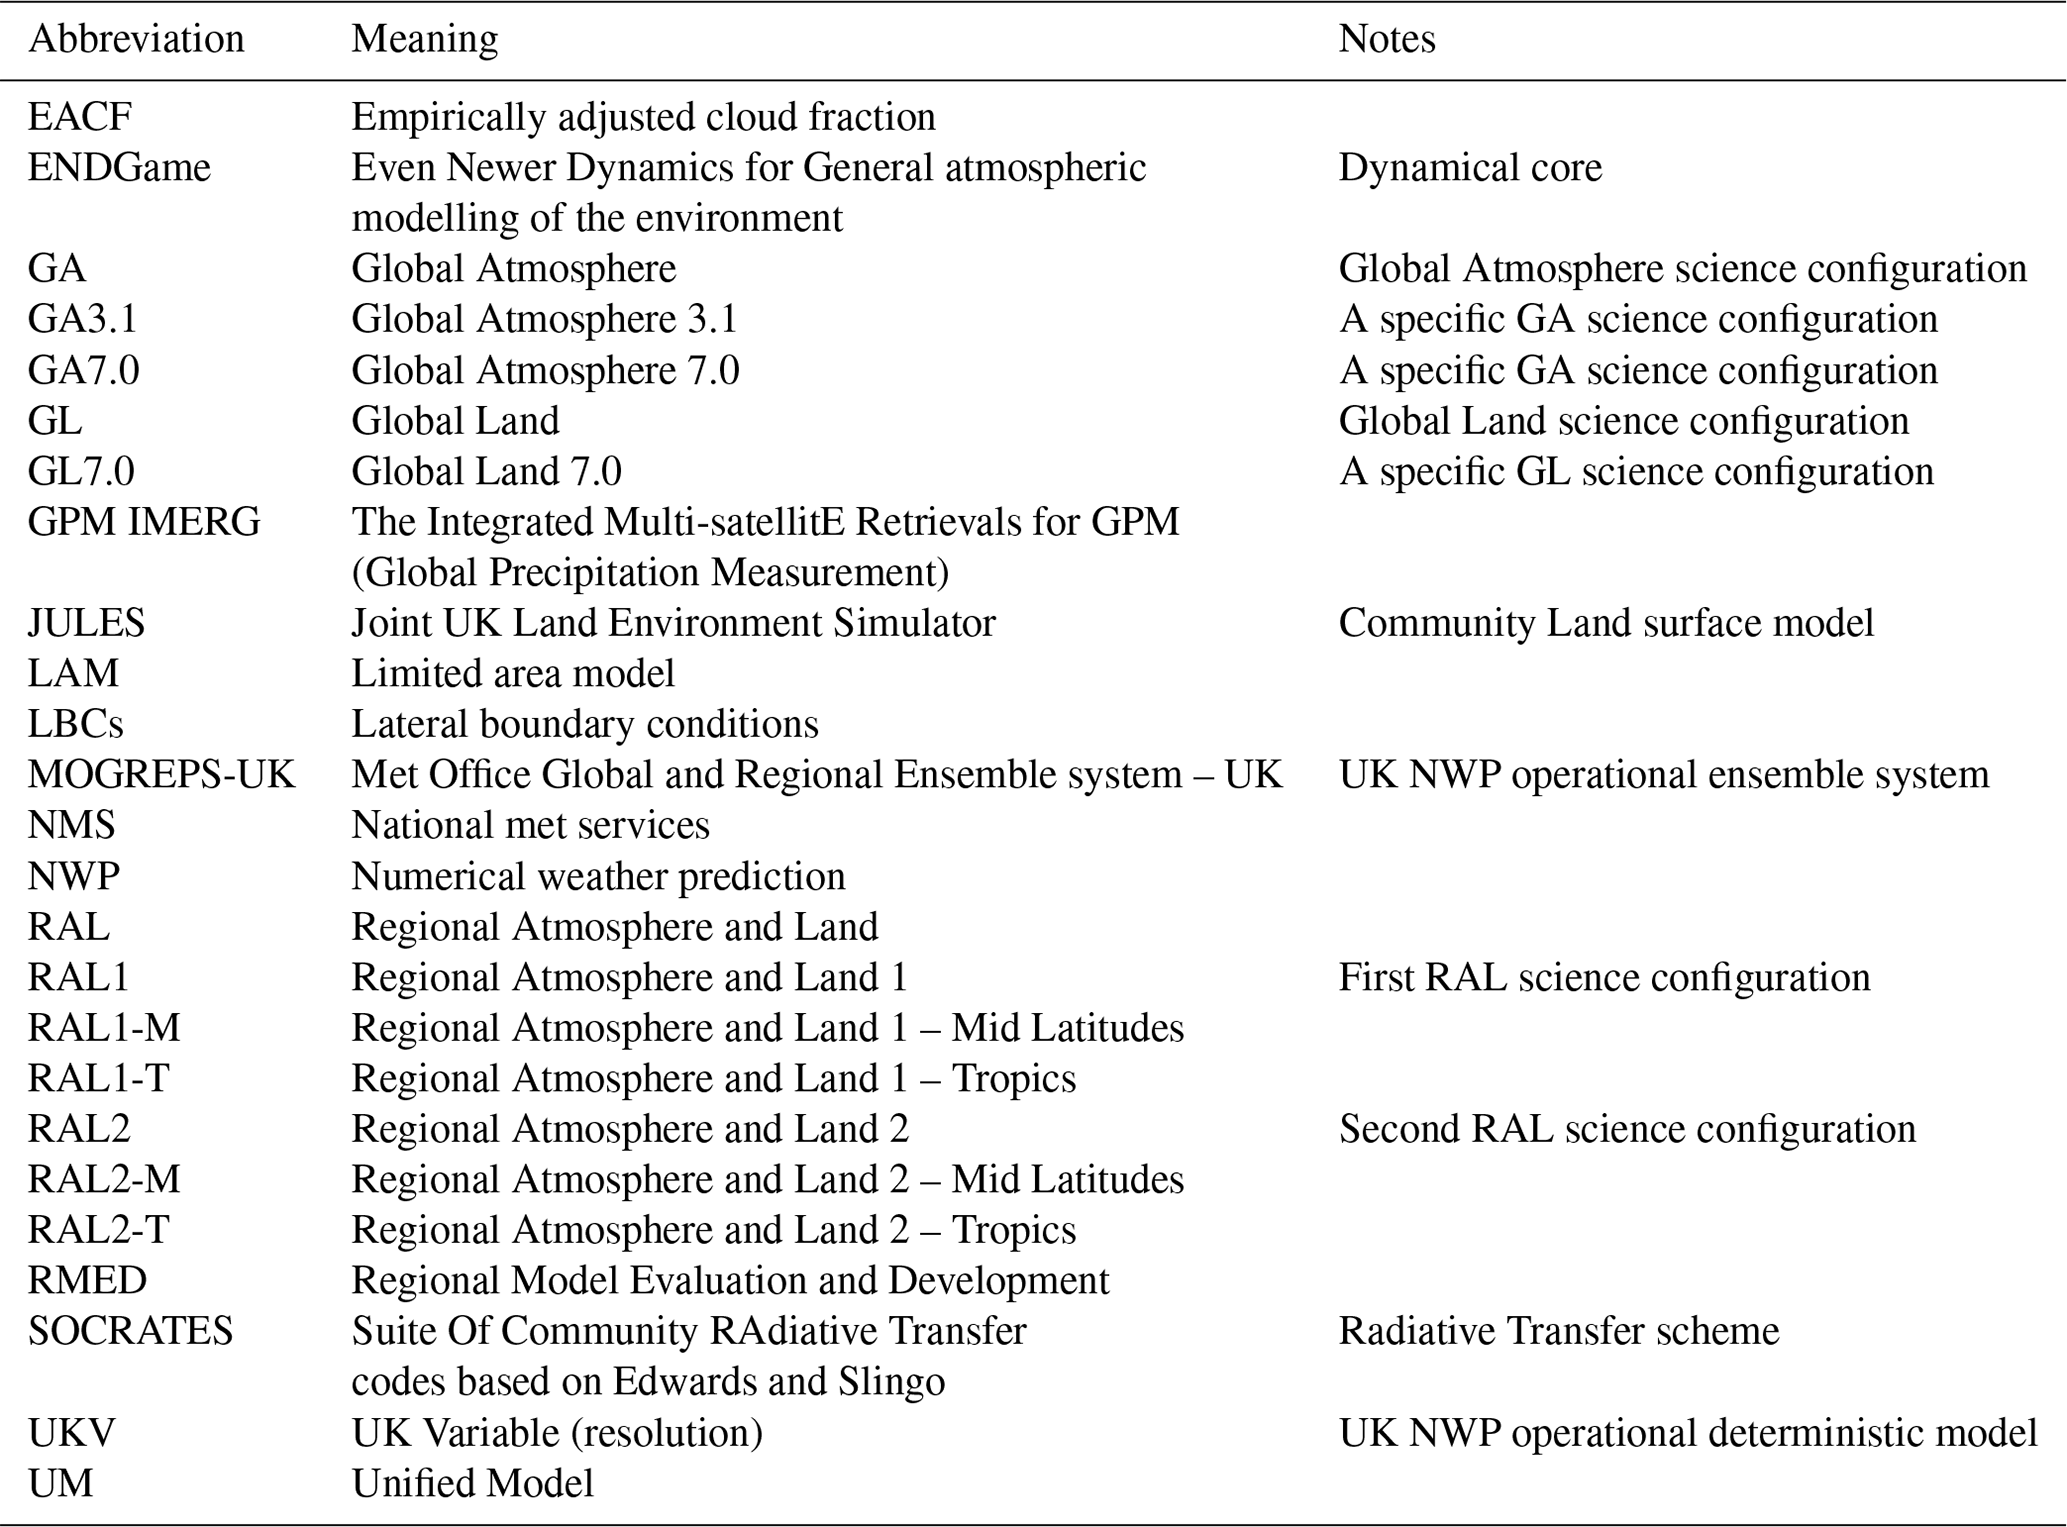
In this section, we give only a brief description of the model, concentrating on the differences from the baseline of RAL1 (Bush et al., 2020), where a more detailed description can be found. Certain aspects of the model (e.g. those described in Sect. 2.2, 2.3, 2.4, 2.5 and 2.9) have not changed from RAL1 to RAL2. For reference, a list of abbreviations is given in Appendix Table A2.
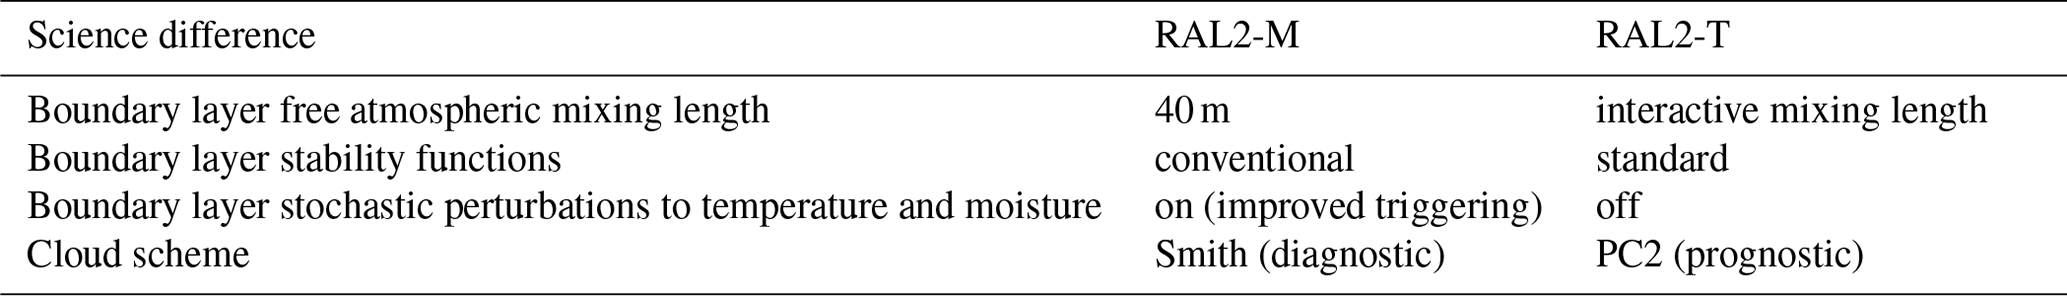
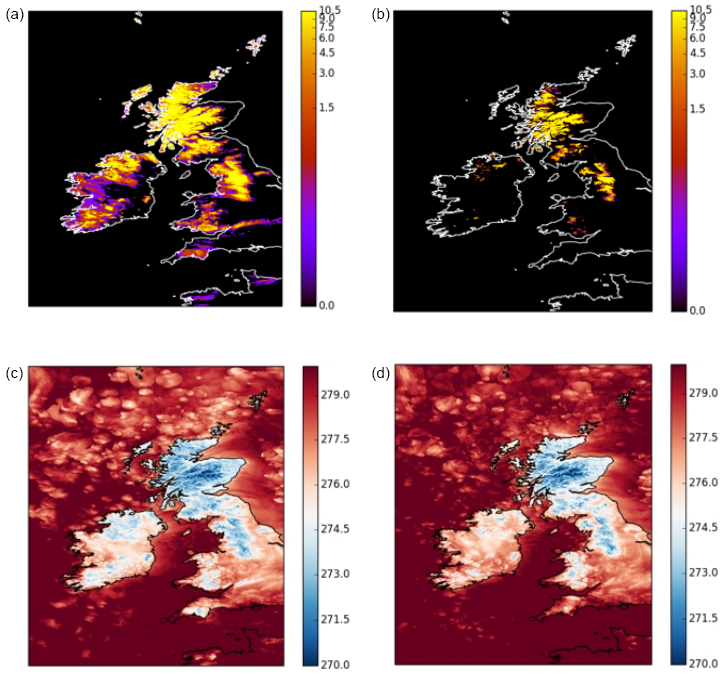
Figure 3 18 November 2016 12Z. UKV case study at T+60 showing snow amount (kg m−2) (a, b) and screen temperature (c, d) for RAL1-M (a, c) and RAL1-M with improvements to the treatment of lying snow (b, d).
2.1 Horizontal and vertical grid
The primary atmospheric prognostics are discretised horizontally onto a longitude–latitude grid. Optionally, this can be a rotated longitude–latitude grid with the pole rotated so that the grid's Equator runs through the centre of the regional model domain. UK forecasts use this option in order to minimise grid distortion due to convergence of the meridians, which is most noticeable at high latitudes. In contrast, domains which lie within the tropics use unrotated grids, and this applies to the domains of interest in this paper over Darwin (Australia), South East Asia and India.
In the vertical, RAL2 uses a 90-level vertical level set labelled L90(67t,23s)40, which has 67 levels below 18 km, 23 levels above this and a fixed model lid 40 km above sea level. Table 1 compares level sets used in RAL1 and RAL2. The mid-latitude RAL1-M configuration has a 70-level vertical level set labelled L70(61t,9s)40, and the tropical RAL1-T configuration has an 80-level vertical level set labelled L80(59t,21s)38.5 (Bush et al., 2020).
The unification of level sets in RAL2 removes an unnecessary difference between mid-latitude and tropical configurations by converging on an enhanced vertical resolution level set that captures the best features of both RAL1 level sets. The L70(61t,9s)40 level set has slightly greater resolution in the lowest 18 km of the atmosphere than the L80(59t,21s)38.5, whilst the L80(59t,21s)38.5 level set has more levels in the upper troposphere than L70(61t,9s)40. The rationale for these differences is that the tropopause is shallower in the mid-latitudes than in the tropics. Also, boundary layer fog and low-cloud processes are more important in the mid-latitudes and convection more important in the tropics.
The L90(67t,23s)40 grid is based on a quadratic function of layer thicknesses, which is gradually stretched so as to ensure an economical number of levels is employed to cover the height domain of the model. The general method is quite flexible and depends upon the choice of relatively few parameters: the lid top, number of levels, height to which a pure quadratic grid is used, the first layer thickness, a scale parameter for stretching the grid and some simple exponent parameters that govern the rate of stretching (and compression if required).
2.2 Dynamical core: spatio-temporal discretisation
The ENDGame dynamical core is a semi-implicit (SI) semi-Lagrangian (SL) formulation that solves the non-hydrostatic, fully compressible deep-atmosphere equations of motion (Wood et al., 2014).
2.3 Lateral boundary conditions (LBCs)
The treatment of LBCs uses the method of relaxation and blending (Davies, 1976; Perkey and Kreitzberg, 1976).
2.4 Solar and terrestrial radiation
The SOCRATES1 radiative transfer scheme (Edwards and Slingo, 1996; Manners et al., 2023) is used with a configuration based on GA3.1 (Walters et al., 2011). Solar radiation is treated in six short-wave bands and thermal radiation in nine long-wave bands.
2.5 Microphysics
A single-moment microphysics scheme based on Wilson and Ballard (1999) is used, but with extensive modifications. Prognostic rain and prognostic graupel are included. The warm-rain scheme is based on Boutle et al. (2014), whilst ice cloud parameterisations use the generic size distribution of Field et al. (2007) and mass–diameter relations of Cotton et al. (2013).
2.6 Large-scale cloud
RAL2-M uses the Smith (1990) cloud scheme. This is a diagnostic scheme which relies on a definition of critical relative humidity, RHcrit, the grid-box mean relative humidity at which clouds start to appear. For liquid cloud, the Smith cloud scheme is built around an assumption that sub-grid temperature and humidity fluctuations can be described by a symmetric triangular probability distribution function (PDF). An empirically adjusted cloud fraction (EACF) and an area cloud fraction scheme are also used, which follows a similar approach to that described by Boutle and Morcrette (2010).
The ice cloud fraction is parameterised as described by Abel et al. (2017), who diagnosed it from the ice water content. A change in RAL2-M is to limit the overlap between the liquid water and ice phases. Abel et al. (2017) describe how aircraft observations in a cold-air outbreak to the north of the UK are used to examine the boundary layer and cloud properties in an overcast mixed-phase stratocumulus cloud layer and across the transition to more broken open-cellular convection. Sensitivity studies using a convection-permitting (1.5 km grid spacing) regional version of the Met Office Unified Model showed that ice was too active at removing supercooled liquid water from the cloud layer and that improvements could be made by limiting the overlap between the liquid water and ice phases (see Appendix of Abel et al., 2017, for more details of the modification to the cloud scheme). Reducing the ice cloud fraction in mixed-phase regions protects a region of supercooled liquid and prevents excessive depletion of this by riming. This delays the transition of cold-air outbreaks into snow showers and improves the reflected SW radiation by increasing stratiform regions.
RAL2-T has three extra prognostic fields (liquid fraction, ice fraction and mixed-phase fraction) as it uses the prognostic cloud prognostic condensate (PC2) cloud scheme (Wilson et al., 2008).
2.7 Atmospheric boundary layer
Although most turbulent motions are still unresolved in kilometre-scale models (Takayabu et al., 2022), the largest scales can be of a similar size to the grid length. The model must therefore be able to parameterise the smaller scales, resolve the largest ones if possible, and not alias turbulent motions smaller than the grid scale onto the grid scale. The “blended” boundary-layer parameterisation described by Boutle et al. (2014) is used to achieve this. This scheme transitions from the 1D vertical turbulent mixing scheme of Lock et al. (2000), suitable for low-resolution simulations such as GA configurations, to a 3D turbulent mixing scheme based on Smagorinsky (1963) and suitable for high-resolution simulations, based on the ratio of the grid length to a turbulent length scale. The blended eddy diffusivity, including any non-local contribution from the Lock et al. (2000) scheme, is applied to down-gradient mixing in all three dimensions, whilst appropriately weighted non-local fluxes of heat and momentum are retained in the vertical for unstable boundary layers.
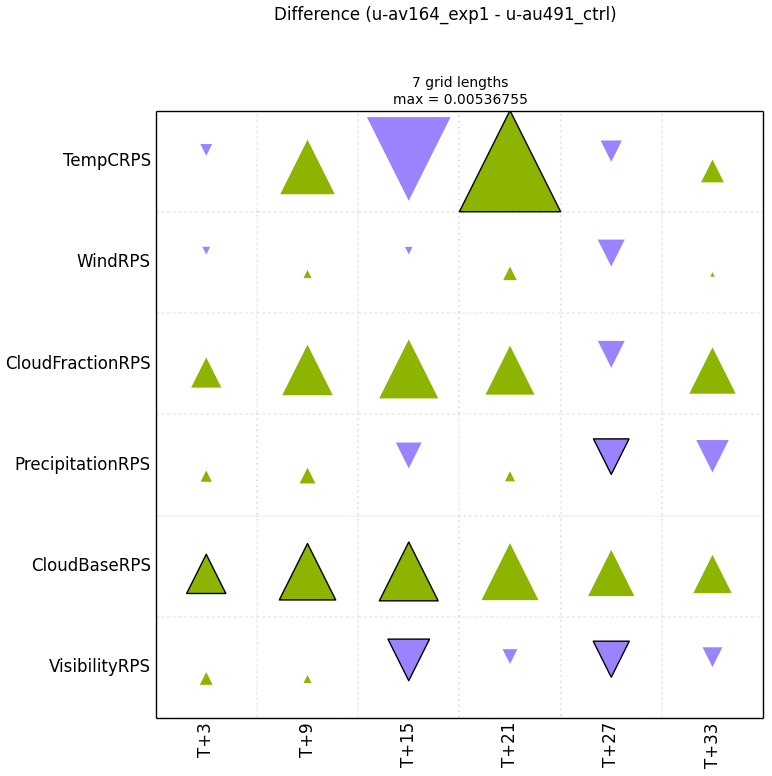
Figure 5 HiRA summary scorecard at 10.5 km (seven grid lengths) spatial scale for UKV case studies run with the Leonard term.
A change that is included in RAL2 is the addition of the ”Leonard” term as proposed by Moeng et al. (2010) and described and implemented in the UM by Hanley et al. (2019). The Leonard term is an extra subgrid vertical flux that accounts for the tilting of horizontal flux into the vertical by horizontal gradients in vertical velocity. Hanley et al. (2019) found that including this extra term in the Met Office UKV model reduces the peak vertical velocity within updraughts, leading to a reduction in condensation. As a result, the number of grid points with moderate to high rainfall rates, which are overrepresented by the UKV, is also reduced. RAL2 also includes a number of minor corrections to the Smagorinsky scheme, including the horizontal diffusion of cloud liquid water and the use of the momentum diffusion coefficient to diffuse vertical velocity in the vertical.
The configuration of the Lock et al. (2000) scheme is the same as that of GA7 (Walters et al., 2019), except for the following differences: (i) for stable boundary layers, the “sharp” function is used everywhere, but with a parameterisation of sub-grid drainage flows dependent on the sub-grid orography (Lock, 2012); (ii) heating generated by frictional dissipation of turbulence is not represented; (iii) the parameterisation of shear generated turbulence extending into cumulus layers (Bodas-Salcedo et al., 2012) is not used; (iv) RAL2 uses the surface fluxes calculated by JULES, rather than a simpler, less accurate calculation used in RAL1.
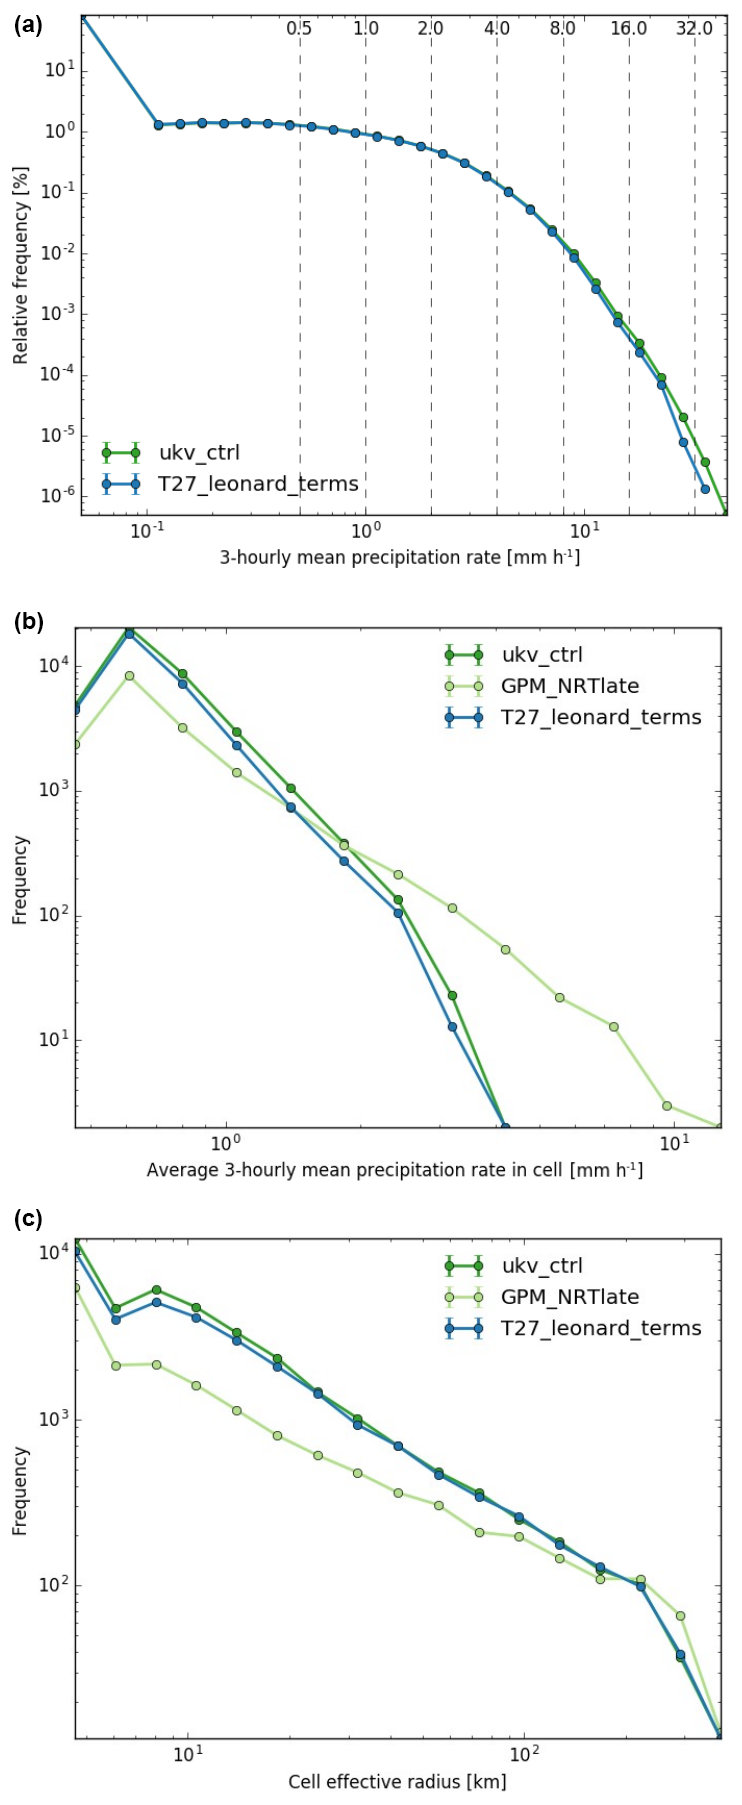
Figure 6 The 3 h mean precipitation histogram (a), cell mean value (b) and cell effective radius (c) against GPM near-real-time (NRT) late observations for UKV case studies run with the Leonard term.
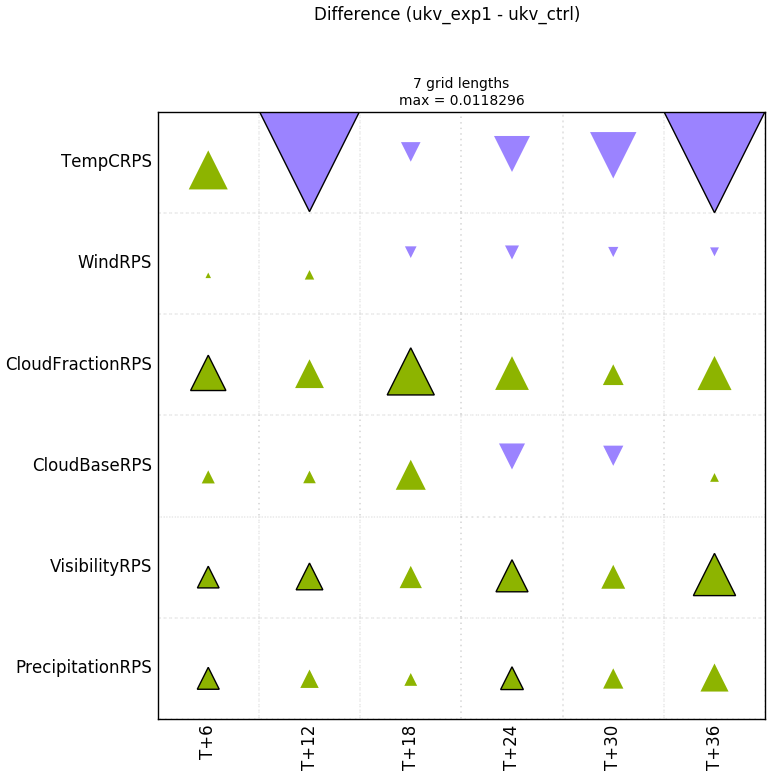
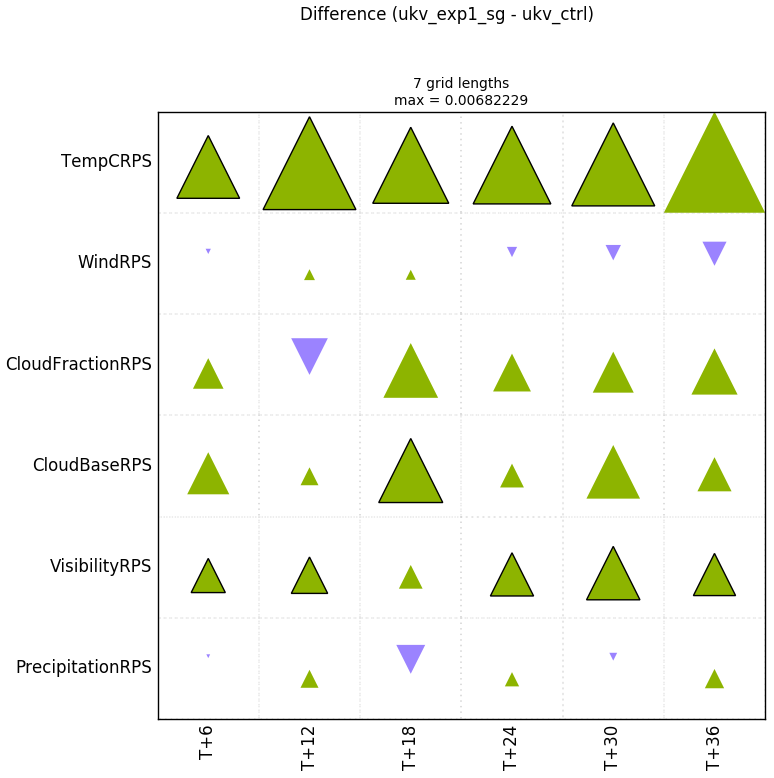
Figure 7 HiRA summary scorecard at 10.5 km (seven grid lengths) spatial scale for UKV case studies run with improved ice cloud fraction in mixed phase clouds. HiRA uses synoptic observations (see Sect. 3).
There are two differences in the representation of turbulence between RAL2-M and RAL2-T, namely in the form of the unstable stability functions and in the free-atmospheric mixing length. Both give enhanced turbulent mixing in RAL2-T compared to RAL2-M. RAL2-M uses the Brown (1999) “conventional” function, the same as GA7, while RAL2-T uses the Brown (1999) “standard” function. RAL2-T has an interactive free-atmospheric mixing length, whilst RAL2-M uses a value of 40 m. Related to this, stochastic perturbations to temperature and specific humidity are applied to RAL2-M (but not RAL2-T) in an effort to improve the triggering of explicit convection as described for RAL1 in Bush et al. (2020). For more details and a summary of differences between RAL2-T and RAL2-M, see Table 2.
2.8 Land surface and hydrology
The community land surface model JULES (Best et al., 2011; Clark et al., 2011) represents exchanges of mass, momentum and energy between the atmosphere and the underlying land and sea surfaces. The configuration adopted in RAL2 largely follows that of GL7.0 (Walters et al., 2019), although different priorities for regional and global modelling development can result in differences between the configurations.
A fixed value of Charnock's coefficient (0.011) is used to determine the surface roughness over open sea. Parameterisation of the sea surface albedo is based on Barker and Li (1995), and an RAL2 change implements form drag over sea ice bringing the treatment up to the level of GL8.0. RAL2 also limits drag over the ocean at high wind speeds by imposing a cap on the drag coefficient in very high winds. This is more realistic than allowing the drag coefficient to increase continually and significantly improves the wind–pressure relationship of tropical cyclones. For lower mean wind speeds, the effect of subgrid convective boundary layer gusts on the surface turbulent fluxes is included via a term proportional to the convective velocity scale in the calculation of the friction velocity. For RAL2 we reduce the strength of that term by a half, to then match GL7.0.
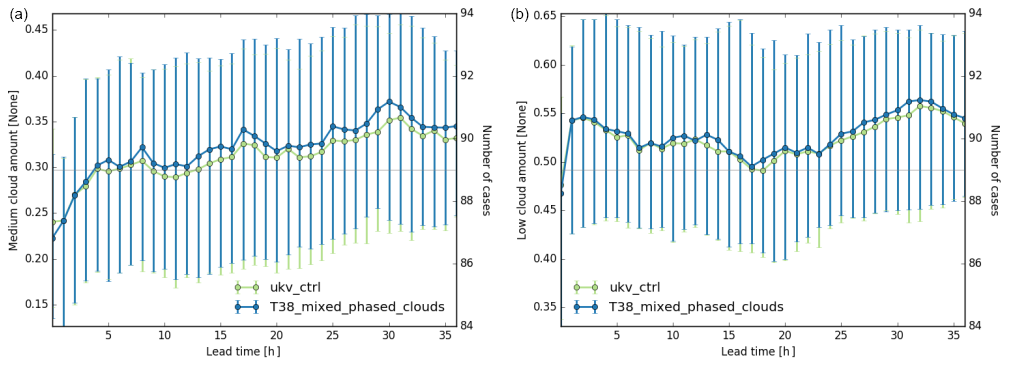
Figure 8 Medium cloud (a) and low cloud (b) amounts in UKV case studies run with improved ice cloud fraction in mixed phase clouds.
RAL2 includes the multilayer snow scheme, with a value for the density of fresh snow of 170 kg m−3. Improvements to the treatment of lying snow in RAL2 are achieved by introducing a representation of melting of the snow pack from the base over warm ground, as the original code in JULES allows melting only from the surface. Previously it was necessary to remove graupel from the precipitation reaching the surface as the omission of melting from the base resulted in unrealistically prolonged retention of thin layers of frozen precipitation. This modification allows the reintroduction of graupel into the precipitation reaching the surface.
In GL7.0 urban surfaces are represented by a single urban tile, but in RAL2 two separate tiles for street canyons and roofs are used for UK domains (Porson et al., 2010). Currently the two-tile scheme is limited to domains over the UK due to the availability of morphology data.
2.9 Lower boundary condition (ancillary files) and forcing data
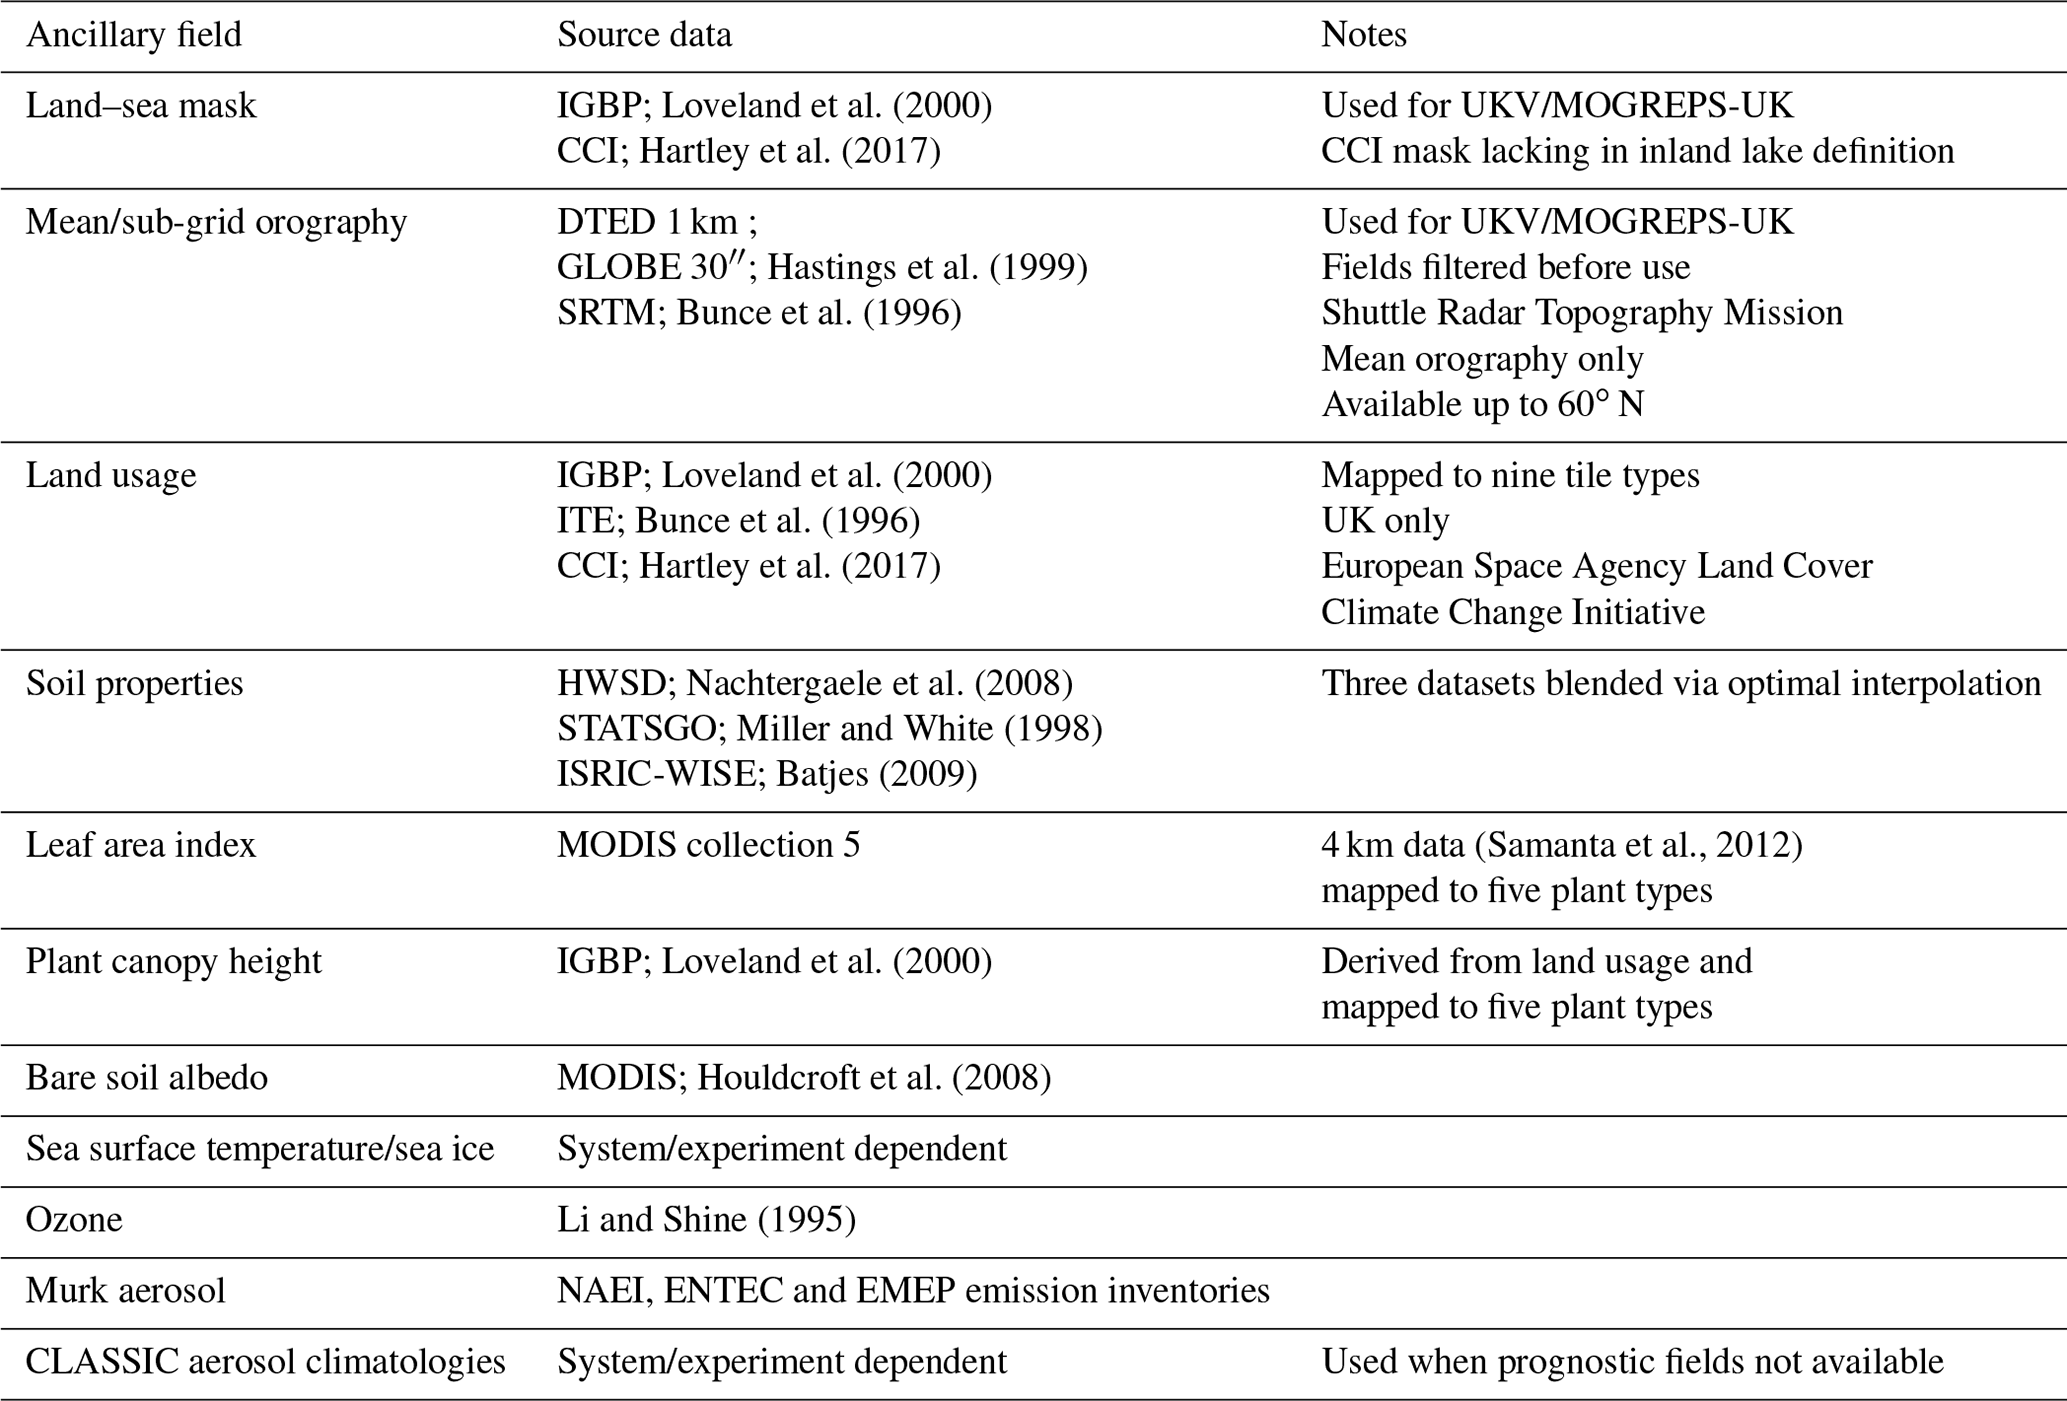
In the UM, the characteristics of the lower boundary, the values of climatological fields, and the distribution of natural and anthropogenic emissions are specified using ancillary files. Table A1 in the Appendix contains the main ancillaries used in RAL applications as well as references to the source data from which they are created.
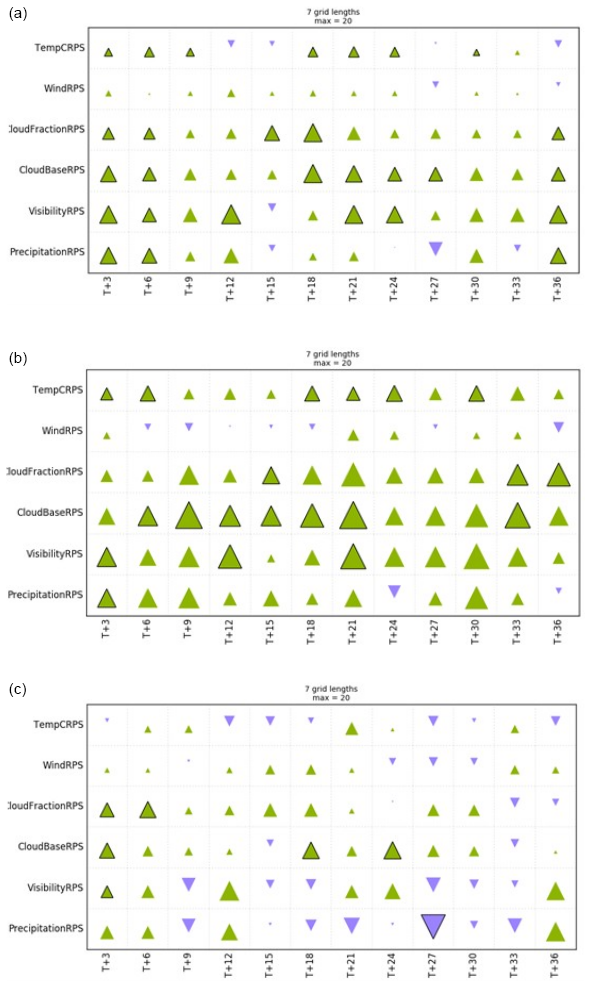
Figure 9 UKV case studies: RAL2-M vs. RAL1-M HiRA summary scorecard at 10.5 km (seven grid lengths) spatial scale. Panel (a) shows results for all cases. The seasonal dependence is explored by stratifying the cases into winter cases (b) and summer cases (c).
In this section we demonstrate the performance of RAL2 compared to the baseline of RAL1.
The Regional Model Evaluation and Development (RMED) team at the Met Office carry out scientific research and technical developments to improve current and next-generation regional modelling systems. RMED develops and delivers regional model configurations (e.g. RAL2) for use in weather forecasting and climate prediction; develops tools and methods for effective model evaluation; evaluates and develops next-generation convective-scale models; and builds, tests and evaluates the science of coupled regional modelling systems.
Regional model development, evaluation and application is coordinated across the UM partnership to enhance the research conducted and ensure that the RAL configurations that underpin weather and climate applications are suitable for UM partner needs. In this section we have focused on performance of RAL2 over the UK, Australia and India. This allows us to assess the model behaviour in diverse climatic zones and for different weather phenomena. We give only a brief description of the evaluation metrics and the “RMED Toolbox”, as a more detailed description can be found in Bush et al. (2020).
A range of evaluation methods are required to assess the performance. Verification skill scores, diagnostic plots and case studies all provide useful information on model characteristics and skill. The “High Resolution Assessment” (HiRA) framework (Mittermaier, 2014) provides a spatial and inherently probabilistic framework for evaluating kilometre-scale models. HiRA uses synoptic observations and a neighbourhood of model grid points centred on observation locations. The HiRA continuous ranked probability score (CRPS) is used for temperature, and the ranked probability score (RPS) is used for non-normally distributed or spatially discrete variables such as precipitation.
Precipitation is also evaluated using the fractions skill score (FSS; Roberts and Lean, 2008). The FSS requires a spatial observation-based analysis; over the UK this is a radar-based analysis, whilst in the tropics (for example in South East Asia) a Global Precipitation Measurement (GPM) IMERG satellite data-based product (Huffman, 2015, 2017; Skofronick-Jackson et al., 2017) is used.
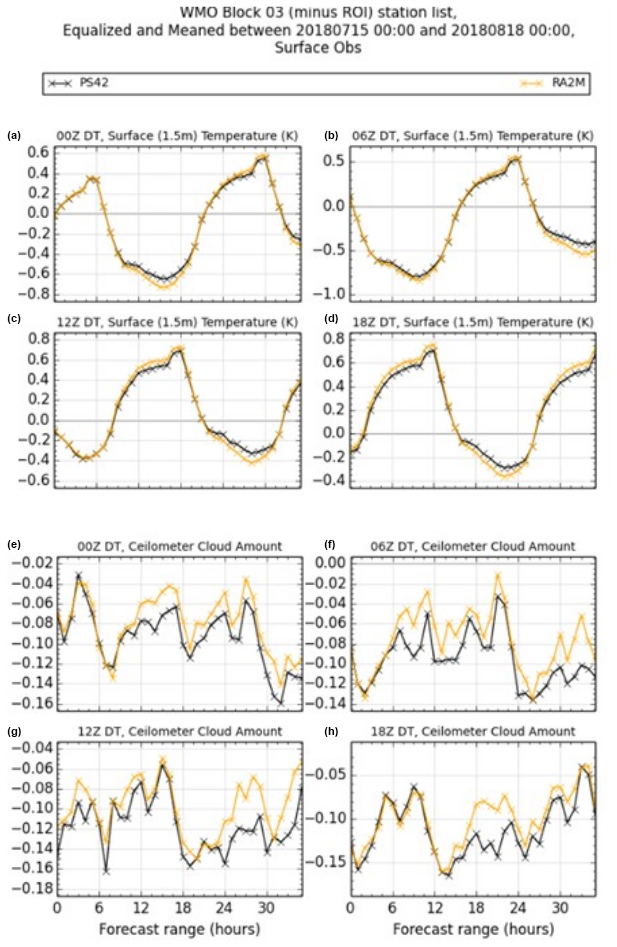
Figure 10 The 4D-Var trials: diurnal cycle of screen temperature bias (a–d) and cloud bias (against ceilometer cloud obs) (e–h) in summer for RAL1 (black) and RAL2 (orange).
3.1 The Regional Model Evaluation and Development (RMED) Toolbox
The main purpose of the RMED toolbox is to ensure a uniformity of verification and diagnostic output across multiple users and institutions. One of the outputs of the toolbox is a “scorecard” – a single clear plot with arrows and triangles showing whether the model version being tested is better or worse than a previous incarnation. Triangles pointing upward (green) indicate that the test model is better than the control, and downward (purple) triangles indicate the control model is better. The area of the triangles is proportional to the absolute improvement (or deterioration) of the model, and the triangles are outlined in black if the change is statistically significant at the 0.05 level determined using the Wilcoxon signed-rank test. The scorecards contain a huge amount of information, digested into an easy-to-understand summary, allowing fast assessments about model skill to be made. The scorecards presented in this paper use a spatial scale of 10.5 km for the UKV, 15 km for MOGREPS-UK and 30 km for the South East Asia cases, and these all correspond to seven grid lengths. This particular scale was chosen for evaluation as Mittermaier and Csima (2017) showed that all variables benefited from the use of at least a 3×3 neighbourhood, whilst neighbourhoods which are too large may be detrimental for some variables, including temperature. Other outputs include domain (area) average plots, histograms and “cell statistics” (Hanley et al., 2015).
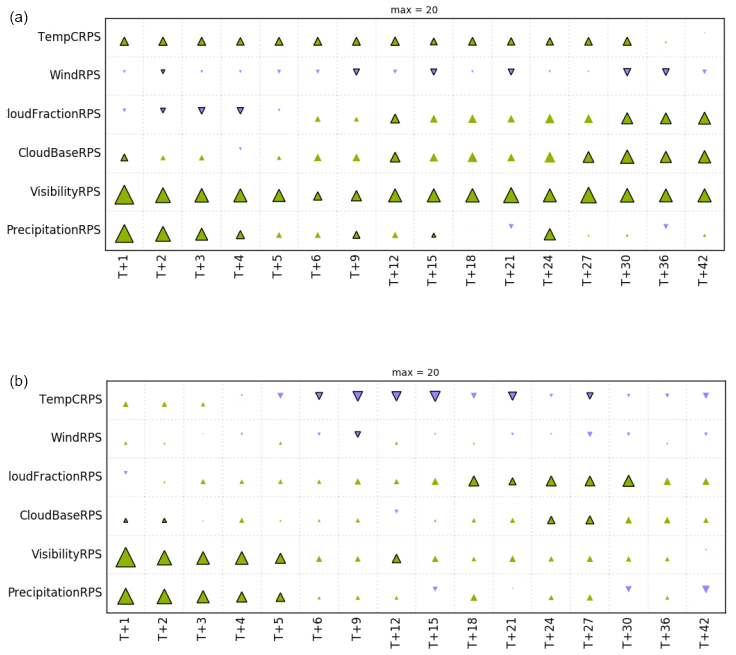
Figure 11 MOGREPS-UK trials: RAL2-M vs. RAL1-M HiRA summary scorecard at 15 km (seven grid lengths) spatial scale for winter (a) and summer (b).
3.2 Performance of individual science changes
In this section we illustrate the impact of the RAL2 changes on model performance. The baseline used for the UK and mid-latitudes is RAL1-M. Individual science changes (see list of RMED tickets in Table A3) were tested by running 100 case studies with a 1.5 km horizontal grid length, using the same domain as the operational UKV model (Fig. 1). Figures 3 to 8 show results from these 100 cases, which were downscaling runs (from the Met Office global model) with no data assimilation. The cases sampled a wide range of meteorological conditions from the period July 2014 to April 2017 and comprised roughly equal numbers from each season. The cases were a mixture of poor forecasts (as identified by forecasters), high-impact weather and normal everyday weather.
Case studies were also run for a domain over Darwin, Australia, in order to assess performance in the tropics. The model was run twice per day from 21 January to 17 March 2017, giving 112 cases in total. Darwin is the preferred location for tropical testing as there are observations from the Darwin C-band polarimetric radar which collects 3D observations out to a range of 150 km (Louf et al., 2018), which allows for a detailed evaluation of simulated tropical convection. Figure 2 shows the domain the radar covers and the area over which the comparison with the model is done.
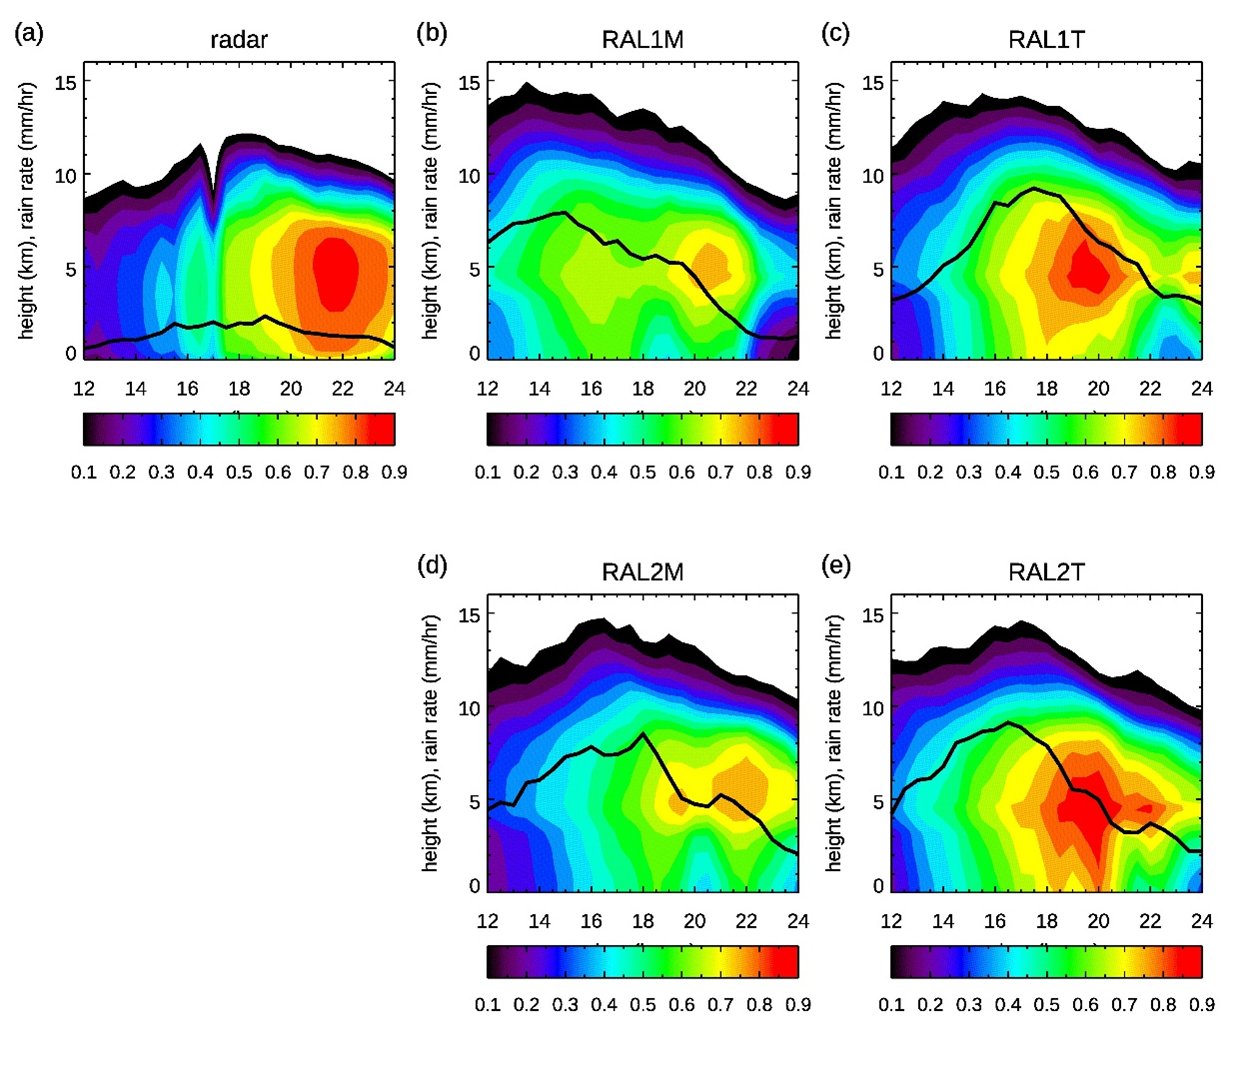
Figure 12 Fraction of radar area covered by reflectivities greater than 10 dBZ as a function of height and time (coloured contours) from 12:00 to 24:00 UTC on 18 February 2014. Solid lines are the time series of the domain mean rain rate (mm h−1).
Figure 3 shows a case study from 18 November 2016 in which a thin layer of graupel over SW England in the operational UKV forecast (RAL1) motivated an emergency change to remove graupel at the surface being seen by JULES. Ticket 20 (improvements to the treatment of lying snow; see Sect. 2.8) includes graupel and applies existing code for melting below needle-leaved trees, instantaneously melting if soil is above freezing. It removes the spurious very thin snow shown in RAL1, leading to a warming in those areas (e.g. over Ireland, Wales, South West England and northern France). Figure 4 shows scorecard verification for Ticket 20 with screen temperature and visibility showing statistically significant improvements.
Figure 5 shows scorecard verification for Ticket 27 (Leonard terms; see Sect. 2.7). The overall impact is neutral, with a slight improvement to cloud base height and a slight detriment to visibility. The top panel in Fig. 6 shows the histogram of rain rates and shows a reduction in high rates above 10 mm h−1. The middle panel in Fig. 6 shows the frequency of occurrence of precipitation in a convective cell. The frequency is reduced for all rates, and this is in closer agreement with GPM observations for lower rates but worse agreement at higher rates. The bottom panel in Fig. 6 shows there are fewer small cells, showing better agreement with GPM observations.
Figure 7 shows scorecard verification for Ticket 38 (improved ice cloud fraction in mixed phase clouds; see Sect. 2.6). There is a detriment to screen temperature and improvement to cloud fraction, visibility and precipitation. Figure 8 shows medium and low cloud amounts are increased.
Whilst tickets 20, 27 and 38 had a positive impact over the UK, there was a neutral impact over Darwin (hence no results shown in this section). Likewise no results are shown from tickets 30, 36, 37, 39, 42 and 43 as their impact was neutral, showing no statistically significant changes in performance over either the UK or the Darwin domains. Based on these results, the decision was taken to combine the tickets together into a package of changes referred to as RAL2-M in the mid-latitudes and RAL2-T in the tropics.
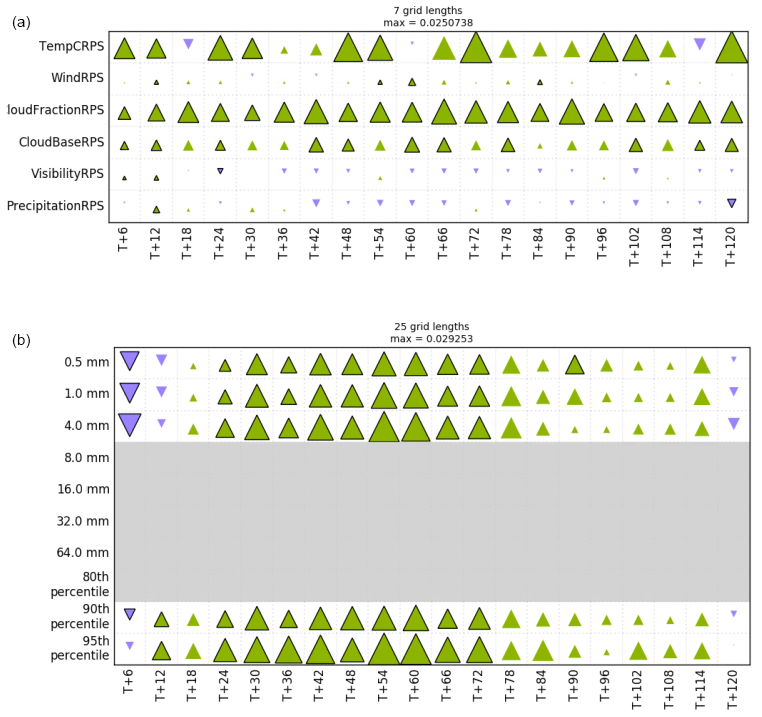
Figure 13 RAL2-T vs. RAL1-T HiRA summary scorecard at 30 km (7 grid lengths) spatial scale (a) and FSS summary scorecard at 110 km (25 grid lengths) for precipitation (b).
3.3 Mid-latitude performance of RAL2 case studies over the UK
Figure 9 shows scorecard verification for RAL2-M vs. RAL1-M for the 100 UKV cases described in the previous section. There is improvement to all variables with statistically significant results at seven grid lengths for temperature, cloud (fraction and base), visibility and precipitation. Stratifying the cases by season reveals that the improvement in performance in winter, where almost all parameters are improved (Fig. 9 middle panel), is much greater than the improvement in performance in summer (Fig. 9 bottom panel). The signals noted in Sect. 3.2 are also seen in the RAL2 case studies, with an increase in medium and low cloud, cooler temperatures by day in summer, and decreased precipitation amounts associated with a reduction in the frequency of heavier rates (not shown).
3.4 Mid-latitude performance of RAL2 data assimilation trials over the UK
RAL2 was tested with the operational 4D-Var data assimilation system (Milan et al., 2020) in use at the time (known as Operational Suite 42, OS42). This was operational from 19 March to 4 December 2019. It was decided that RAL2 would be aimed at the next Parallel Suite (known as Parallel Suite 43, PS43), which would eventually become operational on 4 December 2019 (and be known as Operational Suite 43, OS43). It was also decided that despite RAL2 being defined as using a L90(67t,23s)40 level set, the implementation of RAL2 in the Parallel Suite would retain the L70(61t,9s)40 level set due to the extra cost of the L90(67t,23s)40 level set.
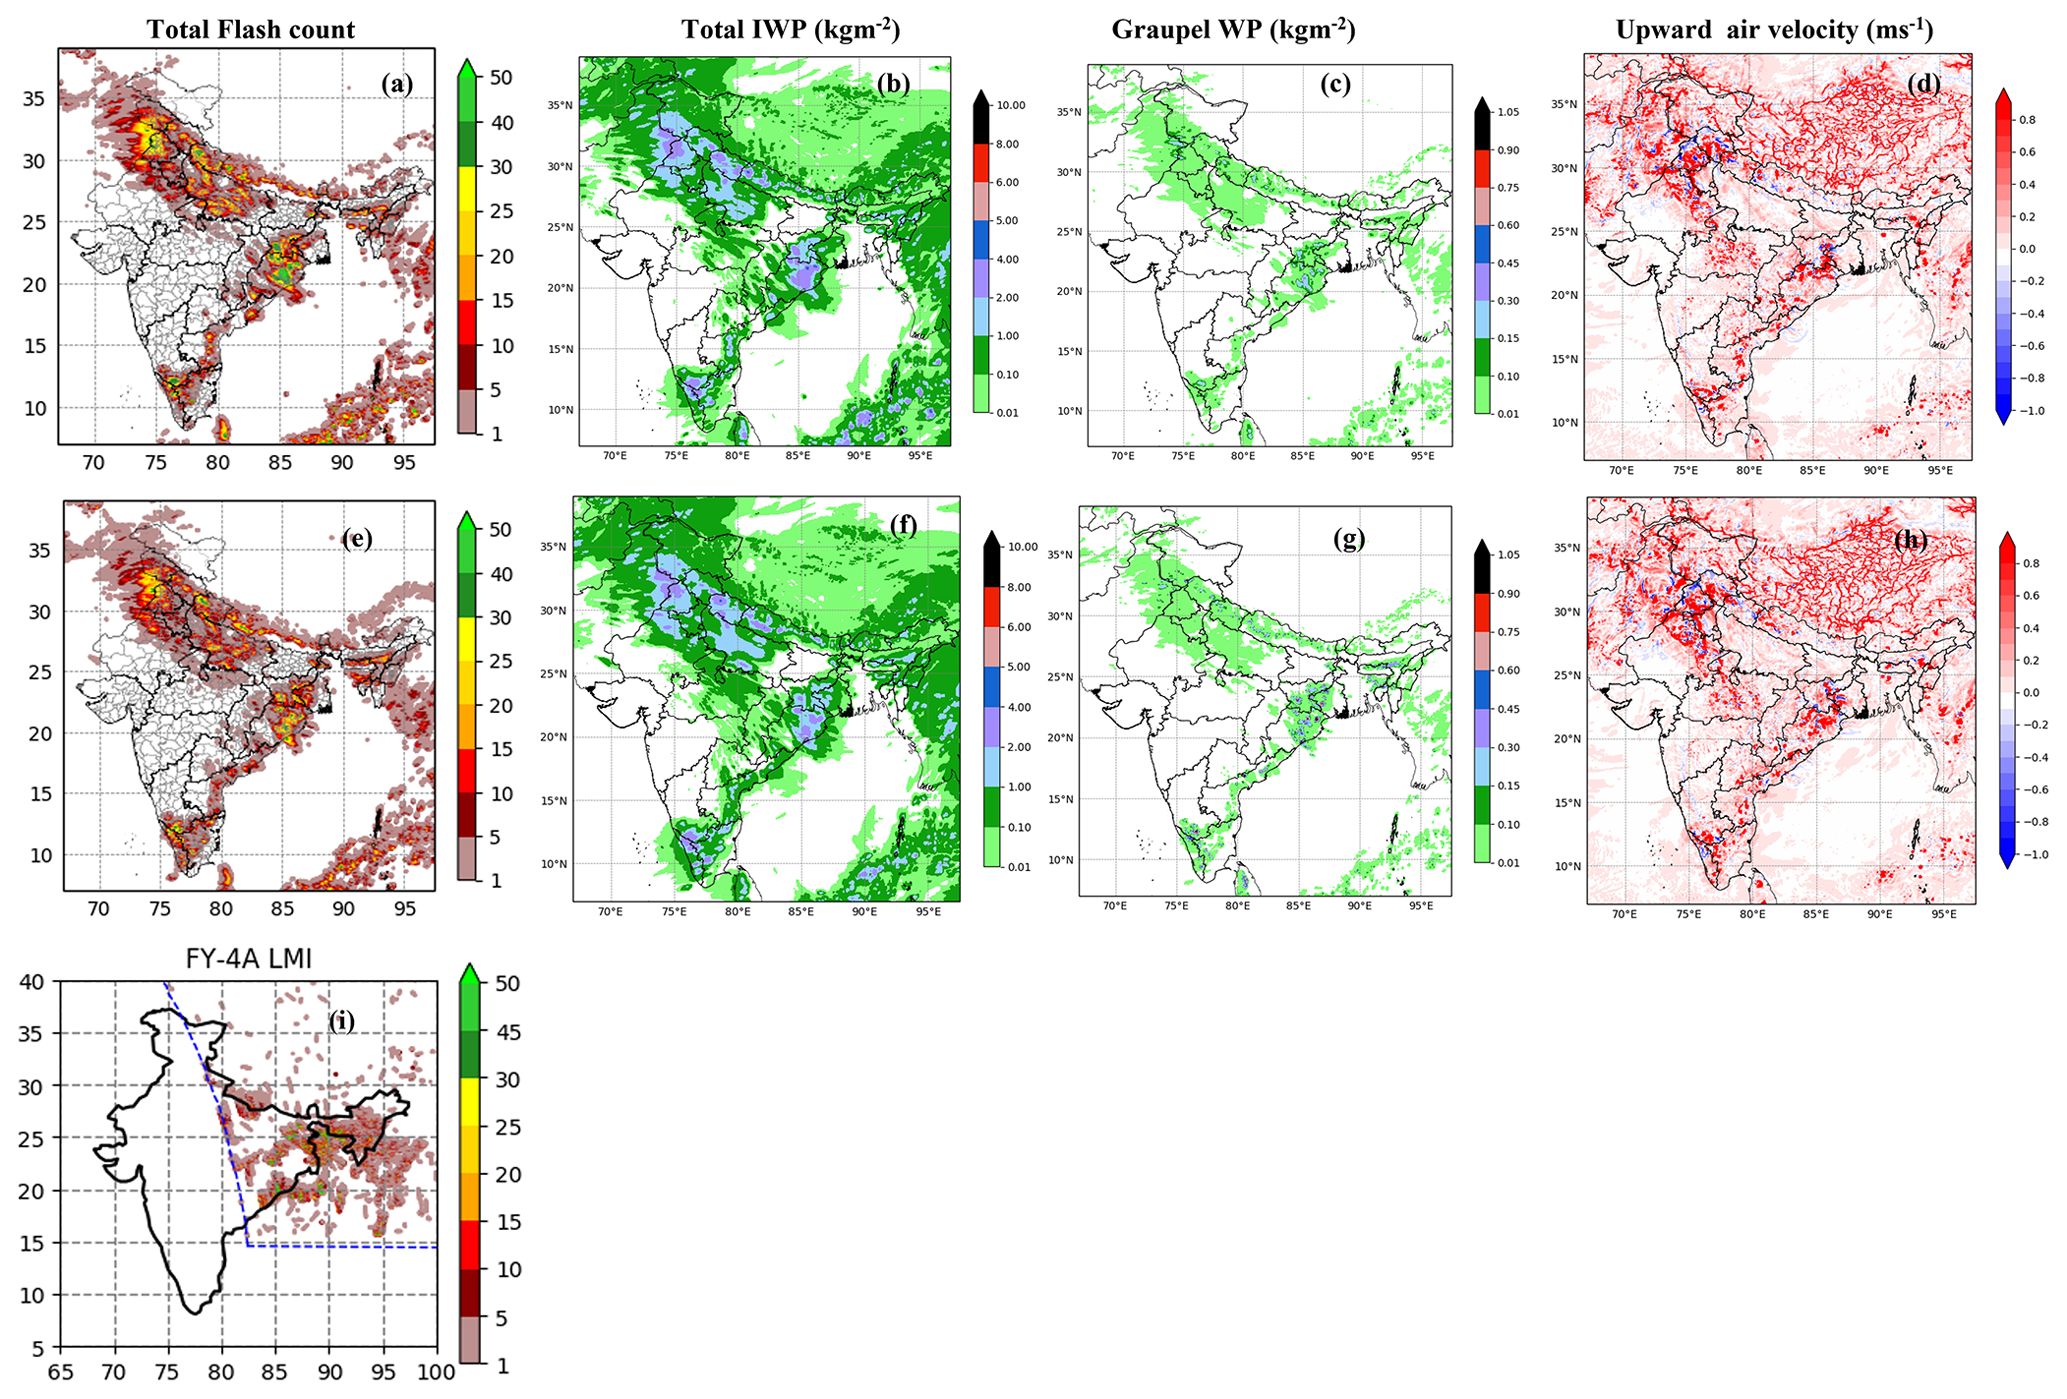
Figure 14 NCMRWF 2 May 2018 lightning case study: RAL1 (top) and RAL2 (middle). Panels (a)–(e) are total lightning flashes, panels (b)–(f) are total ice water path, panels (c)–(g) are total graupel water path, and panels (d)–(h) are vertical velocity at 500 hPa. Panel (i) is accumulated lightning flash counts from FY-4A LMI observations.
The UKV 4D-Var winter trial was run for 38 days of the winter 2017 period (1 December 2017 to 8 January 2018) and 8 weeks of the summer 2018 period (15 July to 18 August 2018). Figure 10 shows the bias for screen temperature and cloud amount vs. lead time for 00:00, 06:00, 12:00 and 18:00 UTC runs in summer. There is a good correlation between the cooler temperatures by day in RAL2 (which verifies worse) and the increased cloud cover (which verifies better, reducing a negative bias).
3.5 Mid-latitude performance of RAL2 MOGREPS-UK trials over the UK
At OS41, the MOGREPS-UK ensemble system is a 2.2 km horizontal grid length, 6 h cycling, 12-member ensemble driven by MOGREPS-G LBCs and centred around the UKV analysis. Initial condition uncertainty is sampled by adding perturbations from MOGREPS-G members, and forecast uncertainty is sampled by the random parameter (RP) scheme (McCabe et al., 2016) to perturb the model physics. At OS42 the MOGREPS-UK system moved to an hourly cycling system, and although both OS41 and OS42 MOGREPS-UK trials have been run with RAL2, only results from the OS41 runs are shown.
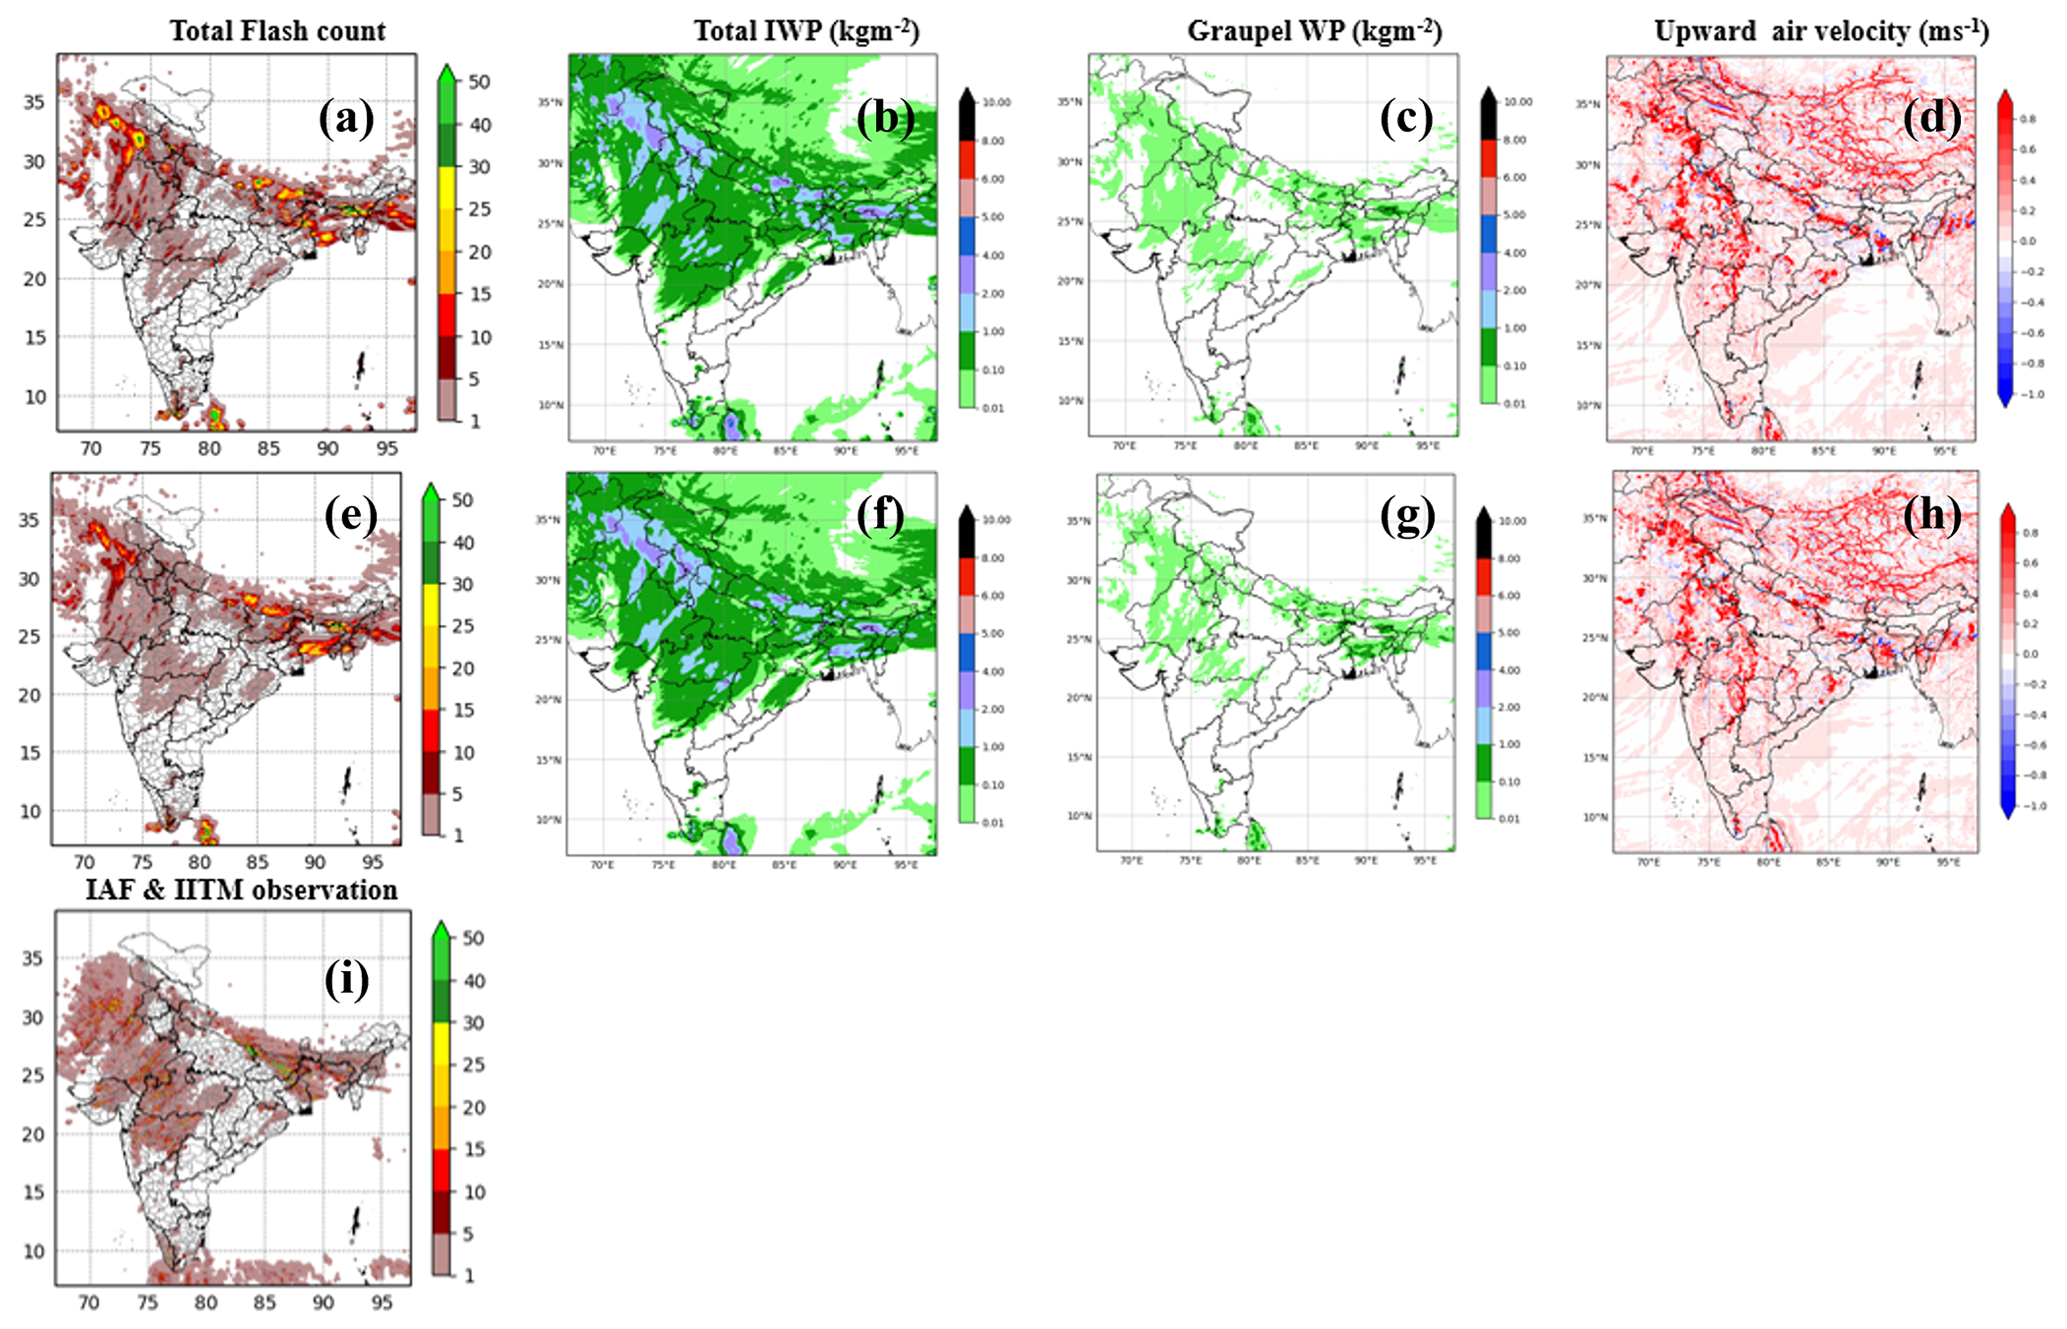
Figure 15 NCMRWF 16 April 2019 lightning case study: RAL1 (top) and RAL2 (middle). Panels (a)–(e) are total lightning flashes, panels (b)–(f) are total ice water path, panels (c)–(g) are total graupel water path, and panels (d)–(h) are vertical velocity at 500 hPa. Panel (i) is accumulated lightning flash counts from IAF and IITM observations.
The MOGREPS-UK trials were run for 1 month in summer 2017 (2 July to 2 August 2017) and 1 month in winter 2017–2018 (2 December 2017 to 2 January 2018). Figure 11 shows RAL2 outperforms RAL1 in winter with improvements to screen temperature, cloud base height, visibility and precipitation. There is a detriment to wind which is statistically significant at a number of forecast ranges. There is a detriment to cloud fraction at early forecast ranges to T+4 but an improvement from T+12 onwards. In summer, RAL2 also outperforms RAL1 with improvements to cloud fraction, cloud base height, visibility and precipitation. There is a detriment to screen temperature, whilst wind shows a neutral signal.
The MOGREPS-UK verification results are consistent with the results from the case studies (Sect. 3.3) and the UKV DA trials (Sect. 3.4). The improvement in performance in winter is much better than the improvement in performance in summer.
3.6 Mid-latitude performance – Perth (Australia) fog case
The Australian evaluation was carried out at BoM in Australia and consisted of running eight case studies over various domains with a 1.5 km horizontal grid length. Here and in the next section, we discuss two of the eight cases.
Fog was observed at Perth Airport between 16:00–23:00 UTC on 29 August 2017 (01:00–07:00 local time on 30 August 2017). The tropical configurations RAL1-T and RAL2-T have more extensive fog than mid-latitude configurations RAL1-M and RAL2-M with little difference between RAL1 and RAL2 (not shown). It should be noted that some parameters in the visibility diagnostic have been tuned at BoM to better suit fog conditions in Australia. Mid-latitude configurations have more low clouds and fewer high clouds and are warmer and drier than tropical configurations through the evening transition and night-time minimum.
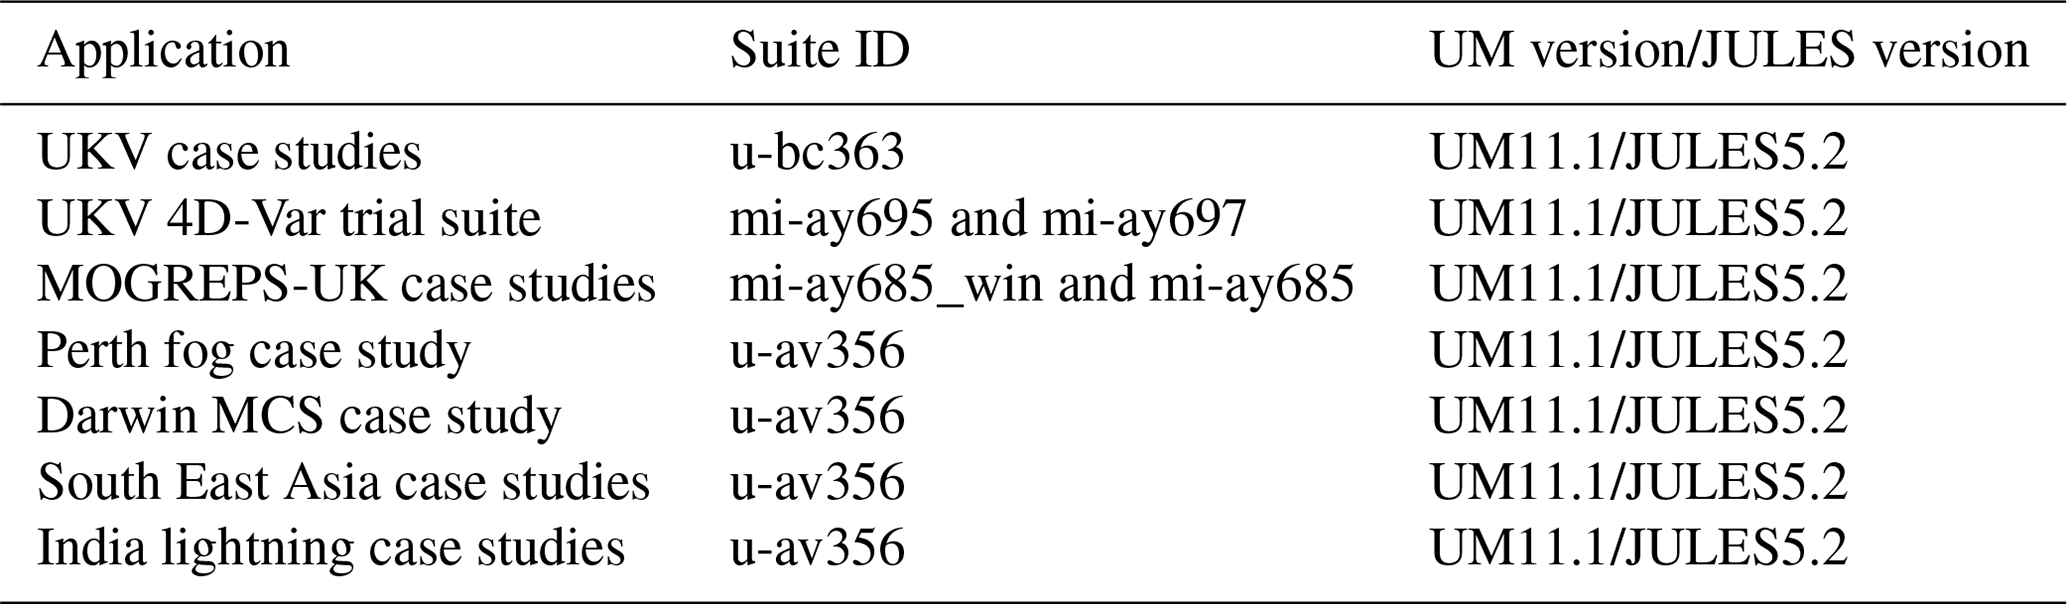
Table 3 Identifiers for a set of RAL2 reference simulations across a number of systems and/or applications. These suites are held on the Met Office Science Repository Service, which also holds the UM and JULES code.
3.7 Tropical performance – Darwin MCS case
The case studied is the 18 February 2014 where active monsoon conditions produced a mesoscale convective system (MCS). The observed and modelled MCS life cycle is illustrated in Fig. 12, which shows the fractional area of the radar domain covered by reflectivities greater than 10 dBZ as a function of height and time over a 12 h period. The observations come from the Darwin C-band polarimetric radar, which collects 3D observations out to a range of 150 km (Louf et al., 2018), which allows for a detailed evaluation of simulated tropical convection. (Figure 2 shows the domain the radar covers and the area over which the comparison with the model is done.)
From 12:00–15:00 UTC scattered convection was observed around Darwin, and by 17:00 UTC the convection had become organised. Throughout this time, all the configurations produce too much cloud cover, deeper clouds and more rainfall in the domain than was observed by the radar. The largest difference between RAL2-M and RAL2-T is the greater area covered by cloud and rain in the RAL2-T simulation from 18:00 UTC. This corresponds to the time when the MCS matured and had an extensive stratiform cloud region. The largest fractional areal coverage is 0.9 in the RAL2-T simulation, which agrees with the observed value, albeit the simulated maximum being a couple of hours too early. Compared to RAL1-T, RAL2-T shows improvements in the larger areal coverage of rain below the melting level and the fractional coverage >0.8 being simulated for a longer time period out to 22:30 UTC, as compared to 21:00 UTC in RAL1-T and 23:30 UTC in the observations.
3.8 Tropical performance – South East Asia cases
The South East Asia evaluation was carried out as part of a Weather and Climate Science for Service Partnership (WCSSP) South East Asia project at the Met Office and consisted of near-real-time running of a 4.4 km horizontal grid-length model for a large domain covering Indonesia, Singapore, Malaysia and the Philippines. The model was run twice per day from 20 November through to 17 December 2018, giving a total of 56 cases. Figure 13 shows RAL2-T outperforms RAL1-T with improvements to screen temperature, cloud fraction, cloud base height and wind. FSS results (Fig. 13 bottom panel) show a significant improvement to precipitation at all thresholds between T+24 and T+72 and a smaller improvement out to T+114. The only degradation is seen in the first few hours of the forecast when convective-scale structures are still spinning up from global model initial fields at T+0.
3.9 Tropical performance – two Indian lightning cases
The Indian evaluation was carried out at NCMRWF in India and consisted of a number of case study runs with a 4.0 km horizontal grid-length model covering all India and looking primarily at rainfall and lightning. Here, we discuss two fairly intense lightning cases. The lightning flash counts by RAL2 were underestimated compared to RAL1, and hence a tuning was carried out by reducing the graupel water path (GWP) threshold for the storm detection from 200 to 100 g m−2, which has enhanced the flash counts on par with RAL1 values.
The cases studied are (i) 2 May 2018, where widespread lightning occurred associated with an MCS over the northern sector of Indian Great Plains, and (ii) 16 April 2019, a case of strong western disturbance causing widespread rainfall over north-central and north-west India. The first case did not have enough coverage of observations over the entire Indian region to verify, except Chinese satellite FY-4A LMI (Lightning Mapping Imager) covering only the eastern sector of India. However, the second case has lightning observations coming from two sources, i.e., Indian Institute of Tropical Meteorology (IITM) and Indian Air Force (IAF) Earth Networks Lightning Sensor (ENLS) datasets, which are merged and binned at 4 km resolution.
Figure 14e shows that RAL2-T has slightly fewer total lightning flashes compared to RAL1-T (Fig. 14a). This is due to a reduction in both the GWP (Fig. 14f compared to Fig. 14b) and ice water path (Fig. 14g compared to Fig. 14c). Although the vertical velocity (updraught) in RAL2 (Fig. 14h) is higher than RAL1 (Fig. 14d) over some pockets, this appears to be of secondary importance on the flash rate compared to graupel or cloud frozen ice content (QCF).
The second case shows a fairly good match between the model (Fig. 15a–h) and observations (Fig. 15i) for both RAL1 and RAL2. The observations (Fig. 15i) show very few intense hotspots for the second case with the counts extending even up to 50 over the foothills of Bihar and Uttar Pradesh (eastern India) and also very few flash strikes over the Rajasthan–Madhya Pradesh border (north-western India). RAL1 (Fig. 15a) and RAL2 (Fig. 15e) both show a fairly good match over the Himalayan region but with a slight shift towards the upper slopes, while the central Indian hotspots are missing in both simulations. The maximum flash counts are reduced from 40 in RAL1 (Fig. 15a) to 30 in RAL2 (Fig. 15e) with both simulations showing too large a coverage of the intense patch compared to observations.
In this paper we have defined the RAL2 science configuration of the regional Met Office Unified model. RAL2 is an important step in the development of kilometre grid-scale configurations of the Unified Model, and we define two sub-releases: one for mid-latitudes (RAL2-M) and one for tropical regions (RAL2-T). Results are presented from case studies with domains in both the mid-latitudes (UK and Perth in Australia) and the tropics (Darwin in Australia, South East Asia and India). Results are also presented from UKV data assimilation and MOGREPS-UK ensemble trials.
The recent science developments included in RAL2-M are shown to increase medium and low cloud amounts and decrease precipitation amounts (associated with a reduction in the frequency of heavier rates). The diurnal cycle of temperature sees a warming compared to RAL1 from early evening through the night-time period in winter, reducing a cold bias at this time. In summer, there is a reduction in maximum temperature in RAL2-M compared to RAL1-M, which worsens the cold bias. These temperature changes (warmer by night and cooler by day) are consistent with the increased cloud cover, which verifies better, reducing a negative bias. Visibility forecasts over the UK in winter are improved, although the simulation of a fog case at Perth Airport in Australia showed a similar performance to RAL1. There is a consistency in performance between individual science change tests (Sect. 3.2), RAL2 case studies (Sect. 3.3), data assimilation trials (Sect. 3.4) and MOGREPS-UK trials (Sect. 3.5).
RAL2-T outperforms RAL1-T in the South East Asia region of the tropics with significant improvement to precipitation at all thresholds between T+24 and T+72. There are also improvements to screen temperature, cloud fraction, cloud base height and wind. Results from other tropical tests over Darwin (Australia) and India show incremental changes to model behaviour.
At the Met Office, RAL2 was implemented operationally at Parallel Suite 43 (PS43) on 4 December 2019; to this day, RAL2-M science is used in the UKV and MOGREPS-UK weather forecast systems. Despite RAL2 being defined as using a L90(67t,23s)40 level set, the implementation of RAL2 in operational weather forecasting retains the L70(61t,9s)40 level set due to cost. Both level sets have a very similar number of near-surface levels with both having 28 levels below 3 km and L90(67t,23s)40 only having one extra level by 10 km a.s.l. As a consequence of this, the impact of L90(67t,23s)40 was found to be very small for this UK-specific application. Nevertheless it is currently planned to upgrade to the L90(67t,23s)40 level set in 2024 as part of the exploitation of a new HPC.
Looking ahead to RAL3, research effort is focused on producing a single defined configuration of the model that performs effectively in all regions of the world. This goal is hugely challenging and will require a concerted effort and coordination from the UM partnership developing the RAL configuration. In this paper we have shown a series of tests in a small number of regions that require substantial computational effort. For RAL3, we will need to develop a more extensive set of tests for the model that gives confidence that changes are generally improving the system. One very specific area which is not covered in this paper is the performance of the model in climate simulations. It remains a high priority to include climate testing in the development process of the regional model, although with the high computing costs involved in regional climate runs at the kilometre grid-scale system, the test will need careful design.
We list source datasets used to create standard ancillary files used in RAL2 in Table A1. We list abbreviations in Table A2.
Loveland et al. (2000)Hartley et al. (2017)Hastings et al. (1999)Bunce et al. (1996)Loveland et al. (2000)Bunce et al. (1996)Hartley et al. (2017)Nachtergaele et al. (2008)Miller and White (1998)Batjes (2009)(Samanta et al., 2012)Loveland et al. (2000)Houldcroft et al. (2008)Li and Shine (1995)Table A1 Source datasets used to create standard ancillary files used in RAL2.
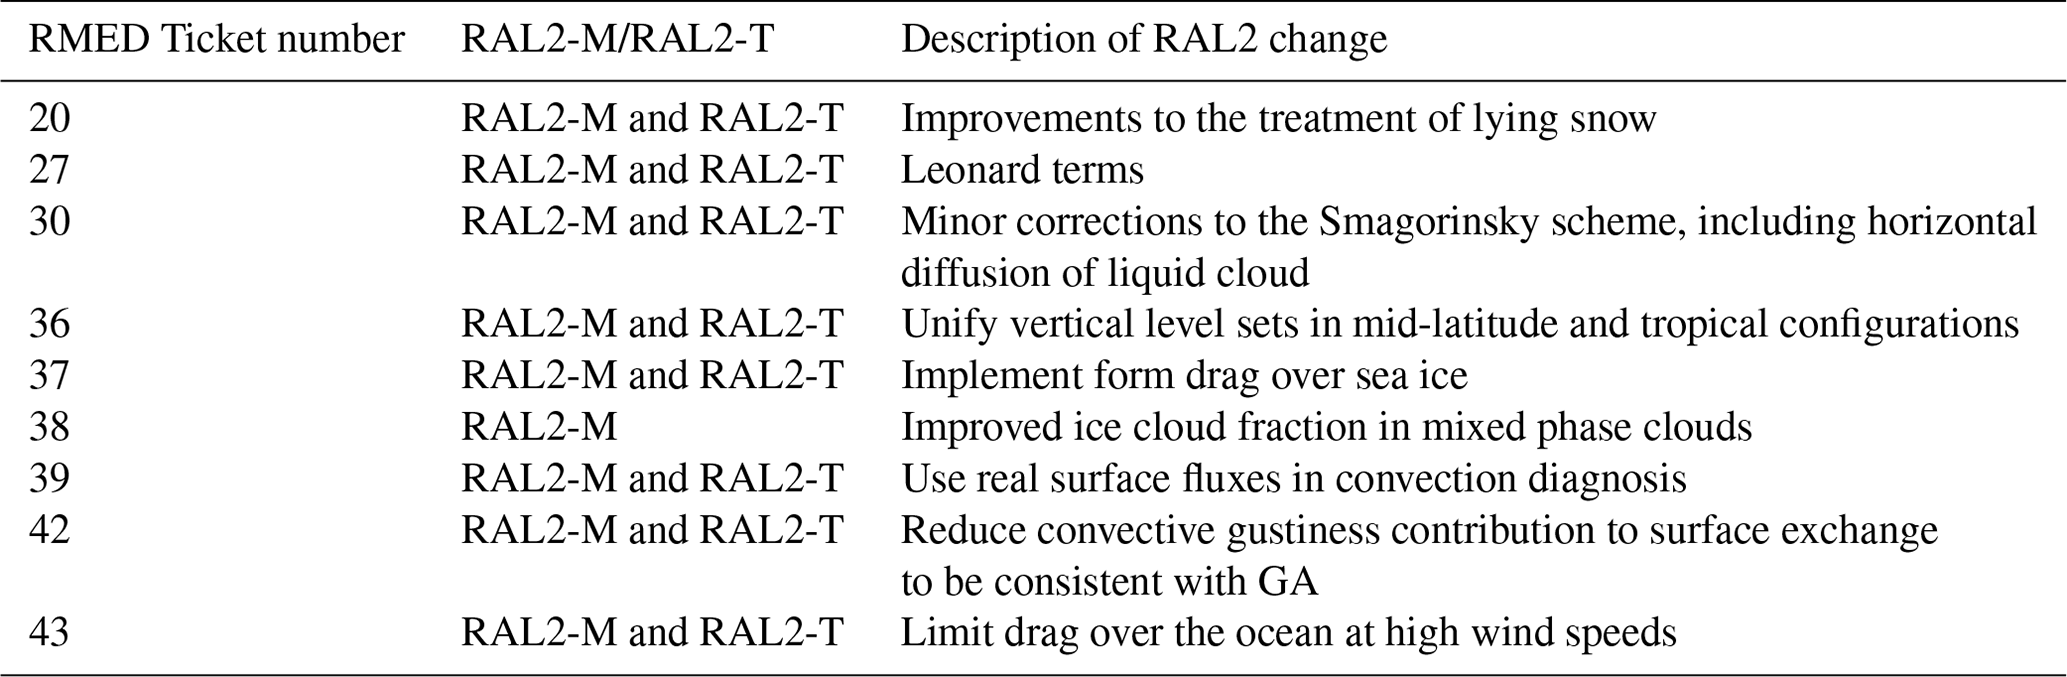
The Regional Model Evaluation and Development (RMED) processes at the Met Office makes use of an online “ticket” tracking system which allows scientists to document changes to the model. RMED tickets included in RAL2 are listed in Table A3. These are the RAL2 developments which when added to the RAL1 base define RAL2. The developments are ordered by ticket number to both inform the development community and for future cross-reference.
Due to intellectual property right restrictions, we cannot provide the source code or documentation papers for the UM. Obtaining the UM. The Met Office Unified Model (UM) is available for use under a closed licence agreement. A number of research organisations and national meteorological services use the UM in collaboration with the Met Office to undertake research, produce forecasts, develop the UM code, and build and evaluate models. For further information on how to apply for a licence, please get in contact with “scientific_partnerships@metoffice.gov.uk” or see http://www.metoffice.gov.uk/research/modelling-systems/unified-model (last access: 24 March 2023). UM documentation papers are accessible to registered users at https://code.metoffice.gov.uk/doc/um/latest/umdp.html (last access: 24 March 2023). Obtaining JULES. The JULES user manual is accessible via https://jules-lsm.github.io/ (last access: 24 March 2023), and JULES is available under licence free of charge. For further information on how to gain permission to use JULES for research purposes, see http://jules-lsm.github.io/access_req/JULES_access.html (last access: 24 March 2023). Details of the simulations performed. UM–JULES simulations are compiled and run in suites developed using the Rose suite engine (http://metomi.github.io/rose/doc/html/index.html, Met Office, 2023) and scheduled using the Cylc workflow engine (https://cylc.github.io/cylc, Oliver et al., 2019). Both Rose and Cylc are available under v3 of the GNU General Public License (GPL). In this framework, the suite contains the information required to extract and build the code as well as configure and run the simulations. Each suite is labelled with a unique identifier and is held in the same revision-controlled repository service in which we hold and develop the model code. Therefore these suites are available to any licensed user of both the UM and JULES. Obtaining FCM. The UM and JULES codes were built using the fcm_make extract and build system provided within the flexible configuration management (FCM) tools. UM and JULES codes and Rose suites were also configuration managed using this system. Further information is provided at http://metomi.github.io/fcm/doc/user_guide/ (last access: 24 March 2023). We document a set of reference RAL2-based simulations in Table 3.
Processed data used in the production of figures in this paper are available via https://doi.org/10.5281/zenodo.7745376 (Bush et al., 2023).
MB led the RAL2 testing and evaluation process and prepared the manuscript with contributions from all co-authors. IB, JE, KH and AL are either code owners and/or developers of the model code included in RAL2. IB, JE, AF, CF, KH, AJ, AL, SM, AP, BR, SW and MW performed the evaluation. MM and RN contributed to the writing of the model evaluation section.
The contact author has declared that none of the authors has any competing interests.
Publisher’s note: Copernicus Publications remains neutral with regard to jurisdictional claims in published maps and institutional affiliations.
The development and assessment of the Regional Atmosphere Land configurations is possible only through the hard work of a large number of people, which exceeds the list of authors. Specifically we would like to thank Chris Short (Met Office, Exeter, UK) for his work with the RMED Toolbox and Vinod Kumar for his efforts in installing/supporting the RMED Toolbox/RES at the Bureau of Meteorology (BoM), Melbourne, Victoria, Australia. The GPM IMERG Late Precipitation L3 Half Hourly V04 data were provided by the NASA/Goddard Space Flight Center's Goddard Earth Sciences Data and Information Services Center and PPS, which develop and compute the GPM IMERG Late Precipitation L3 Half Hourly as a contribution to GPM, and archived at the NASA GES DISC.
The research/project work of participants from the Bureau of Meteorology was undertaken with assistance of resources and services from the National Computational Infrastructure (NCI), which is supported by the Australian Government.
This paper was edited by Mohamed Salim and reviewed by three anonymous referees.
Abel, S. J., Boutle, I. A., Waite, K., Fox, S., Brown, P. R. A., Cotton, R., Lloyd, G., Choularton, T. W., and Bower, K. N.: The role of precipitation in controlling the transition from stratocumulus to cumulus clouds in a northern hemisphere cold-air outbreak, J. Atmos. Sci., 74, 2293–2314, https://doi.org/10.1175/JAS-D-16-0362.1, 2017. a, b, c
Baldauf, M., Seifert, A., Forstner, J., Majewski, D., Raschendorfer, M., and Reinhardt, T.: Operational Convective-Scale Numerical Weather Prediction with the COSMO Model: Description and Sensitivities, Mon. Weather Rev., 139, 3887–3905, https://doi.org/10.1175/MWR-D-10-05013.1, 2011. a
Barker, H. and Li, Z.: Improved simulation of clear-sky radiative transfer in the CCC-GCM, J. Climate, 8, 2213–2223, https://doi.org/10.1175/1520-0442(1995)008<2213:ISOCSS>2.0.CO;2, 1995. a
Batjes, N. H.: Harmonized soil profile data for applications at global and continental scales: updates to the WISE database, Soil Use Manage., 25, 124–127, https://doi.org/10.1111/j.1475-2743.2009.00202.x, 2009. a
Bengtsson, L., Andrae, U., Aspelien, T., Batrak, Y., Calvo, J., de Rooy, W., Gleeson, E., Hansen-Sass, B., Homleid, M., Hortal, M., Ivarsson, K.-I., Lenderink, G., Niemela, S., Nielsen, K. P., Onvlee, J., Rontu, L., Samuelsson, P., Munoz, D. S., Subias, A., Tijm, S., Toll, V., Yang, X., and Koltzow, M. O.: The HARMONIE-AROME model configuration in the ALADIN-HIRLAM NWP system, Mon. Weather Rev., 145, 1919–1935, https://doi.org/10.1175/MWR-D-16-0417.1, 2017. a
Berthou, S., Kendon, E., Chan, S., Ban, N., Leutwyler, D., Schar, C., and Fosser, G.: Pan-European climate at convection-permitting scale: a model intercomparison study, Clim. Dynam., 55, 35–59, https://doi.org/10.1007/s00382-018-4114-6, 2018. a
Best, M. J., Pryor, M., Clark, D. B., Rooney, G. G., Essery, R. L. H., Ménard, C. B., Edwards, J. M., Hendry, M. A., Porson, A., Gedney, N., Mercado, L. M., Sitch, S., Blyth, E., Boucher, O., Cox, P. M., Grimmond, C. S. B., and Harding, R. J.: The Joint UK Land Environment Simulator (JULES), model description – Part 1: Energy and water fluxes, Geosci. Model Dev., 4, 677–699, https://doi.org/10.5194/gmd-4-677-2011, 2011. a, b
Bodas-Salcedo, A., Williams, K. D., Field, P. R., and Lock, A. P.: The surface downwelling solar radiation surplus over the Southern Ocean in the Met Office model: the role of midlatitude cyclone clouds, J. Climate, 25, 7467–7486, https://doi.org/10.1175/JCLI-D-11-00702.1, 2012. a
Boutle, I. A. and Morcrette, C. J.: Parametrization of area cloud fraction, Atmos. Sci. Lett., 11, 283–289, https://doi.org/10.1002/asl.293, 2010. a
Boutle, I. A., Eyre, J. E. J., and Lock, A. P.: Seamless stratocumulus simulation across the turbulent gray zone, Mon. Weather Rev., 142, 1655–1668, https://doi.org/10.1175/MWR-D-13-00229.1, 2014. a, b
Brousseau, P., Seity, Y., Ricard, D., and Leger, J.: Improvement of the forecast of convective activity from the AROME-France system, Q. J. Roy. Meteor. Soc., 142, 2231–2243, https://doi.org/10.1002/qj.2822, 2016. a
Brown, A., Milton, S., Cullen, M., Golding, B., Mitchell, J., and Shelly, A.: Unified modeling and prediction of weather and climate: a 25 year journey, B. Am. Meteor. Soc., 93, 1865–1877, https://doi.org/10.1175/BAMS-D-12-00018.1, 2012. a
Brown, A. R.: The sensitivity of large-eddy simulations of shallow cumulus convection to resolution and sub-grid model, Q. J. Roy. Meteor. Soc., 125, 469–482, https://doi.org/10.1002/qj.49712555405, 1999. a, b
Bunce, R., Barr, C., Gillespie, M., and Howard, D.: The ITE Land Classification: Providing an Environmental Stratification of Great Britain, Environ. Monit. Assess., 39, 39–46, https://doi.org/10.1007/BF00396134, 1996. a, b
Bush, M., Allen, T., Bain, C., Boutle, I., Edwards, J., Finnenkoetter, A., Franklin, C., Hanley, K., Lean, H., Lock, A., Manners, J., Mittermaier, M., Morcrette, C., North, R., Petch, J., Short, C., Vosper, S., Walters, D., Webster, S., Weeks, M., Wilkinson, J., Wood, N., and Zerroukat, M.: The first Met Office Unified Model–JULES Regional Atmosphere and Land configuration, RAL1, Geosci. Model Dev., 13, 1999–2029, https://doi.org/10.5194/gmd-13-1999-2020, 2020. a, b, c, d, e
Bush, M., Boutle, I., Edwards, J., Finnenkoetter, A., Franklin, C., Hanley, K., Jayakumar, A., Lewis, H., Lock, A., Mittermaier, M., Mohandas, S., North, R., Porson, A., Roux, B., Webster, S., and Weeks, M.: The second Met Office Unified Model-JULES Regional Atmosphere and Land configuration, RAL2, Zenodo [data set], https://doi.org/10.5281/zenodo.7745376, 2023. a
Clark, D. B., Mercado, L. M., Sitch, S., Jones, C. D., Gedney, N., Best, M. J., Pryor, M., Rooney, G. G., Essery, R. L. H., Blyth, E., Boucher, O., Harding, R. J., Huntingford, C., and Cox, P. M.: The Joint UK Land Environment Simulator (JULES), model description – Part 2: Carbon fluxes and vegetation dynamics, Geosci. Model Dev., 4, 701–722, https://doi.org/10.5194/gmd-4-701-2011, 2011. a, b
Cotton, R. J., Field, P. R., Ulanowski, Z., Kaye, P. H., Hirst, E., Greenaway, R. S., Crawford, I., Crosier, J., and Dorsey, J.: The effective density of small ice particles obtained from in situ aircraft observations of mid-latitude cirrus, Q. J. Roy. Meteor. Soc., 139, 1923–1934, https://doi.org/10.1002/qj.2058, 2013. a
Davies, H. C.: A lateral boundary formulation for multi-level prediction models, Q. J. Roy. Meteor. Soc., 102, 405–418, 1976. a
Edwards, J. M. and Slingo, A.: Studies with a flexible new radiation code. I: Choosing a configuration for a large-scale model, Q. J. Roy. Meteor. Soc., 122, 689–719, https://doi.org/10.1002/qj.49712253107, 1996. a
Field, P. R., Heymsfield, A. J., and Bansemer, A.: Snow Size Distribution Parameterization for Midlatitude and Tropical Ice Clouds, J. Atmos. Sci., 64, 4346–4365, https://doi.org/10.1175/2007JAS2344.1, 2007. a
Hagelin, S., Son, J., Swinbank, R., McCabe, A., Roberts, N., and Tennant, W.: The Met Office convective-scale ensemble, MOGREPS-UK, Q. J. Roy. Meteor. Soc., 143, 2846–2861, https://doi.org/10.1002/qj.3135, 2017. a
Hanley, K., Plant, R., Stein, T., Hogan, R., Nicol, J., Lean, H., Halliwell, C., and Clark, P.: Mixing-length controls on high-resolution simulations of convective storms, Q. J. Roy. Meteor. Soc., 141, 272–284, https://doi.org/10.1002/qj.2356, 2015. a
Hanley, K., Whitall, M., Stirling, A., and Clark, P.: Modifications to the representation of subgrid mixing in kilometre-scale versions of the Unified Model, Q. J. Roy. Meteor. Soc., 145, 3361–3375, https://doi.org/10.1002/qj.3624, 2019. a, b
Hartley, A., MacBean, N., Georgievski, G., and Bontemps, S.: Uncertainty in plant functional type distributions and its impact on land surface models, Remote Sens. Environ., 203, 71–89, https://doi.org/10.1016/j.rse.2017.07.037, 2017. a, b
Hastings, D. A., Dunbar, P. K., Elphingstone, G. M., Bootz, M., Murakami, H., Maruyama, H., Masaharu, H., Holland, P., Payne, J., Bryant, N. A., Logan, T. L., Muller, J.-P., Schreier, G., and MacDonald, J. S.: The Global Land One-kilometer Base Elevation (GLOBE) Digital Elevation Model, Version 1.0, Digital data base on the World Wide Web, http://www.ngdc.noaa.gov/mgg/topo/globe.html (last access: 24 March 2023), 1999. a
Houldcroft, C., Grey, W., Barnsley, M., Taylor, C., Los, S., and North, P.: New vegetation albedo parameters and global fields of background albedo derived from MODIS for use in a climate model, J. Hydrometeorol., 10, 183–198, https://doi.org/10.1175/2008JHM1021.1, 2008. a
Huffman, G.: GPM IMERG Late Precipitation L3 Half Hourly 0.1 degree x 0.1 degree V05, Greenbelt, MD, Goddard Earth Sciences Data and Information Services Center (GES DISC), https://doi.org/10.5067/GPM/IMERG/3B-HH-L/05, 2015. a
Huffman, G.: GPM IMERG Final Precipitation L3 Half Hourly 0.1 degree x 0.1 degree V05, Greenbelt, MD, Goddard Earth Sciences Data and Information Services Center (GES DISC), https://doi.org/10.5067/GPM/IMERG/3B-HH/05, 2017. a
Kendon, E. J., Roberts, N. M., Fowler, H. J., Roberts, M. J., Chan, S. C., and Senior, C. A.: Heavier summer downpours with climate change revealed by weather forecast resolution model, Nat. Clim. Change, 4, 570–576, https://doi.org/10.1038/nclimate2258, 2014. a
Klasa, C., Arpagaus, M., Walser, A., and Wernli, H.: An evaluation of the convection-permitting ensemble COSMO-E for three contrasting precipitation events in Switzerland, Q. J. Roy. Meteor. Soc., 144, 744–764, https://doi.org/10.1002/qj.3245, 2018. a
Li, D. and Shine, K.: A 4-D ozone climatology for UGAMP models, Tech. rep., UGAMP, University of Reading, http://catalogue.ceda.ac.uk/uuid/bff84b935ce5aa9f04624777b0eea507 (last access: 24 March 2023), 1995. a
Lock, A. P.: Stable boundary layer modelling at the Met Office, in: ECMWF/GABLS workshop on “Diurnal cycles and the stable atmospheric boundary layer”, ECMWF, 7–10 November 2011, https://www.ecmwf.int/sites/default/files/elibrary/2012/10770-stable-bounday-layer-modelling-met-office.pdf (last access: 24 March 2023), 2012. a
Lock, A. P., Brown, A. R., Bush, M. R., Martin, G. M., and Smith, R. N. B.: A new boundary layer mixing scheme. Part I: Scheme description and single-column model tests, Mon. Weather Rev., 128, 3187–3199, https://doi.org/10.1175/1520-0493(2000)128<3187:ANBLMS>2.0.CO;2, 2000. a, b, c
Louf, V., Protat, A., Jakob, C., Warren, R., Raunyiar, S., Petersen, W., Wolff, D., and Collis, S.: An integrated approach to weather radar calibration and monitoring using ground clutter and satellite comparisons, J. Atmos. Ocean. Tech., 36, 17–39, https://doi.org/10.1175/JTECH-D-18-0007.1, 2018. a, b
Loveland, T. R., Reed, B. C., Brown, J. F., Ohlen, D. O., Zhu, Z., Yang, L., and Merchant, J. W.: Development of a global land cover characteristics database and IGBP DISCover from 1 km AVHRR data, Int. J. Remote Sens., 21, 1303–1330, https://doi.org/10.1080/014311600210191, 2000. a, b, c
Manners, J., Edwards, J. M., Hill, P., and Thelen, J.-C.: SOCRATES (Suite Of Community RAdiative Transfer codes based on Edwards and Slingo) Technical Guide, Met Office, UK, https://code.metoffice.gov.uk/trac/socrates, last access: 24 March 2023. a
McCabe, A., Swinbank, R., Tennant, W., and Lock, A.: Representing model uncertainty in the Met Office convection-permitting ensemble prediction system and its impact on fog forecasting, Q. J. Roy. Meteor. Soc., 142, 2897–2910, https://doi.org/10.1002/qj.2876, 2016. a
Met Office Modelling Infrastructure Support Systems Team, MetOffice: Rose, available at: http://metomi.github.io/rose/doc/html/index.html, last access: 24 March 2023. a
Milan, M., Macpherson, B., Tubbs, R., Dow, G., Inverarity, G., Mittermaier, M., Halloran, G., Kelly, G., Li, D., Maycock, A., Payne, T., Piccolo, C., Stewart, L., and Wlasak, M.: Hourly 4D-Var in the Met Office UKV operational forecast model, Q. J. Roy. Meteor. Soc., 146, 1281–1301, https://doi.org/10.1002/qj.3737, 2020. a
Miller, D. A. and White, R. A.: A conterminous United States multilayer soil characteristics dataset for regional climate and hydrology modeling, Earth Interact., 2, 1–26, https://doi.org/10.1175/1087-3562(1998)002<0001:ACUSMS>2.3.CO;2, 1998. a
Mittermaier, M.: A strategy for verifying near-convection-resolving forecasts at observing sites, Weather Forecast., 29, 185–204, https://doi.org/10.1175/WAF-D-12-00075.1, 2014. a
Mittermaier, M. and Csima, G.: Ensemble versus deterministic performance at km-scale, Weather Forecast., 32, 1697–1709, https://doi.org/10.1175/WAF-D-16-0164.1, 2017. a
Moeng, C.-H., Sullivan, P., Khairoutdinov, M., and Randall, D.: A Mixed Scheme for Subgrid-Scale Fluxes in Cloud-Resolving Models, J. Atmos. Sci., 67, 3692–3705, https://doi.org/10.1175/2010JAS3565.1, 2010. a
Nachtergaele, F., van Velthuizen, H., Verelst, L., Batjes, N., Dijkshoorn, K., van Engelen, V., Fischer, G., Jones, A., Montanarella, L., Petri, M., Prieler, S., Teixeira, E., Wiberg, D., and Shi, X.: Harmonized World Soil Database (version 1.0), FAO, Rome, Italy and IIASA, Laxenburg, Austria, https://data.isric.org/geonetwork/?uuid=bda461b1-2f35-4d0c-bb16-44297068e10d (last access: 24 March 2023), 2008. a
Oliver, H., Shin, M., Matthews, D., Sanders, O., Bartholomew, S., Clark, A., Fitzpatrick, B., van Haren, R., Hut, R., and Drost, N.: Workflow Automation for Cycling Systems The Cylc Workflow Engine, Comput. Sci. Eng., 21, 7–21, https://doi.org/10.1109/MCSE.2019.2906593, 2019. a
Perkey, D. J. and Kreitzberg, C. W.: A time-dependent lateral boundary scheme for limited-area primitive equation models, Mon. Weather Rev., 104, 744–755, 1976. a
Porson, A., Clark, P., Harman, I., Best, M., and Belcher, S.: Implementation of a new urban energy budget scheme in the MetUM. Part I: Description and idealized simulations, Q. J. Roy. Meteor. Soc., 136, 1514–1529, https://doi.org/10.1002/qj.668, 2010. a
Roberts, N. and Lean, H.: Scale-selective verification of rainfall accumulations from high-resolution forecasts of convective events, Mon. Weather Rev., 136, 78–97, https://doi.org/10.1175/2007MWR2123.1, 2008. a
Samanta, A., Ganguly, S., Schull, M. A., Shabanov, N. V., Knyazikhin, Y., and Myneni, R. B.: Collection 5 MODIS LAI/FPAR Products, Presented at AGU Fall Meeting, San Francisco, USA, 15–19 December 2008, https://ui.adsabs.harvard.edu/abs/2008AGUFM.B41C0387S/abstract (last access: 24 March 2023), 2012. a
Skofronick-Jackson, G., Petersen, W. A., Berg, W., Kidd, C., Stocker, E. F., Kirschbaum, D. B., Kakar, R., Braun, S. A., Huffman, G. J., Iguchi, T., Kirstetter, P. E., Kummerow, C., Meneghini, R., Oki, R., Olson, W. S., Takayabu, Y. N., Furukawa, K., and Wilheit, T.: The Global Precipitation Measurement (GPM) Mission for Science and Society, B. Am. Meteor. Soc., 98, 1679–1695, https://doi.org/10.1175/BAMS-D-15-00306.1, 2017. a
Smagorinsky, J.: General circulation experiments with the primitive equations: I. The basic experiment, Mon. Weather Rev., 91, 99–164, https://doi.org/10.1175/1520-0493(1963)091<0099:GCEWTP>2.3.CO;2, 1963. a
Smith, R. N. B.: A scheme for predicting layer cloud and their water content in a general circulation model, Q. J. Roy. Meteor. Soc., 116, 435–460, https://doi.org/10.1002/qj.49711649210, 1990. a
Stratton, R. A., Senior, C. A., and Vosper, S. B.: A Pan-African Convection-Permitting Regional Climate Simulation with the Met Office Unified Model: CP4-Africa, J. Climate, 31, 3485–3508, https://doi.org/10.1175/JCLI-D-17-0503.1, 2018. a
Takayabu, I., Rasmussen, R., Nakakita, E., Prein, A., Kawase, H., Watanabe, S.-I., Adachi, S. A., Takemi, T., Yamaguchi, K., Osakada, Y., and Wu, Y.-H.: Convection-Permitting Models for Climate Research, B. Am. Meteor. Soc., 103, E77–E82, https://doi.org/10.1175/BAMS-D-21-0043.1, 2022. a
Tang, Y., Lean, H., and Bornemann, J.: The benefits of the Met Office variable resolution NWP model for forecasting convection, Met. Apps, 20, 417–426, https://doi.org/10.1002/met.1300, 2013. a
Walters, D., Baran, A. J., Boutle, I., Brooks, M., Earnshaw, P., Edwards, J., Furtado, K., Hill, P., Lock, A., Manners, J., Morcrette, C., Mulcahy, J., Sanchez, C., Smith, C., Stratton, R., Tennant, W., Tomassini, L., Van Weverberg, K., Vosper, S., Willett, M., Browse, J., Bushell, A., Carslaw, K., Dalvi, M., Essery, R., Gedney, N., Hardiman, S., Johnson, B., Johnson, C., Jones, A., Jones, C., Mann, G., Milton, S., Rumbold, H., Sellar, A., Ujiie, M., Whitall, M., Williams, K., and Zerroukat, M.: The Met Office Unified Model Global Atmosphere 7.0/7.1 and JULES Global Land 7.0 configurations, Geosci. Model Dev., 12, 1909–1963, https://doi.org/10.5194/gmd-12-1909-2019, 2019. a, b, c
Walters, D. N., Best, M. J., Bushell, A. C., Copsey, D., Edwards, J. M., Falloon, P. D., Harris, C. M., Lock, A. P., Manners, J. C., Morcrette, C. J., Roberts, M. J., Stratton, R. A., Webster, S., Wilkinson, J. M., Willett, M. R., Boutle, I. A., Earnshaw, P. D., Hill, P. G., MacLachlan, C., Martin, G. M., Moufouma-Okia, W., Palmer, M. D., Petch, J. C., Rooney, G. G., Scaife, A. A., and Williams, K. D.: The Met Office Unified Model Global Atmosphere 3.0/3.1 and JULES Global Land 3.0/3.1 configurations, Geosci. Model Dev., 4, 919–941, https://doi.org/10.5194/gmd-4-919-2011, 2011. a
Wilson, D. R. and Ballard, S. P.: A microphysically based precipitation scheme for the UK Meteorological Office Unified Model, Q. J. Roy. Meteor. Soc., 125, 1607–1636, https://doi.org/10.1002/qj.49712555707, 1999. a
Wilson, D. R., Bushell, A. C., Kerr-Munslow, A. M., Price, J. D., and Morcrette, C. J.: PC2: A prognostic cloud fraction and condensation scheme. I: Scheme description, Q. J. Roy. Meteor. Soc., 134, 2093–2107, https://doi.org/10.1002/qj.333, 2008. a
Wood, N., Staniforth, A., White, A., Allen, T., Diamantakis, M., Gross, M., Melvin, T., Smith, C., Vosper, S., Zerroukat, M., and Thuburn, J.: An inherently mass-conserving semi-implicit semi-Lagrangian discretization of the deep-atmosphere global non-hydrostatic equations, Q. J. Roy. Meteor. Soc., 140, 1505–1520, https://doi.org/10.1002/qj.2235, 2014. a
https://execlim.github.io/Isca/modules/socrates.html (last access: 24 March 2023)