the Creative Commons Attribution 4.0 License.
the Creative Commons Attribution 4.0 License.
 | 02 Jan 2023
Towards an improved representation of carbonaceous aerosols over the Indian monsoon region in a regional climate model: RegCM
Sudipta Ghosh
Sushant Das
Nicole Riemer
Graziano Giuliani
Dilip Ganguly
Chandra Venkataraman
Filippo Giorgi
Sachchida Nand Tripathi
Srikanthan Ramachandran
Thazhathakal Ayyappen Rajesh
Harish Gadhavi
Atul Kumar Srivastava
Mitigation of carbonaceous aerosol emissions is expected to provide climate and health co-benefits. The accurate representation of carbonaceous aerosols in climate models is critical for reducing uncertainties in their climate feedback. In this regard, emission fluxes and aerosol life cycle processes are the two primary sources of uncertainties. Here, we demonstrate that the incorporation of a dynamic ageing scheme and emission estimates that are updated for the local sources improves the representation of carbonaceous aerosols over the Indian monsoon region in a regional climate model, RegCM, compared with its default configuration. The respective mean black carbon (BC) and organic carbon (OC) surface concentrations in 2010 are estimated to be 4.25 and 10.35 µg m−3 over the Indo-Gangetic Plain (IGP) in the augmented model. The BC column burden over the polluted IGP is found to be 2.47 mg m−2, 69.95 % higher than in the default model configuration and much closer to available observations. The anthropogenic aerosol optical depth (AOD) increases by more than 19 % over the IGP due to the model enhancement, also leading to a better agreement with observed AOD. The respective top-of-the-atmosphere, surface, and atmospheric anthropogenic aerosol short-wave radiative forcing are estimated at −0.3, −9.3, and 9.0 W m−2 over the IGP and −0.89, −5.33, and 4.44 W m−2 over Peninsular India (PI). Our results suggest that the combined effect of two modifications leads to maximum improvements in the model performance in regions where emissions play a dominant role.
- Article
(5635 KB) - Full-text XML
-
Supplement
(3845 KB) - BibTeX
- EndNote


Carbonaceous aerosols (organic carbon, OC, and black carbon, BC) emitted from incomplete combustion constitute 20 %–50 % of the total global aerosol mass (Kanakidou et al., 2005; Putaud et al., 2010), causing substantial air quality degradation (Singh et al., 2021). Due to their ability to absorb solar radiation, carbonaceous aerosols also contribute to global warming (Ramanathan and Carmichael, 2008). Hence, they are considered to be key short-lived climate pollutants (SLCPs) (UNFCCC, 2015), and mitigating their emissions is expected to result in both climate and health co-benefits (Tibrewal and Venkataraman, 2021; Szopa et al., 2021). Climate models are characterized by large discrepancies in simulating carbonaceous aerosol loadings, their optical properties, and radiative forcing (Ajay et al., 2019), primarily due to uncertainties in emission inventories and limitations in the treatment of aerosol processes in the models (Bond et al., 2013). Unless the representation of the life cycle of carbonaceous aerosols in climate models is improved, their role in climate impacts and air quality degradation cannot be assessed accurately (Riemer et al., 2019).
A multi-institutional network programme – “Carbonaceous aerosol emissions, source apportionment, and climate impacts” (COALESCE) – was launched by the government of India to address some of these issues for the Indian monsoon region (Venkataraman et al., 2020). One of the scientific objectives of COALESCE is to understand and reduce uncertainties in representing the carbonaceous aerosol life cycle in global and regional climate models, focusing on the Indian subcontinent. The regional climate model (RegCM4) developed at the International Centre for Theoretical Physics (ICTP), Italy (Giorgi et al., 2012), is one of the participating models in COALESCE. RegCM4 has been extensively used to examine variability in the Indian summer monsoon (Dash et al., 2015; Rai et al., 2020), to project climate change over South Asia (Pattnayak et al., 2018), and to elucidate the dynamical impacts of aerosols on the Indian summer monsoon under present (Das et al., 2015, 2016) and future (Das et al., 2020) climate conditions.
The aerosol module in the RegCM4 (Solmon et al., 2006; Zakey et al., 2006) considers various aerosol life cycle processes, such as emission (source), advection, horizontal and vertical diffusion, transport, conversion of hydrophobic to hygroscopic species, and wet and dry deposition (sink) (see Sect. 2 for more details). Previous studies (Das et al., 2016; Nair et al., 2012) have pointed out that the RegCM4 underestimates the anthropogenic aerosol loading over the Indian subcontinent and that the net aerosol impact over the region is, therefore, dominated by natural aerosols (Das et al., 2020). We recently implemented a dynamic ageing scheme in the RegCM aerosol module (Ghosh et al., 2021a), which converts carbonaceous aerosols from hydrophobic to hygroscopic states based on the aerosol number concentration. Compared with the constant conversion rate of 27.6 h used in the default version of the model, the scheme allowed a faster conversion in the polluted regions than in the clean areas of the South Asia region. This, in turn, affected the aerosol forcing due to the changes in aerosol loadings induced by the new hydrophobic-to-hygroscopic conversion scheme. It was also found that implementing the dynamic ageing scheme alone is not sufficient to fully improve the model performance; thus, it was hypothesized that much of the model uncertainty was due to the emission inventory.
In this work, we examined the changes in the carbonaceous aerosol burden and their impact on the radiation budget of the South Asia region due to the combined impact of the improved dynamic ageing scheme and a regional emission inventory (Pandey and Venkataraman, 2014; Sadavarte and Venkataraman, 2014) replacing the global emission inventory used in the default model version (see Sect. 2). We carried out four sets of simulations for the year 2010: (1) a control simulation with the default (fixed) ageing scheme and global inventory (hereafter Default_Sc), (2) a simulation with the dynamic ageing scheme and global inventory (Dyn_global), (3) a simulation with the default ageing scheme and regional inventory (Fix_Regio), and (4) simulation with the dynamic ageing scheme and regional emission inventory (Dyn_Regio). The changes due to ageing alone (i.e. Default_Sc vs. Dyn_global) have already been reported in Ghosh et al. (2021a). Here, we analyse and report the improvements in model performance due to the combined impact of incorporating a better emission inventory and a more realistic ageing scheme relative to the default model configuration (i.e. Default_Sc vs. Dyn_Regio) and investigate these performance changes in terms of the aerosol processes considered in the model. However, the changes due to emissions alone (i.e. Default_Sc vs. Fix_Regio) will be considered as an intermediate step towards Dyn_Regio.
2.1 Model configuration
RegCM, version 4, is a hydrostatic, compressible, primitive equation, and sigma-p vertical coordinate model with a dynamical core from Version 5 of the National Center for Atmospheric Research (NCAR) Mesoscale Model (MM5) (Grell et al., 1994). We have used Version 3 of the Community Climate Model (CCM3) (Kiehl et al., 1996) radiative transfer scheme with the modifications described in the literature (Giorgi et al., 2012). The model is interactively coupled with both natural (dust and sea salt) (Zakey et al., 2006, 2008) and anthropogenic aerosols (Solmon et al., 2006) as well as a gas-phase chemistry module (Shalaby et al., 2012); however, for this study, we have only considered the anthropogenic module (Solmon et al., 2006). The choice of parameterization schemes for our experiments has been provided in the following table.
Table 1The choice of parameterization schemes for the experiments carried out in this work.
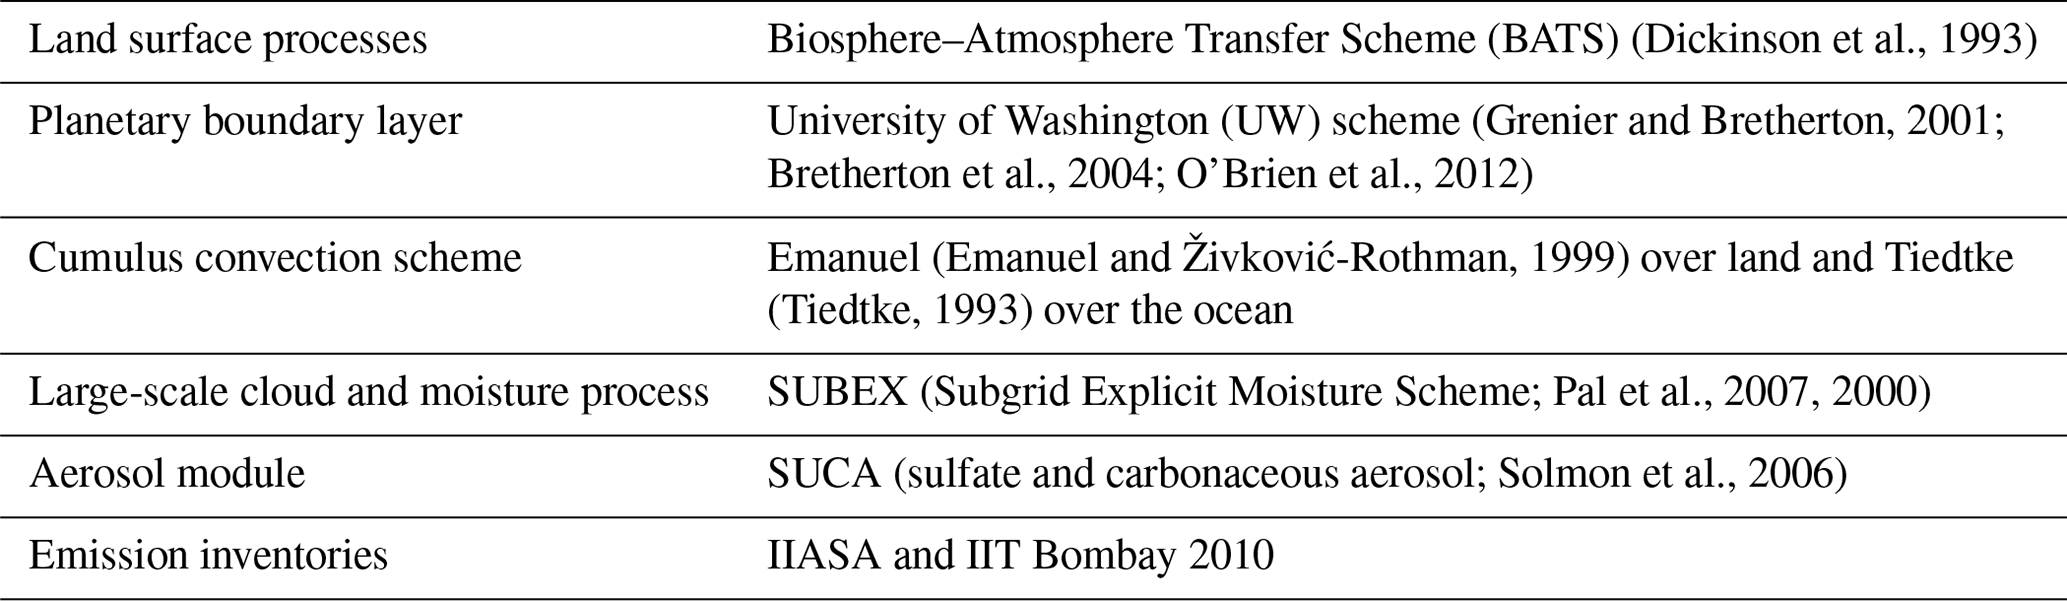
The acronyms used in this table are as follows: IIASA – International Institute for Applied Systems Analysis, and IIT Bombay – Indian Institute of Technology Bombay.
The anthropogenic aerosol module consists of sulfate, hydrophilic and hydrophobic BC, hydrophilic and hydrophobic OC, and a sulfate scheme (Qian et al., 2001). The mass concentrations of these species are tracked, assuming that they form an external mixture. The emitted carbonaceous aerosols are considered to be 80 % hydrophobic and 20 % hydrophilic for BC, whereas equal fractions of hydrophobic and hydrophilic OC are considered in the simulations. The rate of change in mass mixing ratios of hydrophobic and hydrophilic tracers, indicated by the subscripts “hb” and “hl” respectively, is described by the chemical transport equation in Solmon et al. (2006).
The atmospheric lifetime of aerosols is governed by dry and wet deposition. The dry-deposition velocity depends on the type of surface, while the dry-deposition flux variation is proportional to the tracer concentration in the lowest level of the model (around 30 m above the surface). Wet deposition in RegCM4 has been split into “in-cloud” and “below-cloud” terms. The in-cloud removal process starts for large-scale clouds if the liquid water is higher than the threshold level (0.01 g m−3) in the model layers where the cloud fraction is more than zero, and it is a function of the fractional removal rate of liquid water (fraction of precipitating rain over liquid water content of the atmospheric layer; the in-cloud removal rate for cumulus clouds is constant and fixed at 0.001 s−1) and the aerosol solubility. This solubility is different for different species; thus, hydrophilic and hydrophobic BC and OC have different in-cloud wet-deposition rates. The below-cloud washout of the aerosols is controlled by their effective diameters and densities. Collection efficiency for each aerosol species is computed from the aerosol effective diameter and density, which is different for different species. The changes in wet and dry deposition alter the ratio of hydrophobic to hydrophilic changes, which in turn alters the atmospheric lifetime of aerosols. A detailed explanation regarding these changes due to ageing alone can be found in Ghosh et al. (2021a). Seasonal variation in the lifetime of particles, at the surface and in the upper atmosphere, due to ageing alone has also already been given in Ghosh et al. (2021a).
The model was simulated over the South Asian CORDEX (Coordinated Regional Downscaling Experiment) domain (Giorgi et al., 2009) (20∘ S–50∘ N, 10–130∘ E) for the year 2010 at a resolution, while the results are analysed over the Indian subcontinent (0–45∘ N, 60–105∘ E) with special focus on the Indo-Gangetic Plain (IGP; 25–30∘ N, 73–89∘ E) and Peninsular India (PI; 8–20∘ N, 72–85∘ E). The model consists of 18 vertical levels with 50 hPa as the model top pressure. There are three levels (1000, 925, and 850 hPa) within the boundary layer. The ERA-Interim reanalysis dataset, at a 1.5∘ resolution and a 6 h temporal resolution, has been used to generate the initial and lateral meteorological boundary conditions for the study (Dee et al., 2011). The sea surface temperature was derived from the NOAA Optimum Interpolation weekly gridded data, and the chemical boundary conditions were from MOZART (Model for OZone And Related chemical Tracers) 6 h data. Four sets of simulations have been performed for the year 2010: (1) a control simulation with the default (fixed) ageing scheme and global inventory (hereafter Default_Sc), (2) a simulation with the dynamic ageing scheme and global inventory (Dyn_global), (3) a simulation with the default ageing scheme and regional inventory (Fix_Regio), and (4) a simulation with the dynamic ageing scheme and regional emission inventory (Dyn_Regio). In each of the experiments, the model was simulated from 1 October 2009 to 31 December 2010. The first 3 months were considered spin-up and, thus, were not included in the analysis. The focus of this paper is the Indian landmass only. Changes in aerosol properties over the oceans have not been discussed because the oceanic condition is mostly clean with a low tracer concentration compared with that over the landmass. In Fig. S1 in the Supplement, there are hardly any emissions over the oceans. Additionally, in Ghosh et al. (2021a), it is evident that the ageing time of the carbonaceous aerosols over the oceans is larger than the default ageing timescale.
2.2 Emission inventories
In this study, we considered a global emission inventory (https://www.iiasa.ac.at/web/home/research/researchPrograms/air/Global_emissions.html, last access: 21 November 2022) and a regional emission inventory (Pandey and Venkataraman, 2014; Sadavarte and Venkataraman, 2014; Venkataraman et al., 2018). Figure S2 represents the seasonal variation in the emissions estimated by the two inventories. The global emission inventory used in the Default_Sc and Dyn_global experiments was developed using the International Institute for Applied Systems Analysis (IIASA) emission inventory at a resolution of (https://www.iiasa.ac.at/web/home/research/researchPrograms/air/Global_emissions.html, last access: 21 November 2022). The key emission sectors considered in this inventory are energy, industry, solvent use, transport, domestic combustion, agriculture, open burning of agricultural waste, and waste treatment. The emission estimates were available only at an annual scale with no seasonal variation from 1990 to 2010.
The regional emission inventory used in Fix_Regio and Dyn_Regio experiments was developed by the Indian Institute of Technology Bombay (IIT Bombay) (Pandey and Venkataraman, 2014; Sadavarte and Venkataraman, 2014; Venkataraman et al., 2018) at a horizontal resolution of , and the estimates vary at a monthly scale. Thus, the regional emissions have a profound seasonal variability (Fig. S1). The key sectors included in the regional inventory are energy (coal, oil, and gas), heavy and light industry, brick production, residential cooking, solid biomass fuel, residential cooking (LPG and kerosene), residential lighting (kerosene lamp), residential water heating, residential space heating, informal industry, agricultural residue burning, on-road gasoline, on-road diesel, railway, agricultural diesel pumps, and agricultural tractors. Among these sectors, the residential water heating, residential space heating, and agricultural residue burning sectors have seasonality in emissions.
2.3 In situ BC data
In situ BC data for the year 2010 have been procured from 24 sites to evaluate the model performance. These sites are shown in Fig. S4. A total of 21 of these sites are part of ARFINET – the Indian Space Research Organization's Aerosol Radiative Forcing over India Network (Babu et al., 2013; Gogoi et al., 2021). This network has been measuring columnar AOD and BC for many years. In addition to ARFINET measurements, BC concentrations are also measured independently at Kanpur (for the entire year 2010 except during the monsoon season; Tripathi et al., 2005), Gadanki (Gadhavi et al., 2015; Jain et al., 2018), and Delhi (October–December 2010) by individual institutions. At all of the sites, BC was measured by an Aethalometer. An Aethalometer measures the amount of attenuation of the light beam passing through the filter where particles get deposited. The BC mass concentration is measured by the change in optical attenuation given by the rate of BC deposition on the filter tape (Hansen et al., 1984). Datasets from all of the sites except Gadanki (monthly values) are available on a daily scale and have been averaged to get the annual concentrations.
2.4 Modern-Era Retrospective analysis for Research and Applications, Version 2 (MERRA-2) data
Model-simulated BC and OC columnar burdens have been evaluated against MERRA-2 reanalysis data. MERRA-2 is an updated reanalysis of atmospheric data produced by the NASA Global Modeling and Assimilation Office (Buchard et al., 2017). MERRA-2 consists of parameters that are not available in its predecessor, MERRA. It includes updates of the Goddard Earth Observing System model and analysis scheme in order to give a more realistic view of the ongoing climate analysis beyond MERRA's jargon. This dataset addressed the limitations of MERRA. Various improvements in MERRA-2 include assimilation of aerosol observations and improved representation of the stratosphere, including ozone and the cryosphere. MERRA-2 data products are freely accessible through the NASA Goddard Earth Sciences Data Information Services Center. We note that MERRA-2 data are also not observations, and direct validation of the MERRA-2 columnar BC and OC burden is not possible.
2.5 Multi-angle Imaging SpectroRadiometer (MISR) aerosol data
MISR, aboard the Terra satellite, crosses the Equator around 10:30 LT (local time). It has a high spatial resolution and a wide range of viewing angles. It views the Earth using four spectral bands in each of the nine cameras and has a weekly global coverage between north and south latitudes. A detailed description is provided in the literature (Diner et al., 1998). MISR AOD has a correlation coefficient of ∼0.9 (for maritime sites) and ∼0.7 (for dusty sites) with respect to the Aerosol Robotic Network (AERONET) (Kahn et al., 2005). In the absence of any direct measurement of anthropogenic AOD, we use MISR fine AOD (AOD for particles smaller than 0.35 µm) (Dey and Di Girolamo, 2010).
In this section, we discuss the three-dimensional annual distribution of carbonaceous aerosols (Sect. 3.1 and 3.2) for the default (Default_Sc) and augmented (Dyn_Regio) model set-ups. The seasonal distributions for all four experiments, Default_Sc, Dyn_global, Fix_Regio, and Dyn_Regio, are reported in the Supplement. In Sect. 3.3, we investigate the annual changes in aerosol optical properties due to the default (Default_Sc) and augmented (Dyn_Regio) model set-ups. In this case, the seasonal variability across the four experiments is also shown in the Supplement.
3.1 Spatial distribution of carbonaceous aerosols
Figure 1 shows the spatial distributions of the annual surface concentration for BC and OC using the default and augmented model set-ups, along with their differences. Several key features are notable. First, the OC concentration is almost 3 times higher than the BC concentration in the augmented model, which is consistent with the literature (Priyadharshini et al., 2019). Second, the concentrations are 2–3 times higher over the polluted Indo-Gangetic Plain (IGP) compared with the rest of India in the augmented model. High aerosol loadings in the IGP are a result of the combined effects of greater source strength, low topography surrounded by highlands to the north and south, and unfavourable meteorology (Dey and Di Girolamo, 2010; Srivastava et al., 2012). Third, the BC and OC concentrations increase by >100 % and >60 % respectively over the IGP and by smaller margins elsewhere in the augmented model relative to the default configuration. The increase in the annual tracer concentrations can be further explained by the seasonal distributions and the selected model configuration. To begin with, an increase in both BC and OC concentrations during the winter (January–February, JF), pre-monsoon (March–April–May, MAM), and post-monsoon (October–November–December, OND) seasons are clearly visible in Figs. S2 and S3 (in the Supplement). During the monsoon, precipitation removes large amounts of aerosols; as a result, the increase in the BC concentration is almost negligible, whereas it is negative for OC. The transition in concentration from Dyn_global to Fix_Regio is more prominent than that from Default_Sc to Dyn_global or Fix_Regio to Dyn_Regio. This indicates the impact of the switch from the global to regional emission inventory (Fig. S1) is greater than the impact of the implementation of the dynamic ageing scheme (Fig. S1) on the increases in BC and OC mass concentrations in the augmented model.
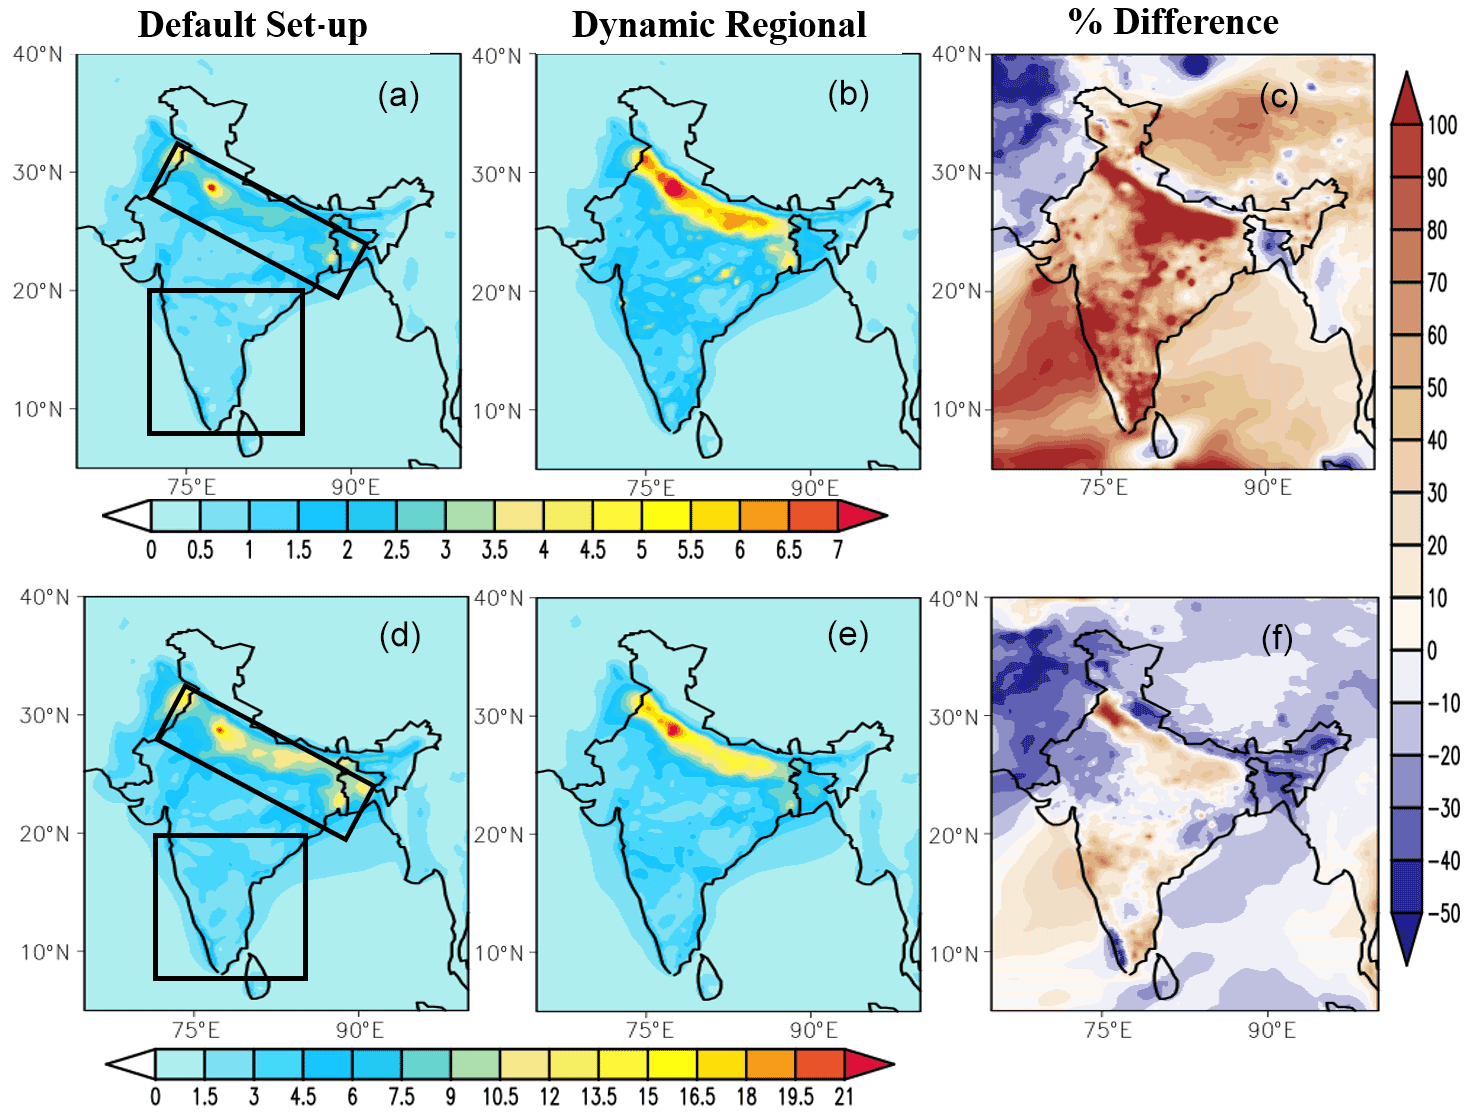
Figure 1Spatial distribution of surface mass concentration (µg m−3) of BC (a, b) and OC (d, e) in 2010 over the Indian subcontinent using (a, d) the default and (b, e) the augmented model configurations. Panels (c) and (f) represent the corresponding percentage differences due to the augmented model set-up (positive values imply an increase in mass concentration). The vertical distributions (shown in Fig. 4) are analysed for the IGP and PI subregions marked by boxes panels (a) and (d).
We evaluate the performance of the customized model against BC surface concentrations measured at 24 sites across India (Fig. 2). We note that the in situ concentrations are point measurements, whereas the model grids containing these sites are representative of 25 km × 25 km areas. The default model severely underestimates the surface BC compared with the in situ observations (mean normalized bias, MNB, of −69 %). Although the underestimation persists in the augmented model (by varying proportions across the sites), the simulated concentration magnitudes are closer to the observations (MNB ), particularly in the megacities of the polluted IGP (e.g. Delhi, Kanpur, Varanasi, and Kharagpur). The improvement is small in some cities, particularly in the East India region (e.g. Dehradun, Dibrugarh, and Ahmedabad), where the differences in global and regional emission inventories are also small. This suggests that the problem could be related to the emission fluxes. In several cities, especially in North and South India (e.g. Goa, Nainital, Ooty, and Thiruvananthapuram), the simulated BC using the augmented model is a very close match with the observations. Overall, the augmented model (R2=0.66) performs better than the default model (R2=0.6) with respect to simulating surface BC concentrations, and the errors shown in Fig. 2 could also be amplified by the fact that the model data refer to a 25 km×25 km area as a single grid.
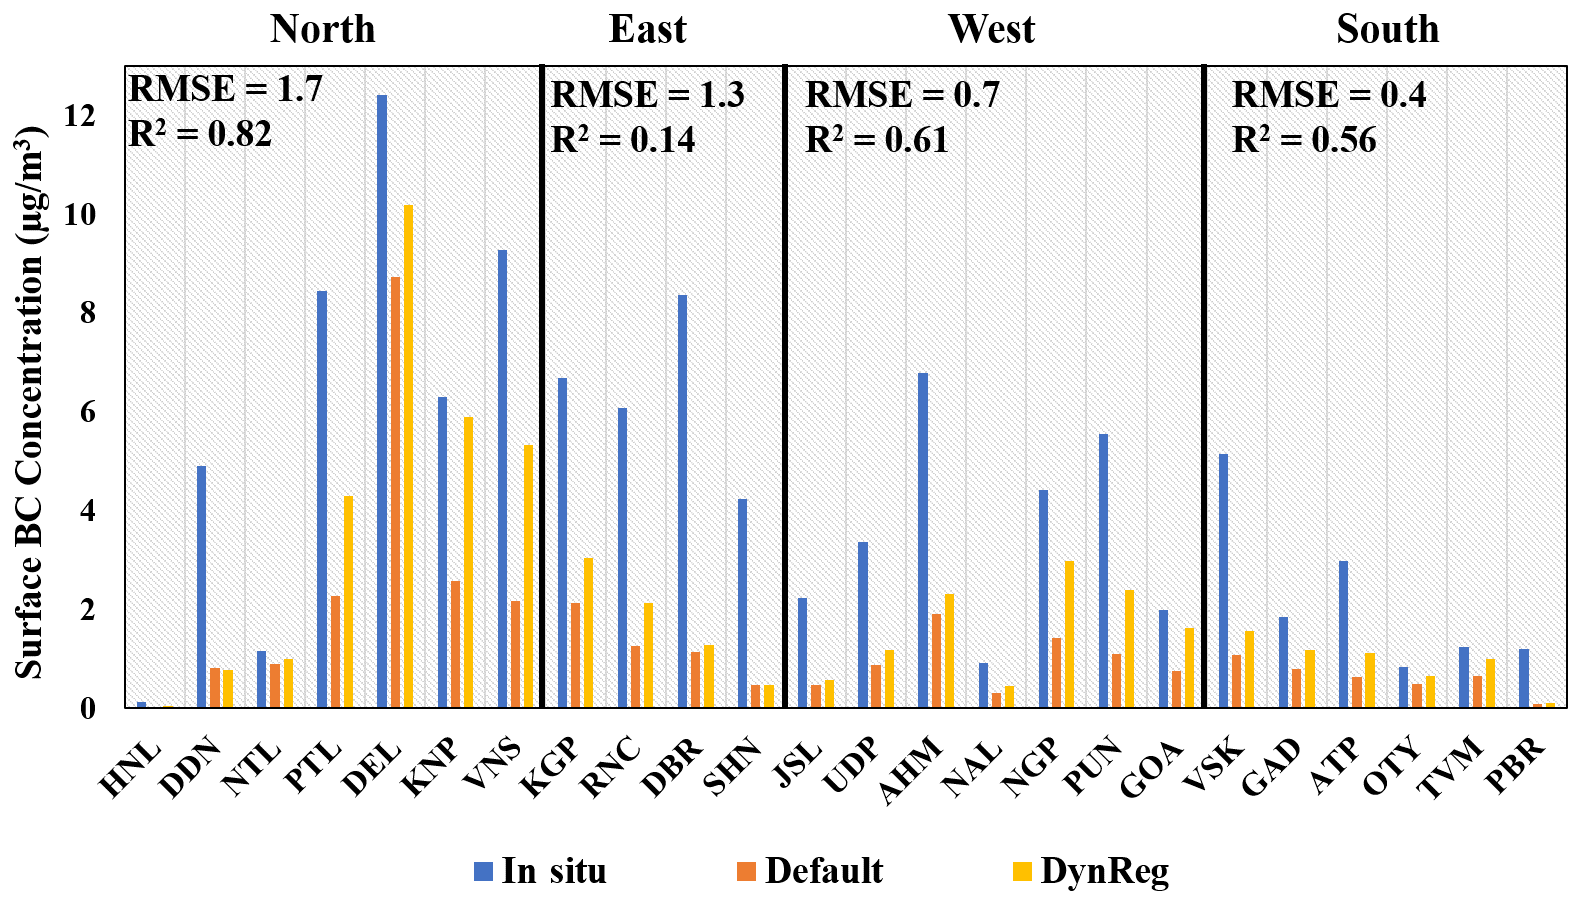
Figure 2Comparison of simulated BC surface concentration (µg m−3) using the default and augmented model with in situ measurements from 24 cities across India (see Fig. S4 for definitions of the abbreviations). The locations of the cities are shown in Fig. S4. The RMSE (in µg m−3) and R2 values between the customized model simulations and surface measurements are also provided.
As there are no in situ measurements of columnar burden, we compare the simulated columnar burden (Fig. 3) with data from MERRA-2 (Buchard et al., 2017). Similar to the surface mass concentration, the BC burden shows a more pronounced change than the OC burden due to the inclusion of the new model features. Here, the introduction of the emissions alone also played a more prominent role than the dynamic ageing alone (see Figs. S5 and S6), but the highest change can be observed in the presence of both. Although the simulated burden is still underestimated relative to the MERRA-2 data, the values in the augmented model are much closer to the reanalysis data, and the sequence of changes (in both BC and OC) are as follows: Dyn_Regio > Fix_Regio > Dyn_global > Default_Sc. During the winter season (JF), the percentage difference in the model-simulated column burden (with respect to MERRA-2) decreases from >70 % to ∼35 % for BC and from ∼63 % to ∼49 % for OC in the augmented model (Figs. S5, S6). A similar improvement is found in the pre-monsoon season (MAM). The higher BC loading over the IGP results from higher magnitudes of regional emissions coupled with faster ageing and a slower removal rate. The percentage difference increases for the OC burden over north-western India, decreases over the IGP, and is negligible over the rest of the country. A probable explanation for such an OC distribution relies on the emission inventories used: OC emissions are slightly higher in the global inventory than those in the regional inventory over north-western India, whereas they are lower in the IGP. Emissions over the PI are roughly similar in the two inventories (Fig. S1). The dominant role of emissions in both the BC and OC simulated burden is further supported by the observed transition changes from Dyn_global to Fix_Regio. We also note that anthropogenic aerosol emissions vary on an annual basis in MERRA-2 (Buchard et al., 2017); hence, there could be larger uncertainties at a seasonal scale.
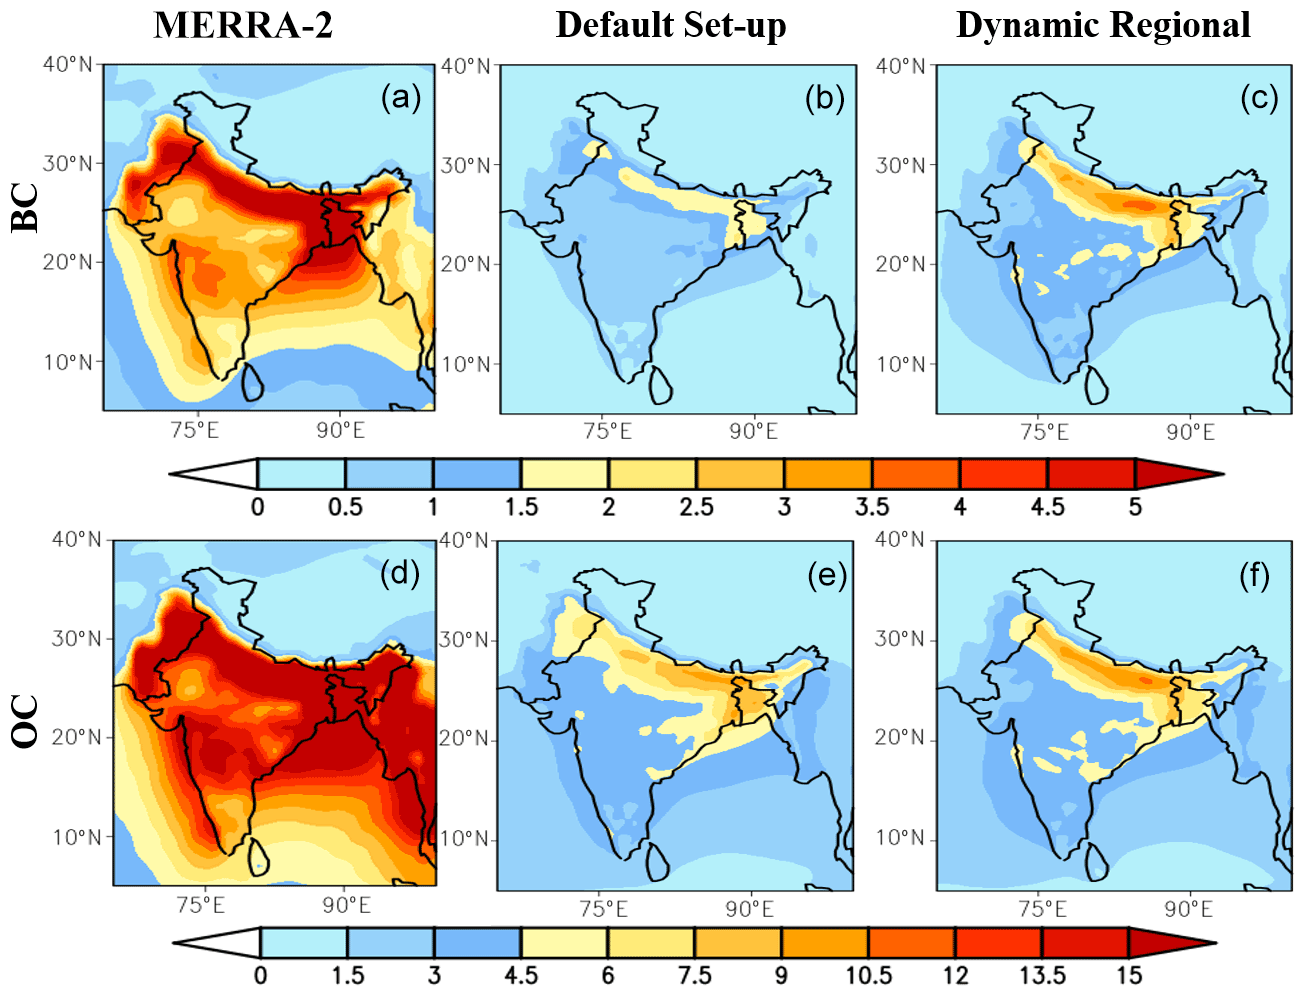
Figure 3Comparison of spatial patterns of the annual (a, b, c) BC and (d, e, f) OC column burden (mg m−2).
During the monsoon season (June–September, JJAS), the BC loading increases and the OC loading decreases in magnitude in the augmented model compared with the default set-up (Fig. S5), mostly due to the implementation of the regional inventory. The magnitude of the simulated BC column burden is comparable between the Default_Sc and Dyn_sc experiments and between the Fix_Regio and Dyn_Regio experiments (Fig. S5), with an opposite pattern found for the OC column burden (Fig. S6). Two possible reasons can explain this result First, the OC emissions in the global inventory are higher than in the regional ones (Fig. S1). Second, the model assumes that OC is 50 % hydrophobic and 50 % hydrophilic at the time of emission (for BC, it is 80 % hydrophobic and 20 % hydrophilic); therefore, the faster conversion to hydrophilic OC due to dynamic ageing can enhance the hydrophilic OC removal by rain. On analysing the wet removal (see Figs. S7 and S8), BC_HL (were HL is for hydrophilic) showed the expected highest removal during JJAS, but OC_HL showed a lower magnitude of wet removal. Therefore, lower OC emissions in the regional inventory play a major role in simulating OC burden in the augmented model during JJAS. In the post-monsoon season (OND), an overall increase in column burden in the augmented model is observed throughout India. Higher emissions (in the case of the regional inventory) result in higher concentrations of available condensing and coagulating particles; this, in turn, allows for faster ageing of hydrophobic to hydrophilic BC, leading to the accumulation of BC particles in the atmosphere before their removal by dry deposition. The changes in the OC loading are negligible in this season (see Fig. S6).
3.2 Vertical distribution of carbonaceous aerosols
In this section, we analyse the effects of the model improvements on the vertical distribution of aerosols over the IGP and compare the results with the contrasting PI region, where the emissions are much lower. The two regions are indicated by the boxes in Fig. 1a and d. Figure 4 represents longitude–altitude cross sections of the annual BC and OC mass concentration (µg m−3) over the regions. The vertically distributed mass concentrations (µg m−3) of both BC and OC increase due to the model improvements up to 500 hPa. Similar to the spatial distribution, seasonal variability will also help to explain the annual vertical concentrations here. Furthermore, the changes are more dramatic and prominent over the IGP than that over PI.
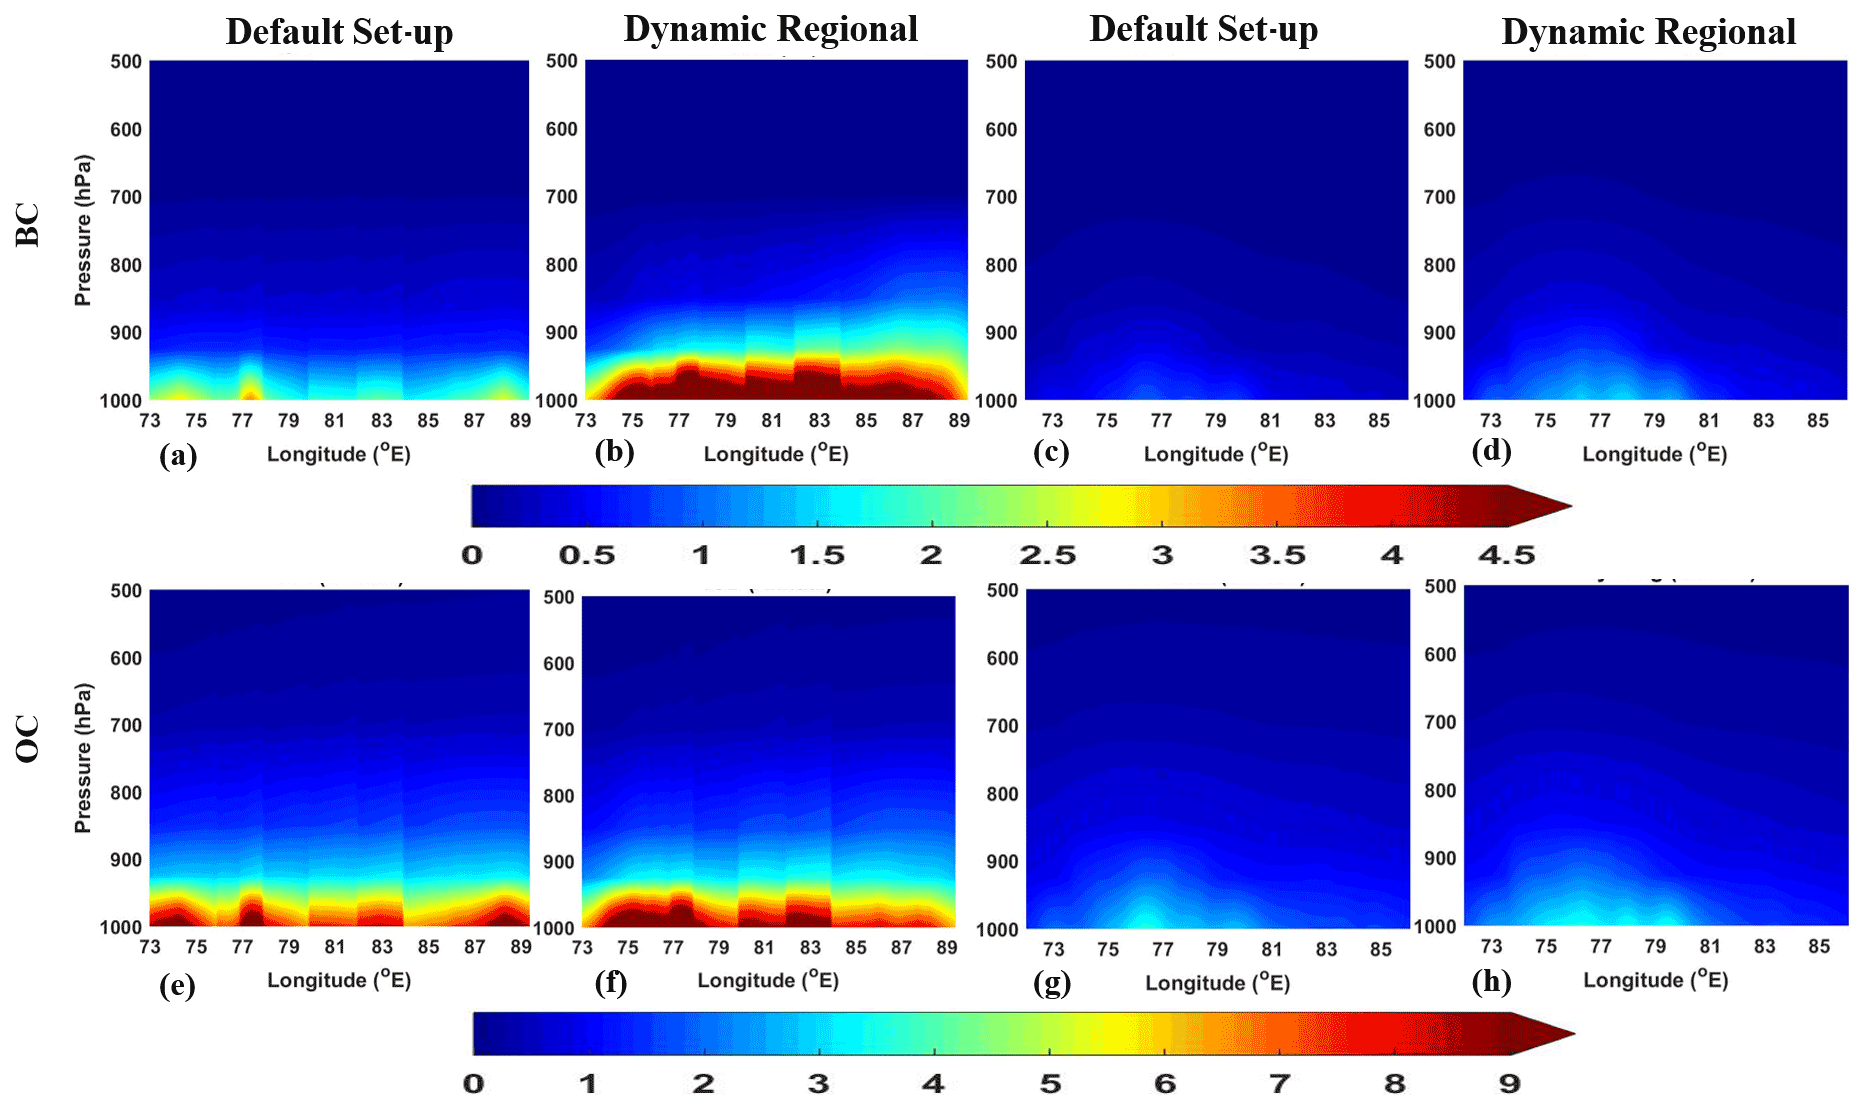
Figure 4Longitude (in ∘ E) vs. altitude (in hPa) cross sections of the (a–d) BC and (e–h) OC mass concentration (µg m−3) over the IGP (a, b, e, f) and PI (c, d, g, h) for the default and customized model.
Over the IGP, a larger increase is observed during the winter and post-monsoon seasons (Figs. S9, S10). Both the BC and OC concentrations (µg m−3) are comparable in the default and Dyn_global configurations, but they increase in the Fix_Regio and Dyn_Regio set-ups (Figs. S9, S10). This observation reflects the predominant role of regional emissions. In these two seasons, both BC and the OC are distributed up to the mid-tropospheric levels but with differing magnitudes. This is indicative of higher concentrations of OC vertical transport than that of BC. During the pre-monsoon season, the vertical distributions of both BC and OC show responses similar to those of their spatial distributions. In the monsoon season, the tracer concentration is mainly confined to the surface levels, indicating a lower wet removal and slower ageing above 1000 hPa (Ghosh et al., 2021a).
For further clarification of the seasonality of the vertical pumping effect, the convective tendency (which represents vertical transport) and lateral advection (which represents horizontal transport) have been investigated. The model-simulated convective tendency and lateral advection (responsible for long-range transport) are given below. More positive values indicate a strong updraught above the surface due to convection. The convection tendency gradually increases from left to right (Fig. 5 for BC and Fig. S11 for OC). This is particularly apparent in the drier seasons, as more particles are available in the absence of washout. During winter, the augmented model (Dyn_Regio) shows a lesser pumping effect over the IGP than that when only emissions have been changed (Fix_Regio). This can be due to the fact that, in the presence of dynamic ageing, a greater number of hydrophilic tracers are available for removal (evident from the removal plot of BC_HL) even for a small amount of precipitation from western disturbances. However, during the post-monsoon period (OND), due to negligible precipitation over the IGP, removal rates of hydrophilic tracers are comparable; hence, the pumping effect also follows the same trend. A similar trend in convective tendency is also shown by OC particles (Fig. S11). The magnitude of the OC convection tendency is stronger than that of BC particles, probably due to a higher concentration (Priyadharshini et al., 2019; Ram et al., 2010) of available particles. Furthermore, lateral advection is an indicator of horizontal long-range aerosol transport. More positive values indicate strong flow along the surface due to advection. Advection shows strong seasonality (from top to bottom – Fig. 6 for BC and Fig. S12 for OC). In drier months (JF and OND), horizontal transport is comparatively less than in the pre-monsoon (MAM) and monsoon (JJAS) periods. Therefore, vertical convection is more prominent in dry seasons, whereas horizontal advection is dominant in MAM and JJAS, irrespective of the choice of schemes. Consequently, the observed BC concentration is due to convection in JF and OND and due to advection in MAM and JJAS. Similar logic can be applied for the OC concentration distribution due to lateral advection (Fig. S12). However, the positive advection signal is stronger than that of BC particles. This can again be due to the higher concentration of available particles for transport to other regions.
In addition, the atmospheric profiles over the region have also been used to explain the tracer distribution. In terms of changes in temperature profile, higher temperatures over the IGP during MAM and JJAS facilitated the strong vertical wind movement (negative values in Fig. S13). However, a negative convective tendency (Fig. 5 for BC and Fig. S11 for OC) and positive lateral advection (Fig. 6 for BC and Fig. S12 for OC) of carbonaceous aerosols during these months lowered their concentrations. This is further supported by the high RH values, particularly in JJAS (Fig. S14), which resulted in higher removal. Exactly the inverse occurs during the drier months (JF and OND). Comparatively low temperatures (Fig. S15), facilitated more stable wind movement (positive values in Fig. S13). However, in presence of high emissions, the aerosol pumping effect resulted in a strong convective tendency (Fig. 5) which further facilitated the higher concentrations during these months. The low RH values (Fig. S14) during these months are also conducive of a higher aerosol atmospheric lifetime.
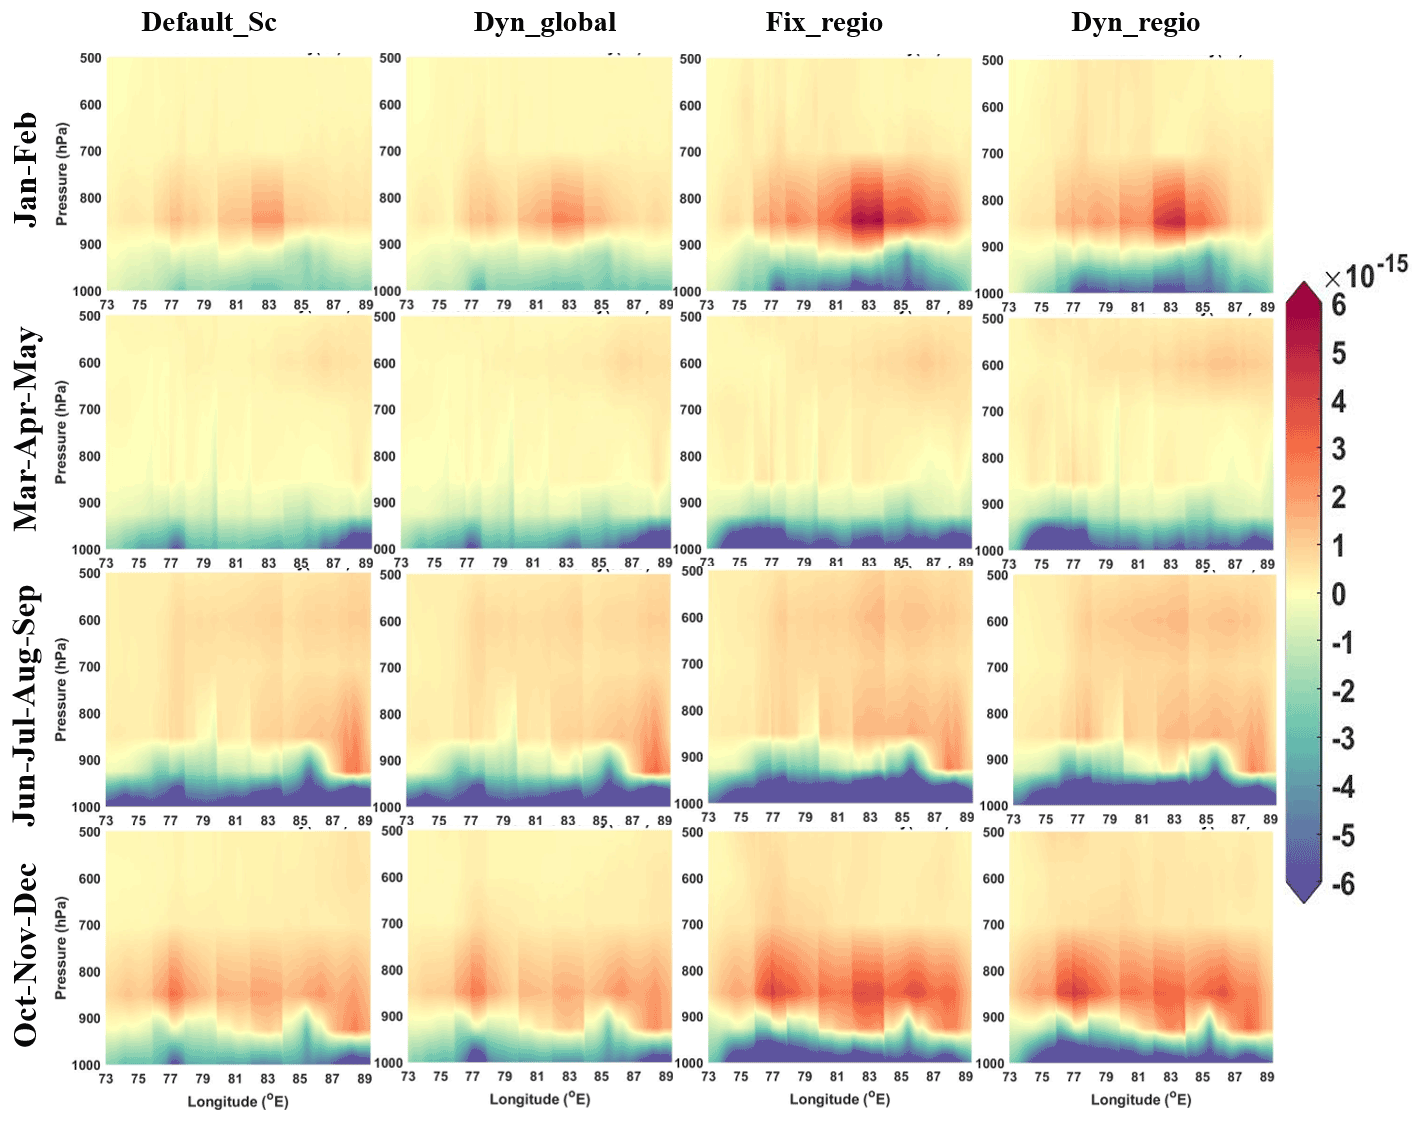
Figure 5Seasonal distribution of the convective tendency (kg kg−1 s−1) of BC over the IGP for four distinct experiments.
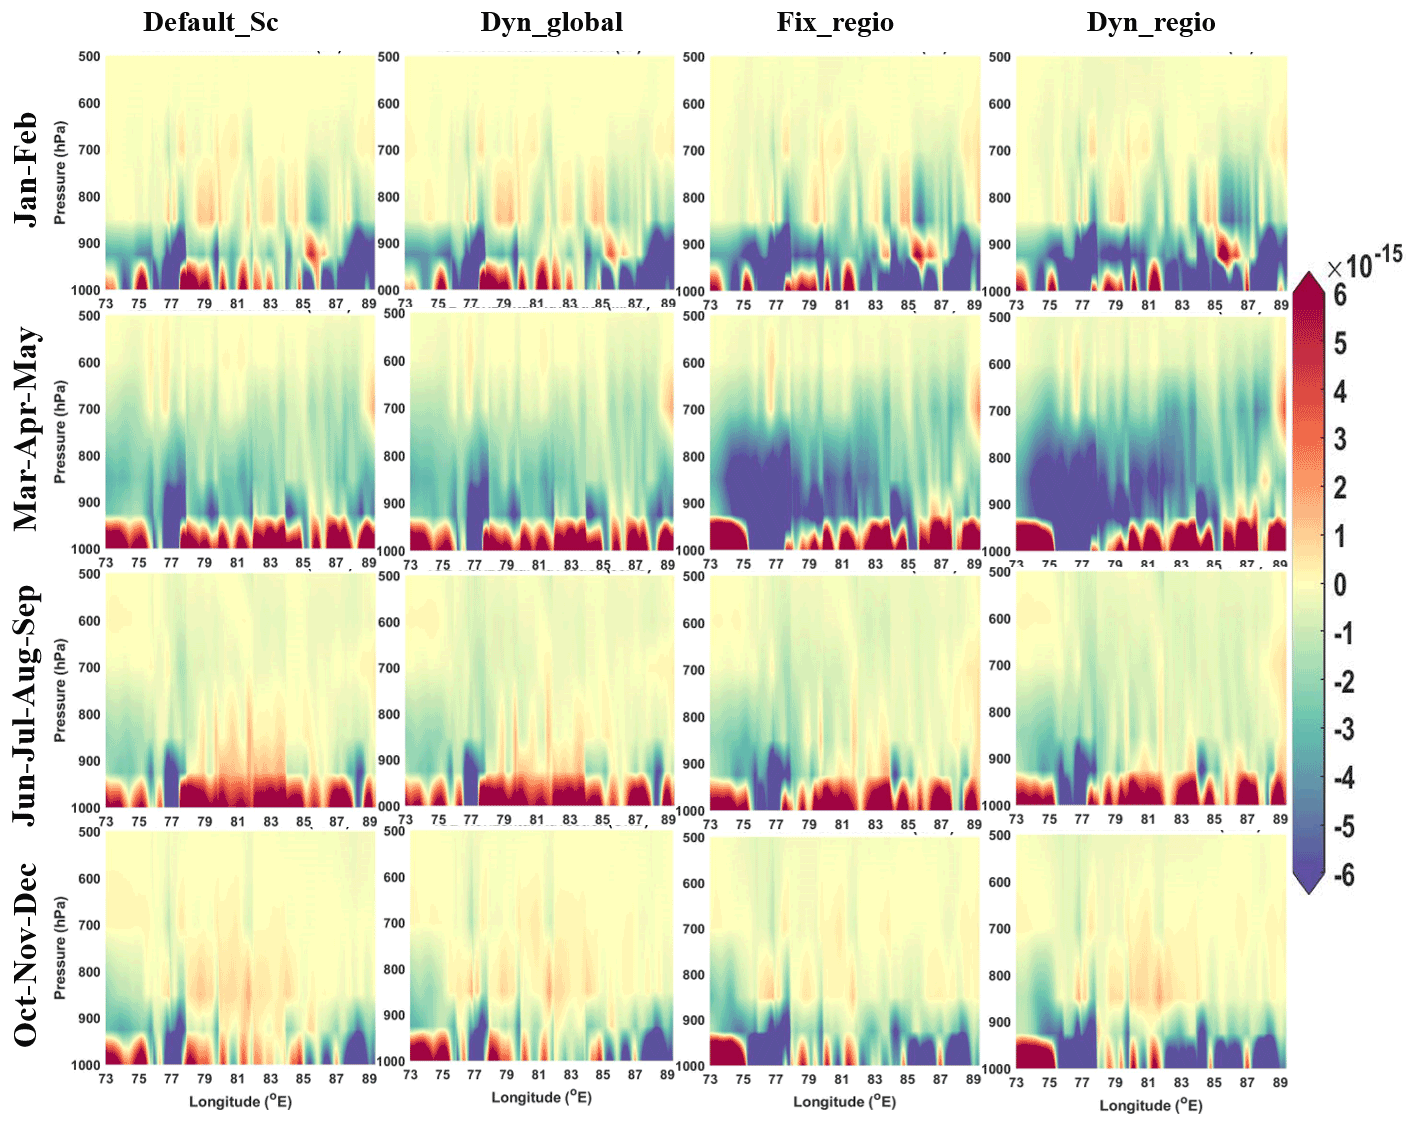
Figure 6Seasonal distribution of the lateral advection (kg kg−1 s−1) of BC over the IGP for four distinct experiments.
Over the PI, the annual concentrations of carbonaceous aerosols (Fig. 4) are very low compared with the IGP, which limits the impact of dynamic ageing because of the lower availability of condensing and coagulating particles (relative to the IGP). This results in slower ageing and lower accumulation of hydrophilic tracers in the troposphere. However, the vertical pumping effect is quite prominent during the winter season in the augmented configuration (Figs. S16, S17). During the pre-monsoon season, only the BC concentration shows an increment in the lower troposphere, whereas the OC concentration remains more or less unchanged. The PI receives rainfall during the south-west and north-east monsoon; hence, the tracer concentration is further lowered during the monsoon and post-monsoon seasons. This is further supported by the high relative humidity values over PI during monsoon and post-monsoon periods (Fig. S18). The high humidity during JJAS can also influence a comparatively high near-surface air temperature (Fig. S19) by trapping the radiation. This, in turn, results in a high vertical wind shear (Fig. S20) over PI during this season. However, the convective tendency is low for both BC and OC (Figs. S21 and S24 respectively).
Therefore, lower concentrations can be primarily due to lower emissions for both BC and OC (see Fig. S1). This argument is further supported by lower washout in PI compared with the IGP (Figs. S7, S8) in spite of high RH values (Fig. S18). As the convective tendency, as well as lateral advection for BC, does not play a major role (as can be seen in Figs. S21 and S22), one can again conclude the role of lower emissions. In the case of OC, lateral advection (Fig. S23) and comparatively lower emissions (Fig. S1) compared with the IGP could be the predominant factors resulting in lower concentrations over PI in the presence of a negative convective tendency (Fig. S24).
3.3 Optical and radiative properties of anthropogenic aerosols
We now examine the effects of the model improvements on the optical properties of anthropogenic aerosols. In this regard, we note that the changes due to the implementation of the dynamic ageing scheme can alter only BC and OC concentrations, whereas the changes related to the emission inventory impact the sulfate concentration as well. We consider the AOD due to small particles (radius <0.35 µm) from MISR (Kahn and Gaitley, 2015) as a proxy for anthropogenic AOD (hereafter AAOD), as direct measurements of AAOD are not available to evaluate our model performance (Fig. 7).
The simulated annual AAOD is >50 % lower than the MISR small-mode AOD over the polluted IGP and 30 %–50 % lower over the PI in the default model. This is consistent with previous studies (Nair et al., 2012). These model underestimations improve by 25 %–35 % over the IGP and parts of PI in the augmented model. The seasonal plots (Fig. S8) clearly show an increase in AAOD in all seasons except during the monsoon. This increase in AAOD is due to both the implementation of region-specific emission fluxes (Nair et al., 2012) and the dynamic ageing scheme (Ghosh et al., 2021a). The AAOD still remains underestimated in some regions, which can possibly be addressed by further improvements in the emission estimates – for example, the addition of missing sectors (e.g. crematorium and municipal solid waste burning), improving sectoral methodologies for informal activities, and the incorporation of regionally measured emission factors.
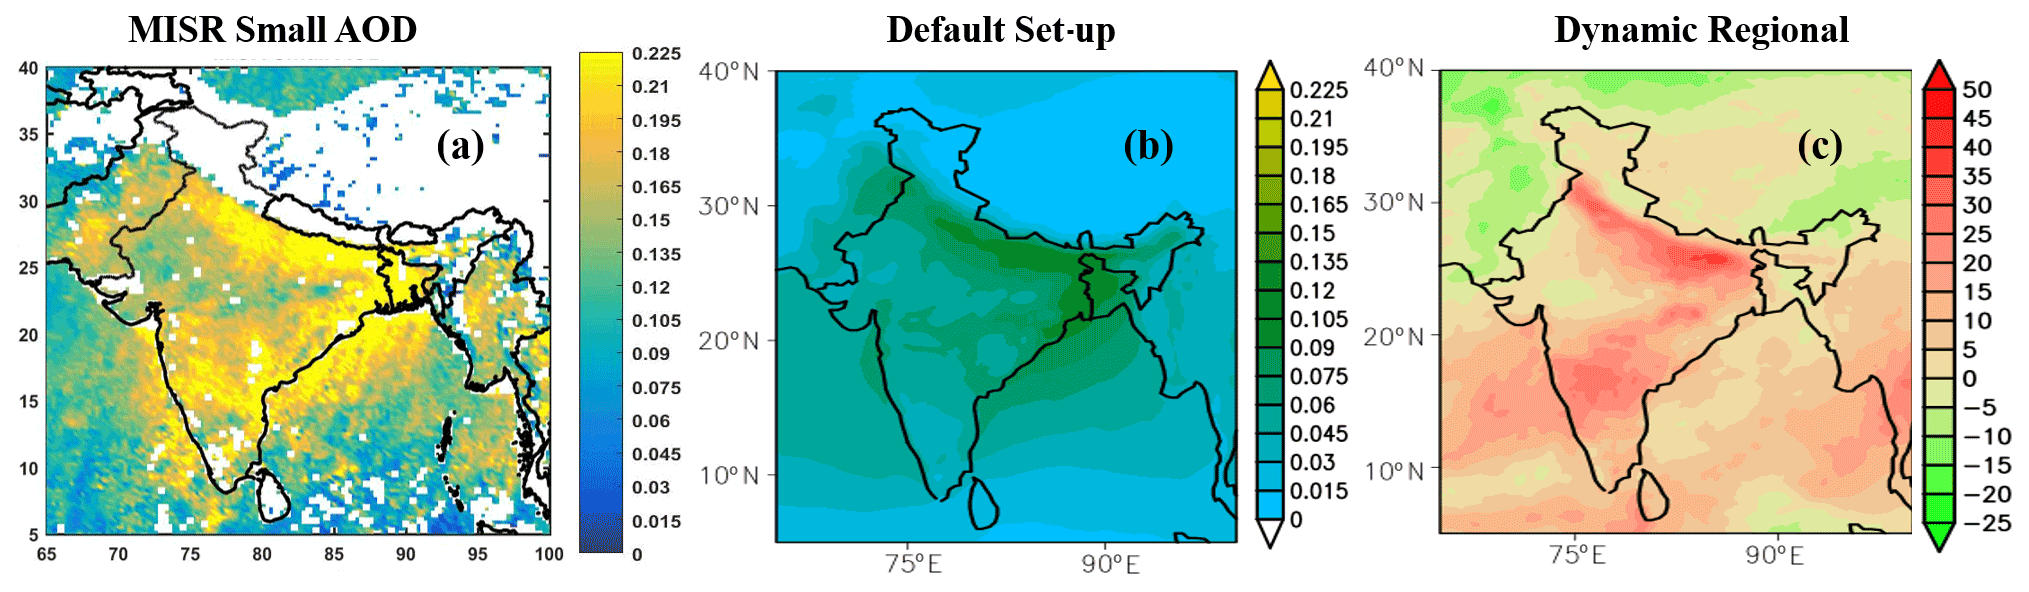
Figure 7Spatial distribution of (a) MISR small-mode AOD (white colour implies no data), (b) AAOD simulated by Default_Sc, and (c) the percentage increase in AAOD simulated by the augmented model with respect to Default_Sc for 2010.
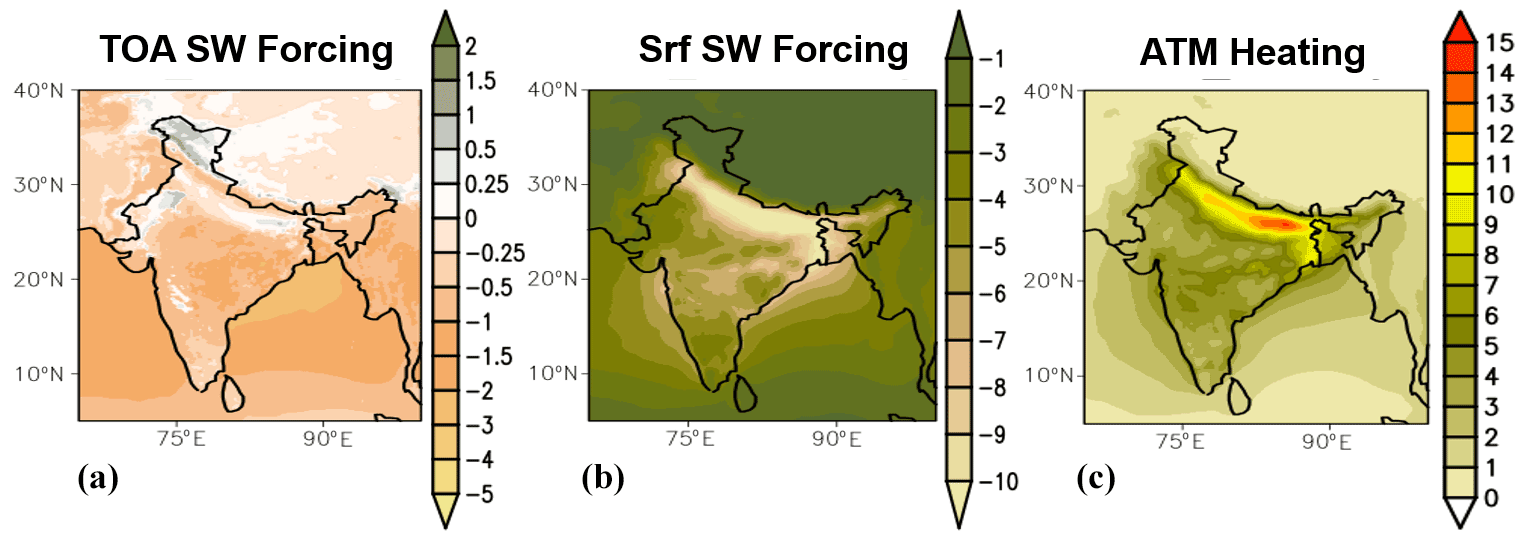
Figure 8Annual variation in SW radiative forcing (W m−2) at TOA (a), at the surface (b), and the resultant atmospheric heating (W m−2) (c) for the customized set-up.
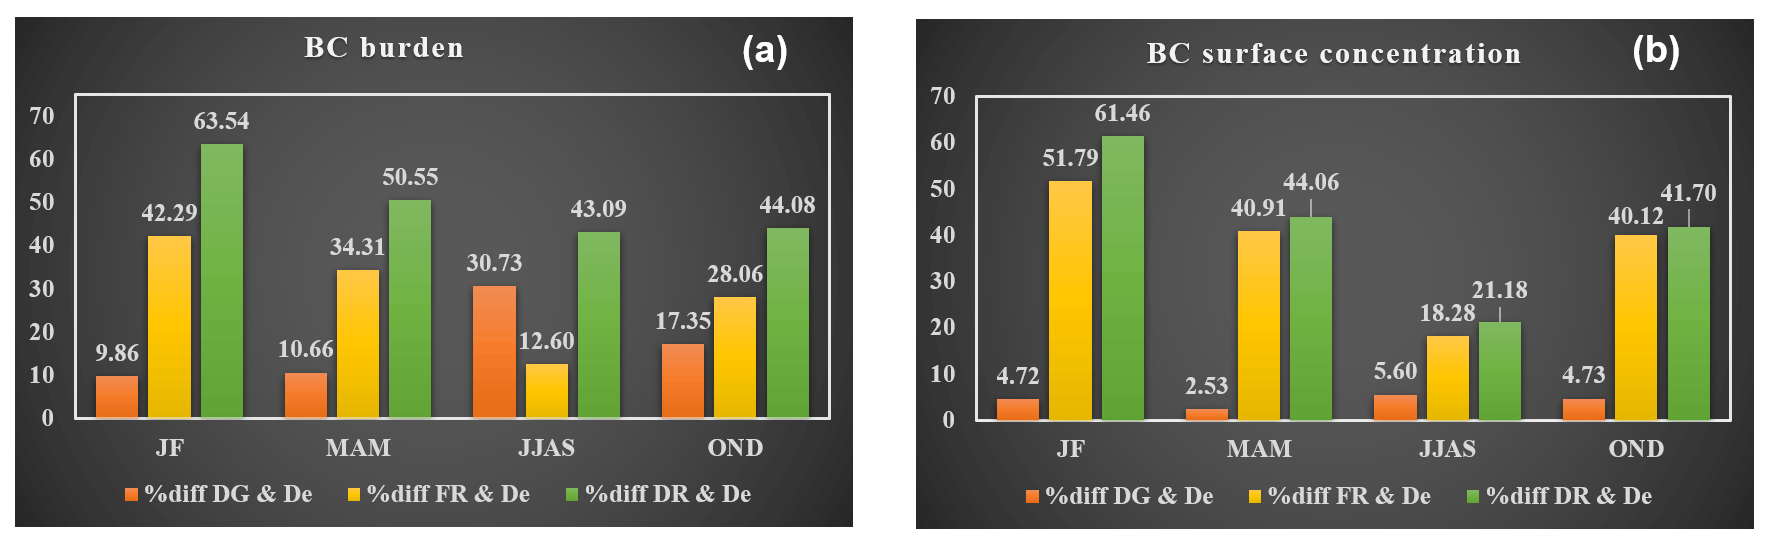
Figure 9Seasonal variations in the percentage changes in the (a) BC burden (mg m−2) and (b) BC surface concentration (µg m−3) for each sensitivity experiment with respect to the default set-up, where “De” represents Default, “DG” represents Dyn_global, “FR” represents Fix_Regio, and “DR” represents Dyn_Regio.
Spatial patterns of the annual top-of-the-atmosphere (TOA), surface, and atmospheric radiative forcing associated with the anthropogenic aerosols for the augmented model are shown in Fig. 8. Currently, the model does not assume aerosol interaction with clouds; therefore, the radiative feedback is mainly governed by direct radiative forcing. Hence, secondary effects due to aerosols cannot be considered for the observed values in Fig. 8. The TOA aerosol radiative forcing lies in the range of −0.5 to −1.5 W m−2 over most of the Indian landmass, except the IGP, where it is positive (0.25 to 1 W m−2) due to the higher concentration of carbonaceous aerosols (Figs. 1, 3), particularly BC. The TOA forcing is also positive over the Indian desert and snow-covered regions, even when the carbonaceous aerosol concentrations are lower or comparable to the rest of India. The high surface albedo in these regions allows for an enhanced interaction of the carbonaceous aerosols with solar radiation, resulting in a warming effect (Satheesh, 2002). The surface radiative forcing is found to be larger than −10 W m−2 over the polluted IGP, which is consistent with published results (Ramanathan and Carmichael, 2008). Over the rest of India, the surface forcing values lie between −3 and −8 W m−2. Due to the model improvements (forcing estimates with the default model are shown in Fig. 8), the TOA forcing changes by −72.75 %, and the surface dimming increases by 39.73 % over the IGP; over PI, TOA forcing changes by −23.94 %, and the surface dimming increases by 34.35 %. As a result, the atmospheric heating increases by ∼9 W m−2 over the IGP. The simulated surface short-wave (SW) radiation shows a statistically significant (p<0.05) correlation with the observations from CERES (Clouds and the Earth’s Radiant Energy System; Su et al., 2005) all-sky and clear-sky radiation throughout the year except under MAM and JJAS clear-sky conditions (Figs. S26, S27). Here, we did not separate clear and cloudy days because aerosol–cloud interactions are absent in the model. Therefore, the reflection from clouds will also be lower. As a result, the contribution of cloud reflections to the observed AAOD (in Fig. S25) will also be lower. Thus, the AAOD distribution over the IGP is primarily responsible for the surface dimming effect and the resulting atmospheric heating.
Accurate estimates of emission fluxes and a better representation of aerosol processes are required to improve the representation of aerosol life cycle and radiative effects in climate models. Here, we modified the regional climate model RegCM4 by implementing a dynamic ageing scheme and a regional emission inventory, and we examined the combined impact of these factors on the model performance over the Indian monsoon region. The percentage difference (in Fig. 9) clearly showed that the Fix_Regio experiment simulates a comparable BC concentration and burden (except monsoon) to that of Dyn_Regio (augmented model). Therefore, regional emissions are a dominant influence in the model estimates of tracer distribution. We note that, although the aerosol simulations improve due to these model enhancements, some systematic biases persist (underestimation of carbonaceous aerosol concentrations) and need to be further addressed. For example, RegCM has a bulk scheme for anthropogenic aerosols; thus, the number concentration is calculated from the bulk mass concentration (Ghosh et al., 2021a). Hence, the anthropogenic aerosol module can be improved by including a particle-size-dependent representation. In addition, the present dynamic ageing timescale depends only on the anthropogenic aerosol number concentration, whereas it should, in fact, depend on the total (anthropogenic and natural) number concentrations. The simulations presented in this work did not include natural aerosols, which could have impacted the meteorology through dynamic feedback, thereby possibly affecting the carbonaceous aerosol burden. This aspect will be examined in future work. Finally, although the emission fluxes of BC, OC, and SO2 are higher in the regional than in the global inventory, there may still be uncertainty related to missing sectoral sources.
Our work demonstrates that even the improvement of some aspects of the aerosol representation can lead to substantial enhancements in the model performance. Over the South Asian monsoon region, particularly over highly polluted regions such as the IGP, we also find that the default model significantly underestimates the surface dimming and atmospheric heating, which can have implications for climate studies (Das et al., 2016, 2020); this problem is substantially ameliorated with our model augmentations.
The key conclusions of our work can be summarized as follows:
-
Implementation of a dynamic ageing scheme and a regional emission inventory in RegCM4 substantially improves the model performance over the Indian subcontinent.
-
The combined impact of both modifications leads to improvements of the model performance with respect to simulating BC and OC surface concentration and column burden; however, emissions play a dominant role.
-
The respective TOA, surface, and atmospheric radiative forcing are estimated to be −0.3, −5.3, and 5.0 W m−2 over the polluted IGP using the augmented model, but they could still be underestimated.
The RegCM4 code is freely available from https://doi.org/10.5281/zenodo.5729783 (Ghosh et al., 2021b). The anthropogenic aerosol emissions considered for the simulations are taken from the IIASA inventory. The data used can be freely accessed at http://clima-dods.ictp.it/Data/RegCM_Data/RCP_EMGLOB_PROCESSED/iiasa/ (last access: 23 November 2022). Input files for the RegCM4 model are archived at http://clima-dods.ictp.it/Data/RegCM_Data/ (last access: 23 November 2022). MISR data are freely available from https://www-misr.jpl.nasa.gov/ (last access: 23 November 2022), and MERRA-2 data are freely available from the NASA Giovanni site at https://giovanni.gsfc.nasa.gov/giovanni/ (last access: 23 November 2022).
The supplement related to this article is available online at: https://doi.org/10.5194/gmd-16-1-2023-supplement.
SG, SDey, and NR designed the study. SG modified the RegCM4.6 and performed the simulations with help from GG and SDas. SG analysed the model output and wrote the paper with the reviews and edits from SDey, NR, DG, CV, FG, SNT, RS, RAT, HG, and AKS.
The contact author has declared that none of the authors has any competing interests.
Publisher’s note: Copernicus Publications remains neutral with regard to jurisdictional claims in published maps and institutional affiliations.
The views expressed in this document are solely those of the authors and do not necessarily reflect those of the Ministry. The Ministry does not endorse any products or commercial services mentioned in this publication.
We thank the Aerosol Radiative Forcing over India (ARFINET) project of the Indian Space Research Organisation Geosphere–Biosphere Programme (ISRO GBP) for sharing the BC data. The authors thank the internal review committee of the NCAP-COALESCE project for their comments and suggestions. Sudipta Ghosh acknowledges the Keeling supercomputing facility at the University of Illinois Urbana-Champaign. Sagnik Dey acknowledges IIT Delhi for support in the form of an institute chair fellowship.
This work has been supported by MoEFCC in the framework of the NCAP-COALESCE project (grant no. 14/10/2014-CC). Sudipta Ghosh has been supported by a DST-INSPIRE fellowship (grant no. IF150055) and a Fulbright–Kalam Climate doctoral fellowship. Nicole Riemer has been supported by funding from the NSF (grant no. AGS-1254428) and DOE (grant no. DE-SC0019192). Funding from the Department of Science and Technology – Funds for Improvement of S&T Infrastructure in Universities and Higher Educational Institutions (DST-FIST; grant no. SR/FST/ESII-016/2014) has also been received.
This paper was edited by Holger Tost and reviewed by three anonymous referees.
Ajay, P., Pathak, B., Solmon, F., Bhuyan, P. K., and Giorgi, F.: Obtaining best parameterization scheme of RegCM 4.4 for aerosols and chemistry simulations over the CORDEX South Asia, Clim. Dynam., 53, 329–352, https://doi.org/10.1007/s00382-018-4587-3, 2019.
Babu, S. S., Manoj, M. R., Moorthy, K. K., Gogoi, M. M., Nair, V. S., Kompalli, S. K., Satheesh, S. K., Niranjan, K., Ramagopal, K., Bhuyan, P. K., and Singh, D.: Trends in aerosol optical depth over Indian region: Potential causes and impact indicators, J. Geophys. Res.-Atmos., 118, 11794–11806, https://doi.org/10.1002/2013JD020507, 2013.
Bond, T. C., Doherty, S. J., Fahey, D. W., Forster, P. M., Berntsen, T., Deangelo, B. J., Flanner, M. G., Ghan, S., Kärcher, B., Koch, D., Kinne, S., Kondo, Y., Quinn, P. K., Sarofim, M. C., Schultz, M. G., Schulz, M., Venkataraman, C., Zhang, H., Zhang, S., Bellouin, N., Guttikunda, S. K., Hopke, P. K., Jacobson, M. Z., Kaiser, J. W., Klimont, Z., Lohmann, U., Schwarz, J. P., Shindell, D., Storelvmo, T., Warren, S. G., and Zender, C. S.: Bounding the role of black carbon in the climate system: A scientific assessment, J. Geophys. Res.-Atmos., 118, 5380–5552, https://doi.org/10.1002/jgrd.50171, 2013.
Bretherton, C. S., McCaa, J. R., and Grenier, H.: A New Parameterization for Shallow Cumulus Convection and Its Application to Marine Subtropical Cloud-Topped Boundary Layers. Part I: Description and 1D Results, Mon, Weather Rev., 132, 864–882, https://doi.org/10.1175/1520-0493(2004)132<0864:ANPFSC>2.0.CO;2, 2004.
Buchard, V., Randles, C. A., Silva, A. M. da, Darmenov, A., Colarco, P. R., Govindaraju, R., Ferrare, R., Hair, J., Beyersdorf, A. J., Ziemba, L. D., and Yu, H.: The MERRA-2 Aerosol Reanalysis, 1980 Onward. Part II: Evaluation and Case Studies, J. Climate, 30, 6851–6872, https://doi.org/10.1175/JCLI-D-16-0613.1, 2017.
Das, S., Dey, S., Dash, S. K., Giuliani, G., and Solmon, F.: Dust aerosol feedback on the Indian summer monsoon: Sensitivity to absorption property, J. Geophys. Res., 120, 9642–9652, https://doi.org/10.1002/2015JD023589, 2015.
Das, S., Dey, S., and Dash, S. K.: Direct radiative effects of anthropogenic aerosols on Indian summer monsoon circulation, Theor. Appl. Clim., 124, 629–639, https://doi.org/10.1007/s00704-015-1444-8, 2016.
Das, S., Giorgi, F., Giuliani, G., Dey, S., and Coppola, E.: Near-Future Anthropogenic Aerosol Emission Scenarios and Their Direct Radiative Effects on the Present-Day Characteristics of the Indian Summer Monsoon, J. Geophys. Res.-Atmos., 125, e2019JD031414, https://doi.org/10.1029/2019JD031414, 2020.
Dash, S. K., Mishra, S. K., Pattnayak, K. C., Mamgain, A., Mariotti, L., Coppola, E., Giorgi, F., and Giuliani, G.: Projected seasonal mean summer monsoon over India and adjoining regions for the twenty-first century, Theor. Appl. Climatol., 122, 581–593, https://doi.org/10.1007/s00704-014-1310-0, 2015.
Dee, D. P., Uppala, S. M., Simmons, A. J., Berrisford, P., Poli, P., Kobayashi, S., Andrae, U., Balmaseda, M. A., Balsamo, G., Bauer, P., Bechtold, P., Beljaars, A. C. M., van de Berg, L., Bidlot, J., Bormann, N., Delsol, C., Dragani, R., Fuentes, M., Geer, A. J., Haimberger, L., Healy, S. B., Hersbach, H., Hólm, E. V., Isaksen, L., Kållberg, P., Köhler, M., Matricardi, M., Mcnally, A. P., Monge-Sanz, B. M., Morcrette, J. J., Park, B. K., Peubey, C., de Rosnay, P., Tavolato, C., Thépaut, J. N., and Vitart, F.: The ERA-Interim reanalysis: Configuration and performance of the data assimilation system, Q. J. Roy. Meteor. Soc., 137, 553–597, https://doi.org/10.1002/qj.828, 2011.
Dey, S. and Di Girolamo, L.: A climatology of aerosol optical and microphysical properties over the Indian subcontinent from 9 years (2000–2008) of Multiangle Imaging Spectroradiometer (MISR) data, J. Geophys. Res.-Atmos., 115, D15204, https://doi.org/10.1029/2009JD013395, 2010.
Dickinson, R., Henderson-Sellers, A., and Kennedy, P.: Biosphere-atmosphere Transfer Scheme (BATS) Version 1e as Coupled to the NCAR Community Climate Model, UCAR/NCAR, https://doi.org/10.5065/D67W6959, 1993.
Diner, D. J., Beckert, J. C., Reilly, T. H., Bruegge, C. J., Conel, J. E., Kahn, R. A., Martonchik, J. V., Ackerman, T. P., Davies, R., Gerstl, S. A. W., Gordon, H. R., Muller, J.-P., Myneni, R. B., Sellers, P. J., Pinty, B., and Verstraete, M. M.: Multi-angle Imaging SpectroRadiometer (MISR) instrument description and experiment overview, IEEE T. Geosci. Remote, 36, 1072–1087, https://doi.org/10.1109/36.700992, 1998.
Emanuel, K. A. and Živković-Rothman, M.: Development and Evaluation of a Convection Scheme for Use in Climate Models, J. Atmos. Sci., 56, 1766–1782, https://doi.org/10.1175/1520-0469(1999)056<1766:DAEOAC>2.0.CO;2, 1999.
Gadhavi, H. S., Renuka, K., Ravi Kiran, V., Jayaraman, A., Stohl, A., Klimont, Z., and Beig, G.: Evaluation of black carbon emission inventories using a Lagrangian dispersion model – a case study over southern India, Atmos. Chem. Phys., 15, 1447–1461, https://doi.org/10.5194/acp-15-1447-2015, 2015.
Ghosh, S., Riemer, N., Giuliani, G., Giorgi, F., Ganguly, D., and Dey, S.: Sensitivity of Carbonaceous Aerosol Properties to the Implementation of a Dynamic Aging Parameterization in the Regional Climate Model RegCM, J. Geophys. Res.-Atmos., 126, e2020JD033613, https://doi.org/10.1029/2020JD033613, 2021a.
Ghosh, S., Dey, S., Das, S., Riemer, N., Giuliani, G., Ganguly, D., Venkatraman, C., Giorgi, F., Tripathi, S. N., Ramachandran, S., Rajesh, T. A., Gadhavi, H., and Srivastava, A. K.: RegCM 4.6.1 code used for “Towards an improved representation of carbonaceous aerosols over the Indian monsoon region in a regional climate model RegCM” (4.6.1-carb), Zenodo [code], https://doi.org/10.5281/zenodo.5729783, 2021b.
Giorgi, F., Jones, C., and Asrar, G. R.: Addressing climate information needs at the regional level: the CORDEX framework, WMO Bulletin, 2009.
Giorgi, F., Coppola, E., Solmon, F., Mariotti, L., Sylla, M. B., Bi, X., Elguindi, N., Diro, G. T., Nair, V., Giuliani, G., Turuncoglu, U. U., Cozzini, S., Güttler, I., O'Brien, T. A., Tawfik, A. B., Shalaby, A., Zakey, A. S., Steiner, A. L., Stordal, F., Sloan, L. C., and Brankovic, C.: RegCM4: Model description and preliminary tests over multiple CORDEX domains, Clim. Res., 52, 7–29, https://doi.org/10.3354/cr01018, 2012.
Gogoi, M. M., Babu, S. S., Arun, B. S., Moorthy, K. K., Ajay, A., Ajay, P., Suryavanshi, A., Borgohain, A., Guha, A., Shaikh, A., Pathak, B., Gharai, B., Ramasamy, B., Balakrishnaiah, G., Menon, H. B., Kuniyal, J. C., Krishnan, J., Gopal, K. R., Maheswari, M., Naja, M., Kaur, P., Bhuyan, P. K., Gupta, P., Singh, P., Srivastava, P., Singh, R. S., Kumar, R., Rastogi, S., Kundu, S. S., Kompalli, S. K., Panda, S., Rao, T. C., Das, T., and Kant, Y.: Response of ambient BC concentration across the Indian region to the nation-wide lockdown: results from the ARFINET measurements of, Cur. Sci., 120, 341–351, 2021.
Grell, G., Dudhia, J., and Stauffer, D.: A description of the fifth-generation Penn State/NCAR Mesoscale Model (MM5), UCAR/NCAR, https://doi.org/10.5065/D60Z716B, 1994.
Grenier, H. and Bretherton, C. S.: A Moist PBL Parameterization for Large-Scale Models and Its Application to Subtropical Cloud-Topped Marine Boundary Layers, Mon. Weather Rev., 129, 357–377, https://doi.org/10.1175/1520-0493(2001)129<0357:AMPPFL>2.0.CO;2, 2001.
Hansen, A. D. A., Rosen, H., and Novakov, T.: The aethalometer – An instrument for the real-time measurement of optical absorption by aerosol particles, Sci. Total Environ., 36, 191–196, https://doi.org/10.1016/0048-9697(84)90265-1, 1984.
Jain, C. D., Gadhavi, H. S., Wankhede, T., Kallelapu, K., Sudhesh, S., Das, L. N., Pai, R. U., and Jayaraman, A.: Spectral Properties of Black Carbon Produced during Biomass Burning, Aerosol Air Qual. Res., 18, 671–679, https://doi.org/10.4209/aaqr.2017.03.0102, 2018.
Kahn, R., Li, W.-H., Martonchik, J. V., Bruegge, C. J., Diner, D. J., Gaitley, B. J., Abdou, W., Dubovik, O., Holben, B., Smirnov, A., Jin, Z., and Clark, D.: MISR Calibration and Implications for Low-Light-Level Aerosol Retrieval over Dark Water, J. Atmos. Sci., 62, 1032–1052, https://doi.org/10.1175/JAS3390.1, 2005.
Kahn, R. A. and Gaitley, B. J.: An analysis of global aerosol type as retrieved by MISR, J. Geophys. Res.-Atmos., 120, 4248–4281, https://doi.org/10.1002/2015JD023322, 2015.
Kanakidou, M., Seinfeld, J. H., Pandis, S. N., Barnes, I., Dentener, F. J., Facchini, M. C., Van Dingenen, R., Ervens, B., Nenes, A., Nielsen, C. J., Swietlicki, E., Putaud, J. P., Balkanski, Y., Fuzzi, S., Horth, J., Moortgat, G. K., Winterhalter, R., Myhre, C. E. L., Tsigaridis, K., Vignati, E., Stephanou, E. G., and Wilson, J.: Organic aerosol and global climate modelling: a review, Atmos. Chem. Phys., 5, 1053–1123, https://doi.org/10.5194/acp-5-1053-2005, 2005.
Kiehl, J., Hack, J., Bonan, G., Boville, B., Briegleb, B., Williamson, D., and Rasch, P.: Description of the NCAR Community Climate Model (CCM3), UCAR/NCAR, https://doi.org/10.5065/D6FF3Q99, 1996.
Nair, V. S., Solmon, F., Giorgi, F., Mariotti, L., Babu, S. S., and Moorthy, K. K.: Simulation of South Asian aerosols for regional climate studies, J. Geophys. Res.-Atmos., 117, 4209, https://doi.org/10.1029/2011JD016711, 2012.
O'Brien, T. A., Chuang, P. Y., Sloan, L. C., Faloona, I. C., and Rossiter, D. L.: Coupling a new turbulence parametrization to RegCM adds realistic stratocumulus clouds, Geosci. Model Dev., 5, 989–1008, https://doi.org/10.5194/gmd-5-989-2012, 2012.
Pal, J. S., Small, E. E., and Eltahir, E. A. B.: Simulation of regional-scale water and energy budgets: Representation of subgrid cloud and precipitation processes within RegCM, J. Geophys. Res.-Atmos., 105, 29579–29594, https://doi.org/10.1029/2000JD900415, 2000.
Pal, J. S., Giorgi, F., Bi, X., Elguindi, N., Solmon, F., Gao, X., Rauscher, S. A., Francisco, R., Zakey, A., Winter, J., Ashfaq, M., Syed, F. S., Bell, J. L., Differbaugh, N. S., Karmacharya, J., Konari, A., Martinez, D., Da Rocha, R. P., Sloan, L. C., and Steiner, A. L.: Regional Climate Modeling for the Developing World: The ICTP RegCM3 and RegCNET, B. Am. Meteor. Soc., 88, 1395–1410, https://doi.org/10.1175/BAMS-88-9-1395, 2007.
Pandey, A. and Venkataraman, C.: Estimating emissions from the Indian transport sector with on-road fleet composition and traffic volume, Atmos. Environ., 98, 123–133, https://doi.org/10.1016/j.atmosenv.2014.08.039, 2014.
Pattnayak, K. C., Panda, S. K., Saraswat, V., and Dash, S. K.: Assessment of two versions of regional climate model in simulating the Indian Summer Monsoon over South Asia CORDEX domain, Clim. Dynam., 50, 3049–3061, https://doi.org/10.1007/s00382-017-3792-9, 2018.
Priyadharshini, B., Verma, S., Chatterjee, A., Sharma, S. K., and Mandal, T. K.: Chemical characterization of fine atmospheric particles of water-soluble ions and carbonaceous species in a tropical urban atmosphere over the eastern Indo-Gangetic plain, Aerosol Air Qual. Res., 19, 129–147, https://doi.org/10.4209/aaqr.2017.12.0606, 2019.
Putaud, J.-P., Van Dingenen, R., Alastuey, A., Bauer, H., Birmili, W., Cyrys, J., Flentje, H., Fuzzi, S., Gehrig, R., Hansson, H. C., Harrison, R. M., Herrmann, H., Hitzenberger, R., Hüglin, C., Jones, A. M., Kasper-Giebl, A., Kiss, G., Kousa, A., Kuhlbusch, T. A. J., Löschau, G., Maenhaut, W., Molnar, A., Moreno, T., Pekkanen, J., Perrino, C., Pitz, M., Puxbaum, H., Querol, X., Rodriguez, S., Salma, I., Schwarz, J., Smolik, J., Schneider, J., Spindler, G., ten Brink, H., Tursic, J., Viana, M., Wiedensohler, A., and Raes, F.: A European aerosol phenomenology – 3: Physical and chemical characteristics of particulate matter from 60 rural, urban, and kerbside sites across Europe, Atmos. Environ., 44, 1308–1320, https://doi.org/10.1016/j.atmosenv.2009.12.011, 2010.
Qian, Y., Giorgi, F., Huang, Y., Chameides, W., and Luo, C.: Regional simulation of anthropogenic sulfur over East Asia and its sensitivity to model parameters, Tellus B, 53, 171–191, 2001.
Rai, P. K., Singh, G. P., and Dash, S. K.: Projected Change and Variability Assessment of Indian Summer Monsoon Precipitation in South Asia CORDEX Domain Under High-Emission Pathway, Pure Appl. Geophys., 177, 3475–3499, https://doi.org/10.1007/s00024-019-02373-3, 2020.
Ram, K., Sarin, M. M., and Tripathi, S. N.: A 1 year record of carbonaceous aerosols from an urban site in the Indo-Gangetic Plain: Characterization, sources, and temporal variability, J. Geophys. Res.-Atmos., 115, D24313, https://doi.org/10.1029/2010JD014188, 2010.
Ramanathan, V. and Carmichael, G.: Global and regional climate changes due to black carbon, Nat. Geosci., 1, 221–227, https://doi.org/10.1038/ngeo156, 2008.
Riemer, N., Ault, A. P., West, M., Craig, R. L., and Curtis, J. H.: Aerosol Mixing State: Measurements, Modeling, and Impacts, Rev. Geophys., 57, 187–249, https://doi.org/10.1029/2018RG000615, 2019.
Sadavarte, P. and Venkataraman, C.: Trends in multi-pollutant emissions from a technology-linked inventory for India: I. Industry and transport sectors, Atmos. Environ., 99, 353–364, https://doi.org/10.1016/j.atmosenv.2014.09.081, 2014.
Satheesh, S. K.: Letter to the Editor Aerosol radiative forcing over land: effect of surface and cloud reflection, Ann. Geophys., 20, 2105–2109, https://doi.org/10.5194/angeo-20-2105-2002, 2002.
Shalaby, A., Zakey, A. S., Tawfik, A. B., Solmon, F., Giorgi, F., Stordal, F., Sillman, S., Zaveri, R. A., and Steiner, A. L.: Implementation and evaluation of online gas-phase chemistry within a regional climate model (RegCM-CHEM4), Geosci. Model Dev., 5, 741–760, https://doi.org/10.5194/gmd-5-741-2012, 2012.
Singh, A., Rastogi, N., Kumar, V., Slowik, J. G., Satish, R., Lalchandani, V., Thamban, N. M., Rai, P., Bhattu, D., Vats, P., Ganguly, D., Tripathi, S. N., and Prévôt, A. S. H.: Sources and characteristics of light-absorbing fine particulates over Delhi through the synergy of real-time optical and chemical measurements, Atmos. Environ., 252, 118338, https://doi.org/10.1016/j.atmosenv.2021.118338, 2021.
Solmon, F., Giorgi, F., and Liousse, C.: Aerosol modelling for regional climate studies: Application to anthropogenic particles and evaluation over a European/African domain, Tellus B, 58, 51–72, https://doi.org/10.1111/j.1600-0889.2005.00155.x, 2006.
Srivastava, A. K., Dey, S., and Tripathi, S. N.: Aerosol Characteristics over the Indo-Gangetic Basin: Implications to Regional Climate, IntechOpen, 47–80, https://doi.org/10.5772/47782, 2012.
Su, W., Charlock, T. P., and Rose, F. G.: Deriving surface ultraviolet radiation from CERES surface and atmospheric radiation budget: Methodology, J. Geophys. Res.-Atmos., 110, D14209 https://doi.org/10.1029/2005JD005794, 2005.
Szopa, S., Naik, V., Adhikary, B., Artaxo, P., Berntsen, T., Collins, W. D., Fuzzi, S., Gallardo, L., Kiendler-Scharr, A., Klimont, Z., Liao, H., Unger, N., and Zanis, P.: Short-Lived Climate Forcers, in: Climate Change 2021: The Physical Science Basis. Contribution of Working Group I to the Sixth Assessment Report of the Intergovernmental Panel on Climate Change, edited by: Masson-Delmotte, V., Zhai, P., Pirani, A., Connors, S. L., Péan, C., Berger, S., Caud, N., Chen, Y., Goldfarb, L., Gomis, M. I., Huang, M., Leitzell, K., Lonnoy, E., Matthews, J. B. R., Maycock, T. K., Waterfield, T., Yelekçi, O., Yu, R., and Zhou, B., Cambridge University Press, Cambridge, United Kingdom and New York, NY, USA, 817–922, 2021.
Tibrewal, K. and Venkataraman, C.: Climate co-benefits of air quality and clean energy policy in India, Nat. Sustain., 4, 305–313, https://doi.org/10.1038/s41893-020-00666-3, 2021.
Tiedtke, M.: Representation of Clouds in Large-Scale Models, Mon. Weather Rev., 121, 3040–3061, https://doi.org/10.1175/1520-0493(1993)121<3040:ROCILS>2.0.CO;2, 1993.
Tripathi, S. N., Dey, S., Tare, V., Satheesh, S. K., Lal, S., and Venkataramani, S.: Enhanced layer of black carbon in a north Indian industrial city, Geophys. Res. Lett., 32, L12802, https://doi.org/10.1029/2005GL022564, 2005.
UNFCCC: Adoption of the Paris Agreement FCCC/CP/2015/L.9/Rev.1, United Nations Framework Convention on Climate Change, 32 pp., https://unfccc.int/resource/docs/2015/cop21/eng/l09r01.pdf (last access: 22 November 2022), 2015.
Venkataraman, C., Brauer, M., Tibrewal, K., Sadavarte, P., Ma, Q., Cohen, A., Chaliyakunnel, S., Frostad, J., Klimont, Z., Martin, R. V., Millet, D. B., Philip, S., Walker, K., and Wang, S.: Source influence on emission pathways and ambient PM2.5 pollution over India (2015–2050), Atmos. Chem. Phys., 18, 8017–8039, https://doi.org/10.5194/acp-18-8017-2018, 2018.
Venkataraman, C., Bhushan, M., Dey, S., Ganguly, D., Gupta, T., Habib, G., Kesarkar, A., Phuleria, H., and Sunder Raman, R.: Indian network project on carbonaceous aerosol emissions, source apportionment and climate impacts (COALESCE), B. Am. Meteor. Soc., 101, E1052–E1068, https://doi.org/10.1175/BAMS-D-19-0030.1, 2020.
Zakey, A. S., Solmon, F., and Giorgi, F.: Implementation and testing of a desert dust module in a regional climate model, Atmos. Chem. Phys., 6, 4687–4704, https://doi.org/10.5194/acp-6-4687-2006, 2006.
Zakey, A. S., Giorgi, F., and Bi, X.: Modeling of sea salt in a regional climate model: Fluxes and radiative forcing, J. Geophys. Res.-Atmos., 113, 14221, https://doi.org/10.1029/2007JD009209, 2008.