the Creative Commons Attribution 4.0 License.
the Creative Commons Attribution 4.0 License.
 | 18 Jan 2022
WRF v.3.9 sensitivity to land surface model and horizontal resolution changes over North America
Almudena García-García
Francisco José Cuesta-Valero
J. Fidel González-Rouco
Elena García-Bustamante
Understanding the differences between regional simulations of land–atmosphere interactions and near-surface conditions is crucial for a more reliable representation of past and future climate. Here, we explore the effect of changes in the model's horizontal resolution on the simulated energy balance at the surface and near-surface conditions using the Weather Research and Forecasting (WRF) model. To this aim, an ensemble of 12 simulations using three different horizontal resolutions (25, 50 and 100 km) and four different land surface model (LSM) configurations over North America from 1980 to 2013 is developed. Our results show that finer resolutions lead to higher surface net shortwave radiation and maximum temperatures at mid and high latitudes. At low latitudes over coastal areas, an increase in resolution leads to lower values of sensible heat flux and higher values of latent heat flux, as well as lower values of surface temperatures and higher values of precipitation, and soil moisture in summer. The use of finer resolutions leads then to an increase in summer values of latent heat flux and convective and non-convective precipitation and soil moisture at low latitudes. The effect of the LSM choice is larger than the effect of horizontal resolution on the near-surface temperature conditions. By contrast, the effect of the LSM choice on the simulation of precipitation is weaker than the effect of horizontal resolution, showing larger differences among LSM simulations in summer and over regions with high latent heat flux. Comparison between observations and the simulation of daily maximum and minimum temperatures and accumulated precipitation indicates that the CLM4 LSM yields the lowest biases in maximum and minimum mean temperatures but the highest biases in extreme temperatures. Increasing horizontal resolution leads to larger biases in accumulated precipitation over all regions particularly in summer. The reasons behind this are related to the partition between convective and non-convective precipitation, specially noticeable over western USA.
- Article
(21878 KB) - Full-text XML
-
Supplement
(95921 KB) - BibTeX
- EndNote


Most assessments of climate change impacts on ecosystems and societies are based on projections performed by regional climate models (RCMs) and/or earth system models (ESMs; IPCC, 2013, 2019). Exploring inter-model differences in present climate simulations is necessary to understand their contribution to the spread in future climate projections and ultimately to better characterize or even reduce the uncertainty in the simulation of the response to a given scenario (Cubasch et al., 2013). Understanding inter-model differences is also important for paleoclimatic studies relying on regional climate model simulations to bridge the gap between the local character of proxy reconstructions and ESM global simulations (e.g., PALEOLINK; Gómez-Navarro et al., 2018).
The representation of land–atmosphere interactions within climate models has received considerable attention during the last decades due to their influence on surface climate, vegetation and soil hydrology, and therefore, on climate variability (e.g., Lorenz et al., 2016; Vogel et al., 2017). For example, energy and water exchanges between the lower atmosphere and the ground surface have been shown to alter surface conditions, particularly during extreme weather events in summer (Seneviratne et al., 2006; Hirschi et al., 2011; Miralles et al., 2012; Hauser et al., 2016). Land–atmosphere interactions have also been studied in the evaluation of climate model simulations, applying several metrics to characterize surface energy fluxes and near-surface conditions (Koven et al., 2013; Dirmeyer et al., 2013; Sippel et al., 2017; García-García et al., 2019).
The representation of near-surface conditions (e.g., air and soil temperatures, soil moisture, etc.) and energy and water exchanges at the land surface in a climate model depends on the processes simulated by the atmospheric and soil model components, as well as on the degree of coupling implemented between both model components (Koster et al., 2006; Melo-Aguilar et al., 2018). Different land surface models (LSMs) include varying levels of realism in the representation of soil physics, land cover type, soil water content, snow cover, drip, runoff or infiltration. Thus, each LSM simulates somewhat different surface water and energy fluxes (e.g., Lawrence et al., 2019). For example, the representation of surface albedo, evaporative resistance and aerodynamic roughness by each LSM alters the simulation of the surface energy balance and consequently affects the evolution of surface temperatures (Laguë et al., 2019; MacDougall and Beltrami, 2017). The dependence of the simulated land–atmosphere interactions on the LSM has been shown in previous studies using global (García-García et al., 2019) and regional climate model simulations over North America (Pei et al., 2014; García-García et al., 2020). There are examples of these studies at local scales (Mooney et al., 2013; Wharton et al., 2013; Chen et al., 2014; Van Den Broeke et al., 2018; Liu et al., 2019; Zhuo et al., 2019) and at continental scales for Europe (Davin and Seneviratne, 2012; Mooney et al., 2013).
Horizontal resolution is another factor to take into account in the study of land–atmosphere interactions in climate model simulations. ESMs are limited by computational resources, using horizontal resolutions from approximately 250 to 100 km (e.g., CMIP5 models; Taylor et al., 2012), while RCMs allow for using much finer resolutions. Analogously, the range of horizontal resolutions employed in RCMs for climate studies is usually limited to approximately 50–25 km (e.g., CORDEX models; Giorgi and Gutowski, 2015). In spite of this enhanced resolution, an RCM's ability to reproduce temporal variability like that of precipitation at daily timescales is still limited, being greatly improved by using resolutions of ∼4 km and convection-resolving RCMs (Sun et al., 2016). Previous studies have shown some resolution-induced improvements in the simulation of precipitation, wind and high-altitude temperatures at local and regional scales with possible implications for the simulation of climate dynamics (Ban et al., 2014; Gómez-Navarro et al., 2015; Messmer et al., 2017; Hahmann et al., 2020; Vegas-Cañas et al., 2020). Small-scale weather phenomena such as sea breezes, snowstorms induced by the presence of lakes, local winds, tropical cyclones and mesoscale convective systems can be better represented with increased resolution (Wehner et al., 2010). Some studies have also suggested a resolution-induced improvement in the representation of interactions between small- and large-scale dynamical processes, ultimately leading to better large-scale atmospheric flow (Lucas-Picher et al., 2017). Thus, the difference in the resolution employed in RCMs and ESMs is expected to improve the representation of land–atmosphere interactions in RCMs through a more adequate discretization of equations, as well as through a more realistic representation of small-scale processes and topographical features (Xue et al., 2014; Rummukainen, 2016; Vegas-Cañas et al., 2020). The improved representation of land–atmosphere interactions associated with finer resolutions is also expected to induce an improvement in the simulation of near-surface conditions, especially in the simulation of extreme events (Prein et al., 2013; Di Luca et al., 2015; Rummukainen, 2016; Demory et al., 2014).
Although the literature on the impact of the LSM choice and changes in resolution on climate simulations is extensive, most studies are focused on small domains and meteorological events, providing little information about the impact of the LSM choice and horizontal resolution changes on long-term climatological variability. Here, we evaluate and compare the influence of both factors, the LSM choice and horizontal resolution, on the representation of energy and water fluxes at the surface and consequently on the simulation of near-surface conditions over North America for a climatological period spanning the time interval 1980–2013. We use the Weather Research and Forecasting (WRF) model (version 3.9; Skamarock et al., 2008) that allows for testing a number of LSM schemes, each varying in physical parameterization complexities. An ensemble of 12 simulations was generated using three different horizontal resolutions (25, 50 and 100 km), four different LSM configurations and two vegetation options, i.e., prescribed or dynamical vegetation.
The WRF representation of climate at different resolutions is expected to affect the simulation of atmospheric and surface phenomena in several ways, through a different representation of cloud formation or through a different level of details in the description of orography and land cover. Simulations with different LSMs provide information about the advantages of using a comprehensive LSM, such as the CLM4 LSM (Oleson et al., 2010), or a simpler LSM component, such as the NOAH LSM (Tewari et al., 2004). Additionally, the comparison of two identical model configurations except for the prescribed or dynamical vegetation mode provides information about the effect of a realistic evolution of vegetation cover on the energy and water balance at the surface. Thus, soil and near-surface variables from these 12 simulations are compared and also evaluated against temperature and precipitation observations to explore two questions. (1) How do changes in horizontal resolution within WRF affect the simulation of land–atmosphere interactions and near-surface conditions? (2) How do LSM differences in the simulation of land–atmosphere interactions translate into different near-surface conditions?
The descriptions of the WRF experiments and the methodology applied for the analysis are included in Sects. 2 and 3, respectively. Section 4 presents the results of the analysis, which are discussed using the available literature in Sect. 5. The conclusions and importance of this work are summarized in Sect. 6.
We performed three sets of regional simulations (12 simulations in total) over North America from 1980 to 2013 using the Advanced Research WRF model (WRF v3.9; Skamarock et al., 2008) with initial and boundary conditions from the North American Regional Reanalysis product (NARR; Mesinger et al., 2006). The NARR product was generated by the National Centers for Environmental Prediction (NCEP) Eta atmospheric model (Janjic, 1997), the NOAH LSM component (Mitchell, 2005) and the Regional Data Assimilation System (RDAS; Mesinger et al., 2006). The NARR data were obtained from the National Center for Environmental Information (NOAA) archive and provides data over a 32 km grid with a 3-hourly temporal resolution. No nudging techniques were applied within the domain of the simulation. The use of nudging techniques imposes large-scale variability within the inner scales of the domain of simulation, thus partially muting the generation of local- and regional-scale dynamical responses in favour of representing the large scale flow of the driving conditions. Avoiding nudging, therefore, allows for more clearly expressing the influences of increased resolution and of changing the LSM component (von Storch et al., 2000).
The three sets of simulations were performed using a Lambert-type projection with resolutions of 25×25 km, 50×50 km and 100×100 km. Each set includes four simulations using three different LSM components: the NOAH LSM (NOAH; Tewari et al., 2004), the NOAH LSM with multiparameterizations options (NOAH-MP; Niu et al., 2011) and the Community Land Model version 4 LSM (CLM4; Oleson et al., 2010). The fourth simulation included in each set was performed using the NOAH-MP LSM with dynamic vegetation (NOAH-MP-DV), while vegetation was prescribed for the other simulations. The rest of the WRF options remained the same for all simulations, employing 27 atmospheric levels, land cover categories from the Moderate Resolution Imaging Spectroradiometer (MODIS; Barlage et al., 2005), the WRF single moment (WSM) 6-class graupel scheme for the microphysics (Hong and Lim, 2006), the Grell–Freitas ensemble scheme (Grell and Freitas, 2014), the Yonsei University scheme for the description of the planetary boundary layer scheme (YSU; Hong et al., 2006), the revised MM5 Monin–Obukhov scheme (Jiménez et al., 2012) and the Community Atmosphere Model (CAM) scheme (Collins et al., 2004). The use of different horizontal resolutions requires the use of different time steps for performing our WRF simulations, as well as different time intervals for computing radiation physics (radt option in WRF namelist). Table 1 summarizes the differences between all simulations employed in this analysis.
Table 1Summary of the regional simulations performed in this analysis.
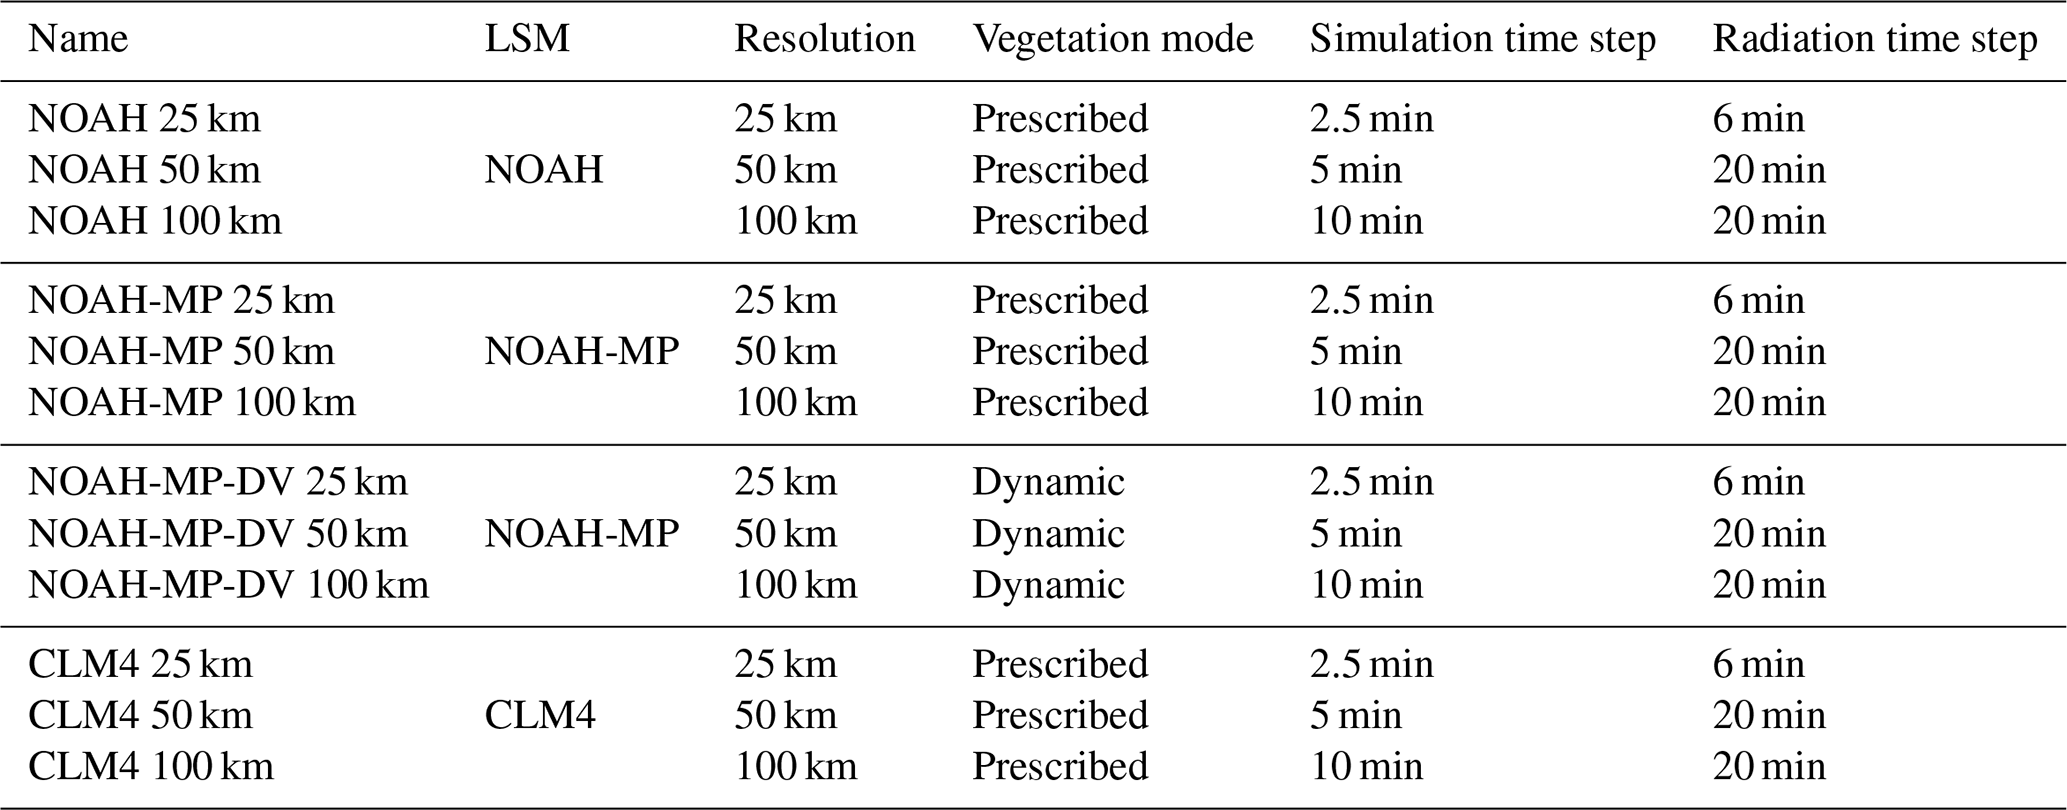
The LSM schemes used in this study differ in parameterization complexity, the NOAH being the most basic amongst the three selected LSMs. The NOAH LSM describes soil and vegetation processes for the closure of the water and energy budgets, discretizing the soil into four soil layers that reach a total of 2 m of depth (Tewari et al., 2004). Some limitations have been associated in this soil model with the represented bulk layer of canopy, snow and soil, its system to drain water at the bottom of the soil column, and its simple snowmelt dynamics (Wharton et al., 2013). The NOAH-MP version of the NOAH LSM improves soil hydrology and the representation of terrestrial biophysical processes (Niu et al., 2011). This scheme includes a separate vegetation canopy with a comprehensive description of vegetation properties. The NOAH-MP also includes a multi-layer snow pack description with liquid water storage and melting and refreezing capabilities. It includes the same soil structure as the NOAH LSM (four soil layers, down to 2 m). The CLM4 LSM incorporates a comprehensive representation of biogeophysics and hydrology, including a single-layer vegetation canopy, a five-layer snowpack and a 10-layer soil column down to a depth of 3.802 m. This scheme also characterizes each grid cell into five primary sub-grid land cover types (glacier, lake, wetland, urban and vegetated), using up to four plant functional types (PFTs) to describe vegetation physiology and structure.
We study the impact of changing horizontal resolution on surface energy fluxes and near-surface conditions as simulated by the WRF model with different LSM components. For this purpose, we estimated the temporal averages of surface energy fluxes for the analysis period (1980–2013) focusing on the following energy components: net shortwave radiation (SNET, W m−2), net longwave radiation (LNET, W m−2), net radiation absorbed by the soil (RNET, W m−2), latent heat flux (LH, W m−2), sensible heat flux (HFX, W m−2) and ground heat flux (GHF, W m−2). The temporal averages of near-surface conditions are estimated using outputs of 2 m air temperatures (SAT, ∘C), daily maximum SAT (TASMAX, ∘C), daily minimum SAT (TASMIN, ∘C), soil temperature at 1 m depth (GST 1 m, ∘C), accumulated convective and non-convective precipitation at the surface (PRECIP C and PRECIP NC, mm d−1), soil moisture contained in the first soil metre (SM 1 m, m3 m−3), and total cloud fraction (TCLDFR, %). All values are computed using the annual and seasonal (boreal winter, DJF; summer, JJA) averages over the 34-year period (1980–2013) after discarding the first year of the simulation (1979) as spin-up, which is enough to avoid the effect of initial conditions (García-García et al., 2020). Thus, we estimated the anomalies of all outputs for each LSM simulation relative to the multi-model mean (the mean of CLM4, NOAH, NOAH-MP and NOAH-MP-DV outputs) for each set of simulations with different resolution (25, 50 and 100 km). Similarly, we estimated the change in the simulation of all variables between the 100 and 50 km simulations and between the 50 and 25 km simulations for all LSM configurations. When required, outputs of all WRF experiments were mapped to the grid of the observational reference employed in this study by selecting the nearest model grid point. A Student's t test considering autocorrelation was used to identify significant differences between simulations with different LSMs and horizontal resolutions at the 95 % confidence level.
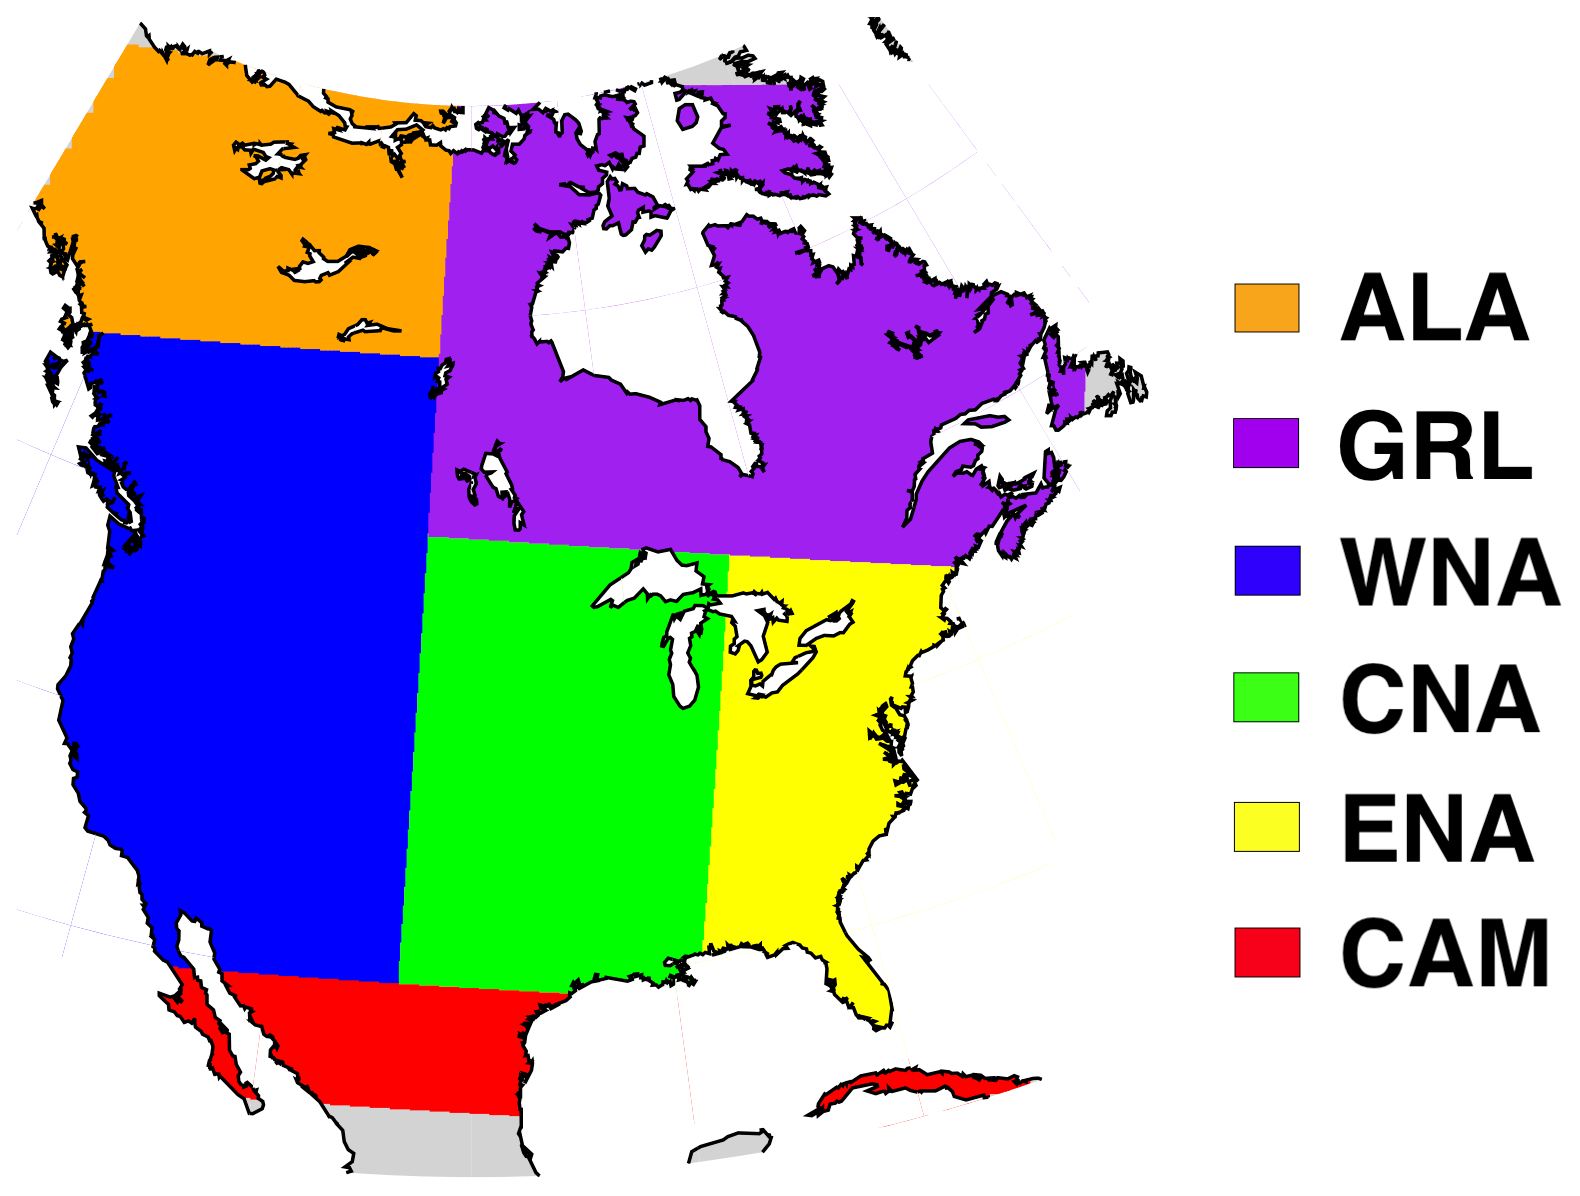
Figure 1Subregions employed for the bias analysis, adapted from Giorgi and Francisco (2000): Central America, CAM; western North America, WNA; central North America, CNA; eastern North America, ENA; Alaska, ALA; and Greenland, GRL.
Additionally, we evaluate the WRF performance in the simulation of maximum and minimum air temperature and accumulated precipitation against the Climatic Research Unit Time-Series product version 4.03 (CRU; Harris et al., 2014). The CRU database provides monthly data at a resolution of approximately 50 km. Previous studies have reported inconsistencies between different observational products, particularly important for the evaluation of model simulations with different resolutions (e.g., Iles et al., 2020). To avoid this issue, we included another observational database in the analysis; the Daily Surface Weather Data version 3 (DAYMET; Thornton et al., 2016), with daily data at approximately 1 km resolution over North America. This allows for the comparison of uncertainties associated with the choice of the observational product and the uncertainties arising from the model configuration. We calculated annual and seasonal WRF and DAYMET biases in these variables relative to the CRU data for the analysis period averaged over six subregions due to the large climate differences over North America. These six subregions cover Central and North America (NA) and are adapted from Giorgi and Francisco (2000): Central America, CAM; western North America, WNA; central North America, CNA; eastern North America, ENA; Alaska, ALA; and Greenland, GRL (Fig. 1). The impact of horizontal resolution is expected to be larger on the simulation of extreme events than on surface climatologies (Prein et al., 2013; Di Luca et al., 2015; Rummukainen, 2016). We examined this by calculating the bias in the 95th percentile of maximum and minimum temperatures and accumulated precipitation within all experiments using the DAYMET product as reference.
4.1 LSM influences on surface energy fluxes and near-surface conditions
The net radiation absorbed by the ground surface enhances turbulent (latent and sensible) fluxes at the surface and/or warms the soil surface, which leads to an increase in the emitted longwave radiation (Bonan, 2002). The relationship between these variables is shown by their corresponding ensemble mean of LSM simulations, indicating similar latitudinal patterns in net radiation, turbulent fluxes and near-surface temperatures with higher fluxes and temperatures at lower latitudes (see for example Fig. 2 for the LSM ensemble mean of the 50 km experiments). The net radiation results from adding net shortwave and longwave radiations, whose mean values have similar spatial distributions but with opposite sign (Fig. 2a). This indicates that more shortwave radiation reaches the land surface than is reflected due to surface albedo, while the radiation emitted from the soil due to its surface temperature, is higher than the longwave radiation reaching the soil surface (Fig. 2a). The energy proportion of net radiation that is propagated through the soil is much smaller than the rest of surface energy fluxes (Fig. 2b). Areas with high latent heat flux coincide with areas with high convective precipitation rates at low and middle latitudes (Fig. 2b and d). The soil moisture map shows high values southward in the Great Lakes region and low values in dry areas such as Florida and the southwest USA, in agreement with both convective and non-convective precipitation (Fig. 2d and e).
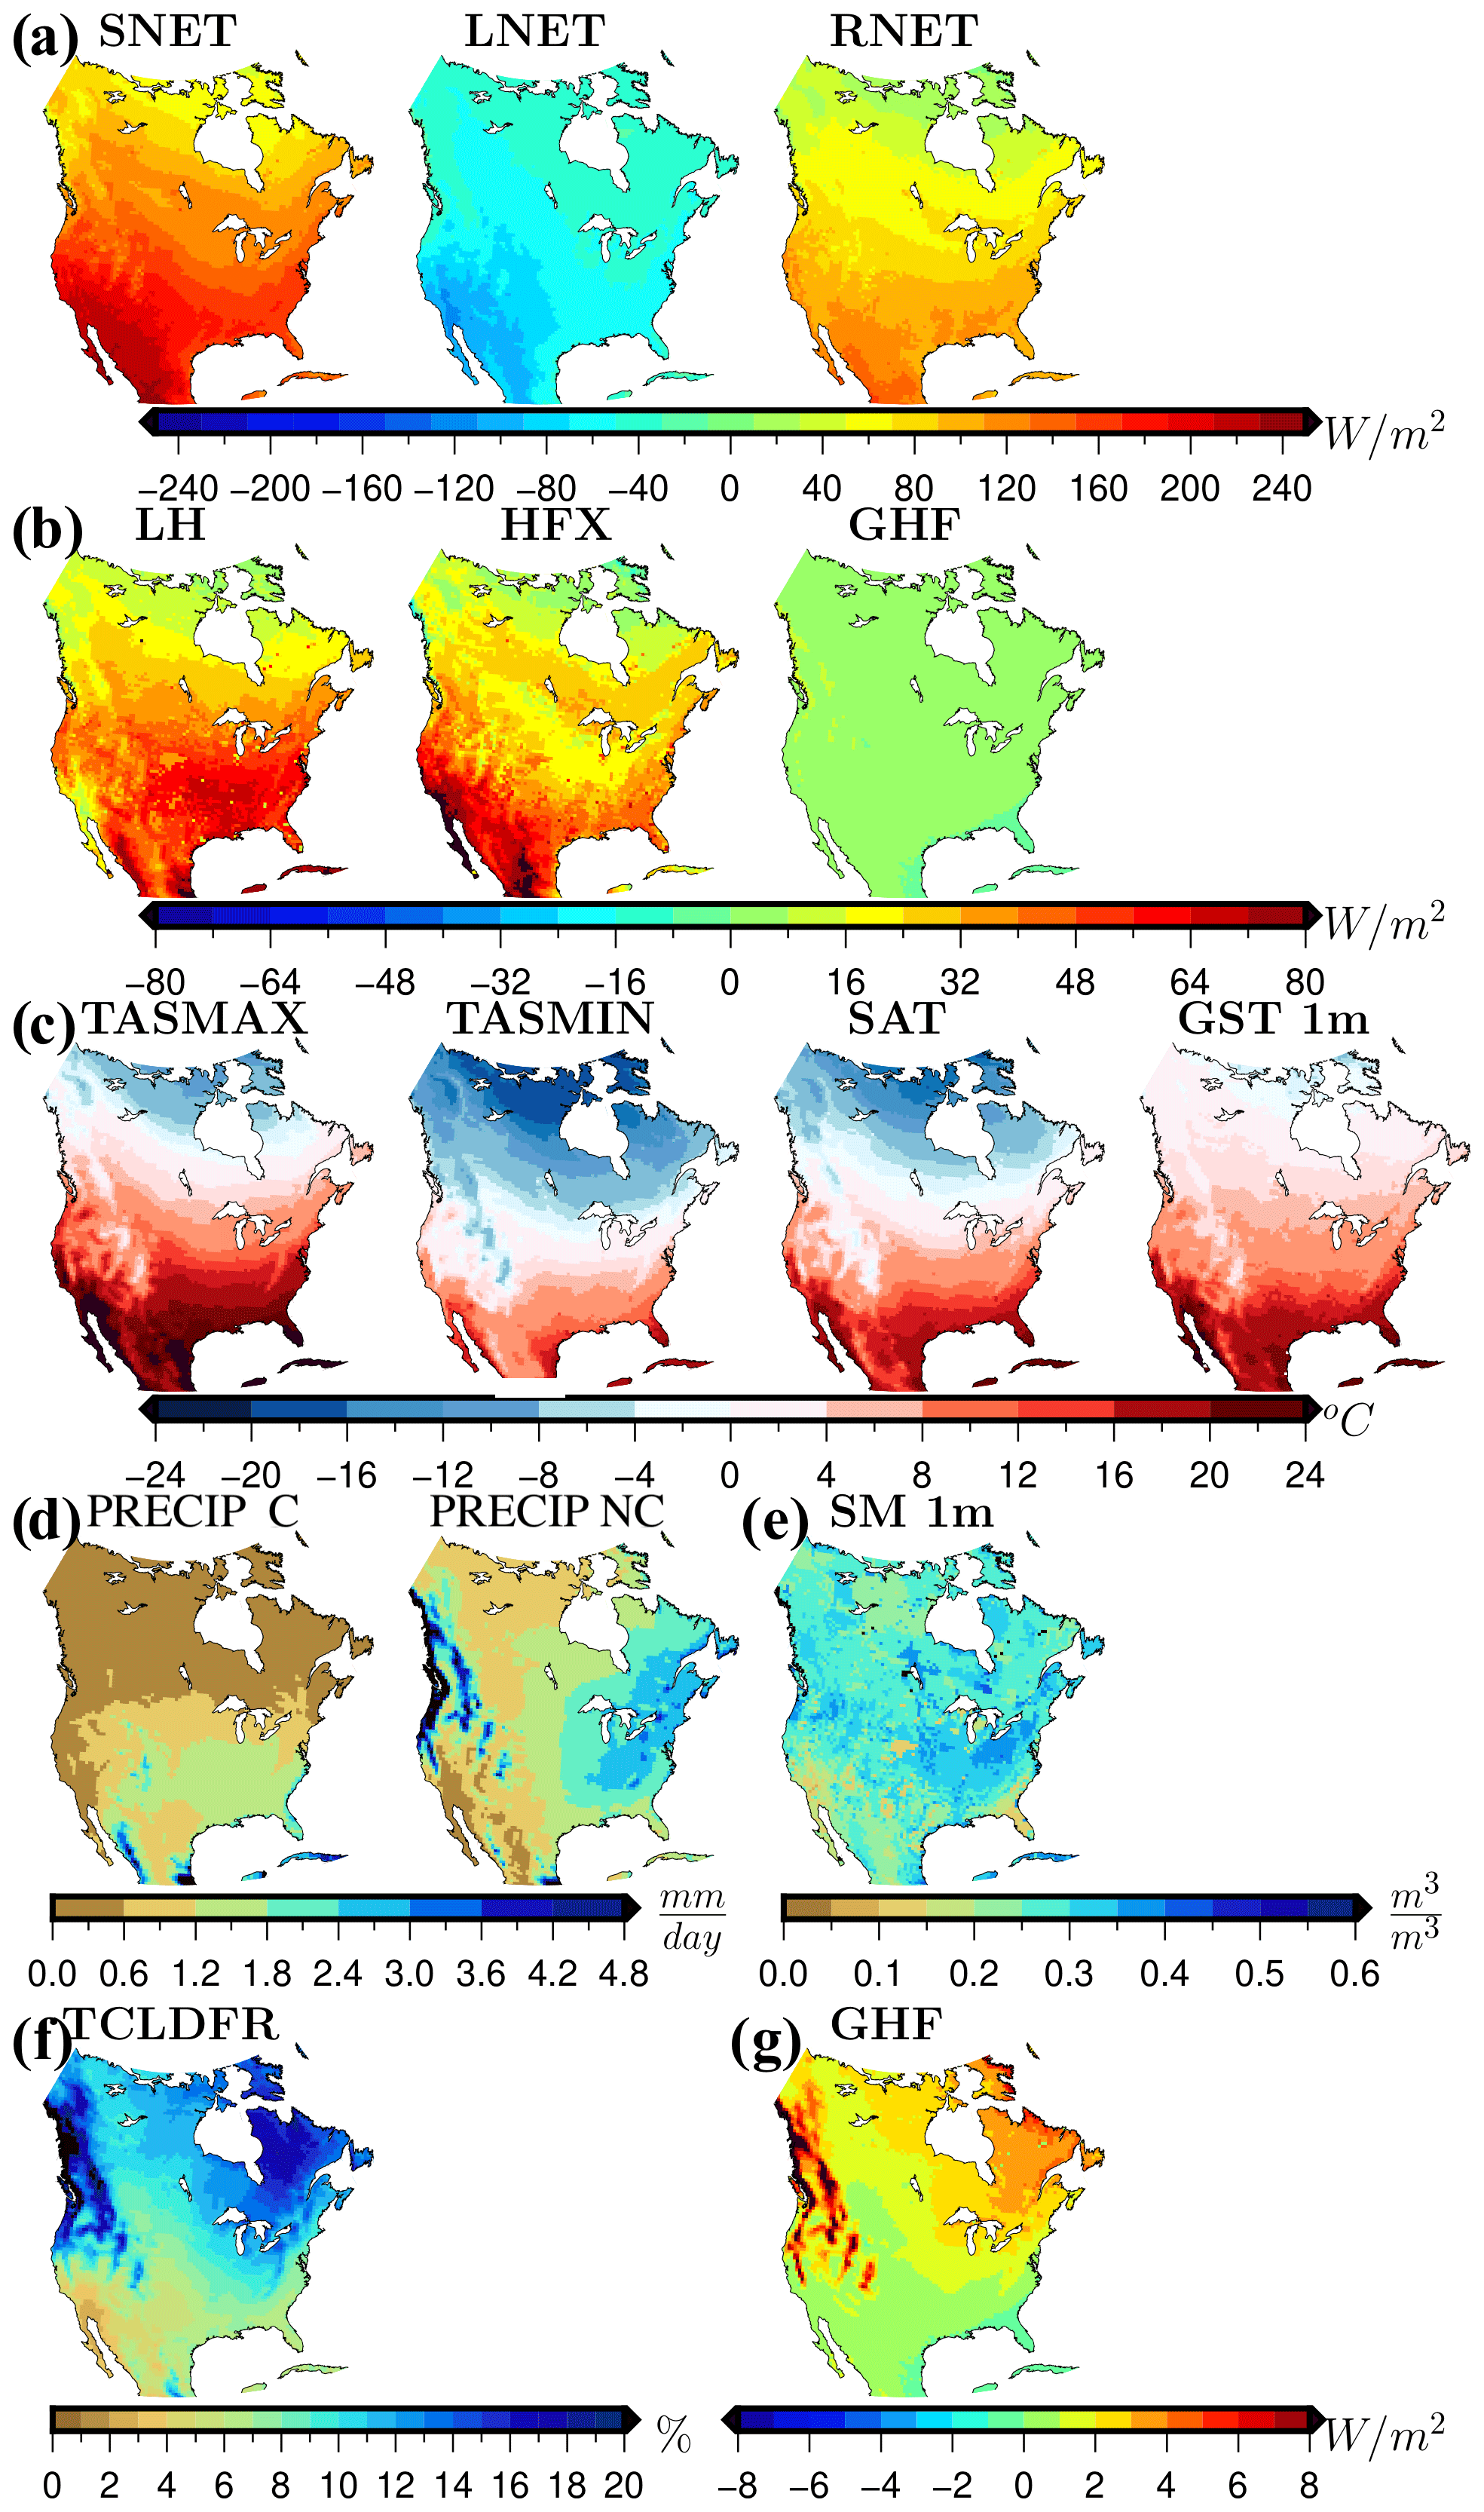
Figure 2Ensemble mean of the LSM simulations for the surface energy fluxes and near-surface conditions: net shortwave radiation (SNET), net longwave radiation (LNET), surface net radiation (RNET) (a); latent heat flux (LH), sensible heat flux (HFX), ground heat flux (GHF) (b); maximum temperature (TASMAX), minimum temperature (TASMIN), surface air temperature (SAT), soil temperature at 1 m depth (GST 1 m) (c); accumulated convective and non-convective precipitation at the surface (PRECIP C and PRECIP NC) (d); soil moisture contained in the first soil metre (SM 1 m) (e); and total cloud cover fraction (TCLDFR) (f) for the WRF ensemble mean. GHF results are also represented using its own colour scale (g). Mean values are estimated as the temporal average for the period 1980–2013 using simulations performed with 50 km resolution.
The use of a different LSM component in WRF affects the representation of soil and vegetation properties and processes in the simulation, resulting in noticeable differences in the simulated energy fluxes across the domain (Fig. 3). For instance, the spatial pattern of the LSM anomalies relative to the multi-model mean in longwave net radiation is similar to the minimum temperature anomalies (Figs. 3b and 4b), and the anomalies in latent heat flux show similar LSM differences to the convective precipitation maps at low latitudes (Figs. 3d and 5a). The spatial patter of the LSM anomalies in sensible and latent heat fluxes shows opposite values around the mean. For example over the boreal forest, the LSMs reaching the highest values of latent heat flux also reach the lowest values of sensible heat flux at the same locations (Fig. 3d and f).
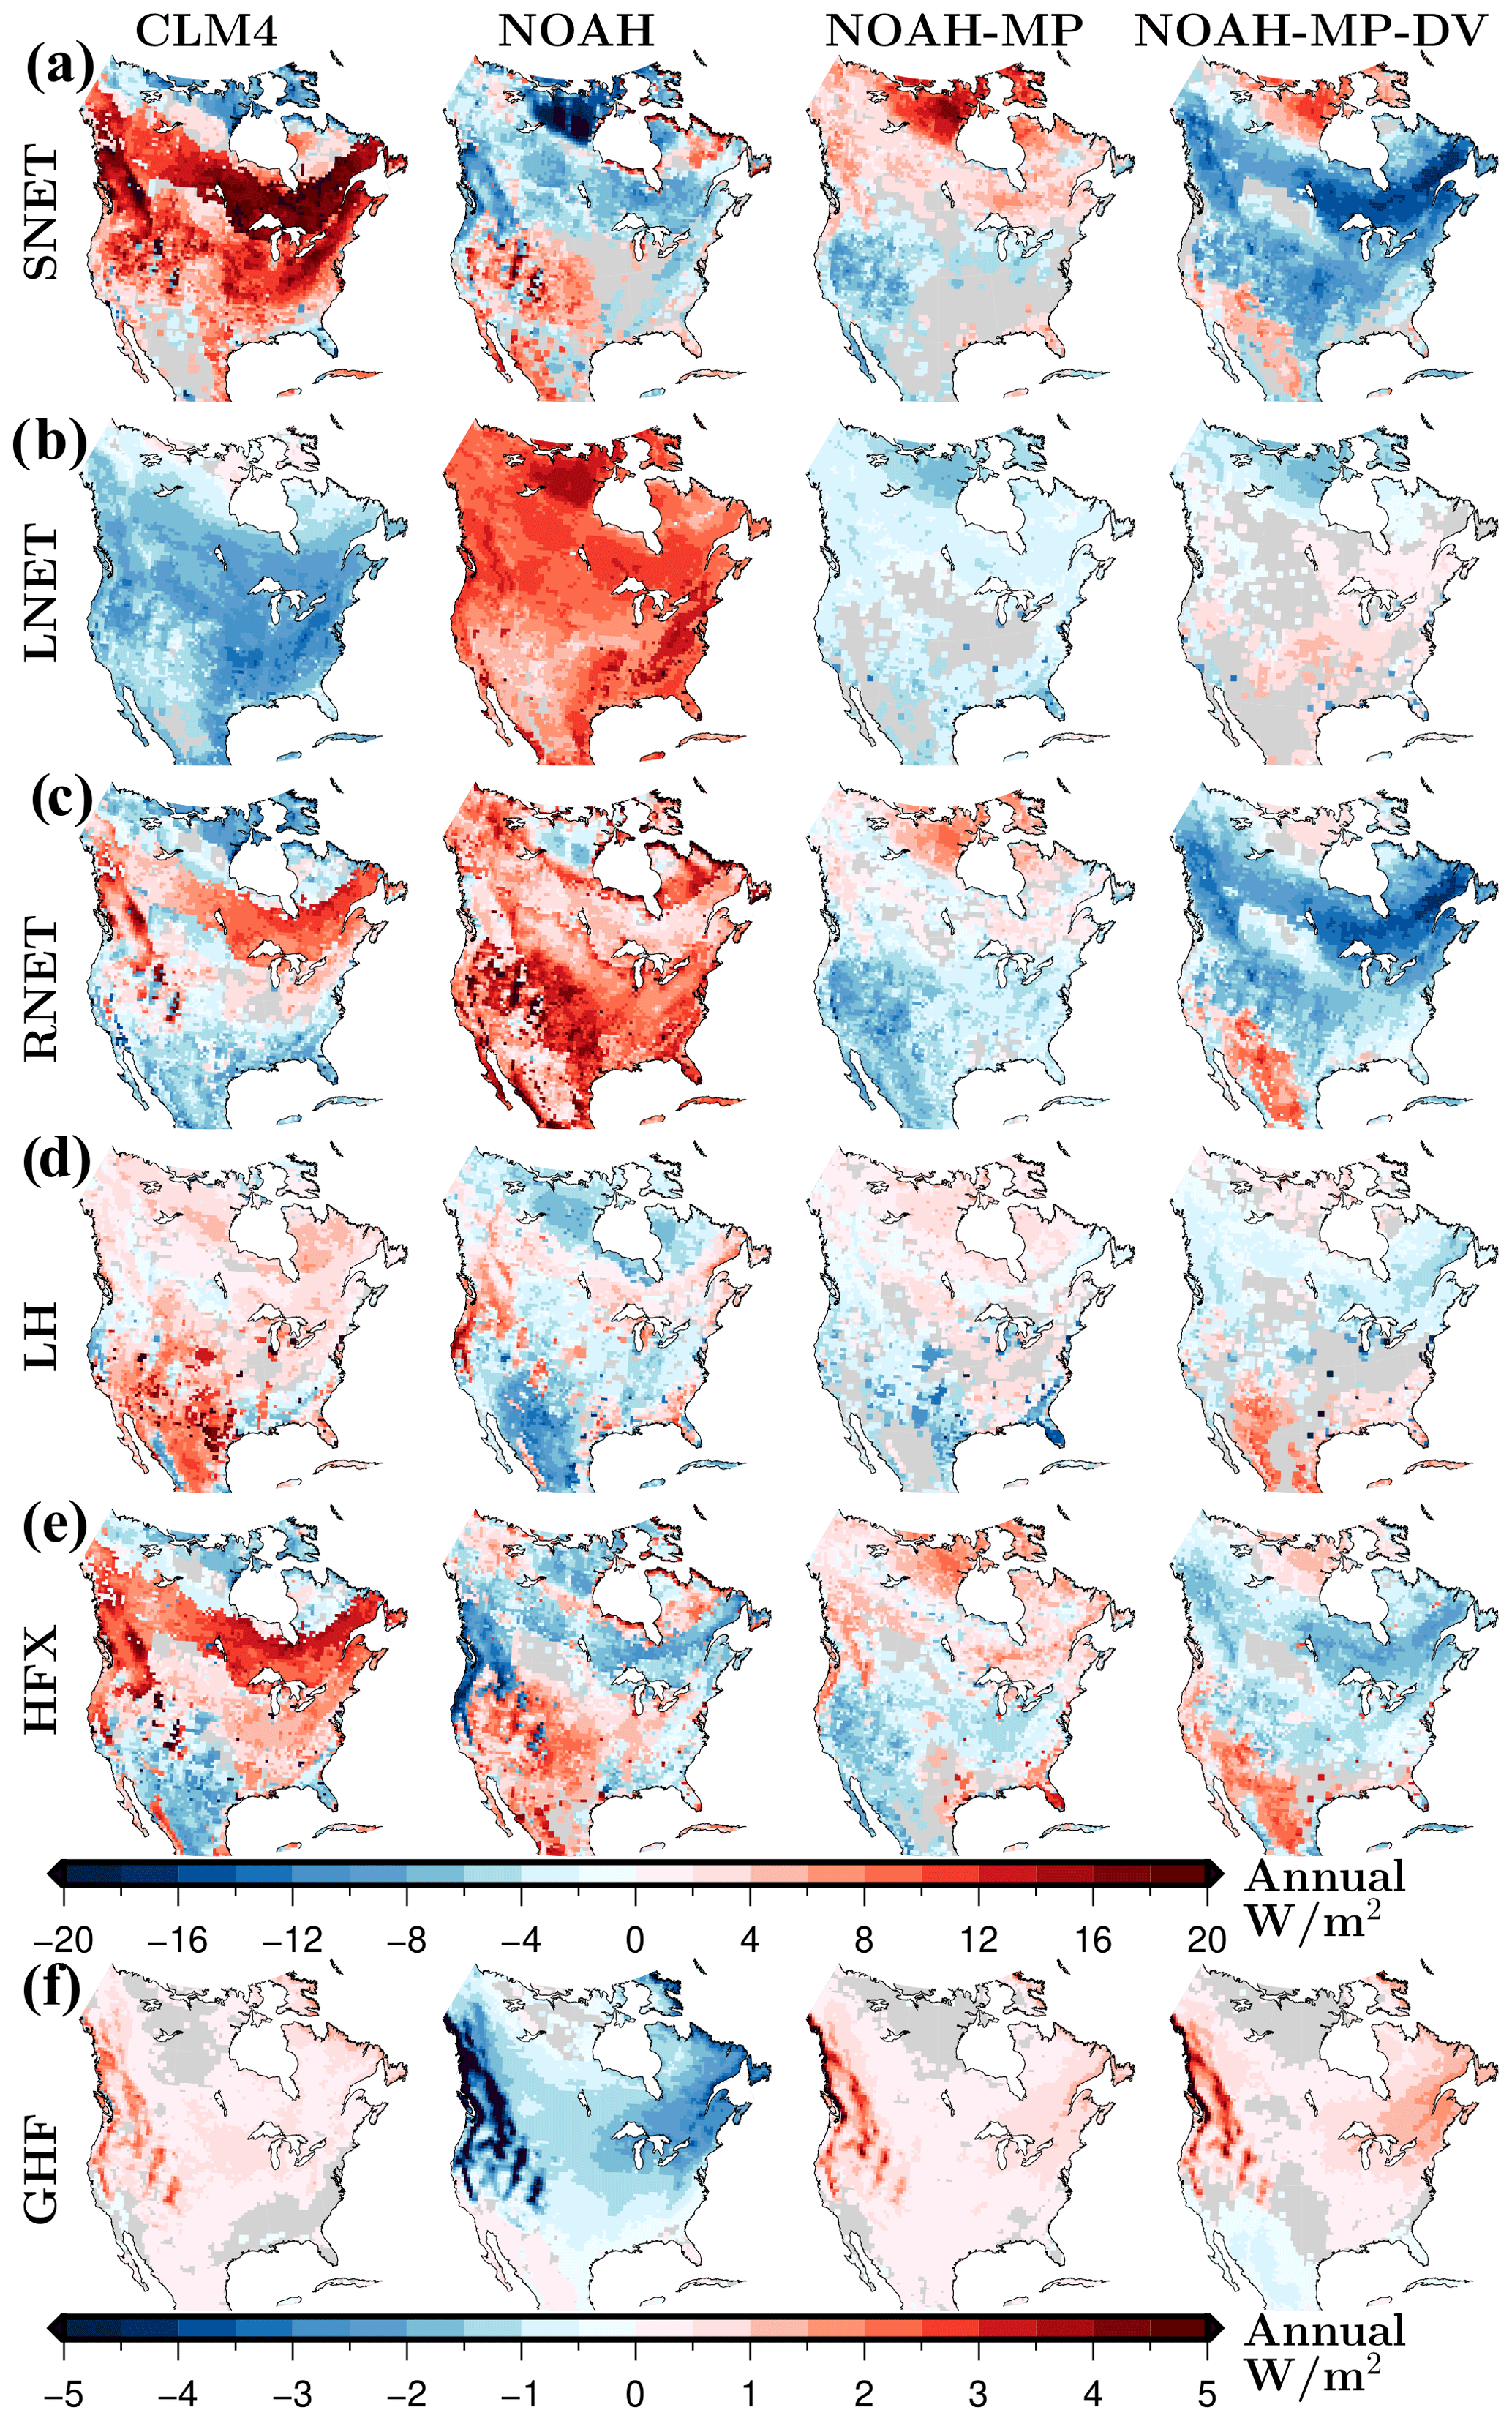
Figure 3Anomalies of energy fluxes at the surface: (a) net shortwave radiation (SNET), (b) net longwave radiation (LNET), (c) soil net radiation (RNET), (d) latent heat flux (LH), (f) sensible heat flux (HFX) and (g) ground heat flux (GHF) for each LSM simulation relative to the LSM ensemble mean. Mean values are estimated as the temporal average for the period 1980–2013 using simulations performed with 50 km resolution. Grid cells with a non-significant change at the 5 % significance level are masked in grey.
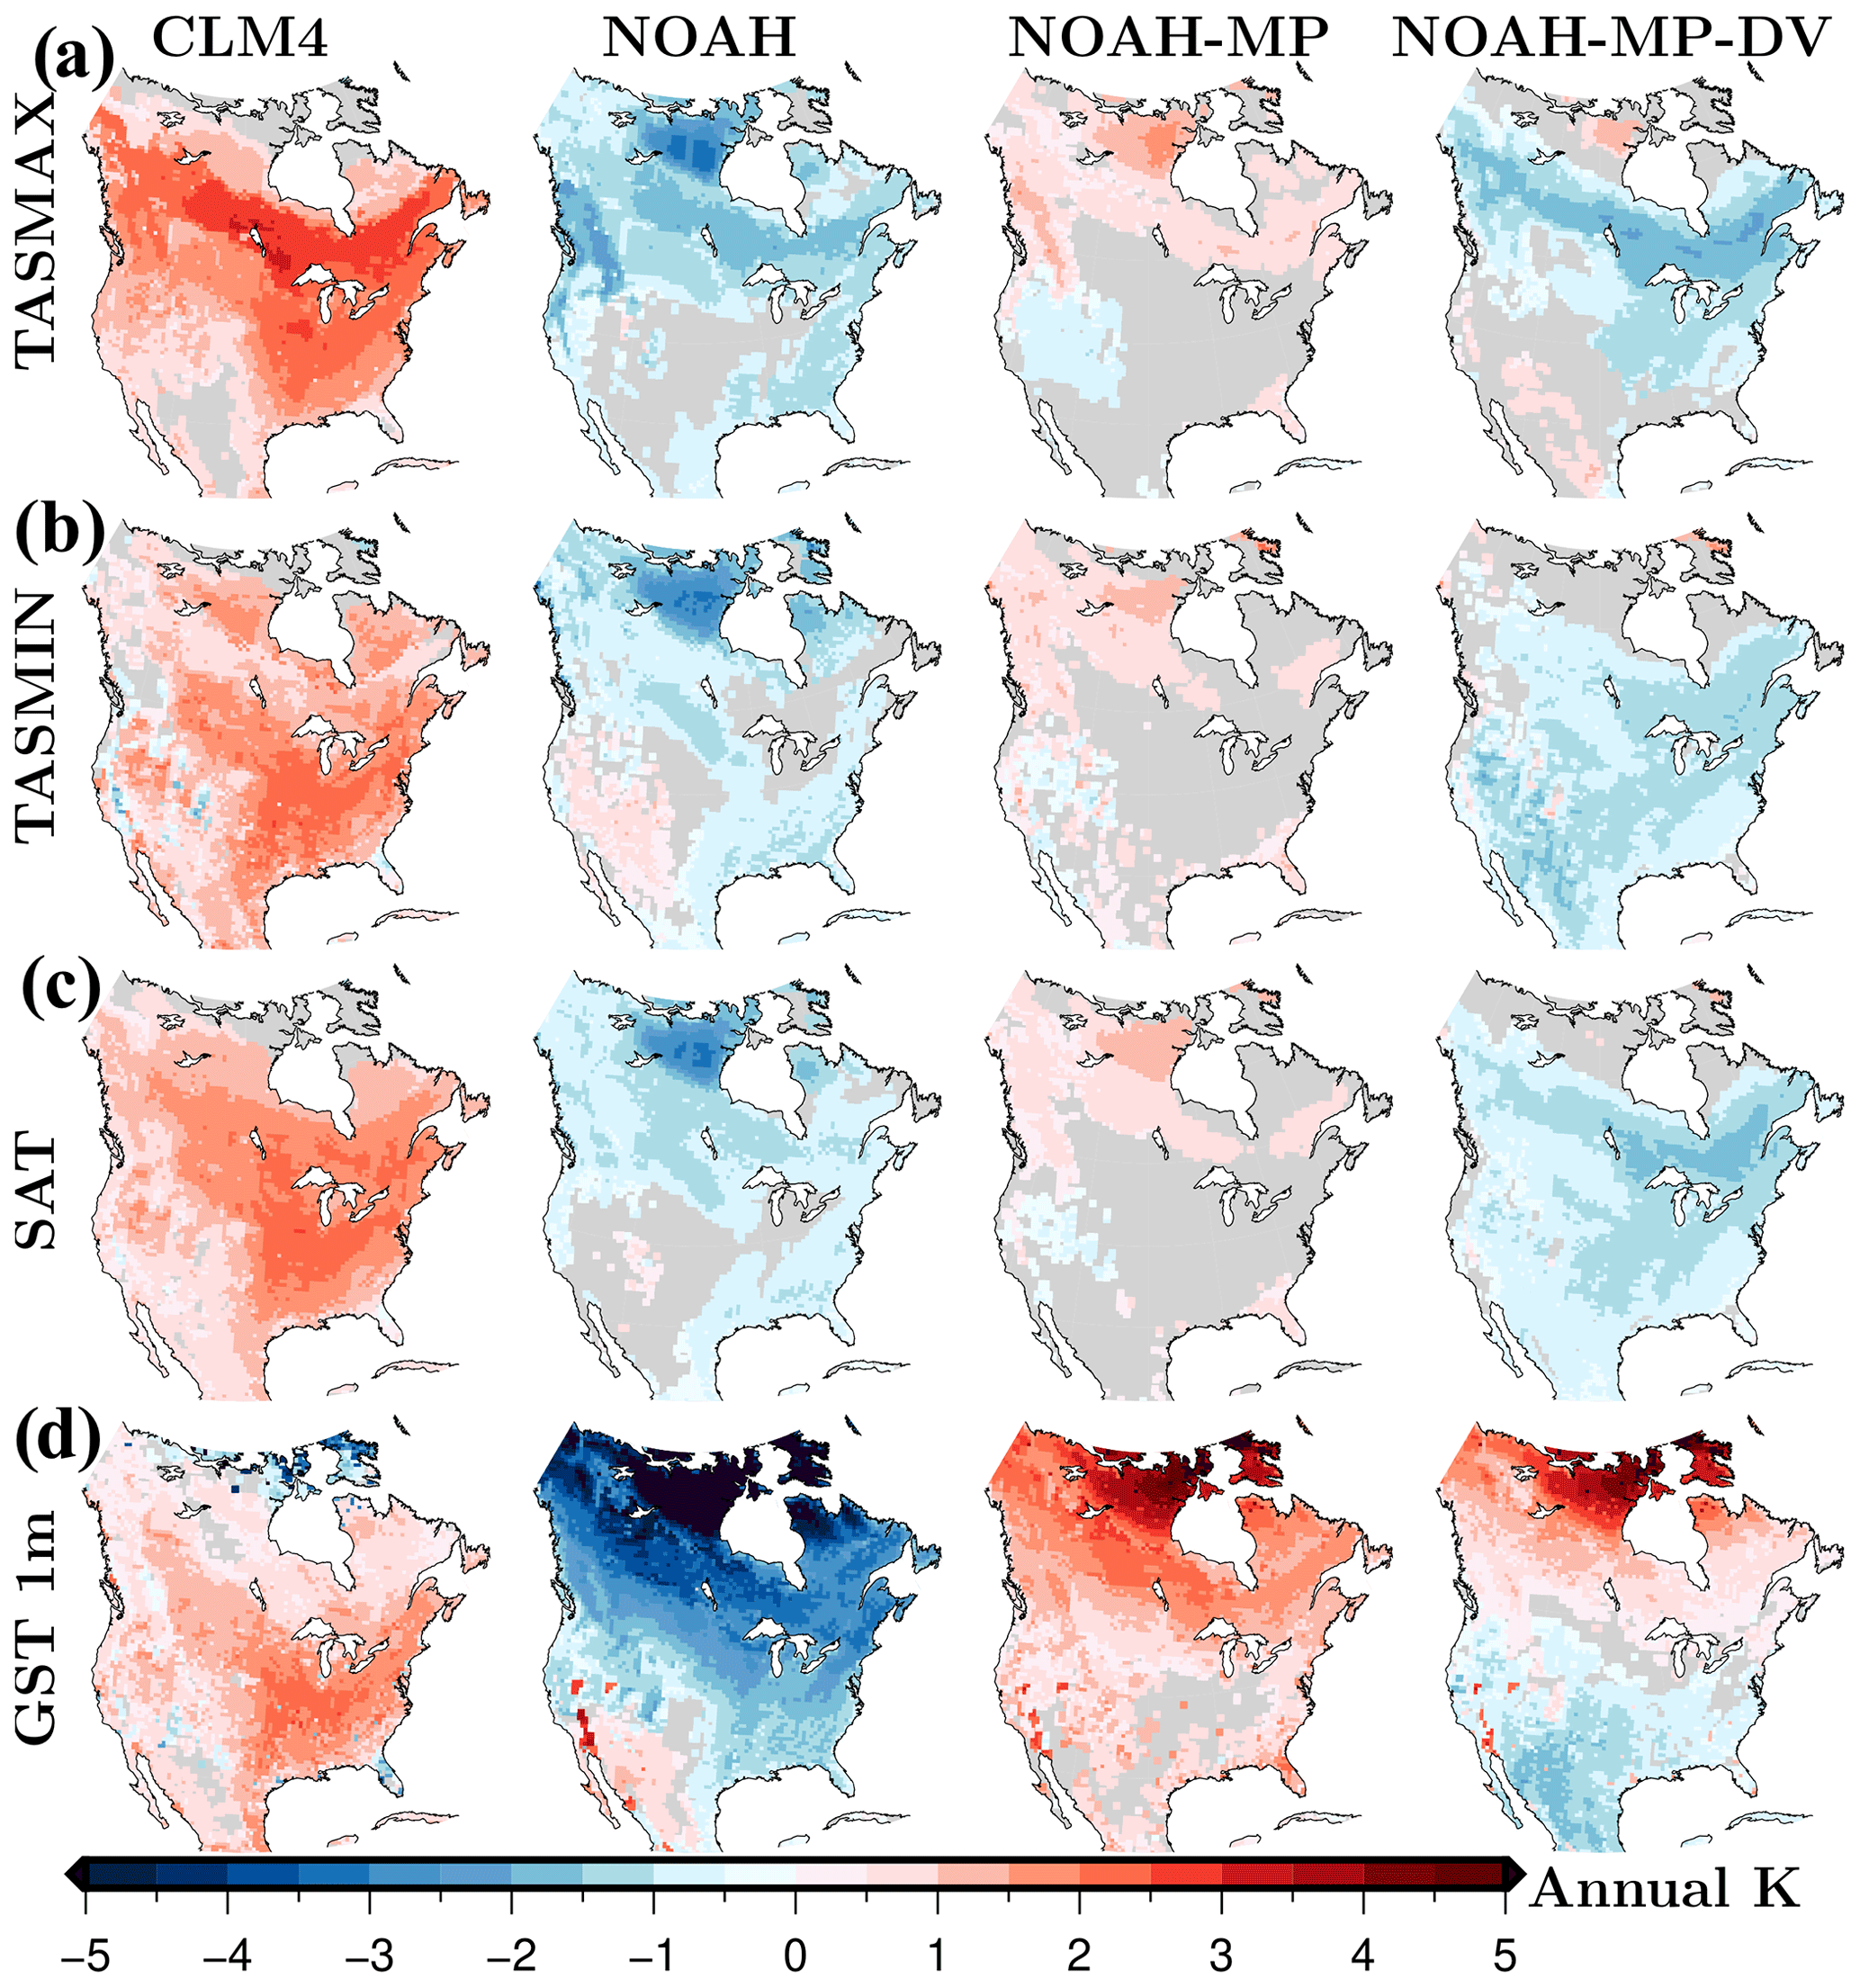
Figure 4Anomalies of near-surface temperature conditions: (a) daily maximum temperature (TASMAX), (b) daily minimum temperature (TASMIN), (c) surface air temperature (SAT) and (d) soil temperature at 1 m depth (GST 1 m) for each LSM simulation relative to the LSM ensemble mean. Mean values are estimated as the temporal average for the period 1980–2013 using simulations performed with 50 km resolution. Grid cells with a non-significant change at the 5 % significance level are masked in grey.

Figure 5Anomalies of near-surface humid conditions: (a) accumulated convective and (b) non-convective precipitation at the surface (PRECIP C and PRECIP NC), (c) soil moisture contained in the first soil metre (SM 1 m), and (d) total cloud fraction (TCLDFR) for each LSM simulation relative to the LSM ensemble mean. Mean values are estimated as the temporal average for the period 1980–2013 using simulations performed with 50 km resolution. Grid cells with a non-significant change at the 5 % significance level are masked in grey.
LSM differences in the simulation of surface fluxes and near-surface conditions are similar among the experiments with different resolutions (Figs. 3–5 and S2, S4 and S6 in the Supplement). For example, based on the differences between each LSM simulation with 50 km resolution and the 50 km multi-model mean (Fig. 2), we can identify the CLM4 as the LSM component simulating the highest net shortwave radiation over most of North America for the annual, DJF and JJA means (SNET in Figs. 3a and S1 in the Supplement). Meanwhile, the NOAH-MP-DV simulation reaches the lowest net shortwave radiation over the same areas (Fig. 3a). The WRF simulation of net longwave radiation reaches negative values (Fig. 2a) with the maximum values simulated by the NOAH LSM and the minimum values simulated by the CLM4 LSM (Fig. 3b). The upward (negative) component of the net longwave radiation results from the Stefan–Boltzmann equation, from which the outgoing longwave radiation LW↑ is proportional to , where Ts is surface temperature and σ is the Stefan–Boltzmann constant. Thus, the CLM4 simulation produces the largest outgoing longwave radiation (see Fig. S7 in the Supplement), shown in Fig. 3b by the largest negative anomalies and therefore the highest air and soil temperatures (Fig. 4). The opposite behaviour is performed by the NOAH LSM, yielding the lowest upward longwave radiation (Figs. 3b and S7), and one of the coldest temperature climatologies relative to the multi-model mean (Fig. 4). The relationship between the radiation and temperature anomalies is also supported by high spatial correlation coefficients (Table S1 in the Supplement). These correlation coefficients show the link of maximum temperatures to both shortwave and longwave net radiation, particularly in summer, while minimum temperatures show higher correlation with longwave net radiation than with shortwave net radiations in most of the LSM simulations (Table S1).
The simulation of sensible heat flux reaches the highest values using the CLM4 configuration over the boreal forest and the lowest values in western USA. Meanwhile, the NOAH simulation reaches the lowest sensible heat fluxes over the boreal forest and the highest values in western USA (Fig. 3e). The spatial patterns of LSM anomalies in sensible heat flux are similar to the LSM anomalies in net shortwave radiation and daily maximum temperatures (Figs. 3a and 4a), which is also shown by high spatial correlation coefficients, particularly in summer (Table S1). LSM differences in ground heat flux are smaller than for the rest of the energy fluxes due to the small magnitude of the GHF in comparison with the rest of energy components (Fig. 2g). The NOAH LSM reaches the lowest ground heat flux values for the annual mean in most of the domain, showing nonetheless the highest ground heat flux values in summer at high latitudes (Figs. 3f and S1). The spatial pattern of LSM differences in ground heat flux differ from the soil temperature results, whose spatial correlation coefficients are higher with the longwave net radiation mainly in summer. LSM differences are larger for the simulation of soil temperatures than for the simulation of air temperatures particularly at high latitudes in summer where LSM differs largely in the simulation of shortwave net radiation probably due to different estimates of surface albedo under different land cover and soil moisture values (Figs. 2a, 4c and d, 5c, and S3 in the Supplement).
The CLM4 simulation produces the highest latent heat flux values and convective precipitation rates, particularly over southwestern NA, while the NOAH simulation provides the lowest latent heat flux and convective precipitation values over the same areas (Figs. 3d and 5a). LSM differences in latent heat flux, convective and non-convective precipitation are larger in summer (Figs. S1 and S5 in the Supplement). LSM differences in JJA convective precipitation rates are particularly large at low latitudes, where the CLM4 LSM produces high latent heat flux over the western part of the domain and low latent heat flux over the eastern NA relative to the multi-model mean (Figs. S1 and S5). These differences between the east and west in the CLM4 simulation of latent heat flux are not reflected in the values of convective precipitation rates, hence the low spatial correlation coefficients between both variables (Table S2 in the Supplement). There are also LSM differences in the non-convective term of precipitation, with larger anomalies in summer than in winter (Figs. 5b and S5). Thus, the NOAH LSM produces the highest precipitation anomaly at mid-latitudes, where the same LSM produces high values of total cloud fraction relative to the multi-model mean (Fig. 5b and d). This relationship between non-convective precipitation and cloud cover is also shown by high spatial correlation coefficients (Table S2). There are large LSM differences in the simulation of soil moisture, with the CLM4 LSM generating the driest conditions and the NOAH-MP experiments the wettest soils (Figs. 5c and S5). Although the LSM differences are large in the representation of humid conditions, the relationship between precipitation, latent heat flux, soil moisture and cloud fraction is weaker than the relationship between radiation and temperatures in the WRF experiments.
Larger LSM differences in the simulation of shortwave and longwave radiations and temperatures are found over very vegetated areas such as the boreal forest and eastern USA (Figs. 3 and 4). The comparison of the NOAH-MP experiments with prescribed and dynamic vegetation also shows larger differences in air temperatures over these areas. This suggests that the different representation of vegetation in each LSM yields to different estimates of soil properties, such as surface albedo, evaporative resistance and aerodynamic roughness, affecting the simulation of radiation and temperatures. The LSM differences in latent heat flux and convective precipitation are larger at low latitudes, with the NOAH LSM yielding the most different values relative to the rest of LSMs. This can be associated with the issues identified in the NOAH LSM to simulate soil hydrology (Wharton et al., 2013).
4.2 Resolution impact on surface energy fluxes and near-surface conditions
The response of surface energy fluxes and near-surface conditions to changes in spatial resolution varies considerably with the season, while they behave similarly using different LSM components (Figs. 6 and S8–S13 in the Supplement). We consider the results of the NOAH-MP-DV experiments as an example to minimize the number of figures in the paper. Changes in resolution alter the surface energy fluxes in DJF mainly over regions of complex topography and coastal areas, while in JJA the simulation of energy fluxes is affected by resolution over the whole domain except over a region in the central USA and northern areas of Hudson Bay (Fig. 6). In JJA, the use of coarser horizontal resolutions induces a decrease in the net radiation absorbed by soil at high latitudes, mainly caused by a decrease in net shortwave radiation (Fig. 6a and c). The decrease in net radiation induced by coarser resolutions limits the energy available for turbulent energy fluxes at high latitudes. Thus, values of latent and sensible heat fluxes also decrease at coarser resolutions at high latitudes (Fig. 6d and e). The use of coarser resolutions also induces higher sensible heat fluxes at low latitudes, which is balanced by lower latent heat flux (Fig. 6d and e).
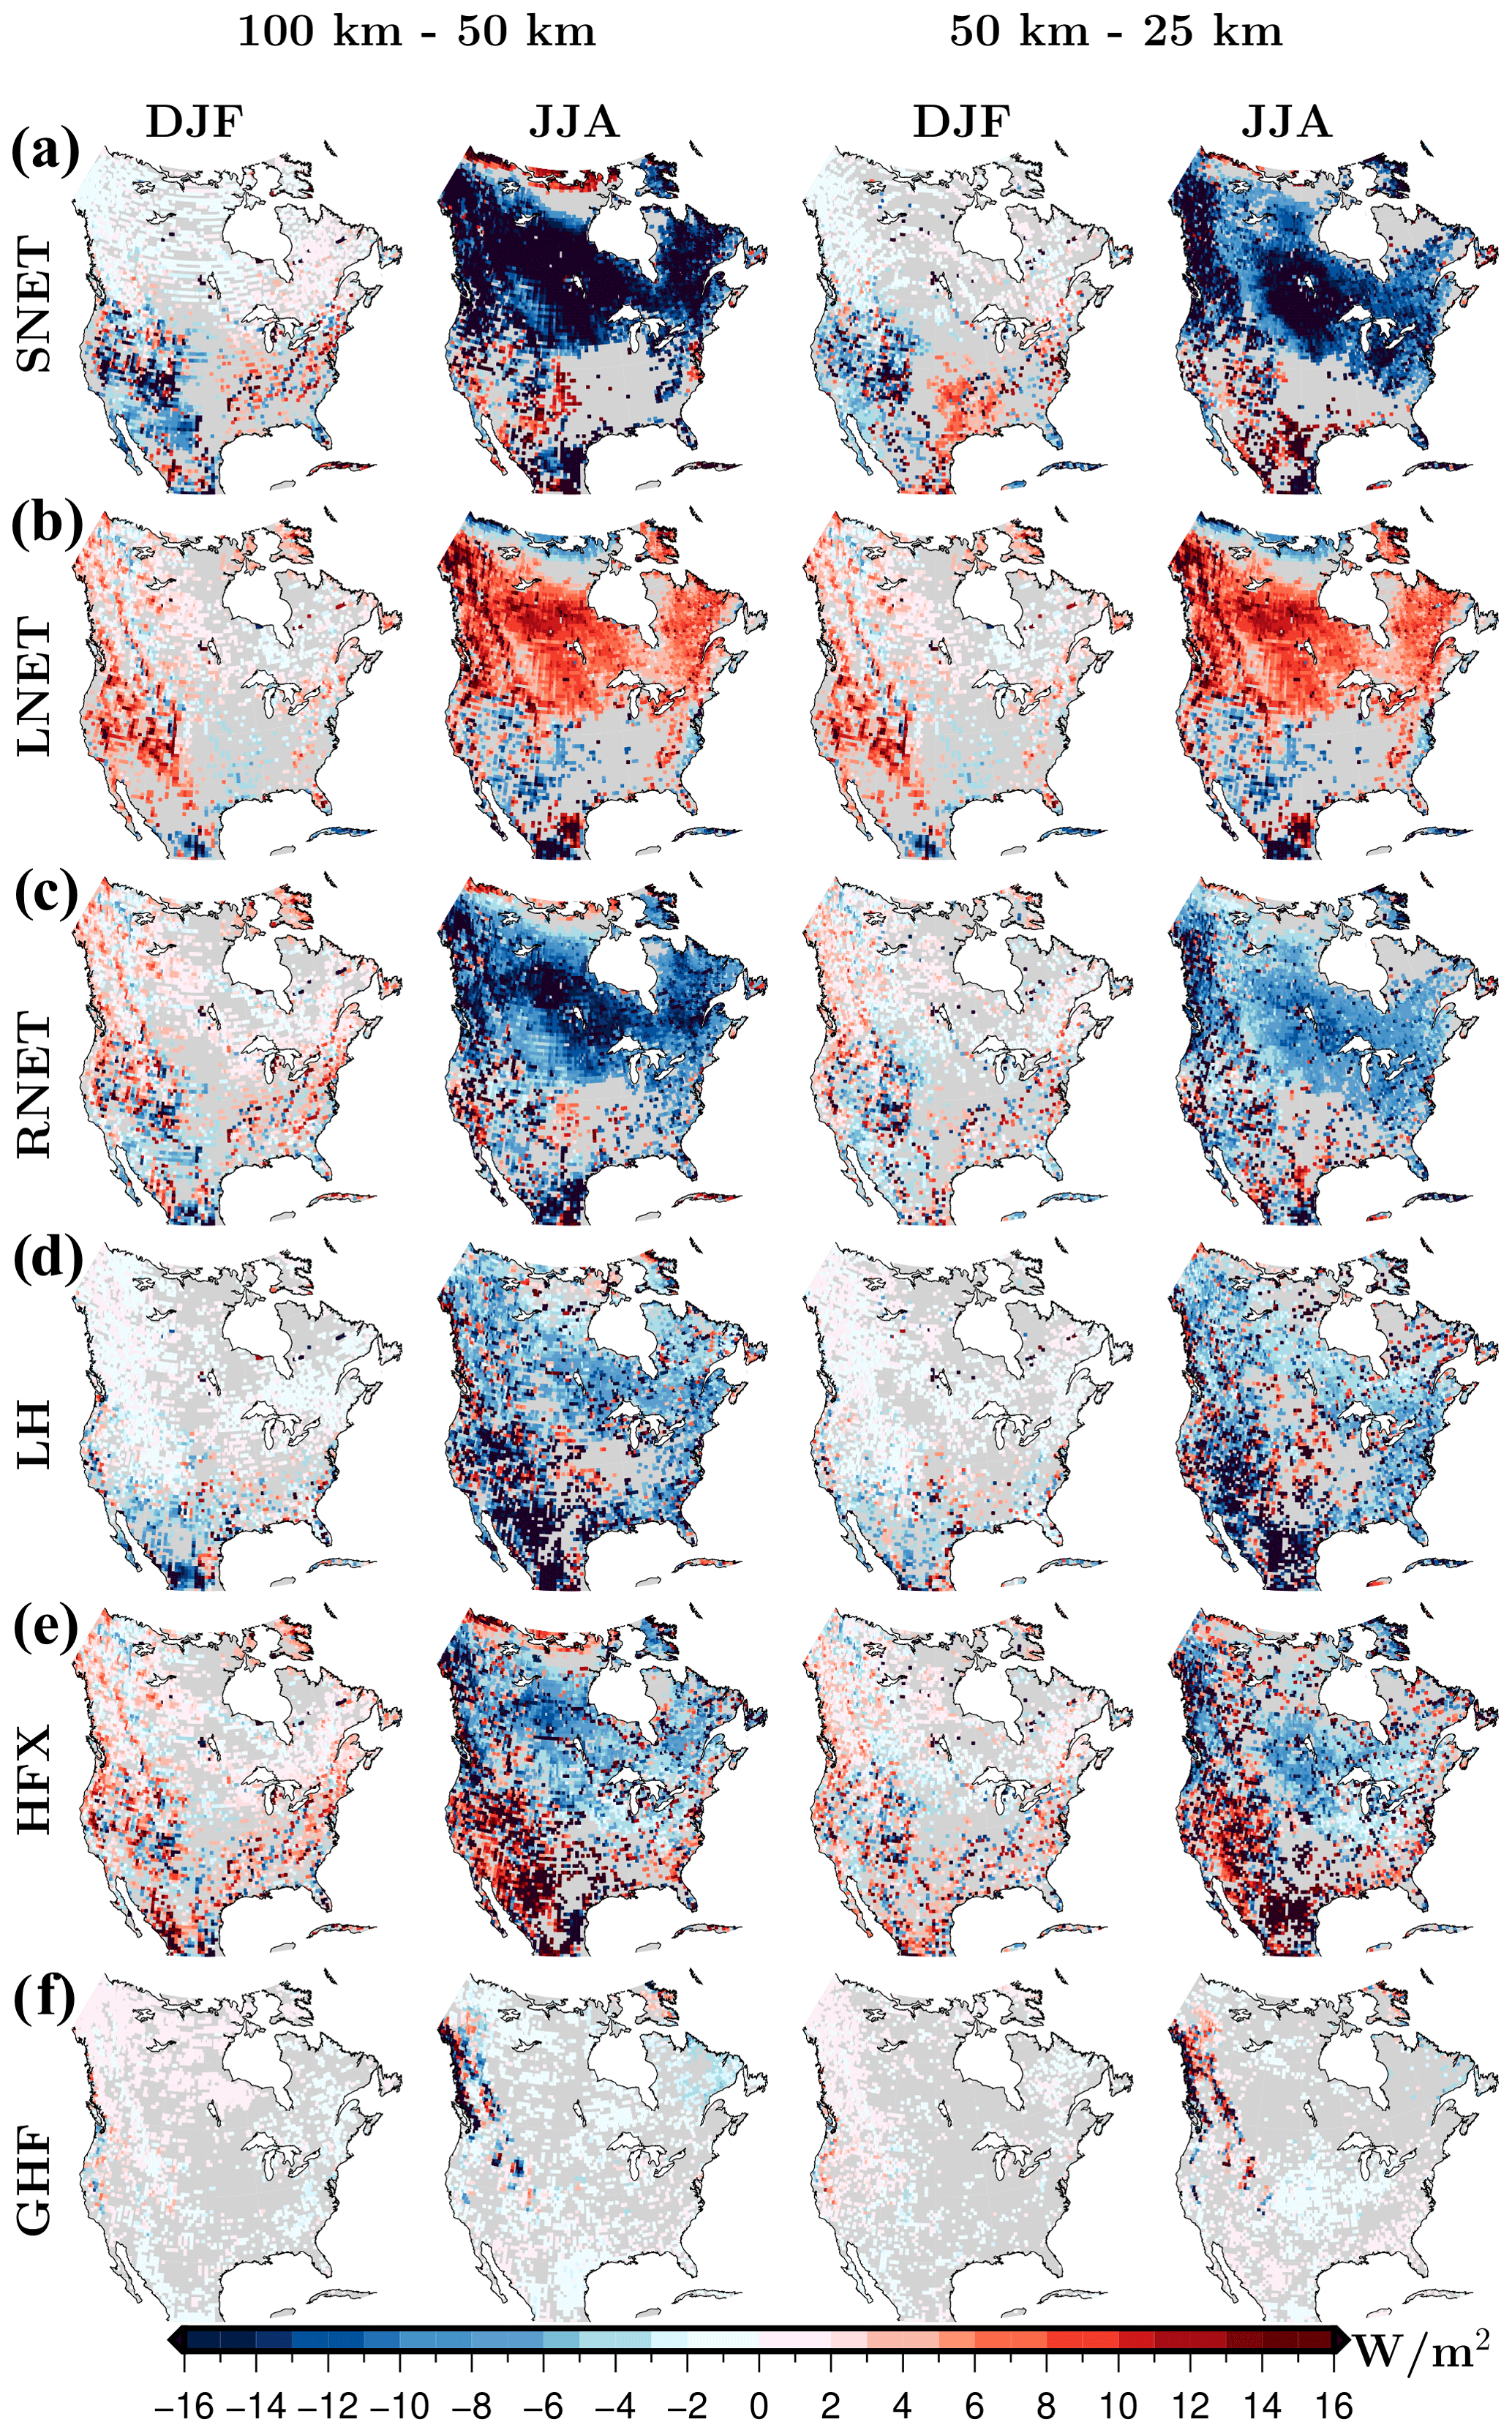
Figure 6Seasonal mean difference in surface energy fluxes between the 100 and 50 km simulations (left) and between the 50 and 25 km simulations (right). All outputs are from the NOAH-MP-DV simulations for the period 1980–2013. Grid cells with a non-significant change at the 5 % significance level are masked in grey. All outputs from the 25, 50 and 100 km simulations were mapped to a common grid (CRU grid) using the nearest model grid point.
Changes in downward shortwave radiation at the surface are mainly driven by changes in cloud cover, but changes in atmospheric water vapour and aerosols may also affect the shortwave radiation reaching the ground surface (Hatzianastassiou et al., 2005). Changes in surface albedo also lead to changes in the upward component of shortwave radiation, thus affecting SNET. The resolution differences in estimating albedo and land cover in our results are smaller than those associated with the cloud cover and the microphysics of the model, particularly in JJA. Thus, the effect of resolution on the downward component of shortwave radiation, which is dependent on cloud formation and atmospheric composition, is larger than the resolution effect on the upward component of shortwave radiation, which is dependent on albedo values (Fig. S14 in the Supplement). The resolution changes in winter SNET at southern latitudes of the Rocky Mountains that are not related to cloud cover seem to be associated with the upward component of shortwave radiation and therefore with the resolution effect on surface albedo values (Figs. 6a, 8d and S14).

Figure 7Seasonal mean difference in near-surface temperature conditions between the 100 and 50 km simulations (left) and between the 50 and 25 km simulations (right). All outputs are from the NOAH-MP-DV simulations for the period 1980–2013. Grid cells with a non-significant change at the 5 % significance level are masked in grey. All outputs from the 25, 50 and 100 km simulations were mapped to a common grid (CRU grid) using the nearest model grid point.
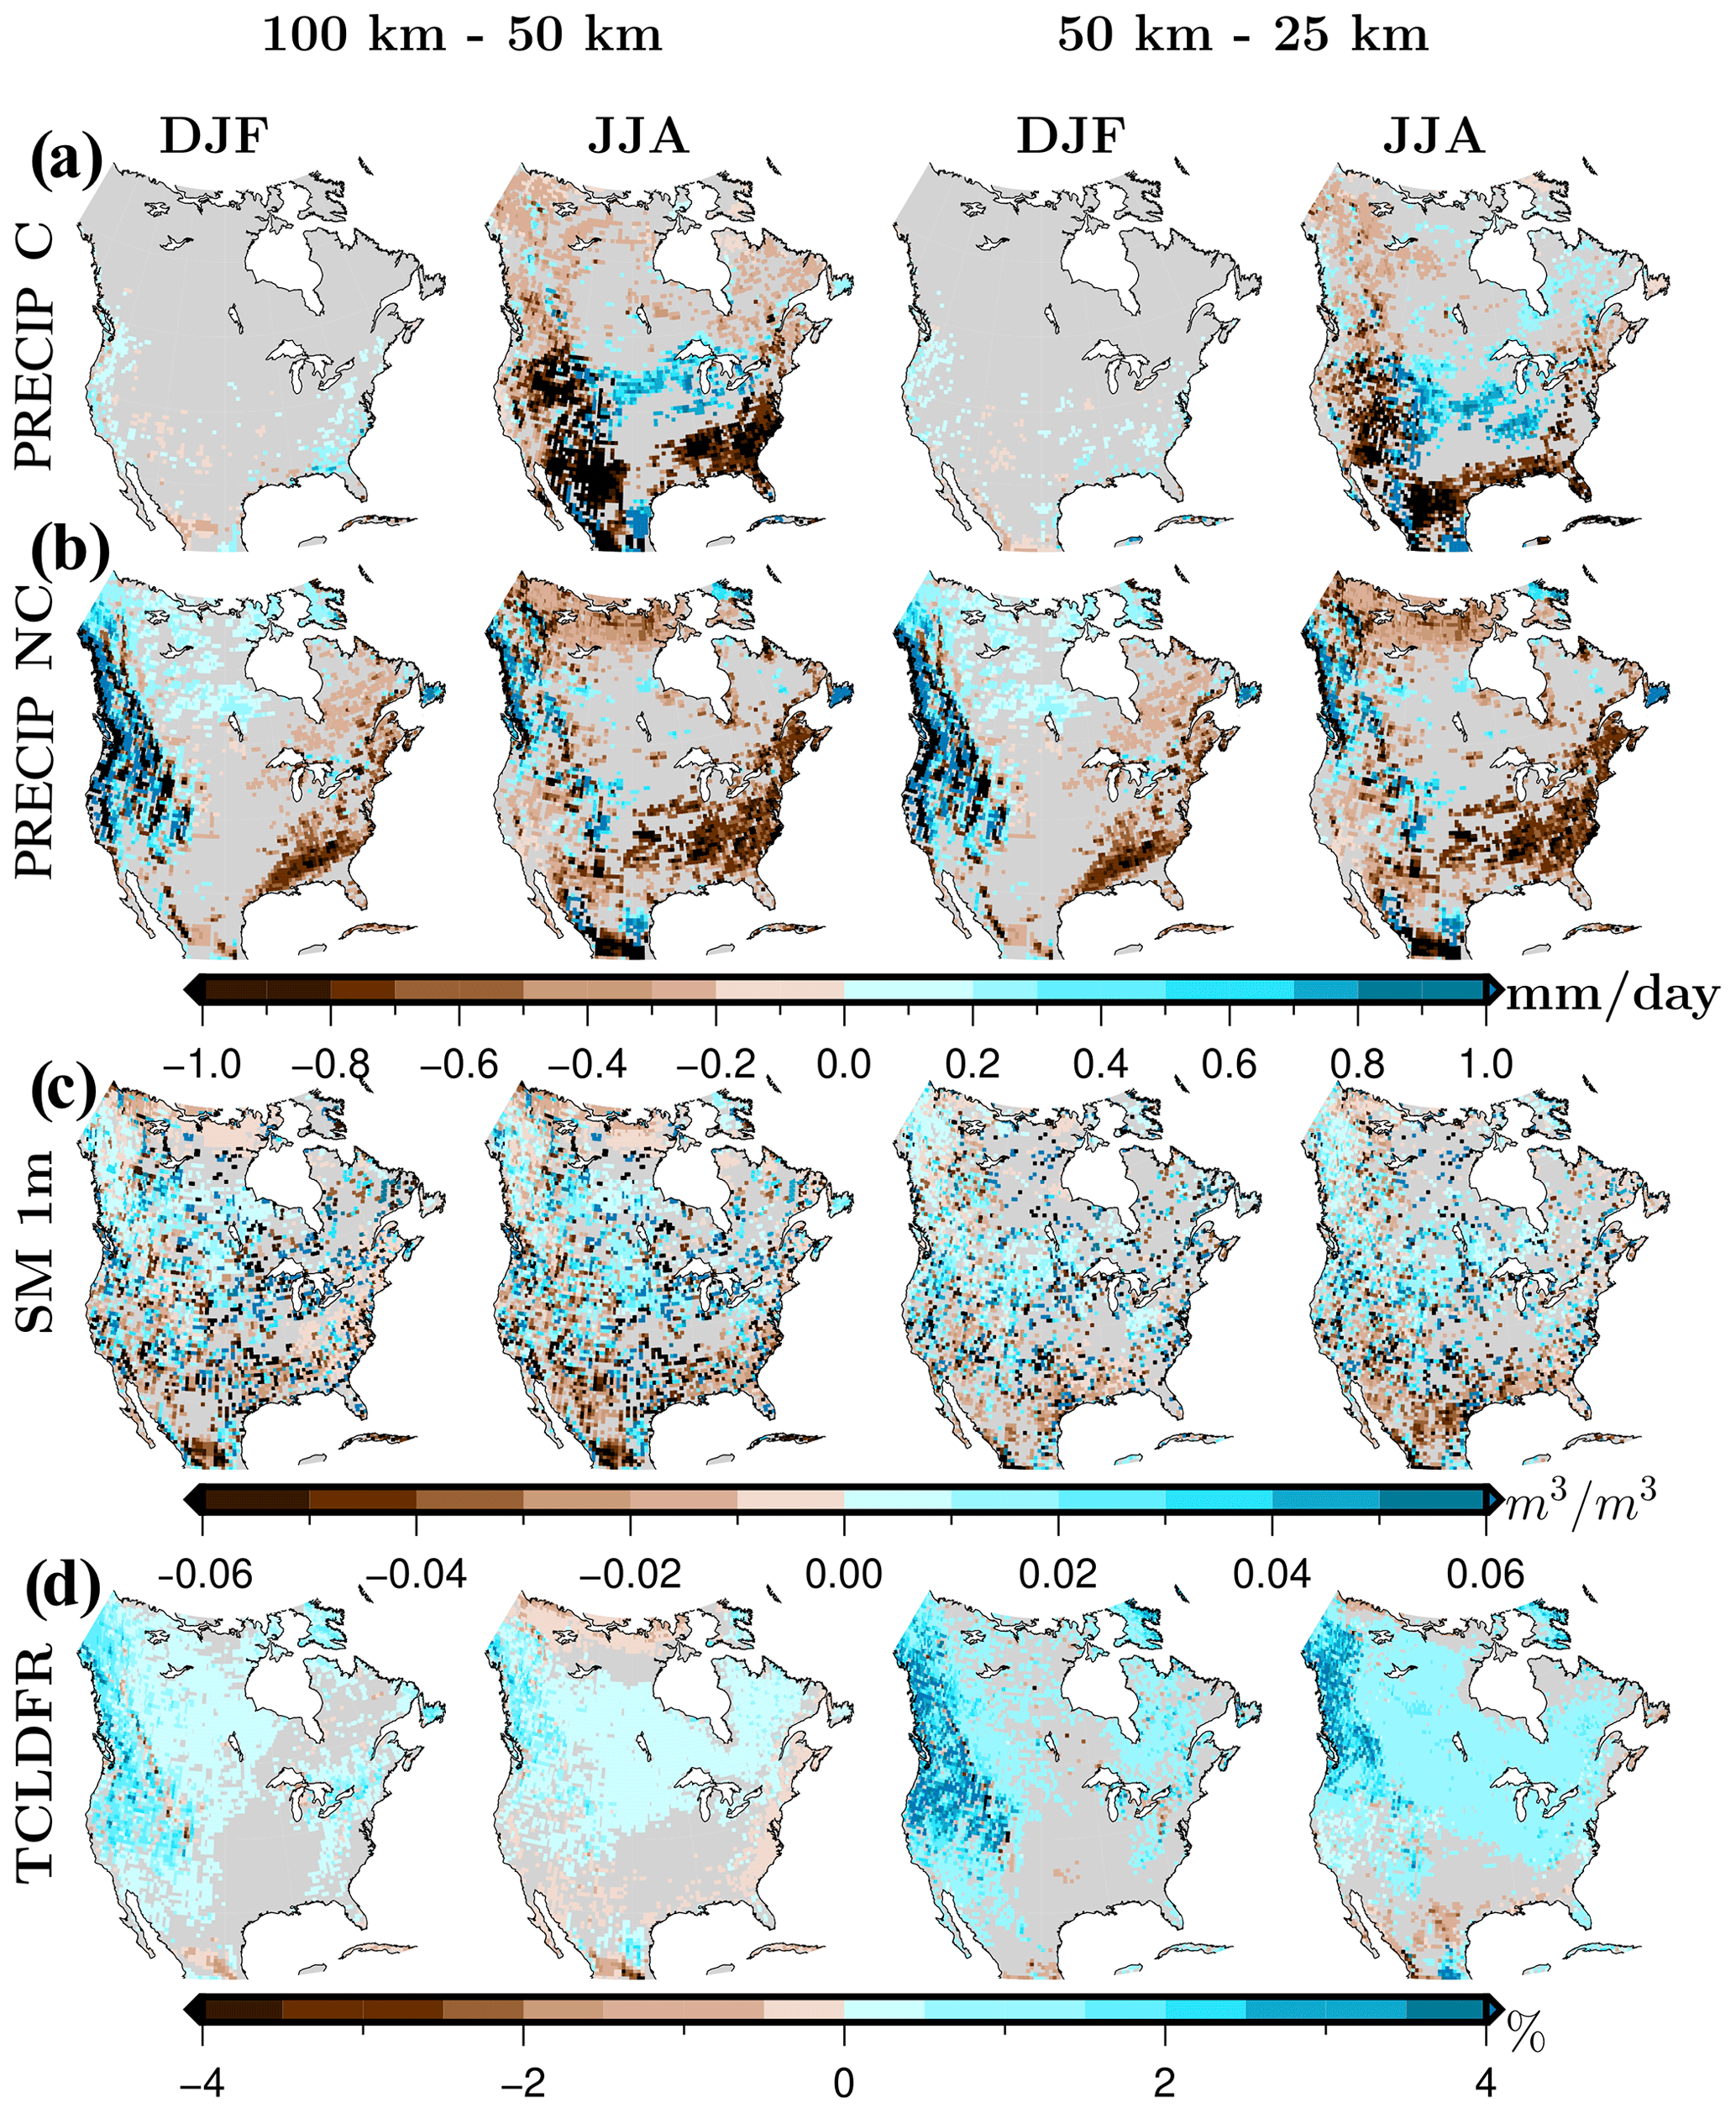
Figure 8Seasonal mean difference in near-surface humid conditions between the 100 and 50 km simulations (left) and between the 50 and 25 km simulations (right). All outputs are from the NOAH-MP-DV simulations for the period 1980–2013. Grid cells with a non-significant change at the 5 % significance level are masked in grey. All outputs from the 25, 50 and 100 km simulations were mapped to a common grid (CRU grid) using the nearest model grid point.
Consistent with the effect of LSM differences on near-surface conditions (Sect. 4.1), the spatial pattern of the resolution impact on net shortwave radiation is similar to the resolution-induced changes in daily maximum temperatures (Figs. 6a and 7a). The response of minimum temperature to changing resolution is, however, smaller than for maximum temperatures at middle–high latitudes (Fig. 7b). Over eastern North America, JJA minimum temperature increases with the use of coarser resolutions, while it decreases over western North America (Fig. 7b). The response of mean temperature to resolution is mainly driven by the resolution impact on maximum temperatures since both show similar spatial patterns (Fig. 7c). Although the impact of resolution on air and soil temperatures shows similar spatial patterns, in winter air temperatures are more affected by changes in resolution than soil temperatures, particularly at high latitudes and elevation where snow may be present (Fig. 7c and d). Thus, soil temperatures are more sensible to JJA changes in the energy budget induced by reducing resolution, while in DJF soil temperature remains insulated from resolution-induced changes in surface conditions probably because of the insulating effect of snow cover (García-García et al., 2019).
Non-convective precipitation increases with the use of coarser horizontal resolutions over the Rocky Mountains, particularly in winter, where the model also represents a higher percentage of cloud cover with coarser resolutions (Fig. 8b and d). Over the east coast of the USA, the use of coarser resolutions leads to lower non-convective precipitation rates (Fig. 8b). This behaviour is also present in JJA over the arctic areas of our domain (Fig. 8b). Although the response of convective precipitation to resolution in winter is not significant, in JJA the use of coarser horizontal resolutions yields a decrease in convective precipitation over coastal areas and the Rocky Mountains, where the simulation also reaches lower latent heat flux values (Figs. 6d and 8a). Although the spatial pattern of soil moisture is very patchy in DJF and JJA, soil moisture tends to decrease at low latitudes in JJA with the use of coarser resolutions (Fig. 8c). At mid-latitudes, however, the use of coarser resolutions leads to an increase in soil moisture during the year at most locations (Fig. 8c).
In summary, at low NA latitudes the JJA values of the three variables associated with the surface water balance (LH, PRECIP and SM 1 m) decrease with the use of coarser horizontal resolutions, although showing large spatial variability (Figs. 6d and 8a and c). At middle and high NA latitudes, there are differences in the response of the water balance variables to the use of coarser resolutions. For example, soil moisture increases with coarser resolutions over a large area at mid-latitudes, while convective precipitation increases just over a few grid cells in central NA, decreasing over most coastal areas (Fig. 8a and c). Latent heat flux decreases with the use of coarser resolutions over most regions at high and middle latitudes, particularly over coastal areas (Fig. 6d).
4.3 Comparison of temperature and precipitation against observations
For the comparison of the effect of LSM and horizontal resolution changes on climate simulations, we estimate the bias in all WRF simulations relative to the CRU observational product (Harris et al., 2014). As a measure of the possible uncertainties in observational databases, we also estimate the bias in the DAYMET product relative to the CRU data. The inconsistencies between both observational data are noticeably smaller than the biases in the WRF experiments for all variables in all regions, except for minimum temperatures in the CAM region and for precipitation in the ALA region (Fig. 9, see a representation of the regions in Fig. 1).
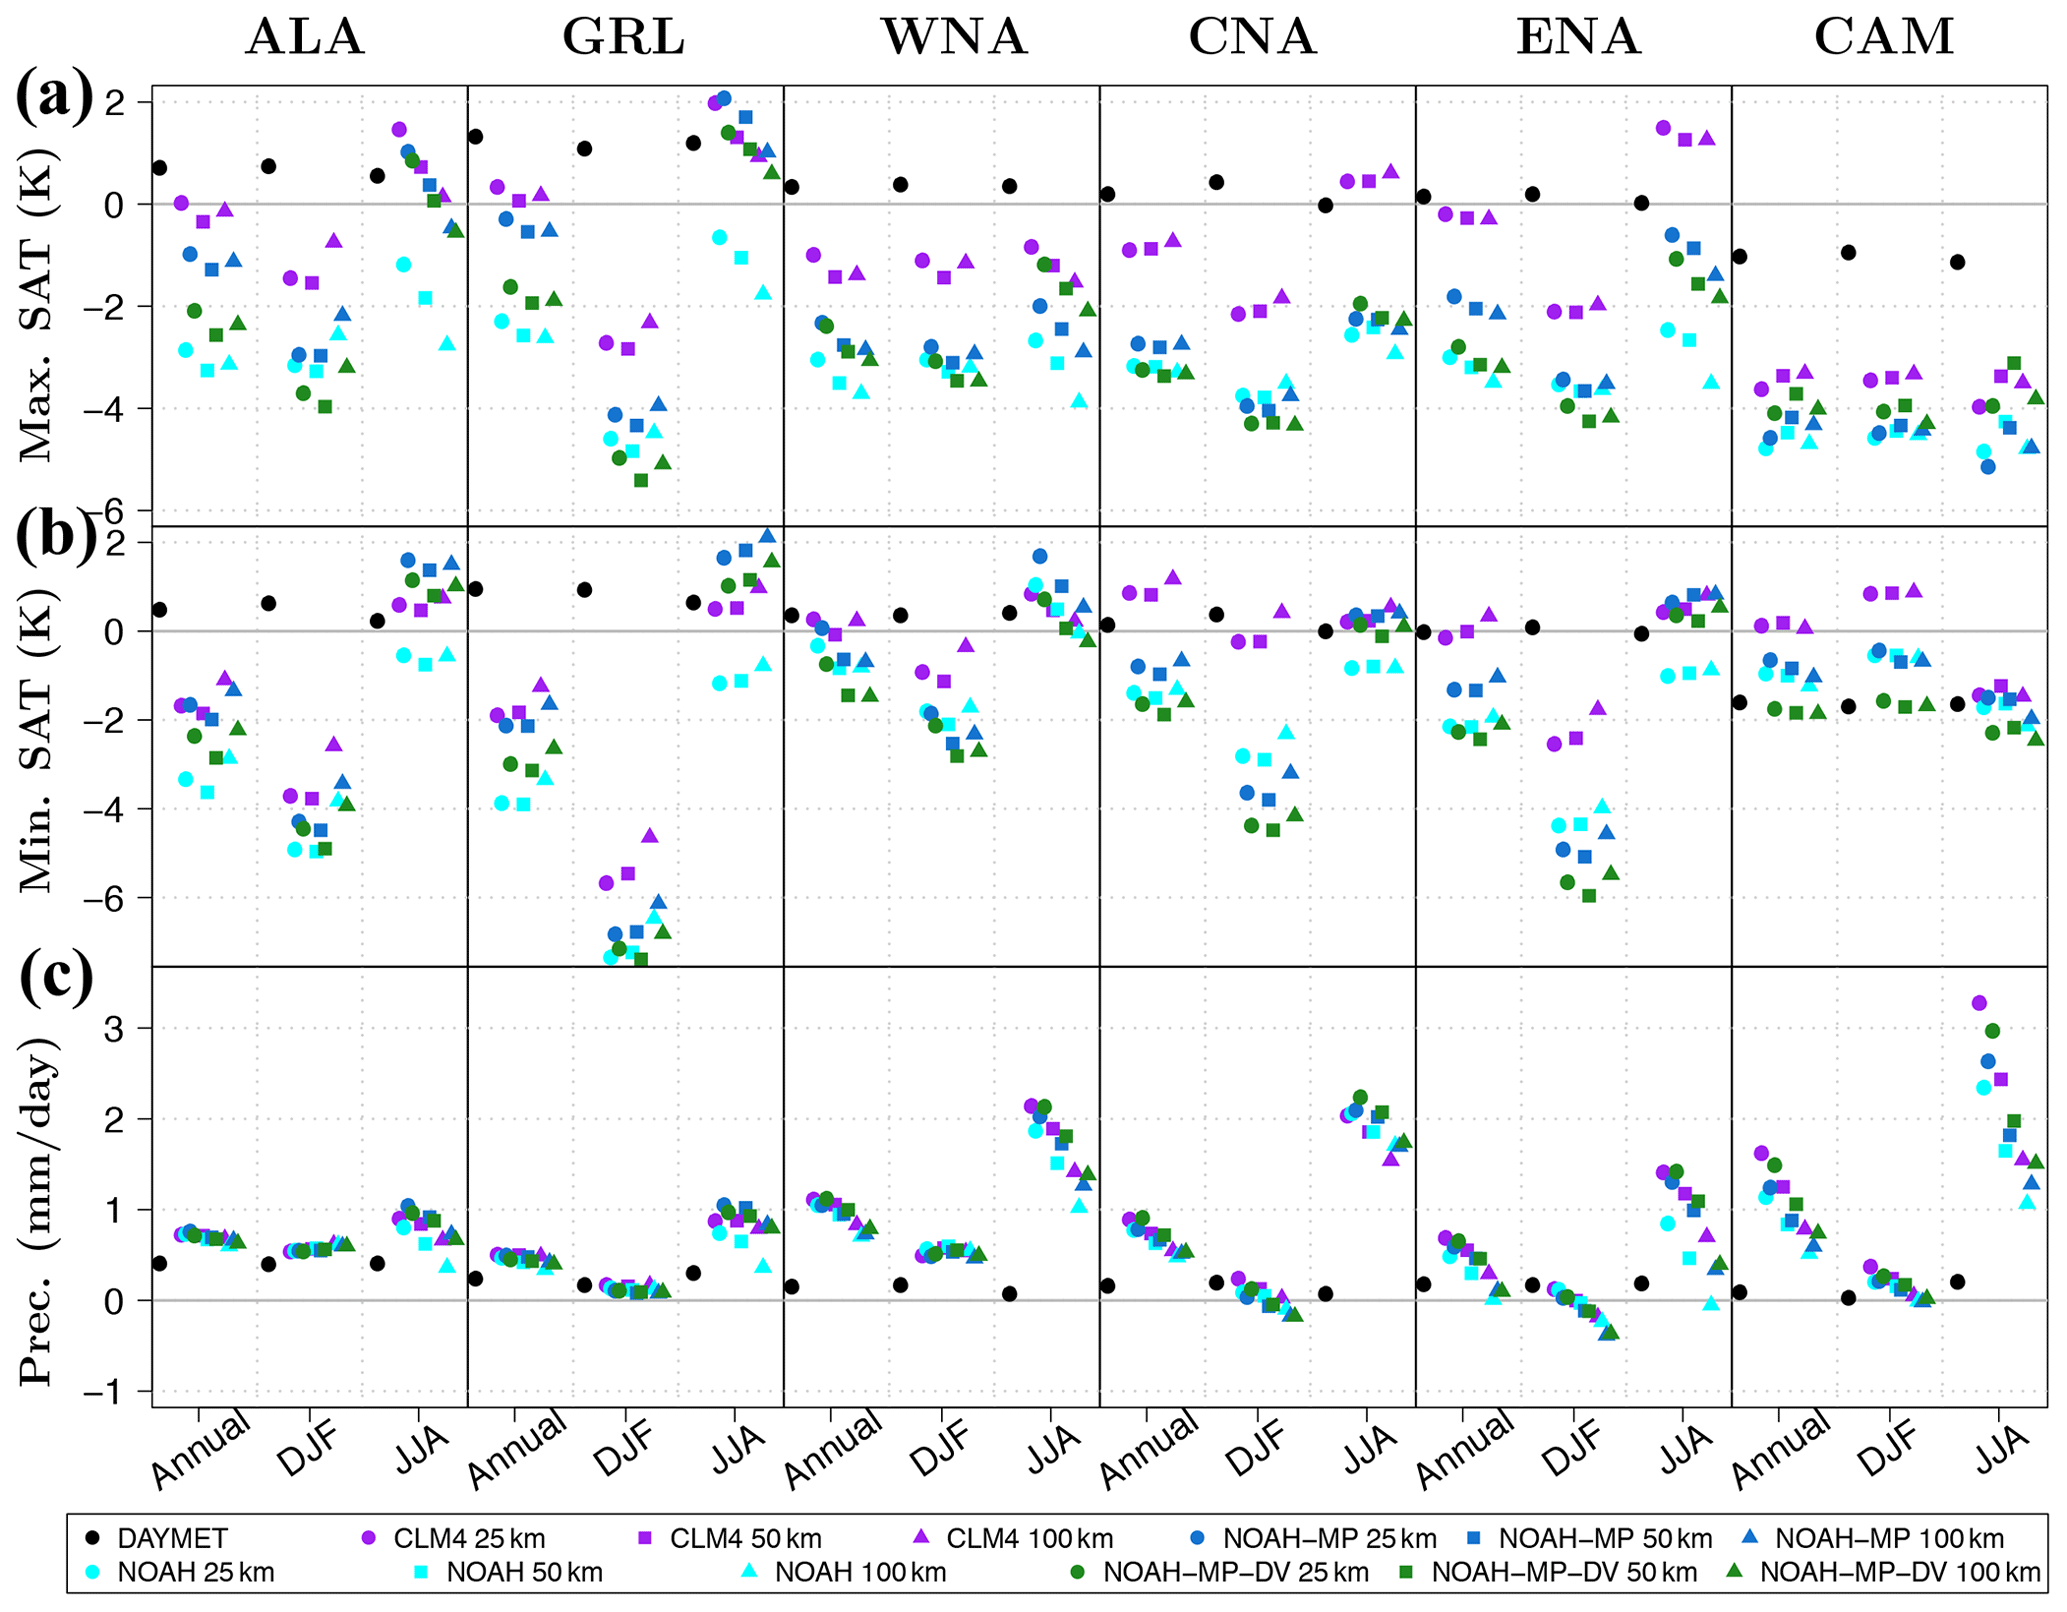
Figure 9Regional mean annual and seasonal biases in maximum and minimum temperatures (∘C) and in accumulated precipitation (mm d−1) for all experiments and the DAYMET data product relative to the CRU database from 1980 to 2013. Biases are estimated averaging over six subregions (Fig. 1) adapted from Giorgi and Francisco (2000): Central America, CAM; western North America, WNA; central North America, CNA; eastern North America, ENA; Alaska, ALA; and Greenland, GRL.
The WRF model underestimates annual and seasonal means of daily maximum temperatures over most of North America at all resolutions, compared grid cell by grid cell (Fig. S15 in the Supplement) and on average over subdomains (Fig. 9a). These biases are generally less pronounced for the experiments using the CLM4 LSM at most locations and in all seasons. The impact of horizontal resolution on these values is weaker than the LSM dependence over each domain, showing a greater effect of resolution on maximum temperatures in summer than in winter over western North America and at high latitudes (WNA, ALA and GRL in Fig. 9a). Over these areas, finer horizontal resolutions are associated with warmer JJA maximum temperatures, reducing the bias relative to the CRU dataset at middle latitudes (Figs. 7a and 9a). In the ALA and GRL regions, the WRF model with the CLM4 and the NOAH-MP LSM components overestimates JJA maximum temperatures, increasing the bias in these simulations with the use of finer resolutions (Fig. 9a). The WRF bias in maximum temperatures in winter is greatly improved over the boreal forest and the Rocky Mountains areas by using the CLM4 as LSM (Fig. S15). Over the same areas the CLM4 simulated very high values of shortwave net radiation and sensible heat flux in comparison with the rest of the land surface models (Fig. 3a and e), which may be related to the CLM4 albedo estimate. Despite the WRF underestimation of mean maximum temperature, extreme maximum temperatures are overestimated by the WRF model, particularly at high latitudes and using the CLM4 LSM (Fig. 10a). As expected based on the literature, the resolution effect on the bias in extreme maximum temperatures is larger than on the bias in mean maximum temperatures; however LSM differences are still larger than resolution-induced changes.

Figure 10Regional mean annual and seasonal biases in extreme maximum and minimum temperatures (∘C) and in extreme precipitation (mm d−1) for all experiments and the DAYMET data product relative to the CRU database from 1980 to 2013. Extremes are calculated as the 95th percentile of the annual and seasonal temporal series at each grid cell. Biases are estimated averaging over six subregions (Fig. 1) adapted from Giorgi and Francisco (2000): Central America, CAM; western North America, WNA; central North America, CNA; eastern North America, ENA; Alaska, ALA; and Greenland, GRL.
The performance of the WRF model in reproducing daily minimum temperatures from the CRU observations is slightly better than reproducing maximum temperatures at middle and low latitudes, but it is worse at high latitudes particularly in DJF (Fig. 9b). Experiments using the CLM4 LSM yield a warmer climatology over most areas and for all seasons than the experiments with the other LSM components, implying smaller biases in the CLM4 simulations for most of the regions (Fig. 9b). The WRF bias in minimum temperature is large in winter over the central and eastern areas of North America and at middle and high latitudes (subdomains ALA, GRL, CNA and ENA in Fig. 9b). The resolution impact on these results is again weaker than the effect of the LSM component. In summer, the WRF-NOAH experiments show a large negative bias in minimum temperatures over the NA southeastern coast (Fig. S16 in the Supplement), areas where the same experiments also shown high values of longwave net radiation and low values of sensible heat flux (Fig. 3b and e). The simulation of extreme minimum temperatures is also overestimated for all experiments and regions except for the CAM region in summer, showing particularly large biases in winter (Fig. 10b). Thus, although the WRF model underestimates mean maximum and minimum temperatures, it overestimates the intensity of hot extremes associated with minimum and maximum temperatures. The effect of dynamic vegetation (NOAH-MP vs. NOAH-MP-DV) on the biases in extreme and mean maximum and minimum temperatures remains constant using different resolutions, reaching larger biases and colder maximum and minimum temperatures with dynamic vegetation than with prescribed vegetation for most of the regions (Fig. 9a and b).
The WRF model simulates large positive biases in daily accumulated precipitation at the surface over most of North America during all seasons, with larger biases in summer (Figs. 9c and S17 in the Supplement). A negative bias is also present in all experiments over the southeastern USA and the eastern coast of North America in summer and winter (Fig. S17). Dry biases are reduced when using finer horizontal resolutions, while wet biases are larger when using smaller scales (Fig. 9c). This is due to the intensification of the water cycle with the use of finer horizontal resolutions discussed in Sect. 4.2 and presented in Figs. 6d and 8. For example in winter, the dry bias shown in all experiments over the southeastern NA is associated with an increase in non-convective precipitation using finer resolutions (Figs. S17 and 8b). In summer, the bias in precipitation is larger using finer resolutions over most of coastal areas where an increase in convective precipitation and latent heat flux was shown with the use of finer resolutions (Figs. 6d, 8a and S17). The impact of resolution on the accumulated precipitation is stronger than the effect of the LSM component, which affects precipitation mainly in summer (Fig. 9). The results show a larger bias in extreme precipitation than for the mean accumulated precipitation but yielding similar conclusions (Fig. 10).
In summary, the LSM impact on temperatures is larger than the resolution effect, while the opposite is true for precipitation climatologies; i.e., differences in precipitation arising from changes in resolution are larger than LSM differences (Fig. 9). The influence of both the LSM choice and resolution intensifies in summer compared with the rest of seasons probably because of the larger energy exchanges and the consequent intensification of land–atmosphere coupling in summer (Zhang et al., 2008; Mei and Wang, 2012). The CLM4 LSM generates the smallest biases relative to the CRU database in the WRF simulation of mean maximum and minimum temperatures; however it also yields the larger biases in extreme maximum and minimum temperatures. The use of finer resolutions leads to slightly larger or smaller biases in the simulation of maximum and minimum temperatures depending on the LSM component and the region, while the use of finer resolutions implies larger biases in mean and extreme precipitation at low and middle latitudes for all LSM components, particularly in summer.
The dependence of climate simulations on the LSM component shown in this study agrees with conclusions drawn from previous analyses at different temporal and spatial scales (Chen et al., 2014; Van Den Broeke et al., 2018; Liu et al., 2019; Zhuo et al., 2019; Davin and Seneviratne, 2012; Mooney et al., 2013; Laguë et al., 2019; García-García et al., 2020). For example, using the Consortium for Small-scale Modeling (COSMO) and WRF RCMs, Davin and Seneviratne (2012) and Mooney et al. (2013) identified an LSM sensitivity of temperature and precipitation conditions over Europe which intensifies in summer. Additionally, our analysis has shown that the impact of the LSM choice on the WRF simulation of precipitation is weaker than its impact on temperature, in agreement with studies over a small region in Italy (Zhuo et al., 2019), over Europe (Mooney et al., 2013), and over the western and central USA at seasonal scales (Jin et al., 2010; Chen et al., 2014; Van Den Broeke et al., 2018). The implementation and calculation of surface properties (albedo, surface roughness and evaporative resistances) by each LSM can be the cause of the LSM differences in the simulation of energy fluxes (Laguë et al., 2019). Thus, LSM differences in SNET are probably related to albedo values within each LSM. The large LSM differences in sensible heat flux over the boreal forest are likely related to the LSM estimates of surface roughness, while the large latent heat flux differences at low latitudes are probably associated with different estimates of evaporative resistances and the treatment of soil water in each LSM.
The great WRF sensibility to precipitation rates to resolution is also supported by the literature (e.g., Pieri et al., 2015). Our results also show large seasonal differences, mainly caused by the different contribution of convective precipitation in summer and winter. In summer at middle and low latitudes, the use of finer grid cells leads to a change in the energy partition into sensible and latent heat flux, increasing latent heat, and decreasing sensible heat (Fig. 6). This increase in latent heat flux over these areas is probably the cause of the higher values of convective precipitation (Fig. 8a). This resolution-induced increase in precipitation through changes in convective processes has also been suggested in the literature (Prein et al., 2016). At high latitudes both turbulent heat fluxes increase in summer with the use of finer resolutions mainly due to the increase in shortwave net radiation probably related to the decrease in cloud cover shown in Fig. 8d. These changes in cloud cover with resolution may be caused by the performance of the microphysical parameterizations at different resolutions and the improvement in the representation of orography (Pieri et al., 2015; Prein et al., 2016).
Previous evaluations of RCMs using several soil models over different domains reached the conclusion that the most complex LSM components – that is, the LSM components representing more physical phenomena – outperform others (Chen et al., 2014; Van Den Broeke et al., 2018; Liu et al., 2019). Over North America, our results indicate that the WRF simulation of temperature conditions using the CLM4 LSM outperforms the simulation of mean maximum and minimum temperatures generated by the NOAH and NOAH-MP LSMs, but it yields larger biases in extreme maximum and minimum temperatures (Figs. 9 and 10). The simulation of precipitation in summer is, however, slightly better represented by the NOAH LSM than by the other LSM components (Fig. 9). Nonetheless, the comparison of all WRF experiments with observations shows overestimated values of precipitation over most of North America, which is in agreement with other studies using WRF over the western USA (Jin et al., 2010; Chen et al., 2014) and over Europe (Pieri et al., 2015). Atmospheric parameterizations were not tested in our study; however, other WRF sensitivity experiments using several microphysics schemes over Europe found a positive bias in precipitation for all simulations, which was considerably reduced in summer within a convective-permitting simulation (Pieri et al., 2015); that is, the positive bias in precipitation has been reported in WRF simulations over different domains using several LSM components, horizontal resolutions, microphysics parameterizations and reanalysis products as initial and boundary conditions (Figs. 9 in this paper, Pieri et al., 2015; Chen et al., 2014; Jin et al., 2010). Therefore, the results included here, together with the results reported in the literature, suggest that the use of finer resolutions may raise precipitation biases in WRF simulations over North America, but the implementation of convective-permitting processes and other atmospheric parameterizations could reduce this bias.
This study has shown the effect of changes in horizontal resolution and LSM choice on the simulation of energy fluxes at the surface and temperature and water conditions near the surface. The effect of both model choices intensifies in summer due to the increase in energy and water exchanges between the lower atmosphere and the land surface. Enhancing horizontal resolution leads to higher precipitation climatologies for all LSMs over coastal areas at low latitudes mainly due to an increase in convective precipitation also associated with an increase in latent heat flux. Our results highlight the important role of the LSM choice in the WRF representation of the energy partition at the surface, which mainly affects the simulation of near-surface temperatures over North America. Additionally, these results demonstrate the impact of the LSM choice on simulated atmospheric conditions, showing LSM-dependent differences in the simulated cloud fraction and non-convective precipitation rates. This is probably associated with the land–atmospheric coupled character of our simulations and the interactions between small- and large-scale dynamical processes.
The evaluation of the WRF simulations against observations supports the use of the CLM4 LSM as the best choice within the evaluated options for WRF simulations over North America, although it may overestimate temperature extreme events. The use of finer resolutions yields a small improvement in the representation of minimum temperatures within WRF at middle and high latitudes. Nonetheless, the use of finer resolutions should be implemented with caution since it may increase the WRF bias in mean and extreme precipitation. Further sensitivity experiments using other atmospheric parameterizations and other resolutions fine enough for convective-permitting processes (<5 km) or for altering the hydrostatic balance of the model (≈10 km) are necessary to determine the best WRF configuration for downscaling climate simulations over North America for paleoclimate and climate change studies. However, the large computational resources required to perform a sensitivity analysis including convective-permitting processes would require a reduction in the area of interest or in the length of the simulation.
Information provided by downscaling studies is used for building climate change policies through the information collected in assessment reports (IPCC, 2013; Mbow et al., 2017; USGCRP, 2018). Thus, sensitivity studies like the one presented here are crucial to understand and ultimately restrict uncertainties in climate simulations with direct benefits to society and environment. Particularly, these results should be considered for downscaling studies over North America aimed at projecting future or past conditions and informing policymakers.
As described in Sect. 2, here we used the Research and Forecasting model (WRF, version 3.9, http://www.wrf-model.org, last access: 12 January 2022, Skamarock et al., 2008). The outputs of all simulations together with the code used to estimate the presented results are available at https://doi.org/10.5281/zenodo.5106087 (García-García et al., 2021). The NARR product (Mesinger et al., 2006) was obtained from https://www.ncei.noaa.gov/data/north-american-regional-reanalysis/access/3-hourly/ (last access: 12 January 2022). The CRU TS4.03 database can be downloaded from the University of East Anglia web page (https://doi.org/10.5285/10d3e3640f004c578403419aac167d82, University of East Anglia Climatic Research Unit et al., 2020). The DAYMET V3 database (Thornton et al., 2016) is available at https://doi.org/10.3334/ORNLDAAC/1328.
The supplement related to this article is available online at: https://doi.org/10.5194/gmd-15-413-2022-supplement.
AGG designed the modelling experiment, performed the simulations and analyzed model outputs. All authors (AGG, FJCV, HB, JFGR and EGB) contributed to the interpretation and discussion of results. AGG wrote the manuscript with continuous feedback from FJCV, HB, JFGR and EGB.
The contact author has declared that neither they nor their co-authors have any competing interests.
Publisher's note: Copernicus Publications remains neutral with regard to jurisdictional claims in published maps and institutional affiliations.
We thank the Mesoscale and Microscale Meteorology (MMM), the National Center for Atmospheric Research (NCAR), the National Oceanic and Atmospheric Administration (NOAA), the Climatic Research Unit (CRU) at the University of East Anglia and the Oak Ridge National Laboratory Distributed Active Archive Center (ORNL DAAC) for making the WRF code and the NARR, CRU and DAYMET datasets available. This analysis contributes to the PALEOLINK project (http://www.pastglobalchanges.org/science/wg/2k-network/projects/paleolink/intro, last access: 4 May 2021), part of the PAGES 2k network. All WRF simulations were performed in the computational facilities provided by the Atlantic Computational Excellence Network (ACENET-Compute Canada). During the elaboration of this analysis, Almudena García-García and Francisco José Cuesta-Valero were partially funded by Hugo Beltrami's Canada Research Chair program, the School of Graduate Students at Memorial University of Newfoundland and the Research Office at St. Francis Xavier University. Francisco José Cuesta-Valero is also funded by the Alexander von Humboldt Foundation.
This research has been supported by the Canadian Network for Research and Innovation in Machining Technology, Natural Sciences and Engineering Research Council of Canada (grant no. DG 140576948), the Canada Excellence Research Chairs, Government of Canada (grant no. 230687), and the Canada Foundation for Innovation (CFI).
This paper was edited by David Lawrence and reviewed by two anonymous referees.
Ban, N., Schmidli, J., and Schär, C.: Evaluation of the convection-resolving regional climate modeling approach in decade-long simulations, J. Geophys. Res.-Atmos., 119, 7889–7907, https://doi.org/10.1002/2014JD021478, 2014. a
Barlage, M., Zeng, X., Wei, H., and Mitchell, K. E.: A global 0.05∘ maximum albedo dataset of snow-covered land based on MODIS observations, Geophys. Res. Lett., 32, L17405, https://doi.org/10.1029/2005GL022881, 2005. a
Bonan, G. B.: Ecological climatology: concepts and applications, Cambridge University Press, Cambridge, UK, ISBN 521 80476 0, 2002. a
Chen, F., Liu, C., Dudhia, J., and Chen, M.: A sensitivity study of high-resolution regional climate simulations to three land surface models over the western United States, J. Geophys. Res.-Atmos., 119, 7271–7291, https://doi.org/10.1002/2014JD021827, 2014. a, b, c, d, e, f
Collins, W. D., Rasch, P. J., Boville, B. A., Hack, J. J., McCaa, J. R., Williamson, D. L., Kiehl, J. T., Briegleb, B., Bitz, C., and Lin, S.-J.: Description of the NCAR community atmosphere model (CAM 3.0), NCAR Tech. Note NCAR/TN-464+ STR, 226, University Corporation for Atmospheric Research, https://doi.org/10.5065/D63N21CH, 2004. a
Cubasch, U., Wuebbles, D., Chen, D., Facchini, M., Frame, D., Mahowald, N., and Winther, J.-G.: Introduction, book section 1, Cambridge University Press, Cambridge, UK and New York, NY, USA, 119–158, https://doi.org/10.1017/CBO9781107415324.007, 2013. a
Davin, E. L. and Seneviratne, S. I.: Role of land surface processes and diffuse/direct radiation partitioning in simulating the European climate, Biogeosciences, 9, 1695–1707, https://doi.org/10.5194/bg-9-1695-2012, 2012. a, b, c
Demory, M.-E., Vidale, P. L., Roberts, M. J., Berrisford, P., Strachan, J., Schiemann, R., and Mizielinski, M. S.: The role of horizontal resolution in simulating drivers of the global hydrological cycle, Clim. Dynam., 42, 2201–2225, https://doi.org/10.1007/s00382-013-1924-4, 2014. a
Di Luca, A., de Elía, R., and Laprise, R.: Challenges in the Quest for Added Value of Regional Climate Dynamical Downscaling, Current Climate Change Reports, 1, 10–21, https://doi.org/10.1007/s40641-015-0003-9, 2015. a, b
Dirmeyer, P. A., Jin, Y., Singh, B., and Yan, X.: Trends in Land–Atmosphere Interactions from CMIP5 Simulations, J. Hydrometeorol., 14, 829–849, https://doi.org/10.1175/JHM-D-12-0107.1, 2013. a
García-García, A., Cuesta-Valero, F. J., Beltrami, H., and Smerdon, J. E.: Characterization of Air and Ground Temperature Relationships within the CMIP5 Historical and Future Climate Simulations, J. Geophys. Res.-Atmos., 124, 3903–3929, https://doi.org/10.1029/2018JD030117, 2019. a, b, c
García-García, A., Cuesta-Valero, F. J., Beltrami, H., González-Rouco, F., García-Bustamante, E., and Finnis, J.: Land surface model influence on the simulated climatologies of temperature and precipitation extremes in the WRF v3.9 model over North America, Geosci. Model Dev., 13, 5345–5366, https://doi.org/10.5194/gmd-13-5345-2020, 2020. a, b, c
García-García, A., José Cuesta-Valero, F., Beltrami, H., González-Rouco, F., and García-Bustamante, E.: Code and Data: WRF v.3.9 sensitivity to land surface model and horizontal resolution changes over North America, Zenodo [data set], https://doi.org/10.5281/zenodo.5106087, 2021. a
Giorgi, F. and Francisco, R.: Uncertainties in regional climate change prediction: a regional analysis of ensemble simulations with the HADCM2 coupled AOGCM, Clim. Dynam., 16, 169–182, https://doi.org/10.1007/PL00013733, 2000. a, b, c, d
Giorgi, F. and Gutowski Jr., W. J.: Regional Dynamical Downscaling and the CORDEX Initiative, Annu. Rev. Env. Resour., 40, 467–490, https://doi.org/10.1146/annurev-environ-102014-021217, 2015. a
Gómez-Navarro, J. J., Raible, C. C., and Dierer, S.: Sensitivity of the WRF model to PBL parametrisations and nesting techniques: evaluation of wind storms over complex terrain, Geosci. Model Dev., 8, 3349–3363, https://doi.org/10.5194/gmd-8-3349-2015, 2015. a
Gómez-Navarro, J. J., Ludwig, P., and Zorita, E.: The PALEOLINK working project: The missing link in the Past-Downscaling paleoclimatic Earth System Models, in: EGU General Assembly Conference Abstracts, 14961, 2018. a
Grell, G. A. and Freitas, S. R.: A scale and aerosol aware stochastic convective parameterization for weather and air quality modeling, Atmos. Chem. Phys., 14, 5233–5250, https://doi.org/10.5194/acp-14-5233-2014, 2014. a
Hahmann, A. N., Sle, T., Witha, B., Davis, N. N., Dörenkämper, M., Ezber, Y., García-Bustamante, E., González-Rouco, J. F., Navarro, J., Olsen, B. T., and Söderberg, S.: The making of the New European Wind Atlas – Part 1: Model sensitivity, Geosci. Model Dev., 13, 5053–5078, https://doi.org/10.5194/gmd-13-5053-2020, 2020. a
Harris, I., Jones, P., Osborn, T., and Lister, D.: Updated high-resolution grids of monthly climatic observations – the CRU TS3.10 Dataset, Int. J. Climatol., 34, 623–642, https://doi.org/10.1002/joc.3711, 2014. a, b
Hatzianastassiou, N., Matsoukas, C., Fotiadi, A., Pavlakis, K. G., Drakakis, E., Hatzidimitriou, D., and Vardavas, I.: Global distribution of Earth's surface shortwave radiation budget, Atmos. Chem. Phys., 5, 2847–2867, https://doi.org/10.5194/acp-5-2847-2005, 2005. a
Hauser, M., Orth, R., and Seneviratne, S. I.: Role of soil moisture versus recent climate change for the 2010 heat wave in western Russia, Geophys. Res. Lett., 43, 2819–2826, https://doi.org/10.1002/2016GL068036, 2016. a
Hirschi, M., Seneviratne, S. I., Alexandrov, V., Boberg, F., Boroneant, C., Christensen, O. B., Formayer, H., Orlowsky, B., and Stepanek, P.: Observational evidence for soil-moisture impact on hot extremes in southeastern Europe, Nat. Geosci., 4, 17–21, https://doi.org/10.1038/ngeo1032, 2011. a
Hong, S.-Y. and Lim, J.-O. J.: The WRF single-moment 6-class microphysics scheme (WSM6), J. Korean Meteor. Soc, 42, 129–151, 2006. a
Hong, S.-Y., Noh, Y., and Dudhia, J.: A New Vertical Diffusion Package with an Explicit Treatment of Entrainment Processes, Mon. Weather Rev., 134, 2318–2341, https://doi.org/10.1175/MWR3199.1, 2006. a
Iles, C. E., Vautard, R., Strachan, J., Joussaume, S., Eggen, B. R., and Hewitt, C. D.: The benefits of increasing resolution in global and regional climate simulations for European climate extremes, Geosci. Model Dev., 13, 5583–5607, https://doi.org/10.5194/gmd-13-5583-2020, 2020. a
IPCC: Climate Change 2013: The Physical Science Basis. Contribution of Working Group I to the Fifth Assessment Report of the Intergovernmental Panel on Climate Change, Cambridge University Press, Cambridge, UK and New York, NY, USA, https://doi.org/10.1017/CBO9781107415324, 2013. a, b
IPCC: Summary for Policymakers, in: Climate Change and Land: an IPCC special report on climate change, desertification, land degradation, sustainable land management, food security, and greenhouse gas fluxes in terrestrial ecosystems, edited by: Shukla, P. R., Skea, J., Calvo Buendia, E., Masson-Delmotte, V., Pörtner, H.-O., Roberts, D. C., Zhai, P., Slade, R., Connors, S., van Diemen, R., Ferrat, M., Haughey, E., Luz, S., Neogi, S., Pathak, M., Petzold, J., Portugal Pereira, J., Vyas, P., Huntley, E., Kissick, K., Belkacemi, M., Malley, J., in press, 2019. a
Janjic, Z. I.: Advection scheme for passive substances inthe NCEP Eta model, Research Activities in Atmospheric and Oceanic Modelling, WMO, Genova, CAS=JSCWGNE, 3–14, 1997. a
Jiménez, P. A., Dudhia, J., González-Rouco, J. F., Navarro, J., Montávez, J. P., and García-Bustamante, E.: A Revised Scheme for the WRF Surface Layer Formulation, Mon. Weather Rev., 140, 898–918, https://doi.org/10.1175/MWR-D-11-00056.1, 2012. a
Jin, J., Miller, N. L., and Schlegel, N.: Sensitivity Study of Four Land Surface Schemes in the WRF Model, Adv. Meteorol., 2010, 167436, https://doi.org/10.1155/2010/167436, 2010. a, b, c
Koster, R. D., Sud, Y. C., Guo, Z., Dirmeyer, P. A., Bonan, G., Oleson, K. W., Chan, E., Verseghy, D., Cox, P., Davies, H., Kowalczyk, E., Gordon, C. T., Kanae, S., Lawrence, D., Liu, P., Mocko, D., Lu, C.-H., Mitchell, K., Malyshev, S., McAvaney, B., Oki, T., Yamada, T., Pitman, A., Taylor, C. M., Vasic, R., and Xue, Y.: GLACE: The Global Land–Atmosphere Coupling Experiment. Part I: Overview, J. Hydrometeorol., 7, 590–610, https://doi.org/10.1175/JHM510.1, 2006. a
Koven, C. D., Riley, W. J., and Stern, A.: Analysis of Permafrost Thermal Dynamics and Response to Climate Change in the CMIP5 Earth System Models, J. Climate, 26, 1877–1900, https://doi.org/10.1175/JCLI-D-12-00228.1, 2013. a
Laguë, M. M., Bonan, G. B., and Swann, A. L. S.: Separating the impact of individual land surface properties on the terrestrial surface energy budget in both the coupled and un-coupled land-atmosphere system, J. Climate, 32, 5725–5744, https://doi.org/10.1175/JCLI-D-18-0812.1, 2019. a, b, c
Lawrence, D. M., Fisher, R. A., Koven, C. D., Oleson, K. W., Swenson, S. C., Bonan, G., Collier, N., Ghimire, B., van Kampenhout, L., Kennedy, D., Kluzek, E., Lawrence, P. J., Li, F., Li, H., Lombardozzi, D., Riley, W. J., Sacks, W. J., Shi, M., Vertenstein, M., Wieder, W. R., Xu, C., Ali, A. A., Badger, A. M., Bisht, G., van den Broeke, M., Brunke, M. A., Burns, S. P., Buzan, J., Clark, M., Craig, A., Dahlin, K., Drewniak, B., Fisher, J. B., Flanner, M., Fox, A. M., Gentine, P., Hoffman, F., Keppel-Aleks, G., Knox, R., Kumar, S., Lenaerts, J., Leung, L. R., Lipscomb, W. H., Lu, Y., Pandey, A., Pelletier, J. D., Perket, J., Randerson, J. T., Ricciuto, D. M., Sanderson, B. M., Slater, A., Subin, Z. M., Tang, J., Thomas, R. Q., Val Martin, M., and Zeng, X.: The Community Land Model Version 5: Description of New Features, Benchmarking, and Impact of Forcing Uncertainty, J. Adv. Model. Earth Sy., 11, 4245–4287, https://doi.org/10.1029/2018MS001583, 2019. a
Liu, L., Ma, Y., Menenti, M., Zhang, X., and Ma, W.: Evaluation of WRF Modeling in Relation to Different Land Surface Schemes and Initial and Boundary Conditions: A Snow Event Simulation Over the Tibetan Plateau, J. Geophys. Res.-Atmos., 124, 209–226, https://doi.org/10.1029/2018JD029208, 2019. a, b, c
Lorenz, R., Argüeso, D., Donat, M. G., Pitman, A. J., van den Hurk, B., Berg, A., Lawrence, D. M., Chéruy, F., Ducharne, A., Hagemann, S., Meier, A., Milly, P. C. D., and Seneviratne, S. I.: Influence of land-atmosphere feedbacks on temperature and precipitation extremes in the GLACE-CMIP5 ensemble, J. Geophys. Res.-Atmos., 121, 607–623, https://doi.org/10.1002/2015JD024053, 2016. a
Lucas-Picher, P., Laprise, R., and Winger, K.: Evidence of added value in North American regional climate model hindcast simulations using ever-increasing horizontal resolutions, Clim. Dynam., 48, 2611–2633, https://doi.org/10.1007/s00382-016-3227-z, 2017. a
MacDougall, A. H. and Beltrami, H.: Impact of deforestation on subsurface temperature profiles: implications for the borehole paleoclimate record, Environ. Res. Lett., 12, 074014, https://doi.org/10.1088/1748-9326/aa7394, 2017. a
Mbow, H.-O. P., Reisinger, A., Canadell, J., and O'Brien, P.: Special Report on climate change, desertification, land degradation, sustainable land management, food security, and greenhouse gas fluxes in terrestrial ecosystems (SR2), IPCC, Ginevra, 2017. a
Mei, R. and Wang, G.: Summer Land–Atmosphere Coupling Strength in the United States: Comparison among Observations, Reanalysis Data, and Numerical Models, J. Hydrometeorol., 13, 1010–1022, https://doi.org/10.1175/JHM-D-11-075.1, 2012. a
Melo-Aguilar, C., González-Rouco, J. F., García-Bustamante, E., Navarro-Montesinos, J., and Steinert, N.: Influence of radiative forcing factors on ground–air temperature coupling during the last millennium: implications for borehole climatology, Clim. Past, 14, 1583–1606, https://doi.org/10.5194/cp-14-1583-2018, 2018. a
Mesinger, F., DiMego, G., Kalnay, E., Mitchell, K., Shafran, P. C., Ebisuzaki, W., Jovic, D., Woollen, J., Rogers, E., Berbery, E. H., Ek, M. B., Fan, Y., Grumbine, R., Higgins, W., Li, H., Lin, Y., Manikin, G., Parrish, D., and Shi, W.: North American regional reanalysis, B. Am. Meteorol. Soc., 87, 343–360, https://doi.org/10.1175/BAMS-87-3-343, 2006 (data available at: https://www.ncei.noaa.gov/data/north-american-regional-reanalysis/access/3-hourly/, last access: 12 January 2022). a, b, c
Messmer, M., Gómez-Navarro, J. J., and Raible, C. C.: Sensitivity experiments on the response of Vb cyclones to sea surface temperature and soil moisture changes, Earth Syst. Dynam., 8, 477–493, https://doi.org/10.5194/esd-8-477-2017, 2017. a
Miralles, D. G., den Berg, M. J., Teuling, A. J., and Jeu, R. A. M.: Soil moisture-temperature coupling: A multiscale observational analysis, Geophys. Res. Lett., 39, L21707, https://doi.org/10.1029/2012GL053703, 2012. a
Mitchell, K.: The community Noah land-surface model (LSM), User’s Guide, 2.7.1, available at: https://ral.ucar.edu/sites/default/files/public/product-tool/unified-noah-lsm/Noah_LSM_USERGUIDE_2.7.1.pdf (last access: 12 January 2022), 2005. a
Mooney, P. A., Mulligan, F. J., and Fealy, R.: Evaluation of the Sensitivity of the Weather Research and Forecasting Model to Parameterization Schemes for Regional Climates of Europe over the Period 1990–95, J. Climate, 26, 1002–1017, https://doi.org/10.1175/JCLI-D-11-00676.1, 2013. a, b, c, d, e
Niu, G.-Y., Yang, Z.-L., Mitchell, K. E., Chen, F., Ek, M. B., Barlage, M., Kumar, A., Manning, K., Niyogi, D., Rosero, E., Tewari, M., and Xia, Y.: The community Noah land surface model with multiparameterization options (Noah-MP): 1. Model description and evaluation with local-scale measurements, J. Geophys. Res.-Atmos., 116, 2156–2202, https://doi.org/10.1029/2010JD015139, 2011. a, b
Oleson, K. W., Lawrence, D. M., Bonan, G. B., Flanner, M. G., Kluzek, E., Lawrence, P. J., Levis, S., Swenson, S. C., Thornton, P. E., Dai, A., Decker, M., Dickinson, R., Feddema, J., Heald, C. L., Hoffman, F., Lamarque, J.-F., Mahowald, N., Niu, G.-Y., Qian, T., Randerson, J., Running, S., Sakaguchi, K., Slater, A., Stockli, R., Wang, A., Yang, Z.-L., Zeng, X., and Zeng., X.: Technical description of version 4.0 of the Community Land Model (CLM), Tech. rep., NCAR, Boulder, 2010. a, b
Pei, L., Moore, N., Zhong, S., Luo, L., Hyndman, D. W., Heilman, W. E., and Gao, Z.: WRF Model Sensitivity to Land Surface Model and Cumulus Parameterization under Short-Term Climate Extremes over the Southern Great Plains of the United States, J. Climate, 27, 7703–7724, https://doi.org/10.1175/JCLI-D-14-00015.1, 2014. a
Pieri, A. B., von Hardenberg, J., Parodi, A., and Provenzale, A.: Sensitivity of Precipitation Statistics to Resolution, Microphysics, and Convective Parameterization: A Case Study with the High-Resolution WRF Climate Model over Europe, J. Hydrometeorol., 16, 1857–1872, https://doi.org/10.1175/JHM-D-14-0221.1, 2015. a, b, c, d, e
Prein, A., Gobiet, A., Truhetz, H., Keuler, K., Goergen, K., Teichmann, C., Fox Maule, C., van Meijgaard, E., Déqué, M., Nikulin, G., Vautard, R., Colette, A., Kjellström, E., and Jacob, D.: Precipitation in the EURO-CORDEX 0.11∘ and 0.44∘ simulations: high resolution, high benefits?, Clim. Dynam., 46, 383–412, https://doi.org/10.1007/s00382-015-2589-y, 2016. a, b
Prein, A. F., Gobiet, A., Suklitsch, M., Truhetz, H., Awan, N. K., Keuler, K., and Georgievski, G.: Added value of convection permitting seasonal simulations, Clim. Dynam., 41, 2655–2677, https://doi.org/10.1007/s00382-013-1744-6, 2013. a, b
Rummukainen, M.: Added value in regional climate modeling, WIREs Clim. Change, 7, 145–159, https://doi.org/10.1002/wcc.378, 2016. a, b, c
Seneviratne, S. I., Lüthi, D., Litschi, M., and Schär, C.: Land–atmosphere coupling and climate change in Europe, Nature, 443, 205–209, 2006. a
Sippel, S., Zscheischler, J., Mahecha, M. D., Orth, R., Reichstein, M., Vogel, M., and Seneviratne, S. I.: Refining multi-model projections of temperature extremes by evaluation against land–atmosphere coupling diagnostics, Earth Syst. Dynam., 8, 387–403, https://doi.org/10.5194/esd-8-387-2017, 2017. a
Skamarock, W. C., Klemp, J. B., Dudhia, J., Gill, D. O., Barker, D., Duda, M. G., Huang, X.-y., Wang, W., and Powers, J. G.: A Description of the Advanced Research WRF Version 3 (No. NCAR/TN-475+STR), University Corporation for Atmospheric Research, https://doi.org/10.5065/D68S4MVH, 2008. a, b, c
Sun, X., Xue, M., Brotzge, J., McPherson, R. A., Hu, X.-M., and Yang, X.-Q.: An evaluation of dynamical downscaling of Central Plains summer precipitation using a WRF-based regional climate model at a convection-permitting 4 km resolution, J. Geophys. Res.-Atmos., 121, 13801–13825, https://doi.org/10.1002/2016JD024796, 2016. a
Taylor, K. E., Stouffer, R. J., and Meehl, G. A.: An overview of CMIP5 and the experiment design, B. Am. Meteorol. Soc., 93, 485–498, 2012. a
Tewari, M., Chen, F., Wang, W., Dudhia, J., LeMone, M., Mitchell, K., Ek, M., Gayno, G., Wegiel, J., and Cuenca, R.: Implementation and verification of the unified NOAH land surface model in the WRF model, 20th conference on weather analysis and forecasting/16th conference on numerical weather prediction, American Meteorological Society, Seattle, WA, US, 11–15, 2004. a, b, c
Thornton, P., Thornton, M., Mayer, B., Wei, Y., Devarakonda, R., Vose, R., and Cook, R.: Daymet: Daily Surface Weather Data on a 1-km Grid for North America, Version 3, ORNL DAAC, Oak Ridge, Tennessee, USA, https://doi.org/10.3334/ORNLDAAC/1328, 2016. a, b
University of East Anglia Climatic Research Unit, Harris, I. C., and Jones, P. D.: CRU TS4.03: Climatic Research Unit (CRU) Time-Series (TS) version 4.03 of high-resolution gridded data of month-by-month variation in climate (Jan. 1901–Dec. 2018), Centre for Environmental Data Analysis [data set], https://doi.org/10.5285/10d3e3640f004c578403419aac167d82, 2020. a
U.S. Global Change Research Program (USGCRP): Impacts, Risks, and Adaptation in the United States: Fourth National Climate Assessment, Volume II, edited by: Reidmiller, D. R., Avery, C. W., Easterling, D. R., Kunkel, K. E., Lewis, K. L. M., Maycock, T. K., and Stewart, B. C., U.S. Global Change Research Program, Washington, DC, USA, 1515 pp., https://doi.org/10.7930/NCA4.2018, 2018. a
Van Den Broeke, M. S., Kalin, A., Alavez, J. A. T., Oglesby, R., and Hu, Q.: A warm-season comparison of WRF coupled to the CLM4.0, Noah-MP, and Bucket hydrology land surface schemes over the central USA, Theor. Appl. Climatol., 134, 801–816, https://doi.org/10.1007/s00704-017-2301-8, 2018. a, b, c, d
Vegas-Cañas, C., González-Rouco, J. F., Navarro-Montesinos, J., García-Bustamante, E., Lucio-Eceiza, E. E., García-Pereira, F., Rodríguez-Camino, E., Chazarra-Bernabé, A., and Álvarez-Arévalo, I.: An Assessment of Observed and Simulated Temperature Variability in Sierra de Guadarrama, Atmosphere, 11, 985, https://doi.org/10.3390/atmos11090985, 2020. a, b
Vogel, M. M., Orth, R., Cheruy, F., Hagemann, S., Lorenz, R., Hurk, B. J. J. M., and Seneviratne, S. I.: Regional amplification of projected changes in extreme temperatures strongly controlled by soil moisture-temperature feedbacks, Geophys. Res. Lett., 44, 1511–1519, https://doi.org/10.1002/2016GL071235, 2017. a
von Storch, H., Langenberg, H., and Feser, F.: A Spectral Nudging Technique for Dynamical Downscaling, Mon. Weather Rev., 128, 3664–3673, https://doi.org/10.1175/1520-0493(2000)128<3664:ASNTFD>2.0.CO;2, 2000. a
Wehner, M. F., Smith, R. L., Bala, G., and Duffy, P.: The effect of horizontal resolution on simulation of very extreme US precipitation events in a global atmosphere model, Clim. Dynam., 34, 241–247, https://doi.org/10.1007/s00382-009-0656-y, 2010. a
Wharton, S., Simpson, M., Osuna, J., Newman, J., and Biraud, S.: Assessment of Land Surface Model Performance in WRF for Simulating Wind at Heights Relevant to the Wind Energy Community, Tech. rep., Lawrence Livermore National Lab. (LLNL), Livermore, CA, US, 2013. a, b, c
Xue, Y., Janjic, Z., Dudhia, J., Vasic, R., and Sales, F. D.: A review on regional dynamical downscaling in intraseasonal to seasonal simulation/prediction and major factors that affect downscaling ability, Atmos. Res., 147–148, 68–85, https://doi.org/10.1016/j.atmosres.2014.05.001, 2014. a
Zhang, J., Wang, W.-C., and Leung, L. R.: Contribution of land-atmosphere coupling to summer climate variability over the contiguous United States, J. Geophys. Res.-Atmos., 113, D2210, https://doi.org/10.1029/2008JD010136, 2008. a
Zhuo, L., Dai, Q., Han, D., Chen, N., and Zhao, B.: Assessment of simulated soil moisture from WRF Noah, Noah-MP, and CLM land surface schemes for landslide hazard application, Hydrol. Earth Syst. Sci., 23, 4199–4218, https://doi.org/10.5194/hess-23-4199-2019, 2019. a, b, c