the Creative Commons Attribution 4.0 License.
the Creative Commons Attribution 4.0 License.
 | 03 Feb 2022
Sensitivity of asymmetric oxygen minimum zones to mixing intensity and stoichiometry in the tropical Pacific using a basin-scale model (OGCM-DMEC V1.4)
Kai Wang
Raghu Murtugudde
Dongxiao Zhang
Rong-Hua Zhang
The tropical Pacific Ocean holds the two largest oxygen minimum zones (OMZs) in the world's oceans, showing a prominent hemispheric asymmetry, with a much stronger and broader OMZ north of the Equator. However, many models have difficulties in reproducing the observed asymmetric OMZs in the tropical Pacific. Here, we apply a fully coupled basin-scale model to evaluate the impacts of stoichiometry and the intensity of vertical mixing on the dynamics of OMZs in the tropical Pacific. We first utilize observational data of dissolved oxygen (DO) to calibrate and validate the basin-scale model. Our model experiments demonstrate that enhanced vertical mixing combined with a reduced O:C utilization ratio can significantly improve our model capability of reproducing the asymmetric OMZs. Our study shows that DO concentration is more sensitive to biological processes over 200–400 m but to physical processes below 400 m. Applying an enhanced vertical mixing causes a modest increase in physical supply (1–2 mmol m−3 yr−1) and a small increase (< 0.5 mmol m−3 yr−1) in biological consumption over 200–1000 m, whereas applying a reduced O:C utilization ratio leads to a large decrease (2–8 mmol m−3 yr−1) in both biological consumption and physical supply in the OMZs. Our analyses suggest that biological consumption (greater rate to the south than to the north) cannot explain the asymmetric distribution of mid-depth DO in the tropical Pacific, but physical supply (stronger vertical mixing to the south) plays a major role in regulating the asymmetry of the tropical Pacific's OMZs. This study also highlights the important roles of physical and biological interactions and feedbacks in contributing to the asymmetry of OMZs in the tropical Pacific.
- Article
(10041 KB) - Full-text XML
-
Supplement
(538 KB) - BibTeX
- EndNote


Photosynthesis and respiration are important processes in all ecosystems on earth, with carbon and oxygen being the two main elements. The carbon cycle has garnered much attention, with significant advances in both observations (Feely et al., 1999; Takahashi et al., 2009) and modeling (DeVries et al., 2019; Le Quéré et al., 2010; McKinley et al., 2016) of biological processes (e.g., uptake of CO2 and respiration) and physical/chemical processes (e.g., carbon fluxes between the atmosphere, land and ocean). However, the oxygen cycle has received much less attention despite its large role in the earth system (Breitburg et al., 2018; Oschlies et al., 2018).
Dissolved oxygen (DO) is a sensitive indicator of physical and biogeochemical processes in the ocean and thus a key parameter for understanding the ocean's role in the climate system (Stramma et al., 2010). In addition to photosynthesis and respiration, the distribution of DO in the world's oceans is also regulated by air–sea gas exchange, ocean circulation, and ventilation (Bettencourt et al., 2015; Bopp et al., 2002; Levin, 2018). Unlike most dissolved nutrients that display an increase in concentration with depth, DO concentration is generally low at mid-depth of the oceans. The most remarkable feature in the oceanic oxygen dynamics is the so-called oxygen minimum zone (OMZ) that is often present below 200 m in the open oceans (Karstensen et al., 2008; Stramma et al., 2008). Previous studies have used the isoline of 20 mmol m−3 as the boundary of the OMZ for the estimation of OMZ volume (Bettencourt et al., 2015; Bianchi et al., 2012; Fuenzalida et al., 2009) and also as an up limit for the suboxic water (Wright et al., 2012).
The world's two largest OMZs are observed in the eastern tropical North Pacific (ETNP) and South Pacific (ETSP), showing a peculiar asymmetric structure across the Equator, i.e., a much larger volume of suboxic water (< 20 mmol m−3) to the north than to the south (Bettencourt et al., 2015; Paulmier and Ruiz-Pino, 2009). It is known that OMZs are caused by continuous biological consumption of DO associated with remineralization of organic matter (OM) and weak physical supply of DO due to sluggish subsurface ocean circulation and ventilation (Brandt et al., 2015; Czeschel et al., 2011; Kalvelage et al., 2015). Although there have been a number of observation-based analyses addressing the dynamics of OMZs in the tropical Pacific during the past decade (Czeschel et al., 2012; Garçon et al., 2019; Schmidtko et al., 2017; Stramma et al., 2010), our understanding of the underlying mechanisms that regulate the asymmetry of mid-depth DO (Oschlies et al., 2018; Stramma et al., 2012) is limited.
Large-scale physical–biogeochemical models have become a useful tool to investigate the responses of OMZs to climate change (Duteil and Oschlies, 2011; Ward et al., 2018; Williams et al., 2014). However, many models are unable to reproduce the observed patterns of asymmetric OMZs in the tropical Pacific (Cabre et al., 2015; Shigemitsu et al., 2017), which may be due to “unresolved transport processes, unaccounted for variations in respiratory oxygen demand, or missing biogeochemical feedbacks” (Oschlies et al., 2018). A common problem is that the two asymmetric OMZs merge into one in most models due to overestimated OMZ volume in the tropical Pacific, which may be related to the regulation of physical supply and/or biological demand (Cabre et al., 2015; Shigemitsu et al., 2017). While some studies suggest that a realistic representation of circulation and ventilation with a high-resolution ocean model is critical to the simulation of asymmetric OMZs in the tropical Pacific (Berthet et al., 2019; Busecke et al., 2019), other modeling studies have demonstrated that physical processes (e.g., vertical mixing) play a major role in regulating the distribution of mid-depth DO (Brandt et al., 2015; Llanillo et al., 2018). On the other hand, there have been advances in the understanding of biogeochemical regulation on DO consumption, i.e., oxygen-restricted remineralization of organic matter (Kalvelage et al., 2015). Hence, it's necessary to carry out integrative model–data studies to improve model capacity of simulating the dynamics of the tropical OMZs and to better understand the relative roles of physical and biological processes in regulating the asymmetry of the tropical Pacific OMZs.
A basin-scale ocean general circulation model coupled with a dynamic marine ecosystem-carbon model (OGCM-DMEC) has been developed for the tropical Pacific, which has demonstrated a capability of reproducing observed spatial and temporal variations in physical, nutrient, and carbon fields in the upper ocean (Wang et al., 2008, 2009b, 2015) and the distribution of particulate organic carbon (POC) and export production below 200 m (Yu et al., 2021). In this study, we conduct model sensitivity experiments and evaluations to examine the responses of mid-depth DO and the sources/sinks to parameterizations of two key processes (i.e., oxygen-restricted remineralization and vertical mixing). We first carry out model calibration and validation using observational data of basin-scale DO concentration and oxygen consumption in the water column of the south tropical Pacific to improve the simulation of OMZs in the tropical Pacific. Then, we analyze the impacts of new parameterizations on biological consumption and physical supply and their relative contributions to the dynamics of mid-depth DO. The objective of this study is to advance our model capacity to simulate the oceanic oxygen cycle and to identify the mechanisms driving the asymmetric OMZs in the tropical Pacific.
2.1 Ocean physical model
The basin-scale OGCM is a reduced-gravity, primitive-equation, sigma-coordinate model, and it is coupled to an advective atmospheric model (Murtugudde et al., 1996). There are 20 layers with variable thicknesses and a total depth of ∼1200 m in the OGCM. The mixed layer (the uppermost layer) depth is determined by the Chen mixing scheme (Chen et al., 1994), which varies from 10 to 50 m on the Equator. The remaining layers in the euphotic zone are approximately 10 m in thickness. The vertical resolution is approximately 30–50 m in the core OMZ (at ∼ 300–500 m). The model domain is between 30∘ S and 30∘ N for the Pacific, with the western boundary closed (i.e., no representation of the Indonesian throughflow). Zonal resolution is 1∘, and meridional resolution varies from 0.3–0.6∘ over 15∘ S–15∘ N (∘ over 10∘ S–10∘ N) to 2∘ in the southern and northern “sponge layers” (the 25–30∘ bands) where temperature, salinity, nutrients, and DO are gradually relaxed back towards the observed climatological seasonal means. The boundary conditions of temperature, salinity, nitrate, and DO are from the World Ocean Atlas, 2013 (WOA2013: http://www.nodc.noaa.gov/OC5/woa13/pubwoa13.html, last access: 20 December 2021), and the boundary condition for dissolved iron is based on limited field data and is represented by a linear regression against temperature (see details in Christian et al., 2001). Such a model configuration may have a disadvantage for longer simulations and analyses but has the advantage in reproducing the spatial patterns of most physical and biogeochemical fields.
The model is forced by the surface momentum, heat, and freshwater fluxes: climatological monthly means of solar radiation and cloudiness and interannual 6 d means of precipitation and surface wind stress. Precipitation is from ftp://ftp.cdc.noaa.gov/Datasets/gpcp (last access: 20 December 2021). Wind stresses are from the National Centers for Environmental Prediction (NCEP) reanalysis (ftp://ftp.cdc.noaa.gov/Datasets/ncep.reanalysis2.dailyavgs/gaussian_grid, last access: 20 December 2021). Air temperature and humidity above the ocean surface are computed by the atmospheric mixed layer model. Initial conditions are obtained from the outputs of an interannual hindcast simulation over 1948–2000, which itself is initialized from a 30-year spin-up with climatological forcing, followed by two 40-year interannual simulations. The initial conditions for the spin-up are from the WOA2013; iron concentration for the spin-up is initialized from limited field data collected in the tropical Pacific (Johnson et al., 1997). We carry out an interannual simulation for the period of 1978–2010 and analyze the mean states from model simulations over the period of 1991–2010.
2.2 Ocean biogeochemical model
The DMEC model consists of 11 components: small (S) and large (L) sizes of phytoplankton (PS and PL), zooplankton (ZS and ZL) and detritus (DS and DL), dissolved organic nitrogen (DON), ammonium, nitrate, dissolved iron, and DO (Fig. 1). Phytoplankton growth is co-limited by nitrogen and iron, which is critical in the tropical Pacific. The model simulates the iron cycle using variable Fe:N ratios and incorporates atmospheric iron input. All biological components use nitrogen as their unit, in which sources/sinks are determined by biological and chemical processes in addition to the physical processes (circulation and vertical mixing) that are computed by the OGCM.
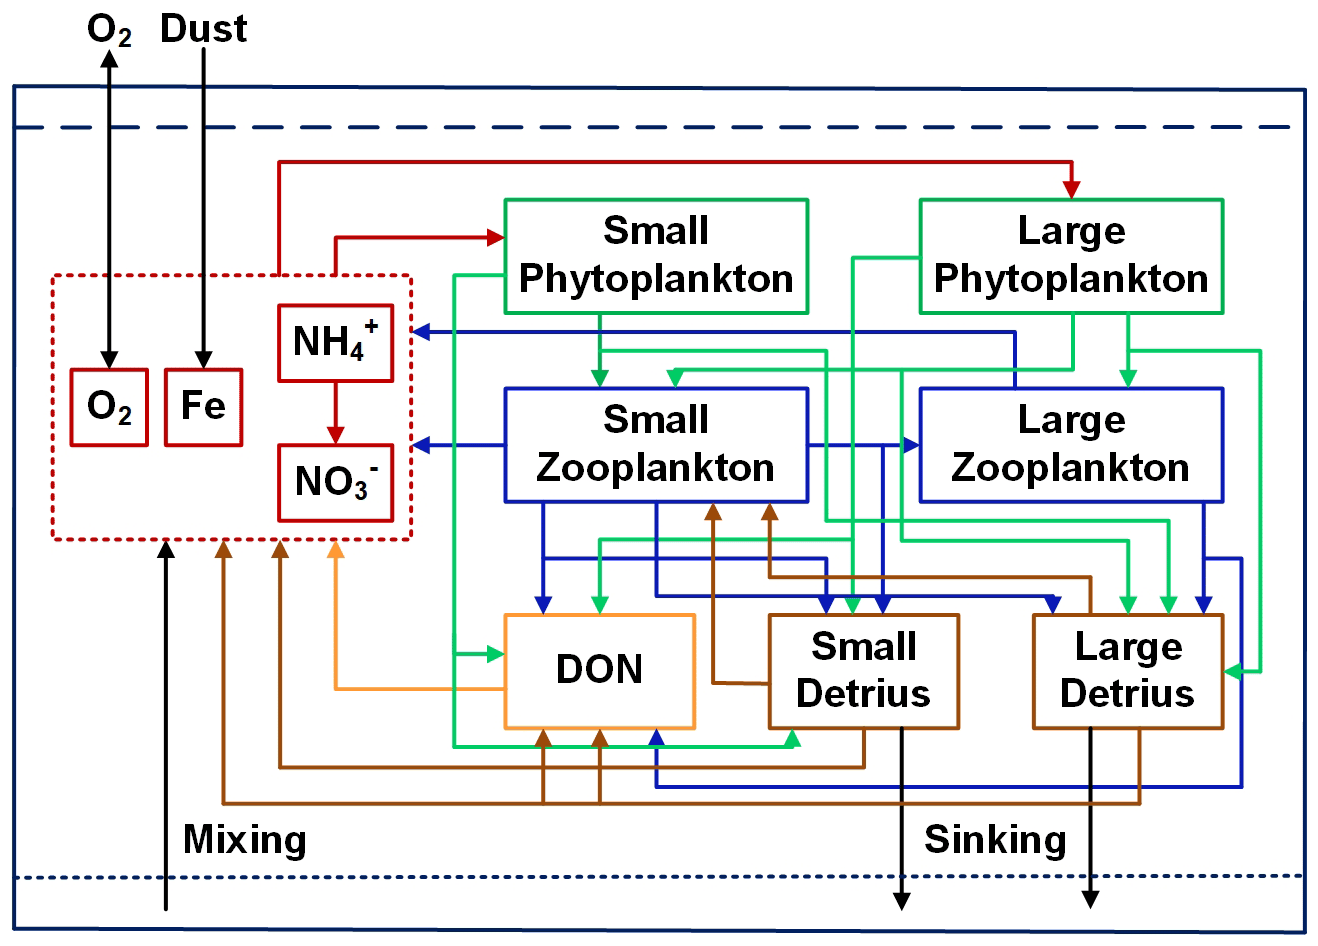
Figure 1Flow diagram of the ecosystem model. Red, green, blue, yellow, and brown lines and arrows denote fluxes originating from inorganic forms, phytoplankton, zooplankton, DON, and detritus, respectively.
In this model, net community production (NCP) is computed as
where 6.625 is the C:N ratio, μ the constant of phytoplankton growth, r the constant of zooplankton respiration, and c the constant of detritus decomposition or DON remineralization. The equations for biogeochemical processes and model parameters are given in Appendices A and B. There are changes in some parameters compared with those used in Wang et al. (2008), which are based on our further model calibration and validation for chlorophyll (Wang et al., 2009a), the nitrogen cycle (Wang et al., 2009b), and the carbon cycle (Wang et al., 2015).
Recently, we have made further improvements in the parameterizations of detritus decomposition and DON remineralization (Eqs. A21–A23), which result from the first round of model calibration on DO distribution using WOA2013. In brief, the constant cDON decreases exponentially with depth over 100–1000 m in this study. The differences in the related parameters are given in Appendix C.
2.3 Computation of oxygen sources and sinks
The time evolution of DO is regulated by physical, biological, and chemical processes:
where u, v, and w are zonal, meridional, and vertical velocity, respectively.
The term Ogas, the flux of O2 from the atmosphere into the surface ocean, is computed as
where Osat is the O2 saturation, a function of temperature and salinity (Weiss, 1970), and K0 is the gas transfer velocity that is a function of wind speed (us) and sea surface temperature (SST) according to Wanninkhof (1992):
where Sc and Sc20 are the Schmidt number at SST and 20 ∘C, respectively:
The biological source/sink term Obio is computed as follows:
where ROC is the O:C utilization ratio (set to 1.3 in the reference simulation, according to the Redfield ratio). Below the euphotic zone, biological consumption (Ocons) is determined by detritus decomposition and DON remineralization:
in which DON remineralization is dominant because the DON pool is several times greater than detritus (Wang et al., 2008).
The vertical mixing term Omix is calculated by three subroutines. Briefly, the first one computes convection to remove instabilities in the water column, and the second one determines the mixed layer depth based on the available surface turbulent kinetic energy. The third one computes partial vertical mixing (Kz) between two adjacent layers to relieve gradient Richardson (Ri) number instability, which is calculated as follows:
where the mixing parameter λ is set to 1. Partial vertical mixing is the dominant process influencing physical supply of DO in the intermediate waters.
Rate of total physical supply (Osup) below the euphotic zone is computed as
Total physical supply consists of meridional, zonal, and vertical advection, and vertical mixing. The advection terms are computed from the corresponding velocity and DO gradient, and the vertical mixing term is calculated as the residue.
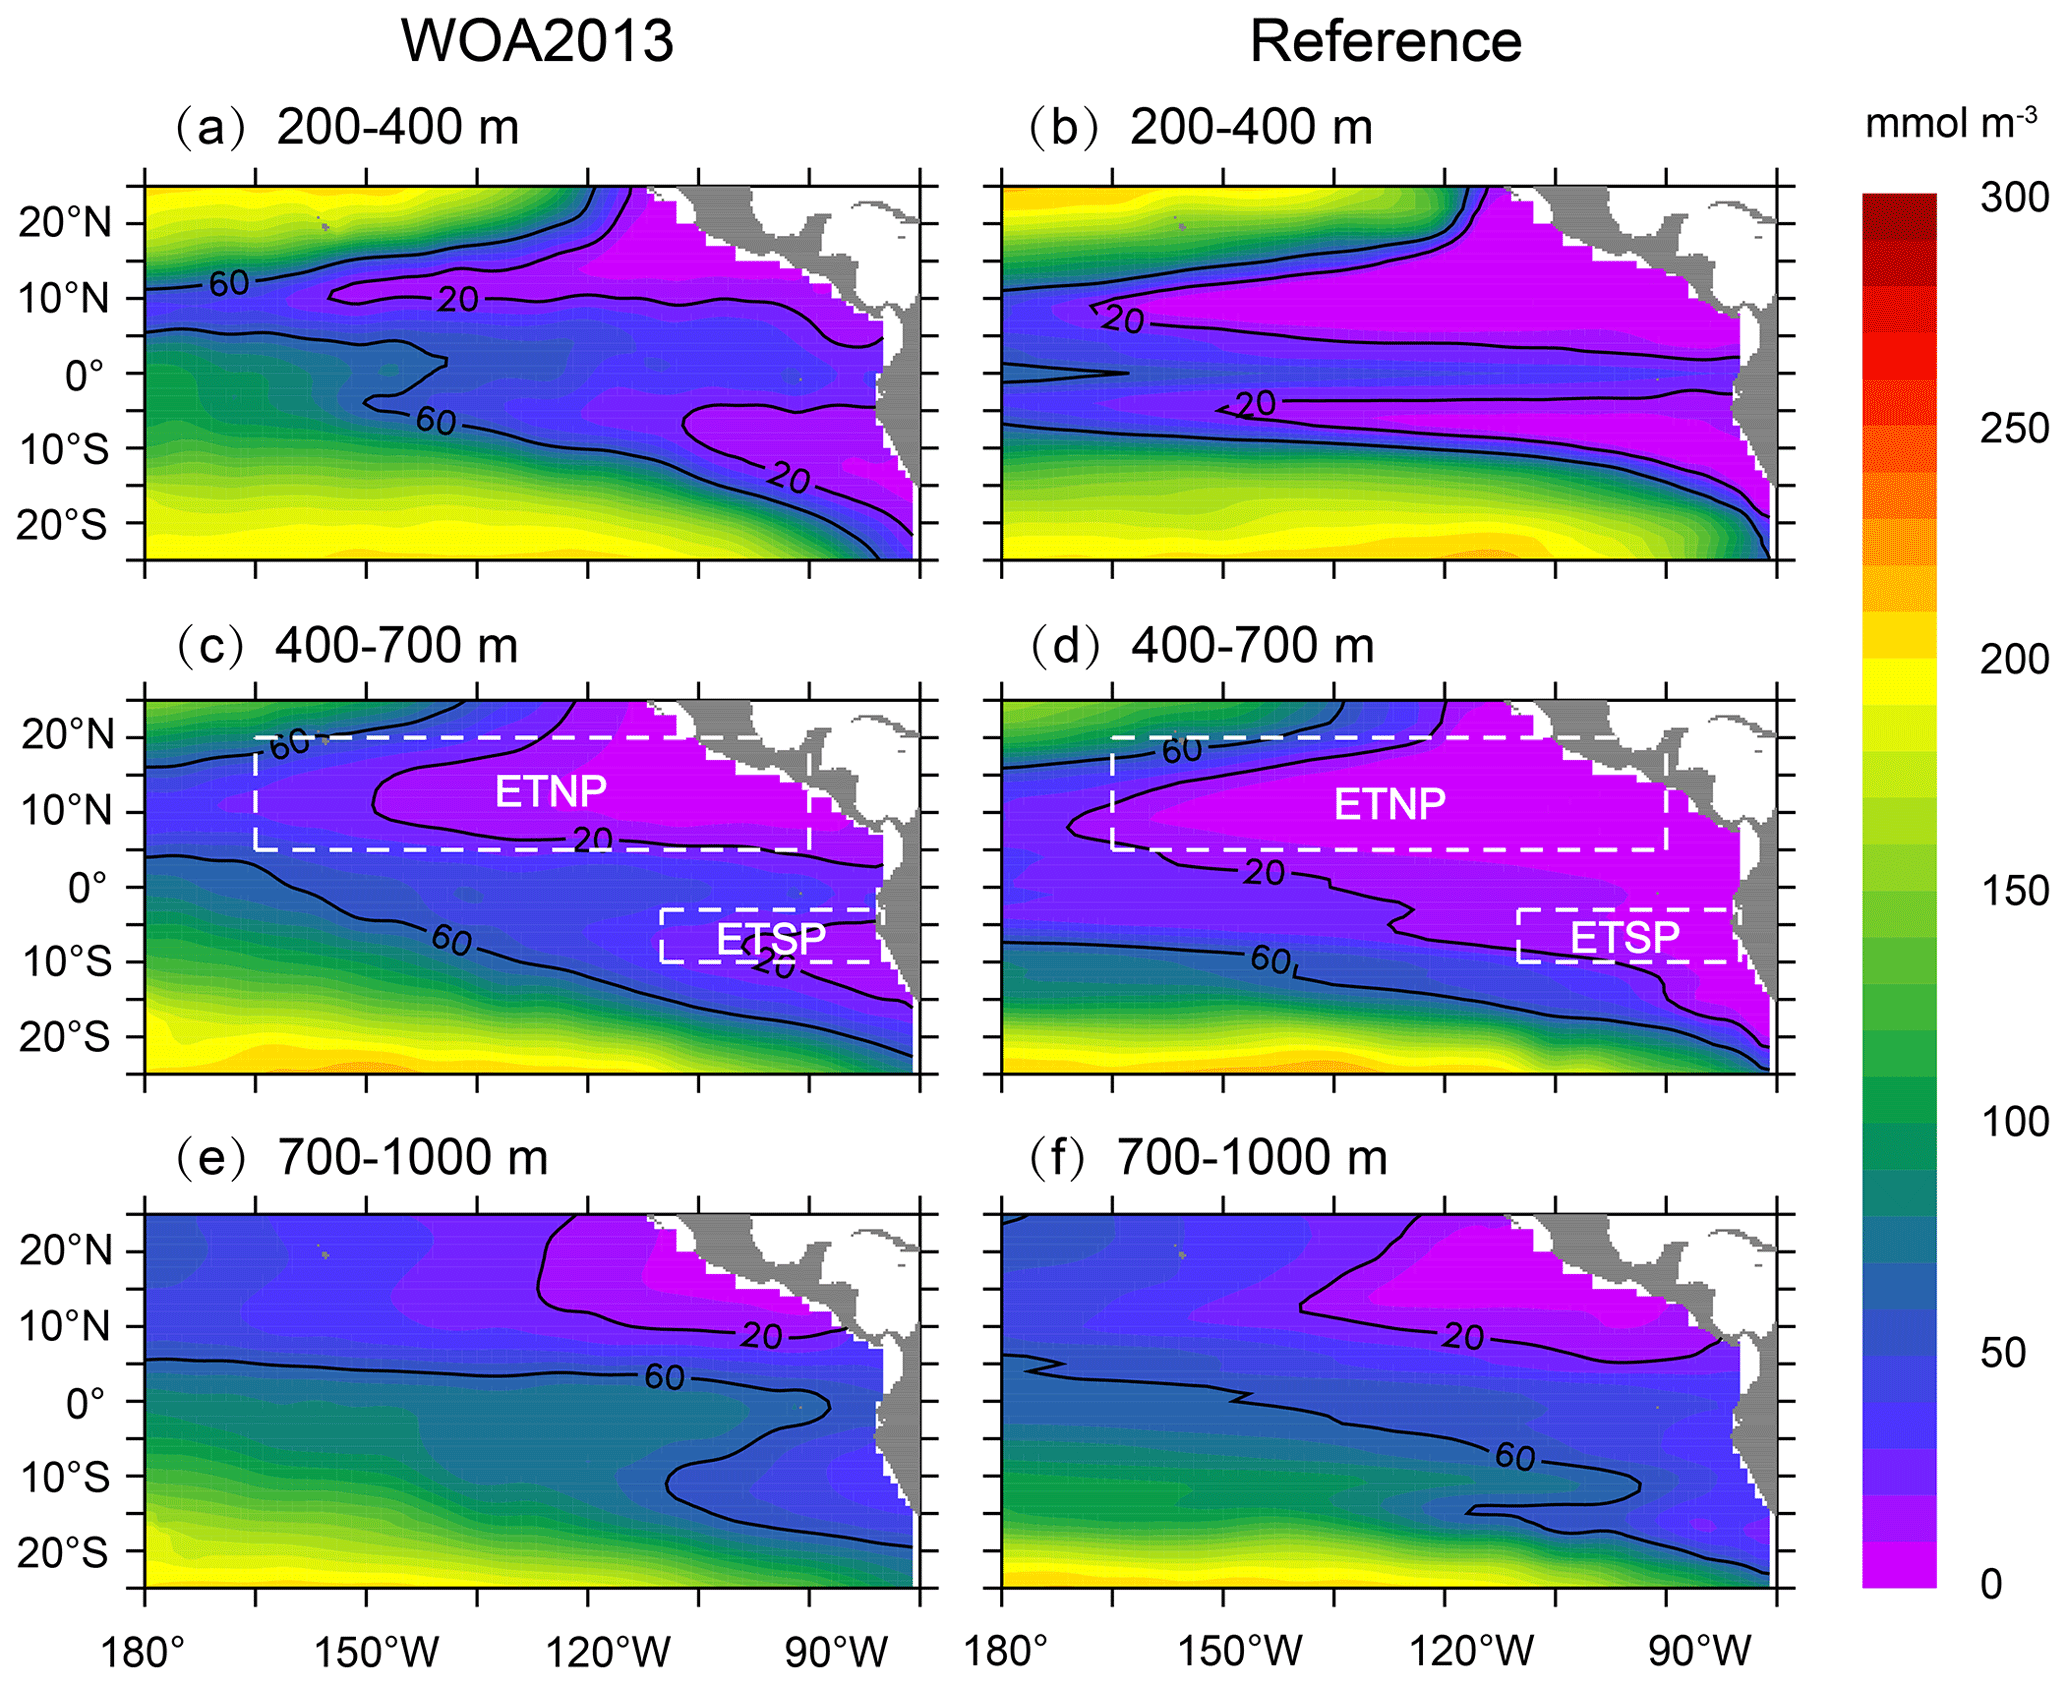
Figure 2Comparisons of DO concentration between WOA2013 (a, c, e) and the reference run (b, d, f) over 1991–2010. White dash lines in (c) and (d) denote two boxes for ETNP (5–20∘ N, 165–90∘ W) and ETSP (10–3∘ S, 110–80∘ W).
3.1 Evaluation of DO distribution from the reference run
We first evaluate simulated DO for the tropical Pacific Ocean using the outputs from the OGCM-DMEC V1.4 (hereafter reference run), which use the same set of parameters as Yu et al. (2021). We focus on model–data comparisons over 200–400, 400–700, and 700–1000 m that broadly represent the upper OMZ, core OMZ, and lower OMZ, respectively. The WOA2013 data show a much larger area of suboxic waters (< 20 mmol m−3) in the ETNP than in the ETSP over 200–400 and 400–700 m (Fig. 2a and c) but no suboxic water over 700–1000 m (Fig. 2e). Although the reference run produces two OMZs off the Equator over 200–400 m (Fig. 2b), the sizes of suboxic water are much larger in the reference run than those in the WOA2013 data. The reference run significantly overestimates the size of suboxic water and underestimates DO concentration over 400–700 m (Fig. 2d). The difference between WOA2013 and the reference run is small over 700–1000 m, except in the eastern tropical Pacific (Fig. 2f).
3.2 Sensitivity experiments
Given that the DO concentration at mid-depth is regulated by physical supply and biological consumption, the underestimation of mid-depth DO would be a result of overestimation of consumption associated with DON remineralization and/or underestimation of supply. The reference run applies a value of zero for background diffusion (see Eq. 9). However, a previous modeling study has demonstrated that vertical background diffusion is an important process for DO supply at mid-depth (Duteil and Oschlies, 2011). Accordingly, we conduct a sensitivity experiment to test a set of values for background diffusion (Kb as 0.1, 0.25 and 0.5 cm2 s−1). The addition of background diffusion is only applied to the two key variables (DO and DON) in this analysis to eliminate any potential interactions and feedbacks between various physical and biogeochemical processes (note: our model experiments show no significant effects on modeled DO dynamics with the background diffusion applied to the nutrients).
There have been several advances in the understanding of oxygen consumption. For example, recent studies have shown that the O:C utilization ratio varies greatly across different basins, e.g., from 0.6 to 2.1 in the Pacific (Moreno et al., 2020; Tanioka and Matsumoto, 2020), and rates of dissolved organic matter (DOM) remineralization or oxygen consumption are influenced by oxygen level, i.e., a reduction under low-DO conditions (Beman et al., 2020; Bertagnolli and Stewart, 2018; Sun et al., 2021). Using the field data collected from mid-depth (∼350 m) in the Peruvian OMZ (Kalvelage et al., 2015), we derive a kinetics function between oxygen consumption rate and DO concentration, which yields two values for the half saturation constant (Km), i.e., 6.9 and 18.7 mmol m−3 (Fig. 3). By applying this function, the O:C utilization ratio in Eq. (7) becomes variable and is also reduced (i.e., ), with lower ratios in low-DO waters. Accordingly, our sensitivity experiments include a few simulations with a reduced O:C utilization ratio (Km as 6.9 or 18.7 mmol m−3) and/or added background diffusion (Table S1 in the Supplement).
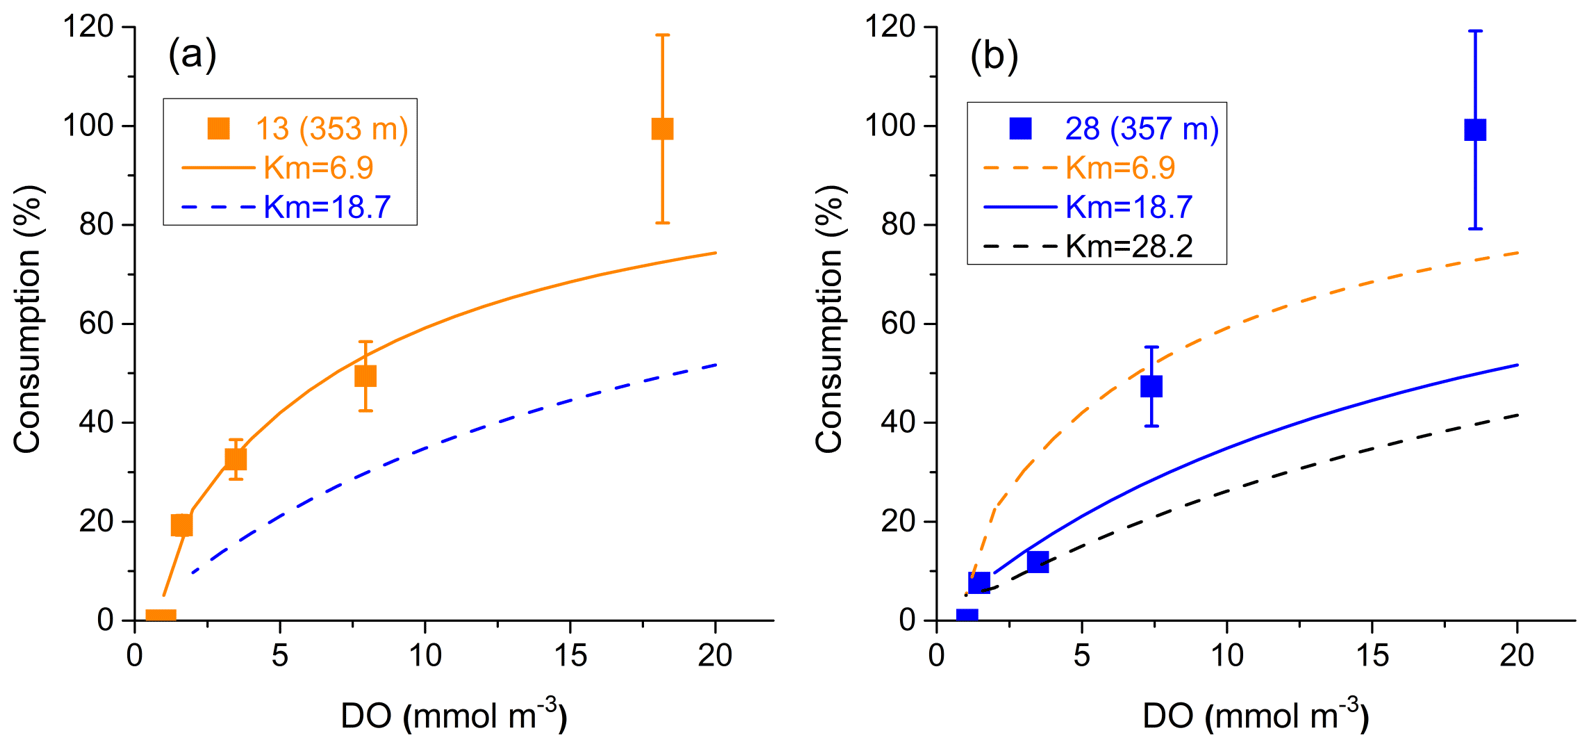
Figure 3Relationship between biological consumption and DO concentration at (a) station 13 (353 m) and (b) station 28 (357 m) in the Peruvian OMZ. Km is the half saturation constant from the fitting curve derived from data of Kalvelage et al. (2015). For station 28, two Km values are derived using four (excluding the smallest value, blue curves) and five (black curve) data points, respectively. Since the curve with Km=28.2 is too far away from most of the data points, the value 18.7 is selected as the half saturation constant.
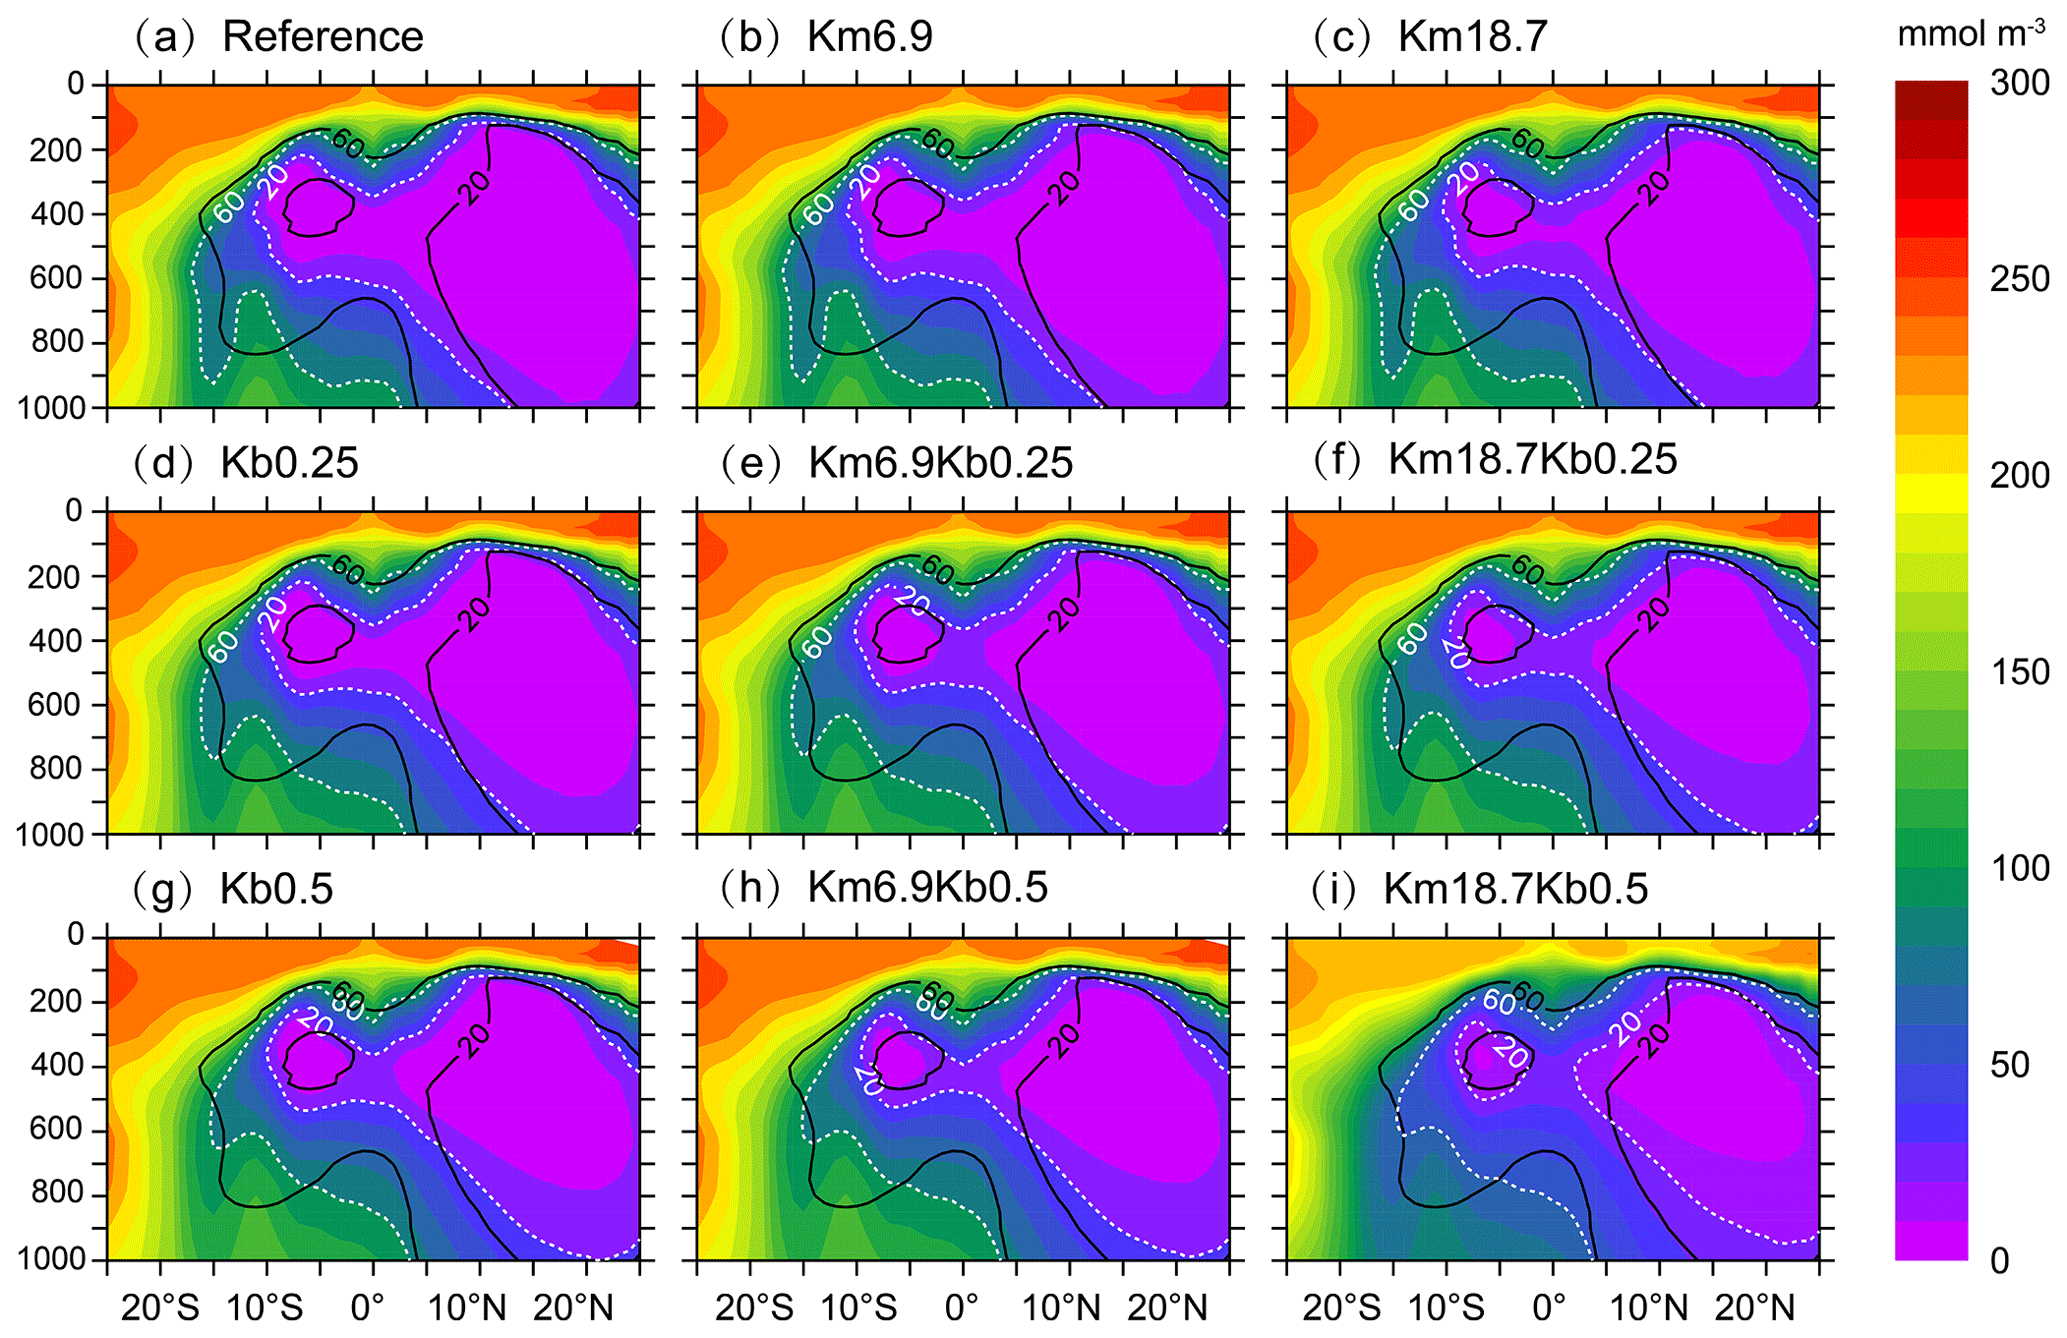
Figure 4Vertical distribution of DO concentration over 120–90∘ W from different model simulations: (a) the reference run, (b, c) with a reduced O:C utilization ratio, (d, g) with an enhanced vertical mixing, and (e, f, h, i) the combination of a reduced O:C utilization ratio and an enhanced vertical mixing. Black lines denote contours of DO concentrations of 20 and 60 mmol m−3 from WOA2013 data.
Figure 4 illustrates that there is a larger volume of suboxic water located north of ∼5∘ N and a smaller volume of suboxic water over 12–4∘ S in the WOA2013, which are separated by relatively higher DO (> 20 mmol m−3) water along the Equator. There is an improvement in simulated DO with a reduced O:C utilization ratio (Fig. 4b and c) and an enhanced vertical mixing (Fig. 4d and g). Clearly, the combination of a reduced O:C utilization ratio and an enhanced vertical mixing leads to a further improvement in simulated mid-depth DO (Fig. 4e, f, h, and i). In particular, the combination of a stronger background diffusion with a smaller O:C utilization ratio (i.e., the Km18.7Kb0.5 run) results in the best simulation that reproduces the observed spatial distribution of mid-depth DO, especially the hemispheric asymmetry (i.e., a larger volume of suboxic water to the north but a smaller size of suboxic water to the south).
3.3 Model validation
To further demonstrate the impact of parameter choices, a few statistical measures are applied over 200–400, 400–700, and 700–1000 m in the ETNP (5–20∘ N, 165–90∘ W) and ETSP (10–3∘ S, 110–80∘ W). As shown in Table 1, bias and root mean square error (RMSE) are reduced in all sensitivity simulations, with the smallest values from the Km18.7Kb0.5 run except over 700–1000 m in the ETNP. For example, both bias and RMSE in the Km18.7Kb0.5 run are smallest over 200–700 m in the ETNP (< 7.8 and 10.2 mmol m−3). Many current models show much larger RMSE (∼ 20–80 mmol m−3) from their simulations from the mixed layer to 1000 m (Bao and Li, 2016; Cabre et al., 2015). Figure 5 also illustrates that the Km18.7Kb0.5 run produces the best outputs, according to the combined assessments of the correlation coefficient and normalized standard deviation (NSD), i.e., the distance to the observation. The distance is shortest over 400–700 and 700–1000 m in both the ETNP and ETSP in the Km18.7Kb0.5 simulation. Clearly, the correlation coefficient was largest (0.38–0.99) in all sections; and the NSD is closest to 1 in the core OMZ of ETNP.
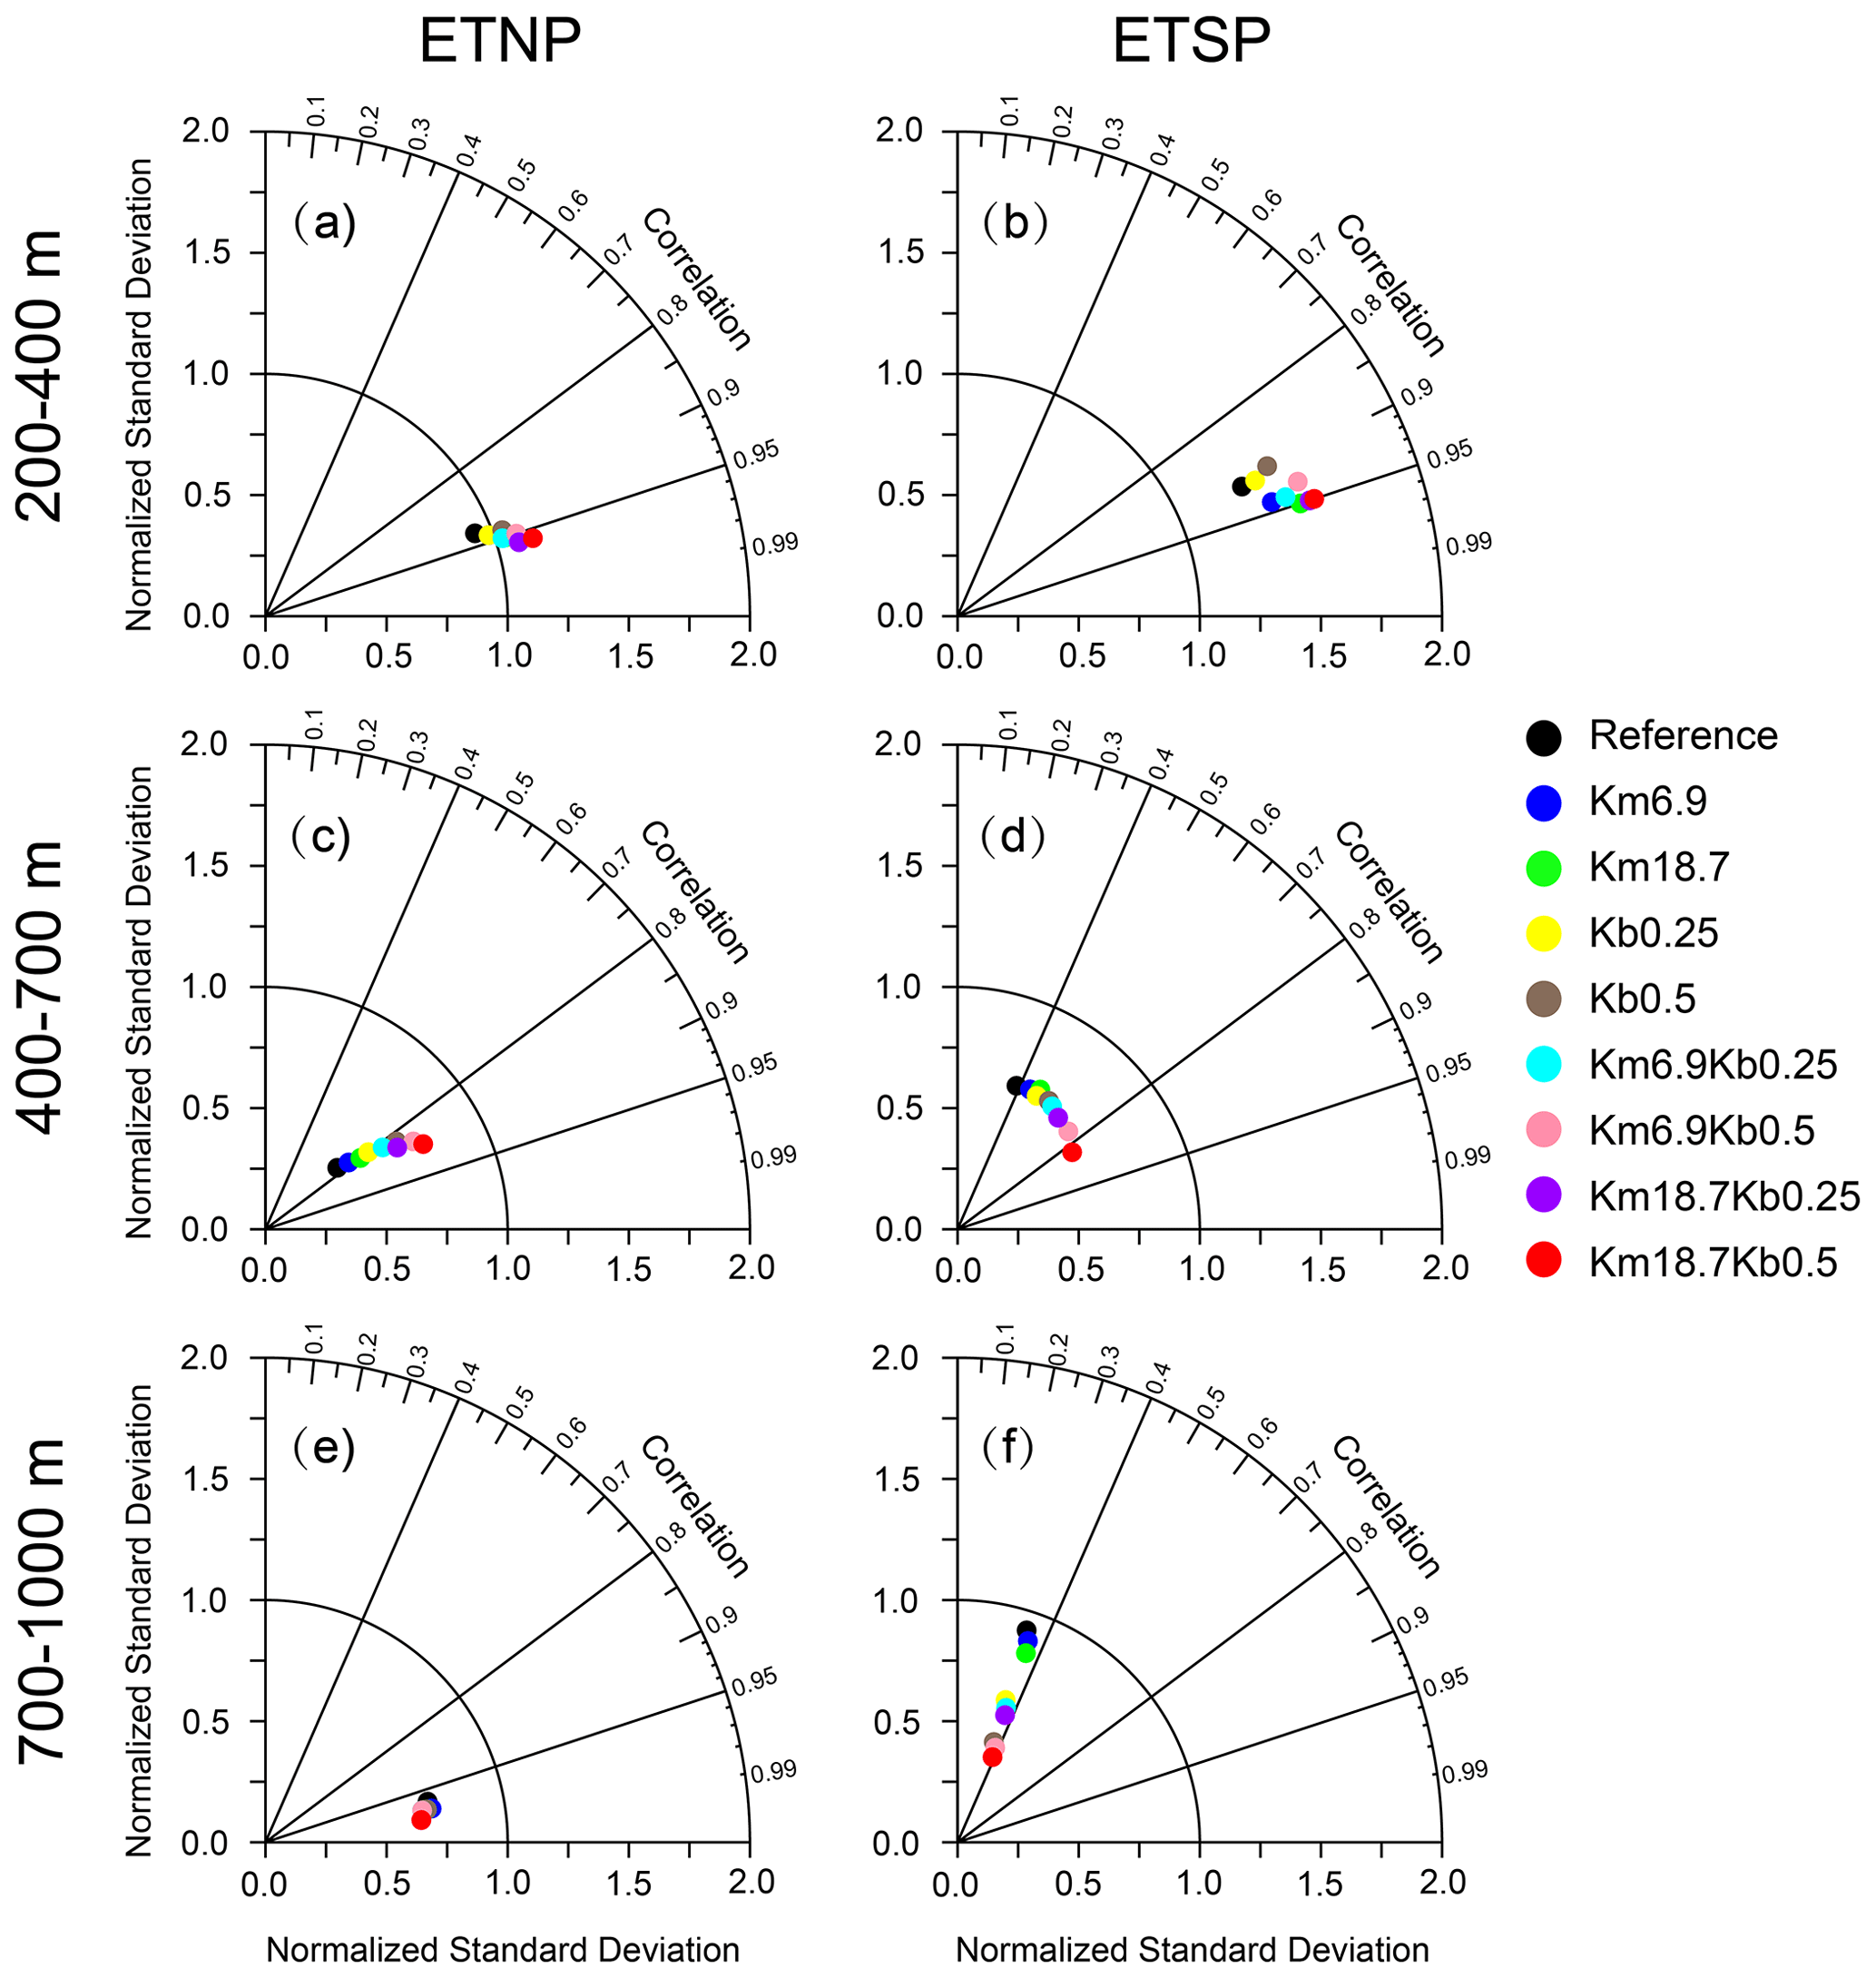
Figure 5Taylor diagrams for the performance of simulated DO concentration (against WOA2013) from model simulations for ETNP (5–20∘ N, 165–90∘ W; a, c, e) and ETSP (10–3∘ S, 110–80∘ W; b, d, f) over (a, b) 200–400 m (c, d) 400–700 m, and (e, f) 700–1000 m.
We also compare the sizes of suboxic and hypoxic waters between the model simulations and WOA2013 (Table 2). Sizes of suboxic and hypoxic waters are 5.97×10¹⁵ and 19.98×10¹⁵ m3 in the north and 1.43×10¹⁵ and 7.12×10¹⁵ m3 in the south, respectively, in the WOA2013. While applying a reduced O:C utilization ratio and an enhanced vertical mixing can lead to an improvement in simulated OMZ volume, a significant improvement is obtained with the combination of a reduced O:C utilization ratio and an enhanced vertical mixing. Overall, the Km18.7Kb0.5 simulation has the best performance for reproducing the OMZ volumes, showing similar volumes for the suboxic water (5.55×10¹⁵ m3 to the north and 1.12×10¹⁵ m3 to the south) and the hypoxic water (20.91×10¹⁵ and 7.39×10¹⁵ m3).
We then further validate the modeled DO from the best run (Km18.7Kb0.5), using the time series of the observed DO data (https://cchdo.ucsd.edu/, last access: 20 December 2021). Figure 6 illustrates that the model can generally reproduce the vertical-zonal distributions of DO along 10∘ N and 17∘ S, spanning 1989 to 2009, particularly in the eastern tropical Pacific. For example, cruise data from the P04 line (during April–May, 1989) show a large area of low-DO water from ∼200 to ∼800 m (Fig. 6a), and our model also predicts low-DO water over ∼ 200–700 m (Fig. 6b).
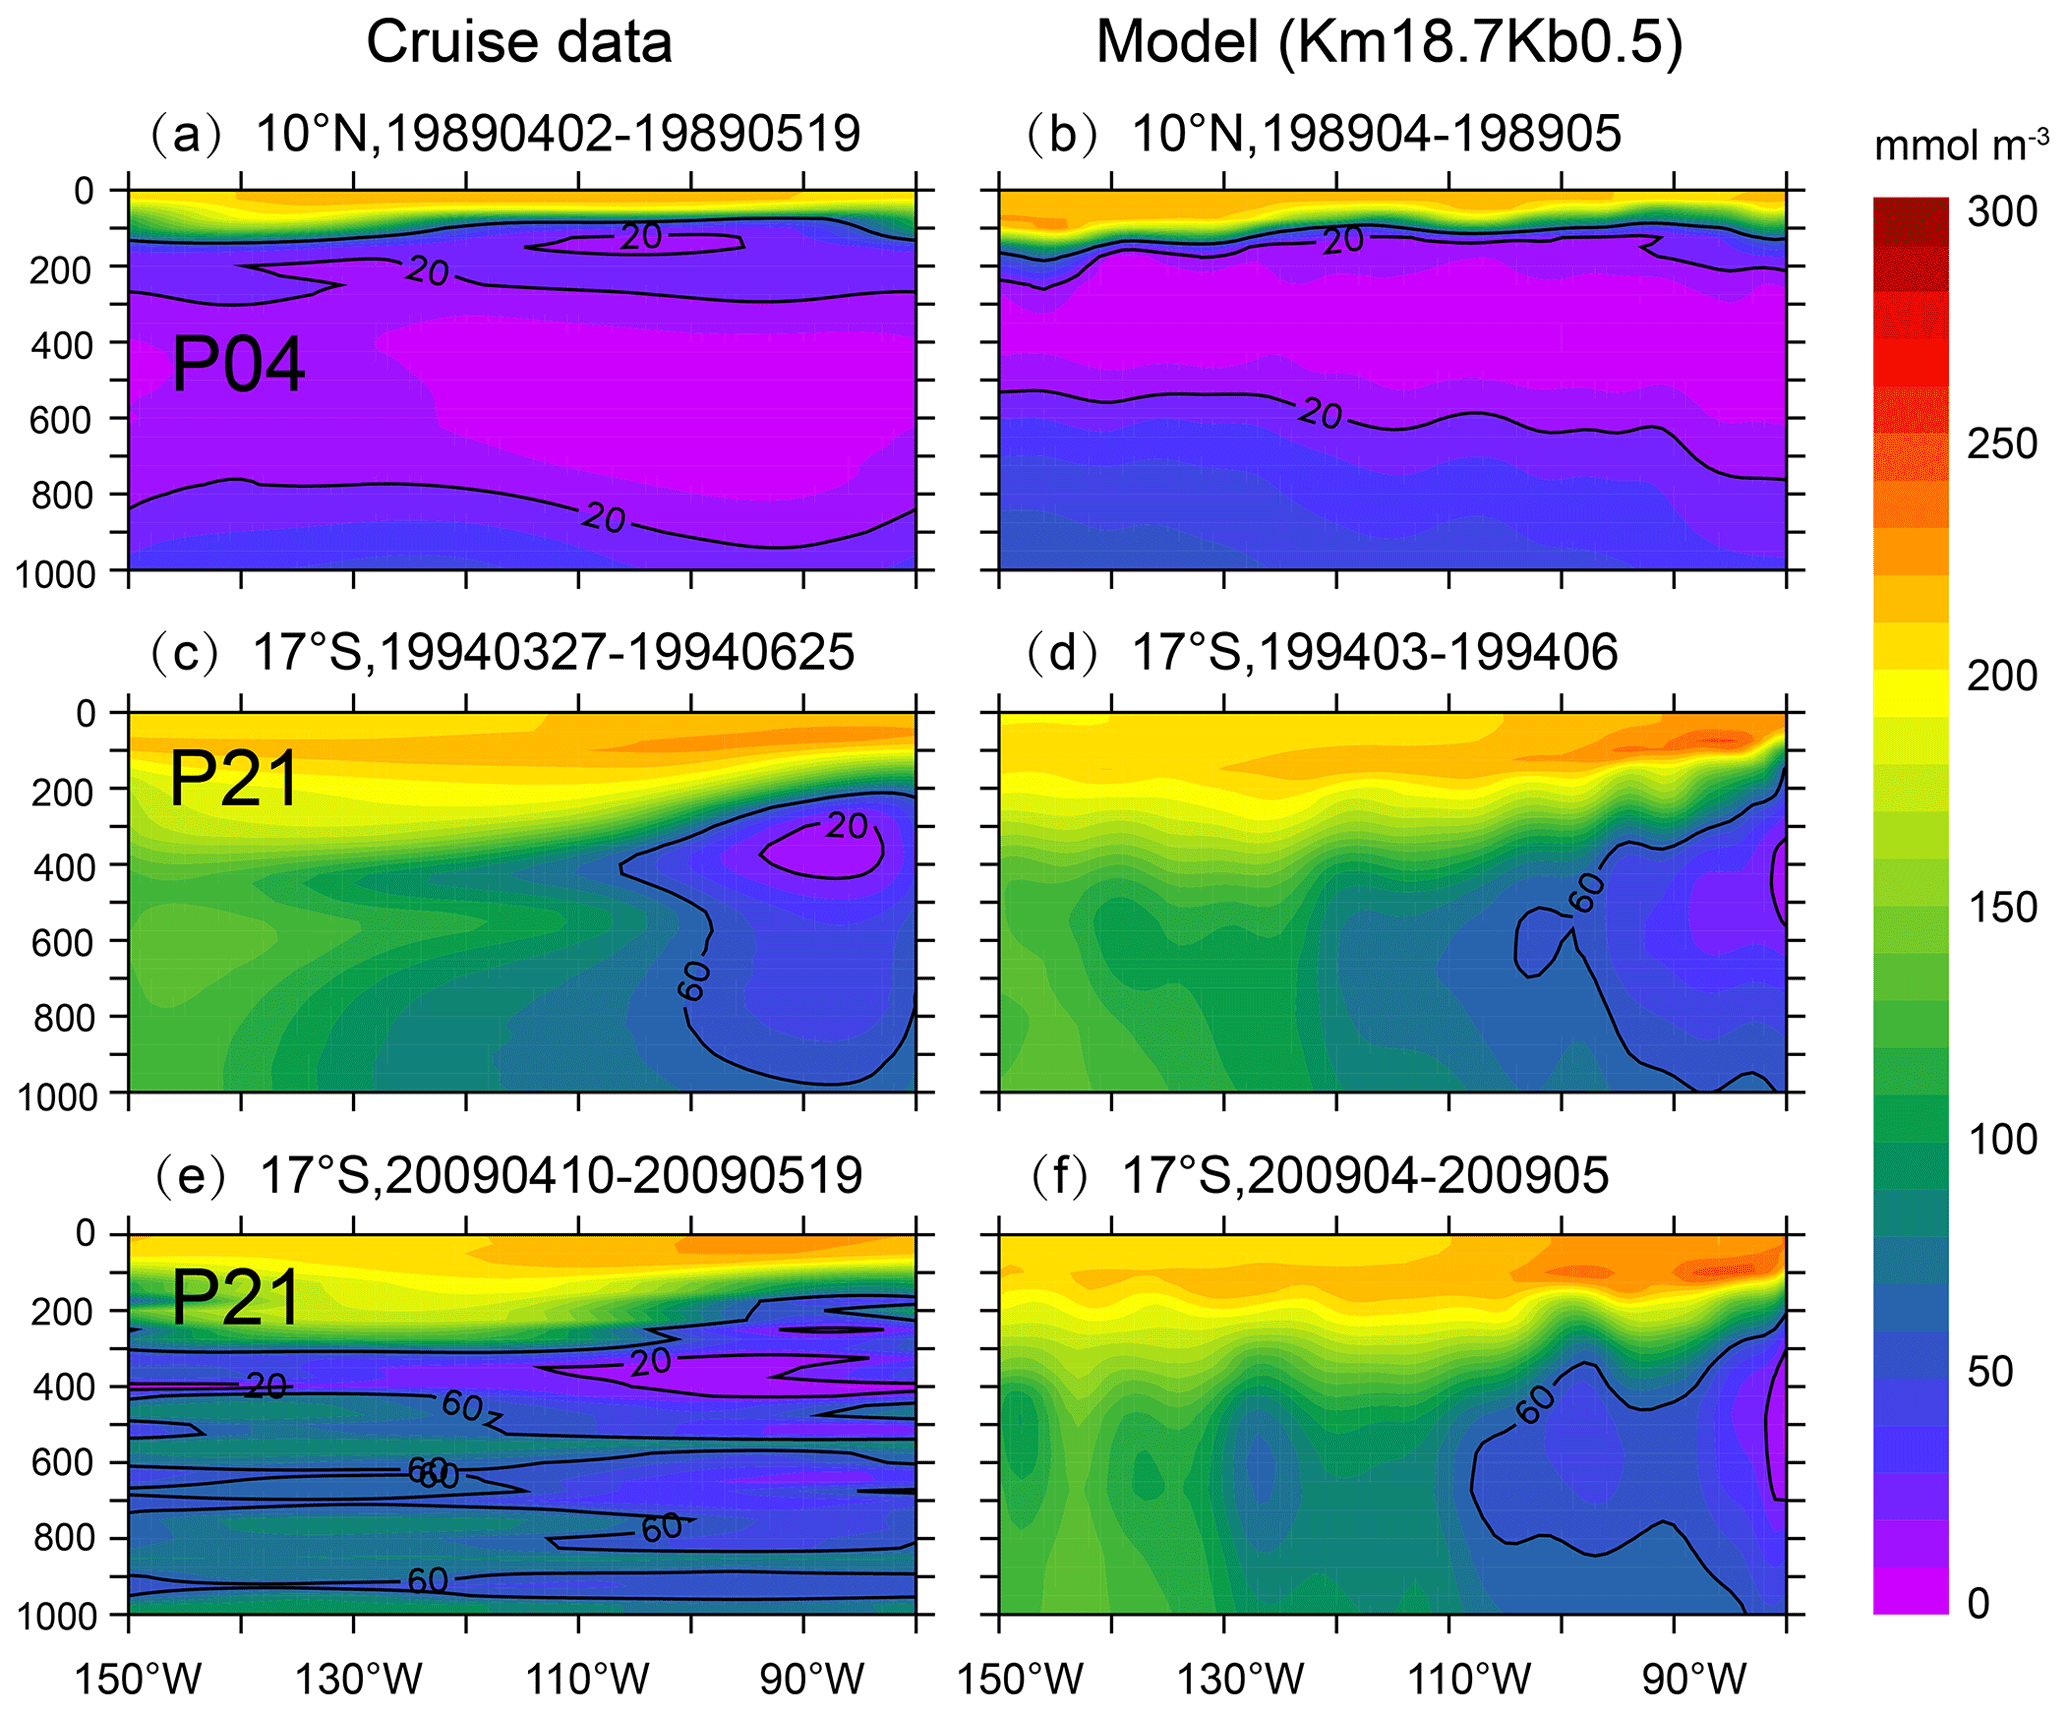
Figure 6Distribution of DO from cruise data (a, c, e) and model simulation from Km18.7Kb0.5 (b, d, f). Observed DO data are from CCHDO (https://cchdo.ucsd.edu/ last access: 20 December 2021), along (a) P04 (10∘ N) during 2 April–19 May 1989, (c) P21 (17∘ S) during 27 March–25 June 1994, and (e) P21 (17∘ S) during 10 April–19 May 2009.
Table 1Bias and root mean square error (RMSE) for DO (mmol m−3) comparisons between WOA2013 and model simulations averaged over 1991–2010 in the eastern tropical North Pacific (ETNP) and eastern tropical South Pacific (ETSP).
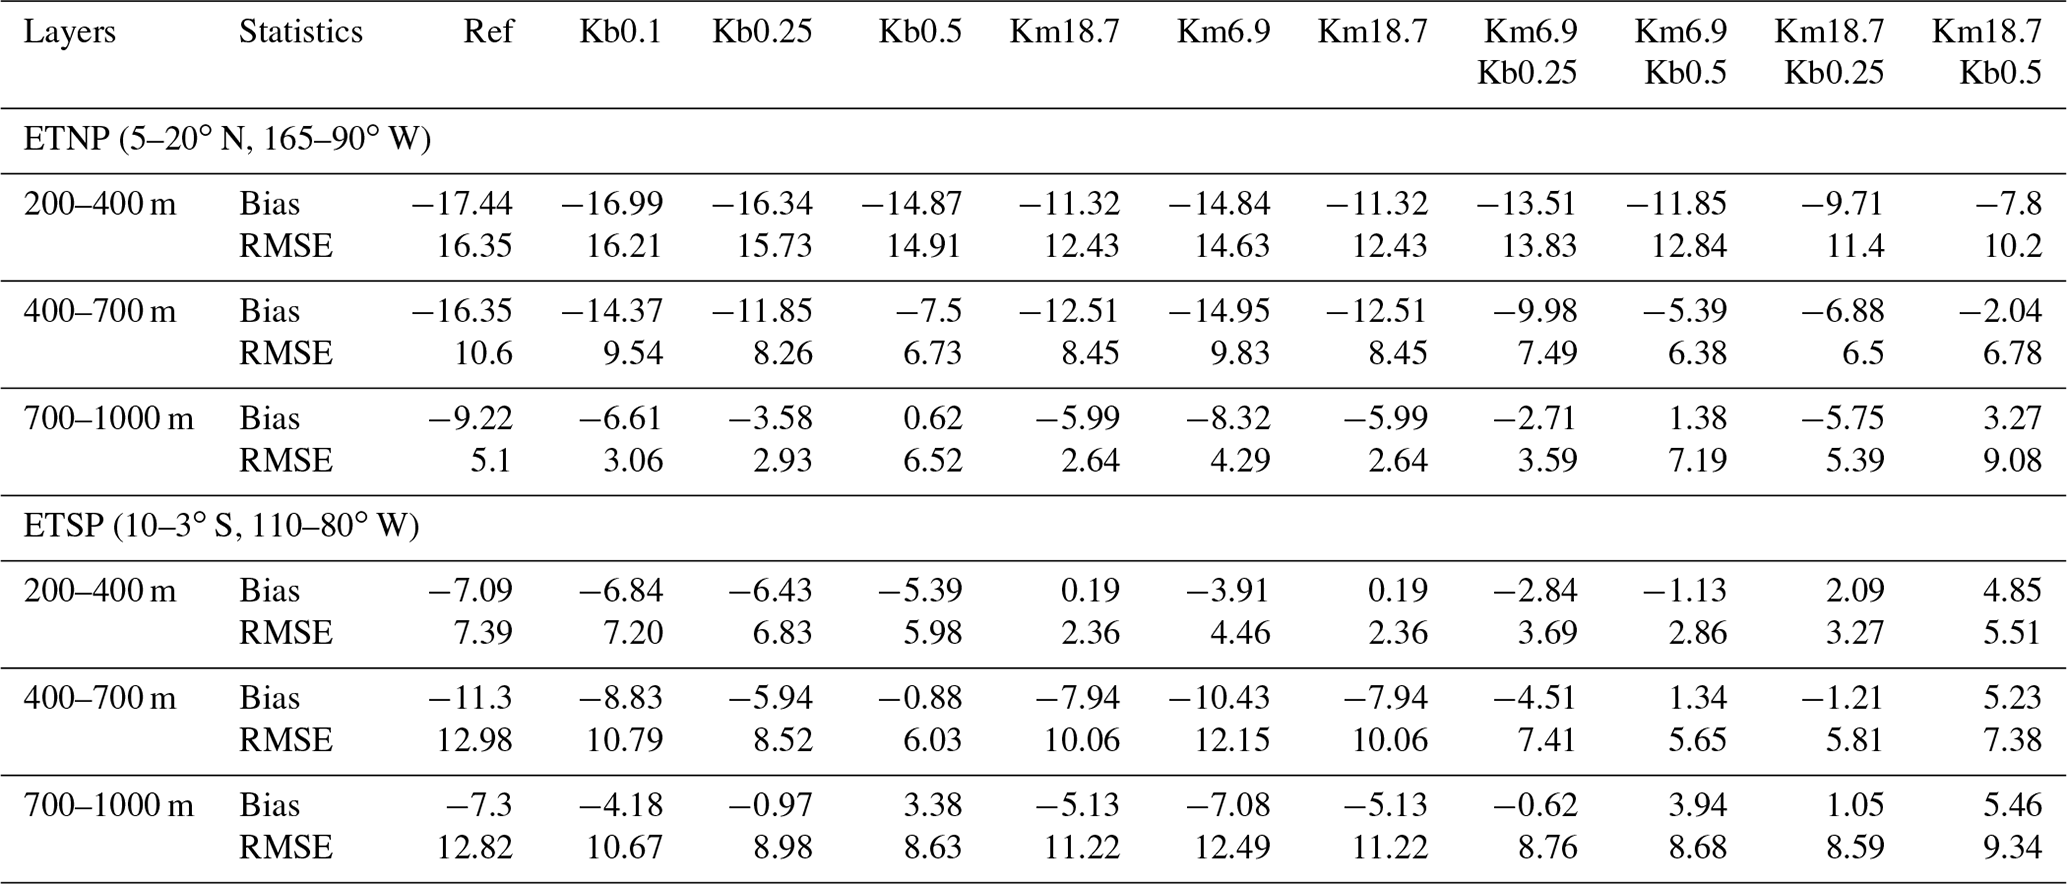
Table 2Volumes (1015 m3) of suboxic and hypoxic waters from WOA2013 and model simulations.
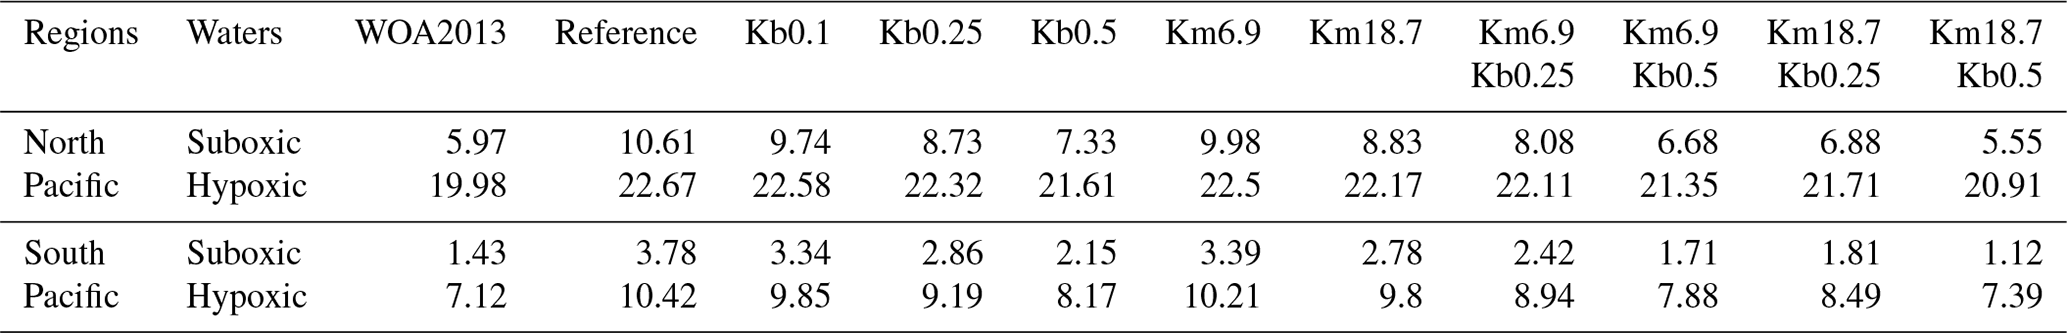
Suboxic: DO < 20 mmol m−3; hypoxic: DO < 60 mmol m−3.
In this section, we further compare the improved simulations (Km18.7, Kb0.5, and Km18.7Kb0.5) with the reference run to diagnose the responses of mid-depth DO and biological consumption and physical supply to the improved parameterizations. We then analyze the interactions of physical and biogeochemical processes and their impacts on the mid-depth DO. Finally, we explore the underlying mechanisms regulating the asymmetry of OMZs in the tropical Pacific.
4.1 Changes in mid-depth DO due to a reduced O:C utilization ratio and an enhanced vertical mixing
We first compare the changes in DO concentration between the three simulations over 200–400, 400–700, and 700–1000 m (Fig. 7). Clearly, applying a reduced O:C utilization ratio causes an increase in DO in all three layers, with the greatest increase (> 6 mmol m−3) in the 200–400 m layer (Fig. 7a), followed by a modest increase (∼ 3–6 mmol m−3) over 400–700 m (Fig. 7d). Although the increase is generally smaller in the 700–1000 m layer (Fig. 7g) than in the 400–700 m layer (Fig. 7d), the increase is greater in the north OMZ over 700–1000 m than over 400–700 m. Applying an enhanced vertical mixing results in a small increase in DO (∼ 2–5 mmol m−3) in the 10∘ S–10∘ N band over 200–400 m (Fig. 7b) but a large increase (∼ 5–15 mmol m−3) in the majority of the basin over 400–700 and 700–1000 m (Fig. 7e and h).
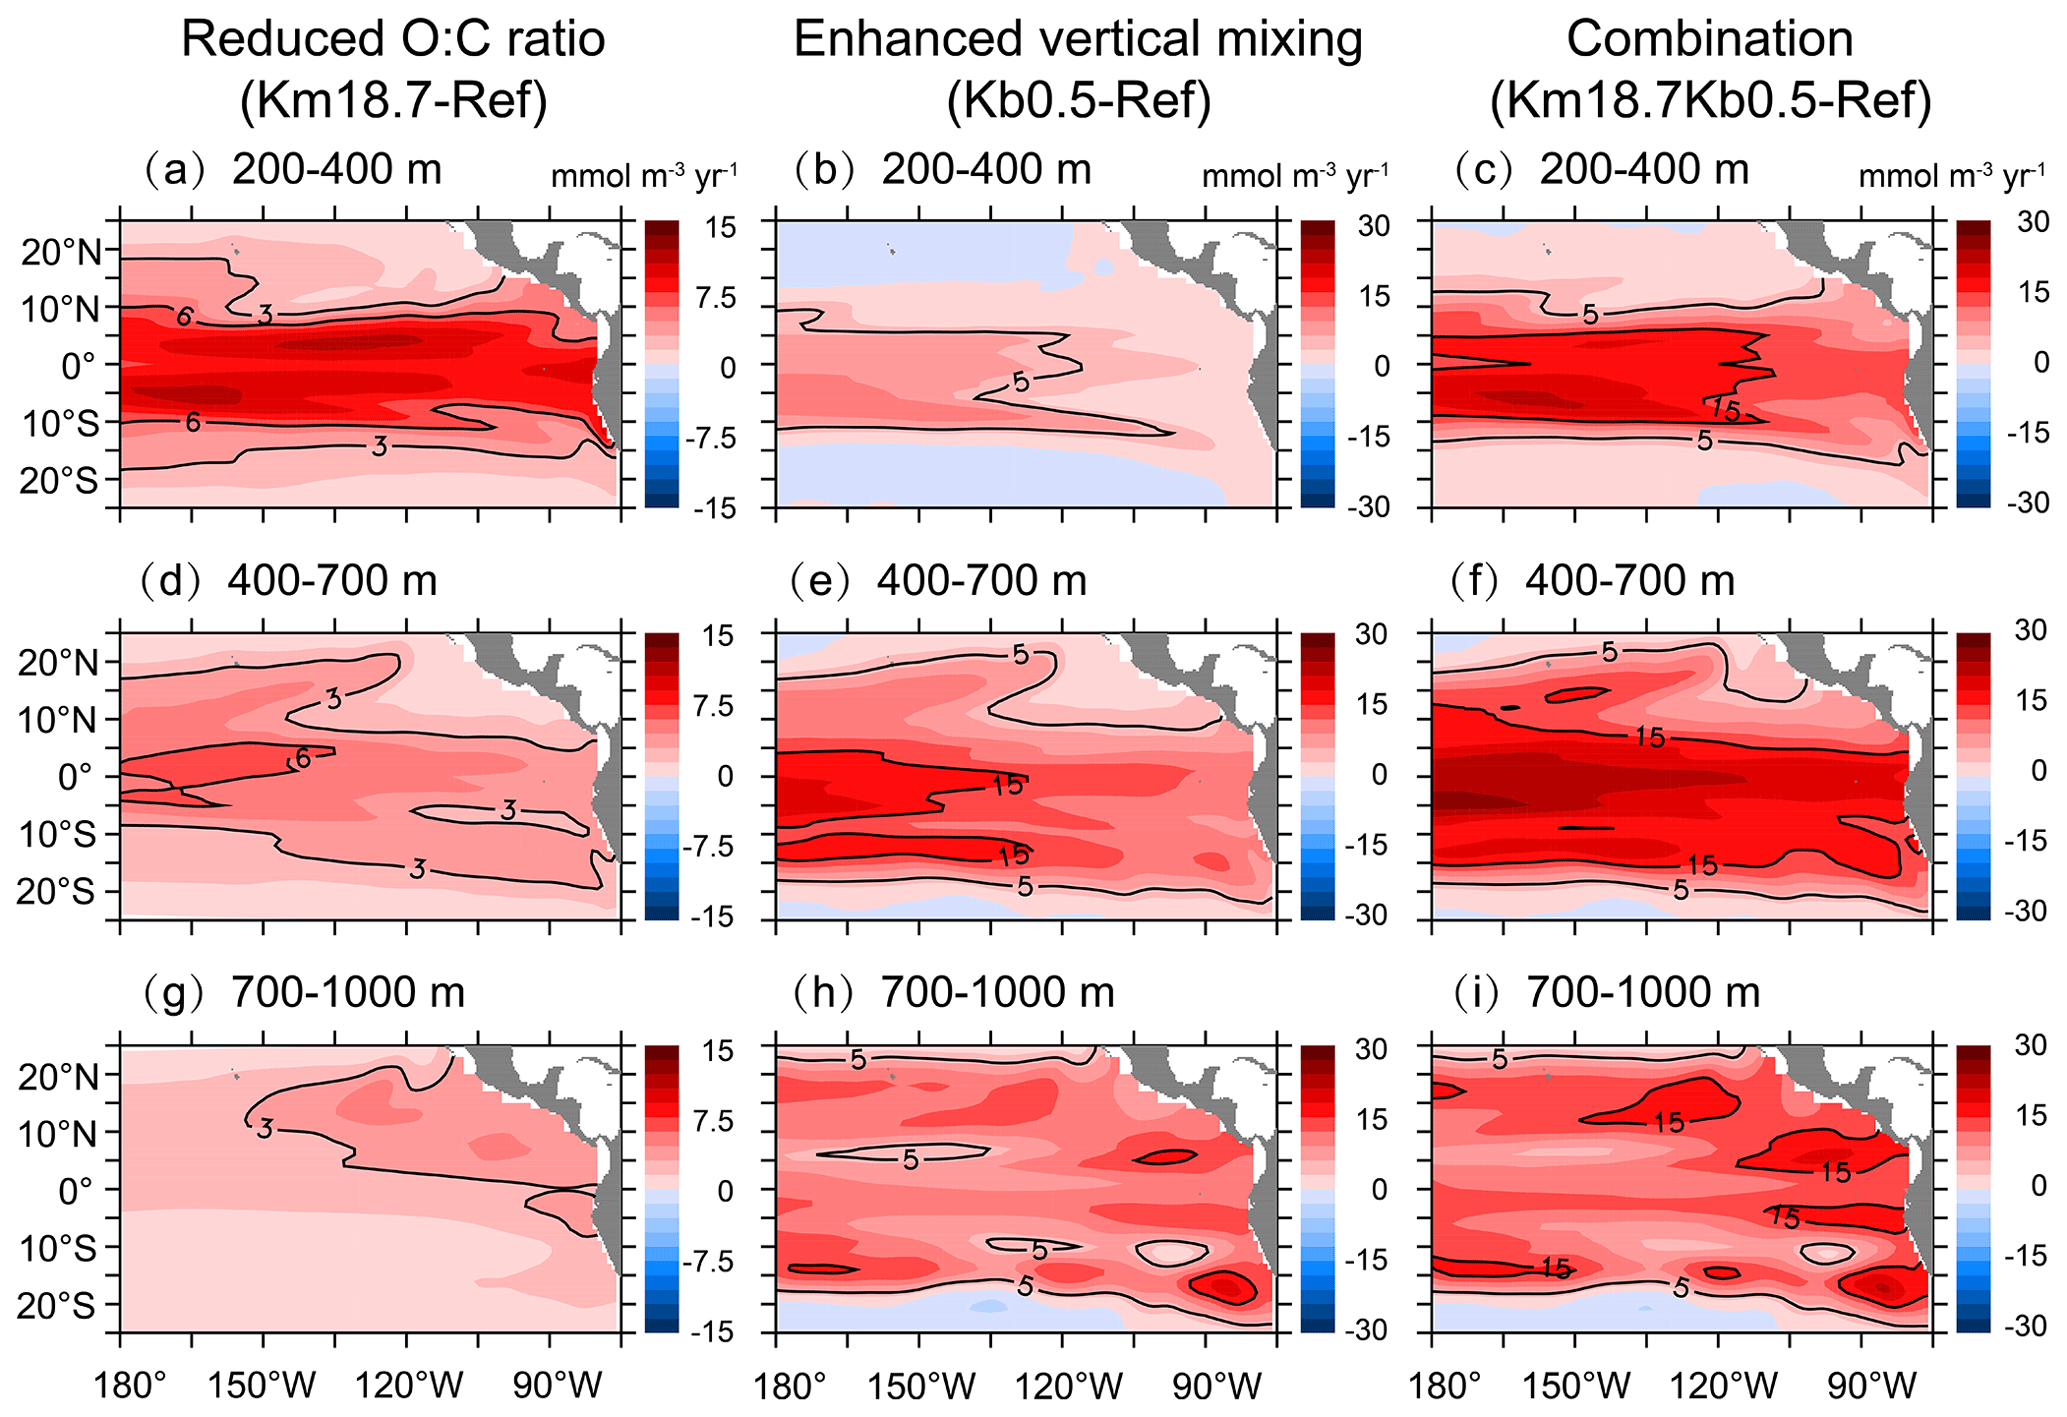
Figure 7Changes in DO concentration over (a, b, c) 200–400 m, (d, e, f) 400–700 m, and (g, h, i) 700–1000 m due to a reduced O:C utilization ratio (a, d, g), an enhanced vertical mixing (b, e, h), and the combination of a reduced O:C utilization ratio and an enhanced vertical mixing (c, f, i).
Overall, mid-depth DO shows an increase with the combination of a reduced O:C utilization ratio and an enhanced vertical mixing (Fig. 7c, f, and i). A great increase in DO (> 15 mmol m−3) occurs over most of the basin over 400–700 m, mainly in the central tropical Pacific over 200–400 m but in a few small areas over 700–1000 m. The spatial pattern and magnitude of the DO increase resulting from the combination of a reduced O:C utilization ratio and an enhanced vertical mixing have a large similarity to those with a reduced O:C utilization ratio for the 200–400 m layer (Fig. 7a) and to those under an enhanced vertical mixing below 400 m (Fig. 7e and h). For example, the relative increase in DO is similarly larger in the north OMZ over 200–400 m under a reduced O:C utilization ratio with and without the addition of background diffusion and over 700–1000 m under an enhanced vertical mixing (i.e., with additional background diffusion) with and without the change in the O:C utilization ratio. Our analyses suggest that the dominant process regulating the DO dynamics is biological consumption over 200–400 m but physical supply over 400–1000 m.
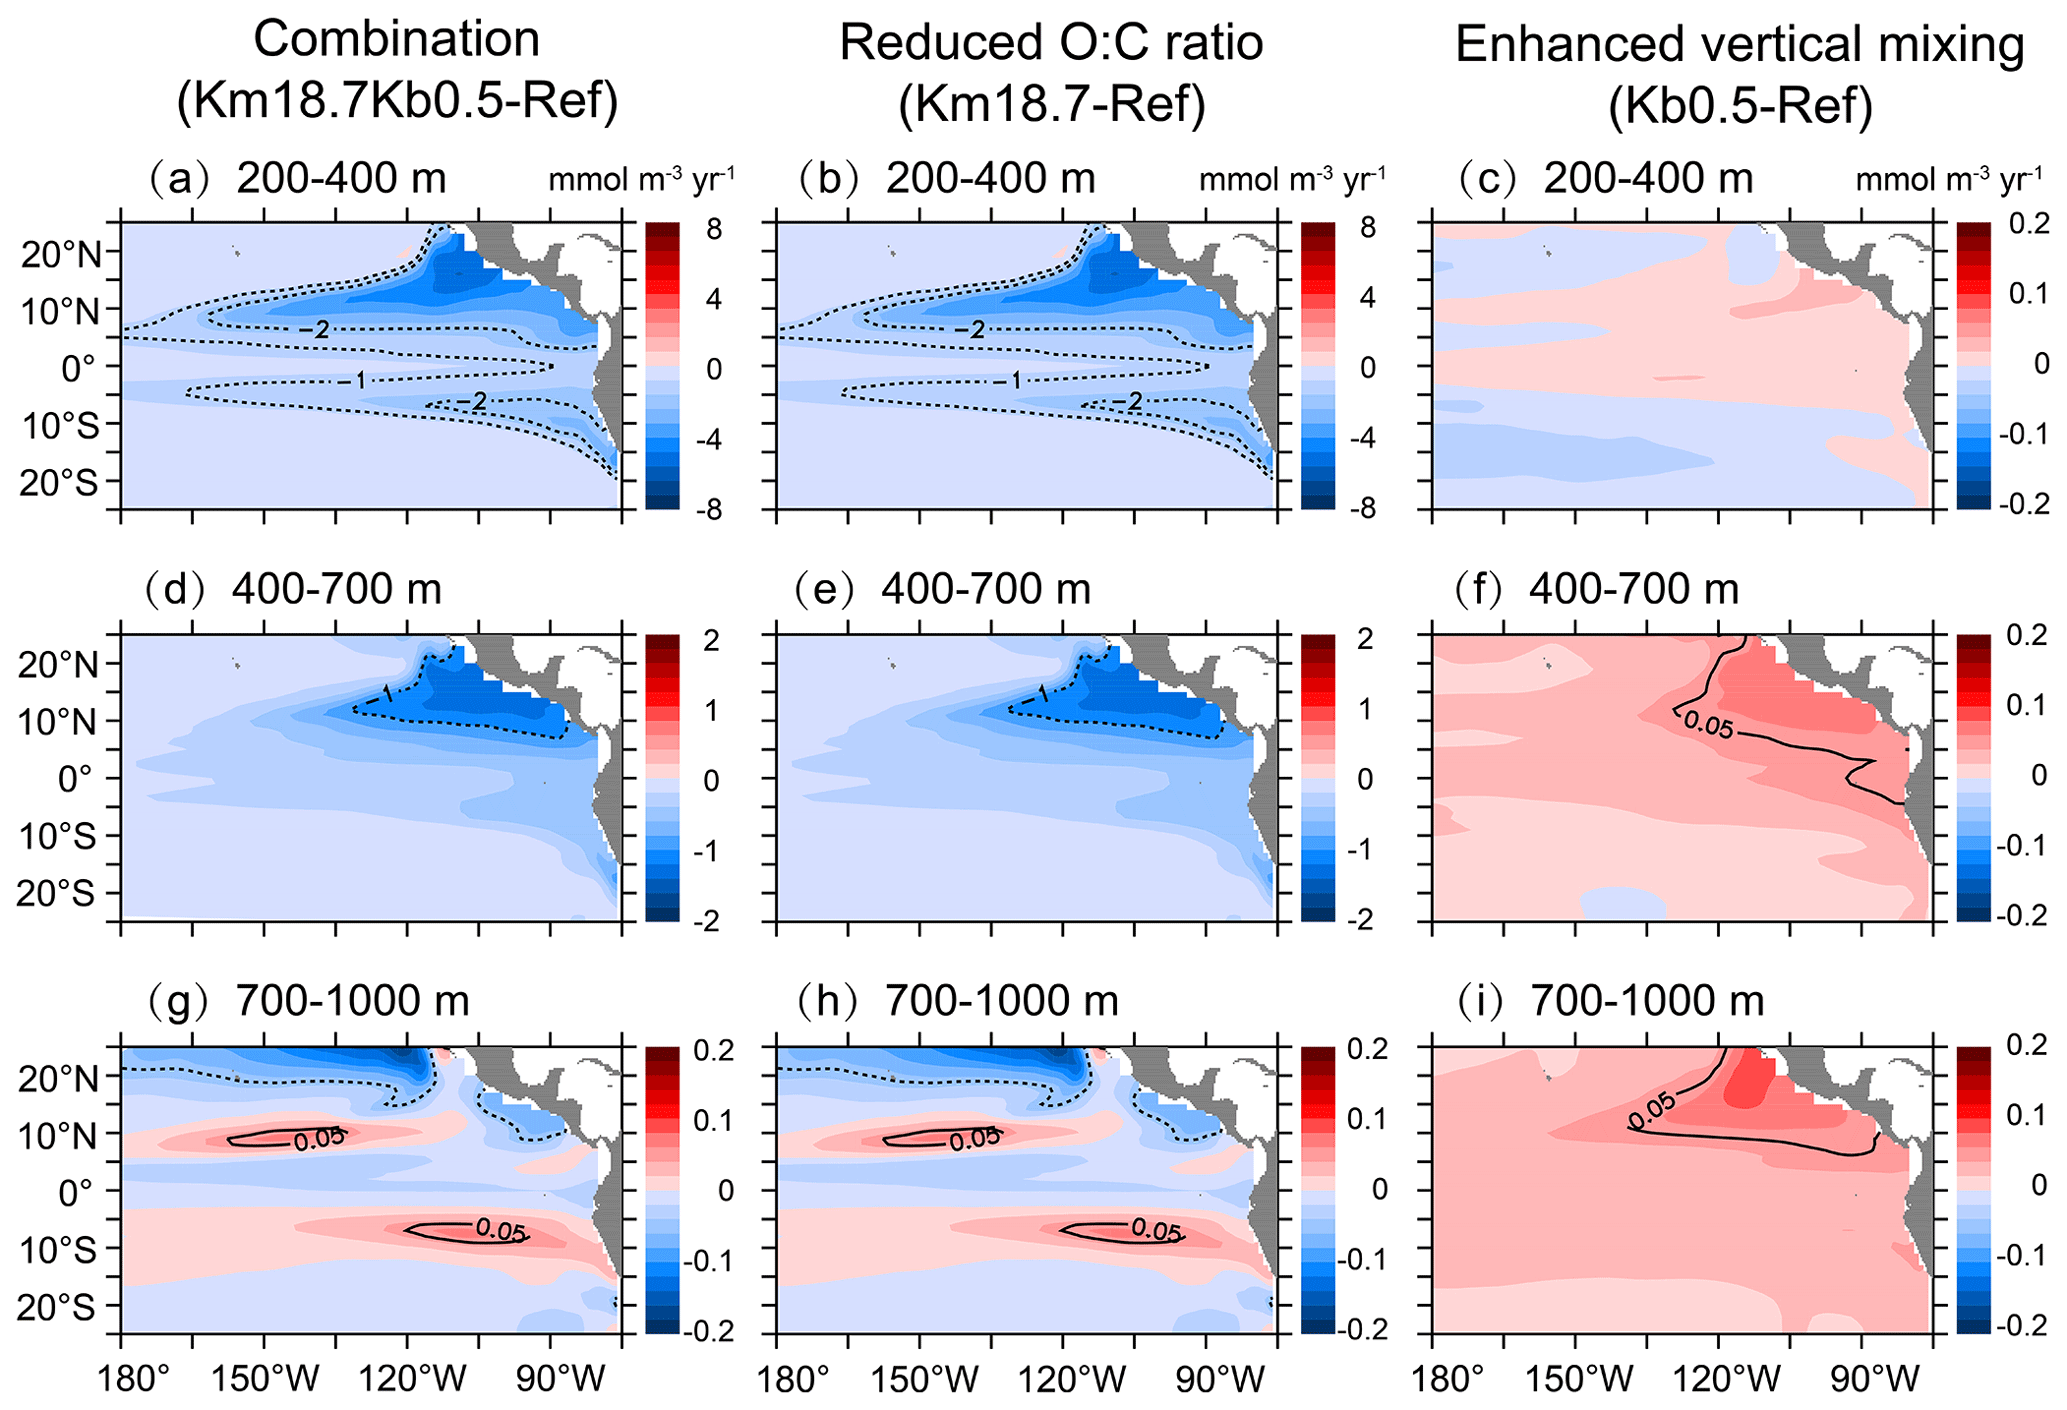
Figure 8Changes in biological consumption over (a, b, c) 200–400 m, (d, e, f) 400–700 m, and (g, h, i) 700–1000 m due to the combination of a reduced O:C utilization ratio and an enhanced vertical mixing (a, d, g), a reduced O:C utilization ratio (b, e, h), and an enhanced vertical mixing (c, f, i).
4.2 Effects of a reduced O:C utilization ratio and an enhanced vertical mixing on consumption and supply
To better understand the effects of changes in the biological and/or physical parameters on the DO dynamics, we evaluate the responses of biological consumption and physical supply. As illustrated in Fig. 8, changes in biological consumption caused by a reduced O:C utilization ratio are almost identical with or without background diffusion. In particular, biological consumption shows a large decrease (∼ 2–8 mmol m−3 yr−1) over 200–400 m (Fig. 8b) and a relatively small decrease (∼ 0.2–1.0 mmol m−3 yr−1) over 400–700 m, with the largest decrease in the north OMZ (Fig. 8e). There is a very small change in biological consumption over 700–1000 m, i.e., a decrease of < 0.1 mmol m−3 yr−1 over much of the basin but an increase of < 0.1 mmol m−3 yr−1 in some parts of the subtropical region (Fig. 8h). On the other hand, applying an enhanced vertical mixing leads to a small increase (< 0.2 mmol m−3 yr−1) in biological consumption in all three layers, with a relatively larger increase in the north OMZ (Fig. 8c, f, and i).
Figure 9 shows the effects of a reduced O:C utilization ratio and an enhanced vertical mixing on physical supply. With the combination of a reduced O:C utilization ratio and an enhanced vertical mixing, physical supply shows a small increase (by ∼ 0.2–1.0 mmol m−3 yr−1) in the whole basin over 700–1000 m (Fig. 9g) and only outside the OMZs over 400–700 m (Fig. 9d) but a relatively larger decrease (by ∼ 0.2–6 mmol m−3 yr−1) in the OMZs over 200–700 m (Fig. 9a and d). Clearly, applying an enhanced vertical mixing leads to an increase in physical supply over the majority of the basin, with a greater increase over 400–1000 m (∼ 0.2–1.0 mmol m−3 yr−1) than over 200–400 m (∼ 0–0.4 mmol m−3 yr−1) (Fig. 9c, f and i). However, applying a reduced O:C utilization ratio causes a large decrease in physical supply above 700 m, with a greater decrease over 400–700 m in the OMZs (∼ 0.2–6 mmol m−3 yr−1) and very small changes (< 0.2 mmol m−3 yr−1) over 700–1000 m (Fig. 9b, e, and h). Overall, the rate of physical supply is determined largely by vertical mixing over 700–1000 m, by both vertical mixing and biological consumption over 400–700 m and by consumption over 200–400 m, implying complex physical–biological interactions and feedbacks in the tropical Pacific OMZs.
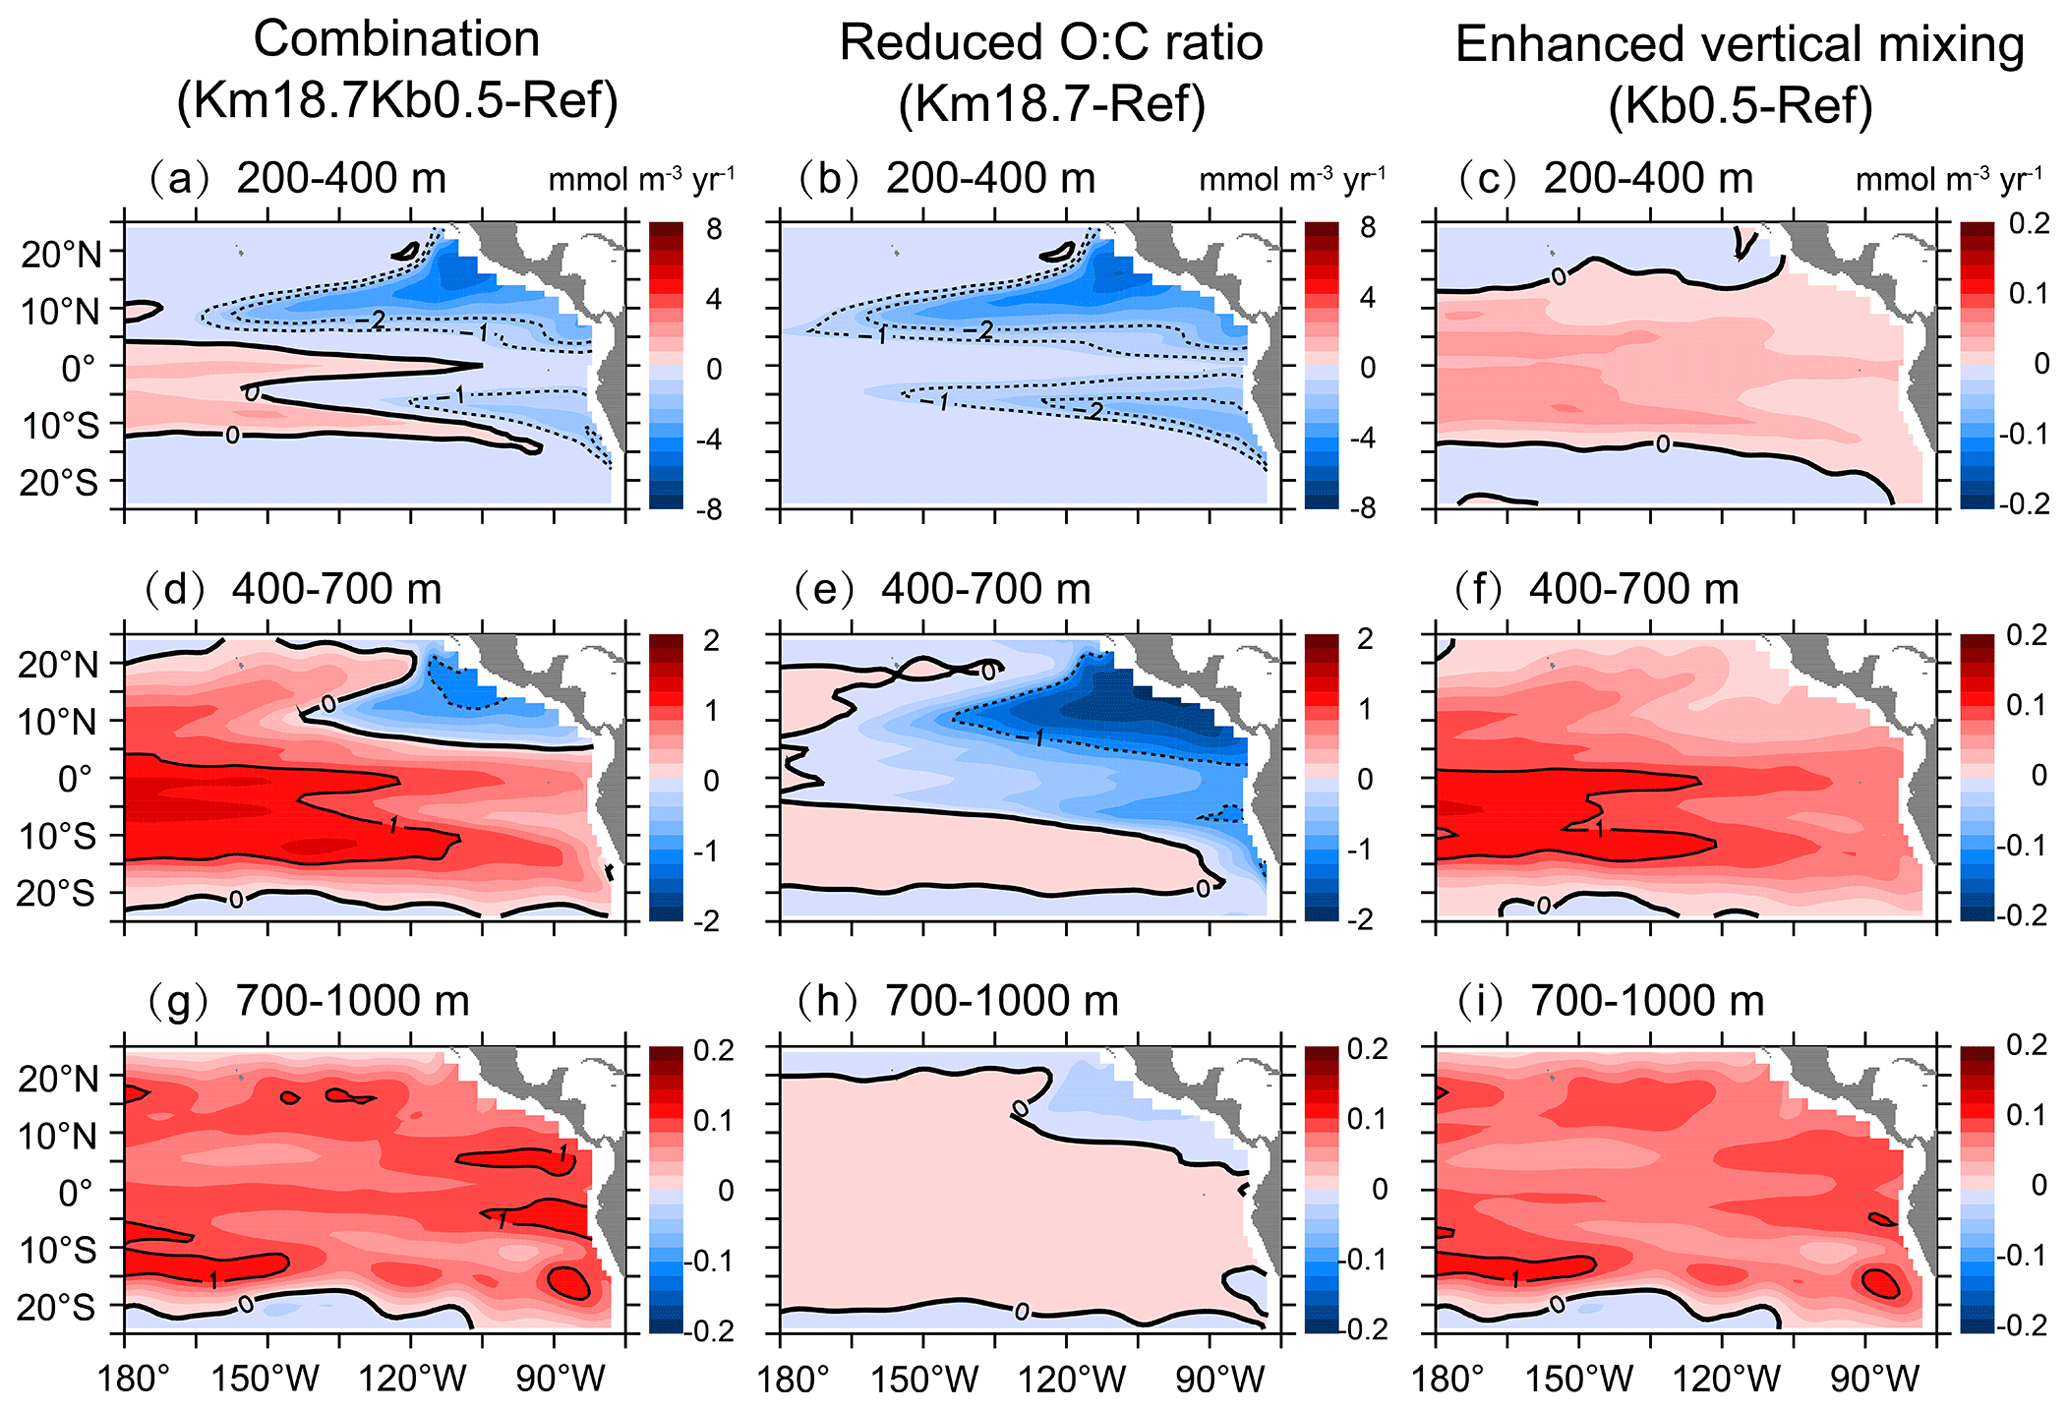
Figure 9Changes in physical supply over (a, b, c) 200–400 m, (d, e, f) 400–700 m, and (g, h, i) 700–1000 m due to the combination of a reduced O:C utilization ratio and an enhanced vertical mixing (a, d, g), a reduced O:C utilization ratio (b, e, h), and an enhanced vertical mixing (c, f, i).
4.3 Interactive effects of physical and biological processes on the source and sink of mid-depth DO
Our further analyses show an increase in physical supply under an enhanced vertical mixing in most parts of the 200–1000 m layer, with larger values below the OMZs particularly to the south (Fig. 10a). Applying an enhanced vertical mixing also results in a generally small increase in biological consumption (Fig. 10b). The small increase in consumption is attributable to the increase in DON concentration (Fig. 10c) that results from the enhancement in vertical mixing. Clearly, there is an overall increase in net flux, with the largest increases occurring mainly outside the OMZs below ∼ 400 m (Fig. 10d).

Figure 10Changes in physical supply, biological consumption, DON concentration, and net flux over 120–90∘ W under an enhanced vertical mixing (a, b, c, d), a reduced O:C utilization ratio (e, f, g, h), combination effects (i, j, k, l), and the residuals or interactions (m, n, o, p). Black and blue lines denote contours of DO concentrations of 20 and 60 mmol m−3 from the reference run (dashed lines) and other simulations (solid lines).
As expected, applying a reduced O:C utilization ratio results in a decrease in consumption in the suboxic waters (Fig. 10f), with a greater decrease in the north OMZ than in the south OMZ. Interestingly, physical supply shows an overall decrease in the water column under a reduced O:C utilization ratio, with a greater decrease in the upper OMZs (Fig. 10e). A decreased rate of consumption leads to a large increase in DON concentration, with a greater increase in the north OMZ than in the south OMZ (Fig. 10g). Net flux shows a small increase in the whole basin under a reduced O:C utilization ratio, with a greater increase over ∼ 200–400 m (Fig. 10h).
The combination of an enhanced vertical mixing and a reduced O:C utilization ratio results in an increase in supply below the OMZs but a decrease in supply inside of OMZs (Fig. 10i). There is an overall decrease in biological consumption in the water column, with a greater decrease in the upper OMZs (Fig. 10j), which is similar to the changes under a reduced O:C utilization ratio (Fig. 10f). DON concentration shows a greater increase in the north OMZ than in the south OMZ under the combination of a reduced O:C utilization ratio and an enhanced vertical mixing (Fig. 10k), which is similar to the changes in DON under a reduced O:C utilization ratio (Fig. 10g). Applying a reduced O:C utilization ratio combined with an enhanced vertical mixing leads to an increase in net flux over 200–1000 m, with a larger increase outside of OMZs (Fig. 10l), which is much greater than that under a reduced O:C utilization ratio (Fig. 10h) and also greater than that with an enhanced vertical mixing particularly in the lower part of OMZs (Fig. 10d).
There is evidence that physical and biogeochemical processes have multiple interactions with impacts on various physical, chemical, and biological fields which in turn have implications for the DO dynamics (Breitburg et al., 2018; Duteil and Oschlies, 2011; Oschlies et al., 2018). For example, observational and modeling studies show that changes in vertical mixing intensity can affect the distribution of DOM and thus oxygen consumption at mid-depth (Duteil and Oschlies, 2011; Talley et al., 2016). On the other hand, applying a smaller O:C utilization ratio leads to lower consumption rates (Moreno et al., 2020) and thus to a relatively higher DO concentration in the OMZs. Therefore, changes in the consumption caused by an enhanced vertical mixing and/or a reduced O:C utilization ratio would alter the gradients of DO concentration in the water column and thus change the intensity of vertical mixing inside and around the OMZs.
Our analyses also show that both changes in supply and consumption with improved parameterizations of both vertical mixing and remineralization of DOM (i.e., Km18.7Kb0.5) are quite different from the sums of changes caused by single parameter change, particularly in the OMZs (Fig. 10m and n), indicating strong physical and biological interactions with positive feedbacks in the low-DO waters. Clearly, the interactions have a relatively larger effect on physical supply because of its sensitivity to changes in both physical and biological parameters. As a result, the interactive effects result in an overall increase in net flux in the OMZs (Fig. 10p).
Physical supply can be divided into horizontal advection, vertical advection, and vertical mixing. Figure S1 shows that vertical mixing is the dominant process for DO supply, particularly above ∼600 m in the OMZs. Other modeling studies have also demonstrated the dominant role of vertical mixing in supplying oxygen from the thermocline to OMZs (Duteil et al., 2021; Llanillo et al., 2018). Our model simulation with the combination of an enhanced vertical mixing and a reduced O:C utilization ratio compares well with other modeling results (Duteil et al., 2021; Shigemitsu et al., 2017), in simulating meridional and zonal advections and vertical mixing for DO transport (see Fig. S2 in the Supplement), which gives us confidence for the evaluation of different responses of key physical components to an enhanced vertical mixing and a reduced O:C utilization ratio.
As shown in Fig. 11, there is no clear pattern in the response of advective transport, with very small values (<∼1 mmol m−3 yr−1) over the entire basin. However, DO supply by vertical mixing shows a strong response to different model parameterizations, with similar patterns as those in total supply (see Fig. 10). Including background diffusion leads to a large increase in vertical mixing (> 1 mmol m−3 yr−1) over most of the basin, with a greater increase mainly below the OMZs (Fig. 11c). On the other hand, applying a reduced O:C utilization ratio causes a small increase in vertical mixing of DO (< 0.5 mmol m−3 yr−1) outside of suboxic waters but a large decrease (∼ 2–8 mmol m−3 yr−1) inside of the suboxic waters (Fig. 11g). A significant decrease in vertical mixing (> 3 mmol m−3 yr−1) is mainly found above ∼400 m in the OMZs, which corresponds to the decrease in vertical gradient of DO concentration (Fig. 11h).
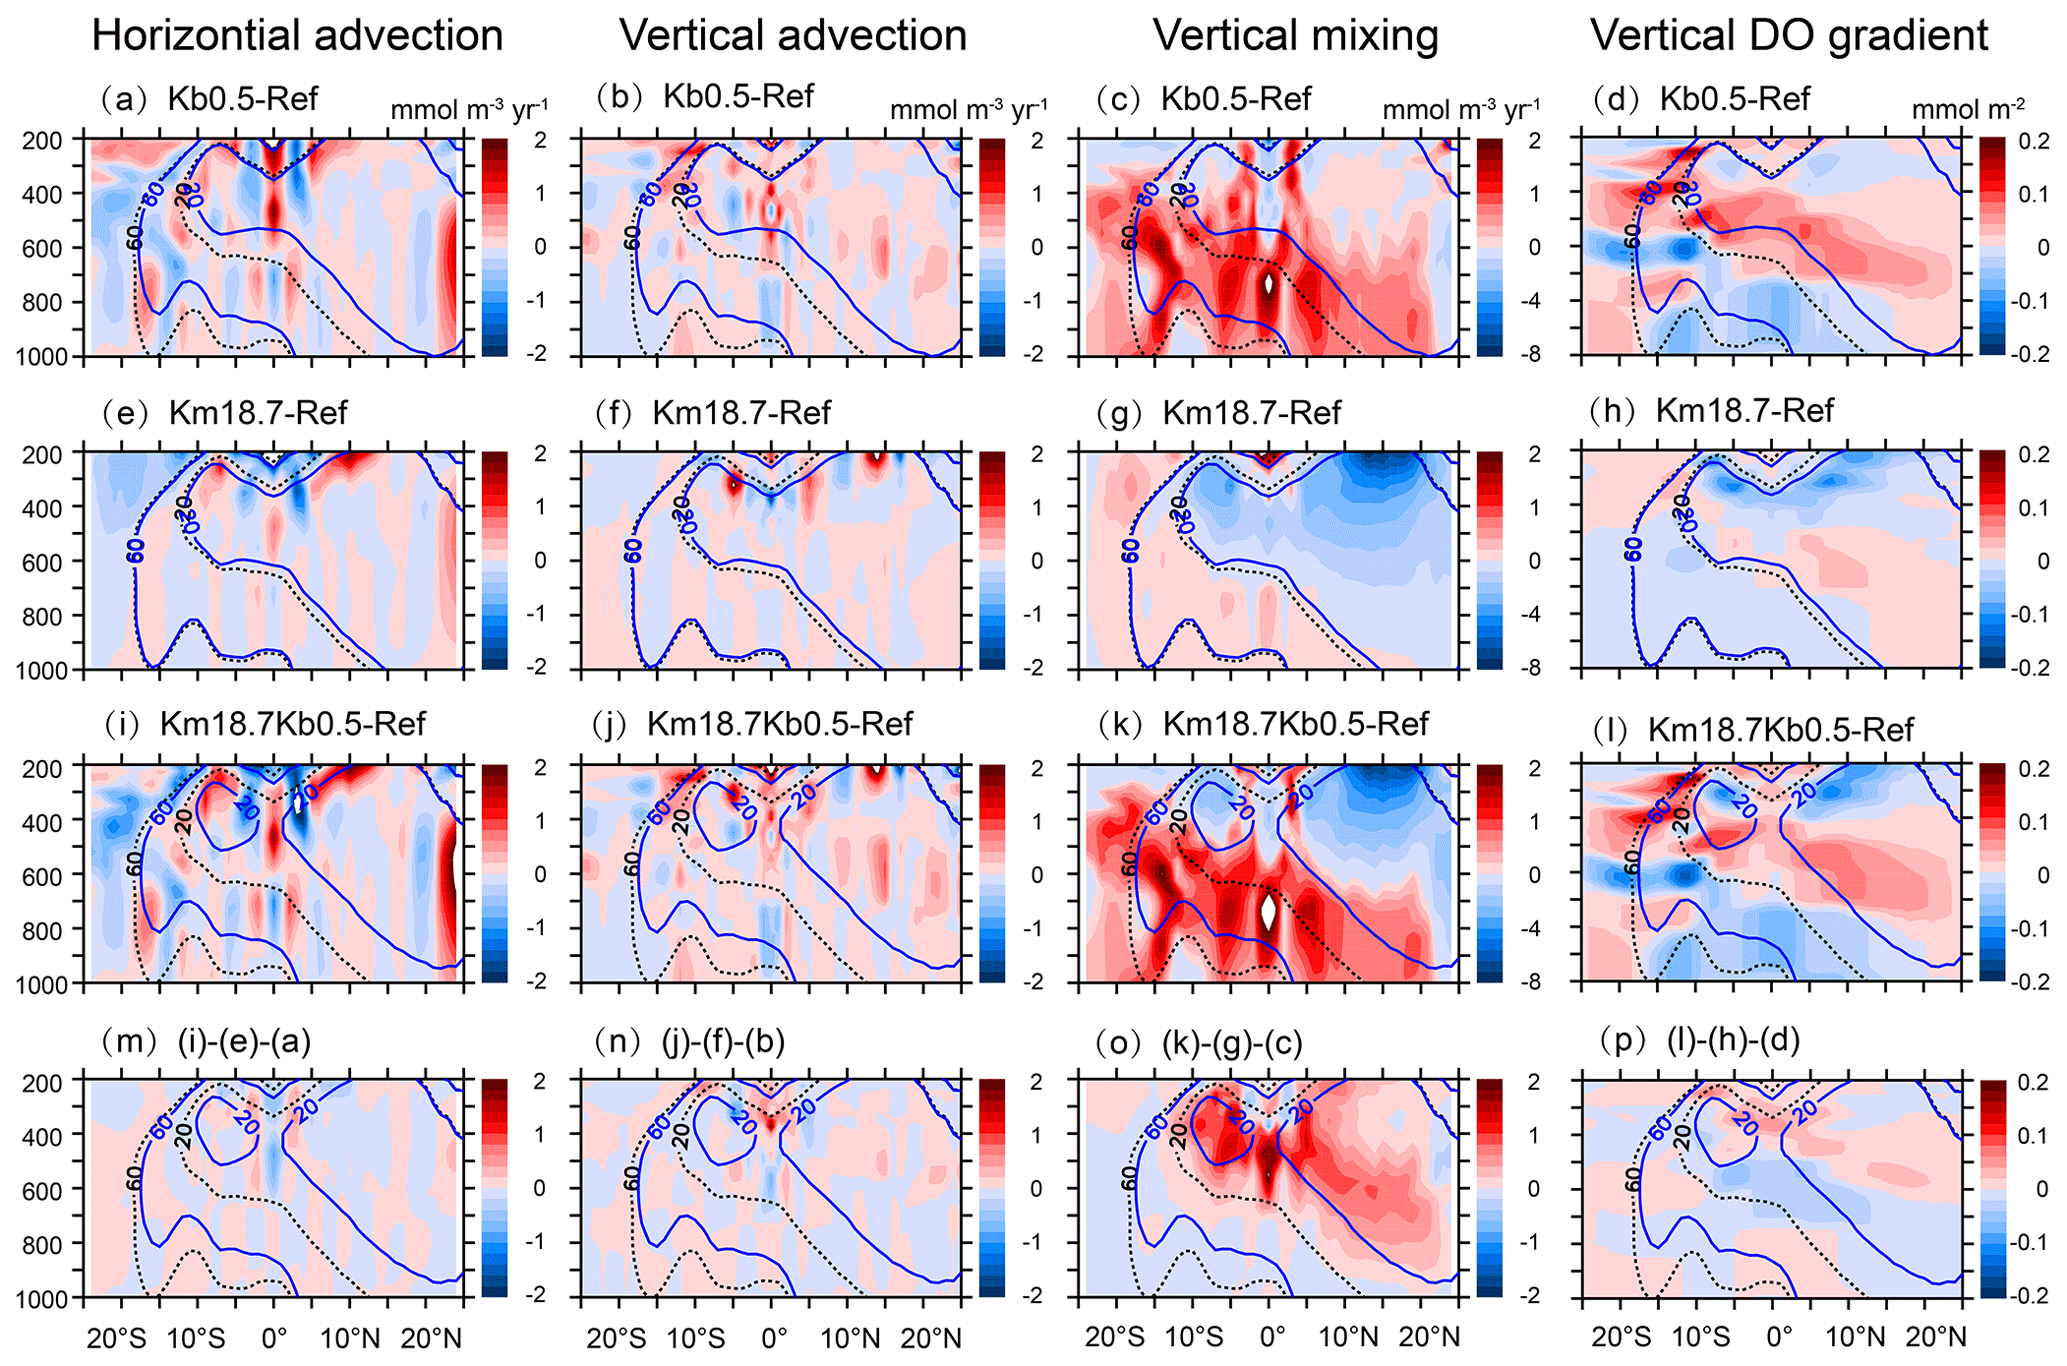
Figure 11Changes in horizontal advection, vertical advection, vertical mixing, and vertical DO gradient over 120–90∘ W under an enhanced vertical mixing (a, b, c, d), a reduced O:C utilization ratio (e, f, g, h) and combination effects (i, j, k, l), and the residues or interactions (m, n, o, p). Black and blue lines denote contours of DO concentrations of 20 and 60 mmol m−3 from the reference run (dashed lines) and other simulations (solid lines).
Vertical mixing of DO shows an increase (∼ 1–2 mmol m−3 yr−1) outside of the OMZs and a decrease (∼ 2–8 mmol m−3 yr−1) inside of the OMZs in response to the combination of an enhanced background diffusion and a reduced O:C utilization ratio (Fig. 11k), which is similar to the net response of vertical mixing to the changes caused by individual parameters (see Fig. 11c and g). However, the combined effects exceed the sum of two individual responses in the south OMZ and the lower part of the north OMZ (Fig. 11o). An early study has demonstrated that applying an enhanced background diffusion can lead to an increase not only in vertical mixing of DO directly but also in biological consumption caused by enhanced export production in the tropical Pacific OMZs (Duteil and Oschlies, 2011), which in turn changes the vertical gradient of DO concentration and thus affects the intensity of vertical mixing.
4.4 Impacts of biological and physical processes on asymmetric OMZs
There is evidence of asymmetric features in many biogeochemical fields in the tropical Pacific. For example, POC flux at 500 m is greater in the northern tropical Pacific (∼4 mmol C m−2 d−1) (Van Mooy et al., 2002) than in the southern tropical Pacific (< 1 mmol C m−2 d−1) (Pavia et al., 2019). Similarly, our regional model reproduces an asymmetric pattern for POC flux, with larger values to the north than to the south. Field studies have reported an asymmetry in DOM distribution over ∼ 200–1000 m in the central–eastern tropical Pacific, i.e., higher levels of DON and DOC to the north than to the south (Hansell, 2013; Libby and Wheeler, 1997; Raimbault et al., 1999). Our best model simulation (i.e., the Km18.7Kb0.5 simulation) also reveals an asymmetric DON below 300 m, i.e., ∼ 6–8 mmol m−3 in the ETNP and ∼ 3–5 mmol m−3 in the ETSP (Fig. S3a in the Supplement). However, an earlier field study reported higher rates of organic carbon remineralization over 200–1000 m to the south (∼ 2–10 mmol m−3 yr−1) than to the north (∼ 1–6 mmol m−3 yr−1) in the eastern/central tropical Pacific (Feely et al., 2004). Similarly, our model simulation also shows such an asymmetric feature in biological consumption over 300–600 m, i.e., ∼ 2–4 mmol m−3 yr−1 in the ETSP and < 1 mmol m−3 yr−1 in the ETNP (Fig. S3b).
It appears that the asymmetric distributions differ largely between biological fields in the tropical Pacific. In particular, there are almost opposite patterns between oxygen consumption (or DOM remineralization) and DOM concentration, which may be attributed to the difference in rate of DOM remineralization between the north and south. The rate of DOM remineralization is determined not only by microbial activity but also by the stoichiometry associated with microbial respiration (Wang et al., 2008; Zakem and Levine, 2019). Recent studies on the respiration quotient demonstrate that the O:C utilization ratio is lower to the north than to the south in the tropical Pacific (Tanioka and Matsumoto, 2020; Wang et al., 2019), which primarily reflects the difference in oxygen limitation on microbial respiration (Kalvelage et al., 2015). Apparently, the asymmetry in biological consumption (lower rate in the north than in the south) cannot explain the asymmetry in the tropical Pacific OMZs (i.e., lower DO levels to the north than to the south), indicating that other processes are responsible for the asymmetry.
Numerous studies have indicated that physical mixing is the only source of DO for the tropical OMZs (Brandt et al., 2015; Czeschel et al., 2012; Duteil et al., 2021). There is evidence that turbulent diffusion accounts for 89 % of the net DO supply for the core OMZ of the southern tropical Pacific (Llanillo et al., 2018). Our model simulations show that zonal, meridional, and vertical advections for DO supply are relatively weak (< 2 mmol m−3 yr−1). However, the intensity of vertical mixing is much stronger (∼ 2–6 mmol m−3 yr−1) at mid-depth, indicating that vertical mixing plays a bigger role in supplying DO to the OMZs.
Our further analyses show that the intensity of vertical mixing over 200–700 m is stronger to the south than to the north of the Equator (Fig. S2), which is consistent with some other modeling studies that report stronger DO supply via vertical mixing in the south OMZ than in the north OMZ in the tropical Pacific (Duteil, 2019; Shigemitsu et al., 2017). There is evidence that larger-scale mass transport due to circulation and ventilation is more efficient in the South Pacific than in the North Pacific (Kuntz and Schrag, 2018), and the transit time from the surface to the OMZ is much longer in the ETNP than in the ETSP (Fu et al., 2018). All these analyses indicate that vertical mixing is largely responsible for asymmetric distribution of mid-depth DO, and physical processes play a major role in shaping the asymmetry of the OMZs in the tropical Pacific.
4.5 Implications and limitations of the current research
There are inter-dependencies between physical and biogeochemical processes at mid-depth (Duteil and Oschlies, 2011; Gnanadesikan et al., 2012; Niemeyer et al., 2019), which can have influences on the asymmetry of OMZs in the tropical Pacific. Our study shows that the rate of physical supply is sensitive to changes in vertical mixing below 400 m and biological consumption over 200–400 m. Since the contribution of physical supply to mid-depth DO flux exceeds that of biological consumption in the tropical Pacific (Llanillo et al., 2018; Montes et al., 2014) and the physical processes are more dominant in the ETSP, one may expect that physical–biological feedbacks are stronger to the south, which can lead to a relatively larger net flux into the south OMZ.
Physical and biogeochemical interactions are complex and region-specific and produce direct and indirect effects on the sources and sinks of DO (Levin, 2018; Oschlies et al., 2018). Our study demonstrates that there is a much greater increase in net DO flux in the core OMZ to the south than to the north that results from these interactions and feedbacks (Fig. 10p). On the one hand, the supply of DO is greater under stronger physical transport in the south tropical Pacific. On the other hand, stronger physical processes can also lead to higher levels of nutrients and biological production and thus enhanced export production and oxygen consumption at mid-depth (Duteil and Oschlies, 2011), which can offset the rate of physical supply. In addition, stronger physical processes can also result in strengthened transport of DO and OM out to other regions (Gnanadesikan et al., 2012; Yu et al., 2021) which have complex impacts on DO balance in the south OMZ.
To date, most regional to global models have difficulty in reproducing the observed asymmetric OMZs in the tropical Pacific (Cabre et al., 2015; Duteil, 2019), which is probably caused by misrepresentations of physical processes such as background diffusion at mid-depth and ocean circulation (Cabre et al., 2015; Duteil and Oschlies, 2011). In addition, model configuration such as vertical and horizontal resolutions can also influence physical transportations of DO (Busecke et al., 2019; Duteil et al., 2014) and distributions of nutrients (with impacts on biological production and DO consumption) (Berthet et al., 2019). Other possible causes may be associated with the ocean–atmosphere interactions and feedbacks due to the uncertainties in atmospheric forcing fields (Duteil, 2019; Ridder and England, 2014; Stramma et al., 2012).
Although there have been advances in our understanding of the regulation of DO consumption by biogeochemical processes, large-scale models do not have representative processes due to various reasons. For example, there is evidence of DO depletion at mid-depth caused by zooplankton migration (Bianchi et al., 2013; Kiko et al., 2017), and there are strong interactions and feedbacks between carbon, nitrogen, and oxygen cycles in marine ecosystems. Limited studies indicate that utilization ratios during microbial respiration vary largely in the water column (Moreno et al., 2020; Zakem and Levine, 2019). Nitrogen cycling (e.g., oxidation, nitrification, and denitrification) not only has impacts on oxygen consumption/production but is also influenced by the oxygen level (Beman et al., 2021; Kalvelage et al., 2013; Oschlies et al., 2019; Sun et al., 2021). However, little attention has been paid to understanding the coupling of carbon and oxygen cycles; the available data are also not sufficient for the parameterizations of relevant processes, which has hampered our ability to assess the impacts of those biogeochemical processes on oxygen fields. Future observational and modeling studies are needed not only to improve our knowledge on the coupling of carbon, nitrogen, and oxygen cycles in the ocean but also to advance our understanding on the physical and biogeochemical interactions and feedbacks associated with marine stoichiometry.
In this paper, we use a basin-scale model to investigate the impacts of parameterizations of vertical mixing and DOM remineralization on the dynamics of mid-depth DO and analyze the underlying mechanisms for asymmetric OMZs in the tropical Pacific. Our results show that the model is capable of reproducing the observed DO distributions and asymmetric OMZs with the combination of an enhanced vertical mixing and a reduced O:C utilization ratio that causes an increase in DO concentration (or net flux) at mid-depth. Overall, applying an enhanced vertical mixing makes a larger contribution to the increase in DO below ∼400 m, and the contribution from a reduced O:C utilization ratio is greater over 200–400 m.
Our analyses demonstrate that there is a modest increase in physical supply and a small increase in biological consumption with an enhanced vertical mixing, and the increase in consumption is a result of the redistribution of DOM in the water column. On the other hand, applying a reduced O:C utilization ratio results in a large decrease in both biological consumption and physical supply in the OMZs (due to the changes in vertical DO gradients). These findings point to strong physical–biological interactions and feedbacks at mid-depth in the tropical Pacific.
This study suggests that biological consumption (i.e., greater rate to the south) cannot explain the asymmetric feature in the tropical Pacific OMZs (i.e., lower DO levels to the north), but physical processes (i.e., stronger vertical mixing to the south) play a major role in shaping the asymmetric OMZs of the tropical Pacific. In addition, the interactions between physical and biological processes are also stronger in the south OMZ than in the north OMZ, likely because physical supply is sensitive to changes in the parameterizations of both vertical mixing and DOM remineralization. Further studies with improved approaches will enable a better understanding of the interactions and feedbacks between physical and biogeochemical processes.
Phytoplankton equations
Zooplankton equations
Detritus equations
DON equations
Nutrient equations
Nitrogen uptake
Other equations
Phytoplankton growth rate
Nutrient limitation
Light limitation
Light attenuation
Detritus decomposition and DON remineralization
Phytoplankton carbon-to-chlorophyll ratio (η)
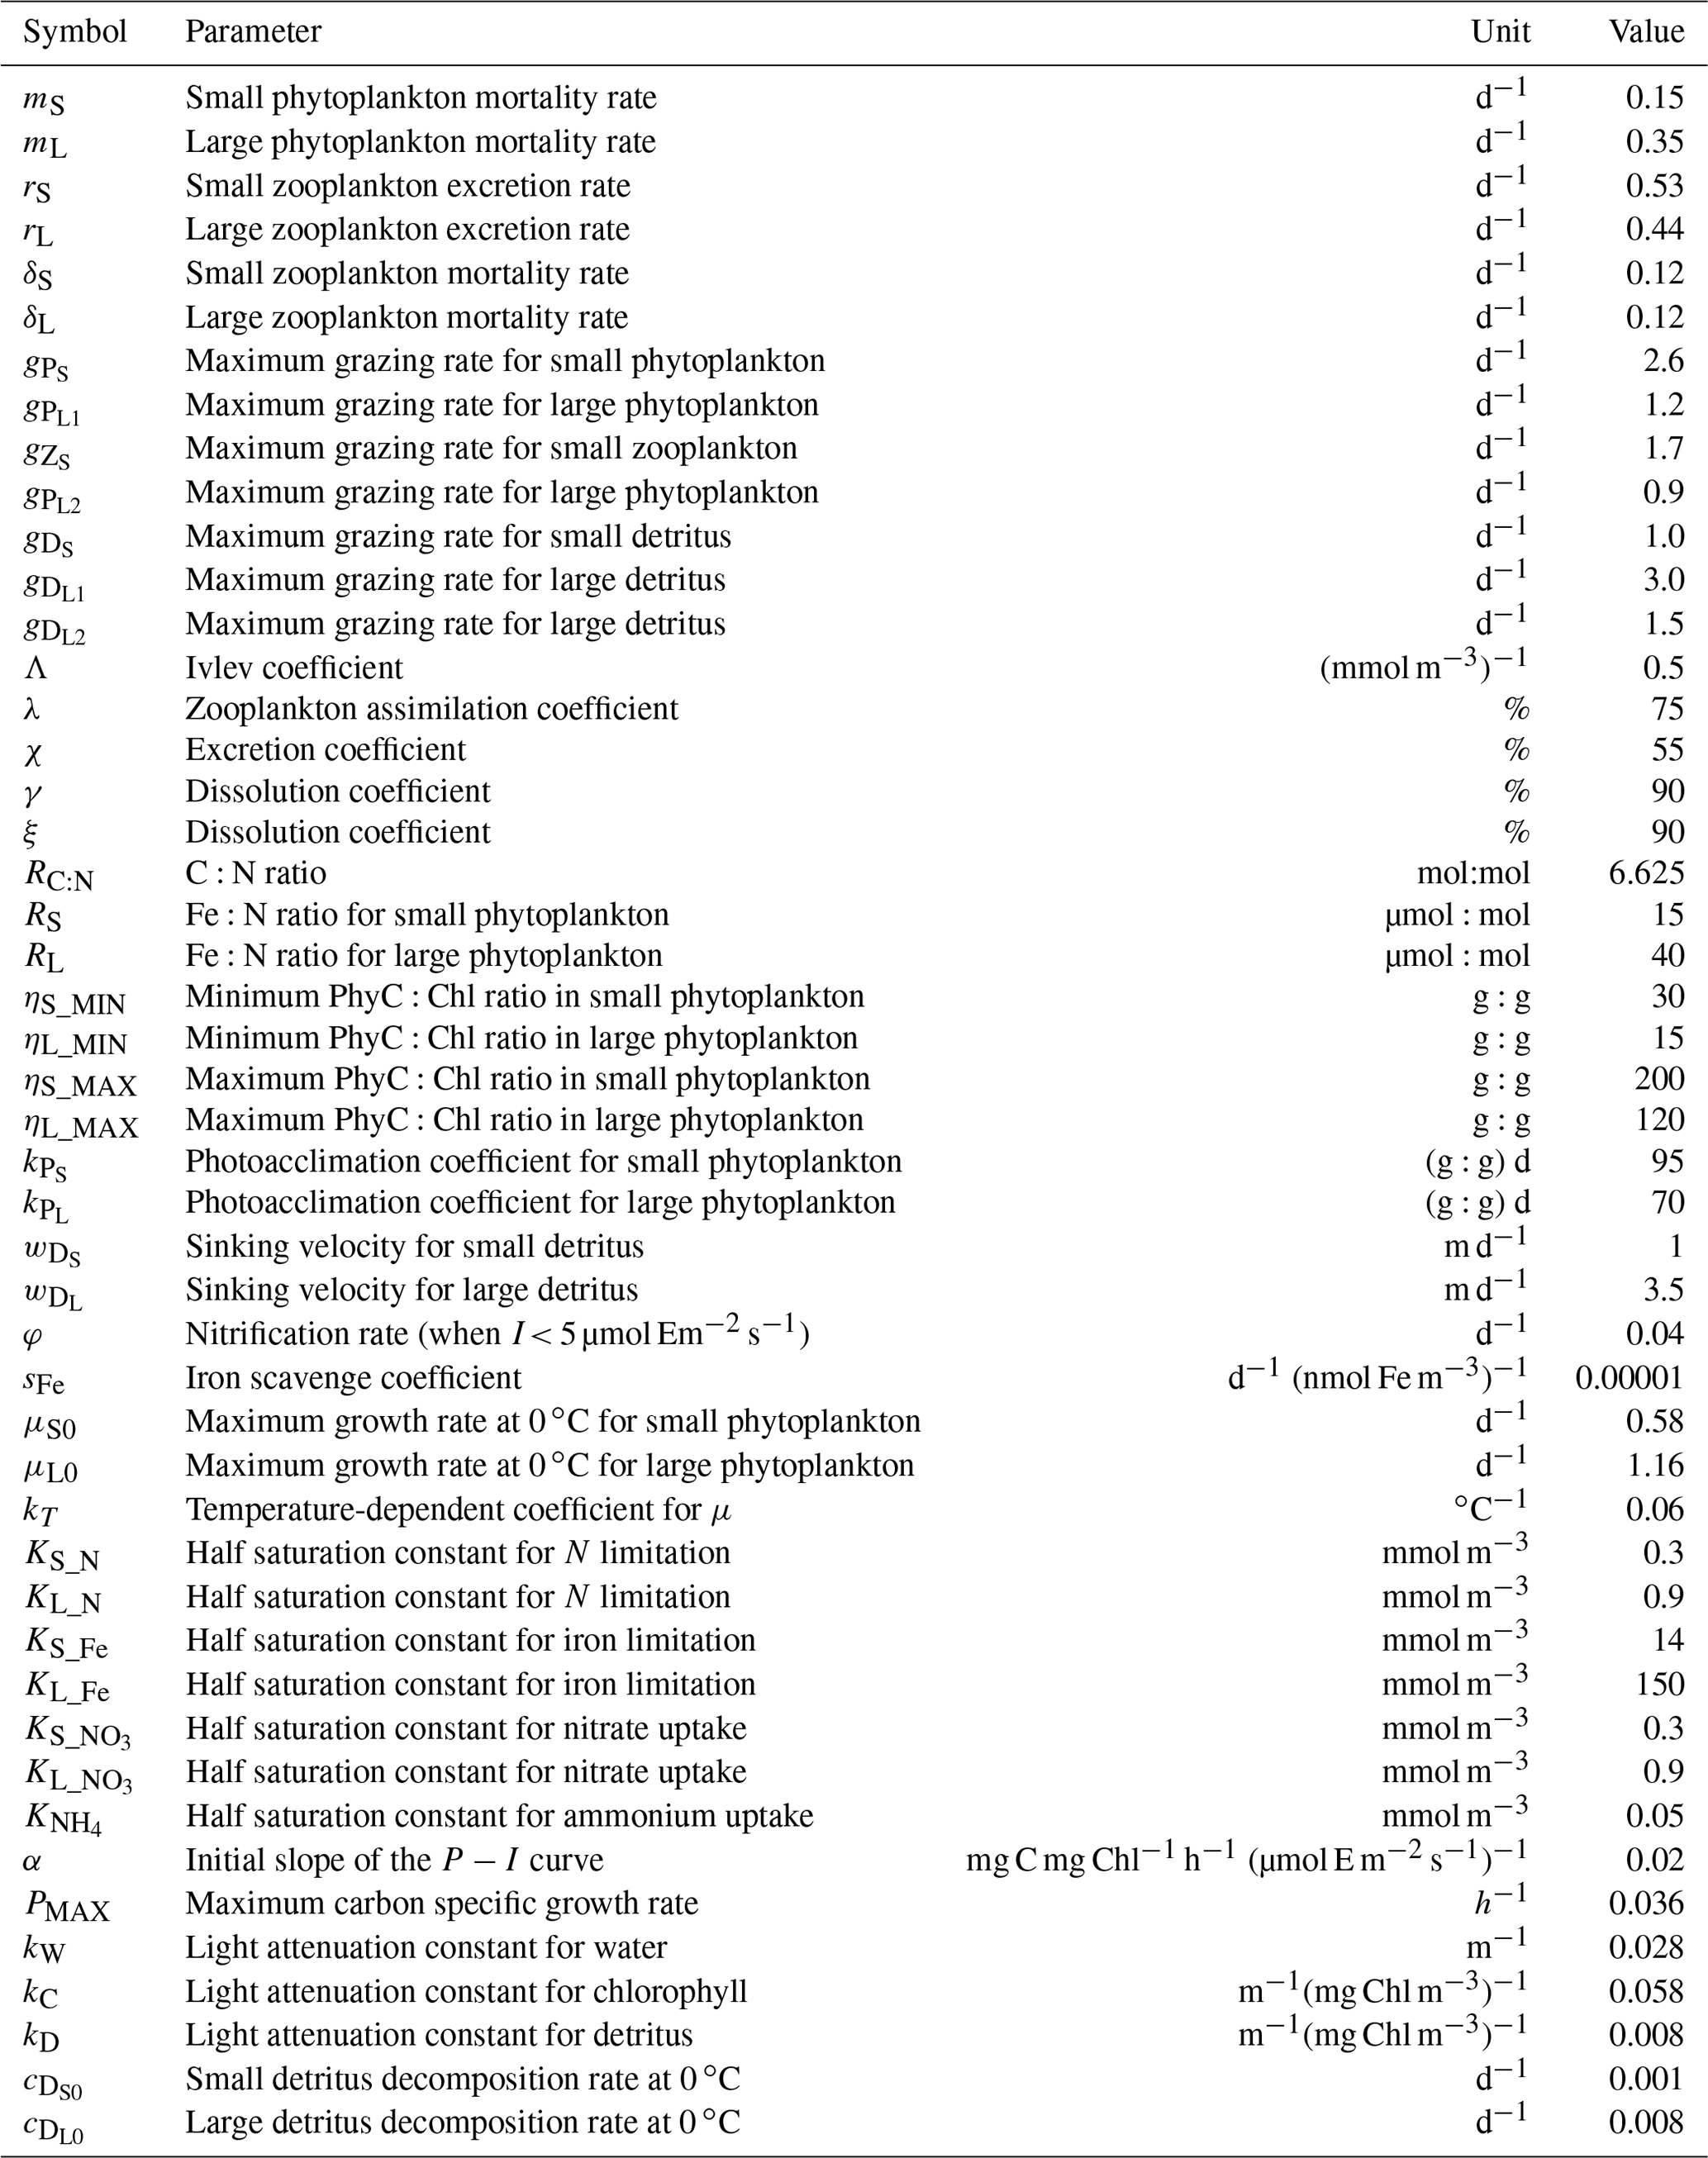
Table C1Comparisons in biogeochemical parameters.
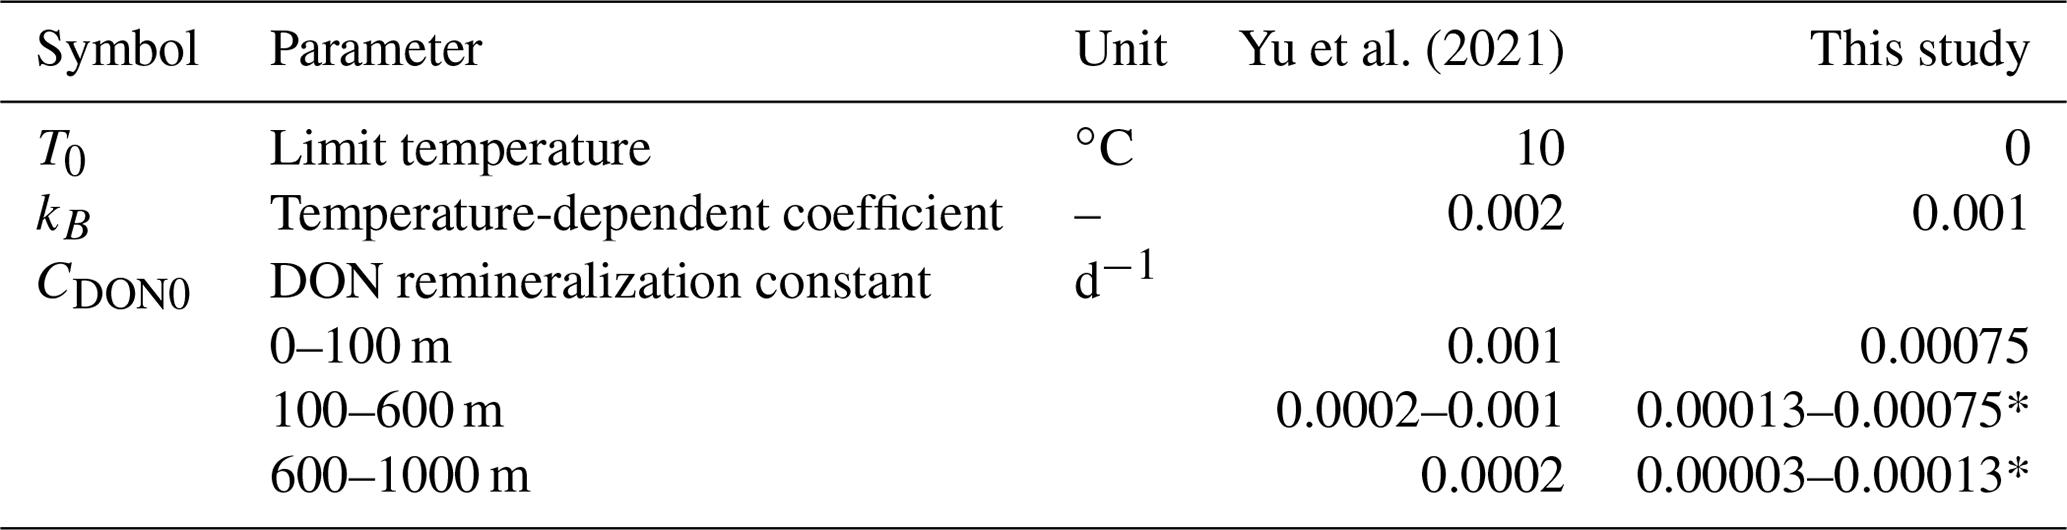
* CDON0 decreases with depth by an exponential function.
The exact version of the software code used to produce the results presented in this paper is archived on Zenodo (https://doi.org/10.5281/zenodo.5148146, Wang et al., 2021). Other code and data are available upon request from the authors. Request for materials should be addressed to Xiujun Wang (xwang@bnu.edu.cn).
The supplement related to this article is available online at: https://doi.org/10.5194/gmd-15-1017-2022-supplement.
XW and KW designed the study, performed the simulations, and prepared the paper. RM, DZ, and RHZ contributed to analysis, interpretation of results, and writing.
The contact author has declared that neither they nor their co-authors have any competing interests.
Publisher's note: Copernicus Publications remains neutral with regard to jurisdictional claims in published maps and institutional affiliations.
The authors wish to acknowledge the use of the Ferret (http://ferret.pmel.noaa.gov/Ferret/, last access: 20 December 2021).
This research has been supported by the Chinese Academy of Sciences' Strategic Priority Project (grant. no XDA1101010504).
This paper was edited by Guy Munhoven and reviewed by four anonymous referees.
Bao, Y. and Li, Y.: Simulations of dissolved oxygen concentration in CMIP5 Earth system models, Acta Oceanol. Sin., 35, 28–37, 2016.
Beman, J. M., Vargas, S. M., Vazquez, S., Wilson, J. M., Yu, A., Cairo, A., and Perez-Coronel, E.: Biogeochemistry and hydrography shape microbial community assembly and activity in the eastern tropical North Pacific Ocean oxygen minimum zone, Environ. Microbiol., 23, 2765–2781, 2020.
Beman, J. M., Vargas, S. M., Vazquez, S., Wilson, J. M., Yu, A., Cairo, A., and Perez-Coronel, E.: Biogeochemistry and hydrography shape microbial community assembly and activity in the eastern tropical North Pacific Ocean oxygen minimum zone, Environ. Microbiol., 23, 2765–2781, 2021.
Bertagnolli, A. D. and Stewart, F. J.: Microbial niches in marine oxygen minimum zones, Nat. Rev. Microbiol., 16, 723–729, 2018.
Berthet, S., Séférian, R., Bricaud, C., Chevallier, M., Voldoire, A., and Ethé, C.: Evaluation of an Online Grid – Coarsening Algorithm in a Global Eddy – Admitting Ocean Biogeochemical Model, J. Adv. Model. Earth Sy., 11, 1759–1783, 2019.
Bettencourt, J. H., Lopez, C., Hernandez-Garcia, E., Montes, I., Sudre, J., Dewitte, B., Paulmier, A., and Garcon, V.: Boundaries of the Peruvian oxygen minimum zone shaped by coherent mesoscale dynamics, Nat. Geosci., 8, 937–940, https://doi.org/10.1038/ngeo2570, 2015.
Bianchi, D., Dunne, J. P., Sarmiento, J. L., and Galbraith, E. D.: Data-based estimates of suboxia, denitrification, and N2O production in the ocean and their sensitivities to dissolved O2, Global Biogeochem. Cy., 26, 1–13, 2012.
Bianchi, D., Galbraith, E. D., Carozza, D. A., Mislan, K. A. S., and Stock, C. A.: Intensification of open-ocean oxygen depletion by vertically migrating animals, Nat. Geosci., 6, 545–548, 2013.
Bopp, L., Le Quere, C., Heimann, M., Manning, A. C., and Monfray, P.: Climate-induced oceanic oxygen fluxes: Implications for the contemporary carbon budget, Global Biogeochem. Cy., 16, 1–13, 2002.
Brandt, P., Bange, H. W., Banyte, D., Dengler, M., Didwischus, S.-H., Fischer, T., Greatbatch, R. J., Hahn, J., Kanzow, T., Karstensen, J., Körtzinger, A., Krahmann, G., Schmidtko, S., Stramma, L., Tanhua, T., and Visbeck, M.: On the role of circulation and mixing in the ventilation of oxygen minimum zones with a focus on the eastern tropical North Atlantic, Biogeosciences, 12, 489–512, https://doi.org/10.5194/bg-12-489-2015, 2015.
Breitburg, D., Levin, L. A., Oschlies, A., Gregoire, M., Chavez, F. P., Conley, D. J., Garcon, V., Gilbert, D., Gutierrez, D., Isensee, K., Jacinto, G. S., Limburg, K. E., Montes, I., Naqvi, S. W. A., Pitcher, G. C., Rabalais, N. N., Roman, M. R., Rose, K. A., Seibel, B. A., Telszewski, M., Yasuhara, M., and Zhang, J.: Declining oxygen in the global ocean and coastal waters, Science, 359, eaam7240, https://doi.org/10.1126/science.aam7240, 2018.
Busecke, J. J. M., Resplandy, L., and Dunne, J. P. P.: The Equatorial Undercurrent and the Oxygen Minimum Zone in the Pacific, Geophys. Res. Lett., 46, 6716–6725, https://doi.org/10.1029/2019GL082692, 2019.
Cabré, A., Marinov, I., Bernardello, R., and Bianchi, D.: Oxygen minimum zones in the tropical Pacific across CMIP5 models: mean state differences and climate change trends, Biogeosciences, 12, 5429–5454, https://doi.org/10.5194/bg-12-5429-2015, 2015.
Chen, D., Rothstein, L. M., and Busalacchi, A. J.: A Hybrid Vertical Mixing Scheme and Its Application to Tropical Ocean Models, J. Phys. Oceanogr., 24, 2156–2179, 1994.
Christian, J. R., Verschell, M. A., Murtugudde, R., Busalacchi, A. J., and McClain, C. R.: Biogeochemical modelling of the tropical Pacific Ocean. I: Seasonal and interannual variability, Deep-Sea Res. Pt. II, 49, 509–543, 2001.
Czeschel, R., Stramma, L., Schwarzkopf, F. U., Giese, B. S., Funk, A., and Karstensen, J.: Middepth circulation of the eastern tropical South Pacific and its link to the oxygen minimum zone, J. Geophys. Res.-Oceans, 116, C01015, https://doi.org/10.1029/2010JC006565, 2011.
Czeschel, R., Stramma, L., and Johnson, G. C.: Oxygen decreases and variability in the eastern equatorial Pacific, J. Geophys. Res.-Oceans, 117, 1–12, 2012.
DeVries, T., Le Quere, C., Andrews, O., Berthet, S., Hauck, J., Ilyina, T., Landschuetzer, P., Lenton, A., Lima, I. D., Nowicki, M., Schwinger, J., and Seferian, R.: Decadal trends in the ocean carbon sink, P. Natl. Acad. Sci. USA, 116, 11646–11651, 2019.
Duteil, O.: Wind Synoptic Activity Increases Oxygen Levels in the Tropical Pacific Ocean, Geophys. Res. Lett., 46, 2715–2725, 2019.
Duteil, O. and Oschlies, A.: Sensitivity of simulated extent and future evolution of marine suboxia to mixing intensity, Geophys. Res. Lett., 38, L06607, https://doi.org/10.1029/2011gl046877, 2011.
Duteil, O., Schwarzkopf, F. U., Böning, C. W., and Oschlies, A.: Major role of the equatorial current system in setting oxygen levels in the eastern tropical Atlantic Ocean: A high-resolution model study, Geophys. Res. Lett., 41, 2033–2040, 2014.
Duteil, O., Frenger, I., and Getzlaff, J.: The riddle of eastern tropical Pacific Ocean oxygen levels: the role of the supply by intermediate-depth waters, Ocean Sci., 17, 1489–1507, https://doi.org/10.5194/os-17-1489-2021, 2021.
Feely, R. A., Wanninkhof, R., Takahashi, T., and Tans, P.: Influence of El Niño on the equatorial Pacific contribution to atmospheric CO2 accumulation, Nature, 398, 597–601, 1999.
Feely, R. A., Sabine, C. L., Schlitzer, R., Bullister, J. L., Mecking, S., and Greeley, D.: Oxygen utilization and organic carbon remineralization in the upper water column of the Pacific Ocean, J. Oceanogr., 60, 45–52, 2004.
Fu, W. W., Bardin, A., and Primeau, F.: Tracing ventilation source of tropical pacific oxygen minimum zones with an adjoint global ocean transport model, Deep-Sea Res. Pt. I, 139, 95–103, 2018.
Fuenzalida, R., Schneider, W., Garces-Vargas, J., Bravo, L., and Lange, C.: Vertical and horizontal extension of the oxygen minimum zone in the eastern South Pacific Ocean, Deep-Sea Res. Pt. II, 56, 1027–1038, 2009.
Garçon, V., Karstensen, J., Palacz, A., Telszewski, M., Aparco Lara, T., Breitburg, D., Chavez, F., Coelho, P., Cornejo-D'Ottone, M., Santos, C., Fiedler, B., Gallo, N. D., Grégoire, M., Gutierrez, D., Hernandez-Ayon, M., Isensee, K., Koslow, T., Levin, L., Marsac, F., Maske, H., Mbaye, B. C., Montes, I., Naqvi, W., Pearlman, J., Pinto, E., Pitcher, G., Pizarro, O., Rose, K., Shenoy, D., Van der Plas, A., Vito, M. R., and Weng, K.: Multidisciplinary Observing in the World Ocean's Oxygen Minimum Zone Regions: From Climate to Fish – The VOICE Initiative, Frontiers in Marine Science, 6, 2296–7745, https://doi.org/10.3389/fmars.2019.00722, 2019.
Gnanadesikan, A., Dunne, J. P., and John, J.: Understanding why the volume of suboxic waters does not increase over centuries of global warming in an Earth System Model, Biogeosciences, 9, 1159–1172, https://doi.org/10.5194/bg-9-1159-2012, 2012.
Hansell, D. A.: Recalcitrant dissolved organic carbon fractions, Annu. Rev. Mar. Sci., 5, 421–445, 2013.
Johnson, K. S., Gordon, R. M., and Coale, K. H.: What controls dissolved iron concentrations in the world ocean?, Mar. Chem., 57, 137–161, 1997.
Kalvelage, T., Lavik, G., Lam, P., Contreras, S., Arteaga, L., Löscher, C. R., Oschlies, A., Paulmier, A., Stramma, L., and Kuypers, M. M. M.: Nitrogen cycling driven by organic matter export in the South Pacific oxygen minimum zone, Nat. Geosci., 6, 228–234, 2013.
Kalvelage, T., Lavik, G., Jensen, M. M., Revsbech, N. P., Loscher, C., Schunck, H., Desai, D. K., Hauss, H., Kiko, R., Holtappels, M., LaRoche, J., Schmitz, R. A., Graco, M. I., and Kuypers, M. M.: Aerobic microbial respiration In oceanic oxygen minimum zones, PloS One, 10, e0133526, https://doi.org/10.1371/journal.pone.0133526, 2015.
Karstensen, J., Stramma, L., and Visbeck, M.: Oxygen minimum zones in the eastern tropical Atlantic and Pacific oceans, Prog. Oceanogr., 77, 331–350, 2008.
Kiko, R., Biastoch, A., Brandt, P., Cravatte, S., Hauss, H., Hummels, R., Kriest, I., Marin, F., McDonnell, A. M. P., Oschlies, A., Picheral, M., Schwarzkopf, F. U., Thurnherr, A. M., and Stemmann, L.: Biological and physical influences on marine snowfall at the equator, Nat. Geosci., 10, 852–858, 2017.
Kuntz, L. B. and Schrag, D. P.: Hemispheric asymmetry in the ventilated thermocline of the Tropical Pacific, J. Climate, 31, 1281–1288, 2018.
Le Quéré, C., Takahashi, T., Buitenhuis, E. T., Rödenbeck, C., and Sutherland, S. C.: Impact of climate change and variability on the global oceanic sink of CO2, Global Biogeochem. Cy., 24, GB4007, https://doi.org/10.1029/2009GB003599, 2010.
Levin, L. A.: Manifestation, Drivers, and Emergence of Open Ocean Deoxygenation, Annu. Rev. Mar. Sci., 10, 229–260, 2018.
Libby, P. S. and Wheeler, P. A.: Particulate and dissolved organic nitrogen in the central and eastern equatorial Pacific, Deep-Sea Res. Pt. I, 44, 345–361, 1997.
Llanillo, P. J., Pelegri, J. L., Talley, L. D., Pena-Izquierdo, J., and Cordero, R. R.: Oxygen Pathways and Budget for the Eastern South Pacific Oxygen Minimum Zone, J. Geophys. Res.-Oceans, 123, 1722–1744, 2018.
McKinley, G. A., Pilcher, D. J., Fay, A. R., Lindsay, K., Long, M. C., and Lovenduski, N. S.: Timescales for detection of trends in the ocean carbon sink, Nature, 530, 469–472, 2016.
Montes, I., Dewitte, B., Gutknecht, E., Paulmier, A., Dadou, I., Oschlies, A., and Garcon, V.: High-resolutionmodeling of the Eastern Tropical Pacific oxygen minimum zone: Sensitivity to the tropical oceanic circulation, J. Geophys. Res.-Oceans, 119, 5515–5532, 2014.
Moreno, A. R., Garcia, C. A., Larkin, A. A., Lee, J. A., Wang, W. L., Moore, J. K., Primeaub, F. W., and Martiny, A. C.: Latitudinal gradient in the respiration quotient and the implications for ocean oxygen availability, P. Natl. Acad. Sci. USA, 117, 22866–22872, https://doi.org/10.1073/pnas.2004986117, 2020.
Murtugudde, R., Seager, R., and Busalacchi, A.: Simulation of the tropical oceans with an ocean GCM coupled to an atmospheric mixed-layer model, J. Climate, 9, 1795–1815, 1996.
Niemeyer, D., Kriest, I., and Oschlies, A.: The effect of marine aggregate parameterisations on nutrients and oxygen minimum zones in a global biogeochemical model, Biogeosciences, 16, 3095–3111, https://doi.org/10.5194/bg-16-3095-2019, 2019.
Oschlies, A., Brandt, P., Stramma, L., and Schmidtko, S.: Drivers and mechanisms of ocean deoxygenation, Nat. Geosci., 11, 467–473, 2018.
Oschlies, A., Koeve, W., Landolfi, A., and Kahler, P.: Loss of fixed nitrogen causes net oxygen gain in a warmer future ocean, Nat. Commun., 10, 2805, https://doi.org/10.1038/s41467-019-10813-w, 2019.
Paulmier, A. and Ruiz-Pino, D.: Oxygen minimum zones (OMZs) in the modern ocean, Prog. Oceanogr., 80, 113–128, 2009.
Pavia, F. J., Anderson, R. F., Lam, P. J., Cael, B. B., Vivancos, S. M., Fleisher, M. Q., Lu, Y., Zhang, P., Cheng, H., and Edwards, R. L.: Shallow particulate organic carbon regeneration in the South Pacific Ocean, P. Natl. Acad. Sci. USA, 116, 9753–9758, 2019.
Raimbault, P., Slawyk, G., Boudjellal, B., Coatanoan, C., Conan, P., Coste, B., Garcia, N., Moutin, T., and Pujo-Pay, M.: Carbon and nitrogen uptake and export in the equatorial Pacific at 150∘ W: Evidence of an efficient regenerated production cycle, J. Geophys. Res.-Oceans, 104, 3341–3356, 1999.
Ridder, N. N. and England, M. H.: Sensitivity of ocean oxygenation to variations in tropical zonal wind stress magnitude, Global Biogeochem. Cy., 28, 909–926, 2014.
Schmidtko, S., Stramma, L., and Visbeck, M.: Decline in global oceanic oxygen content during the past five decades, Nature, 542, 335–339, 2017.
Shigemitsu, M., Yamamoto, A., Oka, A., and Yamanaka, Y.: One possible uncertainty in CMIP5 projections of low-oxygen water volume in the Eastern Tropical Pacifi, Geophys. Res. Lett., 31, 804–820, 2017.
Stramma, L., Johnson, G. C., Sprintall, J., and Mohrholz, V.: Expanding oxygen-minimum zones in the tropical oceans, Science, 320, 655–658, 2008.
Stramma, L., Johnson, G. C., Firing, E., and Schmidtko, S.: Eastern Pacific oxygen minimum zones: Supply paths and multidecadal changes, J. Geophys. Res.-Oceans, 115, C0901, https://doi.org/10.1029/2009jc005976, 2010.
Stramma, L., Oschlies, A., and Schmidtko, S.: Mismatch between observed and modeled trends in dissolved upper-ocean oxygen over the last 50 yr, Biogeosciences, 9, 4045–4057, https://doi.org/10.5194/bg-9-4045-2012, 2012.
Sun, X., Frey, C., Garcia-Robledo, E., Jayakumar, A., and Ward, B. B.: Microbial niche differentiation explains nitrite oxidation in marine oxygen minimum zones, ISME J., 15, 1317–1329, 2021.
Takahashi, T., Sutherland, S. C., Wanninkhof, R., Sweeney, C., Feely, R. A., Chipman, D. W., Hales, B., Friederich, G., Chavez, F., Sabine, C., Watson, A., Bakker, D. C. E., Schuster, U., Metzl, N., Yoshikawa-Inoue, H., Ishii, M., Midorikawa, T., Nojiri, Y., Körtzinger, A., Steinhoff, T., Hoppema, M., Olafsson, J., Arnarson, T. S., Tilbrook, B., Johannessen, T., Olsen, A., Bellerby, R., Wong, C. S., Delille, B., Bates, N. R., and de Baar, H. J. W.: Climatological mean and decadal change in surface ocean pCO2, and net sea–air CO2 flux over the global oceans, Deep-Sea Res. Pt. II, 56, 554–577, 2009.
Talley, L. D., Feely, R. A., Sloyan, B. M., Wanninkhof, R., Baringer, M. O., Bullister, J. L., Carlson, C. A., Doney, S. C., Fine, R. A., Firing, E., Gruber, N., Hansell, D. A., Ishii, M., Johnson, G. C., Katsumata, K., Key, R. M., Kramp, M., Langdon, C., Macdonald, A. M., Mathis, J. T., McDonagh, E. L., Mecking, S., Millero, F. J., Mordy, C. W., Nakano, T., Sabine, C. L., Smethie, W. M., Swift, J. H., Tanhua, T., Thurnherr, A. M., Warner, M. J., and Zhang, J. Z.: Changes in ocean heat, carbon content, and ventilation: a review of the first decade of go-ship global repeat hydrography, Annu. Rev. Mar. Sci., 8, 185–215, 2016.
Tanioka, T. and Matsumoto, K.: Stability of Marine Organic Matter Respiration Stoichiometry, Geophys. Res. Lett., 47, e2019GL085564, https://doi.org/10.1029/2019gl085564, 2020.
Van Mooy, B. A. S., Keil, R. G., and Devol, A. H.: Impact of suboxia on sinking particulate organic carbon: Enhanced carbon flux and preferential degradation of amino acids via denitrificatio, Geochim. Cosmochim. Ac., 66, 457–465, 2002.
Wang, X. J., Le Borgne, R., Murtugudde, R., Busalacchi, A. J., and Behrenfeld, M.: Spatial and temporal variations in dissolved and particulate organic nitrogen in the equatorial Pacific: biological and physical influences, Biogeosciences, 5, 1705–1721, https://doi.org/10.5194/bg-5-1705-2008, 2008.
Wang, X. J., Behrenfeld, M., Le Borgne, R., Murtugudde, R., and Boss, E.: Regulation of phytoplankton carbon to chlorophyll ratio by light, nutrients and temperature in the Equatorial Pacific Ocean: a basin-scale model, Biogeosciences, 6, 391–404, https://doi.org/10.5194/bg-6-391-2009, 2009a.
Wang, X. J., Murtugudde, R., and Le Borgne, R.: Nitrogen uptake and regeneration pathways in the equatorial Pacific: a basin scale modeling study, Biogeosciences, 6, 2647–2660, https://doi.org/10.5194/bg-6-2647-2009, 2009b.
Wang, X. J., Murtugudde, R., Hackert, E., Wang, J., and Beauchamp, J.: Seasonal to decadal variations of sea surface pCO2 and sea-air CO2 flux in the equatorial oceans over 1984–2013: A basin-scale comparison of the Pacific and Atlantic Oceans, Global Biogeochem. Cy., 29, 597–609, 2015.
Wang, W. L., Moore, J. K., Martiny, A. C., and Primeau, F. W.: Convergent estimates of marine nitrogen fixation, Nature, 566, 205–211, 2019.
Wang, K., Wang, X., Murtugudde, R., Zhang, D., and Zhang, R.-H.: Sensitivity of asymmetric Oxygen Minimum Zones to mixing intensity and stoichiometry in the tropical Pacific using a basin-scale model (OGCM-DMEC V1.4) (V1.4), Zenodo [code], https://doi.org/10.5281/zenodo.5148146, 2021.
Wanninkhof, R.: Relationship between wind speed and gas exchange over the Ocean, J. Geophys. Res.-Oceans, 97, 7373–7382, 1992.
Ward, B. A., Wilson, J. D., Death, R. M., Monteiro, F. M., Yool, A., and Ridgwell, A.: EcoGEnIE 1.0: plankton ecology in the cGEnIE Earth system model, Geosci. Model Dev., 11, 4241–4267, https://doi.org/10.5194/gmd-11-4241-2018, 2018.
Weiss, R. F.: The solubility of nitrogen, oxygen and argon in water and seawater, Deep-Sea Res., 17, 721–735, 1970.
Williams, J. H. T., Totterdell, I. J., Halloran, P. R., and Valdes, P. J.: Numerical simulations of oceanic oxygen cycling in the FAMOUS Earth-System model: FAMOUS-ES, version 1.0, Geosci. Model Dev., 7, 1419–1431, https://doi.org/10.5194/gmd-7-1419-2014, 2014.
Wright, J. J., Konwar, K. M., and Hallam, S. J.: Microbial ecology of expanding oxygen minimum zones, Nat. Rev. Microbiol., 10, 381–394, 2012.
Yu, J., Wang, X., Murtugudde, R., Tian, F., and Zhang, R. H.: Interannual – to – Decadal Variations of Particulate Organic Carbon and the Contribution of Phytoplankton in the Tropical Pacific During 1981–2016: A Model Study, J. Geophys. Res.-Oceans, 126, e2020JC016515, https://doi.org/10.1029/2020jc016515, 2021.
Zakem, E. J. and Levine, N. M.: Systematic Variation in Marine Dissolved Organic Matter Stoichiometry and Remineralization Ratios as a Function of Lability, Global Biogeochem. Cy., 33, 1389–1407, 2019.
- Abstract
- Introduction
- Model description
- Model experiments
- Model results and discussions
- Conclusion
- Appendix A: Model biogeochemical equations
- Appendix B
- Appendix C
- Code and data availability
- Author contributions
- Competing interests
- Disclaimer
- Acknowledgements
- Financial support
- Review statement
- References
- Supplement