the Creative Commons Attribution 4.0 License.
the Creative Commons Attribution 4.0 License.
 | 25 Oct 2021
Mineral dust cycle in the Multiscale Online Nonhydrostatic AtmospheRe CHemistry model (MONARCH) Version 2.0
Oriol Jorba
María Gonçalves Ageitos
Jeronimo Escribano
Matthew L. Dawson
Vincenzo Obiso
Enza Di Tomaso
Sara Basart
Gilbert Montané Pinto
Francesca Macchia
Paul Ginoux
Juan Guerschman
Catherine Prigent
Yue Huang
Jasper F. Kok
Ron L. Miller
Carlos Pérez García-Pando
We present the dust module in the Multiscale Online Non-hydrostatic AtmospheRe CHemistry model (MONARCH) version 2.0, a chemical weather prediction system that can be used for regional and global modeling at a range of resolutions. The representations of dust processes in MONARCH were upgraded with a focus on dust emission (emission parameterizations, entrainment thresholds, considerations of soil moisture and surface cover), lower boundary conditions (roughness, potential dust sources), and dust–radiation interactions. MONARCH now allows modeling of global and regional mineral dust cycles using fundamentally different paradigms, ranging from strongly simplified to physics-based parameterizations. We present a detailed description of these updates along with four global benchmark simulations, which use conceptually different dust emission parameterizations, and we evaluate the simulations against observations of dust optical depth. We determine key dust parameters, such as global annual emission/deposition flux, dust loading, dust optical depth, mass-extinction efficiency, single-scattering albedo, and direct radiative effects. For dust-particle diameters up to 20 µm, the total annual dust emission and deposition fluxes obtained with our four experiments range between about 3500 and 6000 Tg, which largely depend upon differences in the emitted size distribution. Considering ellipsoidal particle shapes and dust refractive indices that account for size-resolved mineralogy, we estimate the global total (longwave and shortwave) dust direct radiative effect (DRE) at the surface to range between about −0.90 and −0.63 W m−2 and at the top of the atmosphere between −0.20 and −0.28 W m−2. Our evaluation demonstrates that MONARCH is able to reproduce key features of the spatiotemporal variability of the global dust cycle with important and insightful differences between the different configurations.
- Article
(15121 KB) - Full-text XML
- BibTeX
- EndNote


The Multiscale Online Non-hydrostatic AtmospheRe CHemistry model (MONARCH) is a chemical weather modeling system that can be used at multiple spatial scales, ranging from regional scales at single-digit kilometer resolutions with explicit convection to coarse-resolution global scales with parameterized convection (Pérez et al., 2011; Badia et al., 2017). MONARCH is continuously developed at the Barcelona Supercomputing Center (BSC) with a focus on mineral dust and other aerosols (Pérez et al., 2011; Haustein et al., 2012; Spada et al., 2013; Spada, 2015), atmospheric chemistry (Jorba et al., 2012; Badia and Jorba, 2015; Badia et al., 2017), emissions (HERMES, Guevara et al., 2019), data assimilation (Di Tomaso et al., 2017), workflow management (Manubens-Gil et al., 2016), evaluation (Binietoglou et al., 2015; Ansmann et al., 2017), and operational forecasting (Basart et al., 2019; Xian et al., 2019). Daily dust forecasts using MONARCH are produced at the BSC and made available through the Barcelona Dust Forecast Center (a WMO regional specialized meteorological center with activity specialization on atmospheric sand and dust forecasts; https://dust.aemet.es/, last access: 8 October 2021), the WMO SDS-WAS Regional Center for Northern Africa–Middle East–Europe (NA-ME-E) (https://sds-was.aemet.es/, last access: 8 October 2021), and the International Cooperative for Aerosol Prediction (ICAP) (Sessions et al., 2015; Xian et al., 2019). Here, we present recent developments on the representation of mineral dust processes in MONARCH.
Mineral soil dust is the most abundant aerosol type in terms of global mass, competing only with sea salt (Textor et al., 2006). Global dust emissions are estimated to range between 3300 and 9000 Tg yr−1 for particles smaller than 20 µm in diameter (Kok et al., 2021a). Soil dust is mainly emitted from arid and semi-arid regions, e.g., in Africa, the Middle East, central and northeastern Asia, India, Australia, Patagonia, and the southwestern United States, but it can in principle be emitted from any uncovered dry soil surface under windy conditions, e.g., from agricultural fields (Ginoux et al., 2012).
Mineral dust is emitted as soon as the forces that act to retain the soil particles at the surface (gravity and interparticle cohesion) are overcome either by atmospheric lifting forces generated by wind and turbulence (aerodynamic entrainment) or by the force generated by other impacting particles, i.e., sand grains or particle aggregates (saltation bombardment/aggregate disintegration) (Shao, 2008). Typically, soil particles in the silt and clay particle-size range (diameter <63 µm; Udden, 1914; Wentworth, 1922) are considered dust, whereas larger particles are referred to as sand. Soil particles in the size range 70–100 µm can typically be lifted most easily (Iversen and White, 1982; Shao and Lu, 2000). For larger diameters, the particle weight is the predominant inhibitor. For smaller particles, interparticle cohesion becomes more significant but likely exhibits stochastic behavior leaving a fraction of particles with substantially below-average cohesive forces (Shao and Klose, 2016). Particles with diameters of around 70 µm and larger are mainly transported in ballistic trajectories along the surface (saltation). The limit at which saltation is initiated, i.e., when the particle retarding forces are exceeded by the aerodynamic lifting forces, is expressed as a threshold friction velocity, u*t [ms−1]. Saltation bombardment is typically most efficient at generating dust emission (e.g., Shao et al., 1993; Houser and Nickling, 2001). Aerodynamic dust entrainment is typically less efficient because of on-average higher cohesive forces for dust-sized particles compared to sand (or saltation) particles but can be significant under favorable atmospheric conditions and on long timescales, provided there is a sufficient supply of loose dust particles at the surface (e.g., Loosmore and Hunt, 2000; Macpherson et al., 2008; Chkhetiani et al., 2012; Klose and Shao, 2013; Li et al., 2014; Zhang et al., 2016).
Once airborne, mineral dust particles interact with short- and longwave radiation through scattering and absorption (Boucher et al., 2013; Miller et al., 2014), which has important direct effects on the Earth's energy balance (Kok et al., 2018; Li et al., 2020). Dust particles are known to be efficient ice nuclei and can also act as cloud condensation nuclei (DeMott et al., 2003; Karydis et al., 2011; Cziczo et al., 2013; Kiselev et al., 2017). Nutrients transported with dust can create ecosystem responses due to, e.g., carbon uptake and storage (Jickells et al., 2005; Rizzolo et al., 2017; Kanakidou et al., 2018). Dust can cause respiratory and cardiovascular diseases (Meng and Lu, 2007), and can contribute to other ailments like meningitis (Pérez García-Pando et al., 2014) and valley fever (Tong et al., 2017). To study and quantify dust and its impacts, models that include advanced dust representations, such as MONARCH, are key tools.
Ferrier et al. (2002)Thompson et al. (2008)Hong and Lim (2006)Iacono et al. (2008)Fels and Schwarzkopf (1975)Janjic (1994, 1996b)Ek et al. (2003)Vukovic et al. (2010)Janjic (1996a, 2001)Hong and Pan (1996)Betts (1986); Betts and Miller (1986); Janjic (1994, 2000)Han and Pan (2011)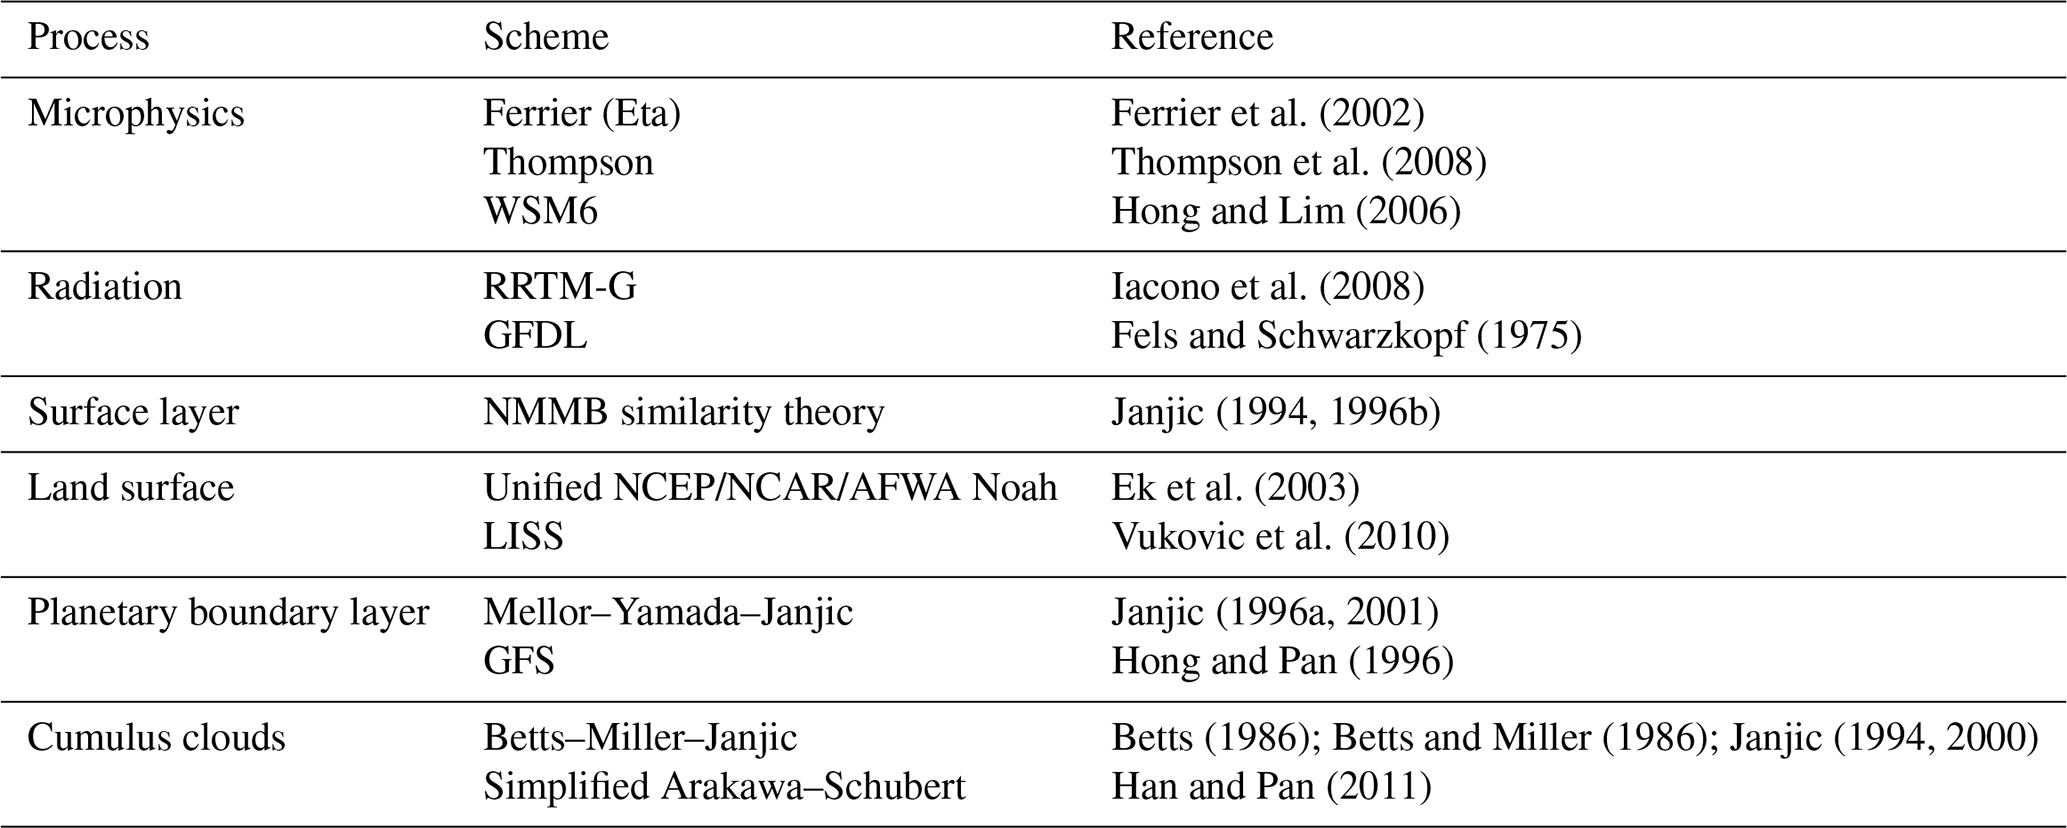
Existing dust emission parameterizations range from formulations that are strongly simplified (e.g., Ginoux et al., 2001) to those that aim to represent the physics of the emission processes (Shao, 2004; Klose et al., 2014; Kok et al., 2014b). The more simplified dust emission schemes are typically constrained by “preferential” source scaling functions and are commonly used in global but also in regional models. Such constraints have significantly improved the skill of models by approximately locating and enhancing dust emissions from prolific large-scale natural sources. However, these schemes are not very sensitive to changes in parameters known to affect dust emission (e.g., soil texture, soil moisture, land-surface properties), which at the same time can make models insensitive to changes in climate. In contrast, physics-based dust emission parameterizations are very sensitive to such changes but need more detailed input. This detailed input has traditionally been difficult to observe and/or estimate, in particular globally, and errors in the description of, for example, surface properties, translate non-linearly into errors in emitted and transported dust. How such errors compare with those arising when neglecting dust emission sensitivities entirely remains a subject of research and discussion. Modeling the dust cycle for past (e.g., mid-Holocene, Last Glacial Maximum, rapid transitions) or future periods requires balancing a sensitive parameterization with input data that are more uncertain than for the present day. All in all, a clear benefit of physics-based schemes with detailed sensitivities is that input data sets can easily be updated as more data become available and hence future improvements are more likely, in particular for climate applications.
In this work, we introduce recent advancements in the treatment of mineral dust in MONARCH. The model now has diverse available model configurations, in particular to estimate dust emission, which makes MONARCH unique among state-of-the-art models, and which makes it suitable for a variety of applications that range from process studies to operational forecasting and climate research. In the following sections, we briefly present the MONARCH modeling system and subsequently focus on the mineral dust cycle. We then demonstrate and evaluate MONARCH's dust modeling capabilities based on four annual global model runs.
Marticorena and Bergametti (1995)Ginoux et al. (2001, modified)Shao (2001)Shao (2004)Shao et al. (2011)Kok et al. (2014b)Table 2Summary of the six available dust emission schemes in MONARCH.

MONARCH (previously known as NMMB/BSC-CTM) consists of advanced chemistry and aerosol packages coupled online with the Non-hydrostatic Multiscale Model on the B-grid (NMMB) (Janjic et al., 2001; Janjic and Gall, 2012), whose nonhydrostatic dynamical core allows running both global and regional simulations with embedded telescoping nests. The global model works on a latitude–longitude grid with polar filtering and the regional model on a rotated longitude–latitude grid. In both cases, the Arakawa B grid and the hybrid pressure–sigma coordinate are used in the horizontal and vertical directions, respectively. The numerical schemes follow the principles described in Janjic (1977, 1979, 1984, 2003). The NMMB can be configured with a combination of different physics schemes (see Table 1). The configuration commonly used in production runs and in this work is as follows. Turbulence in the planetary boundary layer and the free troposphere is resolved using the Mellor–Yamada–Janjic (MYJ) level 2.5 turbulence closure scheme (Janjic, 2001). The surface layer scheme combines Monin–Obukhov similarity theory (Monin and Obukhov, 1954) with a viscous sublayer introduced over land and water (Zilitinkevich, 1965; Janjic, 1994, 1996b). The shortwave and longwave radiation fluxes are computed using the Rapid Radiative Transfer Model for general circulation models (GCMs) (RRTM-G) radiation package (Iacono et al., 2008). The model includes the Ferrier scheme for grid-scale cloud microphysics (Ferrier et al., 2002), and the Betts–Miller–Janjic convective adjustment scheme (Betts, 1986; Betts and Miller, 1986; Janjic, 1994, 2000). The Unified NCEP/NCAR/AFWA Noah (Ek et al., 2003) land surface model is used for the computation of heat and moisture surface fluxes.
The gas-phase chemistry in MONARCH solves the Carbon Bond 2005 chemical mechanism (CB05; Yarwood et al., 2005) extended with toluene and chlorine chemistry. The CB05 is well formulated for urban to remote tropospheric conditions, and it considers 51 chemical species and solves 156 reactions. The photolysis rates are computed with the Fast-J scheme (Wild et al., 2000) considering the physics of each model layer (e.g., aerosols, clouds, absorbers such as ozone). The aerosol module in MONARCH describes the life cycle of dust, sea salt, black carbon, organic matter (both primary and secondary), sulfate, and nitrate aerosols (Spada, 2015). While a sectional approach is used for dust and sea salt, a bulk description of the other aerosol species is currently adopted (Spada, 2015). A simplified gas–aqueous–aerosol mechanism has been introduced in the module to account for the sulfur chemistry, the production of secondary nitrate–ammonium aerosol is solved using the thermodynamic equilibrium model EQSAM (Metzger et al., 2002), and a two-product scheme is used for the formation of secondary organic aerosols from gas-phase precursors. Different meteorology-driven emissions are computed online in MONARCH (i.e., mineral dust, sea salt, and biogenic gas species). Sea salt emissions can be calculated with a wide range of available source functions (Spada et al., 2013), while the biogenic emissions are estimated with the Model of Emissions of Gases and Aerosols from Nature (MEGAN) v2.04 model (Guenther et al., 2006).
In addition to single model runs, MONARCH can be run in an ensemble mode for data assimilation applications, where the ensemble of model states is used to derive a flow-dependent background error covariance at the assimilation time, which evolves during the model forecast. The background error covariance is used to express model uncertainty within the data assimilation framework. Model uncertainty, together with observational uncertainty, is a key ingredient in the optimal integration of model simulations and observations for the production of an analysis that best represents the atmospheric state. The MONARCH ensemble is coupled with the local ensemble transform Kalman filter (LETKF) scheme (Hunt et al., 2007; Miyoshi and Yamane, 2007; Schutgens et al., 2010) for the estimation of dust analyses (Di Tomaso et al., 2017), as well as for the generation of dust reanalyses currently in production at the BSC (Di Tomaso et al., 2021).
The dust module in MONARCH (previously known as NMMB/BSC-Dust), initially described by Pérez et al. (2011), solves the mass balance equation for dust taking into account the following processes:
-
dust generation and uplift by surface wind and turbulence,
-
horizontal and vertical advection,
-
horizontal diffusion and vertical transport by turbulence and convection,
-
dry deposition and gravitational settling, and
-
wet removal by convective and stratiform clouds.
The dust size distribution is represented with eight bins ranging up to 20 µm in diameter: 0.2–0.36, 0.36–0.6, 0.6–1.2, 1.2–2.0, 2.0–3.6, 3.6–6.0, 6.0–12.0, and 12.0–20.0 µm. The effective and volume radii of each bin in the radiative and sedimentation schemes, respectively (see Sect. 3.3, Table 6) are time invariant and based on a lognormal distribution with mass median diameter of 2.524 µm and geometric standard deviation of 2 (Schulz et al., 1998; Zender et al., 2003).
Our new developments presented below have mostly focused on aspect (1): dust generation and uplift by surface wind and turbulence. In particular, we have implemented and tested a variety of dust emission and drag partition parameterizations, along with new data sets for dust source areas, source type (i.e., natural and anthropogenic), surface roughness, and vegetation. Additional upgrades include the option to calculate dust extinction assuming non-spherical particle shape, as well as new diagnostic capabilities (output of three-dimensional single-scattering albedo and extinction, clear-sky aerosol optical depth (clear-sky AOD), and AOD at satellite overpass times). In the following, we present the MONARCH dust module. We first describe the treatment of dust emission, summarizing previous and detailing new developments. Then, we recapitulate the implementation of dust transport and deposition, and interactions with radiation.
3.1 Dust emission and lower boundary conditions
Several different parameterizations of dust emission are available in MONARCH, which cover different paradigms and range from more simplified to more physics-based descriptions. To describe dust emission generated by saltation, MONARCH includes the parameterizations from Marticorena and Bergametti (1995) (MB95), Ginoux et al. (2001) with modifications detailed below (G01), Shao (2001, 2004) (S01, S04), Shao et al. (2011, Eq. 34) (S11), and Kok et al. (2014b) (K14). Including such a large number of dust emission schemes in MONARCH gives us the unique opportunity to directly compare them in the exact same framework (e.g., meteorology, land-surface conditions) of a global model. As by nature none of the schemes can predict dust emission perfectly, discrepancies between results obtained with the different schemes can in comparison with observations provide insights into aspects of parameterizing dust emission, which are particularly uncertain (or not) and which may need more attention in future research. The six available dust emission schemes in MONARCH are summarized in Table 2.
Table 3Coefficients for minimally dispersed particle-size distributions as assigned to the 12 USGS soil texture classes. Each particle-size distribution (PSD) is composed of four lognormal distributions (p1, p2, p3, and p4). Coefficients are taken from Klose (2014), Table 3 (and references therein), unless otherwise indicated.
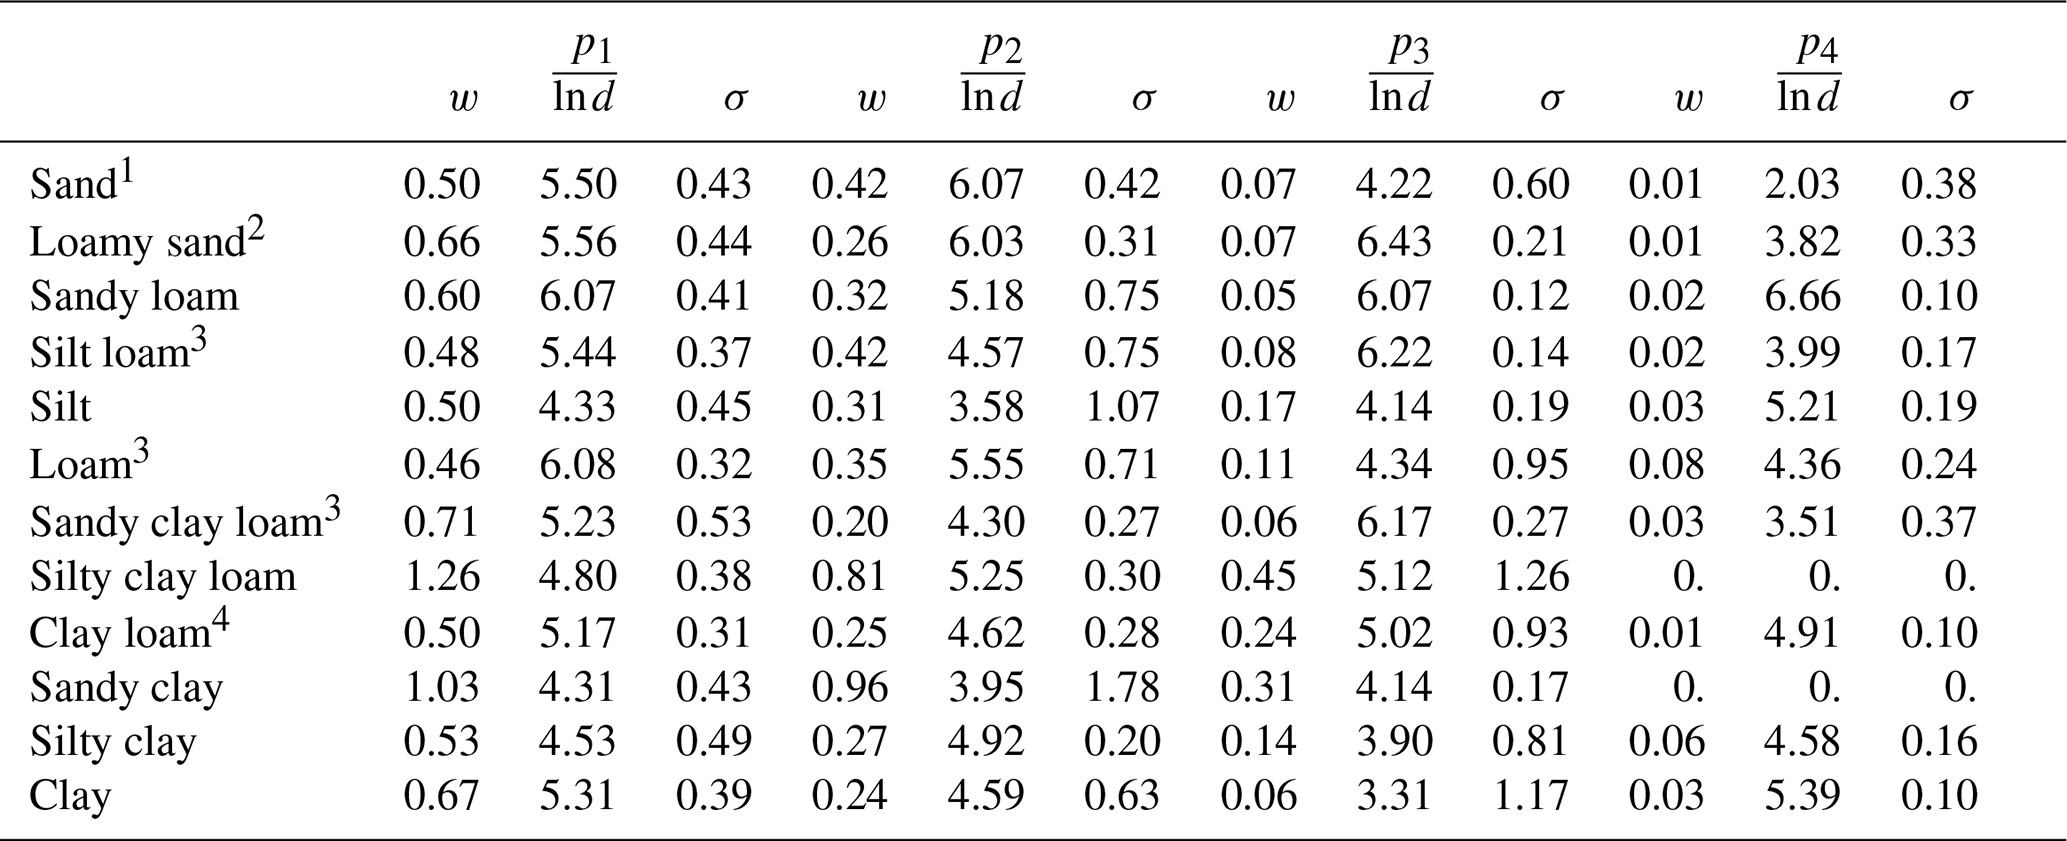
1 Coefficients for samples from Site D in Klose et al. (2019) (PSDLEM).
2 Coefficients from Table 3 of Klose et al. (2019) (PSDLEM).
3 Different sample used as reference than in Table 6.1 of Klose (2014) but same underlying data set.
4 Sandy clay loam in Table 6.1 of Klose (2014).
Table 4Summary of available options in MONARCH to account for soil moisture in the particle entrainment threshold.
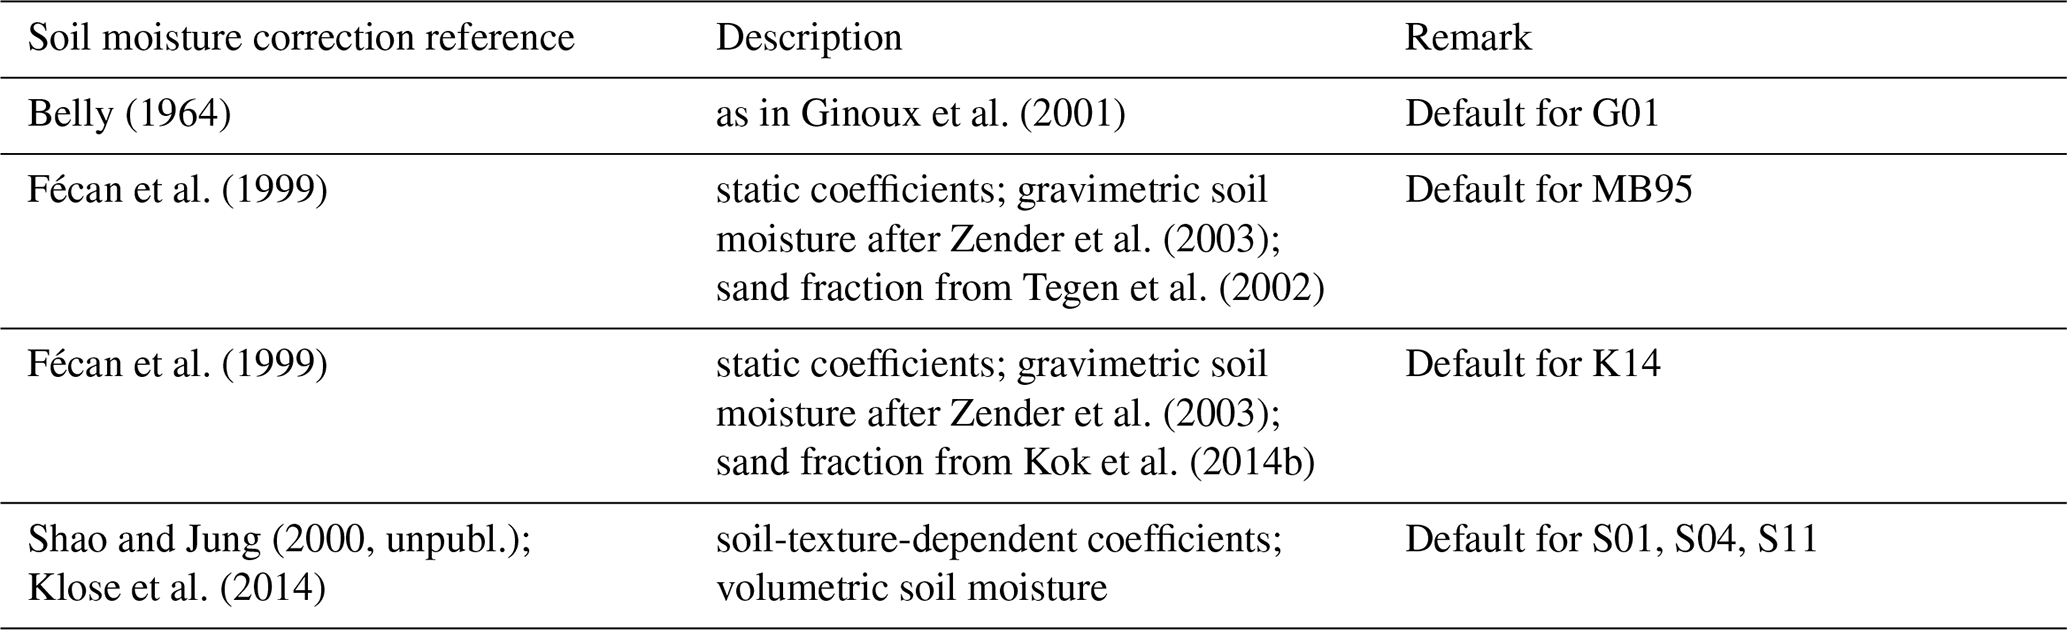
Table 5Summary of available options in MONARCH to account for surface roughness in particle entrainment.
3.1.1 Dust emission flux
In saltation-based dust emission schemes, the vertical dust emission flux F depends on the horizontal flux of saltating soil particles or particle aggregates. In the MB95 scheme, F is directly proportional to the total streamwise saltation flux Q,
In MONARCH, the vertical-to-horizontal-flux ratio αq can either depend on the clay content of the parent soil as originally proposed in Marticorena and Bergametti (1995) or on the soil texture as proposed in Tegen et al. (2002) and described in Pérez et al. (2011). In the latter case, which is the default in MONARCH, αq is determined as a mass-weighted average of the vertical-to-horizontal-flux ratios of four soil particle-size classes with mean diameters 2, 15, 160, and 710 µm. S is a globally variable dust source scaling function, which was not part of the original formulation in Marticorena and Bergametti (1995), but which is introduced here as it was found to lead to improved results (Pérez et al., 2011, see also Sect. 3.1.6). The dust emission flux resulting from Eq. (1) is a bulk flux, which we distribute across particle sizes using a predefined particle-size distribution (Sect. 3.1.5).
The G01 dust emission scheme does not include an explicit formulation of Q. It seeks to avoid the need for detailed descriptions of soil characteristics and instead introduces a topography-based dust source function, S, representing the availability of sediment. The dust emission flux is originally obtained as
where CG01 is a dimensional factor, sbare is the bare soil fraction (see Sect. 3.1.4), u10m is the 10 m wind speed, and ut is a threshold wind speed below which no dust emission occurs (Sect. 3.1.3). Note that sbare was included in S in the original formulation. We apply sbare to all schemes in MONARCH. The bulk dust emission flux F is distributed across particle-size classes using predefined fractions sp (Sect. 3.1.5). To ease comparison with other schemes, we also implemented a modified version of the G01 scheme, which estimates F using friction velocity and threshold friction velocity, u* and u*t (G01-UST), instead of u10m and ut (G01-U), such that
In both implementations, G01-U and G01-UST, we introduced additional modifications on, respectively, ut and u*t, and on sp as described in Sect. 3.1.3 and 3.1.5.
The S01 scheme is a physics-based dust emission scheme, which calculates size-resolved dust emission based on the soil volume removed by impacting saltation particles and explicitly considers aggregate disintegration as a dust emission process in addition to saltation bombardment. The emission of dust particles of size di by saltation particles of size ds is given by (Shao, 2001, Eq. 52)
with
where cy and κ are coefficients, ηfi, ηci, and ηmi are the total, aggregated, and free dust fractions at diameter di, , Qs the saltation flux of particles with diameter ds, the mass of a spherical particle with diameter ds assuming a density of ρps=2650 kg m−3, ρb≈1000 kg m−3 the soil bulk density, g gravitational acceleration, and Ω the soil volume removed by a saltating particle of size ds (Lu and Shao, 1999, Eq. 8). The removed soil mass is given by mΩ=ρbΩ. The bare soil fraction sbare was added here for implementation in MONARCH. The dust fractions ηfi, ηci, and ηmi can be estimated from the minimally and fully dispersed particle-size distributions (PSDs), pm(di) and pf(di), as and , where di0 and di1 are the lower and upper limits of the particle-size bin corresponding to di. The aggregated dust fraction follows as . The γ function (Eq. 5) and therein the parameter κ determine how easily a soil is disaggregated (Shao et al., 2011; Klose et al., 2019, see also Sect. 3.1.2). Here, we use κ=1 globally. A spatially variable, for example, soil-texture-dependent κ, could be easily implemented, if future investigations support such a dependency. The emission flux of dust particles with diameter di, i.e., for all saltation particle sizes, is obtained as
with dmax=20 µm in MONARCH.
The S04 scheme is a simplification of the S01 scheme in which the saltation bombardment efficiency, , is approximated as (Shao, 2004, Eq. 11)
with soil plastic pressure P. The larger u*, the more soil mass is ejected by a saltation particle impact for a given soil. The dust emission flux is given by (Shao, 2004, Eq. 6)
and F(di) follows from Eq. (4) assuming ηfi≈ηci. Based on a detailed comparison with field measurements, a basic version of the scheme (denoted here as S11) was suggested by Shao et al. (2011, Eq. 34), which makes use of the total (instead of size-resolved) saltation flux:
Shao et al. (2011) note, however, that this simplification may be specific to the experimental data set, which had a narrow soil PSD.
The K14 dust emission scheme uses the concept of the fragmentation of brittle material (Kolmogorov, 1941; Åström, 2006). It is also a physics-based dust emission scheme that includes a dynamical dependency of soil erodibility on threshold friction velocity. Although the kinetic energy supplied by saltating particles is taken into account in the scheme, it does not include Q explicitly. The K14 dust emission flux is given as
where fclay is the clay fraction (from STATSGO-FAO inventory; see Sect. 3.1.6), ρa is air density, with ρa0=1.225 kg m−3 is a standardized threshold friction velocity, Cα is a constant coefficient, and Ce is a u*st-dependent coefficient representing soil erodibility.
3.1.2 Saltation flux
For the schemes that contain explicit representations of the saltation flux (MB95, S01, S04, S11), the saltation flux of particles with diameter ds, Qs, is calculated following Kawamura (1964) (same as White, 1979) as
where cQ is a coefficient, u*t(ds) the threshold friction velocity for particles with diameter ds, and u* the friction velocity for the bare surface. In Eq. (12), the saltation of particles of different sizes is treated independently. For a soil that consists of a mixture of different sized loose particles of sufficient availability, particle impacts can cause saltation in a wider size range than it would be expected based on u*t(ds) (Ungar and Haff, 1987; Martin and Kok, 2019). In the MB95 implementation, the total saltation flux Q is used and obtained as a weighted average taking into account the relative surface area of particles in four size classes (see Sect. 3.1.1 for mean diameters) as a function of soil texture (Pérez et al., 2011, Eq. 2). The S11 scheme is also based on the total saltation flux but takes a different approach and obtains Q by weighting Qs with the particle-size distribution estimated for airborne sediment, ps(ds), as
The γ function (Eq. 5) determines how rapidly ps approaches pf with increasing u*, i.e., how easily soil aggregates are disintegrated (Shao et al., 2011; Klose et al., 2019). Both pm and pf are estimated for each soil texture class as a combination of up to four lognormal distributions. The coefficients used for those distributions are given in Table 3. PSDs are calculated with 60 size bins distributed logarithmically using a quarter-φ scale (Krumbein, 1934, 1938) with reference diameter 2000 µm. The S01 and S04 schemes directly use the spectral, i.e., size-resolved, saltation flux from Eq. (12) (cf. Sect. 3.1.1). The G01 and K14 schemes do not contain explicit formulations for saltation flux.
3.1.3 Threshold friction velocity and soil moisture correction
The implementation of the threshold friction velocity for ideal (dry) conditions, u*t0(di), varies depending on the dust emission scheme and its requirements. In the MB95 implementation, we use the relationship from Iversen and White (1982) for the four saltation size classes (cf. Sect. 3.1.2) as described in Pérez et al. (2011). The original parameterization of Ginoux et al. (2001) estimates dust emission based on 10 m wind speed instead of friction velocity (Sect. 3.1.1) and specifies a threshold wind speed for each dust size bin, which can typically be expected to be larger than for saltation particle sizes (see Sect. 1). In combination with the relatively simple and constant distribution of soil particles across clay and silt particle sizes (Ginoux et al., 2001), this dust-size-dependent threshold wind speed leads to a more variable particle-size distribution at emission. Here, we revise this implementation and specify the entrainment threshold for saltation in G01-UST as
based on the theoretical expression for u*t0(di) from Shao and Lu (2000). In the G01-U implementation, we use a fixed minimal threshold of m s−1, a typical 10 m wind lower limit for dust emission under favorable land-surface conditions (Kurosaki and Mikami, 2007; Pu et al., 2020). To obtain a more realistic PSD at emission in combination with a dust-particle-size-independent entrainment threshold, we replace the PSD described in Ginoux et al. (2001) with that of Kok (2011a) (see Sect. 3.1.5). The K14 scheme also makes use of a particle-size-independent threshold friction velocity and in MONARCH, for K14 is obtained based on Iversen and White (1982) for 70 µm, a diameter in the size range where u*t0 becomes minimal. In the implementations of the S01, S04, and S11 dust emission schemes, u*t0(di) is described as in Shao and Lu (2000) and the minimum value (Eq. 15) is used in Eq. (5).
Models are known to underestimate the strong-wind tail of the wind speed distribution by different degrees depending on their resolution. This is particularly relevant for dust emission (Cakmur et al., 2004; Timmreck and Schulz, 2004; Cowie et al., 2015). If the frequency of occurrence of wind speeds or friction velocities above the threshold for particle entrainment is underestimated, dust emission will be underestimated, too. For coarse model resolutions (temporal or spatial), this underestimation might be considerable in some regions, for example in areas with frequent moist convection or pronounced topography. In some models, this effect is mitigated by introducing subgrid-scale wind variability (e.g., Cakmur et al., 2004; Lunt and Valdes, 2002). In our model, we included an optional constant scaling parameter, cthr≤1, such that the final threshold friction velocity for dry conditions, is
As a result, dust emission is initiated more often and over larger areas.
When the soil is moist, the threshold friction velocity above which particles are lifted is higher than under dry conditions, because soil-water capillary forces increase the cohesion between the soil particles (Chepil, 1956; Zimon, 1982; Chen et al., 1996). This is implemented by first estimating the threshold friction velocity for dry conditions, , and then applying a correction factor, fw>1, to obtain the threshold friction velocity for the given (moist) conditions (McKenna Neuman and Nickling, 1989; Fécan et al., 1999; McKenna Neuman, 2003; Cornelis et al., 2004a, b; Klose et al., 2014):
In MONARCH, the soil moisture corrections from Belly (1964); Fécan et al. (1999) and Shao and Jung (unpublished manuscript, 2000; see Klose et al., 2014) are available in combination with all schemes. The options to account for the impact of soil moisture on dust emission in MONARCH are summarized in Table 4 and further detailed below.
The soil moisture correction from Belly (1964) is implemented as described in Ginoux et al. (2001):
where θ is the volumetric soil moisture [m3 m−3], is a large value prohibiting particle movement (here ), and is an optional calibration factor described below. This correction is used as the default for the G01 scheme. The soil moisture correction after Fécan et al. (1999) is implemented as
with gravimetric soil moisture content w [%], gravimetric air-dry residual soil moisture content wr [%], and coefficients a=1.21 and b=0.68 (Fécan et al., 1999). wr is obtained based on Eq. (14) in Fécan et al. (1999). The conversion from volumetric soil moisture content θ to w is implemented as described by Zender et al. (2003, Eqs. 7–9):
Here, ρl is the density of water, ρbd is the bulk density of dry soil, ρpa is the average soil particle density (here ρpa=2500 kg m−3), is the volumetric soil moisture at saturation, and Msand is the sand fraction in the soil (Pérez et al., 2011, Table 1). The factor of 100 converts soil moisture content from kg kg−1 into %. As the top-layer soil moisture in models is usually obtained for a layer of several centimeters and is therefore typically higher than at the actual surface–atmosphere interface (which is relevant for dust emission), the soil moisture correction fw using the model's soil moisture is often too high and precludes dust emission. An optional calibration factor, or , can therefore be applied if needed. The coefficient directly reduces the soil moisture in Eq. (19) (e.g., Shao et al., 2010). Soil moisture remains unmodified outside of Eq. (19). Alternatively, the coefficient (Zender et al., 2003) instead increases the air-dry soil moisture. Both coefficients have the effect to reduce fw. We recommend using either or , but not both at the same time.
Shao and Jung (2000, unpublished manuscript) and Klose et al. (2014) developed a soil moisture correction similar to that of Fécan et al. (1999) but based on the soil-water retention curve from Brooks and Corey (1964) rather than that from Gardner (1970). Including the optional coefficient , the correction is
where θr is the volumetric air-dry residual soil moisture, hw is a function combining different constants, and ψs is the saturation capillary pressure head (Klose et al., 2014). Equation (23) is consistent with Eq. (19), as can be seen when setting
Note that the volumetric soil moisture θ [m3 m−3] is used in Eq. (23). θs is the saturation (volumetric) soil moisture. The values for α, β, and θr were obtained in Shao and Jung (2000) through fitting with observations and were published in Klose et al. (2014, Table 1). The optional tuning constant was not implemented in Eq. (23) for simplicity, as this would require modifying α.
3.1.4 Surface roughness, drag partition, and cover
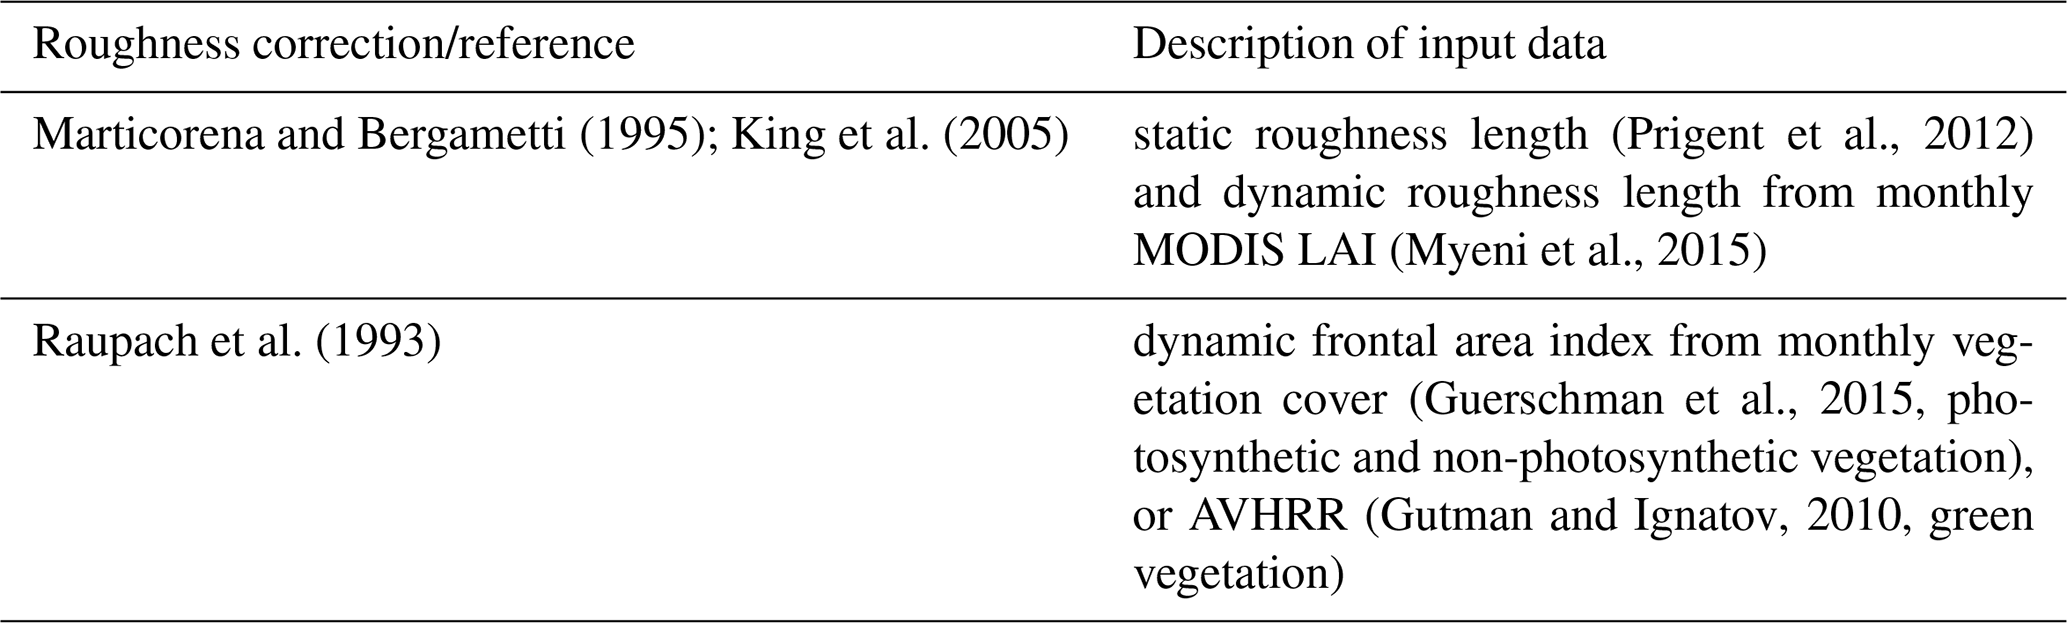
Surface roughness through, e.g., vegetation, pebbles, or rocks, absorbs momentum from the air flow and reduces the atmospheric momentum available for particle entrainment. We account for this drag partitioning using either the scheme of Raupach et al. (1993) or that of Marticorena and Bergametti (1995) with a correction published in King et al. (2005) (Table 5). Typically the drag partition correction is applied to u*t, which is phenomenologically, but not physically, correct as discussed in Kok et al. (2014b). For use with all schemes in MONARCH, we apply the drag partition correction, fv<1, on the friction velocity u*NMMB provided by the atmospheric model NMMB, such that the friction velocity acting on the erodible surface and used in Eq. (12) is
In the parameterization of Raupach et al. (1993), the ratio fv between the friction velocity acting on the erodible surface and the total friction velocity supplied by the atmosphere is given as
where τ is the total stress, is the maximum surface stress on the exposed area estimated from the average surface shear stress on the exposed area, , for a surface with lower roughness density using the constant m≤1, σv is the ratio of the roughness-element basal to frontal area, and βR is the ratio of roughness element to surface drag coefficients. Here we chose σv=1, βR=200, and m=0.5 (Shao et al., 2015). We estimate the frontal area index, λ, based on the vegetation cover fraction as (Shao et al., 1996)
where cλ is a coefficient. If the roughness elements are uniformly distributed and isotropically oriented, cλ=1 (Raupach et al., 1993; Shao et al., 1996). As this is typically not the case, a value of cλ=0.35 was proposed by Shao et al. (1996) based on measurements for stubble roughness. Stubble roughness can typically be associated with agricultural land use for which vegetation and its remains after the growing season are still relatively homogeneously distributed. An even smaller value for cλ, which leads to a weaker effect of vegetation cover in the drag partition correction, may be more appropriate for roughness elements that are distributed heterogeneously, as it is typical in semi-arid regions. Here, we choose cλ=0.2. In MONARCH, λ can be estimated using Eq. (27) based on monthly satellite-based retrievals of photosynthetic and non-photosynthetic vegetation cover (PV and NPV) (Guerschman et al., 2009, 2015), interpolated to the day of simulation (used as η in Eq. 27). Although NPV is intended to represent only vegetation components, it may also include some geological features, which is advantageous for our purposes. Monthly climatologies of the same data set (2003–2017) and also of green vegetation cover estimated from the Advanced Very High Resolution Radiometer (AVHRR) (1985–1990, Gutman and Ignatov, 2010) are also available.
Figure 1a–c show annual averages for 2012 of PV, NPV, and . With the parameter settings as described above, only areas in northern Africa, the Middle East, and western East Asia (Taklamakan Desert) experience a low or moderate roughness correction. Areas in other parts of East Asia, central Asia, and Australia, as well as parts of North and South America and southern Africa, show a stronger correction but one which can still allow dust emission under strong wind conditions. Dust emission from other areas is typically suppressed by a larger vegetation coverage using this drag partition parameterization and the given parameters. Variations in the parameters used for will lead to changes in the roughness correction, particularly in areas with moderate vegetation coverage.
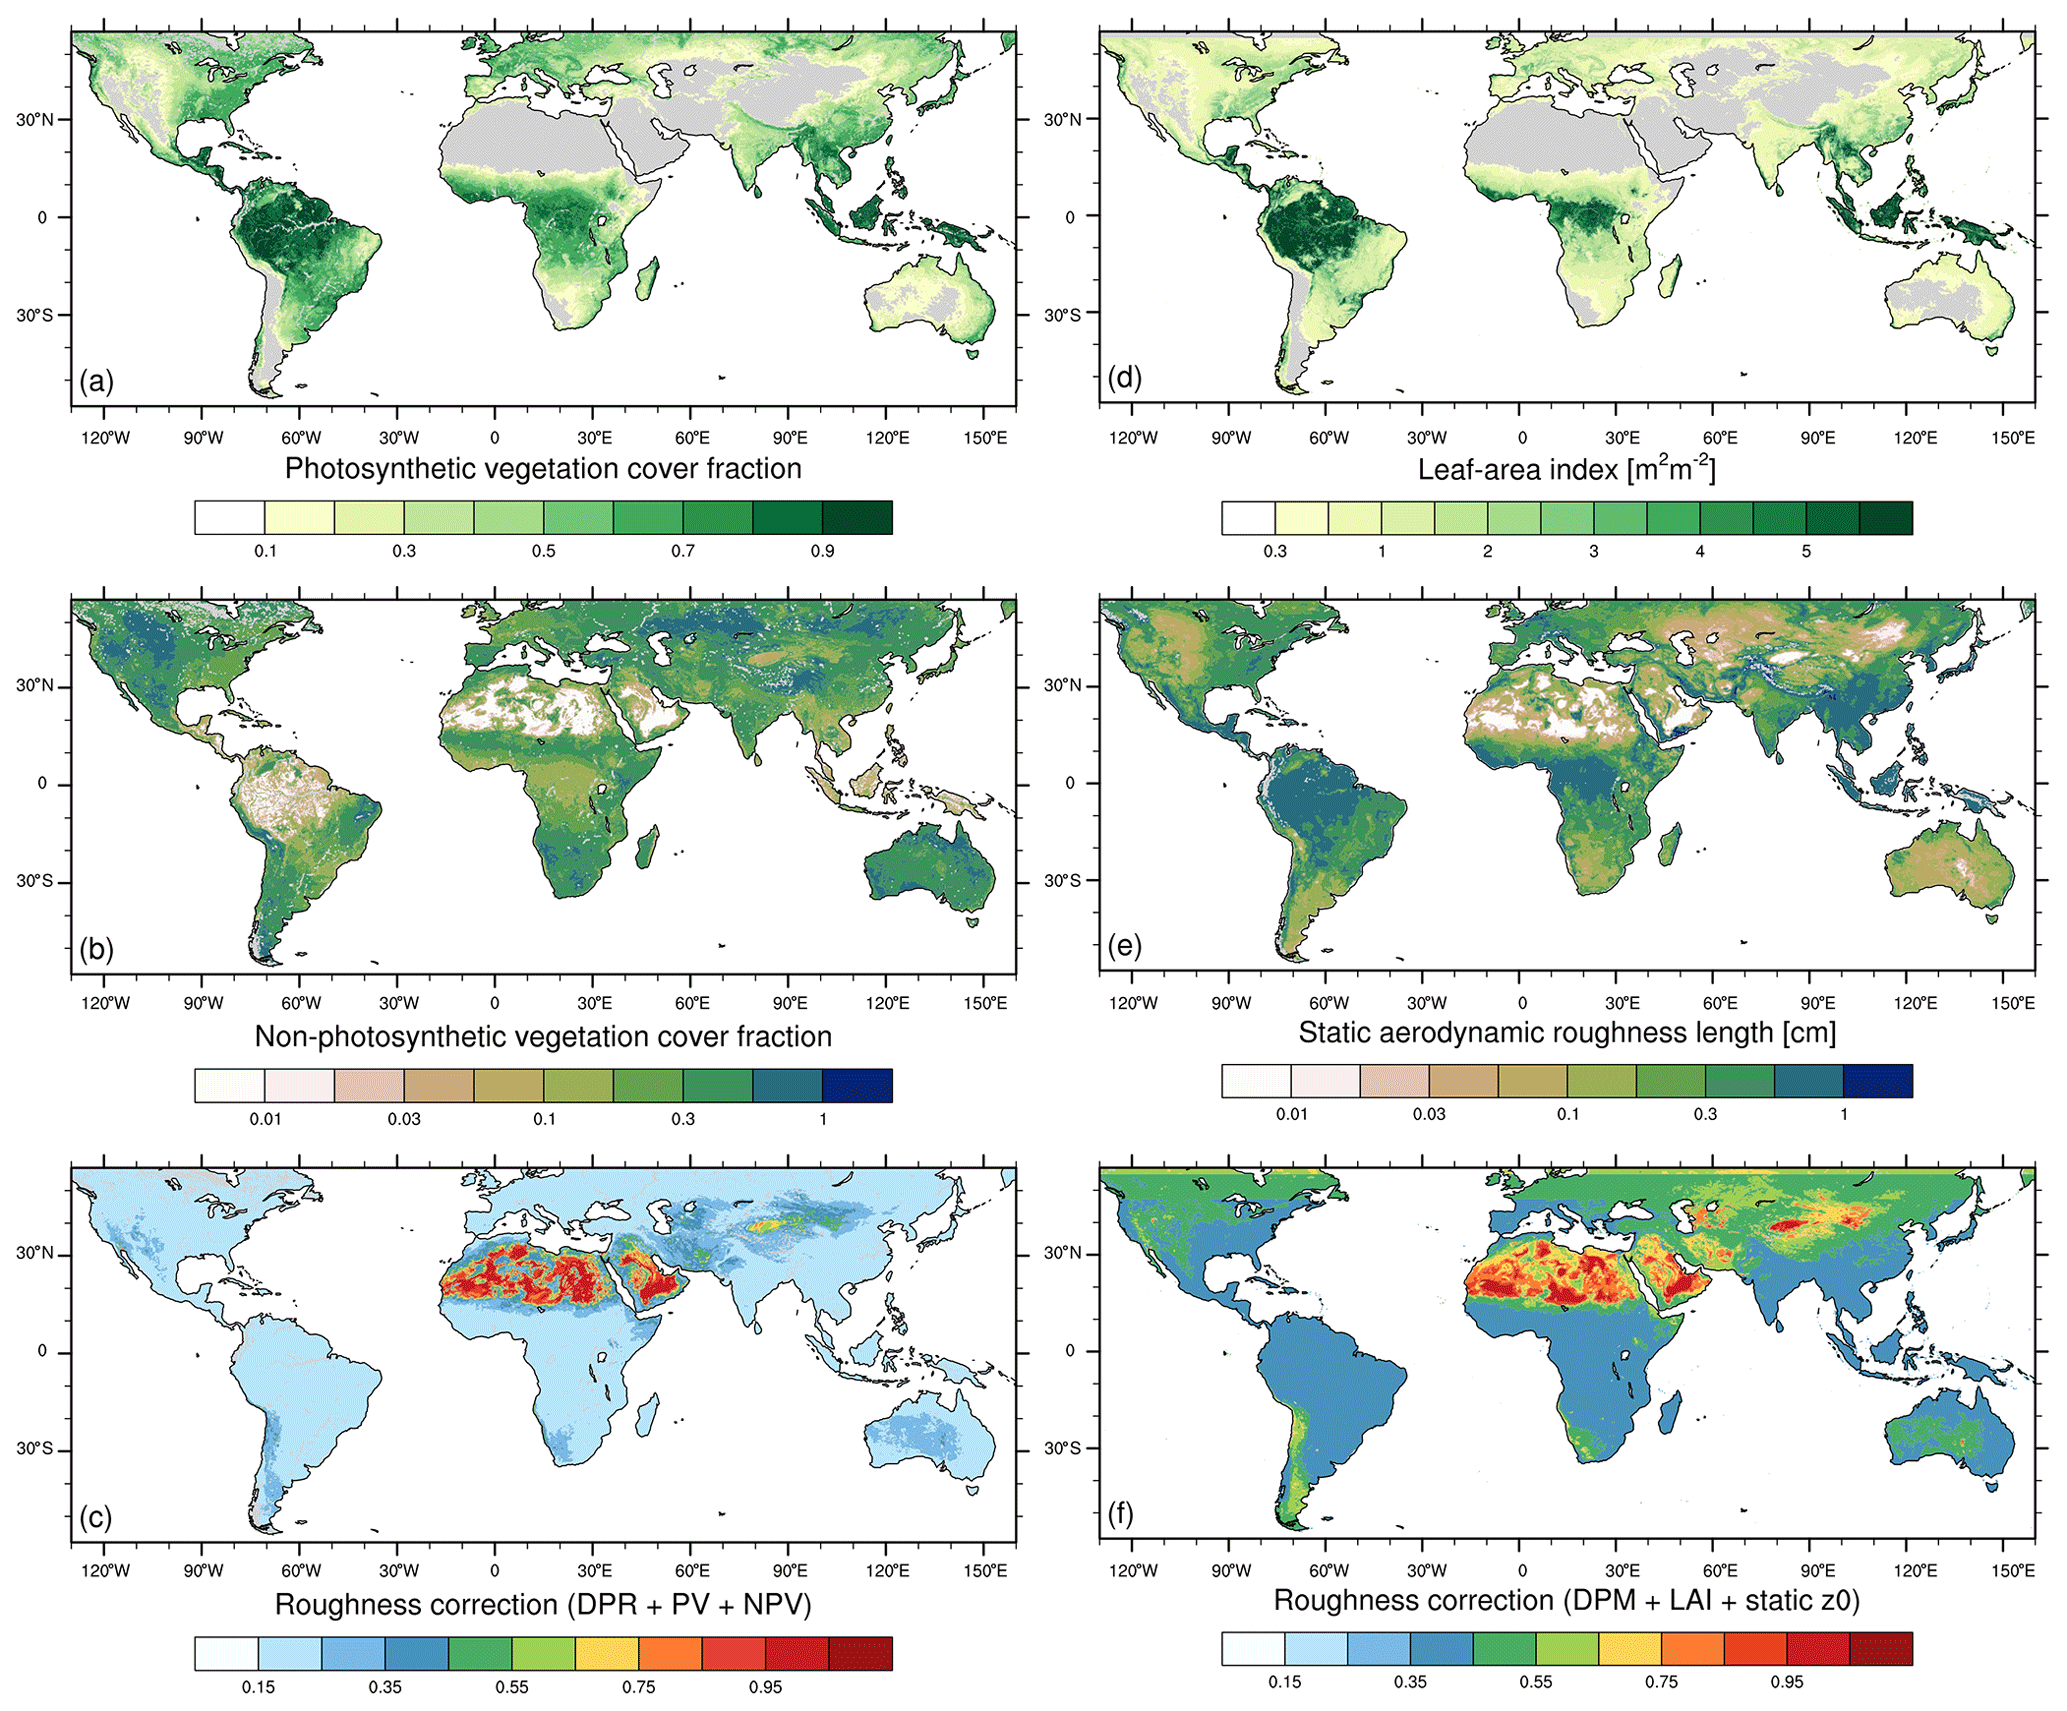
Figure 1Comparison of roughness input and drag partition approaches: panels (a, b) show, respectively, annual averages for 2012 of photosynthetic and non-photosynthetic vegetation cover fractions (Guerschman et al., 2015), which we use to obtain the roughness correction (label DPR) based on Raupach et al. (1993) (parameters cλ=0.2, β=200, m=0.5, σ=1) shown in panel (c); panel (d) displays the annual average MODIS leaf area index and (e) static aerodynamic roughness length (Prigent et al., 2012), which we utilize for the roughness correction (label DPM) after Marticorena and Bergametti (1995) (parameters cm, X=12 255 MacKinnon et al., 2004).
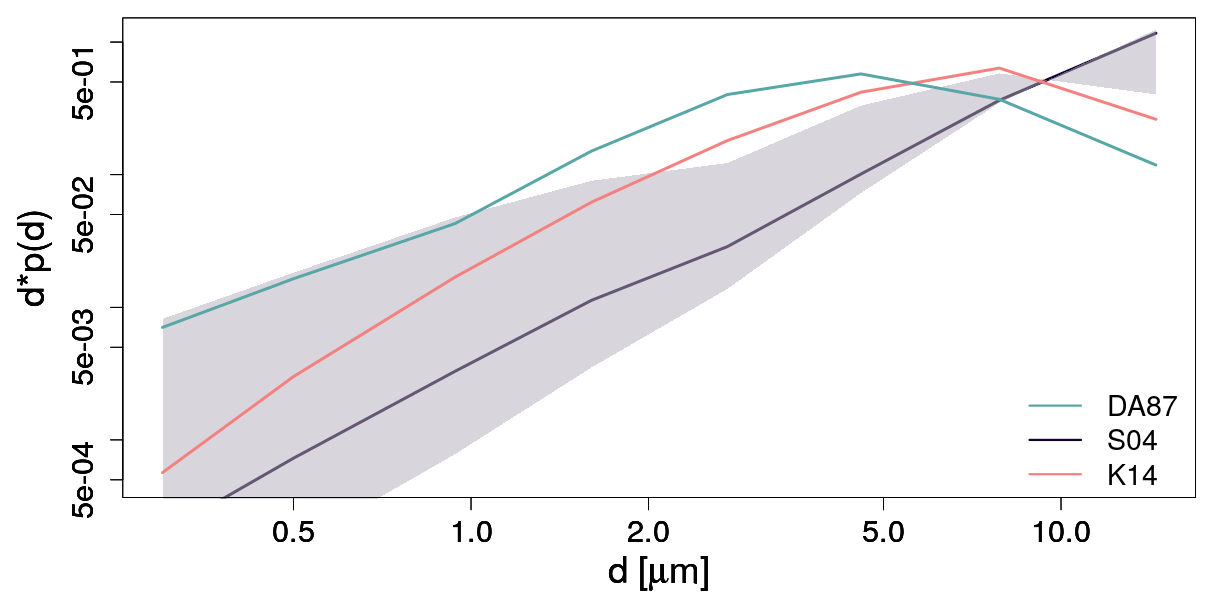
Figure 2Normalized particle-size distributions (PSDs) based on D'Almeida (1987) (DA87, turquoise), Shao (2004) (S04, gray), and Kok (2011a) (as in K14, coral). The DA87 and K14 PSDs are invariant, while the S04 PSD varies in time and space. Shown for the latter are the PSDs corresponding to the 50th percentile (median; solid gray line) of the emission-weighted average diameters per model grid cell of annually accumulated dust emissions, framed by the PSDs belonging to the 5th and 95th percentiles (gray shading). The S04 PSDs were obtained from the S04 experiment presented in Sect. 4.1.
In the formulation from Marticorena and Bergametti (1995), fv is given by
where z0 is the aerodynamic roughness length, z0s is the smooth aerodynamic roughness length, and X is a parameter related to the distance downwind from an individual obstacle. As the surface becomes rougher (corresponding to increasing z0), fv becomes smaller and the stress on the erodible surface decreases, reducing emission. The smooth roughness length z0s is estimated as
where cm is assumed to be the coarsest diameter of particles in the soil bed (Sherman, 1992; Pierre et al., 2014). The aerodynamic roughness length z0 is obtained globally in MONARCH as a combination of two different data sets. In arid regions, we use a static roughness, z0stat, which is derived from satellite microwave backscatter (ASCAT) and visible–near-infrared reflectances (PARASOL) (Prigent et al., 2012). In semi-arid regions, including natural vegetation and cultivated areas, we estimate a time-varying or “dynamic” roughness (z0dyn) based on the dimensions of green vegetation characterized using the Moderate Resolution Imaging Spectroradiometer (MODIS) leaf area index (LAI). The calculation of z0dyn is based on empirical relationships from Marticorena et al. (2006):
where h is the vegetation height and λ the roughness density (or frontal area index), defined as , where n is the number density of roughness elements (number per unit area) having a frontal area af. λ is calculated assuming patches of vegetation of diameter Dη=5 m, the number of which increases with the vegetation cover fraction η, (Pierre et al., 2012). With , it follows that
In Eq. (30), the dynamic roughness length increases with the characteristic height and density of the roughness elements. The influence of density is assumed to saturate above a sufficiently large value. In this implementation, η and h are assumed to scale with LAI:
where hmax is the maximum annual vegetation height and LAImax is the LAI above which dust emission is precluded. This approximation entails that η=1 and h=hmax for LAI=LAImax, decreasing linearly until η=0 and h=0 for LAI=0. Due to the lack of data at global scale, we currently assume hmax=0.4 m, a value obtained for the Sahel (Mougin et al., 1995; Pierre et al., 2012). We also set LAImax=0.3 as in the Community Land Model (Mahowald et al., 2010; Kok et al., 2014a), although this value should be further tested and constrained in future studies. We note that while η should scale with LAI at low fractional ground cover, the scaling may be weaker as leaves start overlapping, an aspect that is currently neglected in our simplified approach. In model grid cells, in which both z0stat and z0dyn are available, we use the larger value, .
The correction fv is smallest (i.e., roughness is largest) for roughness elements like stones or tall and closely spaced vegetation. Although Eq. (28) incorporates these dependencies, there is uncertainty related to characterizing the height and spacing of roughness elements, particularly where they are of irregular size or spacing. For example, in regional studies, X has been set to 10 cm (Marticorena and Bergametti, 1995), 40 cm (Sahel; Pierre et al., 2014), and 12 255 cm to extend its use to rougher vegetated surfaces (US; MacKinnon et al., 2004). The assumption of vegetation patches of 5 m in diameter was suggested as optimal for the Sahel (Pierre et al., 2012) but may be inadequate for other semi-arid regions. We note that this value can easily be modified in a static or dynamic way as soon as more detailed information becomes available. MONARCH uses maps of monthly LAI (actual year or climatology) and interpolates the monthly values to the day of simulation for each grid cell. The static roughness length and annual averages of the dynamic roughness length and the resulting drag partition correction, , using X from MacKinnon et al. (2004) are shown in Fig. 1d–f. Compared to , the correction tends to be weaker with values typically above 0.35. Areas with low corrections generally coincide with those in , but is smaller (weaker correction) in the Taklamakan and Gobi deserts and east/southeast of the Caspian Sea. When specifying X according to Marticorena and Bergametti (1995) or Pierre et al. (2014) instead, the resulting drag partition is substantially more restrictive.
Apart from the effect of vegetation or other roughness elements to absorb atmospheric momentum, they also directly prohibit particle entrainment from the area they cover. Similarly, areas covered by snow/ice (ηsnow) or bedrock (ηbr) preclude particle emission. We take this into account by scaling the obtained dust emission flux with in combination with the drag partition from Marticorena and Bergametti (1995) and with in combination with the drag partition parameterization from Raupach et al. (1993). The area covered by vegetation is already accounted for in the latter, which determines the fraction of shear stress acting on the uncovered surface (Raupach et al., 1993; Webb et al., 2020). Alternatively, the bare soil fraction can be applied to the saltation flux. Accounting for sbare in either the dust emission flux or the saltation flux, but not both, assumes that saltation impacts eject dust close to their origin; i.e., saltation trajectories are short. This may not always be the case, and saltating particles may also impact on the vegetated surface fraction in a grid cell where no emission occurs.
3.1.5 Particle-size distribution at emission
The particle-size distribution of emitted dust is key to quantifying the emitted dust mass, dust loading in the atmosphere, dust interactions with the energy and water cycles, along with more general impacts of dust upon climate. Whether or not the emitted dust PSD changes with the magnitude of atmospheric forces is still debated (e.g., Kok, 2011b; Shao et al., 2020). The S01, S04, and S11 dust emission schemes estimate size-resolved dust emission fluxes, the PSDs of which vary with atmospheric forcing. In contrast, the K14 scheme assumes a PSD that is independent of wind speed. The G01 scheme originally distributed the estimated bulk dust emission flux across four particle-size classes (Sect. 3.1.3) and the MB95 scheme does not include assumptions of emitted dust-particle sizes. For the latter two schemes, a pre-specified PSD is assigned to the estimated bulk dust emission flux that can be chosen to follow either D'Almeida (1987) or Kok (2011a). Figure 2 compares the PSDs based on D'Almeida (1987) (DA87), Shao (2004) (S04), and Kok (2011a) (as in K14). The K14 PSD is shifted toward coarser particle sizes compared to the DA87 PSD, indicating that the DA87 PSD describes dust after more settling of coarse constituents. Both PSDs show a peak in the diameter range 4–8 µm. The mean PSD based on S04 is continuously increasing with particle size; however, the PSD corresponding to the fifth emission-weighted percentile of mean particle diameter with respect to annual emissions does also exhibit a peak around 8 µm, similar to the K14 PSD. In contrast, the S04-PSD belonging to the 95th weighted percentile of mean particle diameter shows a somewhat steeper increase with particle diameter, and correspondingly a smaller fraction of small particles than the median S04 PSD and the DA87 and K14 PSDs. Differences in the PSD of dust at emission yield also differences in airborne dust PSD, which has important effects on the resulting dust optical depth and radiation interactions.
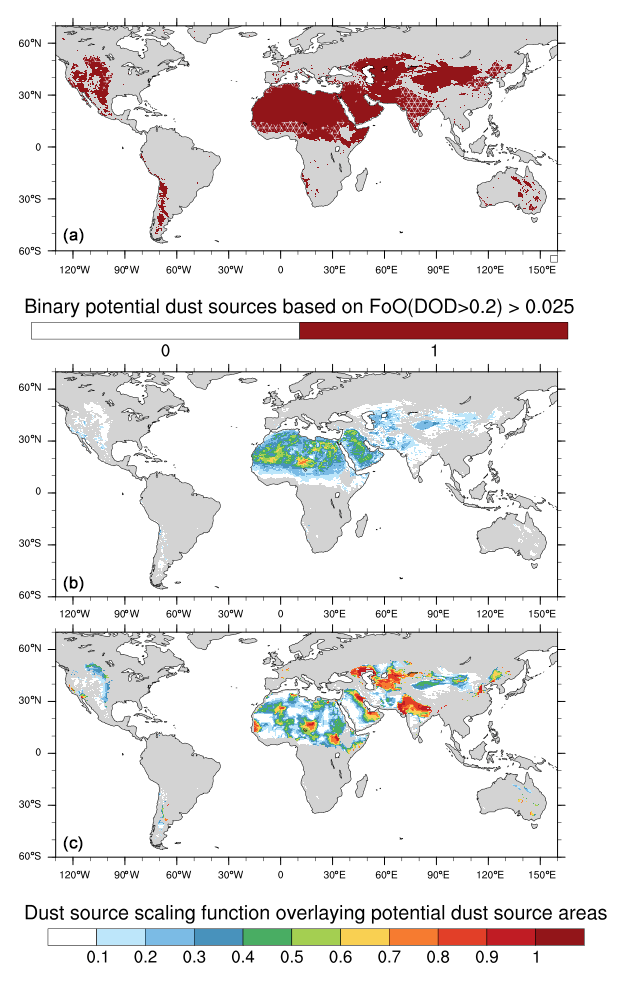
Figure 3(a) Binary potential dust source areas defined based on ; light line patterns indicate anthropogenic dust sources using the method from Ginoux et al. (2012) considering cropland and pasture based on Klein Goldewijk et al. (2017); (b) binary dust source overlaid with FoO(DOD >0.2); (c) binary dust sources overlaid with the topographic source scaling function from Ginoux et al. (2001) without vegetation mask.
Table 6Physical and optical particle properties available in MONARCH for eight particle-size bins: equivalent volume radius (rv), effective radius (re), density (ρp), real and imaginary parts of the refractive index (refREAL, refIMAG), mass-extinction efficiency (MEE, [m2 g−1]), single-scattering albedo (SSA), and asymmetry factor (ASY). The optical properties are for a wavelength of 550 nm and MEE, SSA, and ASY are given assuming ellipsoidal (index ell) or spherical (index sph) particle shape. The diameter ranges of each bin are given in Sect. 3.
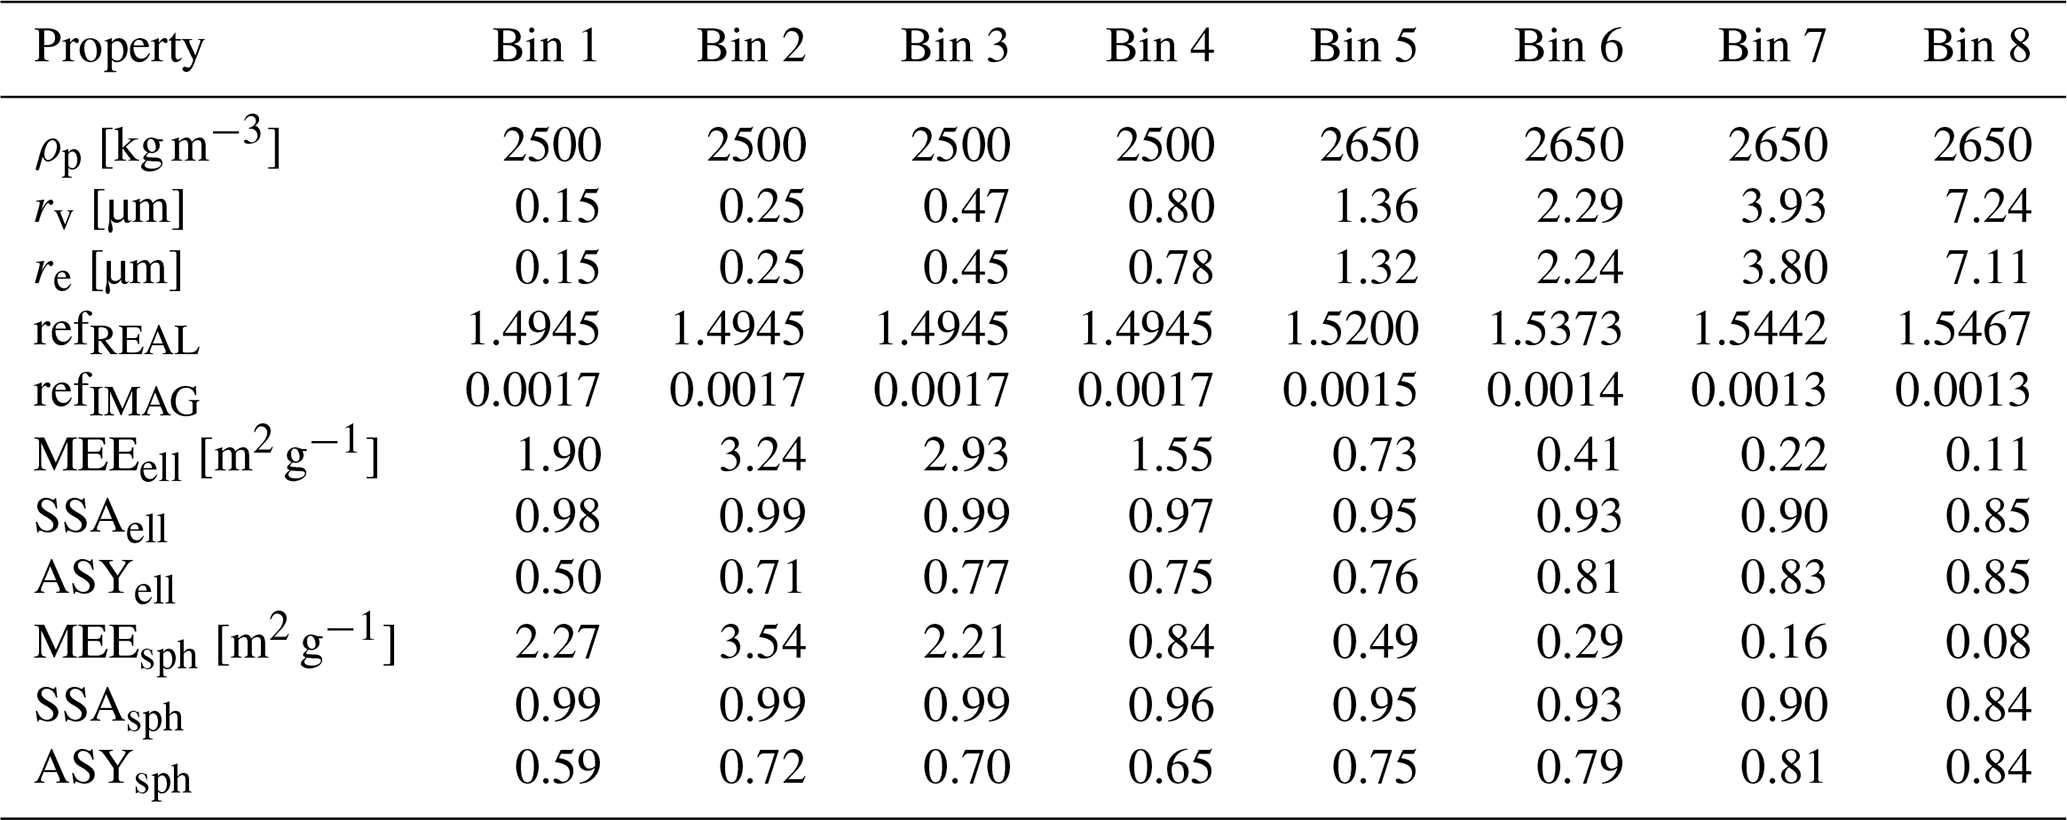
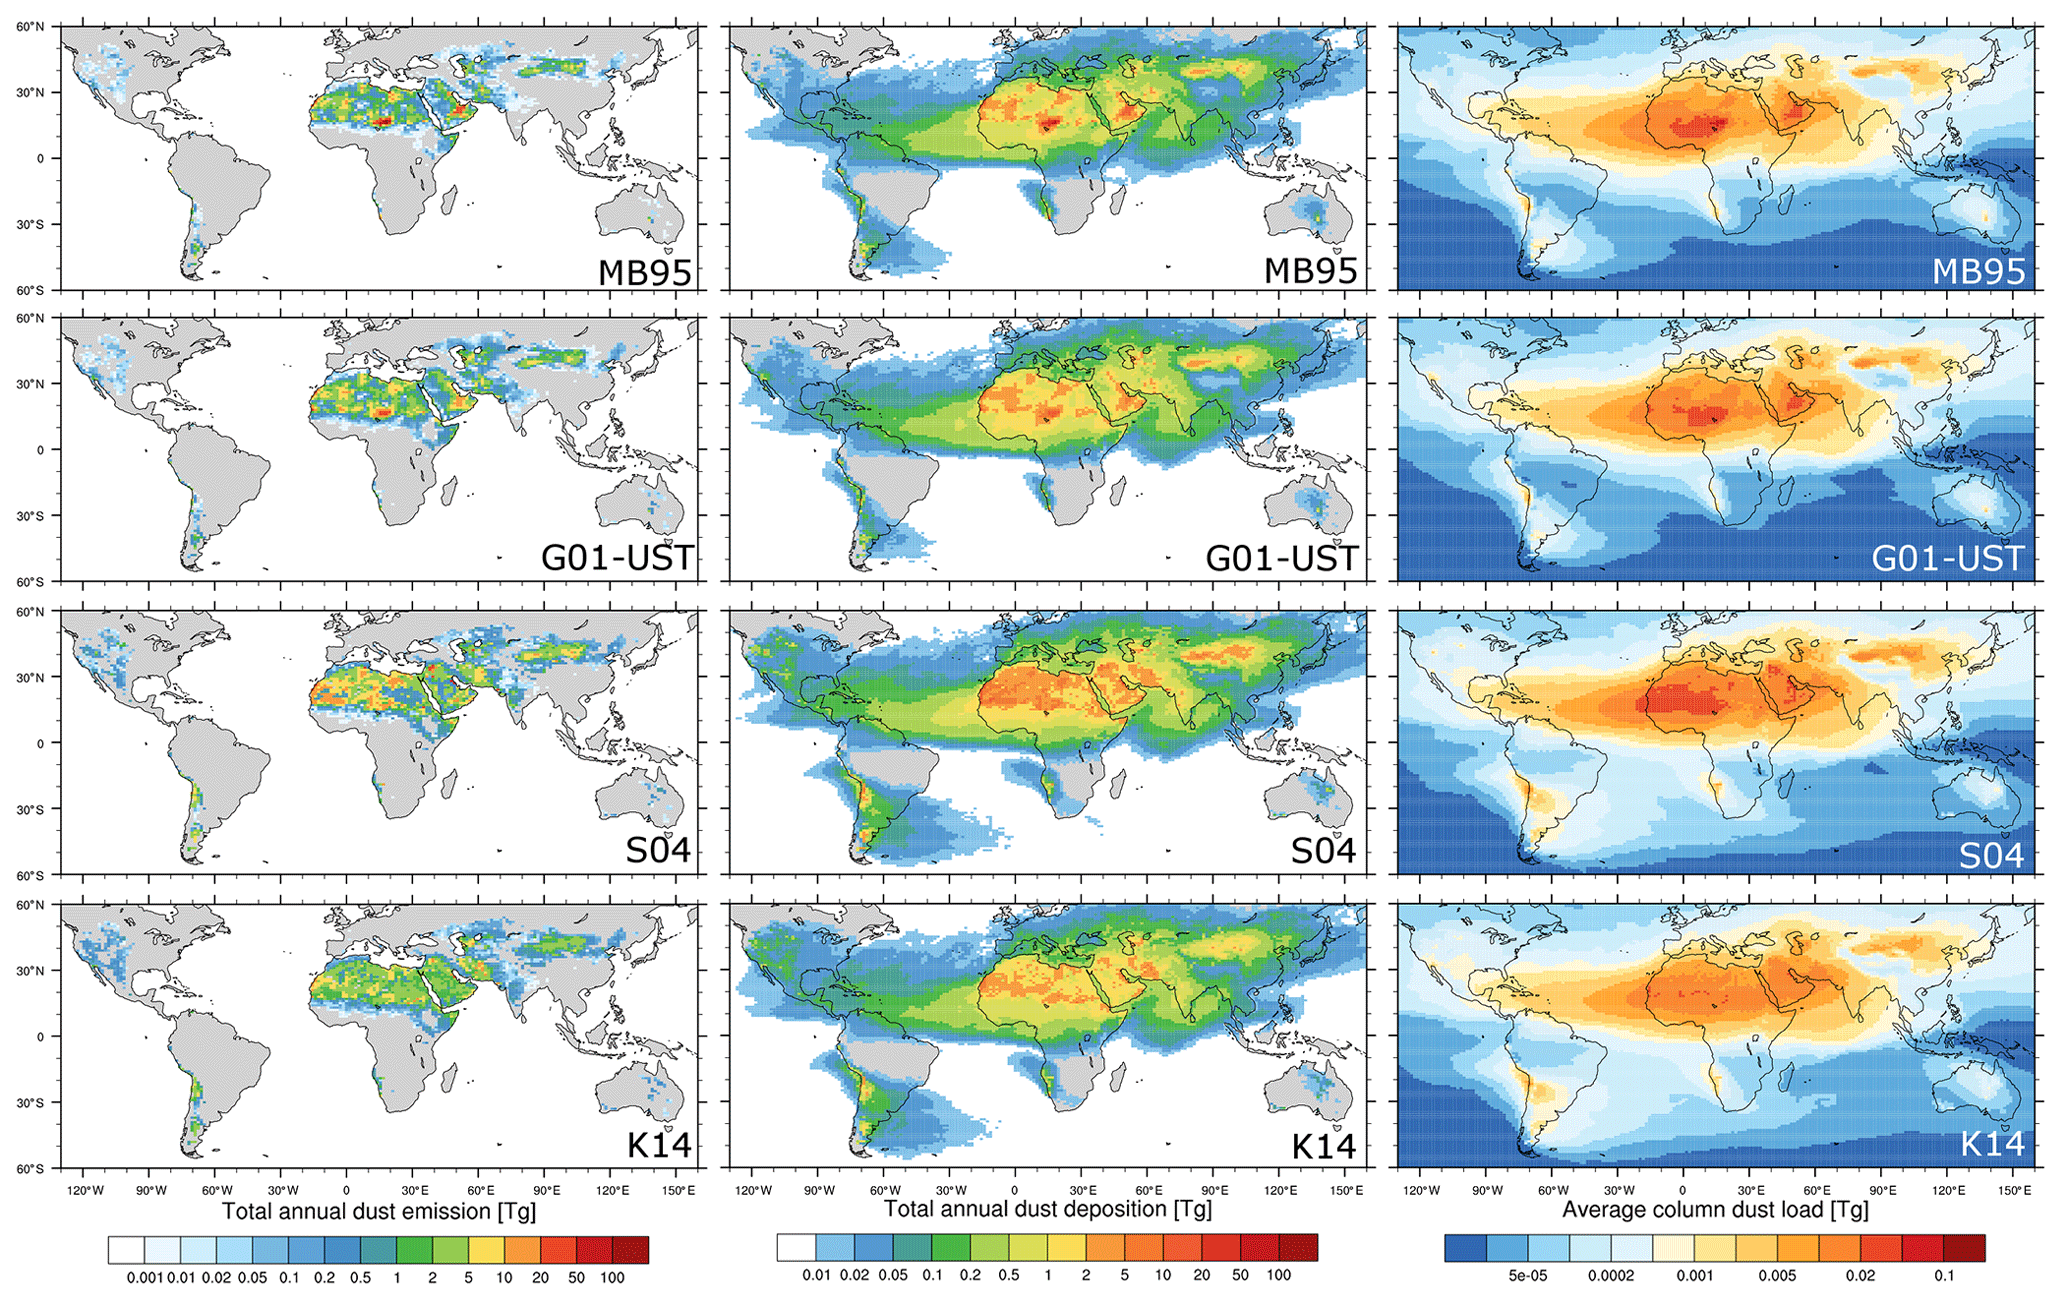
Figure 4Total annual dust emission (left), dust deposition (center), and annual average column dust load for 2012 using the configurations described in Sect. 4.1. Dust deposition includes gravitational settling, turbulent diffusion, and wet deposition from convective and non-convective precipitation. Shown are results for dust-particle diameters up to 20 µm.
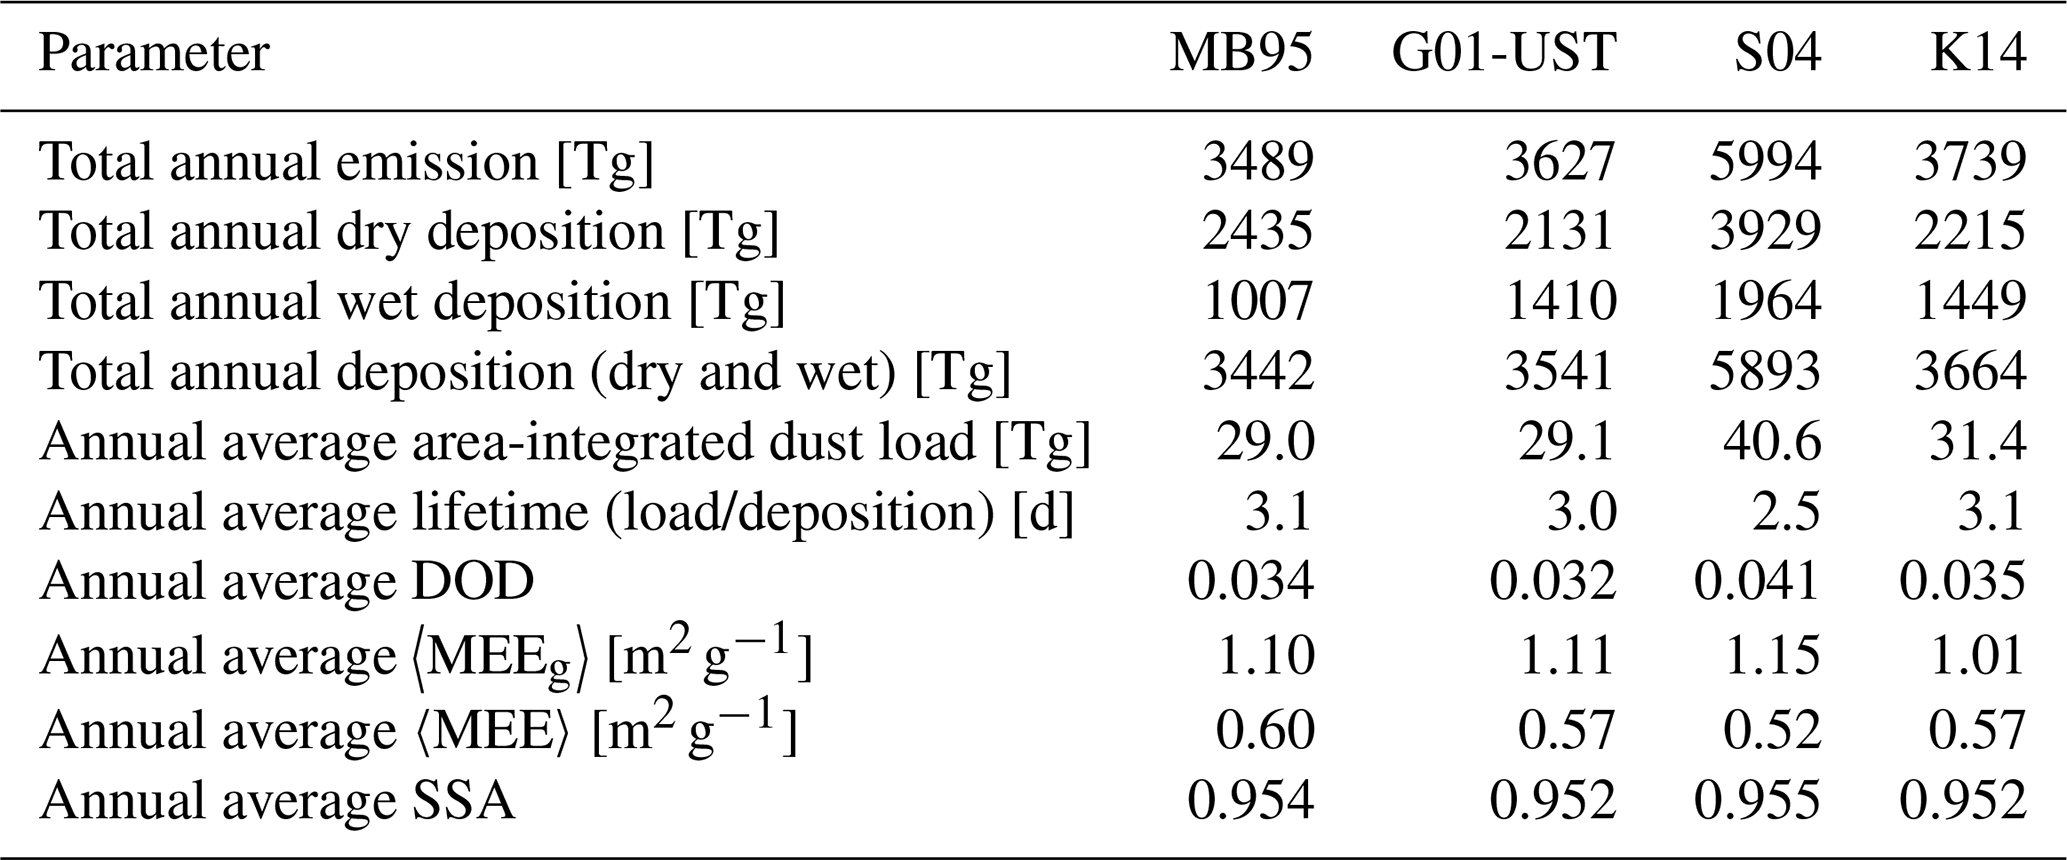
Table 7Statistical dust parameters of four global model simulations using the dust emission schemes MB95, G01-UST, S04, and K14 with the configurations described in Sect. 4.2. 〈MEEg〉 and 〈MEE〉 are annual global averages of MEE (all sizes). 〈MEEg〉 is calculated as the ratio of annual average grid-based DOD and dust load, whereas 〈MEE〉 is calculated from annual global average DOD and dust load. Parameters are for dust with particle diameters up to 20 µm.
3.1.6 Dust sources and lower boundary conditions for emission
In MONARCH, areas from which dust emission is possible are described using a map obtained from the climatological (for the years 2003–2015) frequency of occurrence (FoO) of the MODIS Deep Blue dust optical depth (DOD) greater than 0.2 (Hsu et al., 2004; Ginoux et al., 2012, see Sect. 4.3.1). Note that this specification of potential dust source areas is done in a binary sense and independent of any scaling of saltation or dust emission fluxes (see also next paragraph). This means that dust can be emitted if the topographic mask is non-zero or the retrieved FoO(DOD >0.2) is greater than a small value (here 0.025) (Fig. 3, top panel). Areas fully covered by vegetation, snow (obtained from reanalysis data used as boundary conditions), or bedrock (from STATSGO-FAO data) are excluded from potential dust sources as described in the final paragraph of Sect. 3.1.4, and a land–sea mask is applied.
In addition to the definition of areas from which dust emission is possible, a scaling of the calculated dust emission fluxes with the above-mentioned dust source functions is deployed in the MB95 and G01 schemes. The preferential source map from Ginoux et al. (2001) describes the sources as a function of topography. In practice, the topographic source term (S in Eqs. 2 and 3) enhances dust emission from enclosed basins in arid regions where soil particles have accumulated after fluvial erosion of the surrounding highlands (Fig. 3, bottom panel). Such scaling is part of the design of the G01 scheme and was found to improve results compared to observations also for the MB95 implementation (Pérez et al., 2011). We have also added the option to apply the new FoO map as the preferential source function (Fig. 3, center panel). In this case, dust emission is enhanced in areas with high FoO. The purpose of a source map scaling is to compensate for unrepresented processes and surface properties, which affect dust emission. The S01–S11 and K14 schemes are not scaled with any preferential source map. The physics of these schemes are assumed to account for spatial variations in the emitted dust mass, and the retrieved FoO map is only used as a mask defining the areas from which dust emission is possible as described above.
An additional special feature of MONARCH is its ability to tag dust originating from natural and anthropogenic (agricultural) sources. For this purpose, the MODIS FoO-based map is linked with fractions of anthropogenic land use, following the approach described in Ginoux et al. (2012), but using an updated land-use data set (Klein Goldewijk et al., 2017). When considering cropland and pasture as anthropogenic dust sources, the main anthropogenic source regions are in the Sahel, India, China, and the United States (Fig. 3, top panel). Besides tagging natural and anthropogenic dust sources (Klose et al., 2018), MONARCH's tagging functionality can be adapted to track dust also from other predefined source origins (Kok et al., 2021b).
Vegetation in MONARCH is prescribed based on satellite data, using either an AVHRR monthly climatology of green vegetation cover fraction (Gutman and Ignatov, 2010) or monthly photosynthetic and non-photosynthetic vegetation cover based on MODIS and Landsat surface reflectance (Guerschman et al., 2015) either as a climatology or for the actual year of simulation. The two cover fraction data sets can be used consistently within MONARCH's meteorological and dust modules. Additionally, monthly MODIS LAI data (Myeni et al., 2015) are available for use in the dust module, for the actual year or as a climatology, by default in combination with the AVHRR climatological vegetation used for meteorology (aerodynamic roughness length and evaporative fluxes).
Soil texture class information in MONARCH is obtained from the hybrid STATSGO-FAO data set at a resolution of 30 arc seconds (0.0083∘) (Pérez et al., 2011). Additional soil information, such as on soil mineral content, is currently being implemented (Gonçalves Ageitos et al., 2021b). To aggregate soil texture data to model resolution, MONARCH utilizes a predominance approach; i.e., the predominant soil texture class in each grid cell is applied to the entire cell.
3.2 Dust transport and deposition
Dust transport and deposition in MONARCH have been thoroughly described in Pérez et al. (2011) and are only briefly summarized in this section. The numerical schemes for dust transport by advection and turbulent diffusion are the same as those of other scalars in the NMMB model. Horizontal advection is solved with the Adams–Bashforth scheme and vertical advection with the Crank–Nicholson scheme. Lateral diffusion follows the Smagorinsky non-linear approach. Gravitational settling of dust is solved implicitly from top to bottom using a gravitational settling velocity based on the Stokes–Cunningham approximation. As the settling velocity increasingly deviates from Stokes settling for large particles (approximately >10 µm) and to correct for potential numerical diffusion (Ginoux, 2003) and other unaccounted phenomena (Stout et al., 1995; van der Does et al., 2018; Dey et al., 2019), we successively reduce the settling velocity using bin-wise tuning factors. By default, we use 1, 1, 1, 1, 0.5, 0.3, 0.2, and 0.1 from bins 1 to 8. An explicit formulation is also now available in the model. Dry deposition through turbulent diffusion is based on Zhang et al. (2001), which accounts for Brownian diffusion, impaction, interception, and gravitational settling (Slinn, 1982). Wet deposition in MONARCH includes in-cloud and below-cloud scavenging from both stratiform (grid-scale) and convective (subgrid-scale) clouds. In-cloud scavenging from stratiform clouds is proportional to dust mass and solubility along with the conversion rate of cloud water to rain by autoconversion, accretion, and shedding of accreted cloud water and to the conversion rate of cloud ice to precipitation through melting. Dust solubility is assumed to have intermediate values between purely hydrophobic and purely hydrophilic particles, with values decreasing with increasing particle size (Zakey et al., 2006). Below-cloud scavenging for rain and snow is based on Slinn (1984) and includes the effects of directional interception, inertial impaction and Brownian diffusion. For convective scavenging, the model follows the principles of the Betts–Miller–Janjic (BMJ) convective parameterization scheme developed by Betts (1986); Betts and Miller (1986); Janjic (1994). In-cloud scavenging is proportional to dust mass and solubility along with the production of precipitation in the convective cloud. Below-cloud scavenging also follows Slinn (1984) assuming a raindrop diameter of 1 mm. BMJ is a convective adjustment scheme and therefore does not represent mass fluxes. Dust is vertically mixed by deep convection in analogy with the vertical adjustment of moisture (Pérez et al., 2011). Currently, dust particles do not affect cloud formation in MONARCH. Parameterizations representing the effect of dust particles on cloud formation, as they act as cloud condensation and ice nuclei, are planned to be implemented in the future.
3.3 Radiation and optical properties
The model's radiation scheme is RRTM-G (Iacono et al., 2000, 2008). MONARCH allows multiple options for setting the dust microphysical properties. In the longwave (LW), we assume refractive indices from the Optical Properties of Aerosols and Clouds (OPAC) data set (Hess et al., 1998) and spherical particle shape. In the shortwave (SW), we use mineralogy-based refractive indices and non-spherical shapes. The multi-component Maxwell Garnett theory (Markel, 2016) is used to calculate refractive indices of internal mixtures of eight minerals (Gonçalves Ageitos et al., 2021a), whose size-resolved proportions are estimated based on the mineralogical atlas from Claquin et al. (1999) combined with the brittle fragmentation theory of Kok (2011a). The single-mineral refractive indices are taken from Scanza et al. (2015). We obtain size- and wavelength-dependent real and imaginary indices for each of the 28 soil types in the atlas and we take the median values. Note that the dependence of our refractive indices upon size is due to changes in mineralogy with size. Our median imaginary indices compare better than OPAC values (too absorbing) with recent chamber-based retrievals (Di Biagio et al., 2019), in situ aircraft measurements (Denjean et al., 2016), and ground-based remote sensing (Balkanski et al., 2007) of dust refractive index (Gonçalves Ageitos et al., 2021a). We account for the effects of the substantial dust asphericity (Huang et al., 2020) on dust optics by combining the probability distributions of particle shape obtained in Kok et al. (2017) based on laboratory measurements (e.g., Okada et al., 2001; Kandler et al., 2007) with the dust single-scattering database of Meng et al. (2010). Table 6 summarizes key dust properties used in MONARCH.
A range of global model simulations was performed with MONARCH for 1 year (2012) to demonstrate MONARCH's dust modeling capabilities. We used different configurations in the runs covering different dust emission schemes. We evaluate the presented simulations against MODIS (Ginoux et al., 2012; Hsu et al., 2013) and Aerosol Robotic Network (AERONET, Giles et al., 2019) products in terms of DOD.
4.1 Experimental setup
The global model runs performed with MONARCH were conducted at a horizontal resolution of 1∘ latitude × 1.4∘ longitude with 48 vertical layers and a computational time step of 3 min. Turbulence, surface layer, dust emission, sedimentation, and dry deposition routines were called every four computational times steps; moist convection, microphysics, and wet scavenging routines were called every eight time steps; and short- and longwave radiation routines were called every 20 time steps. The runs were initialized using ERA-Interim reanalysis data (Berrisford et al., 2011; Dee et al., 2011). The meteorological fields are re-initialized daily, whereas dust fields and soil moisture are transferred between the daily runs. We used 1 year of spinup for soil moisture and 1 month of spinup for the dust fields before the 1-year simulation. A simple double-call mechanism computes the total (all size bins together) direct radiative effect (DRE), and a more complex multiple-call mechanism generates the DRE per size bin. The DRE per bin depends on the vertical distribution of particles in a specific bin with respect to those in other bins. Hence, the sum of the DRE per bin does not exactly equal the total DRE, especially for locations with high dust loading. To minimize errors due to such non-linearities, the DRE per bin is calculated as the difference between the total DRE with all bins included (reference state) and the total DRE without the specific bin. Results were output 3-hourly for the global runs.
Here we present results of global MONARCH simulations using the MB95, G01-UST, S04, and K14 dust emission schemes, a set of well-known and frequently used parameterizations. In all runs, we scaled soil moisture using and applied the default soil moisture corrections listed in Table 4 (Sect. 3.1.3). We used the drag partition from Marticorena and Bergametti (1995) with X=12 255 cm (MacKinnon et al., 2004) for all runs presented here. The intention of using the same drag partition is to ease intercomparison between the runs and not to achieve the best possible results for each run. For the latter, different settings for each of the schemes may be more appropriate. The drag partition from Marticorena and Bergametti (1995) uses MODIS LAI as input, while photosynthetic and non-photosynthetic vegetation cover fractions are used for MONARCH's meteorology. Dust emissions in both the MB95 and G01 schemes include a scaling with the topographic source mask from Ginoux et al. (2001) shown in Fig. 3 (bottom), whereas the S04 and K14 schemes do not receive any scaling accounting for preferential dust sources.
The dust fields of all model runs were calibrated using experiment-specific global calibration factors, which were obtained by comparing monthly averages of modeled coarse DOD (size range 1.2–20 µm) for each experiment with the DOD obtained from MODIS (see Sect. 4.3.1 for more details) and minimizing the overall error (Cakmur et al., 2006). This calibration only removes the general global bias for each run and does not affect the spatiotemporal variability of the dust emission, transport, deposition, and interactions.
4.2 Dust emission and deposition
The total mass of dust emitted globally during 2012 was 3489, 3627, 5994, and 3739 Tg, respectively, for the MB95, G01-UST, S04, and K14 dust emission schemes. Correspondingly, the total dust deposition (dry/wet) obtained with the four schemes was 3442 (2435/1007), 3541 (2131/1410), 5893 (3929/1964), and 3664 (2215/1449) Tg. Dry dust deposition here includes both gravitational settling and turbulent diffusion. Wet deposition is due to convective and non-convective precipitation. The globally integrated annual average column dust load for the four configurations resulted as 29.0, 29.1, 40.6, and 31.4 Tg. Figure 4 shows the global spatial distribution of the total annual dust emission and deposition, as well as average column dust load for the four model runs. Values are summarized in Table 7.
The similarity in global dust emission between the MB95 and G01-UST schemes is a result of the scaling with the topographic source mask. Nevertheless, differences in the magnitude of dust emission are evident, in particular in the Middle East, central Asia, and Australia. Neither the S04 nor K14 scheme uses a preferential source function besides the binary treatment explained in Sect. 3.1.6. Hence, dust emissions are independent of this source function and differences to other experiments are more pronounced. Compared with the MB95 and G01-UST runs, for example, the Bodélé Depression in Chad does not stand out as much compared to the runs using the topographic source mask. Dust emissions in Asia extend over a larger area in the S04 and K14 runs and tend to be larger in North and South America. The S04 run shows decreased dust emissions in the eastern Sahara, whereas north African and Middle Eastern dust emissions are relatively homogeneous in the K14 run. Overall, the S04 scheme produced substantially more dust emission and deposition than the other schemes. This is a result of the on average coarser particle-size distribution in the S04 scheme above 10 µm (Fig. 2) and also reflected in the shorter lifetime of dust aerosol obtained with the S04 experiment (Table 7). All experiments were calibrated so that their global DOD resembled that of MODIS. The coarser particles in the S04 experiment have only a small contribution to DOD but constitute a large amount of the emitted and deposited dust mass.
Consistent with the differences in dust emission between the four runs, the annual total dust deposition and annual average dust load are similar in the MB95 and G01-UST runs, with pronounced individual source regions such as the Bodélé Depression. In comparison, deposition and dust loading are more intense in northwestern Africa and the Middle East in the S04 scheme, and more homogeneous in the K14 scheme.
Figure A1 shows the percent contribution of dust emission and deposition at each location to their respective global and annual totals to investigate differences between the four experiments independent from the overall flux magnitudes. The relative emission (deposition) confirms the differences highlighted before: the spatial patterns of the MB95 and G01-UST are similar due to the use of the preferential source function. In contrast, the S04 experiment produced relatively more dust in northwestern Africa, while the K14 scheme generated relatively homogeneous patterns across northern Africa and the Middle East.
Kok et al. (2021b) found that dust models often overestimate dust from North African dust sources but underestimate dust from Asian and other dust sources. MONARCH contributed to this study with a preliminary model version, which did not yet include all developments presented here. Our new results (Table A1) show that, compared to the results from Kok et al. (2021b), the contribution of North African dust sources is overestimated in the four presented configurations (range 55 %–71 % compared to 50 %), which suggests that we may underestimate the contribution from other source regions. This is most likely a result of larger vegetation/roughness element coverage in, for example, North America, which acts to suppress dust emission to a large extent in the coarse global model grid we used. However, besides the overestimation of North African sources, our model results agree with many of the aspects highlighted by Kok et al. (2021b): our global dust emission fluxes are in the range 3489–5994 Tg; Asian dust sources contributed to about 37 %–42 % to global emissions in three of four configurations; South American dust sources about 3 %–4 % in two configurations; Middle Eastern and central Asian sources about 28 %–33 % in three configurations; East Asian sources >9 % in one configuration; western north African sources contributed 6 % more than eastern north African sources in one configuration. Differences across configurations demonstrate the benefit of having multiple dust emission options available in one model and will help to identify aspects of parameterizing dust emission that need particular attention in future research.
4.3 Dust optical depth
The global annual average of DOD is 0.034, 0.032, 0.041, and 0.035 in the MB95, G01-UST, S04, and K14 runs. This results in an average mass-extinction efficiency 〈MEEg〉 of, respectively, 1.10, 1.11, 1.15, and 1.01 m2 g−1 for the four runs considering dust up to 20 µm in diameter (Table 7), calculated from grid-based annual average DOD and dust load, and, correspondingly, 0.60, 0.57, 0.52, and 0.57 based on global annual average DOD and dust load (〈MEE〉). The discrepancy between 〈MEEg〉 and 〈MEE〉 is a result of the different emphasis put on locations with high and low dust loading in the two averaging methods: 〈MEEg〉 is calculated from DOD and dust load at each grid cell and then averaged, which puts equal weight on grid cells with and without dust. In contrast, 〈MEE〉 is calculated from globally averaged DOD and dust load and hence focuses more on dusty locations. To provide a comprehensive yet concise evaluation, we compare the DOD averaged across the four model runs with retrieved DOD from MODIS Deep Blue (Hsu et al., 2013; Sayer et al., 2013) and AERONET (Holben et al., 1998; O'Neill et al., 2003; Giles et al., 2019). Our objective here is to evaluate the overall behavior of MONARCH across dust emission schemes rather than that of each individual scheme.
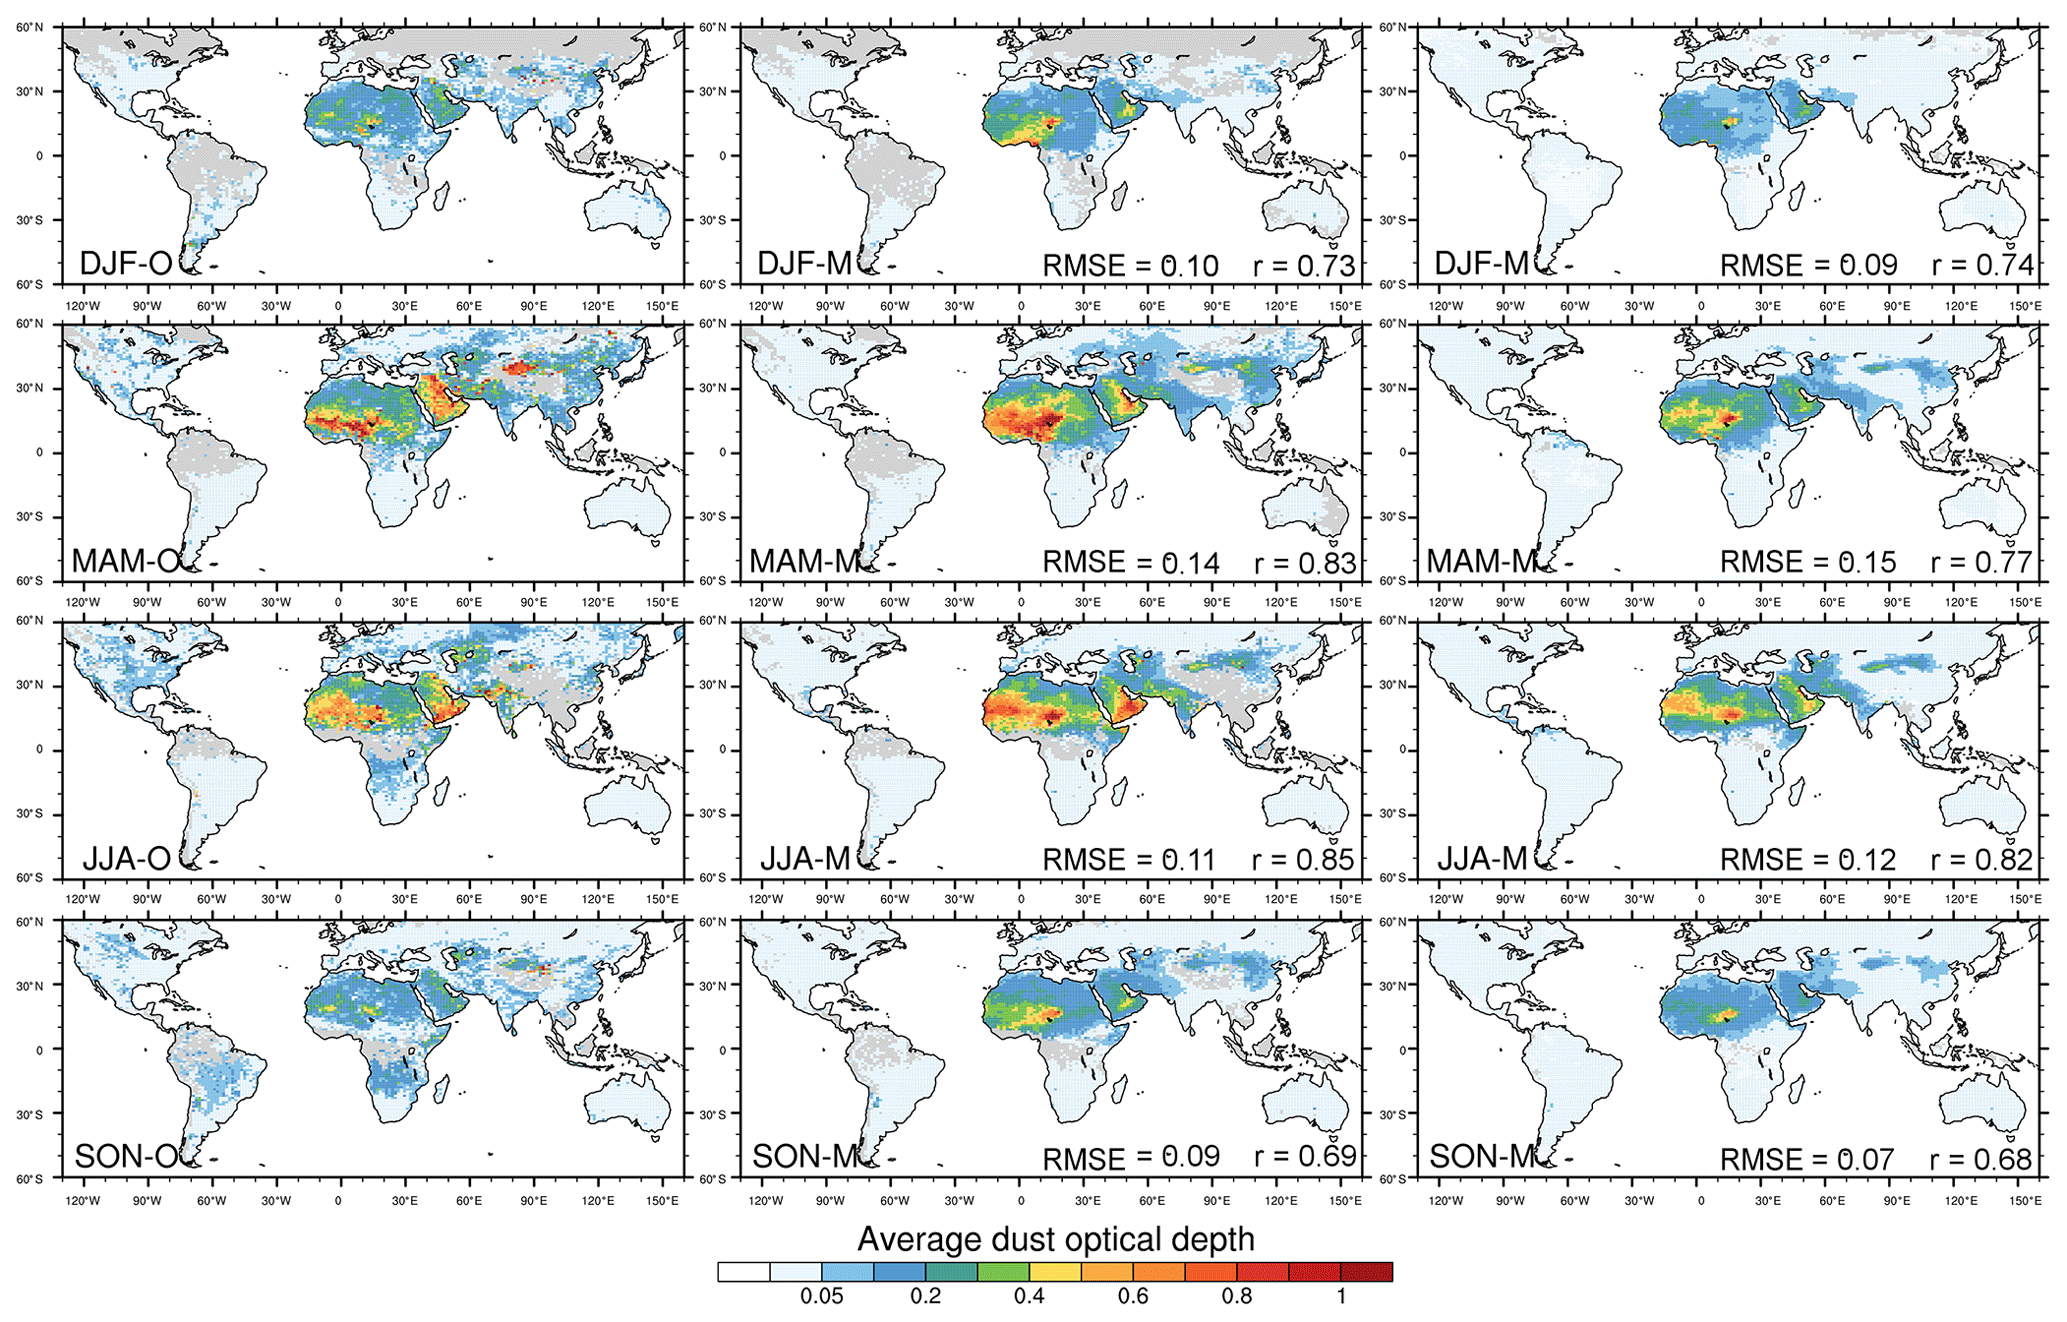
Figure 5Seasonally averaged MODIS Deep Blue DOD (left), MONARCH all-sky DODcoarse at satellite overpass times co-located with MODIS DOD (middle), and clear-sky DODcoarse at approximate satellite overpass times derived from 3-hourly model output from MONARCH (right). The model results were obtained for DODcoarse averaged across the four model experiments. The seasonal averages were calculated with respect to the number of valid values per grid cell in the respective products. Area-weighted root mean square error (RMSE) and uncentered Pearson product-moment coefficient of linear correlation (r) between model and observations are indicated in the respective panels.
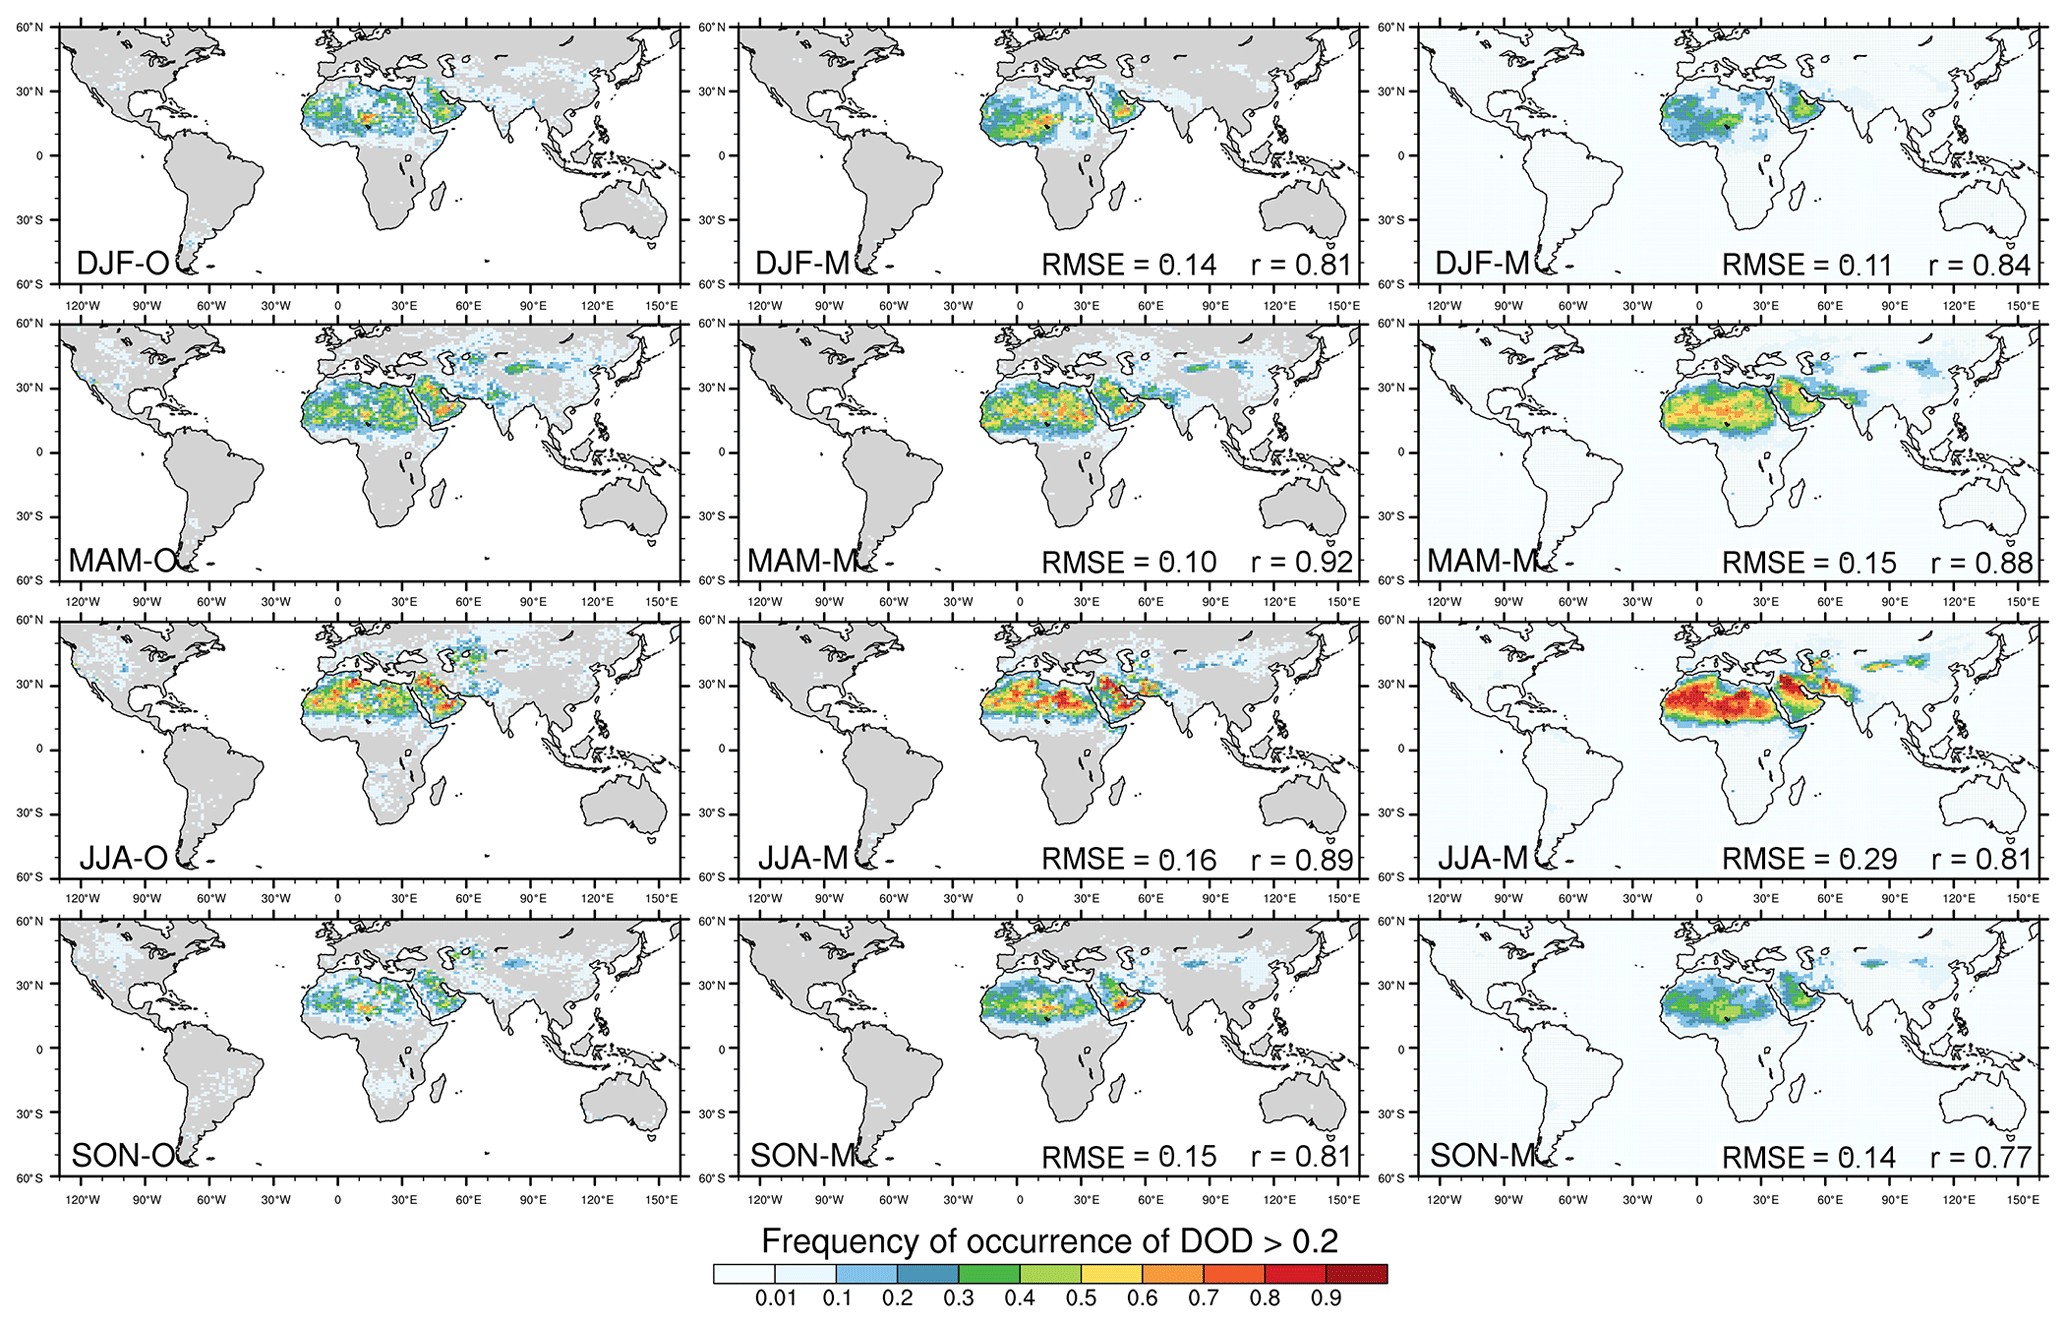
Figure 6Seasonally averaged FoO of DOD >0.2, normalized by the number of days per season for MODIS Deep Blue (left), MONARCH all-sky DODcoarse at satellite overpass time co-located with MODIS DOD (middle), and MONARCH clear-sky DODcoarse at approximated satellite overpass times derived from 3-hourly model output (right). The FoO was calculated with respect to the number of days in the season. Area-weighted RMSE and uncentered Pearson product-moment coefficient of linear correlation (r) are indicated in the respective panels.
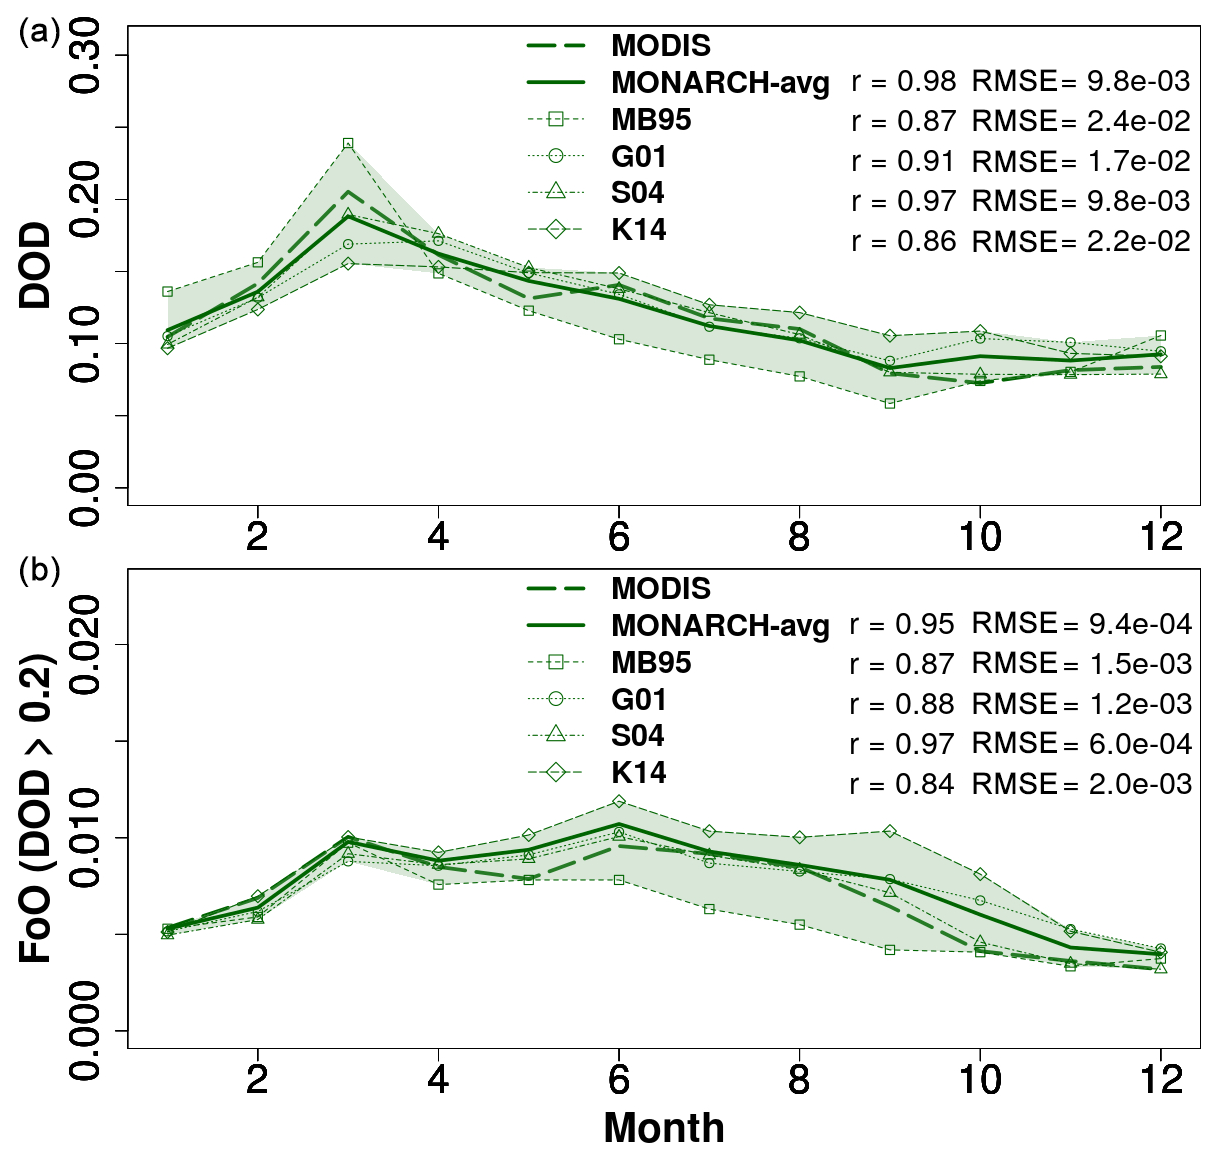
Figure 7Globally averaged monthly global DODcoarse (a) and FoO of DOD >0.2 (b) for MODIS (dashed green line) and MONARCH (DODcoarse all-sky co-located with MODIS observations) (green solid line). The shading indicates the range of DODcoarse across the four MONARCH experiments, which are also shown. Pearson correlation coefficients (r) and RMSE are given in the figure for both the experimental average as well as the individual runs.
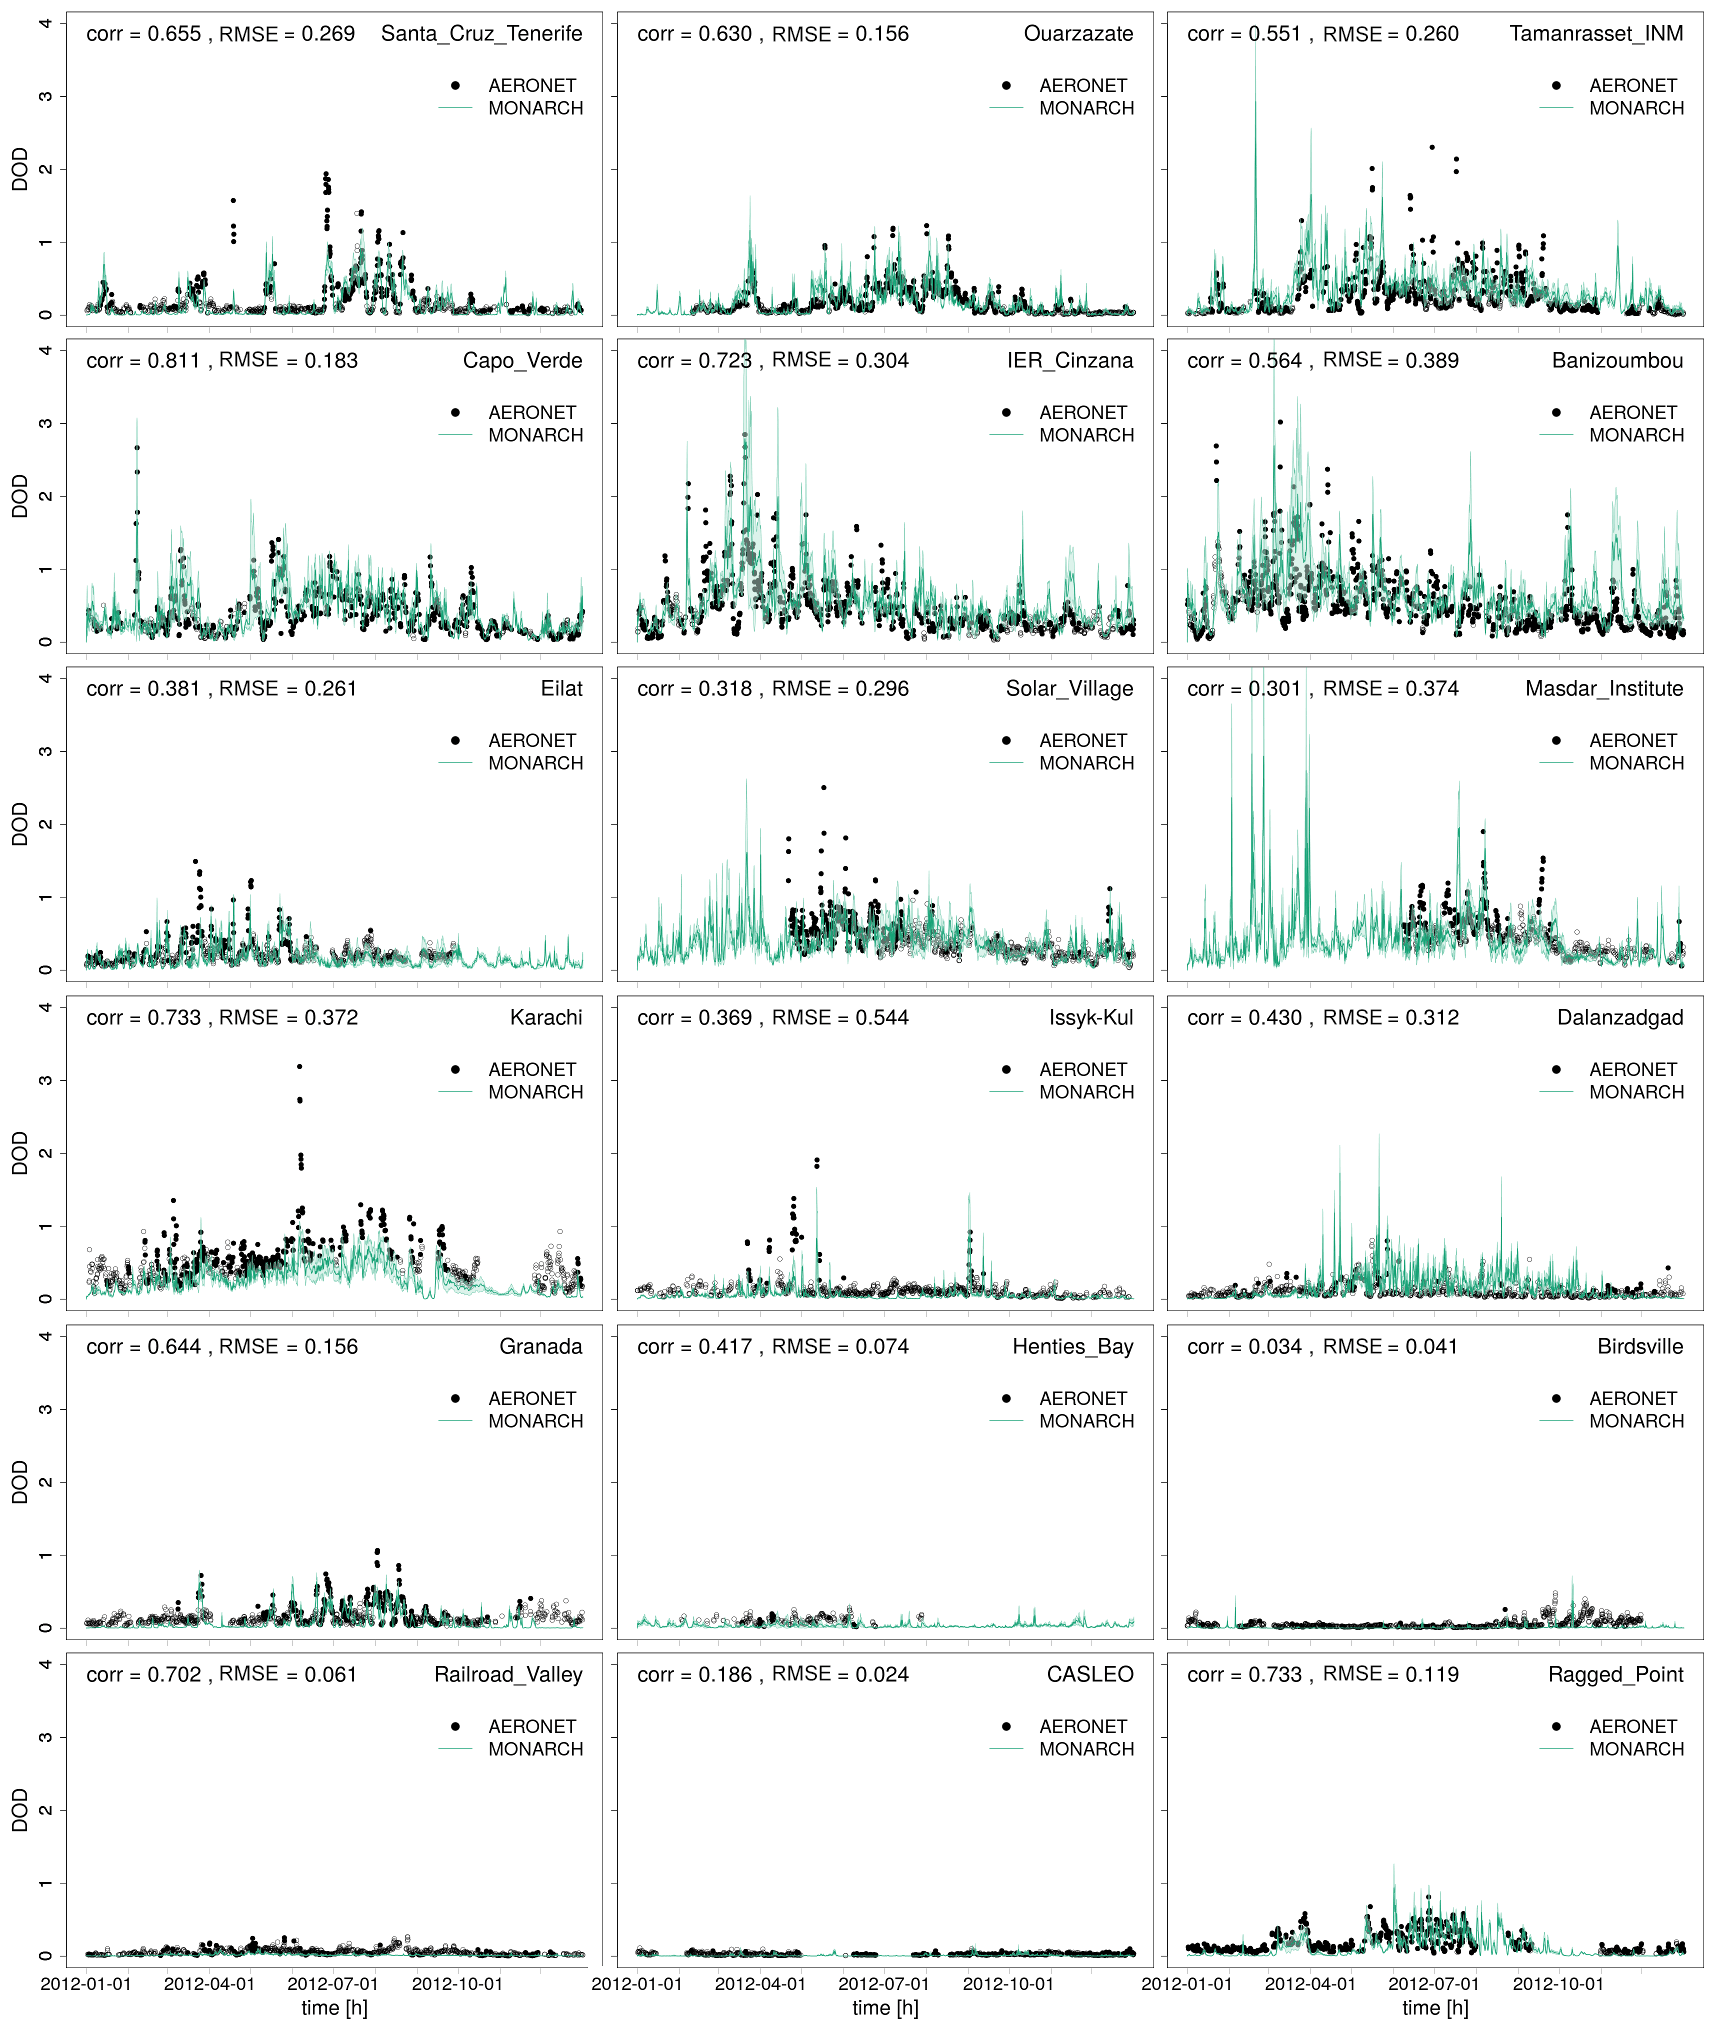
Figure 8Comparison of 3-hourly DOD between MONARCH (average (turquoise line) and standard deviation (shading)) and AERONET direct-Sun V3 level 2.0 for selected stations covering Cabo Verde and the Canary Islands (Capo Verde, Santa Cruz de Tenerife), the Sahara and Sahel (Ouarzazate, Tamanrasset, Cinzana, Banizoumbou), the Middle East (Eilat, Solar Village, Masdar Institute), Asia (Karachi, Issyk-Kul, Dalanzadgad), Europe (Granada), southern Africa (Henties Bay), Australia (Birdsville), and North and South America including the Caribbean (Railroad Valley, CASLEO, Ragged Point). The direct-Sun DOD is filtered for dust aerosol using Ångström exponent (AE) <0.3 (filled circles). Records which do not meet the AE criteria are less likely to be associated with dust and are shown as open circles. The Pearson correlation coefficients (corr) and RMSE are given in each panel.
4.3.1 Comparison of modeled DOD with MODIS Deep Blue
We estimate DOD from MODIS using daily AOD and SSA at 550 nm, and Ångström exponent (AE) of the Deep Blue Collection 6 Level 2 MODIS products (Hsu et al., 2013; Sayer et al., 2013) from the Aqua platform at 0.1∘ resolution (Ginoux et al., 2010). As in Ginoux et al. (2012) and Pu and Ginoux (2018), DOD is estimated from AOD using a continuous function of AE (Anderson et al., 2005). Pu and Ginoux (2018) estimated an error of for the DOD derived from MODIS Aqua.
To enable a direct comparison between MODIS satellite observations and MONARCH results independent of the model output frequency, MONARCH internally diagnoses the all-sky DOD for a given satellite overpass time for each day. The sampling of the satellite overpass time follows Quaas (2011, https://www.yumpu.com/en/document/read/19547757/modis-simulator-software-euclipse, last access: 8 October 2021) and is done based on a longitude-based local time (LLT). We assume 13:30 LLT as the overpass time of MODIS Aqua. Actual overpass times vary and may deviate slightly from this nominal time. The same diagnostic is also available for MODIS Terra (nominal overpass time 10:30 LLT). Other polar satellite overpasses can be implemented easily. For model evaluation, the MONARCH-modeled satellite DOD is additionally co-located in space and time with the satellite observations, i.e., grid cells for which the MODIS data contain missing values because of clouds are filtered from the MONARCH data for each day. MONARCH also estimates the DOD under clear-sky conditions (i.e., without clouds) based on the modeled cloud fraction and a coin-flipping method. The clear-sky DOD is currently diagnosed at the model output times (in contrast to the satellite overpass times available for the all-sky DOD). For that reason, we apply a post-processing and sample the clear-sky DOD for the output time closest to the satellite overpass time (subsequently termed “approximate satellite overpass time”). For comparison with the MODIS DOD, which discriminates coarse particles from the total AOD, we use modeled DOD in the size range 1.2–20 µm and refer to it as DODcoarse. We chose 1.2 µm as the lower diameter limit for DODcoarse as it coincides with that established in the AERONET inversion product (Dubovik and King, 2000). The size range of DODcoarse therefore corresponds to the five coarsest bins in MONARCH.
Figure 5 shows seasonal averages of MODIS DOD (left) and modeled global all-sky co-located DODcoarse at satellite overpass times (center) and clear-sky DODcoarse at approximate satellite overpass times (right) averaged across the four global MONARCH runs. The spatial patterns of observed DOD in northern Africa and the Middle East are well represented in MONARCH throughout the year. Distinct features are high DOD in the Bodélé area (somewhat overestimated mainly in MAM and SON) with elevated levels also toward the south/southwest in MAM and toward the west/northwest in JJA; and increased AOD along the eastern coast of the Arabian Peninsula in MAM and in its southern part in JJA. The spatiotemporal evolution of DOD in central Asia also agrees well between MONARCH and MODIS, with relatively low values in SON and DJF and increased DOD in particular in the Thar and Registan deserts in MAM and JJA. The DOD north of the Aral Sea is underestimated in MONARCH compared to MODIS in JJA. Likewise, DOD in the Taklamakan Desert is lower in MONARCH compared to MODIS in DJF and particularly in MAM. This may be related to the pronounced topographic features in the area, which are difficult to resemble at coarse model resolution. The DOD in Australia is relatively low throughout the year in both MODIS and MONARCH, but with areas of slightly increased DOD in northeastern Queensland in DJF, which are underrepresented in MONARCH. Similarly, a somewhat higher DOD in southern Africa in JJA and SON, in South America in SON and DJF, and in North America in MAM, JJA, and SON are underestimated in MONARCH. Global pattern correlations between MODIS and the MONARCH average range between 0.69 and 0.85 for all-sky co-located DODcoarse (area-weighted RMSE between 0.09 and 0.14) with stronger correlations in MAM and JJA than in other seasons. Note that the algorithm used to derive DOD from MODIS AOD cannot perfectly discriminate dust from other aerosols. This may lead to an overestimation of DOD in areas in which dust is not the dominant aerosol type and where other aerosols are present. Seasonal averages of modeled all-sky co-located DODcoarse for each individual model run are shown in Fig. B1.
Differences in the modeled all-sky co-located and clear-sky DODcoarse underline the impact of the time, location, and number of missing values on the average DODcoarse. The clear-sky DODcoarse tends to be somewhat smaller compared to the all-sky co-located DODcoarse, indicating a discrepancy between modeled and observed clouds, in combination with differences in the underlying DOD. However, the spatial patterns between both model products are overall consistent and achieve comparable pattern correlations and RMSE compared to MODIS. The reduced DODcoarse in northern Africa matches even better with the observed DOD, whereas the modeled clear-sky DODcoarse in the Arabian Peninsula is smaller than in the observations. Other areas show very similar results between the all-sky co-located and clear-sky model results.
Figure 6 shows the FoO of DOD >0.2, normalized by the number of days in each season, again for MODIS DOD (left), as well as modeled all-sky co-located (center) and clear-sky (right) DODcoarse. The spatial patterns of the observed FoO are very well captured by the MONARCH runs, in particular for the all-sky co-located FoO (pattern correlations between 0.81 and 0.92), for key dust sources in northern Africa (e.g., Erg of Bilma/Bodélé Depression, Grand Erg Oriental/Erg Chech, El Djouf desert), the Middle East (e.g., Rub' al Khali and Nefud deserts), and central and eastern Asia (e.g., Registan/Thar and Karakum deserts, Taklamakan, and Gobi deserts). Discrepancies in the all-sky co-located FoO magnitude between the model ensemble and MODIS depend on the season: the FoO is slightly underestimated in deserts east of the Caspian Sea in MAM and JJA, in South America and South Africa in JJA and SON, in Australia in SON and DJF, and in North America throughout the year. FoO values are slightly overestimated in the Arabian Peninsula in JJA and SON, and eastern north Africa in MAM and JJA. The modeled seasonal all-sky co-located FoO for each individual model run is shown in Fig. B2.
The FoO obtained from the modeled clear-sky DODcoarse is generally larger than that obtained from the all-sky co-located DODcoarse. Due to the normalization with the number of days in the season for calculation of the FoO, differences in the frequency and location of clouds in MONARCH and MODIS directly impact the resulting FoO. Over dust source regions, MONARCH produces considerably fewer cloud pixels in its clear-sky product and hence a larger number of valid data values than are in the MODIS observations (not shown). As a result, the clear-sky FoO is based on a larger number of valid (high-DODcoarse) values and is therefore larger than the MODIS and MONARCH all-sky co-located FoOs. With 0.77–0.88, clear-sky FoO pattern correlations are slightly weaker than those obtained for the all-sky co-located FoO.
Figure 7 shows global averages of monthly DOD and FoO from MODIS and the all-sky co-located DODcoarse from MONARCH. Globally, the DOD obtained with MODIS is reproduced well with MONARCH in all four experiments (Pearson correlation coefficient of 0.98 for the experimental average; between 0.86 and 0.97 for the individual runs). The DOD range across the four experiments is relatively similar throughout the year with the spread being the largest during the Northern Hemisphere peak dust season in March. The MB95 experiment contributes the largest DOD in January until March and the lowest during much of the remaining year, whereas the K14 experiment shows opposite behavior. The G01 and S04 experiments are intermediate between the other two runs and best resemble the monthly global DOD for the given configurations. The correlation between the FoO of DOD >0.2 from MODIS and from MONARCH is also very high (0.95 for the MONARCH average; between 0.84 and 0.97 for the individual runs). Whereas the results from the four experiments are very similar from November until April, the variability increases during the other months with the largest range in September. The results for the four individual runs are qualitatively similar to those for DOD, with the MB95 and K14 experiments providing, respectively, the lower and upper frames from approximately April until November, and the G01 and S04 runs being intermediate.

Figure 9(a–c) Scatter plots of 3-hourly, daily, and monthly DOD estimated from AERONET direct-Sun V3 level 2.0 (AE <0.3) and total DOD from MONARCH (average across runs) averages for the stations listed in Appendix C; panels (d–f) are the same as (a–c) but for AERONET O'Neill V3 level 2.0 and coarse (diameters 1.2–20 µm) MONARCH DOD. The Pearson correlation coefficient (corr) and RMSE are given in the plot.
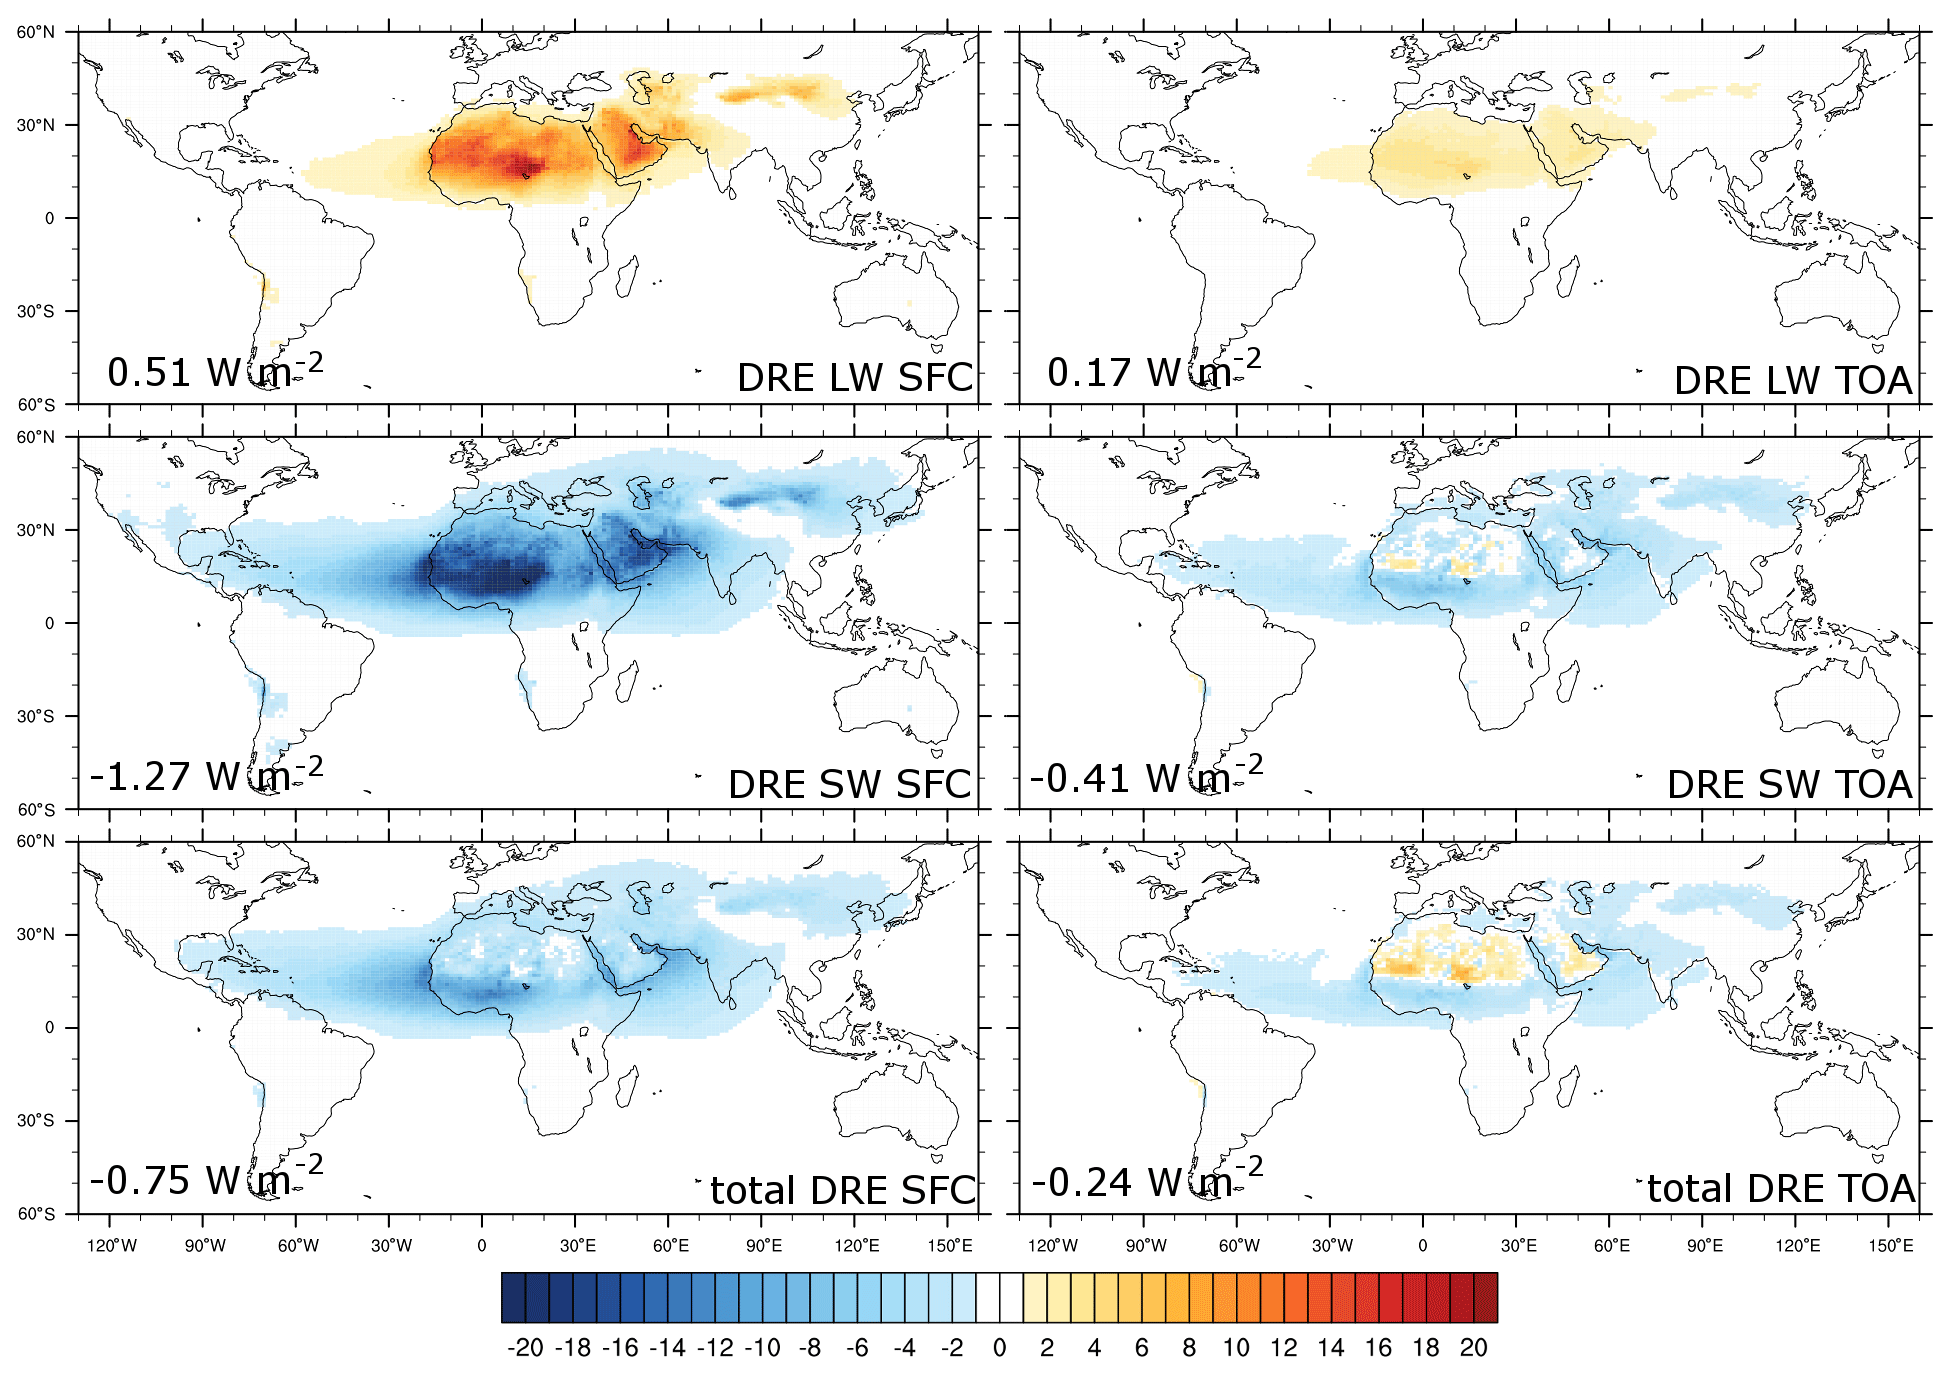
Figure 10Annual average longwave, shortwave, and total direct radiative effect [W m−2] at the surface (SFC) and the top of the atmosphere (TOA) obtained from MONARCH as average across the four runs. Global average values are indicated in each panel.

Figure 11Global averages of MONARCH-derived DRE [W m−2] for each run at the SFC and TOA for shortwave and longwave radiation and the total (shortwave and longwave). Shown are the relative contributions per bin, normalized with the absolute value of the DRE for all bins (left) and the DRE for all particle sizes (right). The diameter ranges and effective radii of each bin are given in, respectively, Sect. 3 and Table 6. The DRE results are also given in Appendix D.
4.3.2 Comparison of modeled DOD with AERONET
AERONET is a global network of ground-based solar photometer stations (Holben et al., 1998; O'Neill et al., 2003; Giles et al., 2019). The primary parameter derived by AERONET (i.e., direct Sun) is the AOD in multiple spectral channels with uncertainties lower than 0.03. AOD data are computed for three data quality levels: level 1.0 (unscreened), level 1.5 (cloud screened), and level 2.0 (cloud screened and quality assured). The products from inverting sky radiance measurements are the aerosol size distribution, single scattering albedo, refractive index, effective radius, and asymmetry factor. AERONET has very good coverage across the globe, albeit with lower station density in remote dust source regions, such as northern Africa, the Middle East, central/western Asia, and Australia. Recently, Sun–sky–lunar photometers extended the use of AERONET during nighttime (Barreto et al., 2013), allowing continuous aerosol monitoring.
Through AOD, AERONET gives information about the aerosol content and the mode-dominant type (i.e., fine or coarse modes) in the atmospheric column, but not the atmospheric dust burden. Almost pure mineral dust is difficult to find, except in specific areas close to desert dust sources. Instead, dust is often mixed in variable percentages with other aerosols. To isolate the atmospheric dust burden and estimate the DOD, two approaches are typically used.
The first approach aims to identify records in which the measured aerosol is dominated by mineral dust based on AE. AE is in general inversely related to the average size of the airborne particles and can be used to distinguish species with large particles like dust and sea salt. As a rule of thumb, a larger AE indicates smaller particle size. AE is typically in the range 0–4, where the upper limit corresponds to molecular extinction, and the lower limit corresponds to coarse-mode aerosols (sea salt and mineral dust), indicating no wavelength dependence of AOD (O'Neill et al., 2003). Since sea salt is related to low AOD (<0.03; Dubovik et al., 2002) and mainly affects coastal stations, large coarse-mode AOD values are mainly related to mineral dust. According to previous studies (Dubovik et al., 2002; Wang et al., 2004; Todd et al., 2007; Basart et al., 2009), AE values between 0.75 and 1.2 are associated with mixed aerosols (including dust). An AE lower than 0.2–0.3 is associated with a highly dominant coarse mode in the AERONET bi-modal size distribution (Schuster et al., 2006), which corresponds to almost pure dust conditions over land. Here, we use AE <0.3 to estimate AERONET DOD for comparison with the DOD (all sizes) obtained from MONARCH.
The second widely used methodology to estimate AERONET DOD is based on the spectral deconvolution algorithm (SDA) retrievals (O'Neill et al., 2003). The SDA algorithm estimates fine (submicron) and coarse (supermicron) AOD at a standard wavelength of 500 nm (AODfine and AODcoarse, respectively). Near dust source regions, DODcoarse≈ AODcoarse. The advantage of this method is the availability of retrievals in regions where dust occurrence is sporadic and other aerosols are predominant, and where a more restrictive criterion, such as AE < threshold may filter out some dust intrusions (Cuevas et al., 2015). As DODcoarse from MONARCH, we use DOD in the diameter range 1.2–20 µm.
For comparison with AERONET, we use bilinear interpolation to extract time series from the 3-hourly global model DOD and DODcoarse for the locations of AERONET measurements. We use 3-hourly averages of AERONET observations, such that a comparison with the 3-hourly instantaneous MONARCH data assumes a statistical similarity between the temporally averaged AERONET DOD and DODcoarse and the spatially interpolated MONARCH DOD and DODcoarse. Figure 8 shows time series of 3-hourly DOD from AERONET direct Sun and MONARCH for 18 selected stations in the vicinity of dust sources around the globe: four stations in northern Africa and two stations in the typical dust outflow region west of northern Africa; three stations in the Middle East; three stations in Asia; and one station each in Europe, southern Africa, Australia, North America, South America, and the Caribbean. In addition, Fig. 9 compares modeled and observed DOD and DODcoarse for the 57 stations listed in Appendix C. The station locations are shown in Fig. C1. The time series demonstrate an overall good agreement between the average modeled and observed DOD where the temporal variability is mostly reproduced with discrepancies for individual DOD peaks. Consistent with MODIS DOD, the AERONET DOD tends to be small at the stations in southern Africa, Australia, and North and South America, and AE is often not below 0.3, i.e., at least part of the DOD is likely due to aerosols other than dust. Correlations between MONARCH and AERONET are smaller for these stations, because MONARCH DOD represents pure dust and because a mismatch between individual peaks receives more weight if the number of dust episodes is small. The Pearson correlation coefficients for all other stations range between around 0.3 (Masdar Institute, Solar Village) and 0.7 (IER Cinzana, Karachi, Ragged Point).
Taking into account the entire station list (Appendix C), the correlation is 0.61 with a RMSE of 0.31 for the total DOD and, 0.71 with an RMSE of 0.14 for DODcoarse, based on the 3-hourly MONARCH data (Fig. 9). For total DOD, the correlation remains fairly constant when comparing daily and monthly instead of 3-hourly values. The RMSE decreases slightly with an increasing averaging period as then discrepancies for individual peaks become less relevant. A similar behavior is found for DODcoarse, but with a slightly more pronounced increase also of the correlation. The overall agreement between MONARCH and AERONET is also similar across experiments (Fig. C2); however, the MB95 and S04 schemes tend to overestimate events with large DOD, whereas the G01 and K14 show an underestimation of such situations. As a result, the individual schemes show a slightly lower correlation and higher RMSE than the experimental average for both DOD and DODcoarse.
4.4 Direct radiative effect
Figure 10 shows the shortwave, longwave, and total direct radiative effect (DRE) at the surface (SFC) and the top of the atmosphere (TOA). The longwave DRE at the SFC is positive and most pronounced in the dust belt ranging across northern Africa, the Middle East, and southwestern Asia. In the dustiest areas of northern Africa and the Middle East, the longwave SFC DRE reaches between 10 and 20 W m−2. This strong sensitivity to the presence of dust is a result of the low atmospheric moisture content in this area. High near-surface atmospheric temperatures enhance the longwave downwelling radiation (Miller et al., 2014). The longwave DRE at the TOA is smaller and typically under 5 W m−2 due to the opposing effects of scattering and absorption by dust at the TOA. The shortwave DRE is strongly negative at the SFC, with values exceeding −20 W m−2 in the main dust regions. At the TOA, the shortwave DRE is slightly negative in most areas but slightly positive in some of the northern African dust sources related to the relatively bright underlying desert surface. This results in a negative total DRE at the SFC, with the largest (negative) values in the Sahel, the eastern Atlantic, and the Arabian Sea. At the TOA, the total DRE is positive around the main north African dust sources and slightly negative/neutral elsewhere. The globally averaged DRE at the SFC and TOA for all particle sizes as well as from each bin (relative contribution with respect to the DRE for all sizes) is summarized in Fig. 11 and listed in Table D1.
We note that the mineralogy-based set of refractive indices used in this work describes a more scattering dust in the shortwave with respect to other widely used prescriptions (e.g., Patterson et al., 1977; Hess et al., 1998). At the TOA, the shortwave DRE closely oscillates around zero over bright surfaces, such as in the Sahara and Saudi Arabia, and the total DRE does not exceed about 10 Wm−2 in these regions. In contrast, Balkanski et al. (2007), for example, obtained a total DRE at the TOA of up to 20 Wm−2 over the Sahara when using Patterson et al. (1977) (Volz, 1973 in the longwave) and lower positive values in this region (in agreement with our values) when using the mineralogy-based refractive indices with a hematite content of 1.5 % by volume. Note that Balkanski et al. (2007) found these refractive indices to be in a better agreement with AERONET retrievals (Dubovik et al., 2002), similar to what was found by Gonçalves Ageitos et al. (2021a) for our refractive indices. Moreover, Miller et al. (2006) obtained a global average total DRE at the TOA of −0.39 Wm−2 using refractive indices from Sinyuk et al. (2003) (Volz, 1973 in the longwave). On the other hand, Miller et al. (2014) reported a value of 0.39 Wm−2 calculated using the dust distribution from Miller et al. (2006) and refractive indices from Patterson et al. (1977). Our negative value of −0.24 Wm−2 is therefore again more comparable with more scattering dust as described by the refractive indices of Sinyuk et al. (2003). The inclusion of particles larger than 20 µm would likely lead to a slightly more positive DRE.
We presented the description of mineral dust in the Multiscale Online Non-hydrostatic AtmospheRe CHemistry model (MONARCH) version 2.0. MONARCH contains multiple state-of-the-art options to represent dust emissions on global and regional scales, ranging from more simplified to more complex parameterizations based on physical processes. We tested and evaluated a set of four global model configurations for the year 2012. Comparison with observations of dust optical depth from MODIS and AERONET showed a good model reproduction of key features of the observed dust cycle. Global annual dust emissions ranged between around 3500 and 6000 Tg. Differences in modeled dust emissions between the four configurations were mainly driven by the dust source description (use of a preferential source mask or not) and the particle-size distributions at emission. Dust deposition ranged between about 3450 and 5900 Tg in 2012 globally, yielding an average dust load of 29–41 Tg. The smaller range of simulated load among experiments is due to the shorter lifetime of the coarse particles included in the S04 scheme that exhibits larger emission. The total direct radiative effect obtained from the MONARCH simulations is slightly negative at the surface in dust transport regions. At the top of the atmosphere, the total direct radiative effect is positive near the main north African dust sources and slightly negative/neutral elsewhere.
The multifaceted options of MONARCH and its dust component, combined with an advanced workflow management for use in high-performance computing environments, makes it a powerful and versatile tool applicable for process studies, operational forecasting, and climate research. In the following, we outline a few ongoing activities related to the MONARCH dust component to demonstrate its capabilities.
Dust ensemble runs can be generated with MONARCH by utilizing the diverse model configurations and by perturbing model parameters related to, for example, surface winds, soil humidity, and the spatial distribution of dust emission, which are deemed to be uncertain. In Di Tomaso et al. (2017), perturbations were applied to the threshold friction velocity and the dust emission flux per size bin. In Escribano et al. (2021), different dust emission schemes – or linear combinations thereof – are used by different ensemble members. Combined meteorology and emission perturbations were shown to be necessary to produce sufficient ensemble spread in (dust) aerosol outflow regions (Rubin et al., 2016). This can be achieved using different meteorological fields as initial and boundary conditions in the meteorological driver of MONARCH (NMMB) for each forecast run in the ensemble, in addition to the dust perturbations. In the dust reanalysis currently in production at the BSC, we use an ensemble based on stochastic perturbations of emission parameters, in conjunction with emission schemes with different physics and different meteorological initial and boundary conditions (Di Tomaso et al., 2021).
Airborne dust is not a homogeneous entity but a mixture of minerals, the relative amounts of which depend on the source region. Mineralogy affects a variety of dust-related impacts, e.g., interaction with radiation, atmospheric chemistry, or nutrient supply to certain ecosystems. The capability to explicitly represent dust composition was recently added to MONARCH allowing the tagging of up to 12 different minerals. This new feature is currently used to assess the relevance of dust mineralogy for dust impacts and to provide insights for the near-term atmospheric and climate modeling communities (Gonçalves Ageitos et al., 2021b).
The combination of different vegetation input data sets, drag partition approaches, and the source tagging capability allows us to represent the seasonal vegetation dynamics and provides an ideal basis to investigate the importance of dust from anthropogenic (agricultural) sources, for which a key driver is the seasonal vegetation growth and decay. The benefit of online estimates within a modeling framework is that not only the emission but also the transport, deposition, and effect of anthropogenic dust can be investigated (Klose et al., 2018).
Figure A1 shows the percent contribution of dust emission and deposition at each location to their respective global and annual totals to visualize regional differences between the different experiments independent from the overall emission (deposition) magnitudes obtained.
Table A1 lists the relative contributions from different source regions to global annual dust emissions are summarized in Table A1. The dust source definitions are as in Kok et al. (2021b).
Table A1Percentage contributions of different dust source regions (definitions as in Kok et al., 2021b) to global annual dust emissions with the four presented configurations.
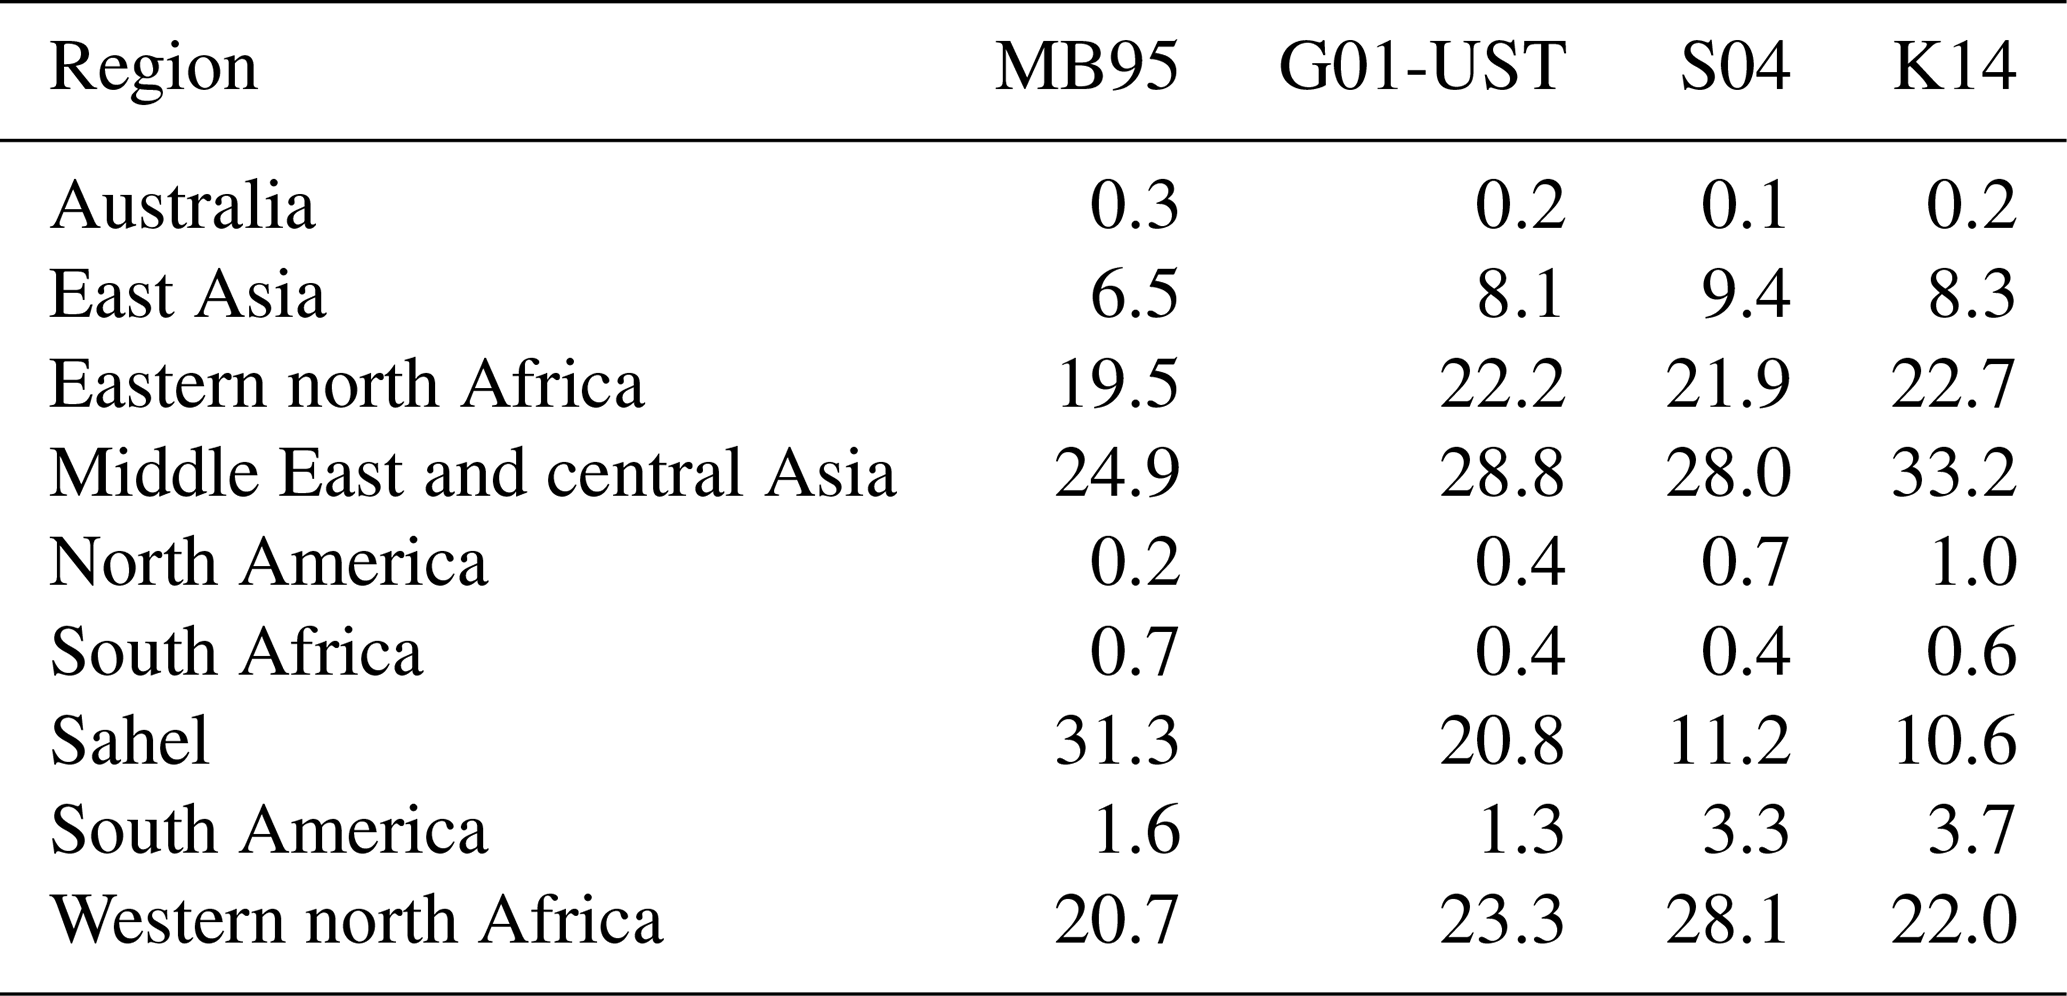
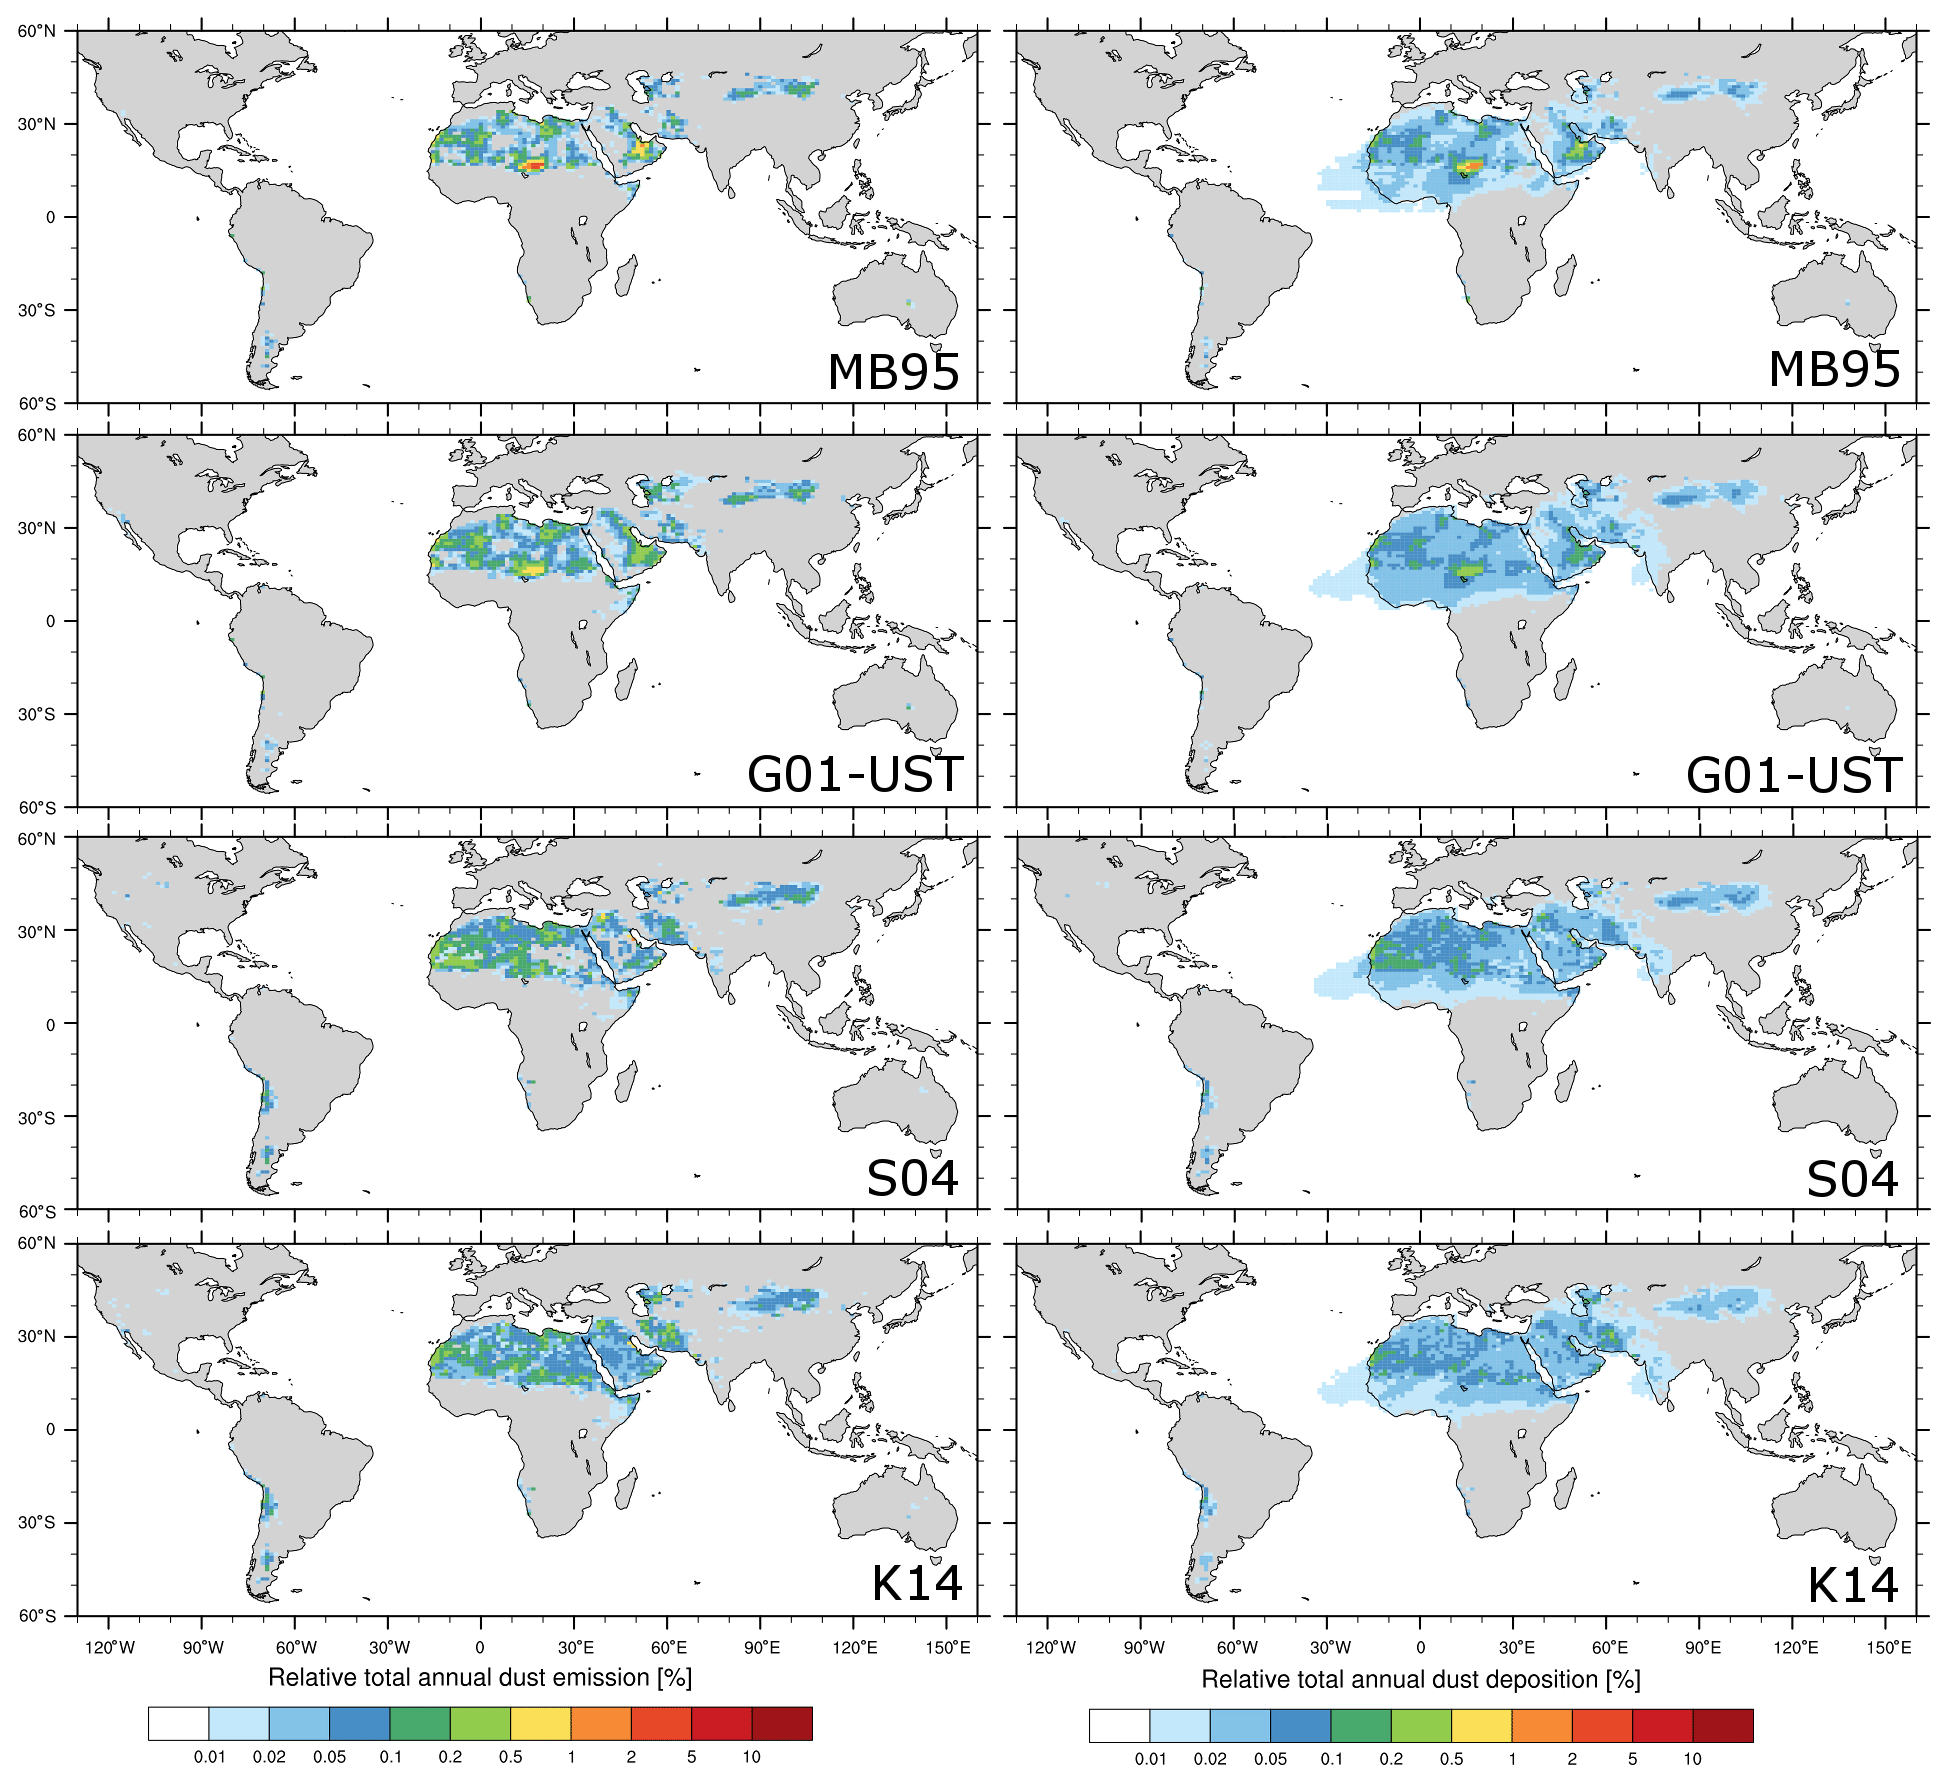
Figure A1Percent contribution of dust emission (left column) and deposition (right column) to their respective global and annual totals for the four experiments described in Sect. 4.1.
Figures B1 and B2 show the DOD and FoO of DOD >0.2 for MODIS and MONARCH (all-sky DODcoarse at satellite overpass time co-located with MODIS) for the four MONARCH experiments using the MB95, G01-UST, S04, and K14 dust emission schemes.

Figure B1Seasonally averaged MODIS Deep Blue DOD (left) and MONARCH all-sky DODcoarse at satellite overpass times co-located with MODIS DOD for the MB95, G01-UST, S04, and K14 runs. The seasonal averages were calculated with respect to the number of valid values per grid cell in the MODIS product. Area-weighted RMSE and uncentered Pearson product-moment coefficient of linear correlation (r) are indicated in the respective panels.
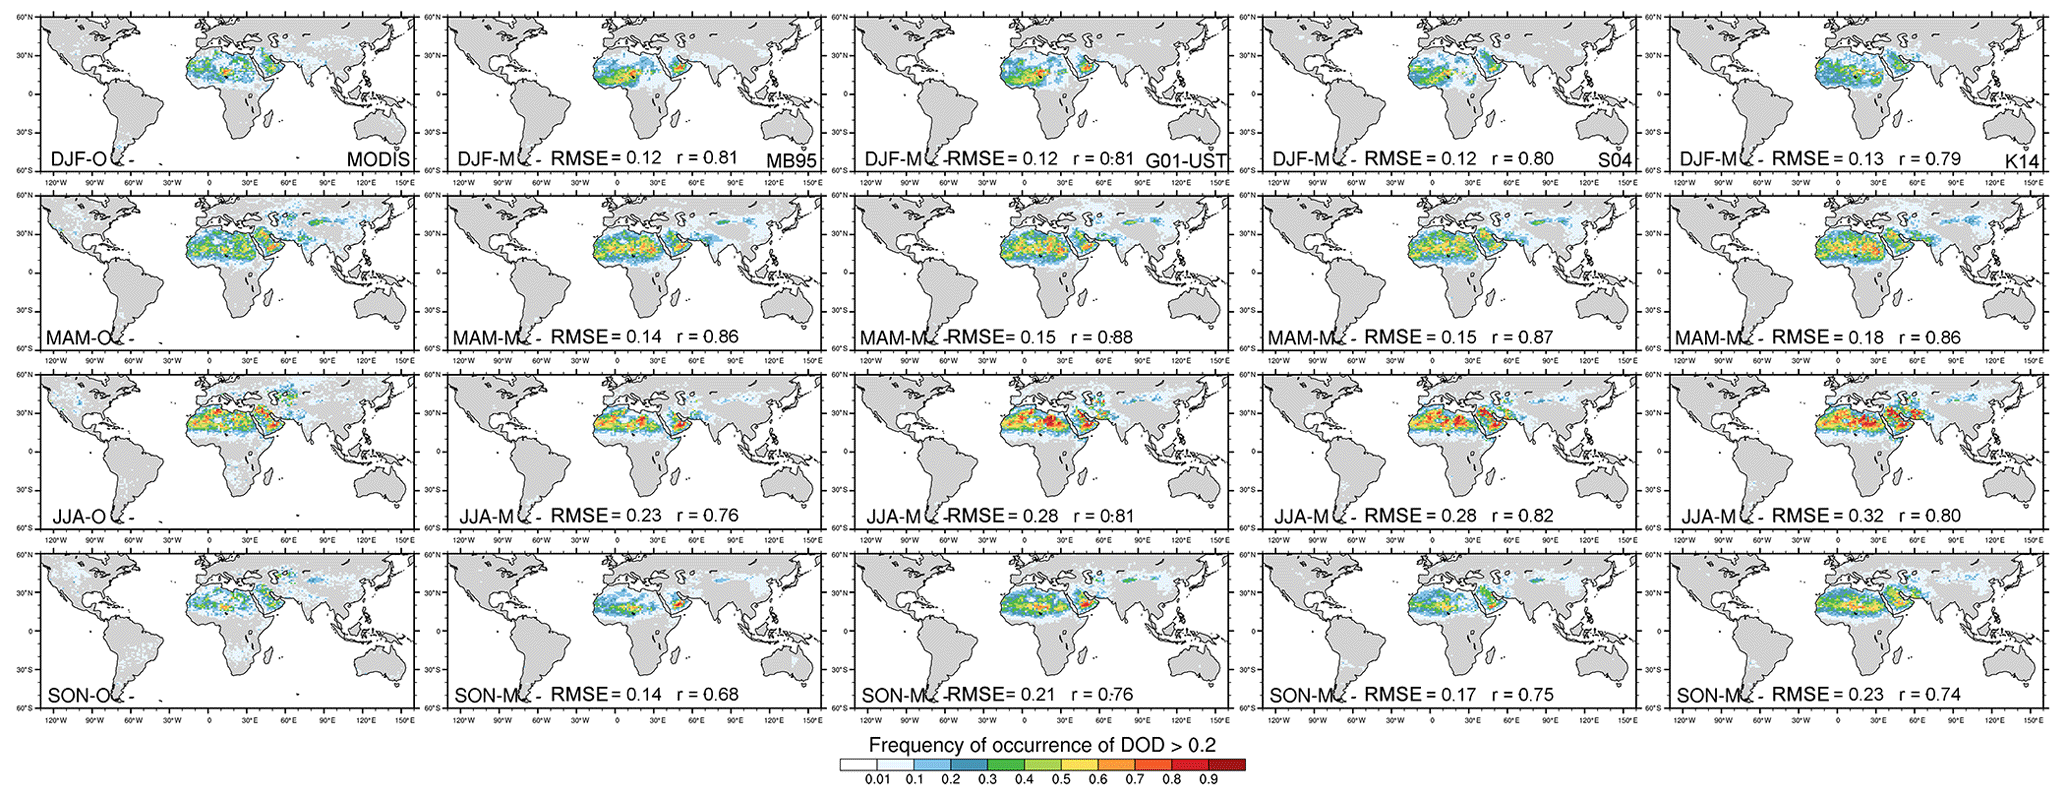
Figure B2Seasonally averaged FoO of DOD >0.2, normalized by the number of days per season for MODIS Deep Blue (left) and MONARCH all-sky DODcoarse at satellite overpass times co-located with MODIS DOD for the MB95, G01-UST, S04, and K14 runs. The FoO was calculated with respect to the number of days in the season. Area-weighted RMSE and uncentered Pearson product-moment coefficient of linear correlation (r) are indicated in the respective panels.
The AERONET stations used for comparison with MONARCH and to obtain the global calibration factor are listed in Table C1 and shown in Fig. C1. They cover the main dust source regions around the globe. The intention of using only a subset of all stations is to increase confidence in that aerosol detected by AERONET photometers is predominantly dust.
Figure C2 compares 3-hourly DOD estimated from AERONET direct-Sun V3 level 2.0 (AE <0.3) and AERONET O'Neill V3 level 2.0 with, respectively, 3-hourly total DOD and DODcoarse from MONARCH for all four experiments (MB95, G01, S04, and K14) taking into account the stations listed in Table C1.
Table C1List of AERONET stations used for comparison with MONARCH results.
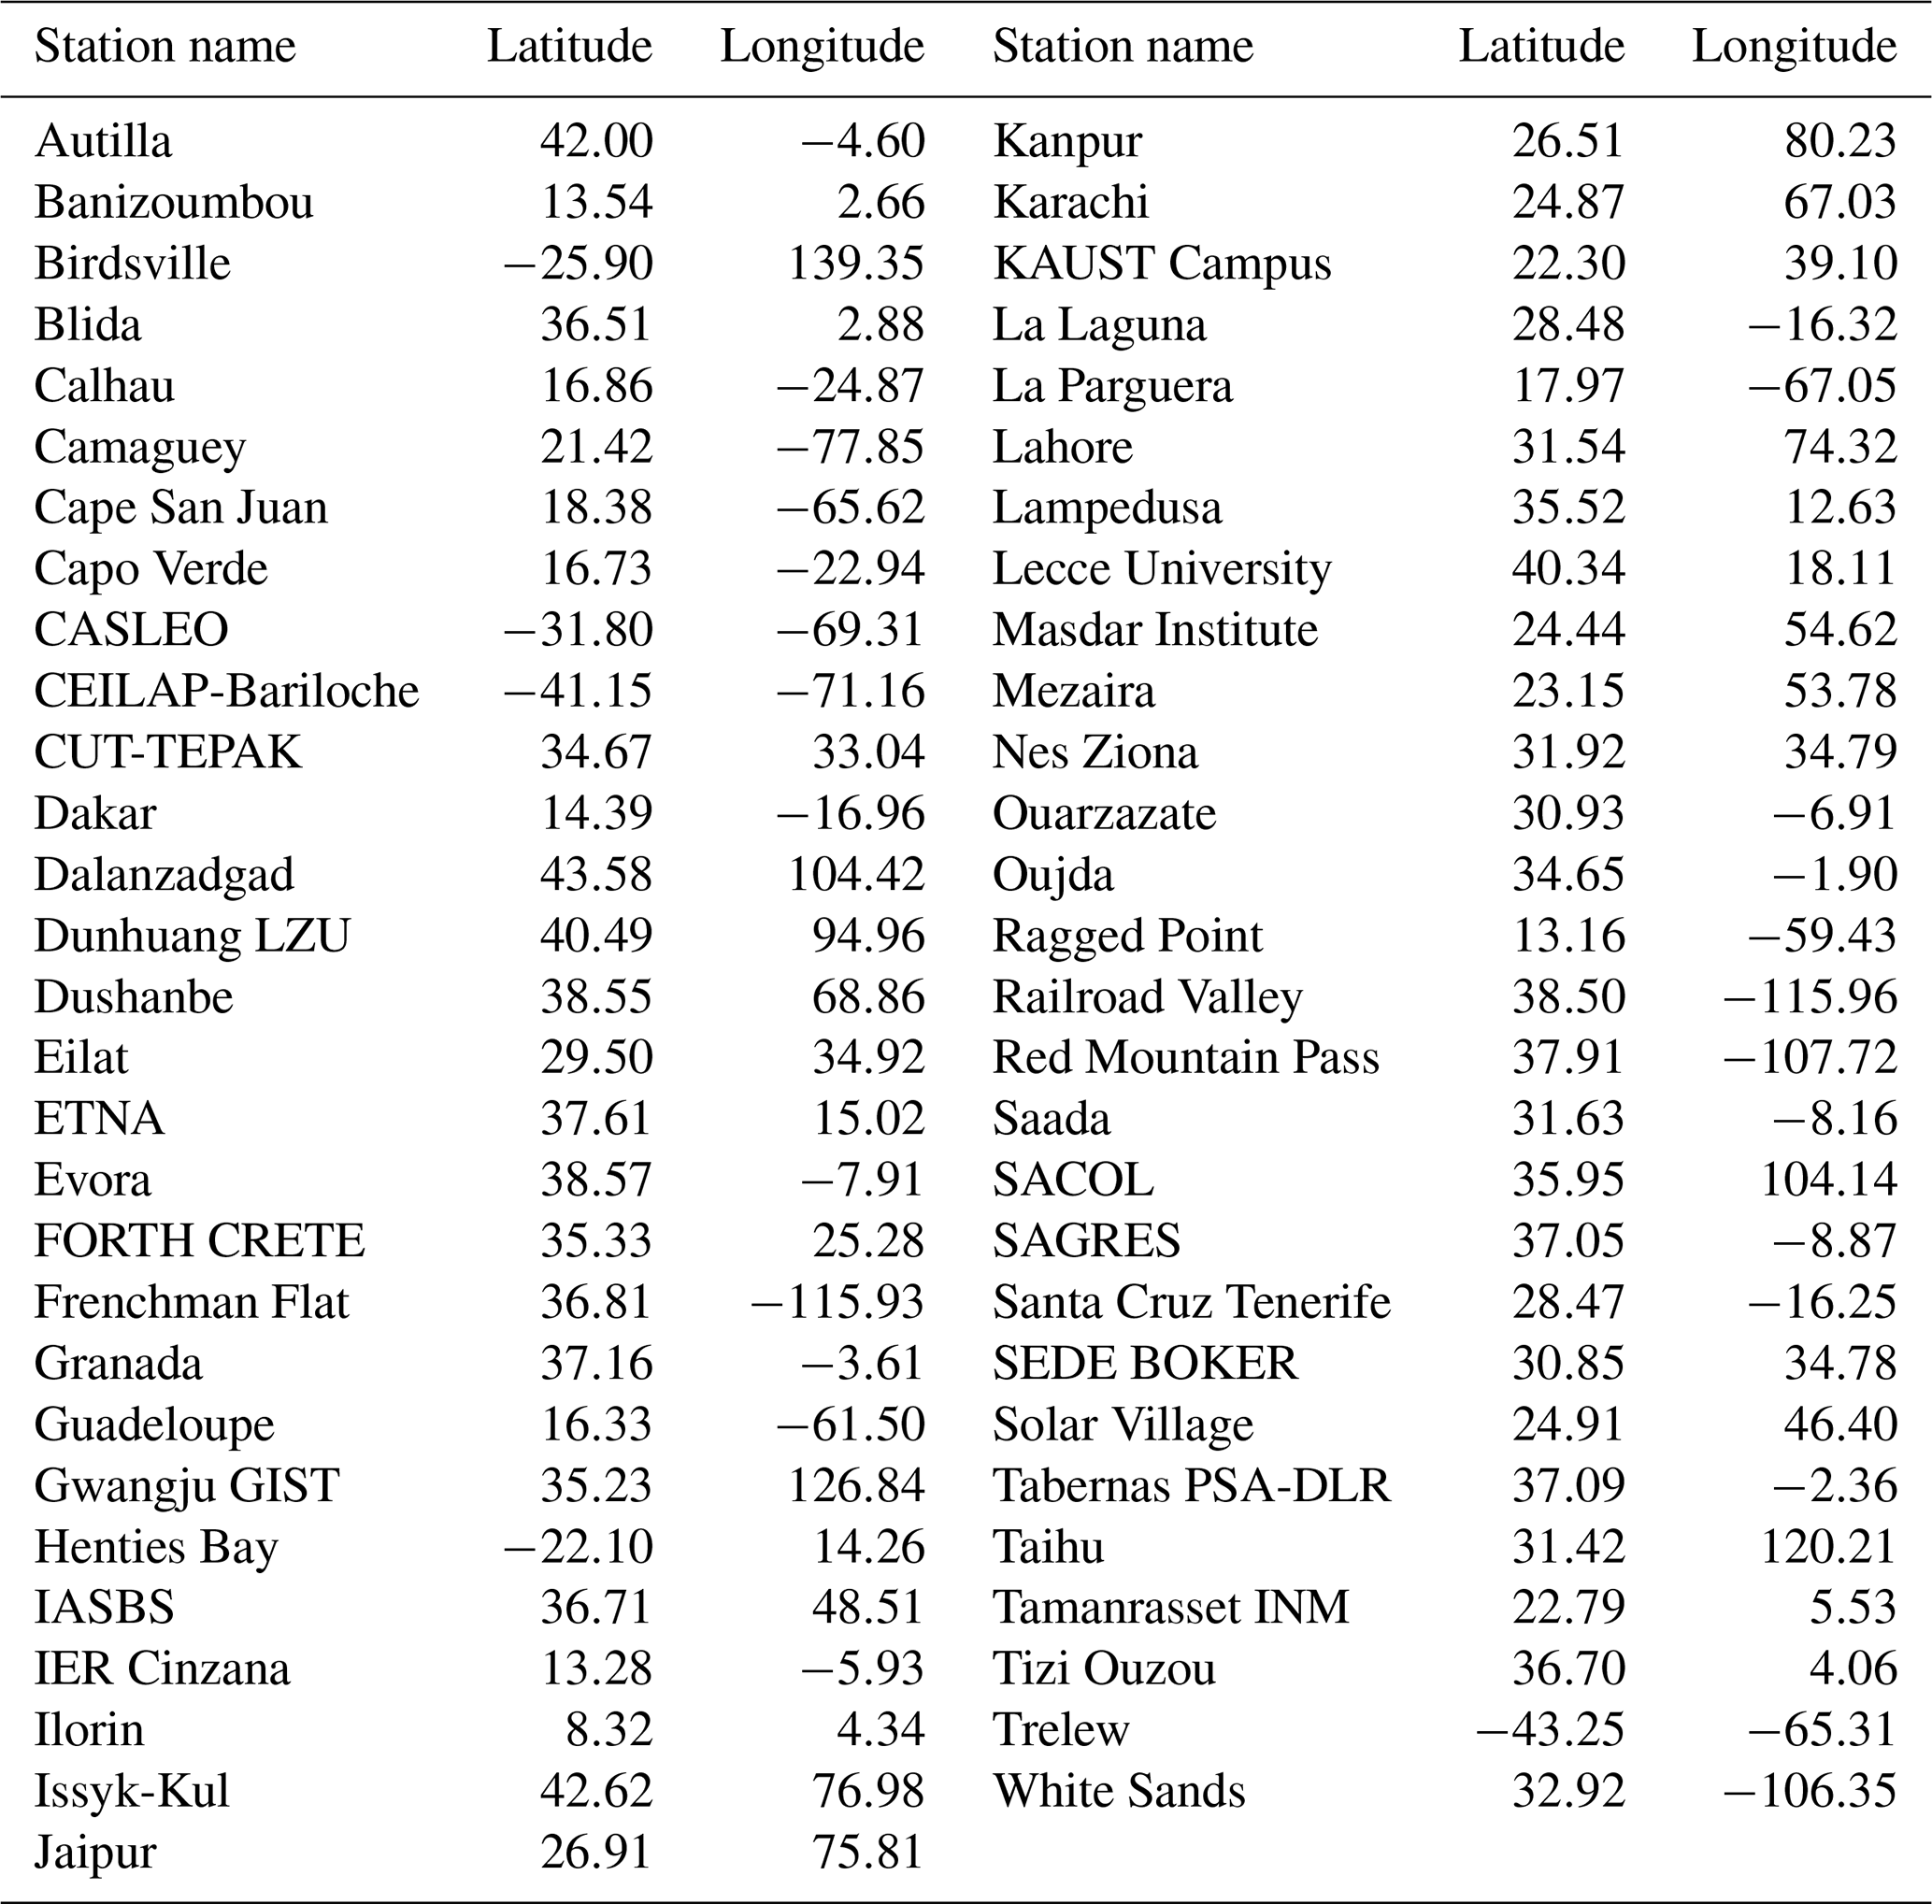
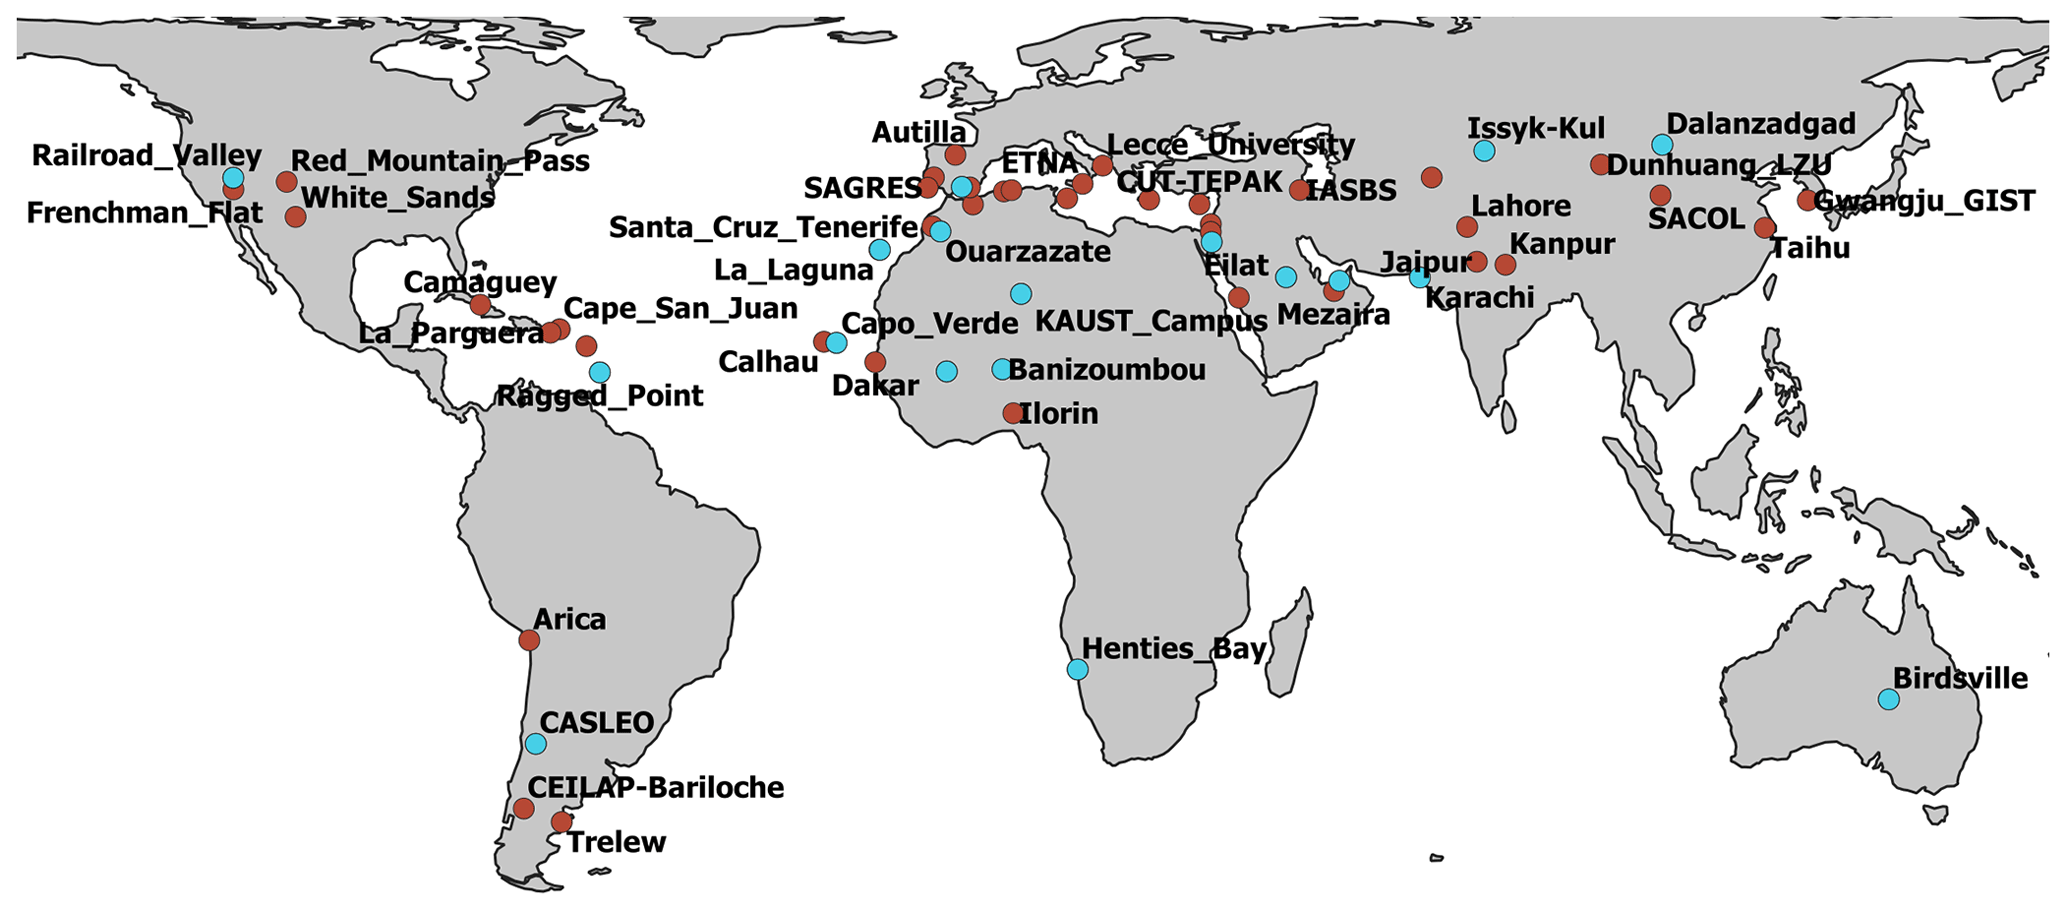
Figure C1AERONET stations (direct-Sun V3 level 2.0) available in 2012. The station subset used for comparison with MONARCH are shown in turquoise, whereas all other stations are marked in red.
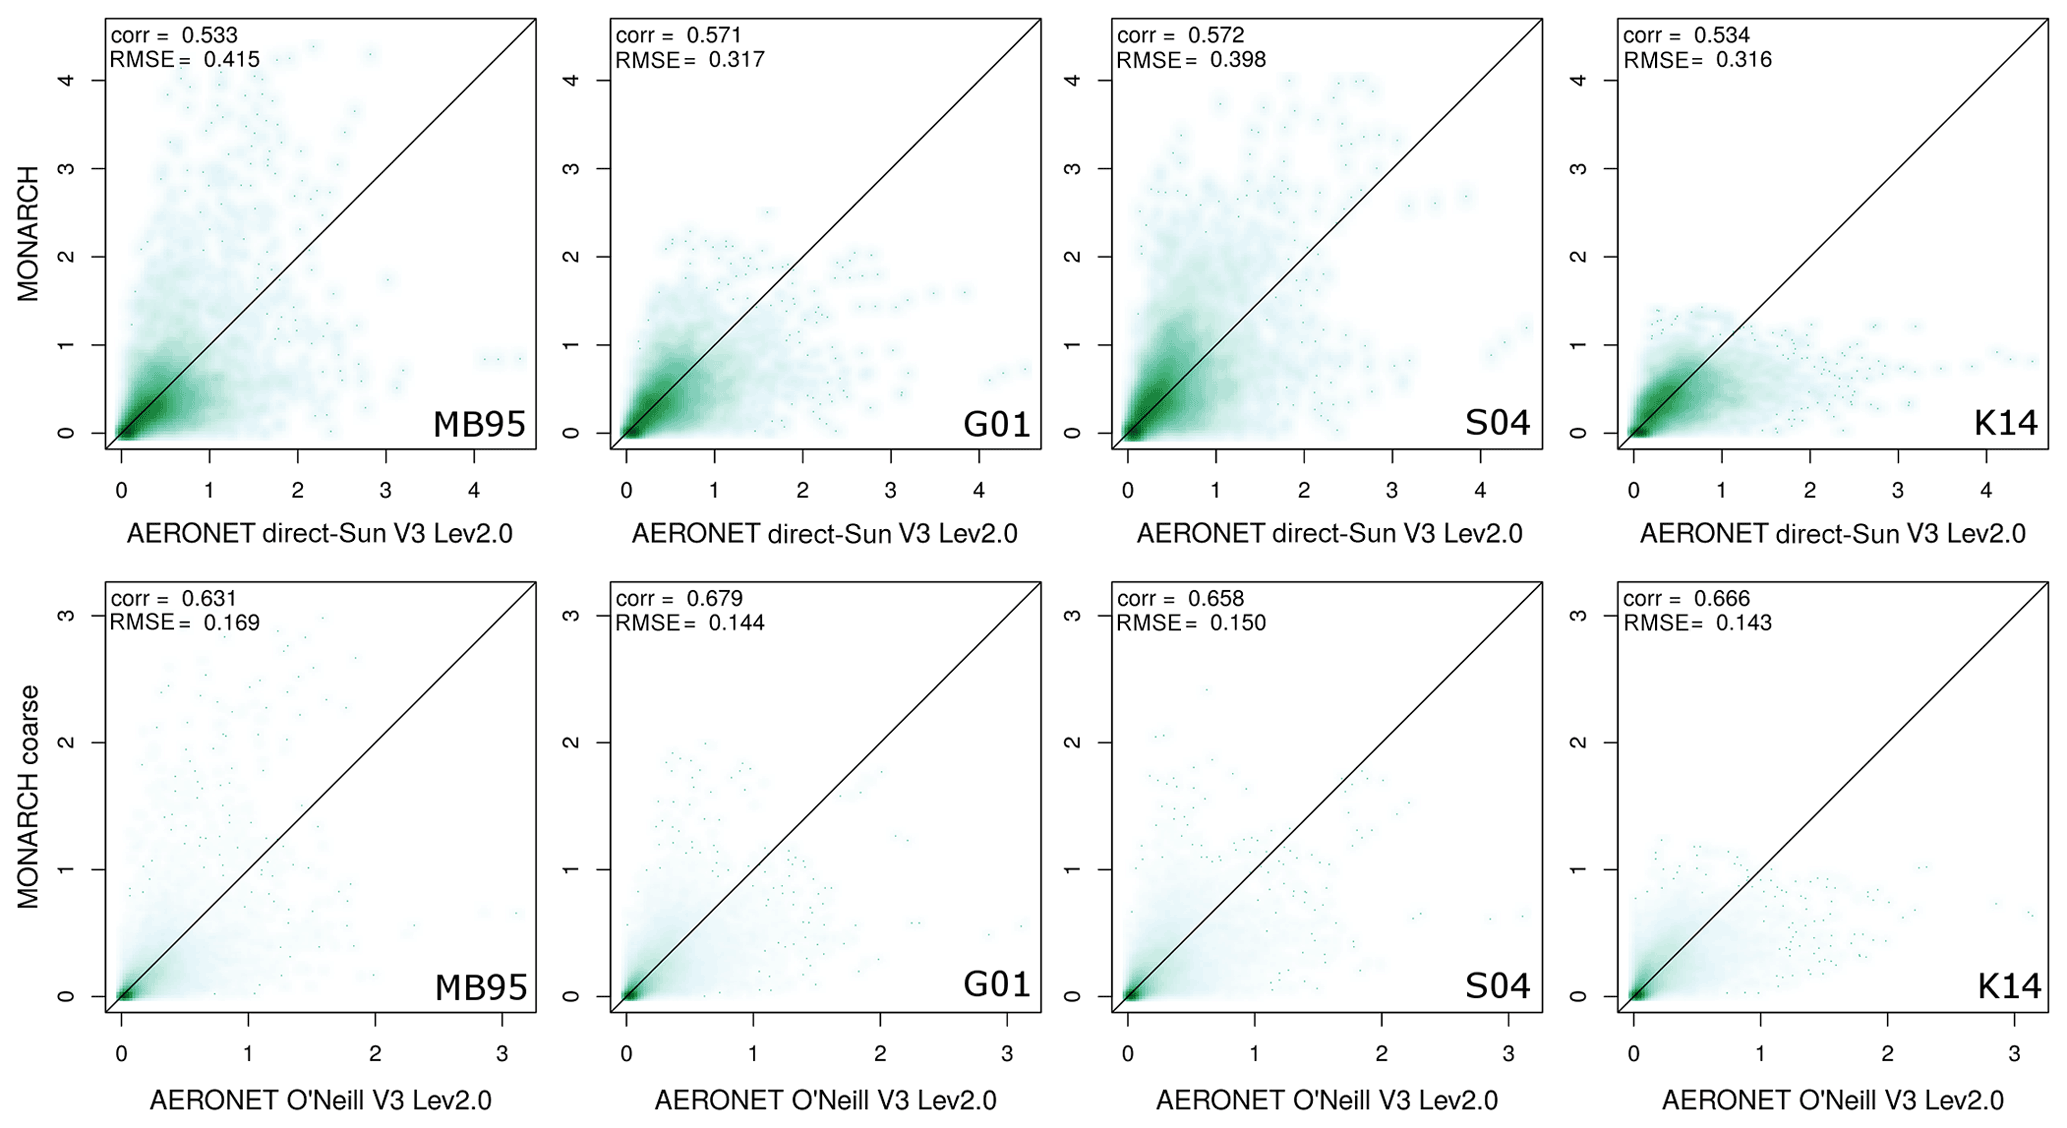
Figure C2Scatter plots (top) of 3-hourly DOD estimated from AERONET direct-Sun V3 level 2.0 (AE <0.3) and total DOD from MONARCH by experiment (MB95, G01, S04, and K14) for the stations listed in Appendix C; the bottom is the same as the top but for AERONET O'Neill V3 level 2.0 and coarse (diameters 1.2–20 µm) MONARCH DOD. The Pearson correlation coefficient (corr) and RMSE are given in the plot.
Table D1 gives the relative contributions of each particle-size bin to the global average DRE for each MONARCH run.
Table D1Global averages of MONARCH-derived DRE [W m−2] (all particle sizes and relative contribution per bin) for each run at the SFC and TOA for shortwave and longwave radiation and the total (shortwave and longwave). Results are visualized in Fig. 11. The diameter ranges and effective radii of each bin are given in, respectively, Sect. 3 and Table 6.
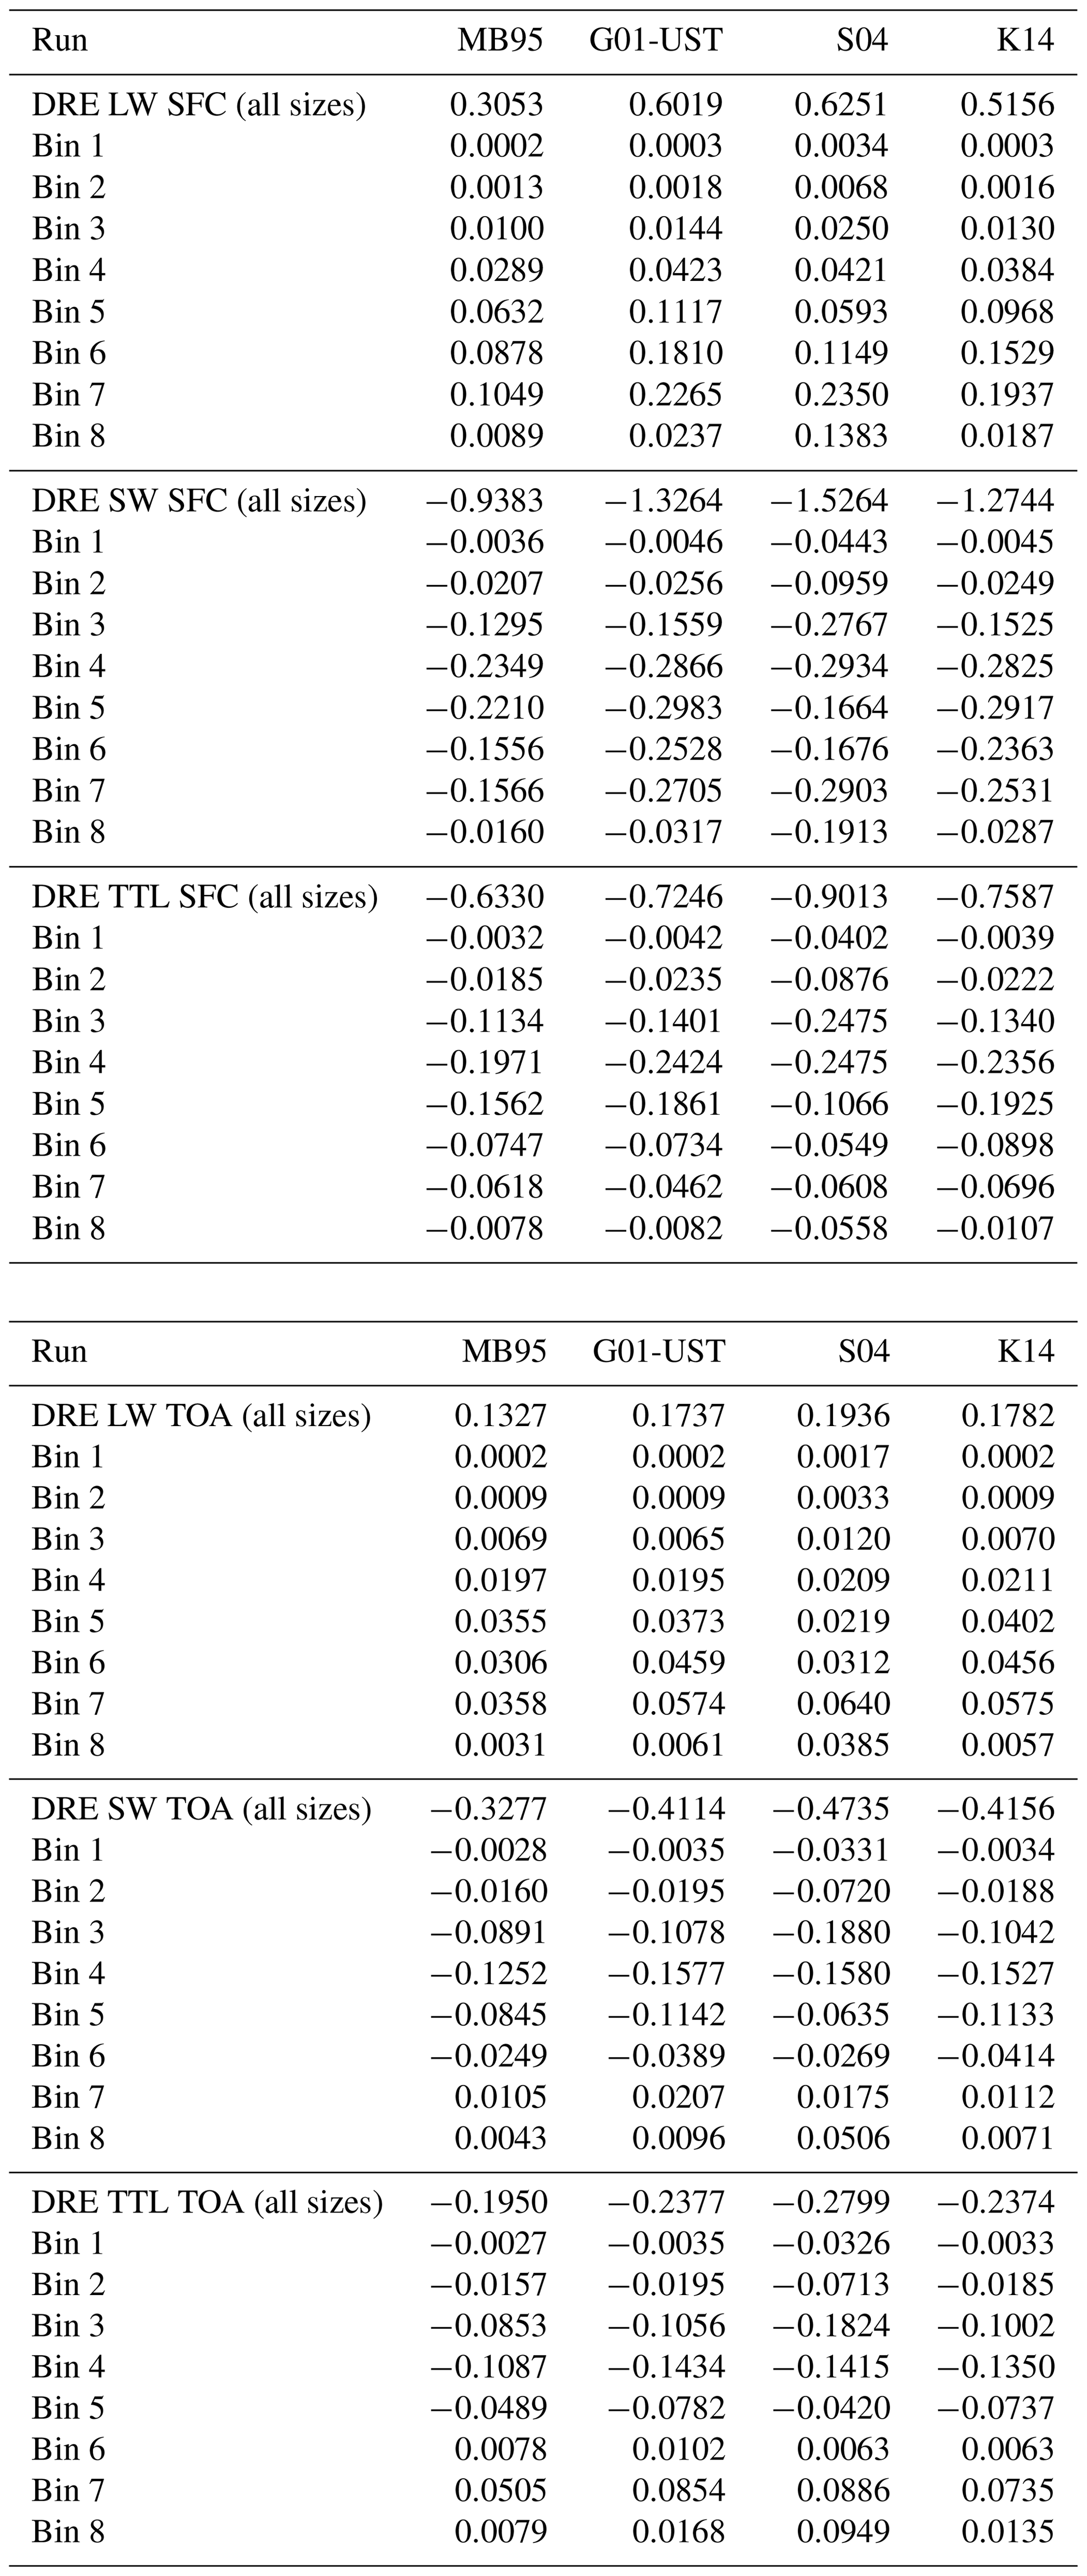
| a | coefficient in soil moisture correction from Fécan et al. (1999) |
| α | coefficient in soil moisture correction from Klose et al. (2014) |
| αq | vertical-to-horizontal-flux ratio |
| b | coefficient in soil moisture correction from Fécan et al. (1999) |
| β | coefficient in soil moisture correction from Klose et al. (2014) |
| βR | coefficient in drag partition correction from Raupach et al. (1993) |
| βR | ratio of roughness element to surface drag coefficients |
| Cα | coefficient in K14 scheme |
| Ce | coefficient in K14 scheme, dependent on u*st |
| soil moisture scaling factor | |
| soil moisture scaling factor | |
| cλ | coefficient |
| cQ | coefficient |
| CG01 | dimensional factor in G01 scheme |
| cthr | scaling coefficient |
| cy | coefficient in S01, S04, and S11 schemes |
| dc | coarse particle diameter in drag partition of Marticorena and Bergametti (1995) |
| Dη | diameter of vegetation patches |
| di0, di1 | lower and upper diameter limits of the particle-size bin corresponding to di |
| di | dust-particle diameter |
| ds | saltation diameter |
| dmax | upper diameter limit of dust in MONARCH; currently dmax=20 µm |
| ηci | aggregated dust fraction at diameter di |
| ηfi | total dust fraction at diameter di |
| ηmi | free dust fraction at diameter di |
| ηbr | bedrock cover fraction |
| ηsnow | snow/ice cover fraction |
| η | vegetation cover fraction |
| fclay | clay fraction |
| fv | drag partition correction |
| F | vertical dust emission flux |
| constant in soil moisture correction from Belly (1964) | |
| fw | soil moisture correction factor |
| γ | function in S04 scheme (Eq. 5) |
| g | gravitational acceleration [m s−2] |
| hmax | maximum annual vegetation height (relevant for dust emission) for use in drag partition |
| h | vegetation height |
| hw | function in soil moisture correction from Klose et al. (2014) |
| κ | coefficient in S01 and S04 schemes |
| λ | roughness density (frontal area index) |
| m | coefficient in drag partition correction from Raupach et al. (1993) |
| mΩ | soil mass removed by a saltation impact; mΩ=ρbΩ |
| mp | particle mass |
| mass of particles with diameter ds | |
| Msand | sand fraction |
| n | number of vegetation patches |
| Ω | soil volume removed by a saltation impact |
| pf | fully dispersed particle-size distribution [m−1] |
| pm | minimally dispersed particle-size distribution [m−1] |
| ps | airborne sediment particle-size distribution in the S11 scheme [m−1] |
| ψ* | function in K14 scheme |
| ψs | saturation capillary pressure head [m] |
| P | soil plastic pressure [Pa] |
| Q | horizontal saltation flux |
| Qs | saltation flux of a particle with diameter ds |
| re | effective radius [m] |
| ρa0 | reference air density; ρa0=1.225 kg m−3 |
| ρa | air density [kg m−3] |
| ρbd | bulk density of dry soil [kg m−3] |
| ρb | soil bulk density (approximately 1000 kg m−3) |
| ρl | water density [kg m−3] |
| ρpa | average soil particle density; ρpa=2500 kg m−3 |
| ρp | particle density [kg m−3] |
| ρps | saltator density [kg m−3] |
| rv | equivalent volume radius [m] |
| S | dust source scaling function |
| σm | saltation bombardment efficiency; |
| σv | ratio of roughness-element basal to frontal area |
| sp | particle-size fractions in G01 scheme |
| sbare | bare soil fraction |
| average surface stress on exposed area | |
| maximum surface stress on exposed area | |
| τ | total stress |
| θr | volumetric air-dry residual soil moisture content [m3 m−3] |
| θs | volumetric saturation soil moisture content [m3 m−3] |
| θ | volumetric soil moisture content [m3 m−3] |
| u* | friction velocity [m s−1] |
| u*st0 | minimum standardized threshold friction velocity; m s−1 |
| u*st | standardized threshold friction velocity; [m s−1] |
| u*t0 | threshold friction velocity for dry conditions |
| minimum dry threshold friction velocity | |
| minimum dry threshold wind velocity | |
| u10m | 10 m wind speed [m s−1] |
| u*NMMB | friction velocity provided by the atmospheric model |
| model threshold friction velocity for dry conditions (including optional scaling) | |
| u*t | threshold friction velocity [m s−1] |
| ut | threshold wind speed [m s−1] |
| w | gravimetric soil moisture content [%] |
| wr | gravimetric air-dry residual soil moisture content [%] |
| X | parameter in drag partition from Marticorena and Bergametti (1995) |
| z0 | aerodynamic roughness length |
| z0s | smooth aerodynamic roughness length |
| z0dyn | dynamic aerodynamic roughness length |
| z0stat | static aerodynamic roughness length |
MONARCH source code used in this work (v2.0.0) is available at https://earth.bsc.es/gitlab/es/monarch (last access: 12 October 2021) (https://doi.org/10.5281/zenodo.5215467, Klose et al., 2021a).
MONARCH output presented in this paper is available via EUDAT B2SHARE (https://doi.org/10.23728/b2share.42ad3309744e40bd9c8920535d14c4a9; Klose et al., 2021b).
MK implemented most of the dust-module upgrades, ran, analyzed, and evaluated the simulations, and wrote the manuscript. OJ contributed to the model upgrade and leads the MONARCH development together with CPGP. MGA, JE, MLD, VO, and EDT contributed to the model upgrades. SB contributed to the model evaluation. GMP and FM supported the development of MONARCH and MONARCH workflow. PG, JG, and CP contributed data used in the model/for model evaluation. YH and JFK contributed dust optical properties used in MONARCH. CPGP and RLM co-designed the model changes together with MK. In addition, CPGP implemented part of the model upgrades and contributed to manuscript writing. All authors commented on the manuscript.
The authors declare that they have no competing interests.
Publisher's note: Copernicus Publications remains neutral with regard to jurisdictional claims in published maps and institutional affiliations.
BSC co-authors acknowledge PRACE (eFRAGMENT2) and RES (AECT-2019-3-0001 and AECT-2020-1-0018) for awarding access to MareNostrum at the Barcelona Supercomputing Center and for providing technical support. Martina Klose, Carlos Pérez García-Pando, Sara Basart, Paul Ginoux, Catherine Prigent, and Ron L. Miller appreciated the opportunity for exchange and discussion at the Institut Pascal at Université Paris-Saclay with support of the program “Investissements d'avenir” (ANR-11-IDEX-0003-01). The authors thank all the principal investigators and their staff for establishing and maintaining the AERONET sites, as well as the MODIS mission scientists and associated NASA personnel for the production of the AOD, SSA, and AE data used in this study.
This research has been supported by the European Union's Horizon 2020 research and innovation programme under the Marie Skłodowska-Curie grant agreement no. 789630. Martina Klose has received funding through the Helmholtz Association's Initiative and Networking Fund (grant agreement no. VH-NG-1533). Jeronimo Escribano and Matthew L. Dawson have received funding from the European Union's Horizon 2020 research and innovation programme under the Marie Skłodowska-Curie grant agreements no. 754433 (Jeronimo Escribano) and no. 747048 (Matthew Dawson). BSC co-authors acknowledge funding from the following: the European Research Council (FRAGMENT (grant no. 773051)); the AXA Research Fund; the Spanish Ministry of Science, Innovation and Universities (grant no. CGL2017-88911-R); the EU H2020 project FORCES (grant no. 821205); the CMUG-CCI3-TECHPROP contract, an activity carried out under a program of and funded by the European Space Agency (ESA); and the DustClim project, which is part of ERA4CS, an ERA-NET initiated by JPI Climate and funded by FORMAS (SE), DLR (DE), BMWFW (AT), IFD (DK), MINECO (ES), and ANR (FR), with co-funding by the European Union (grant no. 690462). Ron L. Miller is funded by the NASA Modeling, Analysis and Prediction Program (NNG14HH42I). Jasper F. Kok acknowledges support from the National Science Foundation (NSF) under grant nos. 1552519 and 1856389 and the Army Research Office (grant no. W911NF-20-2-0150). Yue Huang has received funding from the Columbia University Earth Institute Postdoctoral Research Fellowship and from NASA (grant no. 80NSSC19K1346) awarded under the Future Investigators in NASA Earth and Space Science and Technology (FINESST) program.
This paper was edited by Axel Lauer and reviewed by Yves Balkanski and one anonymous referee.
Anderson, T. L., Wu, Y., Chu, D. A., Schmid, B., Redemann, J., and Dubovik, O.: Testing the MODIS satellite retrieval of aerosol fine-mode fraction, J. Geophys. Res.-Atmos., 110, D18204, https://doi.org/10.1029/2005JD005978, 2005. a
Ansmann, A., Rittmeister, F., Engelmann, R., Basart, S., Jorba, O., Spyrou, C., Remy, S., Skupin, A., Baars, H., Seifert, P., Senf, F., and Kanitz, T.: Profiling of Saharan dust from the Caribbean to western Africa – Part 2: Shipborne lidar measurements versus forecasts, Atmos. Chem. Phys., 17, 14987–15006, https://doi.org/10.5194/acp-17-14987-2017, 2017. a
Åström, J. A.: Statistical models of brittle fragmentation, Adv. Phys., 55, 247–278, https://doi.org/10.1080/00018730600731907, 2006. a
Badia, A. and Jorba, O.: Gas-phase evaluation of the online NMMB/BSC-CTM model over Europe for 2010 in the framework of the AQMEII-Phase2 project, Atmos. Environ., 115, 657–669, https://doi.org/10.1016/j.atmosenv.2014.05.055, 2015. a
Badia, A., Jorba, O., Voulgarakis, A., Dabdub, D., Pérez García-Pando, C., Hilboll, A., Gonçalves, M., and Janjic, Z.: Description and evaluation of the Multiscale Online Nonhydrostatic AtmospheRe CHemistry model (NMMB-MONARCH) version 1.0: gas-phase chemistry at global scale, Geosci. Model Dev., 10, 609–638, https://doi.org/10.5194/gmd-10-609-2017, 2017. a, b
Balkanski, Y., Schulz, M., Claquin, T., and Guibert, S.: Reevaluation of Mineral aerosol radiative forcings suggests a better agreement with satellite and AERONET data, Atmos. Chem. Phys., 7, 81–95, https://doi.org/10.5194/acp-7-81-2007, 2007. a, b, c
Barreto, A., Cuevas, E., Damiri, B., Guirado, C., Berkoff, T., Berjón, A. J., Hernández, Y., Almansa, F., and Gil, M.: A new method for nocturnal aerosol measurements with a lunar photometer prototype, Atmos. Meas. Tech., 6, 585–598, https://doi.org/10.5194/amt-6-585-2013, 2013. a
Basart, S., Pérez, C., Cuevas, E., Baldasano, J. M., and Gobbi, G. P.: Aerosol characterization in Northern Africa, Northeastern Atlantic, Mediterranean Basin and Middle East from direct-sun AERONET observations, Atmos. Chem. Phys., 9, 8265–8282, https://doi.org/10.5194/acp-9-8265-2009, 2009. a
Basart, S., Nickovic, S., Terradellas, E., Cuevas, E., Pérez García-Pando, C., García-Castrillo, G., Werner, E., and Benincasa, F.: The WMO SDS-WAS Regional Center for Northern Africa, Middle East and Europe, E3S Web of Conferences, Central Asian DUst Conference (CADUC), 8–12 April 2019, Dushanbe, Tajikistan, EDP Sciences – Web of Conferences, France, https://doi.org/10.1051/e3sconf/20199904008, 2019. a
Belly, P.-Y.: Sand movement by wind, Technical Memorandum No. 1, US Army Coastal Engineering Research Center, Washington D.C., USA, 1964. a, b, c, d
Berrisford, P., Dee, D. P., Poli, P., Brugge, R., Fielding, M., Fuentes, M., Kållberg, P. W., Kobayashi, S., Uppala, S., and Simmons, A.: The ERA-Interim archive Version 2.0, ERA Report Series 1, ECMWF, Shinfield Park, Reading, available at: https://www.ecmwf.int/node/8174 (12 October 2021), 2011. a
Betts, A. K.: A new convective adjustment scheme. Part 1: Observational and theoretical basis, Q. J. Roy. Meteor. Soc., 112, 677–691, https://doi.org/10.1002/qj.49711247307, 1986. a, b, c
Betts, A. K. and Miller, M. J.: A new convective adjustment scheme. Part 2: Single column tests using GATE wave, BOMEX, ATEX and arctic air-mass data sets, Q. J. Roy. Meteor. Soc., 112, 693–709, https://doi.org/10.1002/qj.49711247308, 1986. a, b, c
Binietoglou, I., Basart, S., Alados-Arboledas, L., Amiridis, V., Argyrouli, A., Baars, H., Baldasano, J. M., Balis, D., Belegante, L., Bravo-Aranda, J. A., Burlizzi, P., Carrasco, V., Chaikovsky, A., Comerón, A., D'Amico, G., Filioglou, M., Granados-Muñoz, M. J., Guerrero-Rascado, J. L., Ilic, L., Kokkalis, P., Maurizi, A., Mona, L., Monti, F., Muñoz-Porcar, C., Nicolae, D., Papayannis, A., Pappalardo, G., Pejanovic, G., Pereira, S. N., Perrone, M. R., Pietruczuk, A., Posyniak, M., Rocadenbosch, F., Rodríguez-Gómez, A., Sicard, M., Siomos, N., Szkop, A., Terradellas, E., Tsekeri, A., Vukovic, A., Wandinger, U., and Wagner, J.: A methodology for investigating dust model performance using synergistic EARLINET/AERONET dust concentration retrievals, Atmos. Meas. Tech., 8, 3577–3600, https://doi.org/10.5194/amt-8-3577-2015, 2015. a
Boucher, O., Randall, D., Artaxo, P., Bretherton, C., Feingold, G., Forster, P., Kerminen, V.-M., Kondo, Y., Liao, H., Lohmann, U., Rasch, P., Satheesh, S. K., Sherwood, S., Stevens, B., and Zhang, X. Y.: Clouds and Aerosols, in: Climate Change 2013: The Physical Science Basis. Contribution of Working Group I to the Fifth Assessment Report of the Intergovernmental Panel on Climate Change, edited by: Stocker, T. F., Quin, D., Plattner, G.-K., Tignor, M., Allen, S. K., Boschung, J., Nauels, A., Xia, Y., Bex, V., and Midgley, P. M., Cambridge University Press, Cambridge, UK and New York, NY, USA, 2013. a
Brooks, R. H. and Corey, A. T.: Hydraulic properies of porous media, Hydrology Paper, 3, Colorado State University, Fort Collins, Colorado, 1964. a
Cakmur, R. V., Miller, R. L., and Torres, O.: Incorporating the effect of small-scale circulations upon dust emission in an atmospheric general circulation model, J. Geophys. Res.-Atmos., 109, D07201, https://doi.org/10.1029/2003JD004067, d07201, 2004. a, b
Cakmur, R. V., Miller, R. L., Perlwitz, J., Geogdzhayev, I. V., Ginoux, P., Koch, D., Kohfeld, K. E., Tegen, I., and Zender, C. S.: Constraining the magnitude of the global dust cycle by minimizing the difference between a model and observations, J. Geophys. Res.-Atmos., 111, D06207, https://doi.org/10.1029/2005JD005791, 2006. a
Chen, W., Zhibao, D., Zhenshan, L., and Zuotao, Y.: Wind tunnel test of the influence of moisture on the erodibility of loessial sandy loam soils by wind, J. Arid Environ., 34, 391–402, https://doi.org/10.1006/jare.1996.0119, 1996. a
Chepil, W. S.: Influence of moisture on erodibility of soil by wind, Soil Sci. Soc. Am. J., 20, 288–292, https://doi.org/10.2136/sssaj1956.03615995002000020033x, 1956. a
Chkhetiani, O. G., Gledzer, E. B., Artamonova, M. S., and Iordanskii, M. A.: Dust resuspension under weak wind conditions: direct observations and model, Atmos. Chem. Phys., 12, 5147–5162, https://doi.org/10.5194/acp-12-5147-2012, 2012. a
Claquin, T., Schulz, M., and Balkanski, Y. J.: Modeling the mineralogy of atmospheric dust sources, J. Geophys. Res., 104, 22243–22256, 1999. a
Cornelis, W. M., Gabriels, D., and Hartmann, R.: A conceptual model to predict the deflation threshold shear velocity as affected by near-surface soil water: I. Theory, Soil Sci. Soc. Am. J., 68, 1154–1161, 2004a. a
Cornelis, W. M., Gabriels, D., and Hartmann, R.: A parameterisation for the threshold shear velocity to initiate deflation of dry and wet sediment, Geomorphology, 59, 43–51, https://doi.org/10.1016/j.geomorph.2003.09.004, 2004b. a
Cowie, S. M., Marsham, J. H., and Knippertz, P.: The importance of rare, high-wind events for dust uplift in northern Africa, Geophys. Res. Lett., 42, 8208–8215, https://doi.org/10.1002/2015GL065819, 2015. a
Cuevas, E., Camino, C., Benedetti, A., Basart, S., Terradellas, E., Baldasano, J. M., Morcrette, J. J., Marticorena, B., Goloub, P., Mortier, A., Berjón, A., Hernández, Y., Gil-Ojeda, M., and Schulz, M.: The MACC-II 2007–2008 reanalysis: atmospheric dust evaluation and characterization over northern Africa and the Middle East, Atmos. Chem. Phys., 15, 3991–4024, https://doi.org/10.5194/acp-15-3991-2015, 2015. a
Cziczo, D. J., Froyd, K. D., Hoose, C., Jensen, E. J., Diao, M., Zondlo, M. A., Smith, J. B., Twohy, C. H., and Murphy, D. M.: Clarifying the Dominant Sources and Mechanisms of Cirrus Cloud Formation, Science, 340, 1320–1324, https://doi.org/10.1126/science.1234145, 2013. a
D'Almeida, G. A.: On the variability of desert aerosol radiative characteristics, J. Geophys. Res., 92, 3017–3026, https://doi.org/10.1029/JD092iD03p03017, 1987. a, b, c
Dee, D. P., Uppala, S. M., Simmons, A. J., Berrisford, P., Poli, P., Kobayashi, S., Andrae, U., Balmaseda, M. A., Balsamo, G., Bauer, P., Bechtold, P., Beljaars, A. C. M., van de Berg, L., Bidlot, J., Bormann, N., Delsol, C., Dragani, R., Fuentes, M., Geer, A. J., Haimberger, L., Healy, S. B., Hersbach, H., Hólm, E. V., Isaksen, L., Kållberg, P., Köhler, M., Matricardi, M., McNally, A. P., Monge-Sanz, B. M., Morcrette, J.-J., Park, B.-K., Peubey, C., de Rosnay, P., Tavolato, C., Thépaut, J.-N., and Vitart, F.: The ERA-Interim reanalysis: configuration and performance of the data assimilation system, Q. J. Roy. Meteor. Soc., 137, 553–597, https://doi.org/10.1002/qj.828, 2011. a
DeMott, P. J., Sassen, K., Poellot, M. R., Baumgardner, D., Rogers, D. C., Brooks, S. D., Prenni, A. J., and Kreidenweis, S. M.: African dust aerosols as atmospheric ice nuclei, Geophys. Res. Lett., 30, 1732, https://doi.org/10.1029/2003GL017410, 2003. a
Denjean, C., Cassola, F., Mazzino, A., Triquet, S., Chevaillier, S., Grand, N., Bourrianne, T., Momboisse, G., Sellegri, K., Schwarzenbock, A., Freney, E., Mallet, M., and Formenti, P.: Size distribution and optical properties of mineral dust aerosols transported in the western Mediterranean, Atmos. Chem. Phys., 16, 1081–1104, https://doi.org/10.5194/acp-16-1081-2016, 2016. a
Dey, S., Ali, S. Z., and Padhi, E.: Termial fall velocity: the legacy of Stokes from the perspective of fluvial hydraulics, Proc. R. Soc. A, 475, 20190277, https://doi.org/10.1098/rspa.2019.0277, 2019. a
Di Biagio, C., Formenti, P., Balkanski, Y., Caponi, L., Cazaunau, M., Pangui, E., Journet, E., Nowak, S., Andreae, M. O., Kandler, K., Saeed, T., Piketh, S., Seibert, D., Williams, E., and Doussin, J.-F.: Complex refractive indices and single-scattering albedo of global dust aerosols in the shortwave spectrum and relationship to size and iron content, Atmos. Chem. Phys., 19, 15503–15531, https://doi.org/10.5194/acp-19-15503-2019, 2019. a
Di Tomaso, E., Schutgens, N. A. J., Jorba, O., and Pérez García-Pando, C.: Assimilation of MODIS Dark Target and Deep Blue observations in the dust aerosol component of NMMB-MONARCH version 1.0, Geosci.s Model Dev., 10, 1107–1129, https://doi.org/10.5194/gmd-10-1107-2017, 2017. a, b, c
Di Tomaso, E., Escribano, J., Basart, S., Ginoux, P., Macchia, F., Barnaba, F., Benincasa, F., Bretonnière, P.-A., Buñuel, A., Castrillo, M., Cuevas, E., Formenti, P., Gonçalves Ageitos, M., Jorba, O., Klose, M., Mona, L., Montané, G., Mytilinaios, M., Obiso, V., Olid, M., Schutgens, N., Votsis, A., Werner, E., and Pérez García-Pando, C.: The MONARCH high-resolution reanalysis of desert dust aerosol over Northern Africa, the Middle East and Europe (2007–2016), Earth Syst. Sci. Data Discuss., in preparation, 2021. a, b
Dubovik, O. and King, M. D.: A flexible inversion algorithm for retrieval of aerosol optical properties from Sun and sky radiance measurements, J. Geophys. Res., 105, 20,673–20,696, https://doi.org/10.1029/2000JD900282, 2000. a
Dubovik, O., Holben, B., Eck, T. F., Smirnov, A., Kaufman, Y. J., King, M. D., Tanré, D., and Slutsker, I.: Variability of Absorption and Optical Properties of Key Aerosol Types Observed in Worldwide Locations, J. Atmos. Sci., 59, 590–608, https://doi.org/10.1175/1520-0469(2002)059<0590:VOAAOP>2.0.CO;2, 2002. a, b, c
Ek, M. B., Mitchell, K. E., Lin, Y., Rogers, E., Grunmann, P., Koren, V., Gayno, G., and Tarpley, J. D.: Implementation of Noah land surface model advances in the National Centers for Environmental Prediction operational mesoscale Eta model, J. Geophys. Res.-Atmos., 108, 8851, https://doi.org/10.1029/2002JD003296, 2003. a, b
Escribano, J., Di Tomaso, E., Jorba, O., Klose, M., Gonçalves Ageitos, M., Macchia, F., Amiridis, V., Baars, H., Marinou, E., Proestakis, E., Urbanneck, C., Althausen, D., Bühl, J., Mamouri, R.-E., and Pérez García-Pando, C.: Assimilating spaceborne lidar dust extinction improves dust forecasts, Atmos. Chem. Phys. Discuss. [preprint], https://doi.org/10.5194/acp-2021-442, in review, 2021. a
Fécan, F., Marticorena, B., and Bergametti, G.: Parametrization of the increase of the aeolian erosion threshold wind friction velocity due to soil moisture for arid and semi-arid areas, Ann. Geophys., 17, 149–157, https://doi.org/10.1007/s00585-999-0149-7, 1999. a, b, c, d, e, f, g, h, i, j
Fels, S. B. and Schwarzkopf, M. D.: The simplified exchange approximation – a new method for radiative transfer calculations, J. Atmos. Sci., 32, 1475–1488, https://doi.org/10.1175/1520-0469(1975)032<1475:TSEAAN>2.0.CO;2, 1975. a
Ferrier, B. S., Jin, Y., Lin, Y., Black, T., Rogers, E., and DiMego, G.: Implementation of a new grid-scale cloud and precipitation scheme in the NCEP Eta Model, in: Proc. 15th Conf. on Numerical Weather Prediction, 12–16 August 2002, pp. 280–283, Amer. Meteor. Soc., San Antonio, TX, 2002. a, b
Gardner, W. R.: Field measurement of soil water diffusivity, Soil Sci. Soc. Am. Proc., 34, 832–833, 1970. a
Giles, D. M., Sinyuk, A., Sorokin, M. G., Schafer, J. S., Smirnov, A., Slutsker, I., Eck, T. F., Holben, B. N., Lewis, J. R., Campbell, J. R., Welton, E. J., Korkin, S. V., and Lyapustin, A. I.: Advancements in the Aerosol Robotic Network (AERONET) Version 3 database – automated near-real-time quality control algorithm with improved cloud screening for Sun photometer aerosol optical depth (AOD) measurements, Atmos. Meas. Tech., 12, 169–209, https://doi.org/10.5194/amt-12-169-2019, 2019. a, b, c
Ginoux, P.: Effects of nonsphericity on mineral dust modeling, J. Geophys. Res., 108, 4052, https://doi.org/10.1029/2002JD002516, 2003. a
Ginoux, P., Chin, M., Tegen, I., Prospero, J. M., Holben, B., Dubovik, O., and Lin, S.-J.: Sources and distributions of dust aerosols simulated with the GOCART model, J. Geophys. Res., 106, 20255–20273, 2001. a, b, c, d, e, f, g, h, i, j, k
Ginoux, P., Garbuzov, D., and Hsu, N. C.: Identification of anthropogenic and natural dust sources using Moderate Resoluation Imaging Spectroradiometer (MODIS) Deep Blue level 2 data, J. Geophys. Res., 115, D05204, https://doi.org/10.1029/2009JD012398, 2010. a
Ginoux, P., Prospero, J. M., Gill, T. E., Hsu, N. C., and Zhao, M.: Global-scale attribution of anthropogenic and natural dust sources and their emission rates based on MODIS Deep Blue aerosol products, Rev. Geophys., 50, RG3005, https://doi.org/10.1029/2012RG000388, 2012. a, b, c, d, e, f
Gonçalves Ageitos, M., Obiso, V., Miller, R., Jorba, O., and Pérez García-Pando, C.: Sensitivity of the fast climate response over North Africa to dust mineralogy, in preparation, 2021a. a, b, c
Gonçalves Ageitos, M., Dawson, M., Obiso, V., Klose, M., Jorba, O., Miller, R., and Pérez García-Pando, C.: Dust mineralogy in the Multiscale Online Non-hydrostatic Atmosphere Chemistry Model (MONARCH), in preparation, 2021b. a, b
Guenther, A., Karl, T., Harley, P., Wiedinmyer, C., Palmer, P. I., and Geron, C.: Estimates of global terrestrial isoprene emissions using MEGAN (Model of Emissions of Gases and Aerosols from Nature), Atmos. Chem. Phys., 6, 3181–3210, https://doi.org/10.5194/acp-6-3181-2006, 2006. a
Guerschman, J. P., Hill, M. J., Renzullo, L. J., Barrett, D. J., Marks, A. S., and Botha, E. J.: Estimating fractional cover of photosynthetic vegetation, non-photosynthetic vegetation and bare soil in the Australian tropical savanna region upscaling the EO-1 Hyperion and MODIS sensors, Remote Sens. Environ., 113, 928–945, https://doi.org/10.1016/j.rse.2009.01.006, 2009. a
Guerschman, J. P., Scarth, P. F., McVicar, T. R., Renzullo, L. J., Malthus, T. J., Stewart, J. B., Rickards, J. E., and Trevithick, R.: Assessing the effects of site heterogeneity and soil properties when unmixing photosynthetic vegetation, non-photosynthetic vegetation and bare soil fractions from Landsat and MODIS data, Remote Sens. Environ., 161, 12–26, https://doi.org/10.1016/j.rse.2015.01.021, 2015. a, b, c, d
Guevara, M., Tena, C., Porquet, M., Jorba, O., and Pérez García-Pando, C.: HERMESv3, a stand-alone multi-scale atmospheric emission modelling framework – Part 1: global and regional module, Geosci. Model Dev., 12, 1885–1907, https://doi.org/10.5194/gmd-12-1885-2019, 2019. a
Gutman, G. and Ignatov, A.: The derivation of the green vegetation fraction from NOAA/AVHRR data for use in numerical weather prediction models, Int. J. Remote Sens., 19, 1533–1543, https://doi.org/10.1080/014311698215333, 2010. a, b, c
Han, J. and Pan, H.: Revision of Convection and Vertical Diffusion Schemes in the NCEP Global Forecast System, Weather Forecast., 26, 520–533, https://doi.org/10.1175/WAF-D-10-05038.1, 2011. a
Haustein, K., Pérez, C., Baldasano, J. M., Jorba, O., Basart, S., Miller, R. L., Janjic, Z., Black, T., Nickovic, S., Todd, M. C., Washington, R., Müller, D., Tesche, M., Weinzierl, B., Esselborn, M., and Schladitz, A.: Atmospheric dust modeling from meso to global scales with the online NMMB/BSC-Dust model – Part 2: Experimental campaigns in Northern Africa, Atmos. Chem. Phys., 12, 2933–2958, https://doi.org/10.5194/acp-12-2933-2012, 2012. a
Hess, M., Koepke, P., and Schult, I.: Optical properties of aerosols and clouds: The software package OPAC, B. Am. Meteorol. Soc., 79, 831–844, https://doi.org/10.1175/1520-0477(1998)079<0831:OPOAAC>2.0.CO;2, 1998. a, b
Holben, B. N., Eck, T. F., Slutsker, I., Tanré, D., Buis, J. P., Setzer, A., Vermote, E., Reagan, J. A., Kaufman, Y. J., Nakajima, T., Lavenu, F., Jankowiak, I., and Smirnov, A.: AERONET – A federated instrument network and data archive for aerosol characterization, Remote Sens. Environ., 66, 1–16, https://doi.org/10.1016/S0034-4257(98)00031-5, 1998. a, b
Hong, S. and Lim, J. J.: The WRF single-moment 6-class microphysics scheme (WSM6), J. Korean Meteor. Soc., 42, 129–151, 2006. a
Hong, S. and Pan, H.: Nonlocal boundary layer vertical diffusion in a medium-range forecast model, Mon. Weather Rev., 124, 2322–2339, https://doi.org/10.1175/1520-0493(1996)124<2322:NBLVDI>2.0.CO;2, 1996. a
Houser, C. A. and Nickling, W. G.: The emission and vertical flux of particulate matter <10 µm from a disturbed clay-crusted surface, Sedimentology, 48, 255–267, https://doi.org/10.1046/j.1365-3091.2001.00359.x, 2001. a
Hsu, N. C., Tsay, S.-C., King, M., and Herman, J. R.: Aerosol properties over bright-reflecting source regions, IEEE T. Geosci. Remote, 42, 557–569, https://doi.org/10.1109/TGRS.2004.824067, 2004. a
Hsu, N. C., Jeong, M.-J., Bettenhausen, C., Sayer, A. M., Hansell, R., Seftor, C. S., Huang, J., and S.-C.Tsay: Enhanced Deep Blue aerosol retrieval algorithm: The second generation, J. Geophys. Res.-Atmos., 118, 9296–9315, https://doi.org/10.1002/jgrd.50712, 2013. a, b, c
Huang, Y., Kok, J. F., Kandler, K., Lindqvist, H., Nousiainen, T., Sakai, T., Adebiyi, A., and Jokinen, O.: Climate models and remote sensing retrievals neglect substantial desert dust asphericity, Geophys. Res. Lett., 47, e2019GL086592, https://doi.org/10.1029/2019GL086592, 2020. a
Hunt, B. R., Kostelich, E. J., and Szunyogh, I.: Efficient data assimilation for spatiotemporal chaos: A local ensemble transform Kalman filter, Physica D, 230, 112–126, https://doi.org/10.1016/j.physd.2006.11.008, 2007. a
Iacono, M. J., Mlawer, E. J., Clough, S. A., and Morcrette, J.-J.: Impact of an improved longwave radiation model, RRTM, on the energy budget and thermodynamic properties of the NCAR community climate model, CCM3, J. Geophys. Res.-Atmos., 105, 14873–14890, https://doi.org/10.1029/2000JD900091, 2000. a
Iacono, M. J., Delamere, J. S., Mlawer, E. J., and Shephard, M. W.: Radiative forcing by long-lived greenhouse gases: Calculations with the AER radiative transfer models, J. Geophys. Res.-Atmos., 113, D13103, https://doi.org/10.1029/2008JD009944, 2008. a, b, c
Iversen, J. D. and White, B. R.: Saltation threshold on Earth, Mars and Venus, Sedimentology, 29, 111–119, 1982. a, b, c
Janjic, Z. I.: Pressure gradient force and advection scheme used for forecasting with steep and small scale topography, Contrib. Atmos. Phys., 50, 186–199, 1977. a
Janjic, Z. I.: Forward-backward scheme modified to prevent two-grid-interval noise and its application in sigma coordinate models, Contrib. Atmos. Phys., 52, 69–84, 1979. a
Janjic, Z. I.: Non-linear advection schemes and energy cascade on semi-staggered grids, Mon. Weather Rev., 112, 1234–1245, https://doi.org/10.1175/1520-0493(1984)112<1234:NASAEC>2.0.CO;2, 1984. a
Janjic, Z. I.: The step-mountain eta coordinate model: further developments of the convection, viscous sublayer, and turbulence closure schemes, Mon. Weather Rev., 122, 927–945, https://doi.org/10.1175/1520-0493(1994)122<0927:TSMECM>2.0.CO;2, 1994. a, b, c, d, e
Janjic, Z. I.: The Mellor-Yamada level 2.5 scheme in the NCEP Eta Model, 11th Conference on Numerical Weather Prediction, 19–23 August 1996, Norfolk, USA, 333–334, 1996a. a
Janjic, Z. I.: The Surface Layer in the NCEP Eta Model, 11th Conference on Numerical Weather Prediction, 19–23 August 1996, Norfolk, USA, 354–355, 1996b. a, b
Janjic, Z. I.: Comments on “Development and evaluation of a convection scheme for use in climate models”, J. Atmos. Sci., 57, 3686, https://doi.org/10.1175/1520-0469(2000)057<3686:CODAEO>2.0.CO;2, 2000. a, b
Janjic, Z. I.: Nonsingular implementation of the Mellor-Yamada Level 2.5 scheme in the NCEP Meso model, National Centers for Environmental Prediction, Office Note, no. 437, available at: https://www.emc.ncep.noaa.gov/officenotes/newernotes/on437.pdf (last access: 19 October 2021), 2001. a, b
Janjic, Z. I.: A nonhydrostatic model based on a new approach, Meteorol. Atmos. Phys., 82, 271–285, https://doi.org/10.1007/s00703-001-0587-6, 2003. a
Janjic, Z. I. and Gall, R.: Scientific documentation of the NCEP Nonhydrostatic Multiscale Model on the B grid (NMMB). Part 1 Dynamics, NCAR Technical Note NCAR/TN-489+STR, University Corporation for Atmospheric Research, 2012. a
Janjic, Z. I., Gerrity Jr., J. P., and Nickovic, S.: An alternative approach to nonhydrostatic modeling, Mon. Weather Rev., 129, 1164–1178, https://doi.org/10.1175/1520-0493(2001)129<1164:AAATNM>2.0.CO;2, 2001. a
Jickells, T. D., An, Z. S., Andersen, K. K., Baker, A. R., Bergametti, G., Brooks, N., Cao, J. J., Boyd, P. W., Duce, R. A., Hunter, K. A., Kawahata, H., Kubilay, N., laRoche, J., Liss, P. S., Mahowald, N., Prospero, J. M., Ridgwell, A. J., Tegen, I., and Torres, R.: Global iron connections between desert dust, ocean biogeochemistry, and climate, Science, 308, 67–71, https://doi.org/10.1126/science.1105959, 2005. a
Jorba, O., Dabdub, D., Blaszczak-Boxe, C., Pérez, C., Janjic, Z., Baldasano, J. M., Spada, M., Badia, A., and Gonçalves, M.: Potential significance of photoexcited NO2 on global air quality with the NMMB/BSC chemical transport model, J. Geophys. Res.-Atmos., 117, D13301, https://doi.org/10.1029/2012JD017730, 2012. a
Kanakidou, M., Myriokefalitakis, S., and Tsigaridis, K.: Aerosols in atmospheric chemistry and biogeochemical cycles of nutrients, Environ. Res. Lett., 13, 063004, https://doi.org/10.1088/1748-9326/aabcdb, 2018. a
Kandler, K., Benker, N., Bundke, U., Cuevas, E., Ebert, M., Knippertz, P., Rodríguez, S., Schütz, L., and Weinbruch, S.: Chemical composition and complex refractive index of Saharan mineral dust at Izaña, Tenerife (Spain) derived by electron microscopy, Atmos. Environ., 41, 8058–8074, https://doi.org/10.1016/j.atmosenv.2007.06.047, 2007. a
Karydis, V. A., Kumar, P., Barahona, D., Sokolik, I. N., and Nenes, A.: On the effect of dust particles on global cloud condensation nuclei and cloud droplet number, J. Geophys. Res., 116, D23204, https://doi.org/10.1029/2011JD016283, 2011. a
Kawamura, R.: Study of sand movement by wind, in: In: Hydraulic Eng. Lab. Tech. Rep., pp. 99–108, University of California, Berkeley, CA, HEL-2-8, 1964. a
King, J., Nickling, W., and Gillies, J.: Representation of vegetation and other nonerodible elements in aeolian shear stress partitioning models for prediction transport threshold, J. Geophys. Res.-Earth, 11, F04015, https://doi.org/10.1029/2004JF000281, 2005. a, b
Kiselev, A., Bachmann, F., Pedevilla, P., Cox, S. J., Michaelides, A., Gerthsen, D., and Leisner, T.: Active sites in heterogeneous ice nucleation – the example of K-rich feldspars, Science, 355, 367–371, https://doi.org/10.1126/science.aai8034, 2017. a
Klein Goldewijk, K., Beusen, A., Doelman, J., and Stehfest, E.: Anthropogenic land use estimates for the Holocene – HYDE 3.2, Earth Syst. Sci. Data, 9, 927–953, https://doi.org/10.5194/essd-9-927-2017, 2017. a, b
Klose, M. and Shao, Y.: Large-eddy simulation of turbulent dust emission, Aeolian Res., 8, 49–58, https://doi.org/10.1016/j.aeolia.2012.10.010, 2013. a
Klose, M., Shao, Y., Li, X. L., Zhang, H. S., Ishizuka, M., Mikami, M., and Leys, J. F.: Further development of a parameterization for convective turbulent dust emission and evaluation based on field observations, J. Geophys. Res.-Atmos., 119, 10441–10457, https://doi.org/10.1002/2014JD021688, 2014. a, b, c, d, e, f, g, h, i, j
Klose, M., Pérez García-Pando, C., Deroubaix, A., Ginoux, P. A., and Miller, R. L.: How much soil dust aerosol is man-made?, AGU Fall Meeting 2018, Washington, D.C., USA, available at: https://agu.confex.com/agu/fm18/meetingapp.cgi/Paper/345230 (last access: 12 October 2021), 2018. a, b
Klose, M., Gill, T. E., Etyemezian, V., Nikolich, G., Ghodsi Zadeh, Z., Webb, N. P., and Van Pelt, R. S.: Dust emission from crusted surfaces: Insights from field measurements and modelling, Aeolian Res., 40, 1–14, https://doi.org/10.1016/j.aeolia.2019.05.001, 2019. a, b, c, d
Klose, M., Jorba, O., Gonçalves Ageitos, M., Escribano, J., Dawson, M. L., Obiso, V., Di Tomaso, E., Basart, S., Montané Pinto, G., Macchia, F., and Pérez García-Pando, C.: MONARCH: Multiscale Online Nonhydrostatic AtmospheRe CHemistry model Version 2.0 (v2.0.0), Zenodo [code], https://doi.org/10.5281/zenodo.5215467, 2021a. a
Klose, M., Jorba, O., Gonçalves Ageitos, M., Escribano, J., Dawson, M. L., Obiso, V., Di Tomaso, E., Basart, S., Montané Pinto, G., Macchia, F., Ginoux, P., Guerschman, J., Prigent, C., Huang, Y., Kok, J. F., Miller, R. L., and Pérez García-Pando, C.: MONARCH data presented in Klose et al. (2021), “Mineral dust cycle in the Multiscale Online Nonhydrostatic AtmospheRe CHemistry model (MONARCH) Version 2.0”, Geosci. Model Dev., EUDAT [data set], https://doi.org/10.23728/b2share.42ad3309744e40bd9c8920535d14c4a9, 2021b. a
Klose, M. R.: Convective Turbulent DustEmission: Process, parameterization, and relevance in the Earth system, Dissertation, Universität zu Köln, available at: http://kups.ub.uni-koeln.de/id/eprint/5826 (last access: 12 October 2021), 2014. a, b, c
Kok, J. F.: A scaling theory for the size distribution of emitted dust aerosols suggests climate models underestimate the size of the global dust cycle, P. Natl. Acad. Sci. USA, D17204, https://doi.org/10.1073/pnas.1014798108, 2011a. a, b, c, d, e
Kok, J. F.: Does the size distribution of mineral dust aerosols depend on the wind speed at emission?, Atmos. Chem. Phys., 11, 10149–10156, https://doi.org/10.5194/acp-11-10149-2011, 2011b. a
Kok, J. F., Albani, S., Mahowald, N. M., and Ward, D. S.: An improved dust emission model – Part 2: Evaluation in the Community Earth System Model, with implications for the use of dust source functions, Atmos. Chem. Phys., 14, 13043–13061, https://doi.org/10.5194/acp-14-13043-2014, 2014a. a
Kok, J. F., Mahowald, N. M., Fratini, G., Gillies, J. A., Ishizuka, M., Leys, J. F., Mikami, M., Park, M.-S., Park, S.-U., Van Pelt, R. S., and Zobeck, T. M.: An improved dust emission model – Part 1: Model description and comparison against measurements, Atmos. Chem. Phys., 14, 13023–13041, https://doi.org/10.5194/acp-14-13023-2014, 2014b. a, b, c, d, e
Kok, J. F., Ridley, D. A., Zhou, Q., Miller, R. L., Zhao, C., Heald, C. L., Ward, D. S., Albani, S., and Haustein, K.: Smaller desert dust cooling effect estimated from analysis of dust size and abundance, Nat. Geosci., 10, 274–278, https://doi.org/10.1038/ngeo2912, 2017. a
Kok, J. F., Ward, D. S., Mahowald, N. M., and Evan, A. T.: Global and regional importance of the direct dust-climate feedback, Nat. Commun., 9, 241, https://doi.org/10.1038/s41467-017-02620-y, 2018. a
Kok, J. F., Adebiyi, A. A., Albani, S., Balkanski, Y., Checa-Garcia, R., Chin, M., Colarco, P. R., Hamilton, D. S., Huang, Y., Ito, A., Klose, M., Leung, D. M., Li, L., Mahowald, N. M., Miller, R. L., Obiso, V., Pérez García-Pando, C., Rocha-Lima, A., Wan, J. S., and Whicker, C. A.: Improved representation of the global dust cycle using observational constraints on dust properties and abundance, Atmos. Chem. Phys., 21, 8127–8167, https://doi.org/10.5194/acp-21-8127-2021, 2021a. a
Kok, J. F., Adebiyi, A. A., Albani, S., Balkanski, Y., Checa-Garcia, R., Chin, M., Colarco, P. R., Hamilton, D. S., Huang, Y., Ito, A., Klose, M., Li, L., Mahowald, N. M., Miller, R. L., Obiso, V., Pérez García-Pando, C., Rocha-Lima, A., and Wan, J. S.: Contribution of the world's main dust source regions to the global cycle of desert dust, Atmos. Chem. Phys., 21, 8169–8193, https://doi.org/10.5194/acp-21-8169-2021, 2021a. a, b, c, d, e, f
Kolmogorov, A.: On the logarithmically normal distribution law of particle sizes under grinding, Dokl. Akad. Nauk SSSR+, 31, 99–101, 1941. a
Krumbein, W. C.: Size frequency distribution of sediments, J. Sediment. Res., 4, 65–67, https://doi.org/10.1306/D4268EB9-2B26-11D7-8648000102C1865D, 1934. a
Krumbein, W. C.: Size frequency distribution of sediments and the normal phi curve, J. Sediment. Res., 8, 84–90, https://doi.org/10.1306/D4269008-2B26-11D7-8648000102C1865D, 1938. a
Kurosaki, Y. and Mikami, M.: Threshold wind speed for dust emission in east Asia and its seasonal variations, J. Geophys. Res.-Atmos., 112, D17202, https://doi.org/10.1029/2006JD007988, 2007. a
Li, L., Mahowald, N. M., Miller, R. L., Pérez García-Pando, C., Klose, M., Hamilton, D. S., Gonçalves Ageitos, M., Ginoux, P., Balkanski, Y., Green, R. O., Kalashnikova, O., Kok, J. F., Obiso, V., Paynter, D., and Thompson, D. R.: Quantifying the range of the dust direct radiative effect due to source mineralogy uncertainty, Atmos. Chem. Phys., 21, 3973–4005, https://doi.org/10.5194/acp-21-3973-2021, 2021. a
Li, X. L., Klose, M., Shao, Y., and Zhang, H. S.: Convective Turbulent Dust Emission (CTDE) observed over Horqin Sandy Land area and validation of a CTDE scheme, J. Geophys. Res.-Atmos., 119, 9980–9992, https://doi.org/10.1002/2014JD021572, 2014. a
Loosmore, G. A. and Hunt, J. R.: Dust resuspension without saltation, J. Geophys. Res., 105, 20663–20671, https://doi.org/10.1029/2000JD900271, 2000. a
Lu, H. and Shao, Y.: A new model for dust emission by saltation bombardment, J. Geophys. Res., 104, 16827–16842, 1999. a
Lunt, D. J. and Valdes, P. J.: The modern dust cycle: Comparison of model results with observations and study of sensitivities, J. Geophys. Res.-Atmos., 107, 4669, https://doi.org/10.1029/2002JD002316, 4669, 2002. a
MacKinnon, D. J., Clow, G. D., Tigges, R. K., Reynolds, R. L., and Chavez Jr., P. S.: Comparison of aerodynamically and model-derived roughness lengths (z0) over diverse surfaces, central Mojave Desert, California, USA, Geomorphology, 63, 103–113, https://doi.org/10.1016/j.geomorph.2004.03.009, 2004. a, b, c, d
Macpherson, T., Nickling, W. G., Gillies, J. A., and Etyemezian, V.: Dust emissions from undisturbed and disturbed supply-limited desert surfaces, J. Geophys. Res.-Earth, 113, F02S04, https://doi.org/10.1029/2007JF000800, 2008. a
Mahowald, N. M., Kloster, S., Engelstaedter, S., Moore, J. K., Mukhopadhyay, S., McConnell, J. R., Albani, S., Doney, S. C., Bhattacharya, A., Curran, M. A. J., Flanner, M. G., Hoffman, F. M., Lawrence, D. M., Lindsay, K., Mayewski, P. A., Neff, J., Rothenberg, D., Thomas, E., Thornton, P. E., and Zender, C. S.: Observed 20th century desert dust variability: impact on climate and biogeochemistry, Atmos. Chem. Phys., 10, 10875–10893, https://doi.org/10.5194/acp-10-10875-2010, 2010. a
Manubens-Gil, D., Vegas-Regidor, J., Prodhomme, C., Mula-Valls, O., and Doblas-Reyes, F. J.: Seamless management of ensemble climate prediction experiments on HPC platforms, 2016 International Conference on High Performance Computing and Simulation (HPCS), 18–22 July 2016, Innsbruck, 895–900, https://doi.org/10.1109/HPCSim.2016.7568429, 2016. a
Markel, V. A.: Introduction to the Maxwell Garnett approximation: tutorial, J. Opt. Soc. Am., 33, 1244–1256, 2016. a
Marticorena, B. and Bergametti, G.: Modeling the atmospheric dust cycle: 1. Design of a soil-derived dust emission scheme, J. Geophys. Res., 100, 16415–16430, 1995. a, b, c, d, e, f, g, h, i, j, k, l, m, n, o
Marticorena, B., Kardous, M., Bergametti, G., Callot, Y., Chazette, P., Khatteli, H., Le Hégarat-Mascle, S., Maillé, M., Rajot, J.-L., Vidal-Madjar, D., and Zribi, M.: Surface and aerodynamic roughness in arid and semiarid areas and their relation to radar backscatter coefficient, J. Geophys. Res., 111, F03017, https://doi.org/10.1029/2006JF000462, 2006. a
Martin, R. L. and Kok, J. F.: Size-independent susceptibility to transport in aeolian saltation, J. Geophys. Res.-Earth, 124, 1658–1674, https://doi.org/10.1029/2019JF005104, 2019. a
McKenna Neuman, C.: Effects of temperature and humidity upon the entrainment of sedimentary particles by wind, Bound.-Lay. Meteorol., 108, 61–89, 2003. a
McKenna Neuman, C. and Nickling, W. G.: A theoretical and wind tunnel investigation of the effect of capillary water on the entrainment of sediment by wind, Can. J. Soil Sci., 69, 79–96, 1989. a
Meng, Z. and Lu, B.: Dust events as a risk factor for daily hospitalization for respiratory and cardiovascular diseases in Minqin, China, Atmos. Environ., 41, 7048–7058, 2007. a
Meng, Z., Yang, P., Kattawar, G. W., Bi, L., Liou, K. N., and Laszlo, I.: Single-scattering properties of tri-axial ellipsoidal mineral dust aerosols: A database for application to radiative transfer calculations, J. Aerosol Sci., 41, 501–512, https://doi.org/10.1016/j.jaerosci.2010.02.008, 2010. a
Metzger, S., Dentener, F., Pandis, S., and Lelieveld, J.: Gas/aerosol partitioning: 1. A computationally efficient model, J. Geophys. Res.-Atmos., 107, 4312, https://doi.org/10.1029/2001JD001102, 2002. a
Miller, R. L., Cakmur, R. V., Perlwitz, J., Geogdzhayev, I. V., Ginoux, P., Koch, D., Kohfeld, K. E., Prigent, C., Ruedy, R., Schmidt, G. A., and Tegen, I.: Mineral dust aerosols in the NASA Goddard Institute for Space Sciences ModelE atmospheric general circulation model, J. Geophys. Res., 111, D06208, https://doi.org/10.1029/2005JD005796, 2006. a, b
Miller, R. L., Knippertz, P.,Pérez Garca-Pando, C., Perlwitz, J. P., and Tegen, I.: Impact of Dust Radiative Forcing upon Climate, in: Mineral Dust, edited by: Knippertz, P. and Stuut, J.-B. W., pp. 327–357, Springer, Dordrecht, the Netherlands, https://doi.org/10.1007/978-94-017-8978-3_13, 2014. a, b, c
Miyoshi, T. and Yamane, S.: Local Ensemble Transform Kalman Filtering with an AGCM at a T159/L48 Resolution, Mon. Weather Rev., 135, 3841–3861, https://doi.org/10.1175/2007MWR1873.1, 2007. a
Monin, A. S. and Obukhov, A. M.: Basis laws of turbulent mixing in the ground layer of the atmosphere, Trans. Geophys. Inst. Akad. Nauk USSR, 151, 163–187, 1954. a
Mougin, E., Lo Seen, D., Rambal, S., Gaston, A., and Hiernaux, P.: A regional Sahelian grassland model to be coupled with multispectral satellite data. I: Model description and validation, Remote Sens. Environ., 52, 181–193, https://doi.org/10.1016/0034-4257(94)00126-8, 1995. a
Myeni, R., Knyazikhin, Y., and Park, T.: MYD15A2H MODIS/Aqua Leaf Area Index/FPAR 8-Day L4 Global 500m SIN Grid V006 [Data set], https://doi.org/10.5067/MODIS/MYD15A2H.006, 2015. a, b
Okada, K., Heintzenberg, J., Kai, K., and Qin, Y.: Shape of atmospheric mineral particles collected in three Chinese arid-regions, Geophys. Res. Lett., 28, 3123–3126, https://doi.org/10.1029/2000GL012798, 2001. a
O'Neill, N. T., Eck, T. F., Smirnov, A., Holben, B. N., and Thulasiraman, S.: Spectral discrimination of coarse and fine model optical depth, J. Geophys. Res.-Atmos., 108, 4559, https://doi.org/10.1029/2002JD002975, 2003. a, b, c, d
Patterson, E. M., Gillette, D. A., and Stockton, B. H.: Complex index of refraction between 300 and 700 nm for Saharan aerosols, J. Geophys. Res., 82, 3153–3160, https://doi.org/10.1029/JC082i021p03153, 1977. a, b, c
Pérez, C., Haustein, K., Janjic, Z., Jorba, O., Huneeus, N., Baldasano, J. M., Black, T., Basart, S., Nickovic, S., Miller, R. L., Perlwitz, J. P., Schulz, M., and Thomson, M.: Atmospheric dust modeling from meso to global scales with the online NMMB/BSC-Dust model – Part 1: Model description, annual simulations and evaluation, Atmos. Chem. Phys., 11, 13001–13027, https://doi.org/10.5194/acp-11-13001-2011, 2011. a, b, c, d, e, f, g, h, i, j, k, l
Pérez García-Pando, C., Stanton, M. C., Diggle, P. J., Trzaska, S., Miller, R. L., Perlwitz, J. P., Baldasano, J. M., Cuevas, E., Ceccato, P., Yaka, P., and Thomson, M. C.: Soil dust aerosols and wind as predictors of seasonal meningitis incidence in Niger, Environ. Health Persp., 122, 679–686, https://doi.org/10.1289/ehp.1306640, 2014. a
Pierre, C., Bergametti, G., Marticorena, B., Mougin, E., Bouet, C., and Schmechtig, C.: Impact of vegetation and soil moisture seasonal dynamics on dust emissions over the Sahel, J. Geophys. Res.-Atmos., 117, D06114, https://doi.org/10.1029/2011JD016950, 2012. a, b, c
Pierre, C., Bergametti, G., Marticorena, B., AbdourhamaneTouré, A., Rajot, J.-L., and Kergoat, L.: Modeling wind erosion flux and its seasonality from a cultivated sahelian surface: A case study in Niger, Catena, 122, 61–71, https://doi.org/10.1016/j.catena.2014.06.006, 2014. a, b, c
Prigent, C., Jiménez, C., and Catherinot, J.: Comparison of satellite microwave backscattering (ASCAT) and visible/near-infrared reflectances (PARASOL) for the estimation of aeolian aerodynamic roughness length in arid and semi-arid regions, Atmos. Meas. Tech., 5, 2703–2712, https://doi.org/10.5194/amt-5-2703-2012, 2012. a, b, c
Pu, B. and Ginoux, P.: How reliable are CMIP5 models in simulating dust optical depth?, Atmos. Chem. Phys., 18, 12491–12510, https://doi.org/10.5194/acp-18-12491-2018, 2018. a, b
Pu, B., Ginoux, P., Guo, H., Hsu, N. C., Kimball, J., Marticorena, B., Malyshev, S., Naik, V., O'Neill, N. T., Pérez García-Pando, C., Paireau, J., Prospero, J. M., Shevliakova, E., and Zhao, M.: Retrieving the global distribution of the threshold of wind erosion from satellite data and implementing it into the Geophysical Fluid Dynamics Laboratory land–atmosphere model (GFDL AM4.0/LM4.0), Atmos. Chem. Phys., 20, 55–81, https://doi.org/10.5194/acp-20-55-2020, 2020. a
Raupach, M. R., Gilette, D. A., and Leys, J. F.: The effect of roughness elements on wind erosion threshold, J. Geophys. Res., 98, 3023–3029, https://doi.org/10.1029/92JD01922, 1993. a, b, c, d, e, f, g, h, i
Rizzolo, J. A., Barbosa, C. G. G., Borillo, G. C., Godoi, A. F. L., Souza, R. A. F., Andreoli, R. V., Manzi, A. O., Sá, M. O., Alves, E. G., Pöhlker, C., Angelis, I. H., Ditas, F., Saturno, J., Moran-Zuloaga, D., Rizzo, L. V., Rosário, N. E., Pauliquevis, T., Santos, R. M. N., Yamamoto, C. I., Andreae, M. O., Artaxo, P., Taylor, P. E., and Godoi, R. H. M.: Soluble iron nutrients in Saharan dust over the central Amazon rainforest, Atmos. Chem. Phys., 17, 2673–2687, https://doi.org/10.5194/acp-17-2673-2017, 2017. a
Rubin, J. I., Reid, J. S., Hansen, J. A., Anderson, J. L., Collins, N., Hoar, T. J., Hogan, T., Lynch, P., McLay, J., Reynolds, C. A., Sessions, W. R., Westphal, D. L., and Zhang, J.: Development of the Ensemble Navy Aerosol Analysis Prediction System (ENAAPS) and its application of the Data Assimilation Research Testbed (DART) in support of aerosol forecasting, Atmos. Chem. Phys., 16, 3927–3951, https://doi.org/10.5194/acp-16-3927-2016, 2016. a
Sayer, A. M., Hsu, N. C., Bettenhausen, C., and Jeong, M.-J.: Validation and uncertainty estimates for MODIS Collection 6 “Deep Blue” aerosol data, J. Geophys. Res.-Atmos., 118, 7864–7872, https://doi.org/10.1002/jgrd.50600, 2013. a, b
Scanza, R. A., Mahowald, N., Ghan, S., Zender, C. S., Kok, J. F., Liu, X., Zhang, Y., and Albani, S.: Modeling dust as component minerals in the Community Atmosphere Model: development of framework and impact on radiative forcing, Atmos. Chem. Phys., 15, 537–561, https://doi.org/10.5194/acp-15-537-2015, 2015. a
Schulz, M., Balkanski, Y., Guelle, W., and Dulac, F.: Role of aerosol size distribution and source location in a three-dimensional simulation of a Saharan dust episode tested against satellite-derived optical thickness, J. Geophys. Res., 103, 10,579–10,592, https://doi.org/10.1029/97JD02779, 1998. a
Schuster, L. G., Dubovik, O., and Holben, B. N.: Angstrom exponent and bimodal aerosol size distribution, J. Geophys. Res.-Atmos., 111, D07207, https://doi.org/10.1029/2005JD006328, 2006. a
Schutgens, N. A. J., Miyoshi, T., Takemura, T., and Nakajima, T.: Applying an ensemble Kalman filter to the assimilation of AERONET observations in a global aerosol transport model, Atmos. Chem. Phys., 10, 2561–2576, https://doi.org/10.5194/acp-10-2561-2010, 2010. a
Sessions, W. R., Reid, J. S., Benedetti, A., Colarco, P. R., da Silva, A., Lu, S., Sekiyama, T., Tanaka, T. Y., Baldasano, J. M., Basart, S., Brooks, M. E., Eck, T. F., Iredell, M., Hansen, J. A., Jorba, O. C., Juang, H.-M. H., Lynch, P., Morcrette, J.-J., Moorthi, S., Mulcahy, J., Pradhan, Y., Razinger, M., Sampson, C. B., Wang, J., and Westphal, D. L.: Development towards a global operational aerosol consensus: basic climatological characteristics of the International Cooperative for Aerosol Prediction Multi-Model Ensemble (ICAP-MME), Atmos. Chem. Phys., 15, 335–362, https://doi.org/10.5194/acp-15-335-2015, 2015. a
Shao, Y.: A model for mineral dust emission, J. Geophys. Res., 106, 20239–20254, 2001. a, b, c
Shao, Y.: Simplification of a dust emission scheme and comparison with data, J. Geophys. Res., 109, D10202, https://doi.org/10.1029/2003JD004372, 2004. a, b, c, d, e, f, g
Shao, Y.: Physics and Modelling of Wind Erosion, Springer-Verlag, Berlin, 2nd edn., 2008. a
Shao, Y. and Klose, M.: A note on the stochastic nature of particle cohesive force and implications to threshold friction velocity for aerodynamic dust entrainment, Aeolian Res., 22, 123–125, https://doi.org/10.1016/j.aeolia.2016.08.004, 2016. a
Shao, Y. and Lu, H.: A simple expression for wind erosion threshold friction velocity, J. Geophys. Res., 105, 22437–22443, 2000. a, b, c
Shao, Y., Raupach, M. R., and Findlater, P. A.: The effect of saltation bombardment on the entrainment of dust by wind, J. Geophys. Res., 98, 12719–12726, 1993. a
Shao, Y., Raupach, M. R., and Leys, J. F.: A model for predicting aeolian sand drift and dust entrainment on scales from paddock to region, Aust. J. Soil Res., 34, 309–342, 1996. a, b, c
Shao, Y., Fink, A. H., and Klose, M.: Numerical simulation of a continental-scale Saharan dust event, J. Geophys. Res., 115, D13205, https://doi.org/10.1029/2009JD012678, 2010. a
Shao, Y., Ishizuka, M., Mikami, M., and Leys, J. F.: Parameterization of size-resolved dust emission and validation with measurements, J. Geophys. Res., 116, D08203, https://doi.org/10.1029/2010JD014527, 2011. a, b, c, d, e, f
Shao, Y., Nickling, W., Bergametti, G., Butler, H., Chappell, A., Findlater, P., Gillies, J., Ishizuka, M., Klose, M., Kok, J. F., Leys, J., Lu, H., Marticorena, B., McTainsh, G., McKenna-Neuman, C., Okin, G. S., Strong, C., and Webb, N.: A tribute to M. R. Raupach for contributions to aeolian fluid dynamics, Aeolian Res., 19, 37–54, https://doi.org/10.1016/j.aeolia.2015.09.004, 2015. a
Shao, Y., Zhang, J., Ishizuka, M., Mikami, M., Leys, J., and Huang, N.: Dependency of particle size distribution at dust emission on friction velocity and atmospheric boundary-layer stability, Atmos. Chem. Phys., 20, 12939–12953, https://doi.org/10.5194/acp-20-12939-2020, 2020. a
Sherman, D. J.: An equilibrium relationship for shear velocity and apparent roughness length in aeolian saltation, Geomorphology, 5, 419–431, https://doi.org/10.1016/0169-555X(92)90016-H, 1992. a
Sinyuk, A., Torres, O., and Dubovik, O.: Combined use of satellite and surface observations to infer the imaginary part of refractive index of Saharan dust, Geophys. Res. Lett., 30, 1081, https://doi.org/10.1029/2002GL016189, 2003. a, b
Slinn, W.: Predictions for particles deposition to vegetative canopies, Atmos. Environ., 16, 1785–1794, https://doi.org/10.1016/0004-6981(82)90271-2, 1982. a
Slinn, W.: Precipitation scavenging, in: Atmospheric Science and Power Production, edited by: Randerson, D., pp. 466–532, OSTI, Oak Ridge, 1984. a, b
Spada, M.: Development and evaluation of anatmospheric aerosol module implemented within the NMMB/BSC-CTM, PhD thesis, Universitat Politècnica de Catalunya, available at: http://hdl.handle.net/2117/95991 (last access: 12 October 2021), 2015. a, b, c
Spada, M., Jorba, O., Pérez García-Pando, C., Janjic, Z., and Baldasano, J. M.: Modeling and evaluation of the global sea-salt aerosol distribution: sensitivity to size-resolved and sea-surface temperature dependent emission schemes, Atmos. Chem. Phys., 13, 11735–11755, https://doi.org/10.5194/acp-13-11735-2013, 2013. a, b
Stout, J. E., Arya, S. P., and Genikhovich, E. L.: The effect of nonlinear drag on the motion and settling velocity of heavy particles, J. Atmos. Sci., 52, 3836–3848, 1995. a
Tegen, I., Harrison, S. P., Kohfeld, K., Prentice, I. C., Coe, M., and Heimann, M.: Impact of vegetation and preferential source areas on global dust aerosol: Results from a model study, J. Geophys. Res., 107, 4576 https://doi.org/10.1029/2001JD000963, 2002. a, b
Textor, C., Schulz, M., Guibert, S., Kinne, S., Balkanski, Y., Bauer, S., Berntsen, T., Berglen, T., Boucher, O., Chin, M., Dentener, F., Diehl, T., Easter, R., Feichter, H., Fillmore, D., Ghan, S., Ginoux, P., Gong, S., Grini, A., Hendricks, J., Horowitz, L., Huang, P., Isaksen, I., Iversen, I., Kloster, S., Koch, D., Kirkevåg, A., Kristjansson, J. E., Krol, M., Lauer, A., Lamarque, J. F., Liu, X., Montanaro, V., Myhre, G., Penner, J., Pitari, G., Reddy, S., Seland, Ø., Stier, P., Takemura, T., and Tie, X.: Analysis and quantification of the diversities of aerosol life cycles within AeroCom, Atmos. Chem. Phys., 6, 1777–1813, https://doi.org/10.5194/acp-6-1777-2006, 2006. a
Thompson, G., Field, P. R., Rasmussen, R. M., and Hall, W. D.: Explicit Forecasts of Winter Precipitation Using an Improved Bulk Microphysics Scheme. Part II: Implementation of a New Snow Parameterization, Mon. Weather Rev., 136, 5095–5115, https://doi.org/10.1175/2008MWR2387.1, 2008. a
Timmreck, C. and Schulz, M.: Significant dust simulation differences in nudged andclimatological operation mode of the AGCM ECHAM, J. Geophys. Res., 109, D13202, https://doi.org/10.1029/2003JD004381, 2004. a
Todd, M. C., Washington, R., Martins, J. V., Dubovik, O., Lizcano, G., M'Bainayel, S., and Engelstaedter, S.: Mineral dust emission from the Bodélé Depression, northern Chad, during BoDEx 2005, J. Geophys. Res.-Atmos., 112, D06207, https://doi.org/10.1029/2006JD007170, 2007. a
Tong, D. Q., Wang, J. X. L., Gill, T. E., Lei, H., and Wang, B.: Intensified dust storm activity and Valley fever infection in the southwestern United States, Geophys. Res. Lett., 44, 4304–4312, https://doi.org/10.1002/2017GL073524, 2017. a
Udden, J. A.: Mechanical composition of clastic sediments, Geol. Soc. Am. Bull., 25, 655–744, https://doi.org/10.1130/GSAB-25-655, 1914. a
Ungar, J. E. and Haff, P. K.: Steady state saltation in air, Sedimentology, 34, 289–299, https://doi.org/10.1111/j.1365-3091.1987.tb00778.x, 1987. a
van der Does, M., Knippertz, P., Zschenderlein, P., Harrison, R. G., and Stuut, J.-B. W.: The mysterious long-range transport of giant mineral dust particles, Sci. Adv., 4, eaau2768, https://doi.org/10.1126/sciadv.aau2768, 2018. a
Volz, F. E.: Infrared optical constants of ammonium sulfate, Sahara dust, volcanic pumice, and flyash, Appl. Optics, 12, 564–568, https://doi.org/10.1364/AO.12.000564, 1973. a, b
Vukovic, A., Rajkovic, B.,and Janjic, Z.: Land Ice Sea Surface Model: Short Description and Verification, in: 2010 International Congress on Environmental Modelling and Software Modelling for Environment's Sake, Fifth Biennial Meeting, Ottawa, Canada, 5–8 July 2010, edited by: Swayne, D. A., Yang, W., Voinov, A. A., Rizzoli, A., and Filatova, T., paper No. S.02.08, available at: http://www.iemss.org/iemss2010/index.php?n=Main.Proceedings (last access: 12 October 2021), 2010. a
Wang, J., Xia, X., Wang, P., and Christopher, S. A.: Diurnal variability of dust aerosol optical thickness and Angström exponent over dust source regions in China, Geophys. Res. Lett., 31, L08107, https://doi.org/10.1029/2004GL019580, 2004. a
Webb, N. P., Chappell, A., LeGrand, S. L., Ziegler, N. P., and Edwards, B. L.: A note on the use of drag partition in aeolian transport models, Aeolian Res., 42, 100560, https://doi.org/10.1016/j.aeolia.2019.100560, 2020. a
Wentworth, C. K.: A scale of grade and class terms for clastic sediments, J. Geol., 30, 377–392, https://doi.org/10.1086/622910, 1922. a
White, B. R.: Soil transport by winds on Mars, J. Geophys. Res., 84, 4643–4651, https://doi.org/10.1029/JB084iB09p04643, 1979. a
Wild, O., Zhu, X., and Prather, M. J.: Fast-J: Accurate Simulation of In- and Below-Cloud Photolysis in Tropospheric Chemical Models, J. Atmos. Chem., 37, 245–282, https://doi.org/10.1023/A:1006415919030, 2000. a
Xian, P., Reid, J. S., Hyer, E. J., Sampson, C. R., Rubin, J. I., Ades, M., Asencio, N., Basart, S., Benedetti, A., Bhattacharjee, P. S., Brooks, M. E., Colarco, P. R., da Silva, A. M., Eck, T. F., Guth, J., Jorba, O., Kouznetsov, R., Kipling, Z., Sofiev, M., Pérez García-Pando, C., Pradhan, Y., Tanaka, T., Wang, J., Westphal, D. L., Yumimoto, K., and Zhang, J.: Current state of the global operational aerosol multi-model ensemble: An update from the International Cooperative for Aerosol Prediction (ICAP), Q. J. Roy. Meteor. Soc., 145, 176–209, https://doi.org/10.1002/qj.3497, 2019. a, b
Yarwood, G., Rao, S., Yocke, M., and Whitten, G.: Updates to the Carbon Bond Chemical Mechanism: CB05. Final Report to the US EPA, RT-0400675, available at: https://camx-wp.azurewebsites.net/Files/CB05_Final_Report_120805.pdf (last access: 12 October 2021), 2005. a
Zakey, A. S., Solmon, F., and Giorgi, F.: Implementation and testing of a desert dust module in a regional climate model, Atmos. Chem. Phys., 6, 4687–4704, https://doi.org/10.5194/acp-6-4687-2006, 2006. a
Zender, C. S., Bian, H., and Newman, D.: Mineral dust entrainment and deposition (DEAD) model: Description and 1990s dust climatology, J. Geophys. Res., 108, 4416, https://doi.org/10.1029/2002JD002775, 2003. a, b, c, d, e
Zhang, J., Teng, Z., Huang, N., Guo, L., and Shao, Y.: Surface renewal as a significant mechanism for dust emission, Atmos. Chem. Phys., 16, 15517–15528, https://doi.org/10.5194/acp-16-15517-2016, 2016. a
Zhang, L., Gong, S., Padro, J., and Barrie, L.: A size-segragrated particle dry deposition scheme for an atmospheric aerosol module, Atmos. Environ., 35, 549–560, https://doi.org/10.1016/S1352-2310(00)00326-5, 2001. a
Zilitinkevich, S. S.: Bulk characteristics of turbulence in the atmospheric planetary boundary layer, Trudy GGO, 167, 49–52, 1965. a
Zimon, A. D.: Adhesion of dust and powder, Consultants Bureau, New York, 1982. a
- Abstract
- Introduction
- The MONARCH model
- The mineral dust cycle in MONARCH
- Model performance and evaluation
- Conclusions and outlook
- Appendix A: Dust emission and deposition
- Appendix B: Dust optical depth and its frequency of occurrence
- Appendix C: Comparison with AERONET
- Appendix D: Size-dependent dust direct radiative effect
- Appendix E: List of symbols
- Code availability
- Data availability
- Author contributions
- Competing interests
- Disclaimer
- Acknowledgements
- Financial support
- Review statement
- References