the Creative Commons Attribution 4.0 License.
the Creative Commons Attribution 4.0 License.
 | 16 Jul 2021
Investigating the importance of sub-grid particle formation in point source plumes over eastern China using IAP-AACM v1.0 with a sub-grid parameterization
Ying Wei
Xueshun Chen
Huansheng Chen
Wenyi Yang
Huiyun Du
Qizhong Wu
Xiujuan Zhao
Jie Li
Zifa Wang
The influence of sub-grid particle formation (SGPF) in point source plumes on aerosol particles over eastern China was firstly illustrated by implementing an SGPF scheme into a global–regional nested chemical transport model with an aerosol microphysics module. The key parameter in the scheme was optimized based on the observations in eastern China. With the parameterization of SGPF, the spatial heterogeneity and diurnal variation in particle formation processes in sub-grid scale were well resolved. The SGPF scheme can significantly improve the model performance in simulating aerosol components and new particle formation processes at typical sites influenced by point sources. The comparison with observations at Beijing, Wuhan and Nanjing showed that the normal mean bias (NMB) of sulfate and ammonium could be reduced by 23 %–27 % and 12 %–14 %, respectively. When wind fields are well reproduced, the correlation of sulfate between simulation and observation can be increased by 0.13 in Nanjing. Considering the diurnal cycle of new particle formation, the SGPF scheme can greatly reduce the overestimation of particle number concentration in nucleation and Aitken mode at night caused by fixed-fraction parameterization of SGPF. On the regional scale, downwind areas of point source experienced an increase in sulfate concentration of 25 %–50 %. The results of this study indicate the significant effects of SGPF on aerosol particles over areas with the point source and the necessity of a reasonable representation of SGPF processes in chemical transport models.
- Article
(6074 KB) - Full-text XML
-
Supplement
(636 KB) - BibTeX
- EndNote


Air pollution caused by high concentrations of aerosol particles has become a major environmental problem in metropolises and has attracted public attention in China (Zhang and Cao, 2015; Sun and Chen, 2017). Atmospheric aerosol particles not only affect atmospheric visibility and public health but also have significant climatic and ecological effects (Zhang et al., 2010; Boucher et al., 2013; Powell et al., 2015; Yang et al., 2019, 2020a), which are closely related to their size distribution and chemical composition (Spracklen et al., 2005; Dusek et al., 2006). As one of the main inorganic aerosol components, sulfate directly changes the energy budget of the earth–atmosphere system by scattering solar radiation and indirectly affects the climate by acting as cloud condensation nuclei (CCN) (IPCC, 2013). Sulfuric acid (H2SO4) is the core material in the nucleation and growth of particles. The hygroscopicity of sulfate triggers heterogeneous reactions of gas precursors by changing the aerosol water content (Zhuang et al., 2014). Sulfate can also enhance extinction and contribute to haze pollution by mixing with other components (Zhu et al., 2010; Zanatta et al., 2018), affecting the formation of secondary inorganic aerosol (Adams et al., 1999) and secondary organic aerosol (SOA) (He et al., 2018). Coal consumption contributed about 80 % to sulfur dioxide (SO2) emission in China over the last decade, with 70 %–90 % being from power plants and industrial emissions (Wang et al., 2014; Ma et al., 2017; Zheng et al., 2018). Although emissions in China have declined since 2007 and India has replaced China as the world's largest SO2 emitter (Li et al., 2017; Chen et al., 2020), SO2 from energy and industrial sectors is still the major source of sulfate in China.
For point sources, the oxidation from SO2 to sulfate is a typical sub-grid phenomenon with a rapid conversion rate in the plume. The concentration of nitrogen oxides (NOx) and volatile organic compounds (VOCs) can influence atmospheric oxidation though gas-phase chemical reactions and thus the OH concentration and the oxidation of SO2. In a sulfur-rich plume, a swift gas-to-particle process occurs through the reaction 2OH + SO2 → H2SO4 (Kulmala and Kerminen, 2008), due to the higher concentration of NOx and VOCs in the plume than in the ambient atmosphere and also due to the inhomogeneous meteorological condition (i.e., temperature, relative humidity (RH)) and aerosol concentrations within and external to the plume (Yu, 2010; Lonsdale et al., 2012; Stevens et al., 2012). H2SO4 can either condense onto pre-existing particles or nucleate to form new particles, which are treated as primary sulfate or so-called sub-grid sulfate (SG-ASO4). A significant increase in both mass and number concentrations of particles has been observed downwind of coal-fired power plants (Richards et al., 1981; Gillani et al., 1998; Brock et al., 2002). Yu (2010) showed that particle formation in the plume depends on hydroxyl radical (OH) concentration. The OH concentration varies diurnally and thus the fraction converted to sulfate has a clear diurnal variation, leading to spatio-temporal heterogeneity in local particle mass concentration and particle number size distribution (PNSD).
The simulated distributions of both particle number and component mass are sensitive to the fraction of SO2 oxidized to sulfate in the plume. Currently, for SG-ASO4, an average proportion of 0 %–5 % of total SO2 emissions is often taken as H2SO4 emitted to every grid in chemical transport models (CTMs) (Textor et al., 2006). Furthermore, a fraction of 0 %–15 % of H2SO4 is taken as the newly formed particles in aerosol microphysical models (Luo and Yu, 2011; Chen et al., 2018). The assumption of an averaged fraction of oxidation and nucleation in the grid neglects the diurnal cycle of sub-grid particle formation (SGPF). Furthermore, the scheme cannot capture the spatio-temporal variation in particle formation in the plume, nor does it account for the effect of H2SO4 condensing onto pre-existing particles, which may have a significant impact on PNSD. A simulation in North China employed 26.5 % of primary fine particulate matter as SG-ASO4 indicated a monthly averaged contribution to sulfate of ∼ 10 %–20 % (H. Zhang et al., 2012). The assumed proportion of SG-ASO4 caused an uncertainty in global CCN concentration of up to 40 % and over 100 % in polluted regions (Spracklen et al., 2005). As SGPF may occur on a spatial scale of 10 s km−1, this leads to large uncertainties in predicting the spatio-temporal variation in particle number and mass concentration during dilution in the plume when it is calculated as a grid-averaged concentration, as in most CTMs (Spracklen et al., 2005, 2008).
To solve the uncertainties caused by grid-averaged fraction of SO2-to-H2SO4, a plume-in-grid (PinG) model coupled to the Eulerian model has been developed in air quality models such as the Community Multiscale Air Quality model, the Comprehensive Air quality Model with extensions and the Weather Research and Forecasting and Chemistry model (Gillani and Godowitch, 1999; Karamchandani et al., 2002, 2010). However, the implementation of PinG greatly increases the computational burden due to the large number of fine grids resolved. For this reason, PinG is not suitable for complicated aerosol models involving microphysical processes. Stevens and Pierce (2013) developed a computationally efficient sub-grid parameterized scheme, the Predicting Particle Production in Power-Plant Plumes (P6) scheme, based on physicochemical processes of particle formation. The scheme was incorporated in a global CTM with an aerosol microphysics module, and the sub-grid effect on particle number concentration was evaluated against observations over North America and Europe. However, urban sites were excluded from the evaluation and the sub-grid impact on aerosol components was not described. Up to now, there are few modeling studies involving sub-grid particle characteristics in highly polluted regions such as China. The severe air pollution in China means that atmospheric chemical characteristics in China are quite different to those in other countries. Higher atmospheric oxidizability and particle growth rates have been reported in recent research (Wang et al., 2017; Tan et al., 2019; Yang et al., 2020b; Liu et al., 2021). Therefore, OH concentration (a key parameter of the oxidation process) parameterized by NOx concentration in the P6 scheme is not suitable for the atmospheric condition in China, and the characteristics of SGPF in plumes should be different here.
In this study, we coupled the P6 scheme to a global–regional nested atmospheric chemistry model with an aerosol microphysics module to better describe the process of SGPF in plumes. Moreover, the localized SGPF scheme (referred to as the SGPF scheme) was developed based on the observed high level of radicals caused by the polluted background in central–eastern China. With the updated model, the improvements in simulating aerosol composition and PNSD were evaluated by comparing them with abundant observations in eastern China. The original model and its updating are described in Sect. 2.1–2.3. Simulation experiments and observations are introduced in Sect. 2.4 and 2.5, respectively. Meteorological fields are verified in Sect. 3.1. The evaluation of the updated model against observations and the model improvements are described in Sect. 3.2–3.4. The influence of SGPF on a regional scale is analyzed in Sect. 3.5.
2.1 Description of IAP-AACM
The Aerosol and Atmospheric Chemistry Model of Institute of Atmospheric Physics (IAP-AACM) is a multi-scale nested three-dimensional chemistry transport model coupled to the Earth System Model of the Chinese Academy of Sciences (CAS-ESM) (Wei et al., 2019; Zhang et al., 2020). The IAP-AACM was developed on the basis of the Nested Grid Air Quality Prediction Model System (NAQPMS) (Wang et al., 2006b) and the Global Nested Grid Air Quality Prediction Model System (GNAQPMS) (Chen et al., 2015). NAQPMS–GNAQPMS are widely used in the simulation of dust (Li et al., 2012; Wei et al., 2019), ozone (Wang et al., 2006a; Li et al., 2007), deposition (Ge et al., 2014), air pollution control policy (Wu et al., 2011; Li et al., 2016; Wei et al., 2017) and global transport of mercury (Chen et al., 2015). In the IAP-AACM, dimethyl sulfide, sea salt and dust emissions are calculated online. The dust scheme originates from the wind erosion model developed by Wang et al. (2000) and improved by Luo and Wang (2006).
The gas-phase chemistry is calculated with the Carbon-Bond Mechanism Z model (CBM-Z; Zaveri and Peters, 1999). The calculation of the photolysis rate mainly considered altitude, latitude, longitude and the effects of clouds. The rates of photolysis reactions depend on the spectral actinic flux, and the spectral actinic flux depends on the absorption and scattering of incident solar radiation by gaseous molecules, clouds and aerosols. The photolytic rate constants typically increase with height due to the reduction in the total integrated optical depth (OD) with lower pressure, less aerosols and clouds (Seinfeld and Pandis, 2012; Williams et al., 2012). The gas-phase chemical mechanism has important impacts on NOx and ultimately the OH concentration calculated in the SGPF scheme. Different mechanisms may have different impacts on the parameterized result. Y. Zhang et al. (2012a) compared simulations conducted in summer with three different gas-phase mechanisms (i.e., CBM-Z, CB05 and SAPRC-99) in WRF-Chem and found that simulations with all three gas-phase mechanisms reproduced the surface concentrations of O3, CO, NO2 and PM2.5 well. Prediction discrepancies caused by different mechanisms were of mass concentrations of O3 (up to 5 ppb), PM2.5 (up to 0.5 µg m−3) and secondary inorganic PM2.5 species (up to 1.1 µg m−3). Overall, the simulation discrepancy between the model with the CBM-Z mechanism and other widely used new mechanisms should be reasonably acceptable.
The aqueous chemistry and wet-deposition scavenging is simulated with the Regional Acid Deposition Model chemical mechanism (Stockwell et al., 1997). The heterogeneous chemistry uses the scheme described by Li et al. (2012). For aerosol microphysical processes, the IAP-AACM describes the size distribution of aerosol particles using the Advanced Particle Microphysics (APM; Yu and Luo, 2009) module, as reported in previous studies (Chen et al., 2014, 2018). The APM in IAP-AACM uses 40 sectional bins to represent secondary particles formed from nucleation and subsequent growth with dry diameters of 0.0012–12 µm. Black carbon (BC) and organic carbon (OC) particles are represented by 28 bins. Sea salt and dust particles are represented by 20 bins and 4 bins, respectively. The APM assumes these particles are the cores of particles and they are coated with secondary species. Both the cores and coating species are tracked in the model. Semi-volatile aerosol species, including nitrate, ammonium and SOA, are simulated by the bulk method. Only their total mass concentrations are tracked and the concentrations apportioned to particles in different sizes are assumed to be proportional to the mass concentration of associated sulfate. Nitrate and ammonium are simulated by ISORROPIA version 1.7 (Nenes et al., 1998, 1999). SOA concentration is calculated with the scheme described by Strader et al. (1999). A comprehensive evaluation of the simulation of IAP-AACM from global to regional was shown in Wei et al. (2019).
2.2 Implementing sub-grid scheme into IAP-AACM
In the original version of the IAP-AACM, H2SO4 was emitted directly into grids by using a fixed proportion with 5 % being emitted into nucleation mode and 95 % condensing onto the existing accumulation mode particles in the APM module (Yu and Luo, 2009). We updated the IAP-AACM+APM by coupling the P6 sub-grid particle parameterization scheme (Stevens and Pierce, 2013) to resolve the dynamic variation in SGPF.
The P6 scheme simulates the rapid conversion from SO2 to sulfate within the plume, considering both computational efficiency and physical basis. The training data for constructing the P6 scheme are based on results of the large-eddy simulation and cloud-resolving model incorporated with a microphysics module, the System for Atmospheric Modeling with TwO Moment Aerosol Sectional (SAM-TOMAS) (Adams and Seinfeld, 2002; Khairoutdinov and Randall, 2003). The model results used to construct the P6 scheme have been tested against aircraft observations (Lonsdale et al., 2012; Stevens et al., 2012). More information on the model can be found in Stevens et al. (2012).
The sub-grid scheme resolves SGPF into two key processes, namely oxidation and nucleation, with involved parameters from the meteorological field, emission source and environmental background as inputs. Accordingly, the oxidation of SO2 emitted from a point source is constructed with meteorological conditions (i.e., wind speed, vg; boundary layer height, BLH; downward shortwave radiative flux, DSWRF), emissions of SO2 and NOx (NOx,emis) from the source, mean background concentrations of SO2 and NOx (bgNOx), and the distance from the source (d). Nucleation of H2SO4 in the plume is constructed with the factors mentioned above and the mean background condensation sink. A scaling factor is used to allow the equations to fit the data when calculating the effective concentrations of NOx and SO2 within the plume, based on the reality that the emitted fluxes and the resulting NOx and SO2 concentrations in the plume are much different from the grid-mean values. A detailed calculation of the parameterization scheme is provided by Stevens and Pierce (2013).
Oxidation and nucleation process in the P6 scheme were integrated into the chemical reaction and aerosol microphysics modules, respectively. The key parameter predicted during the oxidation process is the oxidation fraction of the emitted SO2 (fox). The P6 scheme is combined with the gas-phase chemistry module to describe the dynamic variation in H2SO4 production within and outside the plume, based on the variation in meteorological conditions and environmental backgrounds. Emissions separated by sector are used in IAP-AACM to analyze the impact of different emission sources. We used real-time online calculation of fox to repartition the total SO2 from energy and industrial sector sources to sub-grid H2SO4 production and SO2.
For the nucleation process, the H2SO4 produced in the oxidation process is distributed to nucleate to new particles and condense onto pre-existing particles by the key parameter of new particle formation fraction (fnew). In the APM, the condensation of H2SO4 onto pre-existing particles (sulfate, BC, OC, dust and sea salt) is proportional to the condensation sink ratio of the corresponding particles. Furthermore, the H2SO4 nucleating to newly formed particles is partitioned into 40 bins of secondary particles in the APM with a lognormal distribution as follows:
whereDp and N represent the particle size and total number of particles, respectively; σg is the geometric standard deviation of the aerosol size distribution (1.4 in this study); and Dm is the number-median diameter (µm) calculated by
where Mm is the mean mass per newly formed particles (kg) predicted by the P6 scheme; ρ is the density of dry aerosol (1.7 g cm−3 in our model). After this repartitioning, the tracers of secondary particles are updated through moving mass concentrations of sulfate across bins in the APM module.
2.3 Optimization of the key parameter in the sub-grid scheme
Since OH is very important for the diurnal cycle of SG-ASO4 conversion in the plume, the determination of OH concentration is crucial to the sub-grid scheme. In parameterizing the oxidation process, the key step is calculating fox in the plume, which depends on the rate constant, k, time elapsed, t, and the effective OH concentration in the plume, OHeff (molecules cm−3). OHeff is calculated by
where P1 and P2 are the function of the effective NOx concentration in the plume (NOx,eff, ppb) and the DSWRF, respectively, constructed from excessive training data generated from SAM-TOMAS. P1 and P2 are dimensionless and calculated as
where S0 is the solar constant at the top of the atmosphere (1370 W m−2) and T is an assumed transmittance of the clear atmosphere (0.76). The relationship between DSWRF and OH concentration in the SGPF scheme was displayed in Fig. S1 in the Supplement. The simulated OH concentration is under 1 × 106 cm−3 when DSWRF varies between 0–200 W m−2. Thus, the fraction of total SO2 emitted converted into particles in the plume was much lower in cloudy days.
In the original P6 scheme, x was calculated from NOx,eff by
where NOx,eff is related to NOx,emis (kg N s−1), bgNOx (ppb), BLH (m), vg (m s−1) and d (m) as mentioned in Sect. 2.2 for the low-VOC case for the isoprene mixing ratio of < 0.15 ppb or
in the high-VOC case with the isoprene mixing ratio of 1.5 ppb. The effect of VOC within the plume is not explicitly taken into account in the parameterization of OHeff. Stevens et al. (2012) discussed the potential effect of low and high VOC concentrations on OH production and related it to the concentration of NOx that corresponds to the peak concentration of OH. The large amount of oxidation of isoprene has material effect on peroxy radicals and tends to shift the peak of OH production to a higher level. It is reasonable to expect that the true peak OH concentrations should be shifted to a higher NOx than suggested by the P6 scheme. The upper limit of the background concentration of NOx in the P6 scheme is ∼ 8 ppb (Stevens and Pierce, 2013).
The NOx concentration in eastern China is commonly at a high level of > 20 ppb, so there will be an underestimation of OH production in polluted regions if the original P6 scheme is applied directly. We therefore adjusted the OH concentration parameter in the scheme to take into account the high oxidizability in the polluted atmosphere in eastern China. Although the OHeff calculated in the SGPF scheme is independent of the OH concentration calculated by CBM-Z and was only used to calculate the SO2 oxidation fraction to sulfate in the plume, the grid-averaged OH concentration calculated by CBM-Z has a large impact on NOx and VOCs and ultimately changes OHeff. The simulation of NO2 and OH in the base model has been validated in Wei et al. (2019). Overall, the model reproduced the seasonal variation in NO2 well and captured the daily variations with R of 0.49–0.7 in most cities in eastern China. The global distribution of OH concentration in the IAP-AACM is similar to other CTMs. In addition, the simulations of the IAP-AACM with observations taken at rural sites located in the North China Plain near Beijing (Tan et al., 2017) and the Pearl River Delta near Guangzhou City (Lu et al., 2012) in summer were compared in Fig. S2. Although the observation in Guangzhou was taken in 2006, the characteristics of atmospheric oxidation under the regional atmospheric background can still be roughly reflected. As shown in Fig. S2, the model reproduced the diurnal characteristics of OH concentration well from the south to the north of China in summertime.
Field observations in North China indicate a considerable underestimation of OH levels in simulations for metropolitan areas. For warm seasons, Lu et al. (2013) reported daytime peak OH concentrations of (4–17) × 106 cm−3 at a suburban site in Beijing in summer 2006. Tan et al. (2017) observed a daily OH maxima of (5–15) × 106 cm−3 at a rural site in the North China Plain in summer 2014. In cold seasons, the radical concentrations are expected to be much lower than in summertime due to limited photochemistry, but high concentrations are still found in recently measured records. Tan et al. (2018) observed the average daytime maximum OH concentrations of 2.5 × 106 cm−3 at another suburban site in Beijing in January 2016. Slater et al. (2020) found daily maximum OH concentrations of (1–8) × 106 cm−3 with an averaged daytime peak of 2.7 × 106 cm−3 over the whole observation period.
In view of these observations, we changed the coefficient of [NOx,eff] to 0.3 in the scheme as shown in Eq. (7) to avoid an underestimation of SGPF, on the basis of observations of OH and NOx in eastern China:
The NOx–OH concentration parameterization in both the original scheme and the localized scheme at the site of IAP in Beijing is illustrated in Fig. 1. Before localization, the OH is depleted more when the NOx is high. The NOx–OH curve without localization fits the atmospheric condition in Europe and America. In the updated parameterization, the OH concentration decreases as the NOx concentration increases when the NOx concentration is higher than ∼ 5 ppb. The OH concentration falls to ∼ 2 × 106 cm−3 when NOx concentration is higher than 30 ppb. The maximum of the annual averaged OH concentration is still ∼ 7 × 106 cm−3, but the value of OH concentration corresponding to an NOx concentration of 15–30 ppb is revised from (0.5–1.5) × 106 cm−3 to 2–4 × 106 cm−3. Obviously, there are uncertainties in adjusting the variation curve of OH concentration with respect to the NOx concentration in the plume based on the surface observations. The variation curve can be further updated when observations in the plume are available.
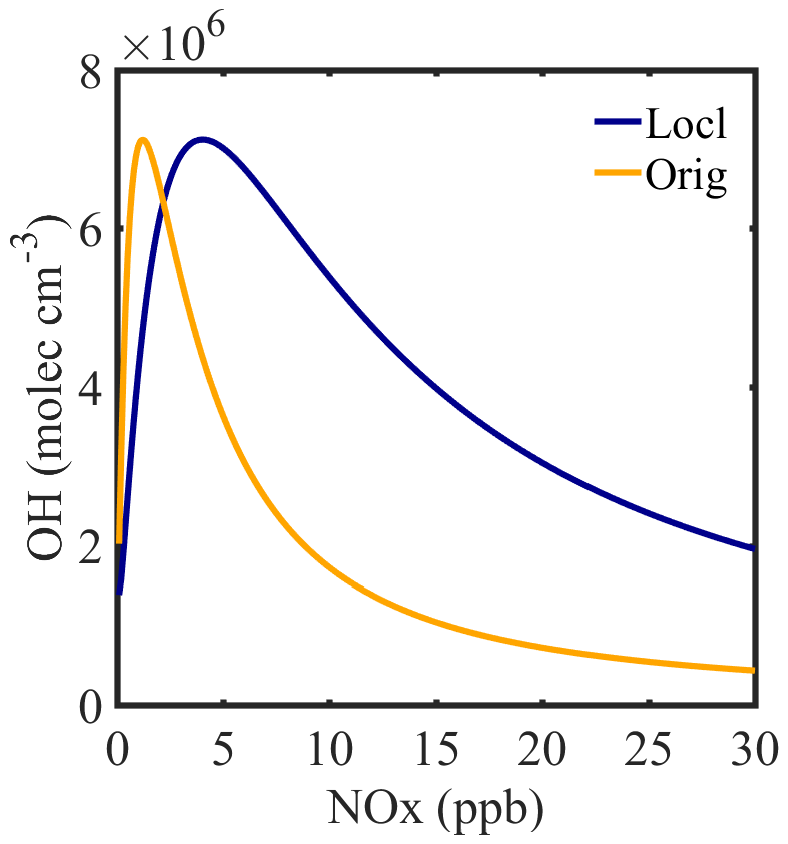
Figure 1The localized (blue line) and original (yellow line) parameterization of the NOx–OH concentration curve in the P6 scheme. The input parameters used to calculate the curve were annually averaged.
2.4 Simulation design
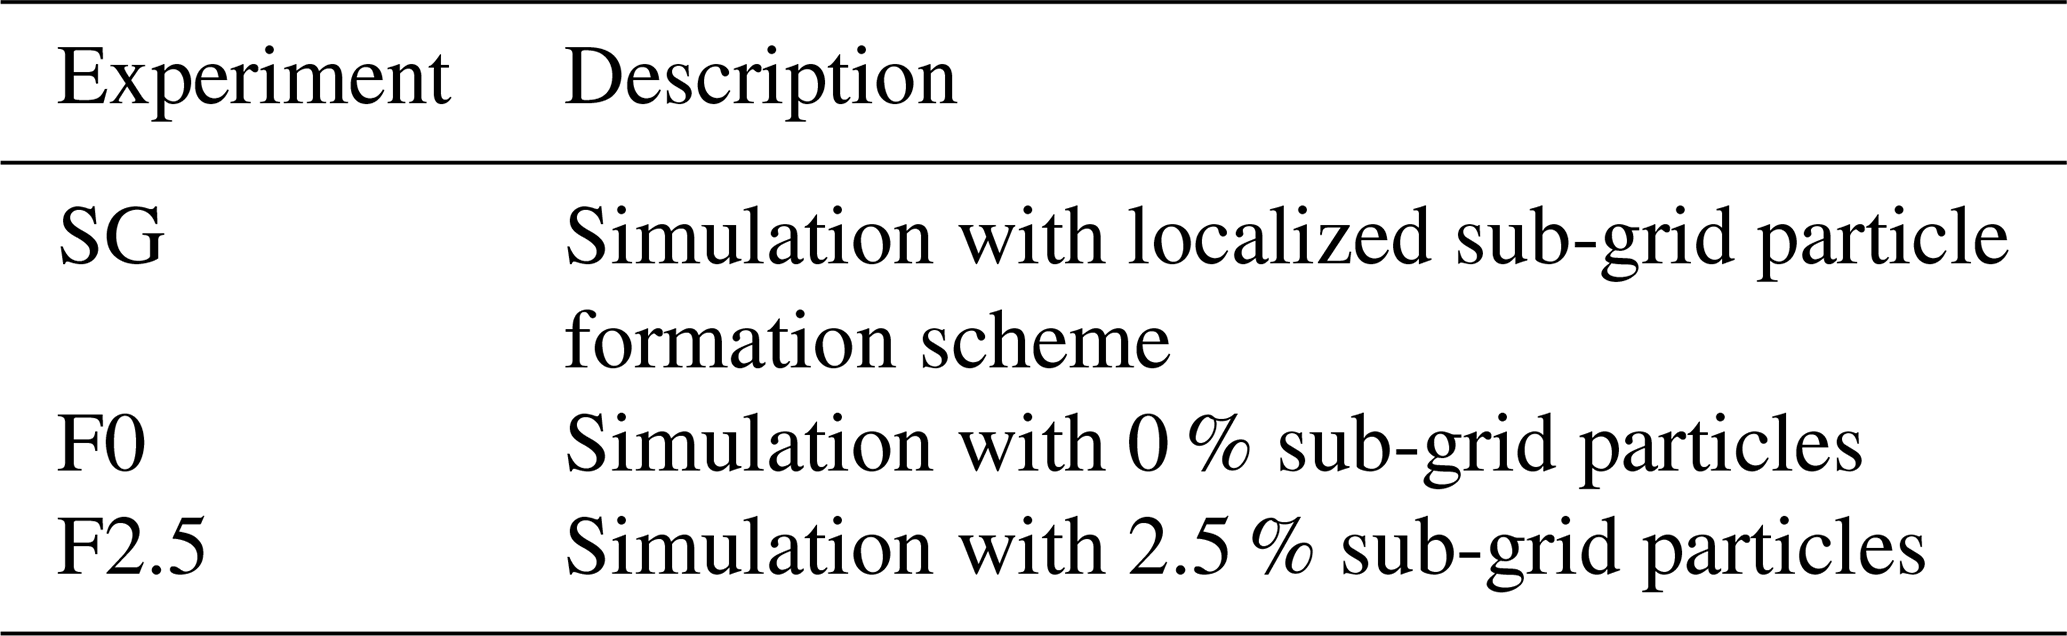
In this study, a nested domain over China with a 0.33∘ × 0.33∘ resolution was implemented to analyze the impact of SGPF on aerosol pollution in China, with the first domain covering the globe at 1∘ × 1∘ resolution. Vertically, the model uses 20 layers, from the bottom layer centered at 50m to the top layer at ∼ 20 km, with 10 layers below 3 km. Meteorology was produced by the global version of Weather Research and Forecasting (GWRF) version 3.7 (Y. Zhang et al., 2012b). The WRF was driven by the National Centers for Environmental Prediction Final Analysis (FNL) datasets with the calculation nudged to FNL data. The input frequencies are 3 h in the global domain and 1 h in the nested domain. The top boundary conditions for ozone, NOx and carbon monoxide were prescribed by the Model for Ozone and Related Chemical Tracers version 4 (Emmons et al., 2010). For model performance evaluation and the analysis of aerosol components, several cases corresponding to observation periods in 2014 (shown in Sect. 2.5) were simulated with 1 month as spin-up time. The experiments used in this study are displayed in Table 1. One simulation with the SGPF scheme (SG) and a control experiment with fox=0 % (F0) were conducted in the simulating period to evaluate the sub-grid particles' impact on aerosol mass concentration simulation. The fraction of fox=0 % represents the simulation without sub-grid particles. In addition, we conducted two simulations that both considered sub-grid particles to explore the impact of the SGPF scheme on the model performance in PNSD at a typical urban site for winter 2016 (described in Sect. 2.5), in which one is with the SGPF scheme and the other is not. The simulation without the SGPF scheme employed fox=2.5 % (F2.5), which refers to the Aerosol Comparisons between Observations and Models recommendation by Dentener et al. (2006). The simulation of F2.5 was also implemented in the comparison of the diurnal characteristics of SGPF in January and July 2014 in Sect. 3.2.
A global emission dataset of source categories (with 29 species and 14 sectors) was applied with anthropogenic emissions from Hemispheric Transport of Air Pollution version 2. Detailed information for the emissions is available from Wei et al. (2019). The SO2 oxidized to SG-ASO4 was from energy and industry sectors (shown in Fig. 2) and was emitted into the first five and three layers of the model, respectively. The emissions in China were scaled to the level of 2014 based on emission trends reported by Zheng et al. (2018). The emissions of China for the simulation of 2016 were updated to the Multi-resolution Emission Inventory for China-2016 published by Tsinghua University (Zhang et al., 2019).
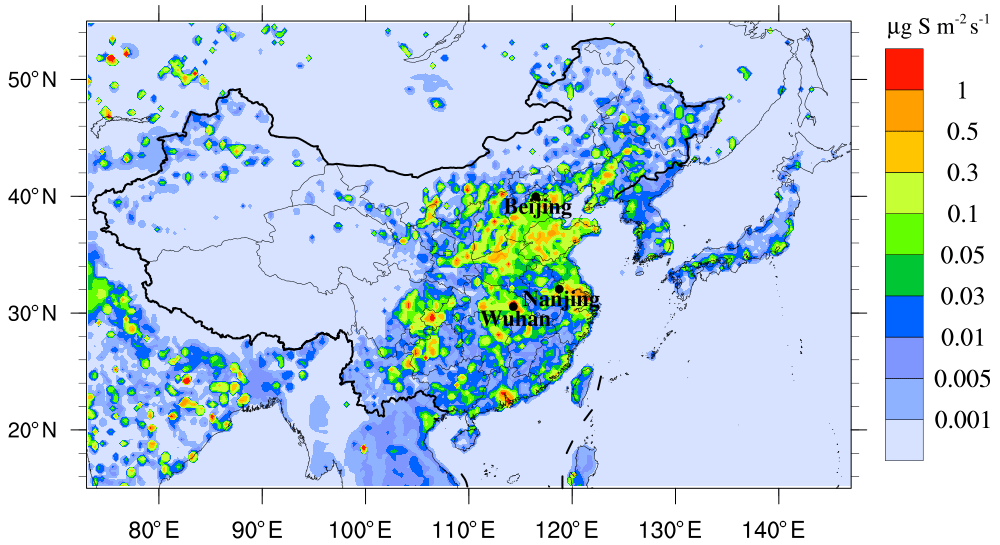
Figure 2The nested domain with annual mean SO2 emission flux (unit: µg S m−2 s−1) from energy and industry sectors in 2014. The black circles are locations of the observation sites.
2.5 Observation data
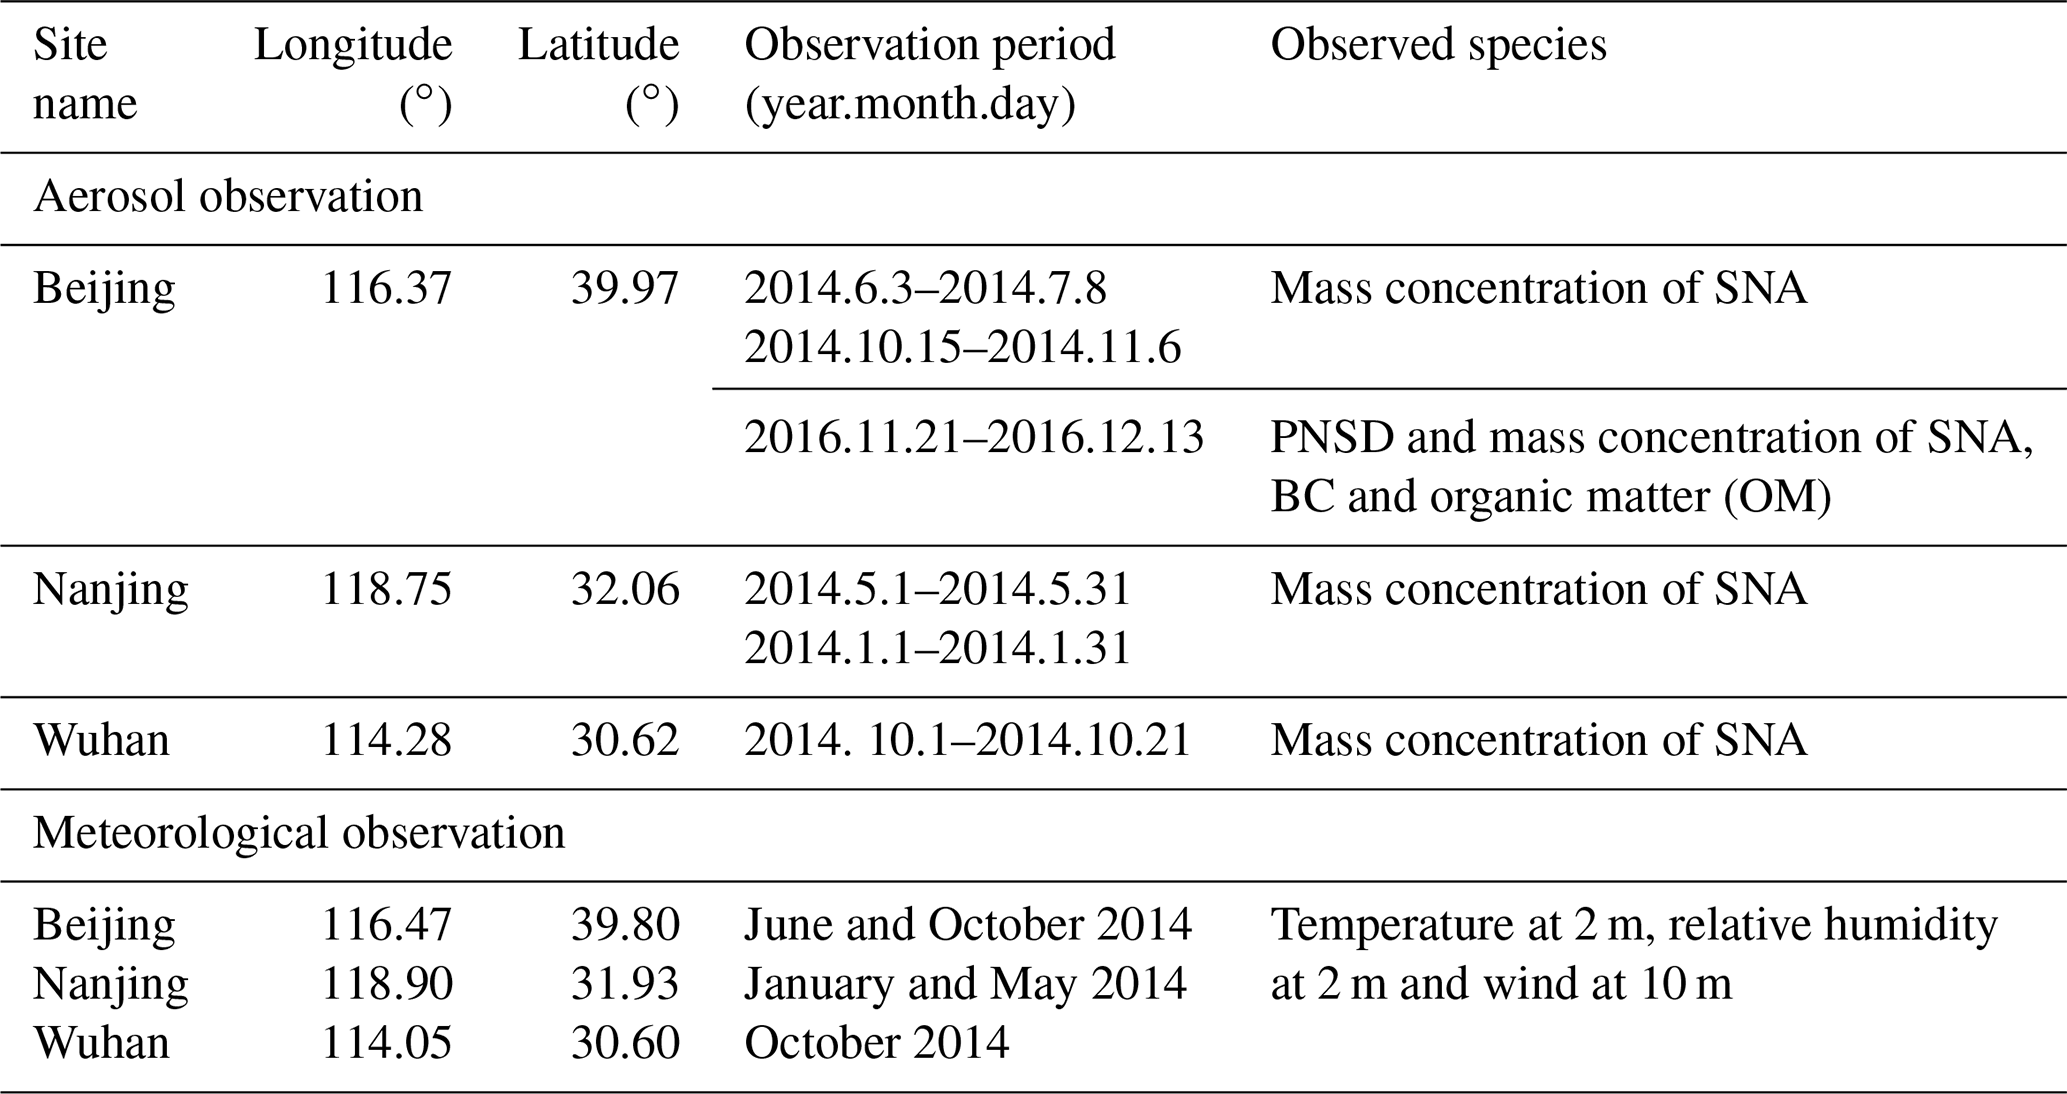
The observations of aerosol components and PNSD were obtained from the Atmospheric Pollution and Human Health in a Chinese Megacity (APHH-Beijing) campaign conducted at an urban site (the meteorological tower of IAP) in central Beijing during November–December 2016. Particle size ranges of 3–25, 25–100 and 100–1000 nm were applied for the nucleation mode, Aitken mode and accumulation mode, respectively. In addition, we collected the mass concentrations of sulfate–nitrate–ammonium (SNA) at urban sites in the center of Nanjing and Wuhan (see in Fig. 2) to evaluate model performance in simulating aerosol components. The Nanjing and Wuhan sites were, respectively, located on the east and west banks of different reaches of the Yangtze River, with several power plants being located to their northeast. Locations and observation periods are given in Table 2. Observations to test the meteorological fields were collected from the National Climate Data Center at sites given in Table 2. In this study, the observation periods were classed as warm (summer and autumn) and cold (winter) seasons to investigate the SGPF under different meteorological conditions, noting that October–November in Beijing and May in Nanjing were categorized as cold and warm seasons, respectively.
Table 2Information of observations for aerosol components and particle number concentrations.
3.1 Evaluation of the simulated meteorological fields
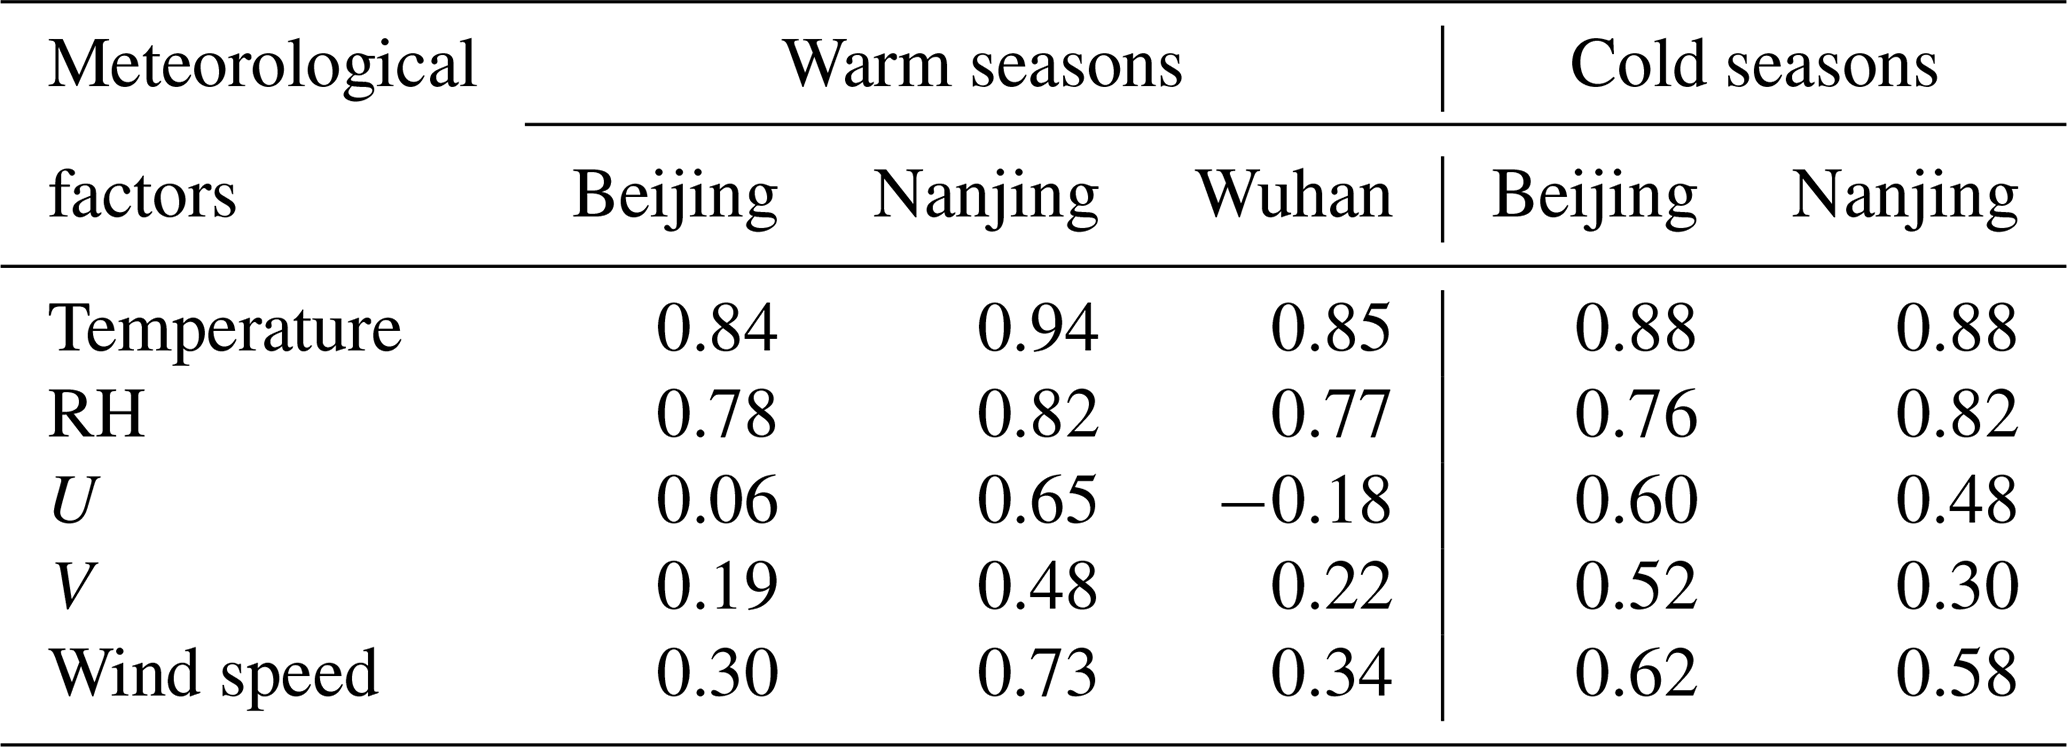
The SGPF is closely related to meteorological conditions, especially solar radiation and wind. Stronger radiation leads to more rapid gas-phase reactions, which means more SGPF. Wind speed and direction control plume diffusion and particle transport in the grids. Furthermore, the concentrations of gases and aerosols in the air are related to temperature, RH, boundary layer height and other meteorological factors. We therefore compared the simulation of several meteorological factors with ground observations in corresponding cities during the same period as shown in Fig. 3. The correlation coefficient (R) of meteorological factors are given in Table 3. The simulation of temperature and RH agreed well with observations, with correlation coefficients (R) of > 0.8. Regarding wind field, the model displays more uncertainties, with R values of 0.30–0.73 for wind speed and < 0.30 for wind direction in Beijing and Wuhan. The worse performance in the Beijing warm season than in the cool season should be related to the poor simulation of the wind field in the warm season. Particularly, there is an obvious discrepancy between modeled and observed variations in Wuhan, with a relatively lower R value of 0.34. This may lead to a poor performance in modeling aerosol distribution.
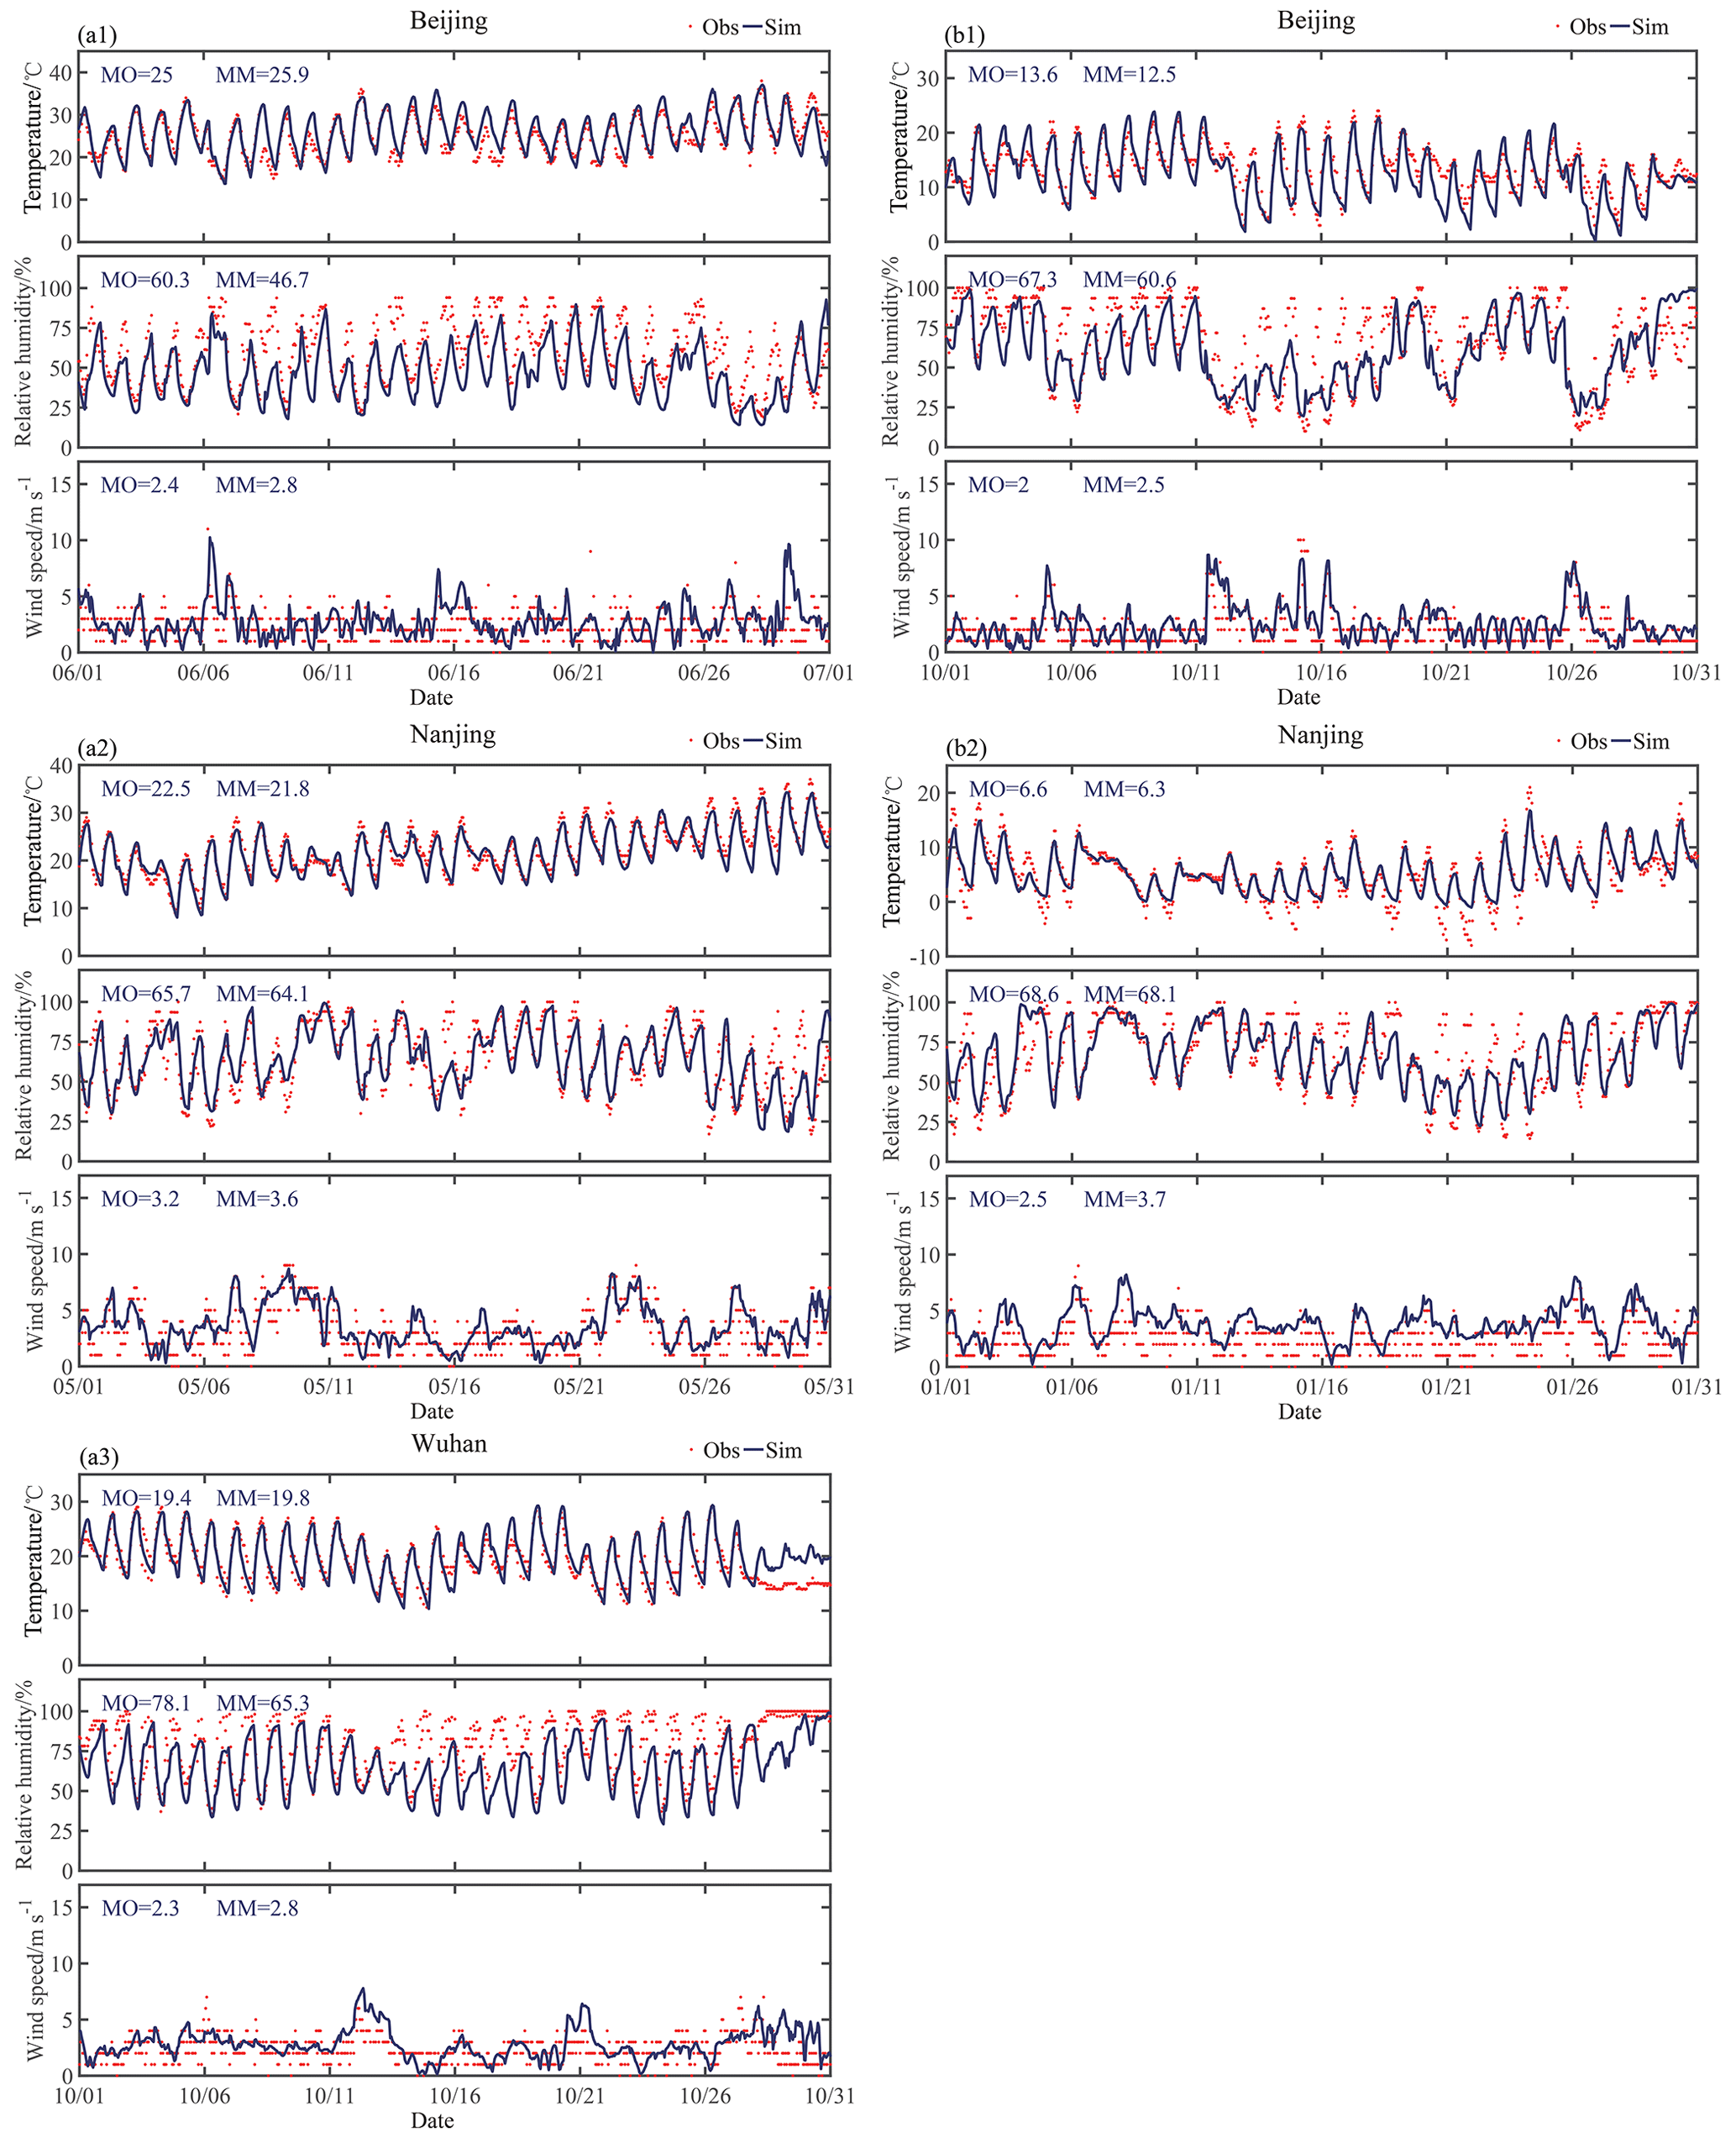
Figure 3Comparison between observed and simulated meteorological factors (i.e., temperature, relative humidity and wind speed) in (a1) Beijing, (a2) Nanjing and (a3) Wuhan in the warm seasons and (b1) Beijing and (b2) Nanjing in the cold seasons of 2014. The red dots and blue lines represent hourly observations and simulations, respectively. Monthly mean values of the observation and simulation are also given on subplots in blue text, abbreviated to MO and MM, respectively.
Table 3Summary of correlation coefficients for hourly meteorological factors in different cities. RH, U and V represent relative humidity, U wind and V wind, respectively.
3.2 Diurnal variation in sub-grid particle formation
The diurnal variation in oxidation rate and mass concentration of SG-ASO4 is shown in Fig. 4. In summer, a clear diurnal pattern for fox at different latitudes is displayed, with initial upward then downward trends from 08:00 to 20:00 (all times in this paper are given in China Standard Time, CST, UTC+8). The fox varies from ∼ 0 % to over 10 % and from 0 % to 14 % in Beijing (Fig. 4a) and Wuhan (Fig. 4c), respectively, due to the variation in solar radiation. At night, fox remained at almost 0 % due to the much lower OH concentration. In winter, fox increased to ∼ 5 % during the daytime and fell to ∼ 0 % at night in Wuhan, with the time for fox being > 1 % narrowing to 10:00–18:00. For the same period, thefox in Wuhan is about 1.5 times that of Beijing. Within a city, the maximumfox in summer is ∼ 3 times that in winter. Particularly, the maximum fox in summer is about 6 times and 4 times that of the simulation of F2.5 for Wuhan and Beijing, respectively. Overall, there is an evident discrepancy forfox in the spatio-temporal distribution. The rate of sulfate formation at noon is significantly higher than at other times, leading to more sulfur deposition (Xu et al., 2014).

Figure 4Monthly averaged diurnal variation in the oxidation rate (fox, a, c) and mass concentration ( µg m−3) of sub-grid sulfate (b, d) in January (blue line) and July (red line) from the IAP-AACM. The orange line represents constant fox of 2.5 %. The solid line and dash-dotted line represent simulation with the sub-grid scheme (SG) and constant fox of 2.5 % (F2.5), respectively. The top row and bottom row are for Beijing and Wuhan, respectively.
The diurnal variation in the mass concentration of SG-ASO4 associated with different fox and emission flux is shown in Fig. 4b and d. The modeling results of SG-ASO4 in Beijing ranged between 0–2 and 0–1 µg m−3 in summer and winter, respectively. In Wuhan, the maximum value exceeded 10 and ∼ 4 µg m−3 in summer and winter, respectively. This indicates that SGPF is substantially important in areas with large point sources. On the other hand, simulation with fixed fox (2.5 %) maintained a constant SG-ASO4 concentration of about 0.5–0.9 and 2 µg m−3 in Beijing and Wuhan, respectively. It is worth noting that, in Beijing, the model results of SG-ASO4 with fixed fox are slightly higher in winter than summer, due to the higher emission flux of SO2 in the heating season. However, the simulation with the SGPF scheme suggests the opposite due to higher SG-ASO4 conversion in summer, demonstrating the superiority of the scheme in resolving temporal heterogeneity of SGPF.
3.3 Improvement in aerosol components simulation
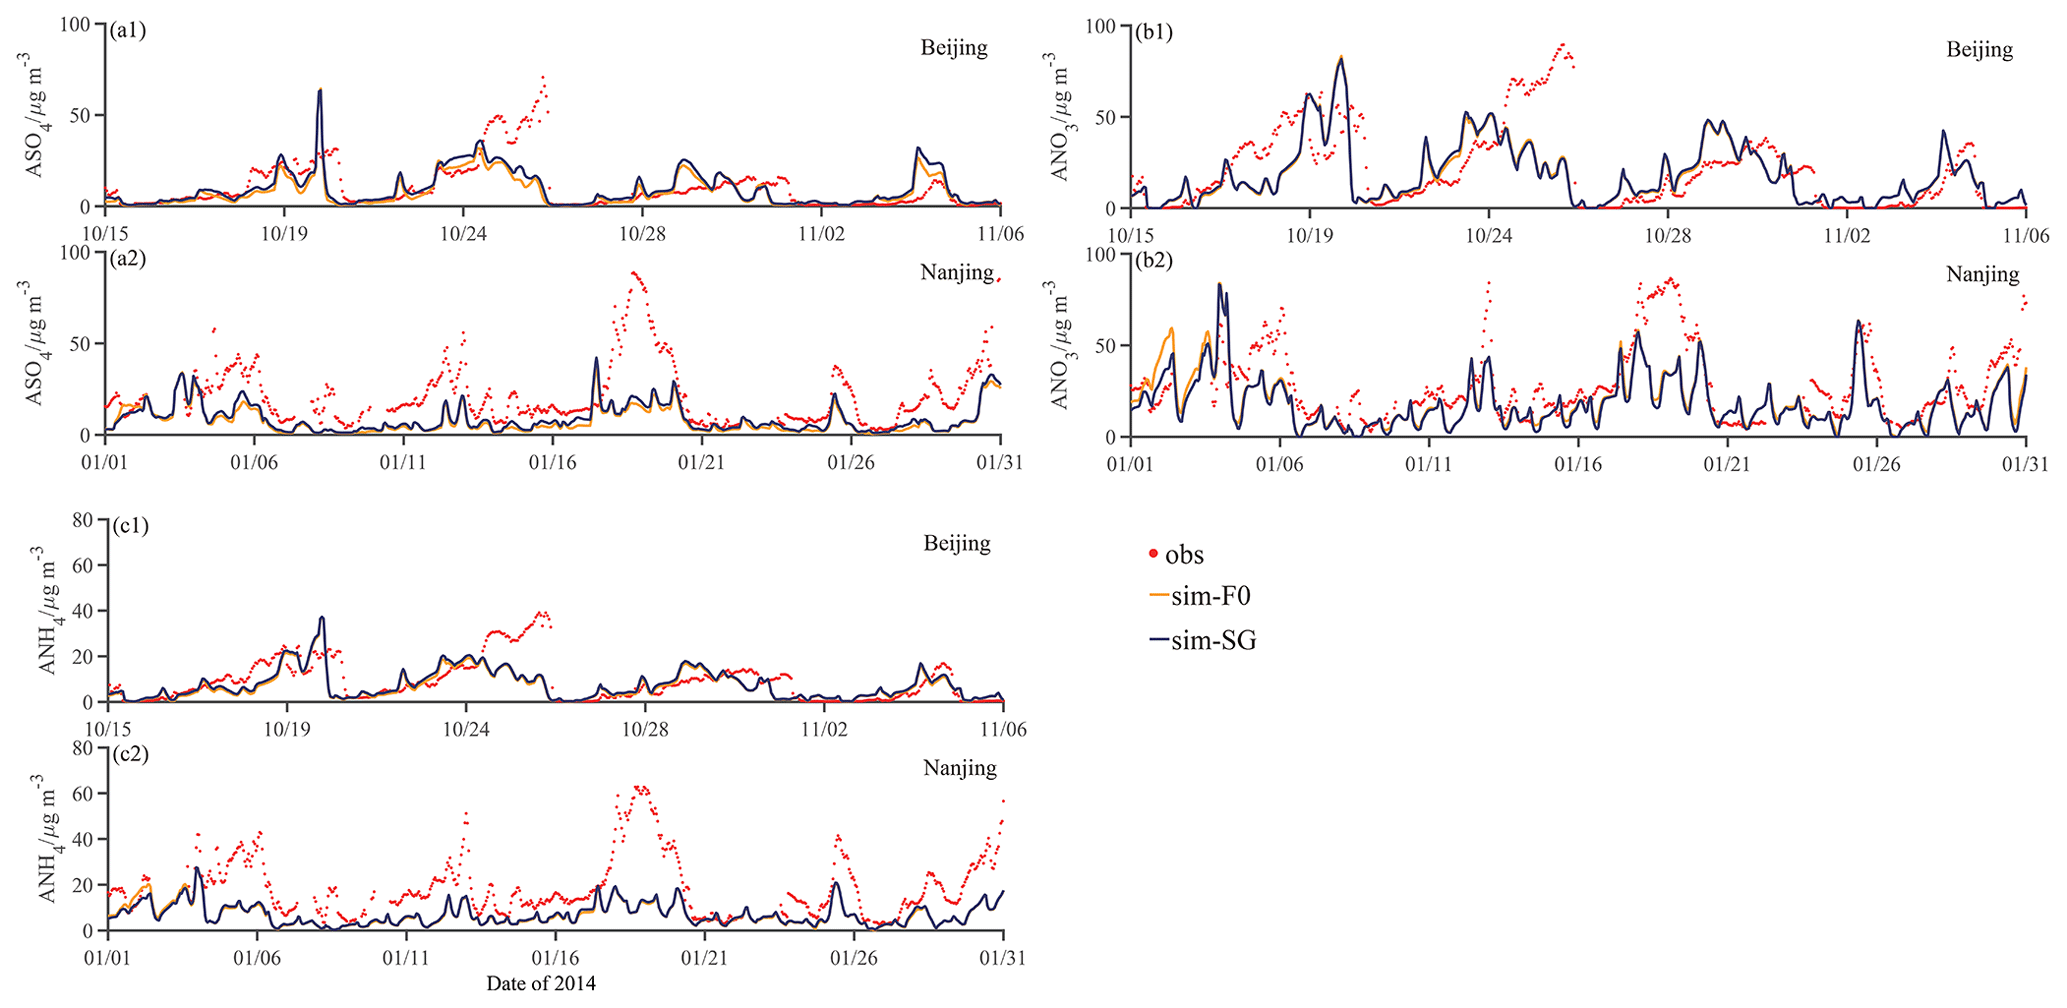
The testing of the simulated time series of SNA mass concentration against site observations in warm seasons is illustrated in Fig. 5, which displays the IAP-AACM simulation with and without the SGPF scheme. The statistics for different model results are given in Table 4. The model reproduced SNA concentration and its temporal evolution well, with R values generally over 0.5. Overall, the model somewhat underpredicted the concentration of SNA. The simulation in Beijing matched observations most closely, likely due to the more accurate emission inventory available for that area.

Figure 5Comparison of hourly simulated aerosol components against site observations in Beijing, Nanjing and Wuhan in warm seasons: (a1–a3) sulfate, (b1–b3) nitrate, (c1–c3) ammonium. The blue and orange lines represent simulations with the SG scheme and with constant fox of 0 % (F0), respectively. The red dots represent observations.
Table 4Summary of statistics for hourly mass concentration of aerosol components in different seasons. MO, MM, NMB and R represent the mean value of the observations, the mean value of the model, normalized mean bias and correlation coefficients, respectively. ASO4, ANO3 and ANH4 represent sulfate, nitrate and ammonium, respectively.

The SG simulation can increase sulfate increases of 1–5 µg m−3 in warm seasons (Fig. 5). Compared with the F0 simulation, the SG simulation leads to an obvious improving on model bias (shown in Table 4), against the background of underestimation of SNA in the model. The normalized model bias (NMB) in Nanjing and Wuhan was narrowed from −41 % to −18 % and from −60 % to −33 %, respectively. The overestimation of the Beijing NMB increased by 20 % (it was overestimated by 6 % in F0). The simulation of SG significantly improved the correlation of sulfate in Nanjing with the R increasing by 0.13. The SG correlation is similar to that of F0 in Beijing but lower in Wuhan where the R value decreased by 0.15, with this being related to some extent to the poor wind simulation in these areas (as shown in Table 3). The SGPF scheme also has an obvious impact on the simulation of ammonium, with the NMB reduced by 14 % and R increased by 0.08 in Nanjing and the NMB decreased by 12 % in Wuhan. The correlation of nitrate in SG is similar to that in the simulation of F0, with the model bias increasing by 1 %–9 %. Overall, the IAP-AACM exhibits good performance in SNA simulation, and the SGPF scheme improves the simulation on sulfate and ammonium.
The SGPF scheme significantly narrowed the gap between model and observation in Wuhan, with the NMB decreasing from −0.6 to −0.33 due to the high emission rate of the point source. We found that the sulfate concentration simulated by the IAP-AACM with the SGPF scheme increased significantly during the daytime, especially on 1 and 15 October. The concentration of sulfate was up to 20 µg m−3 higher on those days than the model results without SG-ASO4. This could be related to the influence of the local wind direction on the plume spreading and accumulation of pollutants. We compared the average diurnal variation in simulated SNA concentrations in Wuhan with observations in Fig. 6. The simulated diurnal profiles of both SG and F0 reproduced the variation in sulfate proportions in SNA (ASO4 / SNA) as unimodal. Simulation with the SGPF scheme provides diurnal SNA mass concentration profiles more similar to observations than that of F0. The averaged SNA concentration was increased by ∼ 5 µg m−3 at night and 10 µg m−3 in the afternoon. The simulated ASO4 / SNA ratio of SG increased by 5 %–10 % or more at daytime and about 5 % more at night than in F0. The simulated ASO4 / SNA ratio dropped much more dramatically than the observed one at noon due to over-decomposition of nitric acid under high-temperature conditions.

Figure 6Averaged diurnal variation for the observed and simulated total SNA concentrations (solid lines), observed ASO4 / SNA ratio (black dashed line), and the percentage of sulfate, nitrate and ammonium in total SNA concentrations (color bars, i.e., observations, simulations of SG and F0) in Wuhan, 1–21 October 2014.
The simulation of SNA in cold seasons is shown in Fig. 7. In general, the mass concentration of sulfate was obviously underestimated, with the SG simulation showing weaker improvement in the negative bias than in warm seasons. As shown in Table 4, the NMB of sulfate decreased by 0.16 and 0.05 in Beijing and Nanjing, respectively. The correlation increased slightly (by 0.02–0.04) due to the favorable performance of wind simulation (Table 3). The SGPF scheme slightly improved the simulation of ammonium but had a neglectable effect on the simulation of nitrate. The NMB of ammonium was reduced by 0.06 in Beijing but not changed in Nanjing as the SGPF is weakest in January. For nitrate, the simulation of SG gave little change in correlation but increased the NMB by 0.05 in Nanjing. The evaluation of SNA simulations in SG and F0 indicates that the SGPF scheme improves model performance for sulfate and ammonium, especially in warm seasons. In particular, the consideration of SG-ASO4 has a considerable influence on the spatio-temporal distribution of SNA near sulfur-rich stacks on condition that the simulation of wind field is reliable.
As displayed in Fig. 8, sulfate accounted for over 40 % of SNA concentration in warm seasons and about 20 %–30 % in cold seasons in 2014. In Nanjing and Wuhan in warm seasons, simulated sulfate without SGPF made up only ∼ 30 % of SNA. The simulation of SG raised the simulated proportion of sulfate by ∼ 10 % in warm seasons and < 5 % in cold seasons. We concluded that the model coupled with the SGPF scheme delivers remarkable advantages in determining the concentration of sulfate and its proportion in SNA.
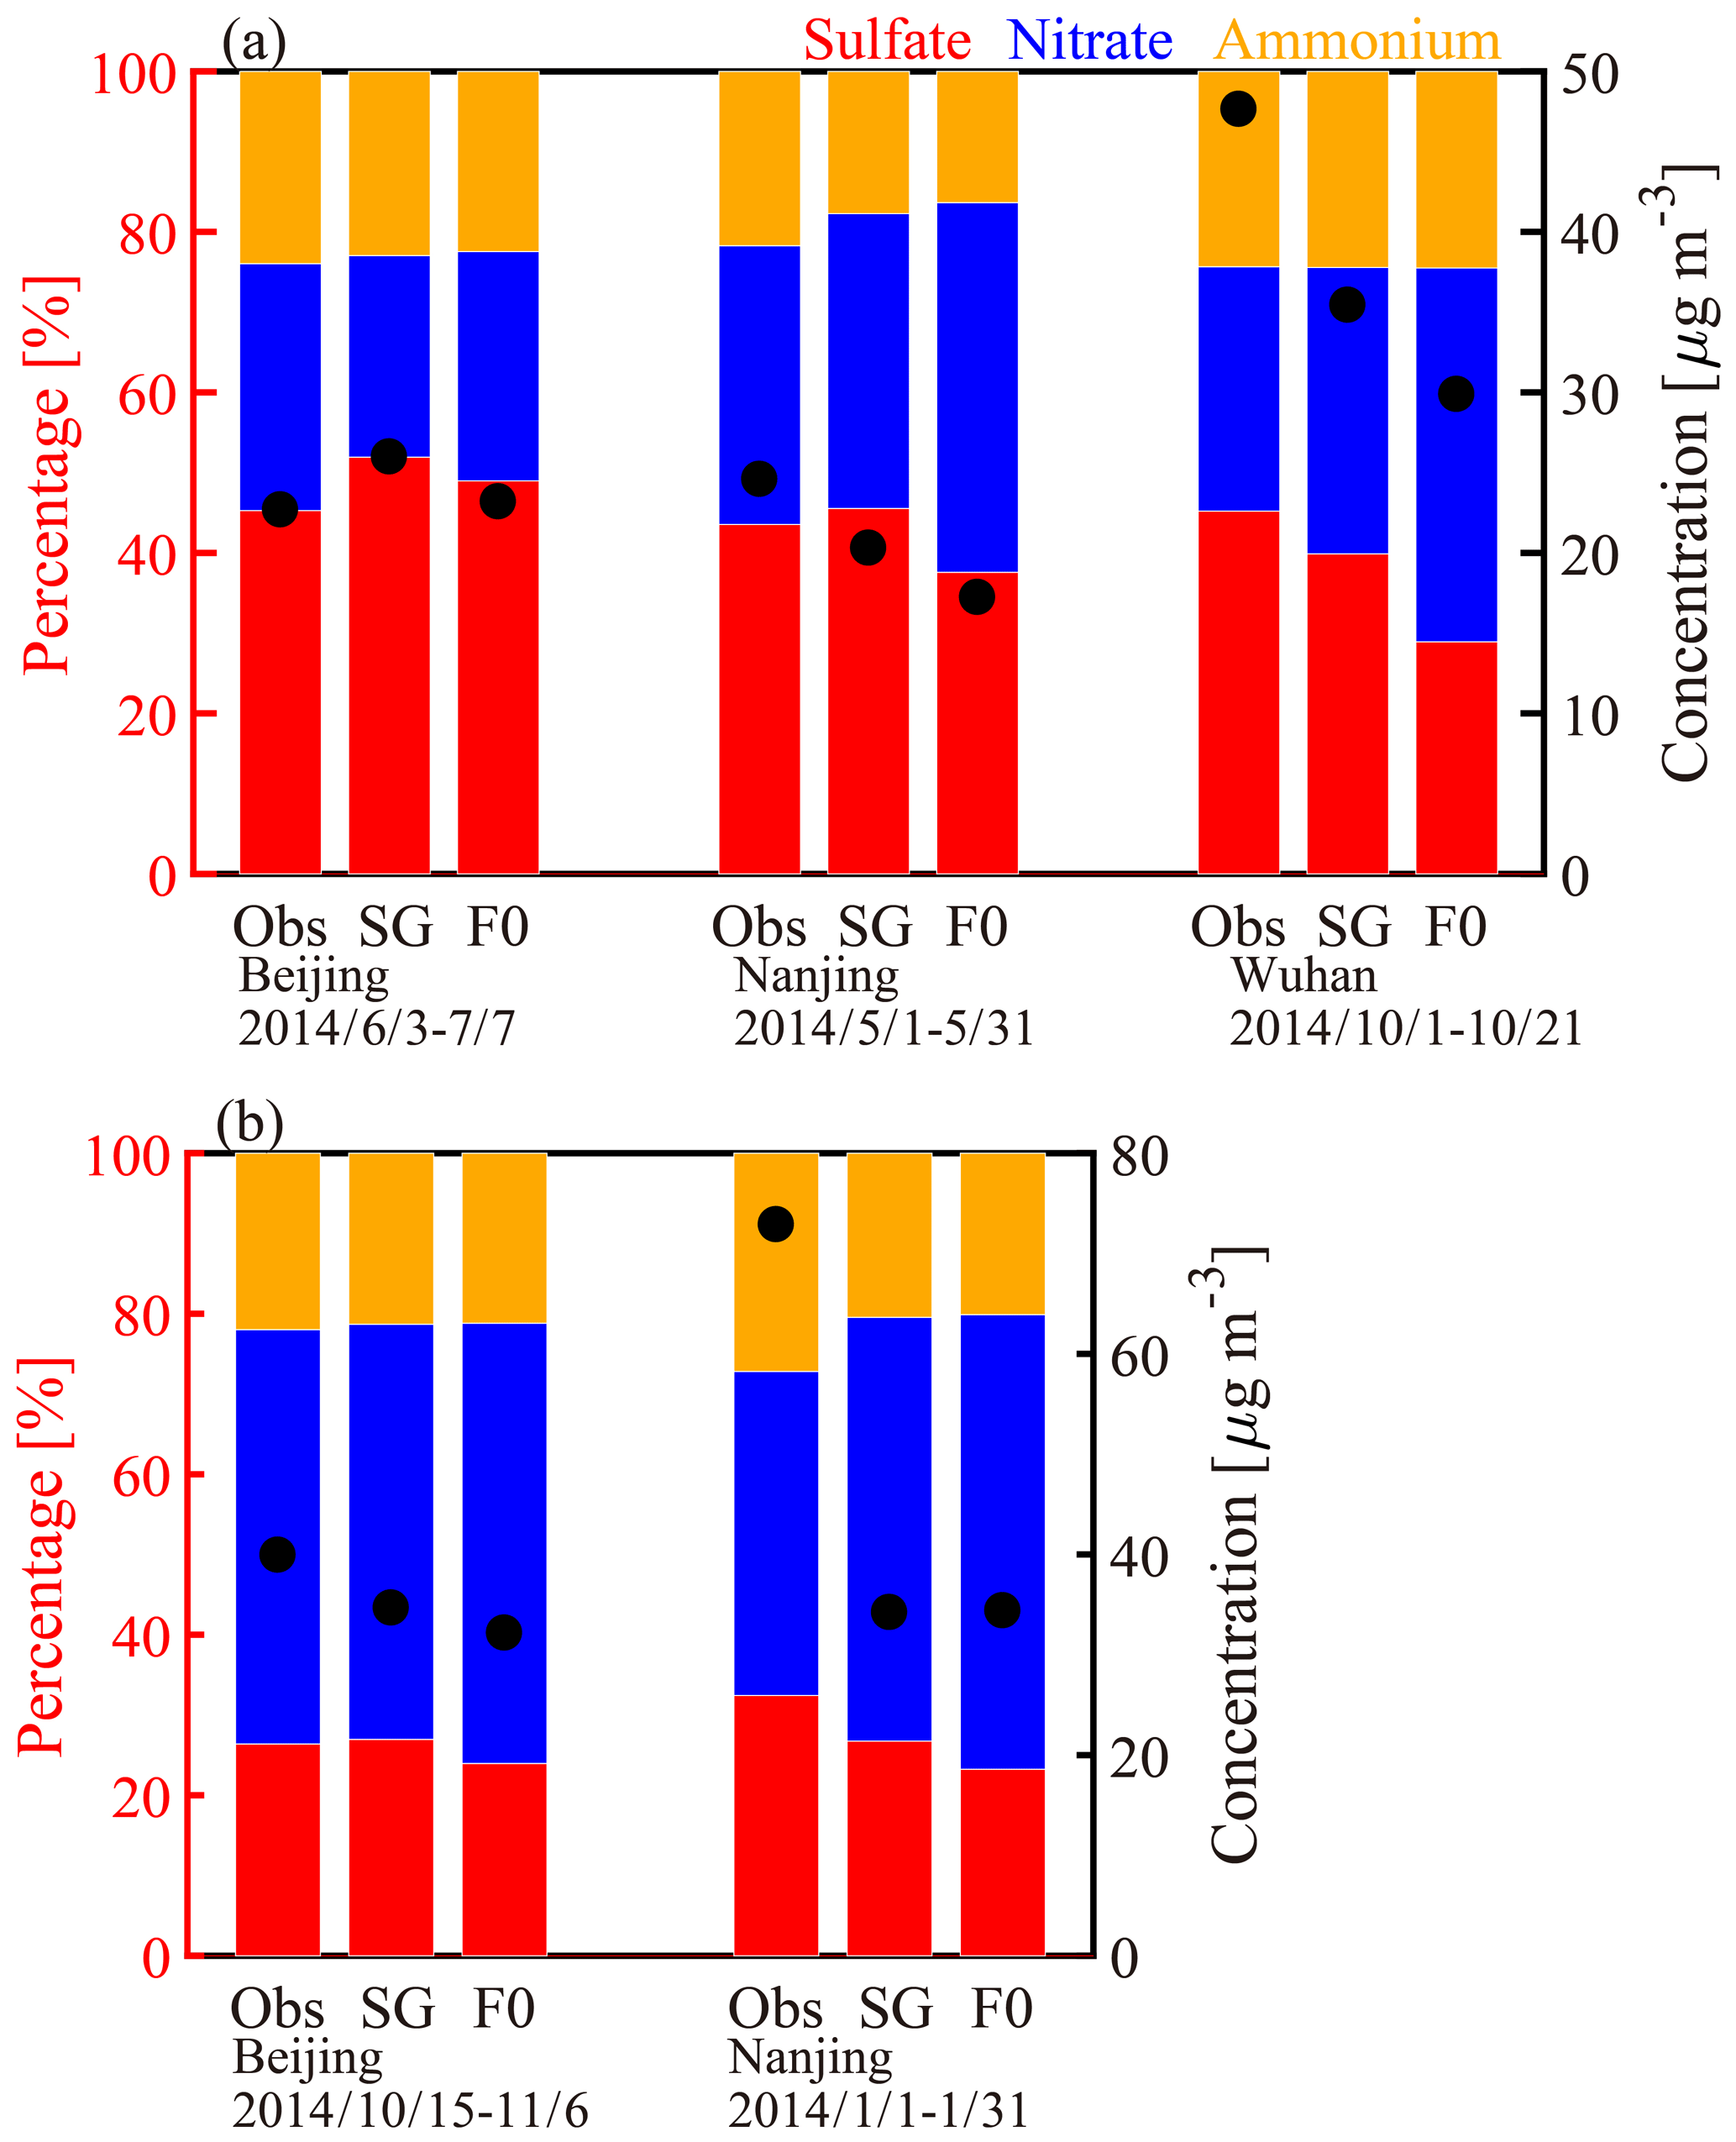
Figure 8Mean percentage of the simulated (SG and F0) and observed sulfate, nitrate and ammonium (i.e., red, blue and orange color bars) and averaged SNA concentration (black dots) in Beijing, Nanjing and Wuhan in (a) warm seasons and (b) cold seasons.
3.4 Improvement in PNSD simulation
Besides the mass concentration of component, particle number concentration is an essential parameter of aerosol particles in evaluating their climatic and environmental effects. Most aerosol models use constant fractions forfox and fnew to describe the SGPF, causing large uncertainties in simulating particle formation processes and particle number concentration. To investigate the influence of the SGPF scheme on particle number concentration, we performed two experiments using IAP-AACM+APM with a fixed scheme (fox=2.5 % and fnew=5 %) and the SGPF scheme. Modeling results were evaluated against observations at the site in Beijing during the APHH-Beijing, winter 2016. The model reproduced the mass concentration of SNA well (Fig. S3), with R ranging from 0.59 to 0.66 and NMB ranging from −0.68 to 0.01. The PNSDs of the two experiments and the observation are shown in Fig. 9. The model with constant SG-ASO4 formation overpredicted the number of particles in Aitken mode at night (Fig. 9a). In fact, nucleation is negligible at night due to very low OH concentration in the plume. Compared with observations, the sub-grid scheme significantly optimized the overestimation of particle number concentration in small size bins (Fig. 9b). Specifically, considering the diurnal variation in nucleation process reduced the positive bias by more than 3 times in nucleation mode and by about 0.5 in Aitken mode (see in Table 5). This indicates that IAP-AACM coupled with the SGPF scheme reasonably captured the process of new particle formation in clean periods (e.g., 27–28 November, 5–6 December) and growth in haze periods (e.g., 28–30 November). Here we also display the simulations of full spectrum of PNSD in F2.5 and SG in Fig. S4. Particles in the simulation with F2.5 (Fig. S4a) were produced continuously within the particle size range of 3–10 nm, due to constant nucleation of SG-ASO4. To avoid this unrealistic particle formation, the fraction of SG-ASO4 is always set as 0 % in aerosol models. However, it will result in a considerable underestimation of particle number concentration in nucleation mode and Aitken mode. Taking into account the influence of solar radiation on SGPF, the model with the SGPF scheme reproduces the diurnal cycle of particle number in small-sized bins and provides a more reasonable estimation of the particle number concentration originating from new particle formation.
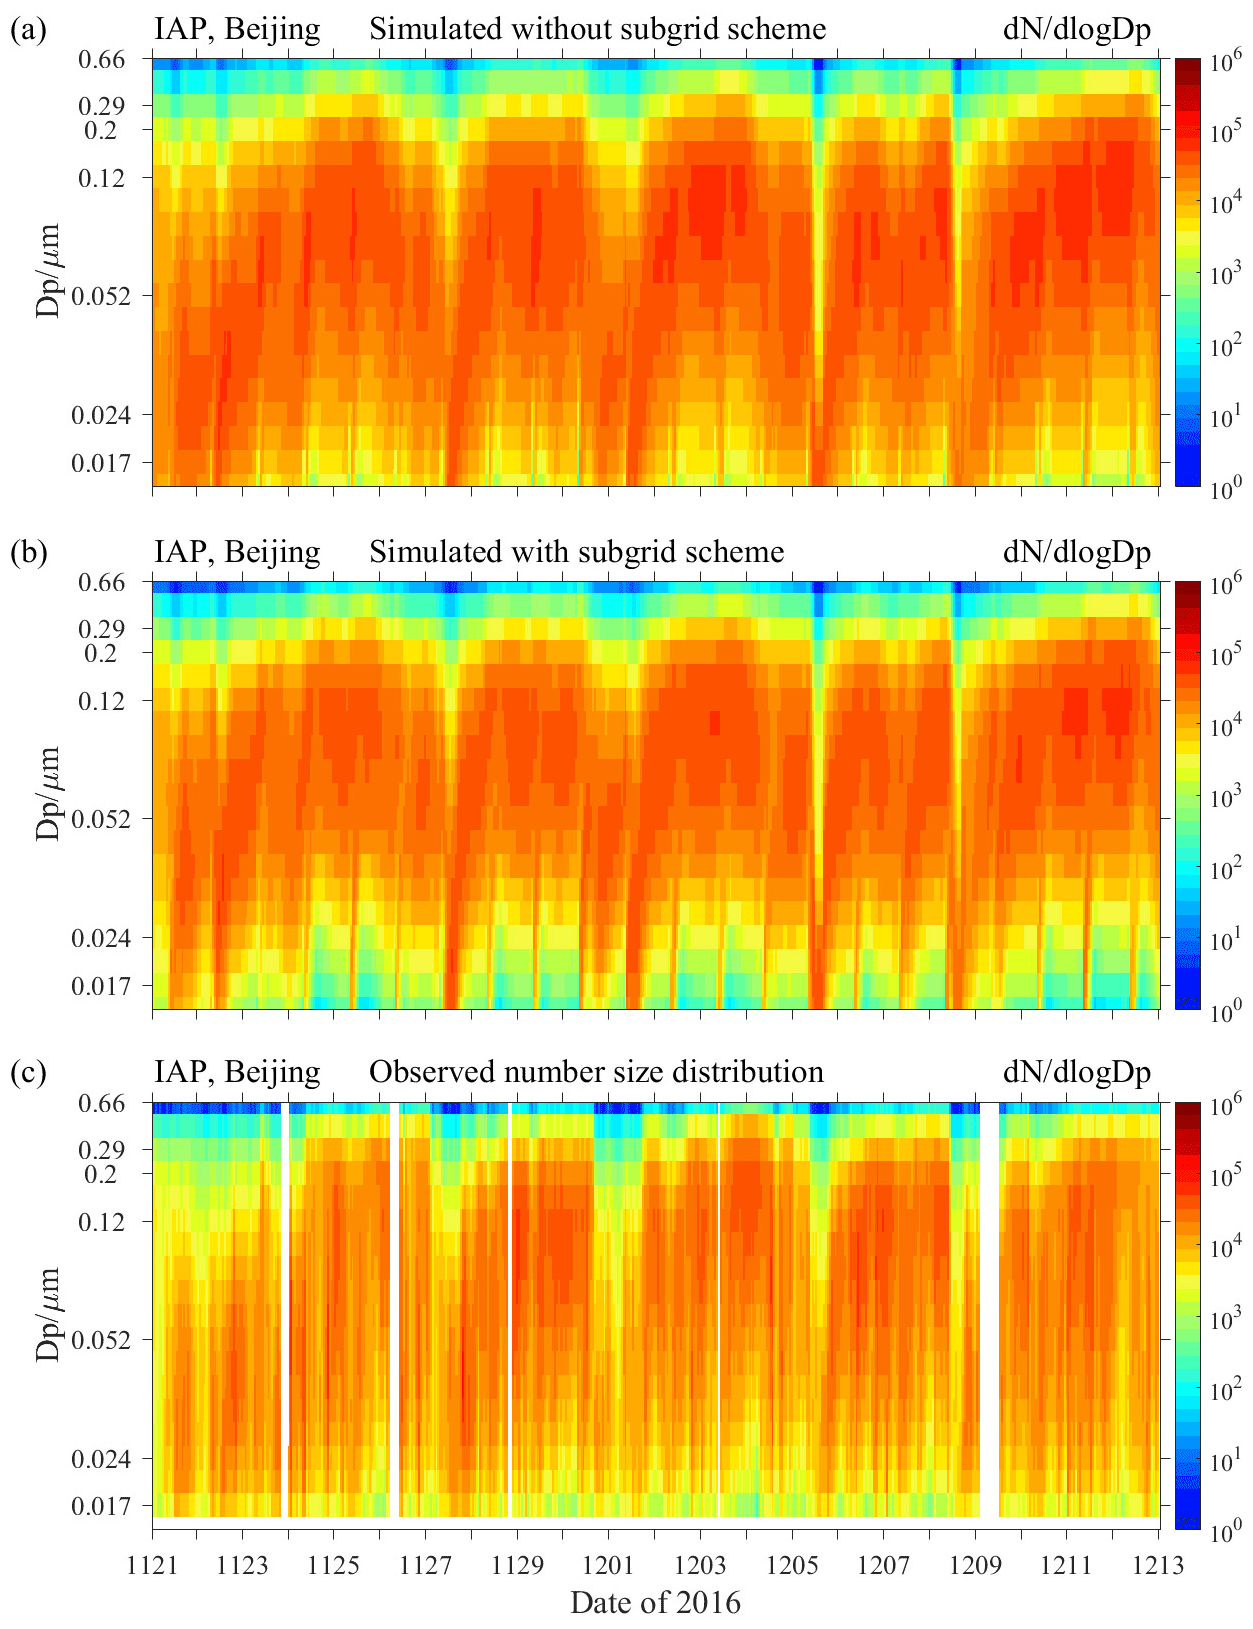
Figure 9Particle number size distribution of simulations from IAP-AACM with (a) F2.5 andfnew=5 %, (b) SG, and (c) observations during the APHH-Beijing in 2016.
3.5 Regional impacts of sub-grid particle formation
The distribution of sub-grid particles in source areas is strongly influenced by the wind-driven dilution and transport of plumes. To explore the spatial inhomogeneity in regions around point sources, the regional impact of SGPF during typical periods is illustrated in Fig. 10. In Nanjing and Wuhan, the area represented by the observation site is located downwind of the point source when the easterly wind prevails. For Nanjing, there is an increase in sulfate mass concentration of 25 %–50 % around the observation site. For Wuhan, the increase can be over 50 % in the downwind area. This should be ascribed to the high capacity of local power plants with a large SO2 emission of over 2 µg m−2 s−1 in suburban Wuhan, indicating the significant impact of the point source on both the spatial scale and material concentration of the aerosol distribution. On the other hand, the regional influence in Beijing was relatively small (Fig. 10a, d), due to the upwind location and much lower emission rate of plants. Comparison of the three scenarios indicates that, although sub-grid particles from elevated sources are discharged at high altitudes, they can still contribute significantly to ground layer pollution under unfavorable wind condition.
Table 5Mean number concentrations (“conc.”) of the observations and simulations and the NMB for different modes at the site in Beijing during the APHH-Beijing in 2016.
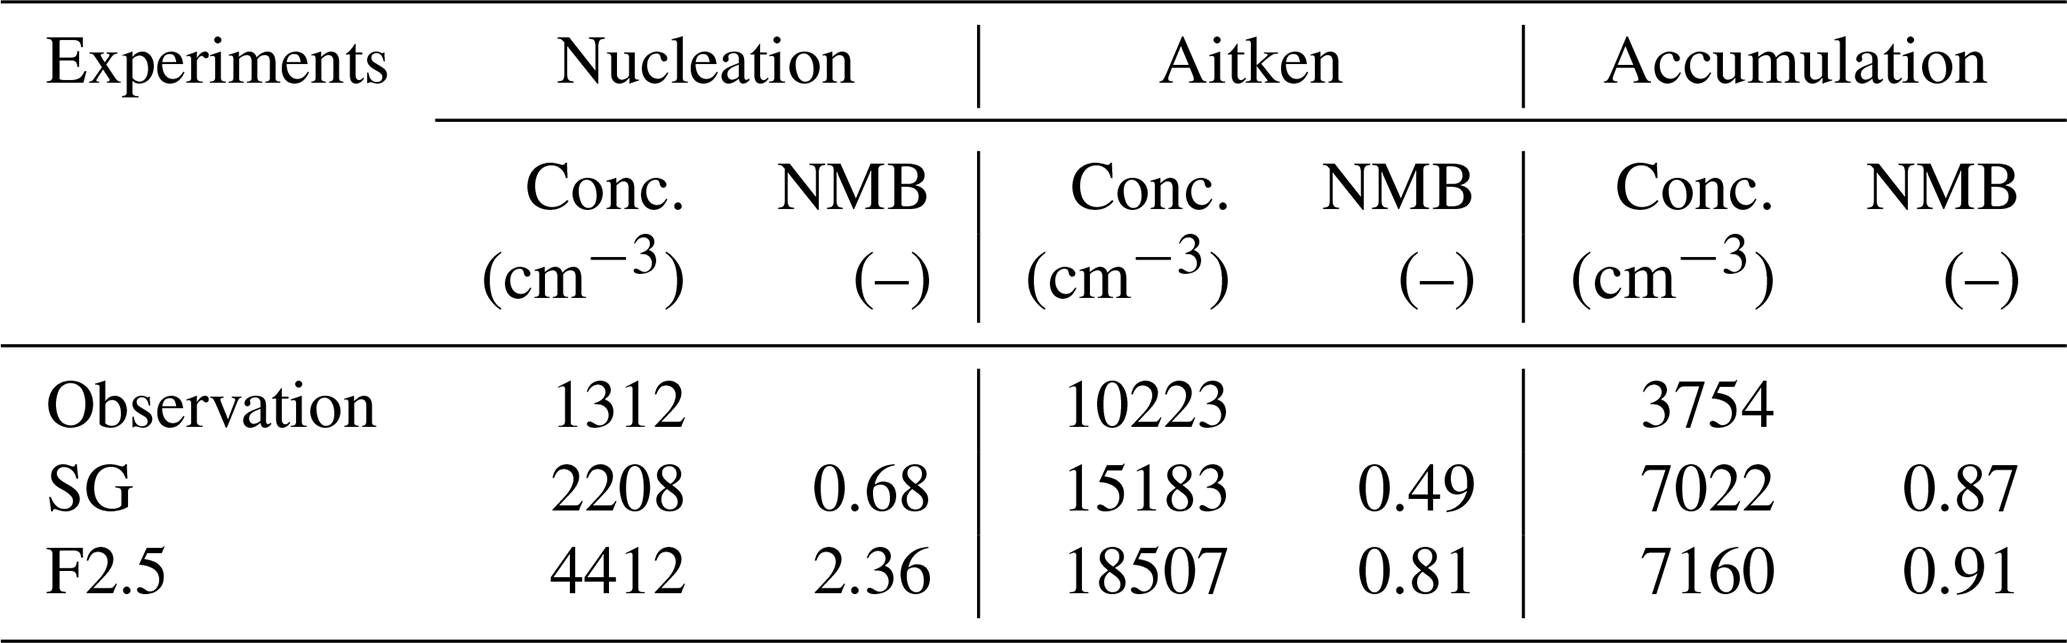
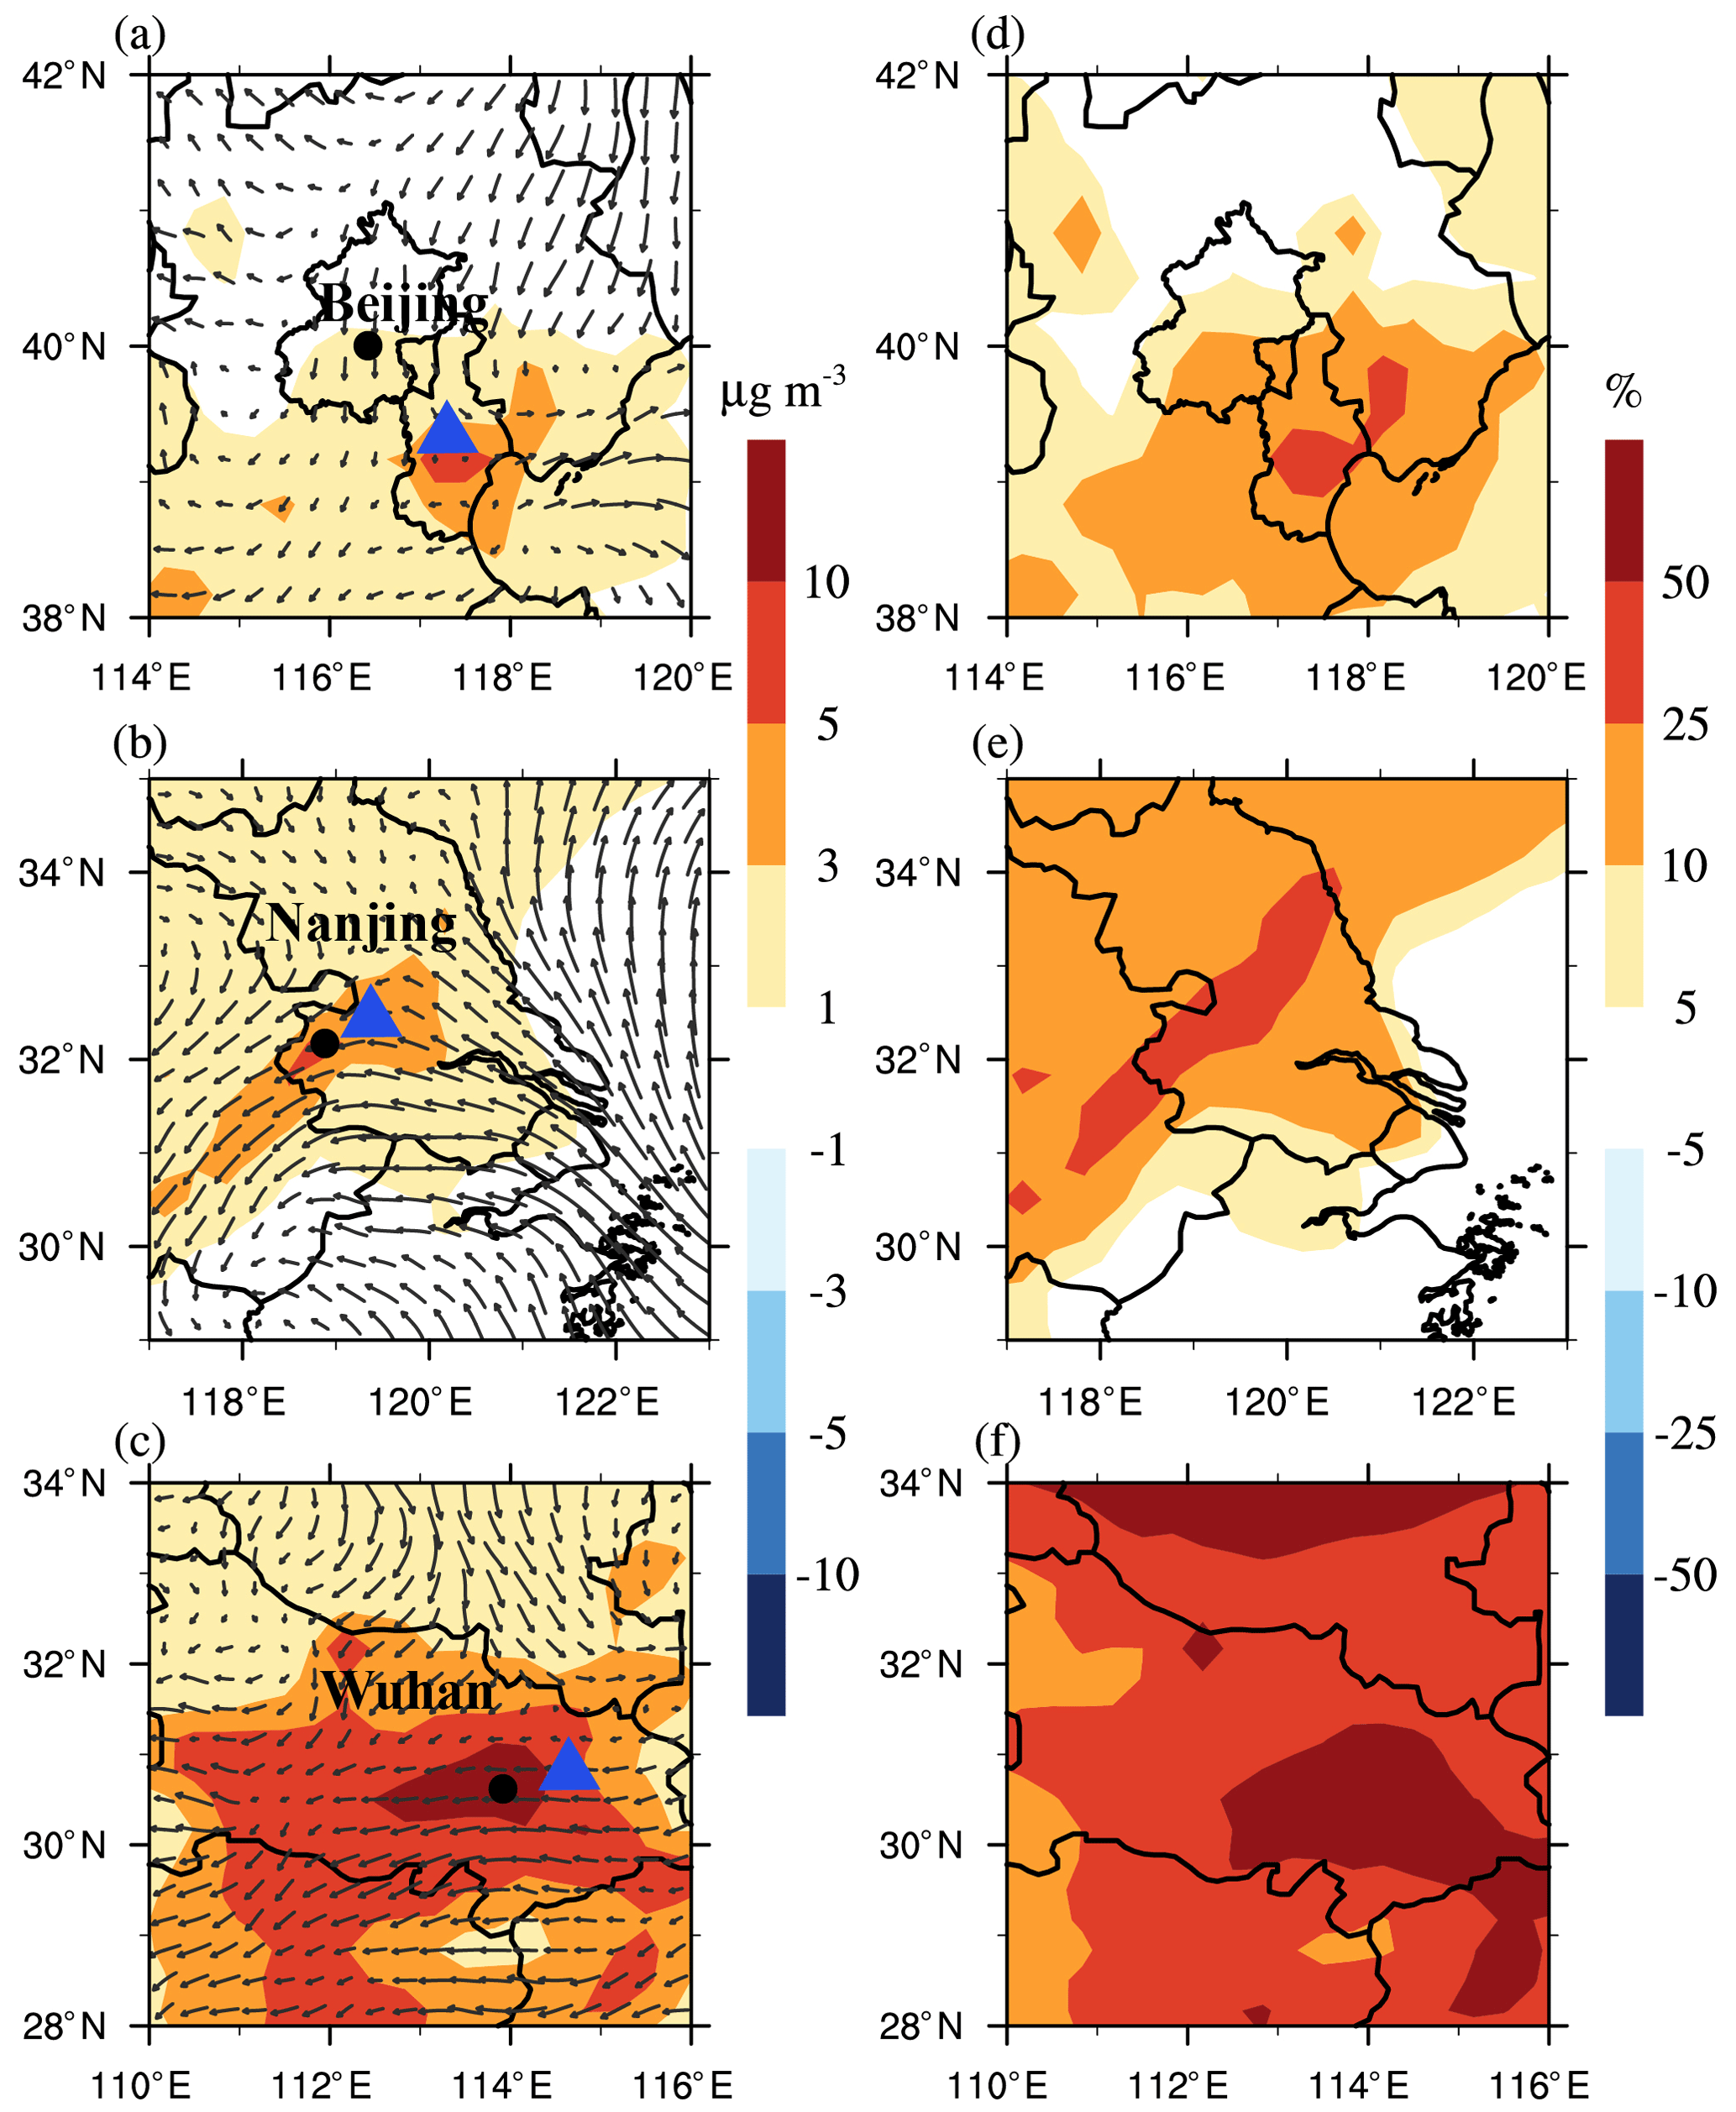
Figure 10Daily averaged differences with overlaid wind field (a–c, µg m−3) and relative change (d–f, %) of sulfate concentrations on a regional scale between SG and F0 at the surface, around (a, d) Beijing on 22 June, (b, e) Nanjing on 16 May and (c, f) Wuhan on 15 October. The difference was calculated as the simulation of SG minus F0. Black dots and blue triangles represent locations of the ground sites and plants, respectively.
The influence of the SGPF diurnal profile (Sect. 3.2) on regional scales was investigated at two particular times (i.e., 14:00 and 02:00 CST). To exclude the influence of boundary layer height on aerosol concentration, we used sulfate / BC ratios to normalize the comparison between day and night. As shown in Fig. 11, over industrial areas in eastern China there is a larger increase in sulfate concentration due to SGPF in daytime than at night. The increase in large areas of Shanxi Province indicates the important role of coal burning as the main energy source. Over central China, there are several maxima, which indicates the local influence of SGPF. Overall, the temporal variation in SGPF affects the sulfate concentration on a large scale in eastern China, especially in areas with high-emission sources, leading to heterogeneous spatial distribution.
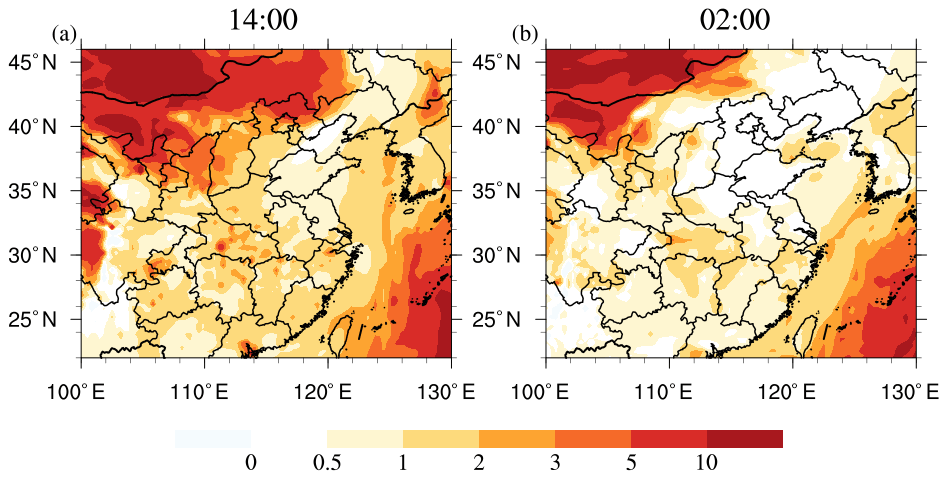
Figure 11Difference in sulfate / BC on 1 July (a) 14:00 and (b) 02:00 CST between SG and F0 at the surface. The difference is calculated as the simulation of SG minus F0.
In this study, the P6 sub-grid parameterization scheme was coupled to the global nested aerosol model IAP-AACM to resolve the SGPF characteristics in both oxidation and nucleation processes over eastern China. Furthermore, the key parameter of the scheme, effective OH concentration in the plume, was modified to fit the local chemical background based on extensive field observations in eastern China, according to its dependence on precursor gases. With the updated model integrated with the localized new scheme, the spatio-temporal inhomogeneity of SGPF was well parameterized in the grids. The significance of sub-grid particles in simulating the distribution of secondary inorganic aerosols was demonstrated in comparisons against site observations for both aerosol mass concentration and PNSD in different seasons.
The major findings were as follows. (1) The SGPF scheme provides a more reasonable description of oxidation and nucleation processes for SGPF, including the diurnal variation in fox and fnew. The spatio-temporal inhomogeneity of sub-grid particle distribution is well characterized. The spatial and temporal discrepancy is obvious, as for the same area, thefox in summer can be 3 times that of winter. (2) Simulations with the SGPF scheme better reproduce nanoparticle formation than the fixed oxidation fraction as the physicochemical parameterization nature and diurnal cycle of the nucleation in plumes are realistically represented. The overestimation of particle number in small sizes was reduced by over 3 times in nucleation mode and roughly 0.5 in Aitken mode. (3) The SGPF gave a more significant improvement in warm seasons as it reduced the NMB of sulfate and ammonium by 12 %–27 % at most sites while increasing that of nitrate by 1 %–9 %. In cold seasons, the influence of SGPF was limited, with the NMB for sulfate decreasing by only 5 %–16 %. The simulating improvement on correlation will result in a significant increase by 0.13 if the wind fields are well reproduced. (4) The SGPF scheme can improve model performance in determining the concentration of sulfate and its proportion in SNA, increasing the proportion of sulfate by ∼ 10 % in warm seasons and < 5 % in cold seasons. Specifically, in Wuhan, the averaged SNA concentration increased by ∼ 5 µg m−3 at night and 10 µg m−3 in the afternoon, implying the obvious impact of SGPF on sulfate simulating over areas with stacks. (5) The SGPF has a significant impact over areas near point sources, with the sulfate concentration increasing by 25 %–50 % or even > 50 % under downwind conditions. This indicates that the impact of SGPF should be taken into account in studies of air pollution and aerosol formation in extensive industrial cities, not only in China, but also in other developing countries facing PM2.5 and ozone pollution, like India (Chen et al., 2021).
As the IAP-AACM was driven by the global WRF off-line, the aerosol feedback was not taken into account in this work. On the other hand, the SGPF scheme did not incorporate the variation in OD associated with droplets in the plume. Without the aerosol–radiation interaction (ARI), the impact on increasing atmospheric stability by cooling the surface but heating the air aloft was excluded. Moreover, the scattering and absorption of ultraviolet radiation by aerosols influence the photolysis rates and reduce the formation of O3 and other oxidants (He and Carmichael, 1999). In highly polluted area, ignoring the aerosol–photolysis interaction (API) will cause a certain degree of overestimation of atmospheric oxidation capacity. Li et al. (2018) incorporated recently reported heterogeneous chemical mechanisms into the regional version of IAP-AACM and found that perturbations in photolysis frequencies reduced O3 concentrations by 1–5 ppb in winter and 1–3 ppb in summer. Considering both the ARI and API, Wu et al. (2020) conducted model experiments in the North China Plain and found that ARI contributed to a 7.8 % increase in near-surface PM2.5 while API suppressed secondary aerosol formation to a 3 % decrease in PM2.5. Therefore, the overestimation of atmospheric oxidation capacity caused by ignoring the OD impact should be under 5 % in eastern China. To better understand the impact and uncertainty of sub-grid particle, the impact of OD should be included in the model in our future work.
All of the observation data needed to evaluate the conclusion of this paper are provided in the main text. The source codes of IAP-AACM with SGPF scheme are available online via ZENODO (https://doi.org/10.5281/zenodo.4383361, Wei et al., 2020b). Please contact Ying Wei (weiying@mail.iap.ac.cn) to obtain the model data for IAP-AACM.
The supplement related to this article is available online at: https://doi.org/10.5194/gmd-14-4411-2021-supplement.
YW developed the model, did the simulation and wrote the paper. XC developed the model and designed the study. HC developed the model and prepared the gridded emission data. YS provided the observation data. WY, HD, QW, DC, XZ, JL and ZW revised the paper. YW and XC prepared the paper with contributions from all the co-authors.
The authors declare that they have no conflict of interest.
Publisher's note: Copernicus Publications remains neutral with regard to jurisdictional claims in published maps and institutional affiliations.
We sincerely thank Fangqun Yu at the State University of New York at Albany for providing the code of the original APM box model. We also thank the Jiangsu Environmental Monitoring Center and Hubei Environmental Monitoring Center for their support with the aerosol composition data of Nanjing and Wuhan, respectively. This research is supported by the National Key Scientific and Technological Infrastructure project “Earth System Science Numerical Simulator Facility”.
This research has been supported by the National Key R&D Program of China (grant no. 2020YFA0607801) and the National Natural Science Foundation of China (grant nos. 42007199 and 41907200).
This paper was edited by Jason Williams and reviewed by Ying Chen and one anonymous referee.
Adams, P. J. and Seinfeld, J. H.: Predicting global aerosol size distributions in general circulation models, J. Geophys. Res.-Atmos., 107, 1–23, https://doi.org/10.1029/2001JD001010, 2002.
Adams, P. J., Seinfeld, J. H., and Koch, D. M.: Global concentrations of tropospheric sulfate, nitrate, and ammonium aerosol simulated in a general circulation model, J. Geophys. Res.-Atmos., 104, 13791–13823, 1999.
Boucher, O., Randall, D., Artaxo, P., Bretherton, C., Feingold, G., Forster, P., Kerminen, V.-M., Kondo, Y., Liao, H., Lohmann, U., Rasch, P., Satheesh, S. K., Sherwood, S., Stevens, B., and Zhang, X. Y.: Clouds and Aerosols, in: Climate Change 2013: The Physical Science Basis. Contribution of Working Group I to the Fifth Assessment Report of the Intergovernmental Panel on Climate Change, edited by: Stocker, T. F., Qin, D., Plattner, G.-K., Tignor, M., Allen, S. K., Boschung, J., Nauels, A., Xia, Y., Bex, V., and Midgley, P. M., Cambridge University Press, Cambridge, United Kingdom and New York, NY, USA, 2013.
Brock, C. A., Washenfelder, R. A., Trainer, M., Ryerson, T. B., Wilson, J. C., Reeves, J. M., Huey, L. G., Holloway, J. S., Parrish, D. D., Hubler, G., and Fehsenfeld, F. C.: Particle growth in the plumes of coal-fired power plants, J. Geophys. Res.-Atmos., 107, 4155, https://doi.org/10.1029/2001JD001062, 2002.
Chen, H. S., Wang, Z. F., Li, J., Tang, X., Ge, B. Z., Wu, X. L., Wild, O., and Carmichael, G. R.: GNAQPMS-Hg v1.0, a global nested atmospheric mercury transport model: model description, evaluation and application to trans-boundary transport of Chinese anthropogenic emissions, Geosci. Model Dev., 8, 2857–2876, https://doi.org/10.5194/gmd-8-2857-2015, 2015.
Chen, X., Wang, Z., Li, J., and Yu, F.: Development of a Regional Chemical Transport Model with Size-Resolved Aerosol Microphysics and Its Application on Aerosol Number Concentration Simulation over China, Sola, 10, 83–87, 2014.
Chen, X., Wang, Z., Li, J., Yang, W., Chen, H., Wang, Z., Hao, J., Ge, B., Wang, D., and Huang, H.: Simulation on different response characteristics of aerosol particle number concentration and mass concentration to emission changes over mainland China, Sci. Total Environ., 643, 692–703, 2018.
Chen, X., Yu, F., Yang, W., Sun, Y., Chen, H., Du, W., Zhao, J., Wei, Y., Wei, L., Du, H., Wang, Z., Wu, Q., Li, J., An, J., and Wang, Z.: Global–regional nested simulation of particle number concentration by combing microphysical processes with an evolving organic aerosol module, Atmos. Chem. Phys., 21, 9343–9366, https://doi.org/10.5194/acp-21-9343-2021, 2021.
Chen, Y., Wild, O., Ryan, E., Sahu, S. K., Lowe, D., Archer-Nicholls, S., Wang, Y., McFiggans, G., Ansari, T., Singh, V., Sokhi, R. S., Archibald, A., and Beig, G.: Mitigation of PM2.5 and ozone pollution in Delhi: a sensitivity study during the pre-monsoon period, Atmos. Chem. Phys., 20, 499–514, https://doi.org/10.5194/acp-20-499-2020, 2020.
Dentener, F., Kinne, S., Bond, T., Boucher, O., Cofala, J., Generoso, S., Ginoux, P., Gong, S., Hoelzemann, J. J., Ito, A., Marelli, L., Penner, J. E., Putaud, J.-P., Textor, C., Schulz, M., van der Werf, G. R., and Wilson, J.: Emissions of primary aerosol and precursor gases in the years 2000 and 1750 prescribed data-sets for AeroCom, Atmos. Chem. Phys., 6, 4321–4344, https://doi.org/10.5194/acp-6-4321-2006, 2006.
Dusek, U., Frank, G. P., Hildebrandt, L., Curtius, J., Schneider, J., Walter, S., Chand, D., Drewnick, F., Hings, S., Jung, D., Borrmann, S., and Andreae, M. O.: Size matters more than chemistry for cloud-nucleating ability of aerosol particles, Science, 312, 1375–1378, 2006.
Emmons, L. K., Walters, S., Hess, P. G., Lamarque, J.-F., Pfister, G. G., Fillmore, D., Granier, C., Guenther, A., Kinnison, D., Laepple, T., Orlando, J., Tie, X., Tyndall, G., Wiedinmyer, C., Baughcum, S. L., and Kloster, S.: Description and evaluation of the Model for Ozone and Related chemical Tracers, version 4 (MOZART-4), Geosci. Model Dev., 3, 43–67, https://doi.org/10.5194/gmd-3-43-2010, 2010.
Ge, B. Z., Wang, Z. F., Xu, X. B., Wu, J. B., Yu, X. L., and Li, J.: Wet deposition of acidifying substances in different regions of China and the rest of East Asia: Modeling with updated NAQPMS, Environ. Pollut., 187, 10–21, 2014.
Gillani, N. V. and Godowitch, J. M.: Plume-in-Grid Treatment of Major Point Source Emissions, chap. 9.76, in: Science Algorithms of the EPA Models-3 Community Multiscale Air Quality (CMAQ) Modeling System, U.S. Environmental Protection Agency, Washington, D.C., USA, 1999.
Gillani, N. V., Meagher, J. F., Valente, R. J., Imhoff, R. E., Tanner, R. L., and Luria, M.: Relative production of ozone and nitrates in urban and rural power plant plumes 1. Composite results based on data from 10 field measurement days, J. Geophys. Res.-Atmos., 103, 22593–22615, 1998.
He, Q.-F., Ding, X., Fu, X.-X., Zhang, Y.-Q., Wang, J.-Q., Liu, Y.-X., Tang, M.-J., Wang, X.-M., and Rudich, Y.: Secondary Organic Aerosol Formation From Isoprene Epoxides in the Pearl River Delta, South China: IEPOX- and HMML-Derived Tracers, J. Geophys. Res.-Atmos., 123, 6999–7012, 2018.
He, S. and Carmichael, G. R.: Sensitivity of photolysis rates and ozone production in the troposphere to aerosol properties. J. Geophys. Res., 104, 23324, https://doi.org/10.1029/2004JD005359, 1999.
IPCC: Climate Change 2013: The Physical Science Basis. Contribution of Working Group I to the Fifth Assessment Report of the Intergovernmental Panel on Climate Change, edited by: Stocker, T. F., Qin, D., Plattner, G.-K., Tignor, M., Allen, S. K., Boschung, J., Nauels, A., Xia, Y., Bex, V., and Midgley, P. M., Cambridge University Press, Cambridge, United Kingdom and New York, NY, USA, 1535 pp., https://doi.org/10.1017/CBO9781107415324, 2013.
Karamchandani, P., Seigneur, C., Vijayaraghavan, K., and Wu, S. Y.: Development and application of a state-of-the-science plume-in-grid model, J. Geophys. Res.-Atmos., 107, ACH 12-1–ACH 12-13, https://doi.org/10.1029/2002JD002123, 2002.
Karamchandani, P., Vijayaraghavan, K., Zhang, Y., and Chen, S-Y.: Development of a Plume-in-Grid Version of Global-through-Urban WRF/Chem, in: Proceedings of the 9th Annual CMAS Conference, 11–13 October 2010, Chapel Hill, NC, USA, 2010.
Khairoutdinov, M. F. and Randall, D. A.: Cloud resolving modeling of the ARM summer 1997 IOP: Model formulation, results, uncertainties, and sensitivities, J. Atmos. Sci., 60, 607–625, 2003.
Kulmala, M. and Kerminen, V.-M.: On the formation and growth of atmospheric nanoparticles, Atmos. Res., 90, 132–150, 2008.
Li, C., McLinden, C., Fioletov, V., Krotkov, N., Carn, S., Joiner, J., Streets, D., He, H., Ren, X., Li, Z., and Dickerson, R. R.: India Is Overtaking China as the World's Largest Emitter of Anthropogenic Sulfur Dioxide, Sci. Rep., 7, 14304, https://doi.org/10.1038/s41598-017-14639-8, 2017.
Li, J., Wang, Z., Akimoto, H., Gao, C., Pochanart, P., and Wang, X.: Modeling study of ozone seasonal cycle in lower troposphere over east Asia, J. Geophys. Res.-Atmos., 112, D22S25, https://doi.org/10.1029/2006JD008209, 2007.
Li, J., Wang, Z., Zhuang, G., Luo, G., Sun, Y., and Wang, Q.: Mixing of Asian mineral dust with anthropogenic pollutants over East Asia: a model case study of a super-duststorm in March 2010, Atmos. Chem. Phys., 12, 7591–7607, https://doi.org/10.5194/acp-12-7591-2012, 2012.
Li, J., Yang, W., Wang, Z., Chen, H., Hu, B., Li, J., Sun, Y., Fu, P., and Zhang, Y.: Modeling study of surface ozone source-receptor relationships in East Asia, Atmos. Res., 167, 77–88, 2016.
Li, J., Chen, X., Wang, Z., Du, H., Yang, W., Sun, Y., Hu, B., Li, J., Wang, W., Wang, T., Fu, P., and Huang, H.: Radiative and heterogeneous chemical effects of aerosols on ozone and inorganic aerosols over East Asia, Sci. Total Environ., 622, 1327–1342, 2018.
Liu, J., Liu, Z., Ma, Z., Yang, S., Yao, D., Zhao, S., Hu, B., Tang, G., Sun, J., Cheng, M., Xu, Z., and Wang, Y.: Detailed budget analysis of HONO in Beijing, China: Implication on atmosphere oxidation capacity in polluted megacity, Atmos. Environ., 244, 117957, https://doi.org/10.1016/j.atmosenv.2020.117957, 2021.
Lonsdale, C. R., Stevens, R. G., Brock, C. A., Makar, P. A., Knipping, E. M., and Pierce, J. R.: The effect of coal-fired power-plant SO2 and NOx control technologies on aerosol nucleation in the source plumes, Atmos. Chem. Phys., 12, 11519–11531, https://doi.org/10.5194/acp-12-11519-2012, 2012.
Lu, K. D., Rohrer, F., Holland, F., Fuchs, H., Bohn, B., Brauers, T., Chang, C. C., Häseler, R., Hu, M., Kita, K., Kondo, Y., Li, X., Lou, S. R., Nehr, S., Shao, M., Zeng, L. M., Wahner, A., Zhang, Y. H., and Hofzumahaus, A.: Observation and modelling of OH and HO2 concentrations in the Pearl River Delta 2006: a missing OH source in a VOC rich atmosphere, Atmos. Chem. Phys., 12, 1541–1569, https://doi.org/10.5194/acp-12-1541-2012, 2012.
Lu, K. D., Hofzumahaus, A., Holland, F., Bohn, B., Brauers, T., Fuchs, H., Hu, M., Häseler, R., Kita, K., Kondo, Y., Li, X., Lou, S. R., Oebel, A., Shao, M., Zeng, L. M., Wahner, A., Zhu, T., Zhang, Y. H., and Rohrer, F.: Missing OH source in a suburban environment near Beijing: observed and modelled OH and HO2 concentrations in summer 2006, Atmos. Chem. Phys., 13, 1057–1080, https://doi.org/10.5194/acp-13-1057-2013, 2013.
Luo, G. and Wang, Z. F.: A Global Environmental Atmospheric Transport Model (GEATM): Model Description and Validation, Chinese Journal of Atmospheric Sciences, 30, 504–518, 2006.
Luo, G. and Yu, F.: Sensitivity of global cloud condensation nuclei concentrations to primary sulfate emission parameterizations, Atmos. Chem. Phys., 11, 1949–1959, https://doi.org/10.5194/acp-11-1949-2011, 2011.
Ma, Q., Cai, S., Wang, S., Zhao, B., Martin, R. V., Brauer, M., Cohen, A., Jiang, J., Zhou, W., Hao, J., Frostad, J., Forouzanfar, M. H., and Burnett, R. T.: Impacts of coal burning on ambient PM2.5 pollution in China, Atmos. Chem. Phys., 17, 4477–4491, https://doi.org/10.5194/acp-17-4477-2017, 2017.
Nenes, A., Pandis, S. N., and Pilinis, C.: ISORROPIA: A new thermodynamic equilibrium model for multiphase multicomponent inorganic aerosols, Aquat. Geochem., 4, 123–152, 1998.
Nenes, A., Pandis, S. N., and Pilinis, C.: Continued development and testing of a new thermodynamic aerosol module for urban and regional air quality models, Atmos. Environ., 33, 1553–1560, 1999.
Powell, H., Krall, J. R., Wang, Y., Bell, M. L., and Peng, R. D.: Ambient Coarse Particulate Matter and Hospital Admissions in the Medicare Cohort Air Pollution Study, 1999–2010, Environ. Health Persp., 123, 1152–1158, 2015.
Richards, L. W., Anderson, J. A., Blumenthal, D. L., Brandt, A. A., McDonald, J. A., Waters, N., Macias, E. S., and Bhardwaja, P. S.: The Chemistry, Aerosol Physics, And Optical-Properties Of A Western Coal-Fired Power-Plant Plume, Atmos. Environ., 15, 2111–2134, 1981.
Seinfeld, J. H. and Pandis, S. N.: Atmospheric Chemistry and Physics: from Air Pollution to Climate Change, 2nd edn., John Wiley & Sons, Hoboken, New Jersey, USA, 2012.
Slater, E. J., Whalley, L. K., Woodward-Massey, R., Ye, C., Lee, J. D., Squires, F., Hopkins, J. R., Dunmore, R. E., Shaw, M., Hamilton, J. F., Lewis, A. C., Crilley, L. R., Kramer, L., Bloss, W., Vu, T., Sun, Y., Xu, W., Yue, S., Ren, L., Acton, W. J. F., Hewitt, C. N., Wang, X., Fu, P., and Heard, D. E.: Elevated levels of OH observed in haze events during wintertime in central Beijing, Atmos. Chem. Phys., 20, 14847–14871, https://doi.org/10.5194/acp-20-14847-2020, 2020.
Spracklen, D. V., Pringle, K. J., Carslaw, K. S., Chipperfield, M. P., and Mann, G. W.: A global off-line model of size-resolved aerosol microphysics: I. Model development and prediction of aerosol properties, Atmos. Chem. Phys., 5, 2227–2252, https://doi.org/10.5194/acp-5-2227-2005, 2005.
Spracklen, D. V., Carslaw, K. S., Kulmala, M., Kerminen, V.-M., Sihto, S.-L., Riipinen, I., Merikanto, J., Mann, G. W., Chipperfield, M. P., Wiedensohler, A., Birmili, W., and Lihavainen, H.: Contribution of particle formation to global cloud condensation nuclei concentrations, Geophys. Res. Lett., 35, L06808, https://doi.org/10.1029/2007GL033038, 2008.
Stevens, R. G. and Pierce, J. R.: A parameterization of sub-grid particle formation in sulfur-rich plumes for global- and regional-scale models, Atmos. Chem. Phys., 13, 12117–12133, https://doi.org/10.5194/acp-13-12117-2013, 2013.
Stevens, R. G., Pierce, J. R., Brock, C. A., Reed, M. K., Crawford, J. H., Holloway, J. S., Ryerson, T. B., Huey, L. G., and Nowak, J. B.: Nucleation and growth of sulfate aerosol in coal-fired power plant plumes: sensitivity to background aerosol and meteorology, Atmos. Chem. Phys., 12, 189–206, https://doi.org/10.5194/acp-12-189-2012, 2012.
Stockwell, W. R., Kirchner, F., Kuhn, M., and Seefeld, S.: A new mechanism for regional atmospheric chemistry modeling, J. Geophys. Res.-Atmos., 102, 25847–25879, 1997.
Strader, R., Lurmann, F., and Pandis, S. N.: Evaluation of secondary organic aerosol formation in winter, Atmos. Environ., 33, 4849–4863, 1999.
Sun, K. and Chen, X.: Spatio-temporal distribution of localized aerosol loading in China: A satellite view, Atmos. Environ., 163, 35–43, 2017.
Tan, Z., Fuchs, H., Lu, K., Hofzumahaus, A., Bohn, B., Broch, S., Dong, H., Gomm, S., Häseler, R., He, L., Holland, F., Li, X., Liu, Y., Lu, S., Rohrer, F., Shao, M., Wang, B., Wang, M., Wu, Y., Zeng, L., Zhang, Y., Wahner, A., and Zhang, Y.: Radical chemistry at a rural site (Wangdu) in the North China Plain: observation and model calculations of OH, HO2 and RO2 radicals, Atmos. Chem. Phys., 17, 663–690, https://doi.org/10.5194/acp-17-663-2017, 2017.
Tan, Z., Lu, K., Dong, H., Hu, M., Li, X., Liu, Y., Lu, S., Shao, M., Su, R., Wang, H., Wu, Y., Wahner, A., and Zhang, Y.: Explicit diagnosis of the local ozone production rate and the ozone-NOx-VOC sensitivities, Sci. Bull., 63, 1067–1076, 2018.
Tan, Z., Lu, K., Jiang, M., Su, R., Wang, H., Lou, S., Fu, Q., Zhai, C., Tan, Q., Yue, D., Chen, D., Wang, Z., Xie, S., Zeng, L., and Zhang, Y.: Daytime atmospheric oxidation capacity in four Chinese megacities during the photochemically polluted season: a case study based on box model simulation, Atmos. Chem. Phys., 19, 3493–3513, https://doi.org/10.5194/acp-19-3493-2019, 2019.
Textor, C., Schulz, M., Guibert, S., Kinne, S., Balkanski, Y., Bauer, S., Berntsen, T., Berglen, T., Boucher, O., Chin, M., Dentener, F., Diehl, T., Easter, R., Feichter, H., Fillmore, D., Ghan, S., Ginoux, P., Gong, S., Grini, A., Hendricks, J., Horowitz, L., Huang, P., Isaksen, I., Iversen, I., Kloster, S., Koch, D., Kirkevåg, A., Kristjansson, J. E., Krol, M., Lauer, A., Lamarque, J. F., Liu, X., Montanaro, V., Myhre, G., Penner, J., Pitari, G., Reddy, S., Seland, Ø., Stier, P., Takemura, T., and Tie, X.: Analysis and quantification of the diversities of aerosol life cycles within AeroCom, Atmos. Chem. Phys., 6, 1777–1813, https://doi.org/10.5194/acp-6-1777-2006, 2006.
Wang, H., Lu, K., Chen, X., Zhu, Q., Chen, Q., Guo, S., Jiang, M., Li, X., Shang, D., Tan, Z., Wu, Y., Wu, Z., Zou, Q., Zheng, Y., Zeng, L., Zhu, T., Hu, M., and Zhang, Y.: High N2O5 Concentrations Observed in Urban Beijing: Implications of a Large Nitrate Formation Pathway, Environ. Sci. Tech. Lett., 4, 416–420, 2017.
Wang, S. X., Zhao, B., Cai, S. Y., Klimont, Z., Nielsen, C. P., Morikawa, T., Woo, J. H., Kim, Y., Fu, X., Xu, J. Y., Hao, J. M., and He, K. B.: Emission trends and mitigation options for air pollutants in East Asia, Atmos. Chem. Phys., 14, 6571–6603, https://doi.org/10.5194/acp-14-6571-2014, 2014.
Wang, Z. F., Ueda, H., and Huang, M. Y.: A deflation module for use in modeling long-range transport of yellow sand over East Asia, J. Geophys. Res.-Atmos., 105, 26947–26959, 2000.
Wang, Z., Li, J., Wang, X., Pochanart, P., and Akimoto, H.: Modeling of regional high ozone episode observed at two mountain sites (Mt. Tai and Huang) in East China, J. Atmos. Chem., 55, 253–272, 2006a.
Wang, Z. F., Xie, F. Y., Wang X. Q., An J. L., and Zhu, J.: Development and Application of Nested Air Quality Prediction Modeling System, Chinese Journal of Atmospheric Sciences, 30, 778–790, 2006b (in Chinese).
Wei, Y., Li, J., Wang, Z. F., Chen, H. S., Wu, Q. Z., Li, J. J., Wang, Y. L., and Wang, W.: Trends of surface PM2.5 over Beijing-Tianjin-Hebei in 2013–2015 and their causes: emission controls vs. meteorological conditions, Atmospheric and Oceanic Science Letters, 10, 276–283, https://doi.org/10.1080/16742834.2017.1315631, 2017.
Wei, Y., Chen, X., Chen, H., Li, J., Wang, Z., Yang, W., Ge, B., Du, H., Hao, J., Wang, W., Li, J., Sun, Y., and Huang, H.: IAP-AACM v1.0: a global to regional evaluation of the atmospheric chemistry model in CAS-ESM, Atmos. Chem. Phys., 19, 8269–8296, https://doi.org/10.5194/acp-19-8269-2019, 2019.
Wei, Y., Chen, X., Chen, H., Yang, W., Wu Q., Li, J., and Wang, Z.: IAP-AACM+sub-grid particle formation (SGPF) scheme v1.0, Zenodo [code], https://doi.org/10.5281/zenodo.4383361, 2020b.
Williams, J. E., Strunk, A., Huijnen, V., and van Weele, M.: The application of the Modified Band Approach for the calculation of on-line photodissociation rate constants in TM5: implications for oxidative capacity, Geosci. Model Dev., 5, 15–35, https://doi.org/10.5194/gmd-5-15-2012, 2012.
Wu, J., Bei, N., Hu, B., Liu, S., Wang, Y., Shen, Z., Li, X., Liu, L., Wang, R., Liu, Z., Cao, J., Tie, X., Molina, L. T., and Li, G.: Aerosol-photolysis interaction reduces particulate matter during wintertime haze events, P. Natl. Acad. Sci. USA, 117, 9755–9761, 2020.
Wu, Q. Z., Wang, Z. F., Gbaguidi, A., Gao, C., Li, L. N., and Wang, W.: A numerical study of contributions to air pollution in Beijing during CAREBeijing-2006, Atmos. Chem. Phys., 11, 5997–6011, https://doi.org/10.5194/acp-11-5997-2011, 2011.
Xu, W. Y., Zhao, C. S., Ran, L., Lin, W. L., Yan, P., and Xu, X. B.: SO2 noontime-peak phenomenon in the North China Plain, Atmos. Chem. Phys., 14, 7757–7768, https://doi.org/10.5194/acp-14-7757-2014, 2014.
Yang, Y., Smith, S. J., Wang, H., Mills, C. M., and Rasch, P. J.: Variability, timescales, and nonlinearity in climate responses to black carbon emissions, Atmos. Chem. Phys., 19, 2405–2420, https://doi.org/10.5194/acp-19-2405-2019, 2019.
Yang, Y., Ren, L., Li, H., Wang, H., Wang, P., Chen, L., Yue, X., and Liao, H.: Fast Climate Responses to Aerosol Emission Reductions During the COVID-19 Pandemic, Geophys. Res. Lett., 47, e2020GL089788, https://doi.org/10.1029/2020GL089788, 2020a.
Yang, Y., Wang, Y., Zhou, P., Yao, D., Ji, D., Sun, J., Wang, Y., Zhao, S., Huang, W., Yang, S., Chen, D., Gao, W., Liu, Z., Hu, B., Zhang, R., Zeng, L., Ge, M., Petäjä, T., Kerminen, V.-M., Kulmala, M., and Wang, Y.: Atmospheric reactivity and oxidation capacity during summer at a suburban site between Beijing and Tianjin, Atmos. Chem. Phys., 20, 8181–8200, https://doi.org/10.5194/acp-20-8181-2020, 2020b.
Yu, F.: Diurnal and Seasonal Variations of Ultrafine Particle Formation in Anthropogenic SO2 Plumes, Environ. Sci. Technol., 44, 2011–2015, 2010.
Yu, F. and Luo, G.: Simulation of particle size distribution with a global aerosol model: contribution of nucleation to aerosol and CCN number concentrations, Atmos. Chem. Phys., 9, 7691–7710, https://doi.org/10.5194/acp-9-7691-2009, 2009.
Zanatta, M., Laj, P., Gysel, M., Baltensperger, U., Vratolis, S., Eleftheriadis, K., Kondo, Y., Dubuisson, P., Winiarek, V., Kazadzis, S., Tunved, P., and Jacobi, H.-W.: Effects of mixing state on optical and radiative properties of black carbon in the European Arctic, Atmos. Chem. Phys., 18, 14037–14057, https://doi.org/10.5194/acp-18-14037-2018, 2018.
Zaveri, R. A. and Peters, L. K.: A new lumped structure photochemical mechanism for large-scale applications, J. Geophys. Res.-Atmos., 104, 30387–30415, 1999.
Zhang, H., Li, J., Ying, Q., Yu, J. Z., Wu, D., Cheng, Y., He, K., and Jiang, J.: Source apportionment of PM2.5 nitrate and sulfate in China using a source-oriented chemical transport model, Atmos. Environ., 62, 228–242, 2012.
Zhang, H., Zhang, M., Jin, J., Fei, K., Ji, D., Wu, C., Zhu, J., He, J., Chai, Z., Xie, J., Dong, X., Zhang, D., Bi, X., Cao, H., Chen, H., Chen, K., Chen, X., Gao, X., Hao, H., Jiang, J., Kong, X., Li, S., Li, Y., Lin, P., Lin, Z., Liu, H., Liu, X., Shi, Y., Song, M., Wang, H., Wang, T., Wang, X., Wang, Z., Wei, Y., Wu, B., Xie, Z., Xu, Y., Yu, Y., Yuan, L., Zeng, Q., Zeng, X., Zhao, S., Zhou, G., and Zhu, J.: CAS-ESM 2: Description and Climate Simulation Performance of the Chinese Academy of Sciences (CAS) Earth System Model (ESM) Version 2, J. Adv. Model. Earth Syst., 12, e2020MS002210, https://doi.org/10.1029/2020MS002210, 2020.
Zhang, Q., Zheng, Y., Tong, D., Shao, M., Wang, S., Zhang, Y., Xu, X., Wang, J., He, H., Liu, W., Ding, Y., Lei, Y., Li, J., Wang, Z., Zhang, X., Wang, Y., Cheng, J., Liu, Y., Shi, Q., Yan, L., Geng, G., Hong, C., Li, M., Liu, F., Zheng, B., Cao, J., Ding, A., Gao, J., Fu, Q., Huo, J., Liu, B., Liu, Z., Yang, F., He, K., and Hao, J.: Drivers of improved PM2.5 air quality in China from 2013 to 2017, P. Natl. Acad. Sci. USA, 116, 24463–24469, 2019.
Zhang, Q. H., Zhang, J. P., and Xue, H. W.: The challenge of improving visibility in Beijing, Atmos. Chem. Phys., 10, 7821–7827, https://doi.org/10.5194/acp-10-7821-2010, 2010.
Zhang, Y., Chen, Y., Sarwar, G., and Schere, K.: Impact of gas-phase mechanisms on Weather Research Forecasting Model with Chemistry (WRF/Chem) predictions: Mechanism implementation and comparative evaluation, J. Geophys. Res.-Atmos., 117, D01301, https://doi.org/10.1029/2011JD015775, 2012a.
Zhang, Y., Hemperly, J., Meskhidze, N., and Skamarock, W. C.: The Global Weather Research and Forecasting (GWRF) Model: Model Evaluation, Sensitivity Study, and Future Year Simulation, Atmospheric and Climate Sciences, 2, 231–253, https://doi.org/10.4236/acs.2012.23024, 2012b.
Zhang, Y.-L. and Cao, F.: Fine particulate matter (PM2.5) in China at a city level, Sci. Rep., 5, 14884, https://doi.org/10.1038/srep14884, 2015.
Zheng, B., Tong, D., Li, M., Liu, F., Hong, C., Geng, G., Li, H., Li, X., Peng, L., Qi, J., Yan, L., Zhang, Y., Zhao, H., Zheng, Y., He, K., and Zhang, Q.: Trends in China's anthropogenic emissions since 2010 as the consequence of clean air actions, Atmos. Chem. Phys., 18, 14095–14111, https://doi.org/10.5194/acp-18-14095-2018, 2018.
Zhu, T., Shang, J., and Zhao D. F.: The roles of heterogeneous chemical processes in the formation of an air pollution complex and gray haze, Scientia Sinica Chimica, 40, 1731–1740, https://doi.org/10.1360/zb2010-40-12-1731, 2010.
Zhuang, X., Wang, Y., He, H., Liu, J., Wang, X., Zhu, T., Ge, M., Zhou, J., Tang, G., and Ma, J.: Haze insights and mitigation in China: An overview, J. Environ. Sci., 26, 2–12, 2014.