the Creative Commons Attribution 4.0 License.
the Creative Commons Attribution 4.0 License.
 | 10 Nov 2020
Modeling the impacts of diffuse light fraction on photosynthesis in ORCHIDEE (v5453) land surface model
Ana Bastos
Fabienne Maignan
Daniel Goll
Olivier Boucher
Laurent Li
Alessandro Cescatti
Nicolas Vuichard
Xiuzhi Chen
Christof Ammann
M. Altaf Arain
T. Andrew Black
Bogdan Chojnicki
Tomomichi Kato
Ivan Mammarella
Leonardo Montagnani
Olivier Roupsard
Maria J. Sanz
Lukas Siebicke
Marek Urbaniak
Francesco Primo Vaccari
Georg Wohlfahrt
Will Woodgate
Philippe Ciais
Aerosol- and cloud-induced changes in diffuse light have important impacts on the global land carbon cycle, as they alter light distribution and photosynthesis in vegetation canopies. However, this effect remains poorly represented or evaluated in current land surface models. Here, we add a light partitioning module and a new canopy light transmission module to the ORCHIDEE (Organising Carbon and Hydrology In Dynamic Ecosystems) land surface model (trunk version, v5453) and use the revised model, ORCHIDEE_DF, to estimate the fraction of diffuse light and its effect on gross primary production (GPP) in a multilayer canopy. We evaluate the new parameterizations using flux observations from 159 eddy covariance sites over the globe. Our results show that, compared with the original model, ORCHIDEE_DF improves the GPP simulation under sunny conditions and captures the observed higher photosynthesis under cloudier conditions in most plant functional types (PFTs). Our results also indicate that the larger GPP under cloudy conditions compared with sunny conditions is mainly driven by increased diffuse light in the morning and in the afternoon as well as by a decreased vapor pressure deficit (VPD) and decreased air temperature at midday. The observations show that the strongest positive effects of diffuse light on photosynthesis are found in the range from 5 to 20 ∘C and at a VPD < 1 kPa. This effect is found to decrease when the VPD becomes too large or the temperature falls outside of the abovementioned range, which is likely due to the increasing stomatal resistance to leaf CO2 uptake. ORCHIDEE_DF underestimates the diffuse light effect at low temperature in all PFTs and overestimates this effect at high temperature and at a high VPD in grasslands and croplands. The new model has the potential to better investigate the impact of large-scale aerosol changes and long-term changes in cloudiness on the terrestrial carbon budget, both in the historical period and in the context of future air quality policies and/or climate engineering.
- Article
(4569 KB) - Full-text XML
-
Supplement
(1299 KB) - BibTeX
- EndNote


Process-based land surface models (LSMs), which simulate the water and energy balance as well as biogeochemical processes on land, have been widely used to attribute past changes in carbon (C) fluxes (Piao et al., 2009; Sitch et al., 2015) and to project the future land C budget (Ciais et al., 2013). Despite being useful and widely applied tools, large uncertainties are a limitation of LSMs (Sitch et al., 2008). One of the sources of the uncertainties is the omission or oversimplification of important processes that affect primary production. For instance, the impacts of light quality on photosynthesis is not currently represented in most LSMs, limiting the possibility to predict the variability of the carbon budget driven by changes in the atmospheric aerosol load which may be triggered by volcanic eruptions or variation in air pollution levels.
In situ observations have found that, under the same light level, the increase in the diffuse light fraction can enhance light use efficiency and ultimately photosynthesis or gross primary production (GPP; Gu et al., 2003; Niyogi et al., 2004; Misson et al., 2005; Alton, 2007a; Knohl and Baldocchi, 2008; Mercado et al. 2009; Oliphant et al., 2011; Kanniah et al., 2013; Williams et al., 2014; Cheng et al., 2015; Wang et al., 2018). Several mechanisms explaining this GPP enhancement have been proposed and tested. First, the more isotropic nature of diffuse light means that it penetrates deeper into the canopy to become available for photosynthesis of the lower canopy leaves, which would otherwise be shaded and light limited (Roderick et al., 2001; Urban et al., 2012). Second, the multi-directionality of diffuse light produces a more homogeneous distribution of radiation between sunlit and shaded leaves, enhancing the photosynthesis of upper canopy shaded leaves and limiting the waste of energy in light-saturated sunlit leaves (Li et al., 2014; Williams et al., 2014). Third, a higher diffuse light fraction is often accompanied by a less stressing temperature and vapor pressure deficit (VPD) for photosynthesis. The covariance of these environmental factors may also cause the GPP to increase under cloudier conditions, although not as a direct effect of diffuse light (Gu et al., 2002; Cheng et al., 2015; Li et al., 2014). Lastly, the plant LAI (leaf area index – the area of leaves per unit land area) maximum may become acclimated to the cloudier seasons, which also contributes to higher GPP (Williams et al., 2016).
Currently, most process-based LSMs simulate leaf photosynthesis using equations and parameterizations derived from Farquhar et al. (1980) with different formulations of stomatal conductance, usually with stomatal closure under a high VPD or low relative humidity (Ball et al., 1987; Yin et al., 2009; Medlyn et al., 2011). These parameterizations calculate photosynthesis per unit LAI considering the stress from temperature, VPD and soil water, and then integrate it over the entire canopy volume. Therefore, the effects of temperature and VPD change under cloudier conditions have usually been implicitly considered in current LSMs (e.g., Zhang et al., 2019). However, for the sake of simplicity and computational efficiency and due to the lack of diffuse light fraction data, most global LSMs have assumed a single extinction coefficient for both direct and diffuse light (Sellers et al., 1997; Sitch et al., 2008). Therefore, these LSMs are incapable of investigating the effect of the diffuse light fraction changes on photosynthesis. This limit of LSMs is thought to cause considerable underestimation of the land C sink after the eruption of Mount Pinatubo (Le Quéré et al., 2018).
To better simulate the diffuse light impacts, several earlier works have developed photosynthesis models that consider different light transmission of diffuse and direct radiation (Spitters, 1986; Leuning et al., 1995; de Pury and Farquhar, 1997). Based on these models, a few studies have tried to address the influence of light quality on GPP in LSMs. Dai et al. (2004) introduced a two-big-leaf canopy model to simulate the effects of diffuse and direct radiation in the Common Land Model (CLM 2L). This two-big-leaf scheme was further used in iTem LSM (Chen and Zhuang, 2014) and was partly inherited in later CLM models (Oleson et al., 2013). However, this light transmission scheme assumes a single-layer canopy and can, therefore, not simulate the vertical profile of leaf traits. A multilayer canopy model is more suitable to represent the vertical heterogeneity of leaf traits and radiation transfer (Alton et al., 2007b; Bonan et al., 2012). Differentiating sunlit and shaded leaves in a multilayer canopy LSM was firstly considered in the Joint UK Land Environment Simulator (JULES) LSM (Alton et al., 2007a; Mercado et al., 2009). Using this version of JULES, Mercado et al. (2009) investigated the diffuse light effect and suggested that diffuse light fraction change enhanced the global land C sink during the 1960–1999 period by about a quarter. However, the model of Mercado et al. (2009) was only tested at two forest sites, which cannot sufficiently represent global terrestrial ecosystems. Thus, the need remains to obtain well-evaluated LSMs that distinguish diffuse and direct light in order to test the results of Mercado et al. (2009) and to further investigate the diffuse radiation effect of aerosols. Apart from JULES, the Yale Interactive terrestrial Biosphere model (YIBs) also included a two-stream multilayer canopy light transmission scheme, but few efforts have been made to evaluate the ability of the YIBs model to capture the observed diffuse light fertilization effect, especially at sub-daily timescales (Yue and Unger, 2015).
Here, we introduce a modified version of the LSM ORCHIDEE (Organising Carbon and Hydrology In Dynamic Ecosystems; Krinner et al., 2005), referred to as ORCHIDEE_DF, which uses a semiempirical method to calculate the fraction of diffuse light (Weiss and Norman, 1985) as well as a process-based multilayer canopy light transmission model to simulate the effects of diffuse light fraction on photosynthesis (Spitters, 1986). We evaluated the GPP simulated by ORCHIDEE_DF and the same version of the ORCHIDEE code without diffuse light (trunk version, v5453) using observations collected from 159 eddy covariance flux sites over 11 plant functional types (PFTs; Baldocchi et al., 2001). Using both model simulations and observations at the flux sites, we also investigated the interactions between diffuse light fraction and biotic and abiotic factors on GPP, with the objective of understanding when and how much the light quality affects photosynthesis. Because diffuse light is expected to enhance the photosynthesis of shaded leaves in deep canopy, we tested whether the enhancement of GPP due to diffuse radiation is larger in canopies with a larger LAI. We also tested whether environmental factors such as temperature or VPD affect this enhancement from diffuse light.
2.1 Model description
2.1.1 Canopy light transmission and photosynthesis in the ORCHIDEE trunk
The ORCHIDEE_DF model is based on ORCHIDEE trunk version 5453 (updated in September 2018). A general description of the physical processes related to the energy and water balance, vegetation dynamics and biogeochemical processes in ORCHIDEE can be found in Krinner et al. (2005). The ORCHIDEE trunk version 5453 brings a number of improvements, and photosynthesis parameters were recently recalibrated against FLUXNET data (Baldocchi et al., 2001) and atmospheric CO2 observations for the IPSL Earth system model (IPSL-CM6) and the CMIP6 simulations.
The leaf-scale photosynthesis calculation in ORCHIDEE trunk is based on the scheme of Yin and Struik (2009). This scheme is an adaptation of the biophysical model of Farquhar et al. (1980) with a specific parameterization of stomatal conductance. The Farquhar et al. (1980) model calculates assimilation (A) as the minimum of the Rubisco-limited rate of CO2 assimilation (Ac) and the electron-transport-limited rate of CO2 assimilation (Aj):
Here, Ac is mainly affected by the maximum carboxylation capacity of Rubisco (Vcmax), which is temperature dependent (Yin and Struik, 2009), and the CO2 concentration at the carboxylation site (Cc):
where Γ* is the CO2 compensation point in the absence of dark respiration (Rd); KmC and KmO are the Michaelis–Menten constants for CO2 and O2, respectively; and O is the O2 concentration at the carboxylation site.
Aj is calculated as a function of Cc and the electron transport rate (J):
Here, J is determined by a temperature-dependent maximum electron transport rate (Jmax) and the photosynthetic photons absorbed by leaves, calculated following Yin and Struik (2009). Due to the attenuation of photosynthetically active radiation (PAR) with depth in the canopy, J also varies vertically. In addition, to account for the distribution of light and maximize the assimilation, plants tend to allocate nitrogen unevenly in the canopy profile (Niinemets et al., 1998; Meir et al., 2002), resulting in a vertical gradient in the enzyme concentration and, consequently, in Vcmax and Jmax. The vertical heterogeneity of canopy photosynthetic properties highlights the need to represent the canopy in a multilayer way.
In order to simulate the vertical transmission and absorption of light within the canopy, ORCHIDEE trunk uses a multilayer canopy with a big-leaf approximation in each layer. The canopy is geometrically divided into up to a maximum number of 20 layers depending on the leaf area index (LAI). The discretization is represented in Fig. 1a, and the LAI at the interface of the layers are given by
where LAI_ci is the cumulative LAI above layer i (), and the layers are numbered from top to bottom (Fig. 3). It should be noted that 20 layers are only for canopies with a total LAI larger than 12. The number of layers decreases with the total LAI. For instance, if the LAI is 2, only the first 10 layers are used to calculate the light distribution and photosynthesis (Fig. 1a).

Figure 1The distribution of light and leaves in the canopy: (a) light distribution in ORCHIDEE trunk; (b) distribution of sunlit and shaded leaves in canopy in ORCHIDEE_DF; and (c) light absorbed by shaded leaves in each canopy layer under different solar zenith angles (SZAs) and fractions of diffuse light (Fdf) in ORCHIDEE_DF. Panel (d) is the same as panel (c) but for sunlit leaves. I denotes downward PPFD at the top of the canopy; Iabs denotes PPFD absorption per leaf area in ORCHIDEE trunk; Ishd,abs denotes PPFD absorption per leaf area in shaded leaves; and Isun,abs denotes PPFD absorption per leaf area in sunlit leaves.
Light transmission in the multilayer canopy is calculated using the Beer–Lambert law (Monsi and Saeki, 2005) without distinguishing direct and diffuse light. The downward shortwave radiation arriving at the top of canopy (TOC) layer i (Ii) is
where k is the light extinction coefficient, taken equal to 0.5; and I0 is the TOC downward shortwave radiation (W m−2).
Because the radiation attenuation between one layer and the one just below is assumed to be due to leaf absorption, the absorbed radiation per leaf area at the top of layer i (Iabsi) can be estimated as in Saeki (1960):
Here, we assume that all canopy layers are thin enough to neglect the difference in light absorption within each canopy layer, i.e., the absorbed radiation does not attenuate within each canopy layer and Iabsi is used for all leaves in layer i.
It should be noted that the radiation considered to calculate the J term in Eq. (3) is not shortwave radiation in watts per square meter (W m−2) but photosynthetic photon flux density (PPFD) in micromoles per square meter per second (µmol m−2 s−1). Thus, a translation from Iabsi to the absorbed PPFD per leaf area in canopy layer i (PPFDabsi) is needed. Currently, there is no standard definition of the wavelength range for shortwave radiation (e.g., Howell et al., 1983; Zhang et al., 2004; Chen et al., 2012). In ORCHIDEE trunk, shortwave radiation (in W m−2) is multiplied by a factor of 0.5 to calculate photosynthetically active radiation (PAR; in W m−2), and then a quanta-to-energy ratio of 4.6 mmol J−1 is used to convert PAR into PPFD (in µmol m−2 s−1).
ORCHIDEE accounts for a vertical gradient in the enzyme concentration in the canopy. Vcmax and Jmax are assumed to be linearly related to photosynthetically active leaf nitrogen concentration (per leaf area) in the model (Kattge and Knorr, 2007). Meir et al. (2002) found a decreasing leaf nitrogen concentration as well as decreasing Vcmax and Jmax with increasing canopy depth in different ecosystems, suggesting an acclimation of plants to maximize photosynthesis in a canopy with unevenly distributed radiation. ORCHIDEE trunk lacks an explicit model of dynamic nitrogen allocation to leaves in the canopy; instead, it uses an empirical relationship to represent the impact of the leaf nitrogen concentration on Vcmax and Jmax using the vertical profile of radiation:
It should be noted that the leaf-scale assimilation variables (e.g., Vcmax) in ORCHIDEE trunk are also affected by the instantaneous leaf temperature and the temperature of the last that which plants have adapted to (Kattge and Knorr, 2007). As there is only one energy budget per grid cell, from which we cannot determine the leaf temperature, in the current ORCHIDEE model, the air temperature is used to represent the leaf temperature in current model. The calculation of Cc depends on the VPD and also on whether the vegetation follows the C3 or C4 photosynthesis pathway (Yin and Struik, 2009). For simplicity, the near-surface air temperature and humidity are used for the calculation of assimilation in all canopy layers. Furthermore, there are 13 PFTs in ORCHIDEE (Table S1), and Vcmax and Jmax are PFT dependent.
2.1.2 Canopy light transmission in ORCHIDEE_DF
In ORCHIDEE_DF, we use the same stratification of canopy as in the trunk version (Eq. 4). However, for the light transmission, we use a two-stream radiative transfer model with direct and diffuse radiation treated separately following Spitters (1986). For convenience, we use radiation and I in this section to refer to the PPFD derived from the light partitioning step (see Sect. 2.1.3).
An assumption of the model is that leaves are bi-Lambertian surfaces for radiation, i.e., the reflection and transmission are isotropic. This reflection and transmission are together referred to as leaf scattering. This assumption implies that once direct radiation encounters a leaf, it is either absorbed or scattered as diffuse light. For diffuse radiation, however, the scattered light remains diffuse. The scattering coefficient, σ, is assumed to be equal to 0.2 following Spitters (1986) – meaning that 20 % of the light encountering a leaf is scattered (80 % is absorbed).
Based on this assumption, the radiation penetrating the canopy can be divided into three components (Fig. 3): the direct light which has not been intercepted by leaves (Idr,dr), the diffuse light generated by leaf scattering of intercepted direct light (Idr,df) and the diffuse light in the canopy provided by the TOC diffuse radiation (Idf). It should be noted that the diffuse light generated after direct light has been scattered multiple times is grouped into Idr,df, whereas light from the scattering of TOC diffuse radiation belong to Idf (Fig. 3). The sum of Idr,dr and Idr,df, hereafter noted as Idr, represents the total radiation in each canopy layer derived from the TOC direct radiation, hereafter Idr,0.
If we also consider direct radiation as parallel beams, only the first leaves in the way of direct light can absorb Idr,dr. These leaves are referred to as sunlit leaves. The fraction of sunlit leaves in each canopy layer can be calculated by applying the Beer–Lambert law using an extinction coefficient for opaque, nonreflective “black” leaves (Fig. 1b):
Here, LAIfsun,i is the fraction of sunlit LAI in canopy layer i; LAI_ci is the cumulative LAI in Eq. (4); kb is the extinction coefficient if the leaves are assumed to be “black”. A function of θ, the leaf angle distribution index (LA) and leaf clumping index (LC) is used to represent the geometry between the direct radiation and leaves:
For spherically distributed leaves, the LA equals 0.5 (Goudriaan, 1977; Bodin and Franklin, 2012). The LC is defined as in Myneni et al. (1989) and Baldocchi and Wilson (2001) – varying between 0 and 1. Here, we use the value 0.85 instead of 0.84, as recommended by an observationally based study (Baldocchi and Wilson, 2001).
The leaves which cannot absorb Idr,dr are referred to as shaded leaves. Thus, the fraction of the shaded LAI in canopy layer i (LAIfshd,i) is the complement of LAIfsun,i:
Because Idr,dr is assumed not to be transmitted as direct radiation through leaves, , which represents Idr,dr at layer i, can be calculated in a similar manner as in Eq. (9) using the downward direct radiation at the top of the canopy (Idr,0):
The transmission of Idr,df is difficult to estimate directly. Here, we calculate it as the difference between Idr and Idr,dr in each layer:
where and Idr,i represent net (downward minus upward) Idr,df and net Idr at layer i, respectively.
The calculation of Idr,i is based on Goudriaan (1982) and Hikosaka et al. (2016) under the assumptions that there is no difference in optical traits between leaves from different canopy layers and that the canopy is deep enough to neglect the reflection of the soil:
where ρ indicates the canopy reflection coefficient (i.e., the ratio between the TOC downward and upward radiation), calculated as
In contrast to the direct light transmission, the diffuse light will not change its directional characteristics when scattered by leaves. Similar to Eq. (5), net Idf at canopy layer i (Idf,i) can be estimated using TOC downward diffuse radiation (Idf,0) in a Beer–Lambert equation:
where kd is the light extinction coefficient for diffuse light, calculated following Spitters (1986) as
Similar to Eq. (6), the flux of light that is absorbed per canopy leaf area in layer i from Idf (Iabsdf,i), Idr (Iabsdr,i) and Idr,dr (), respectively, can be written as
The Idr,df absorbed per canopy leaf area by layer i ( is
It should be noted that all leaves can absorb diffuse radiation. Therefore, Eqs. (18) and (21) also represent the absorption of Idf and Idr,df at the leaf scale. However, Idr,dr is only absorbed by sunlit leaves; thus, the absorption of Idr,dr per sunlit leaf area does not equal , which is the average at the canopy scale. Instead, because Idr,dr does not change its intensity, the absorption of Idr,dr per sunlit leaf area can be written as
We have assumed that shaded leaves can only absorb diffuse light. Thus, the radiation absorbed (per leaf area) by the shaded leaves layer i ( is
Sunlit leaves absorb both direct light and diffuse light; thus, the radiation received by sunlit leaves can be calculated as
Apart from light transmission, all other parameters (e.g., Vcmax, Jmax) in ORCHIDEE_DF are kept the same as in ORCHIDEE trunk.
2.1.3 Light partitioning in ORCHIDEE_DF
The lack of light quality (diffuse light fraction) information in most datasets to drive LSMs is one of the main difficulties when simulating the diffuse light effect. This field can be calculated in atmospheric light transmission models when aerosol and cloud information is available (Yue and Unger, 2017; Malavelle et al., 2019). However, the aerosol and cloud information is not always available. Here, we use the empirical equations following Weiss and Norman (1985) to partition the 30 min downward PAR, which can be derived from the shortwave radiation, into diffuse and direct components. Compared with another empirical method (Spitters et al., 1986), we found that this method more successfully reproduces the observed diffuse light fraction at the flux sites used in this study (Figs. 2, S1). The diffuse PAR fraction (FdfPAR) above the canopy is estimated as follows:
where PARp and PARp,dr are the potential total and direct PAR, i.e., the total and direct PAR which would arrive at land surface under clear-sky conditions. a and b are parameters, which take values of 0.9 and 0.7, and R is the ratio of observed to potential total downward shortwave radiation (SWobs and SWp) reaching the top of the canopy:
The potential downward shortwave radiation consists of potential downward PAR (visible, range 0.4–0.7 µm) and potential downward near-infrared radiation (NIR, range 0.7–5 µm). Also, the potential PAR and NIR are the sum of direct (PARp,dr, NIRp,dr) and diffuse (PARp,df, NIRp,df) components, given by
A simple atmospheric light transfer model modified from Weiss and Norman (1985) is used to estimate potential radiation. The potential direct PAR, PARp,dr is calculated as follows:
where PARTOA is the PAR at top of atmosphere (TOA); p and p0 indicate the local and standard sea level air pressure, respectively; and m is the optical air mass, calculated using the solar zenith angle θ:
The potential diffuse TOC PAR, PARp,df is assessed as
and expresses that 40 % of the PAR flux that is extinguished in the atmosphere through scattering and absorption is available as diffuse PAR at the surface. Similarly, the potential direct and diffuse NIR at the top of the canopy (NIRp,dr and NIRp,df respectively), can be estimated as follows:
where ω is a flux term accounting for atmospheric water vapor absorption, calculated as a function of the solar constant (SC, in W m−2) and m:
Using the results from Eqs. (28), (30), (31) and (32), we are able to calculate the SWp to obtain the value of R in Eq. (26).
It should be noted that the quanta-to-energy ratio (in mmol J−1) is different under different sky conditions, because atmospheric scattering varies spectrally with the air mass and the cloud amount (Dye, 2004). For this consideration, the calculation of PPFD from PAR in ORCHIDEE_DF uses the observation-oriented empirical equations from Dye (2004):
where the βt is the quanta-to-energy ratio for the total PAR (PARt) at the top of the canopy, whereas βdf is for its diffuse component (PARdf):
The diffuse PPFD fraction (FdfPPFD) can thus be calculated as follows:
2.2 Flux data and site-level simulations
To evaluate ORCHIDEE_DF, we collected flux site measurements from the La Thuile dataset, which includes 965 site-year observations from 252 sites in total (https://fluxnet.fluxdata.org/data/la-thuile-dataset/, last access 1 November 2020). Because our ORCHIDEE simulations assume that the ecosystems are in equilibrium and do not experience disturbances (e.g., logging, fire), we selected flux sites without strong disturbances over the last 10 years. For sites that also provided growing season LAI information, we also removed forests site with LAI < 2, which may be considered as sparse forests with understory vegetation. In the end, observations of 655 site-years from 159 sites were retained (Table S2). The annual mean temperature of the sites spans from −9 to 27 ∘C, and the annual precipitation spans from 67 mm yr−1 to over 3000 mm yr−1 (Fig. S2), which is representative of most of the climate conditions over the globe. The dataset provides in situ meteorology, net ecosystem exchange (NEE), gross primary productivity (GPP) and data quality information at 30 min time steps. The GPP provided by this dataset is partitioned from NEE and gap filled using the method of Reichstein et al. (2005). Specifically, 64 of the 159 sites provided measurements of both total and diffuse PPFD, which allows us to evaluate the light partitioning parametrization (Eqs. 25–38). The gaps and missing variables in meteorology are filled using the approach from Vuichard and Papale (2015) to meet the model input requirements.
Because ORCHIDEE has different photosynthesis parameters for different PFTs, we classified the vegetation at each site into the 13 ORCHIDEE PFTs (Table S1) according to the International Geosphere-Biosphere Programme (IGBP) land cover types specified on the FLUXNET website (https://fluxnet.org/, last access: 1 November 2020). If the IGBP land cover type is not specified or may match more than one ORCHIDEE PFT (e.g., shrublands, savannas and wetlands), the PFT is determined according to the dominant plant species described in related references. Specifically, the mixed forests (MF) type exists in the IGBP classification but not in the ORCHIDEE PFTs. Because MF sites are mostly located in temperate regions, we assume that they are composed of 50 % temperate broadleaf deciduous forests and 50 % temperature evergreen needleleaf forests. Detailed information of flux sites is found in Table S2.
To evaluate the model, 30-years spin-up simulations are firstly conducted on ORCHIDEE_DF at each site to equilibrate the leaf area index with site conditions. The simulations with 30 min output are then conducted with ORCHIDEE trunk and ORCHIDEE_DF using the full span of the FLUXNET La Thuile series at each site, respectively. It should be noted that we use the same spin-up for ORCHIDEE trunk and ORCHIDEE_DF to ensure the same initial states for the two simulations. A test has shown that different spin-up simulations do not affect the simulation of GPP in the following years (not shown).
2.3 Analyses
When evaluating the modeled GPP response to diffuse light, we did not use all the 30 min data points due to several concerns. First, all nighttime data points were excluded from the analyses given that GPP is zero at night. Second, all data points flagged with poor quality in the FLUXNET archive were removed. Third, ORCHIDEE might not be perfect at capturing the seasonality of leaf flushing and shedding. In order to minimize the uncertainty from phenology, we used only data from the growing season at each site, which is defined as months when
where GPPmis the observed monthly GPP, and GPPm,min and GPPm,max are the observed minimum and maximum monthly GPP at the corresponding sites, respectively.
To assess the effect of variable diffuse light fraction on both GPP and light use efficiency (LUE – the ratio of GPP to incoming shortwave radiation), we look at the difference in GPP and the LUE under sunny and cloudy conditions. We define sunny and cloudy conditions as those when the fraction of diffuse PPFD at the top of the canopy (FdfPPFD) is smaller than 0.4 and greater than 0.8, respectively, and calculate the average sunny and cloudy GPP and LUE at each site. To ensure that the comparison between sunny and cloudy conditions are at the same PPFD level, the sunny time steps with PPFD larger than the maximum PPFD under cloudy conditions are removed from the average, and vice versa. In addition, to make sure that the difference in GPP between sunny and cloudy conditions is not an artifact of different LAI, sites with average modeled LAI under cloudy and sunny conditions that differ by more than 0.3 are excluded from this analysis.
3.1 Diffuse light modeling
Figure 2 shows the relationship between 30 min modeled and measured FdfPPFD at flux sites (64 sites). The data points are generally distributed along the 1:1 line, indicating an unbiased estimation of our diffuse light model. In total, our simple model explains over 51 % of the variance in observed diffuse PPFD fraction. Although this model is imperfect, we currently have no better way of reproducing the diffuse PPFD at the flux site scale.
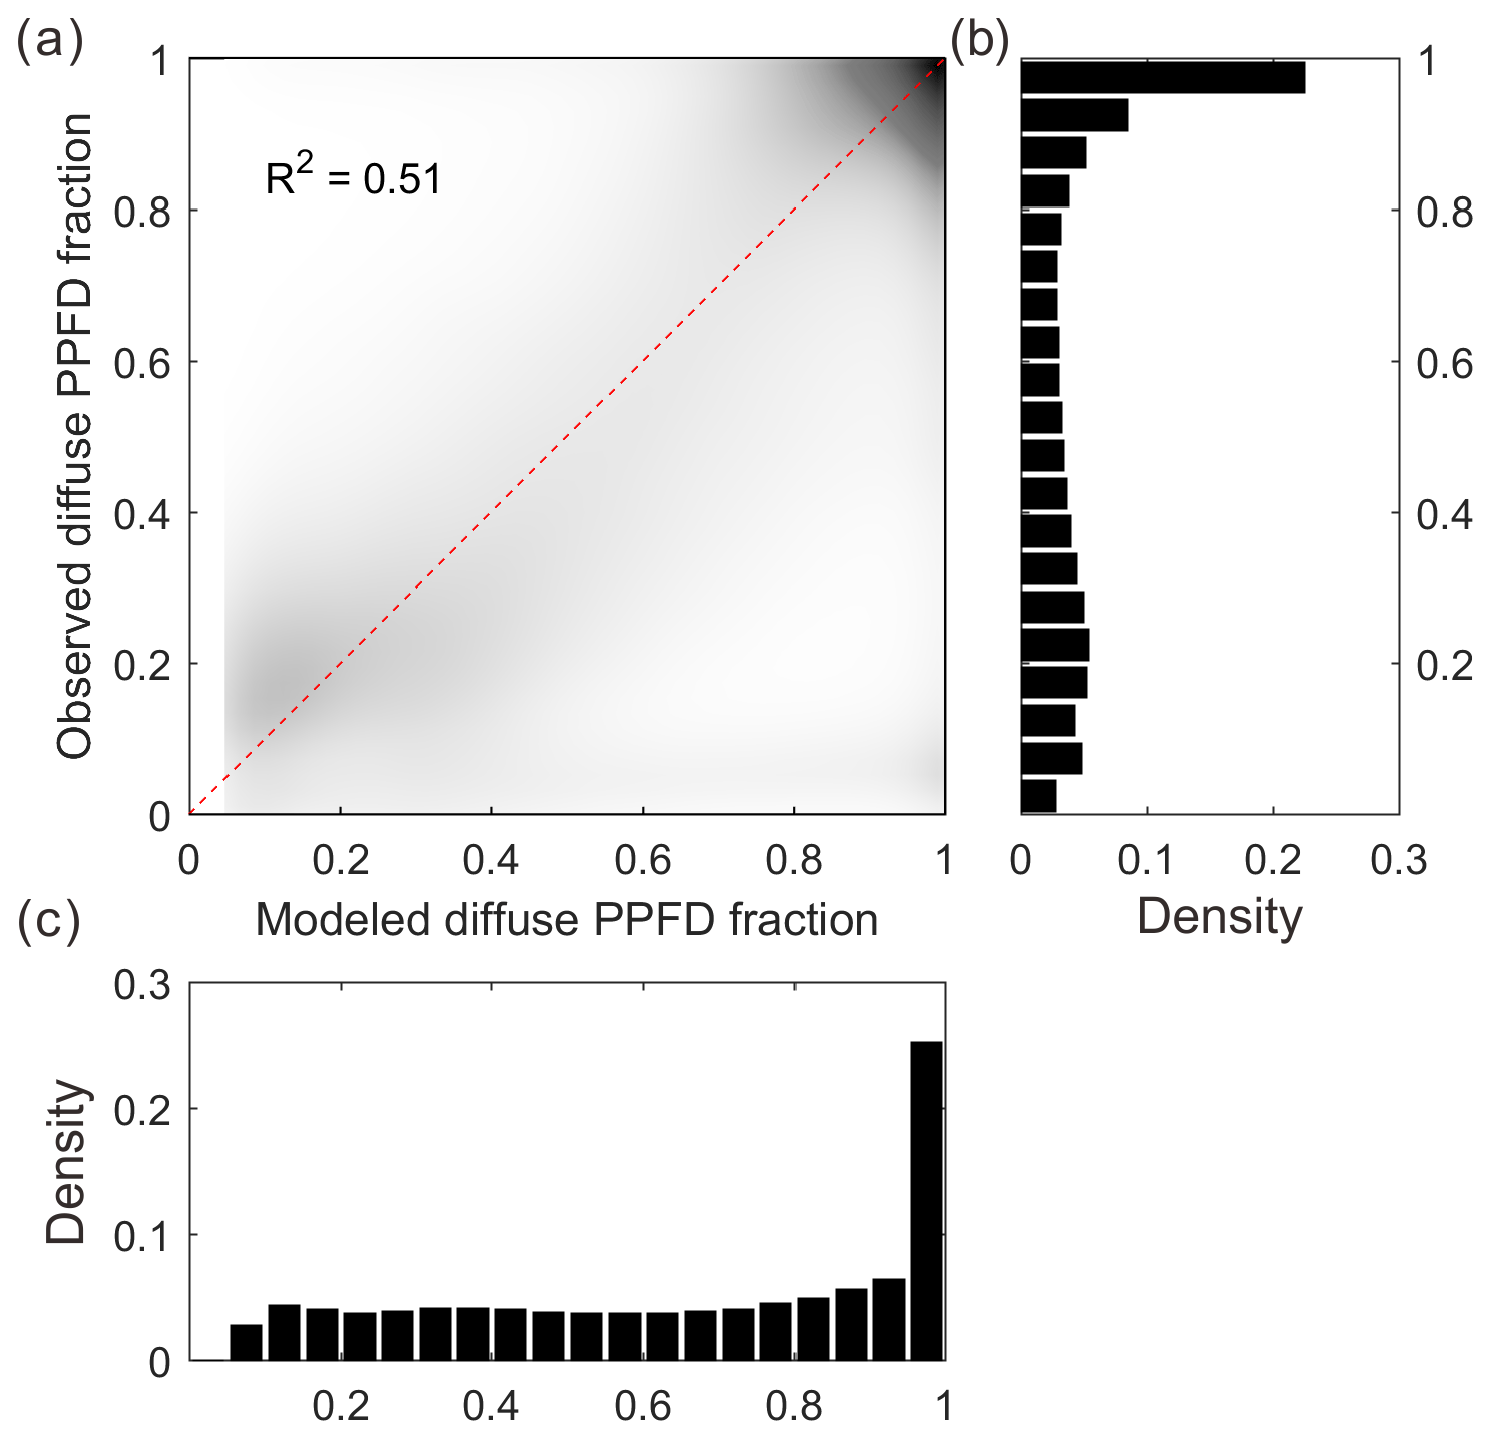
Figure 2Modeled and observed diffuse PPFD fraction (a): the dark area in the scatter plot indicates high data density, whereas the light area indicates low data density. (b) Density distribution of the observed diffuse PPFD fraction. (c) Density distribution of the modeled diffuse PPFD fraction.
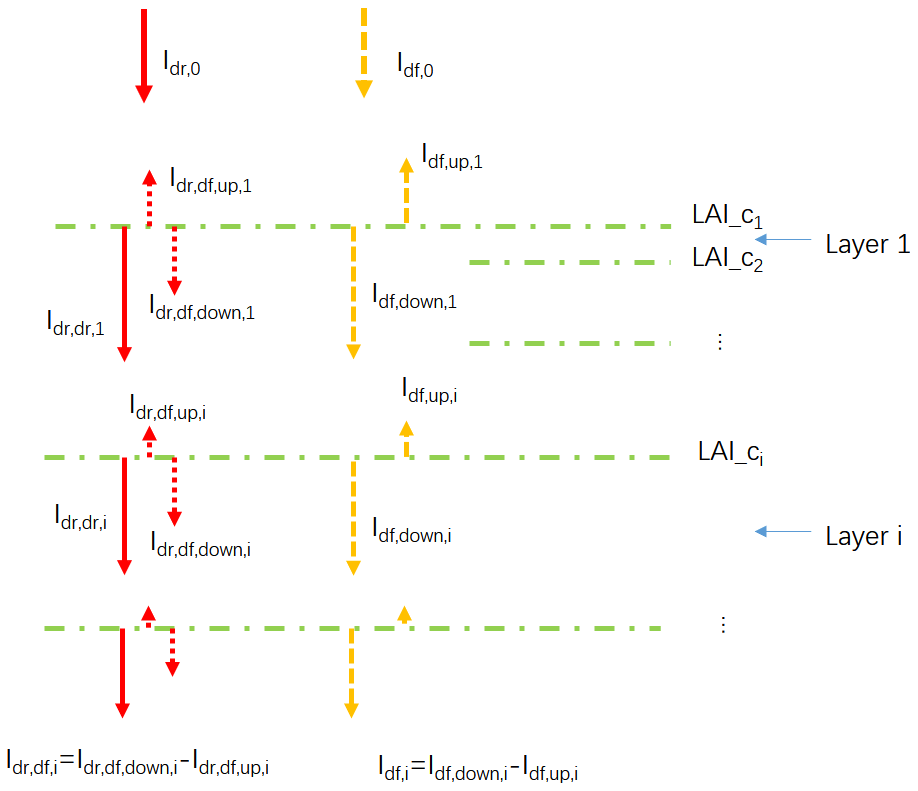
Figure 3Diagram of the canopy light transmission in ORCHIDEE_DF. Idr,0 denotes the downward direct PPFD at the top of the canopy; Idf,0 denotes the downward diffuse PPFD at the top of the canopy; LAI_ci denotes the cumulative LAI above canopy layer i; denotes downward direct PPFD at the top of canopy layer i; denotes the net diffuse PPFD derived from the scattering of Idr,0 at the top of canopy layer i, which is equal to the difference of its downward ( and upward ( components; Idf,i denotes the net diffuse PPFD derived from Idf,0 at the top of canopy layer i, which is equal to the difference of its downward () and upward () components.
3.2 General model performance
The performance of both ORCHIDEE trunk and ORCHIDEE_DF for the 30 min GPP from each PFT (all sites) is presented in Fig. 4. Generally, ORCHIDEE trunk underestimated the standard deviation (SD) of GPP at a 30 min time step compared with observations as well as across all PFTs except boreal evergreen needleleaf forests and C4 croplands (Fig. 4a). The correlation coefficients between ORCHIDEE trunk GPP and observations are generally between 0.5 and 0.7 among PFTs (Fig. 4b). In tropical broadleaf forests, this correlation coefficient is about 0.2, which is much smaller than in other PFTs and likely due to the limited seasonality of primary production in the tropics. The GPP simulated by ORCHIDEE_DF shows comparable performance to ORCHIDEE trunk, although with a slightly smaller SD (Fig. 4a).
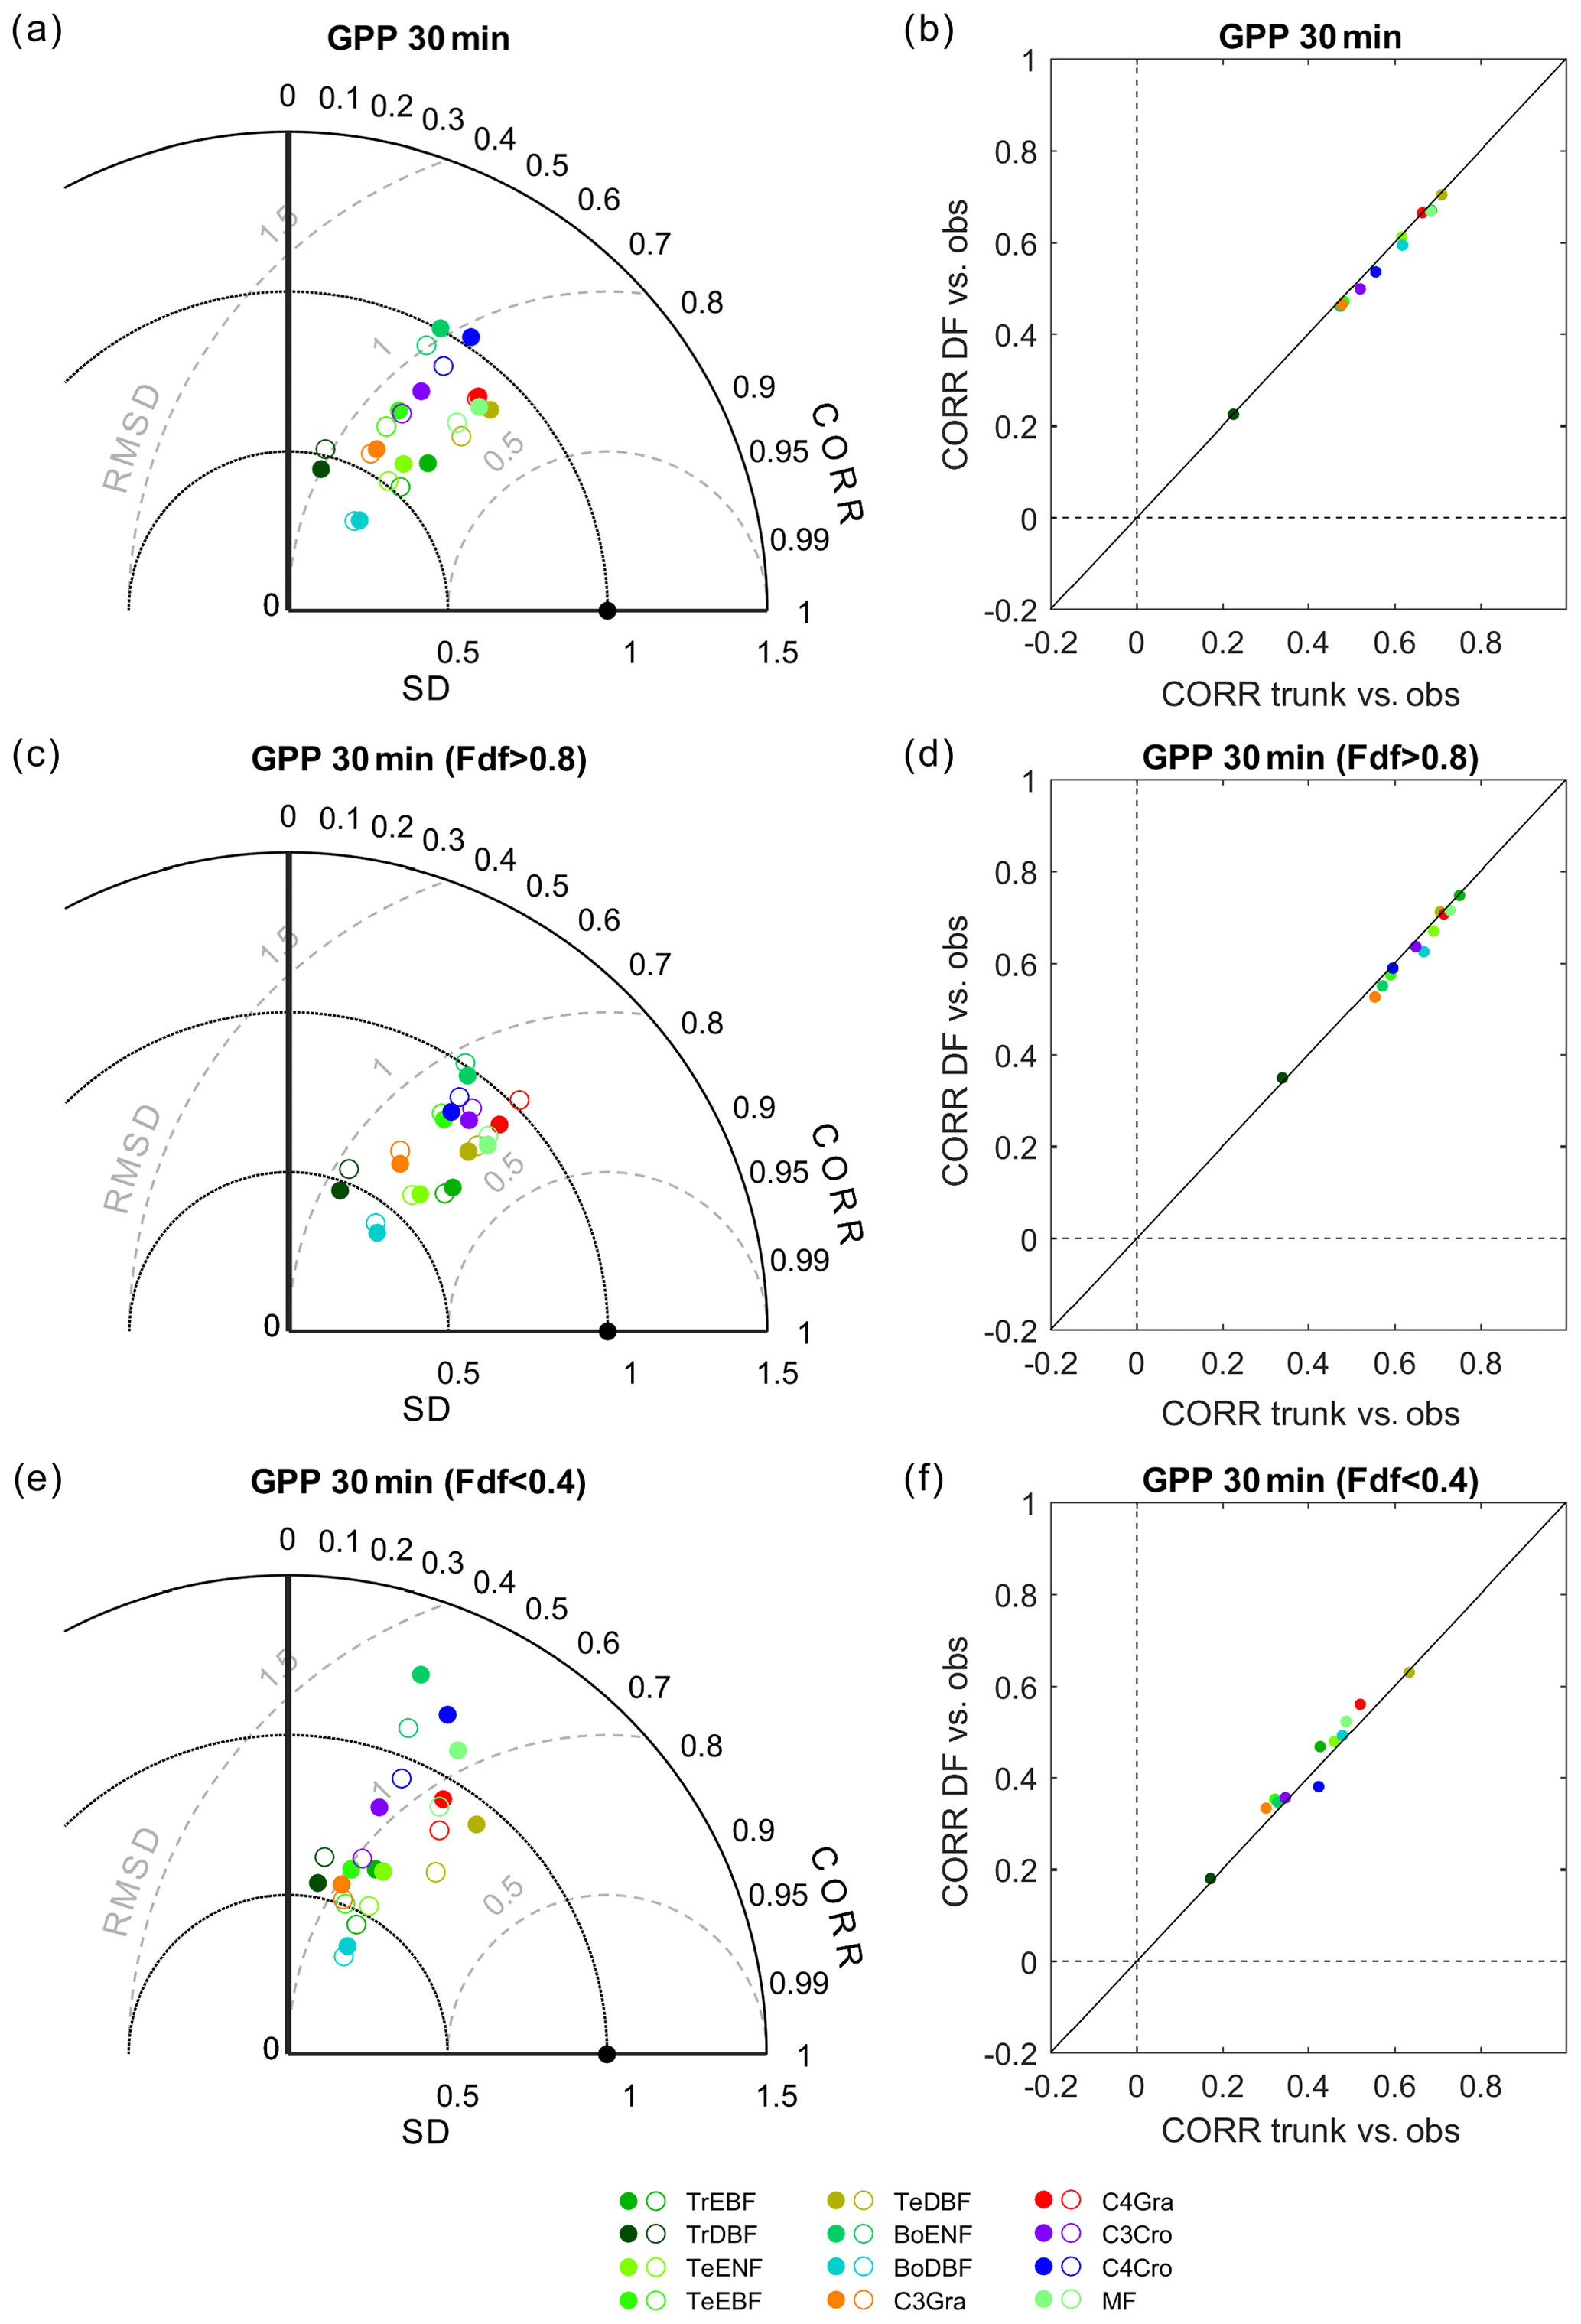
Figure 4Performance of ORCHIDEE trunk and ORCHIDEE_DF at different PFTs. (a) Taylor plot of GPP, where all valid 30 min observations are used as a reference: the filled circles indicate ORCHIDEE trunk, and open circles indicate ORCHIDEE_DF. (b) Comparison of the correlation coefficients between the two models against observations. Panels (c) and (e) are the same as panel (a) but for cloudy (diffuse light fraction > 0.8) and sunny (diffuse light fraction < 0.4) conditions only. Panels (d) and (f) are the same as panel (b) but for cloudy and sunny conditions only.
Similar evaluations on the GPP from the two models are performed under cloudy and sunny conditions, respectively (Fig. 4c, d, e, f). Under cloudy conditions, ORCHIDEE trunk and ORCHIDEE_DF both underestimated the GPP SD. The correlation coefficients to observations are generally between 0.5 and 0.8 (Fig. 4d). Compared with ORCHIDEE trunk, ORCHIDEE_DF shows slightly worse correlation coefficients but an improved SD for most of the PFTs except tropical broad-leaved evergreen forests (TrEBF) and temperate needleleaf evergreen forests (TeENF) (Fig. 4c).
Compared with cloudy conditions, the GPP simulated by the two models under sunny conditions shows a weaker correlation with observations. The correlation coefficients generally vary between 0.3 and 0.6 among PFTs. However, it should be noted that ORCHIDEE_DF more successfully reproduced GPP variation under sunny conditions compared with ORCHIDEE trunk in most PFTs except temperate deciduous broad-leaved forests (TeDBF) and C4 croplands (C4Cro) (Fig. 4f). The GPP SD derived from ORCHIDEE trunk simulations under sunny conditions show larger variability among PFTs than under cloudy conditions, whereas the GPP SD under sunny and cloudy conditions show similar bias compared with observations for ORCHIDEE_DF (Fig. 4e).
3.3 Effects of diffuse light on GPP and LUE
Because the modification of ORCHIDEE_DF was limited to light transmission, the pertinent process-oriented evaluation of the two models should focus on their ability to capture the observed GPP differences between cloudy and sunny conditions (hereafter ΔGPP), rather than on correlations or RMSE with observations, that may result from different structural and parametric errors of the model, which are not related to diffuse light.
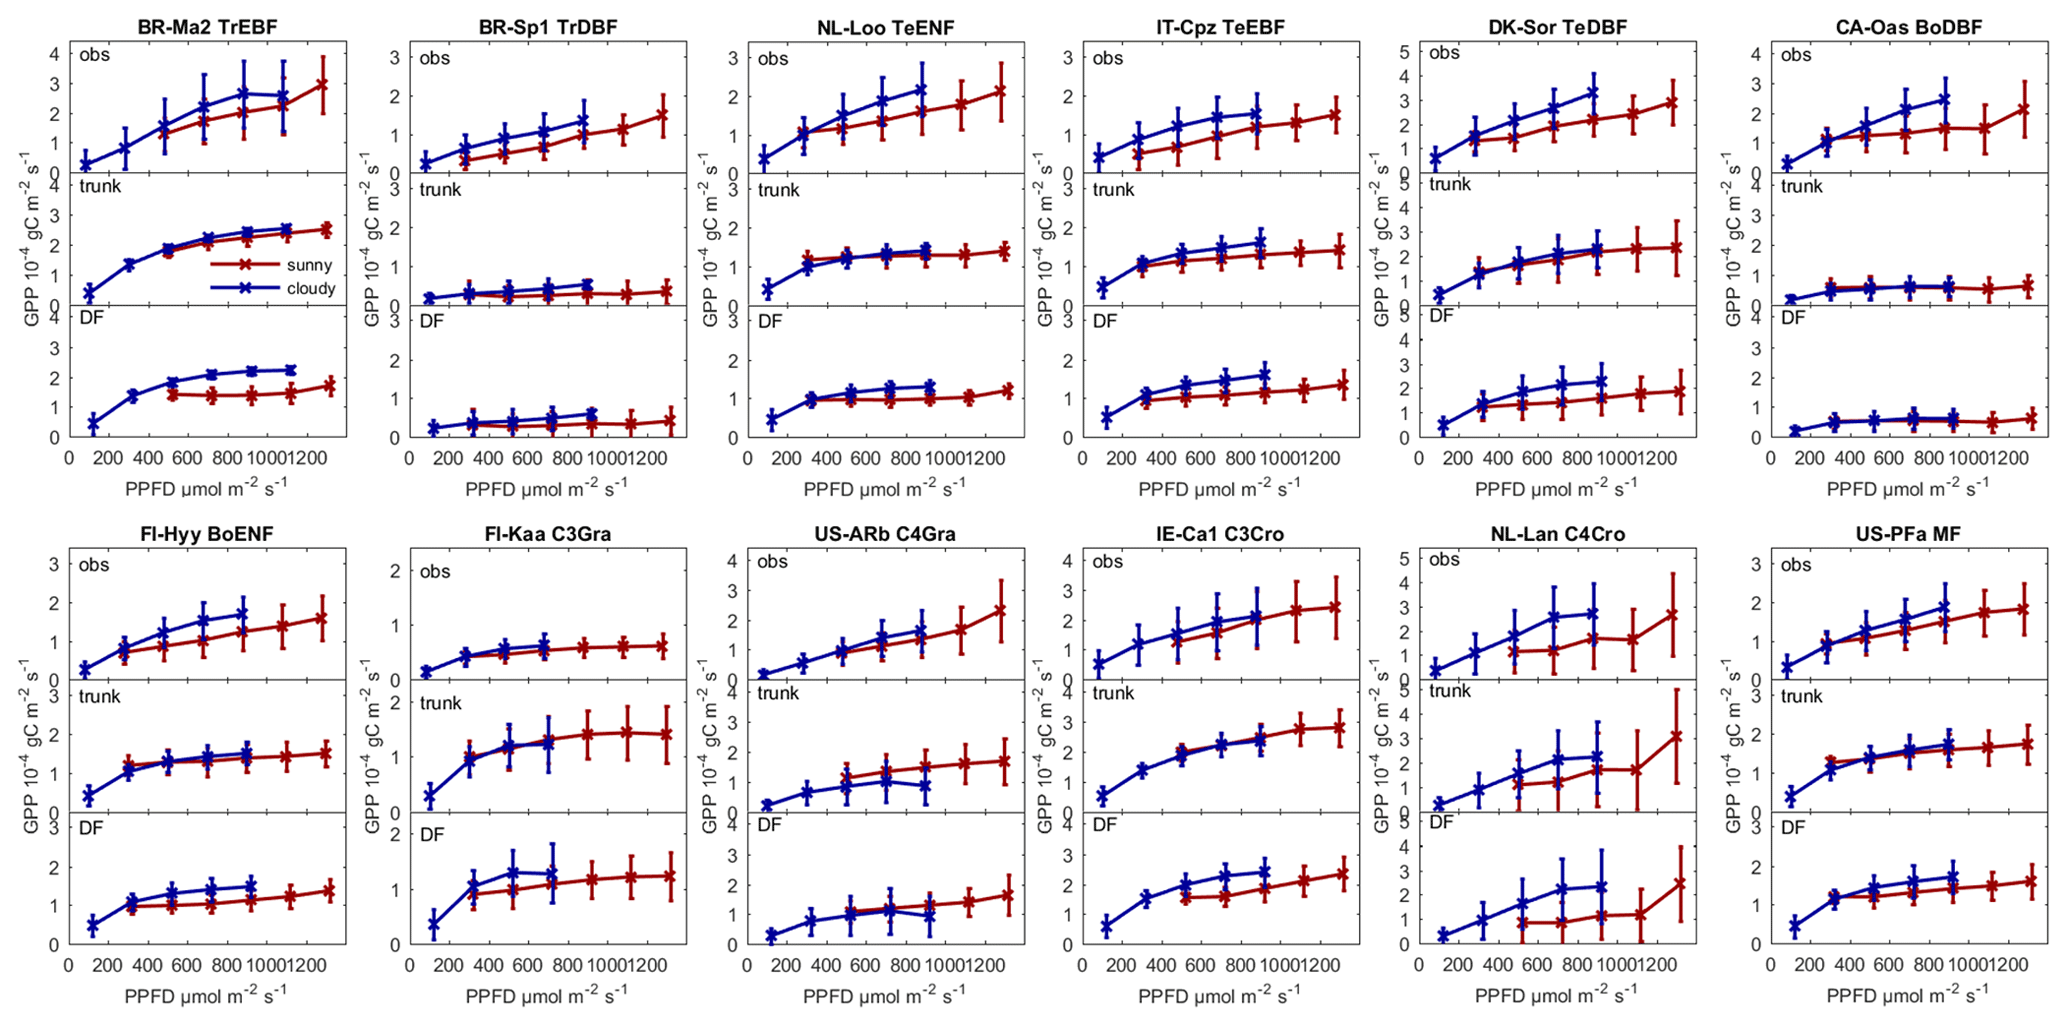
Figure 5Observed GPP and GPP modeled by ORCHIDEE trunk and ORCHIDEE_DF under cloudy (diffuse light fraction > 0.8) and sunny (diffuse light fraction <0.4) conditions at selected sites (with relatively long time series) from each PFT.
Figure 5 shows the observed and modeled GPP under sunny and cloudy conditions at different PPFD levels at flux sites with relatively long time series of observations from each PFT. For all the sites selected, the observed GPP under cloudy conditions is larger than under sunny conditions. However, the GPP simulated by ORCHIDEE trunk shows no or a small difference between cloudy and sunny conditions at most sites. In contrast, ORCHIDEE_DF reproduces this GPP difference in most PFTs except tropical deciduous broad-leaved forests (TrDBF), Boreal deciduous broad-leaved forests (BoDBF) and C4 grasslands (C4Gra). However, there is only one TrDBF site and very few C4Gra sites in our dataset. Furthermore, at most C4Gra sites, we are not able to find PPFD levels where sunny and cloudy conditions coexist. Therefore, we are not able to carry out further evaluation of cloudy-minus-sunny GPP differences for TrDBF and C4Gra. At three of the four BoDBF sites, the modeled GPP difference under cloudy and sunny conditions is relatively small (not shown). This might be because the model overestimated the deleterious effect of low temperature on photosynthesis at the BoDBF sites (mean annual temperature < 3 ∘C). In total, observations from about 70 % of the sites show a remarkably higher GPP under cloudy conditions compared with sunny conditions. This percentage is only 30 % in ORCHIDEE trunk simulations but amounts to 60 % in ORCHIDEE_DF simulations.
To summarize the site-level results, we investigated the distribution of the GPP difference between cloudy and sunny conditions (hereafter refer to as ΔGPP; Fig. 6a). Observations and ORCHIDEE_DF show a positive bias in ΔGPP, with ΔGPP values between 0 and gC m−2 s−1 at most sites. However, for ORCHIDEE trunk, ΔGPP is near zero at most sites. This result confirms that ORCHIDEE_DF performs much better than ORCHIDEE trunk in simulating differences in GPP under different light conditions.
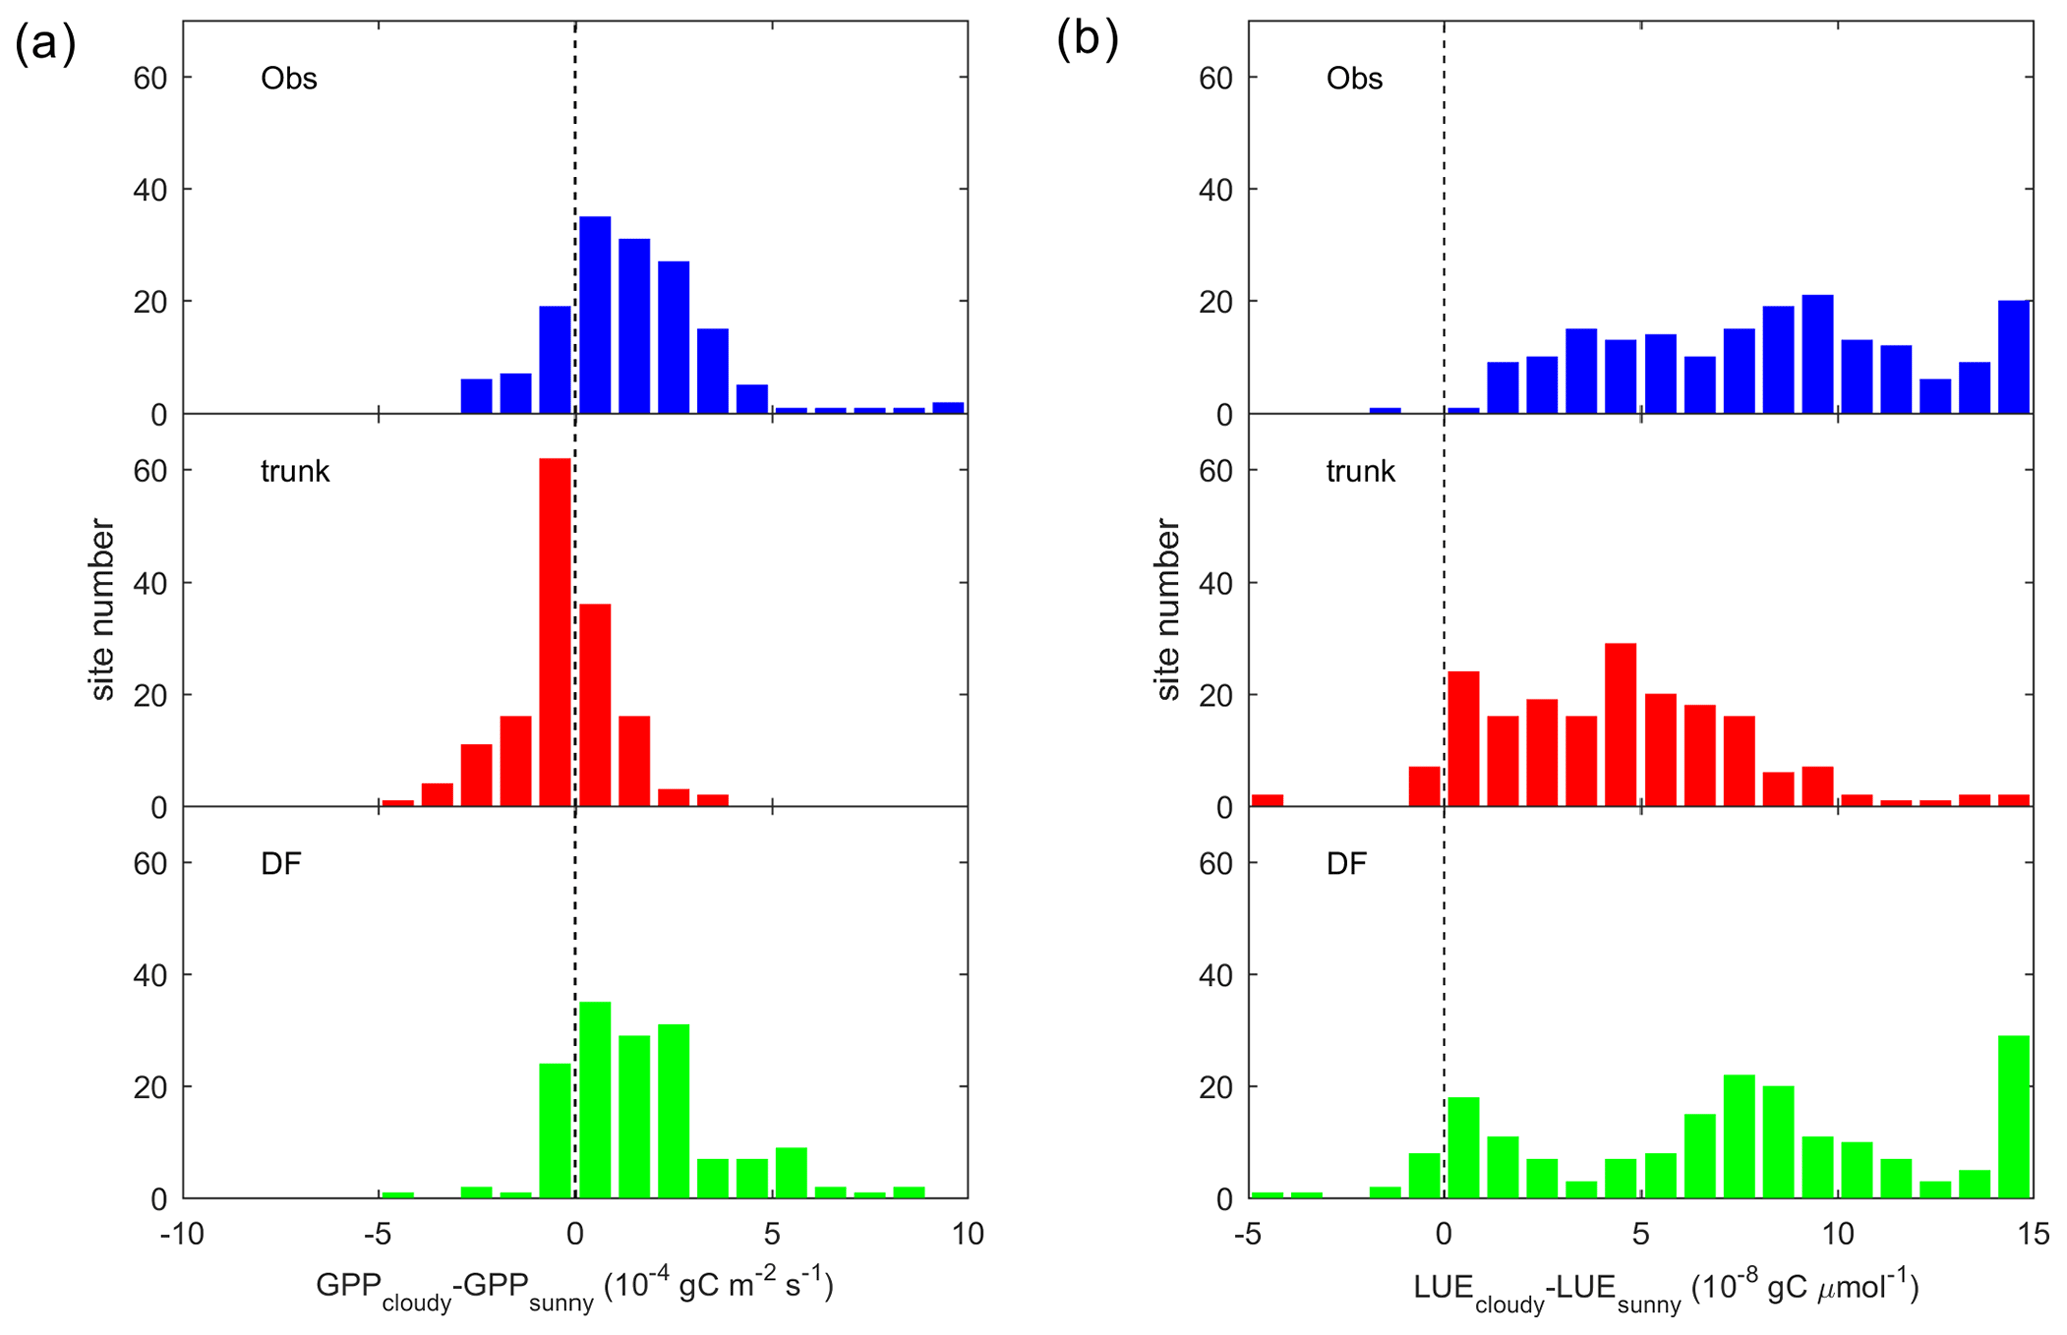
Figure 6Site distribution of (a) the GPP difference between cloudy (diffuse light fraction >0.8) and sunny (diffuse light fraction < 0.4) conditions. Panel (b) is the same as panel (a) but for the LUE. The sunny and cloudy time steps are sampled at equal light levels.
It should be noted that ΔGPP can be affected by PPFD. At sites where sunny and cloudy conditions only coexist at a relatively low PPFD level, the ΔGPP should also be small. To remove the effect of the PPFD level on ΔGPP, we analyzed the difference in the LUE, i.e., ΔLUE, between the two conditions (Fig. 6b). Compared with ΔGPP, positive ΔLUE values are more evenly distributed around 0– gC µmol (of photon)−1 for observations and the ORCHIDEE_DF simulation. For ORCHIDEE trunk, the ΔLUE has a range of 0– gC µmol−1, with the upper range smaller than in the observations and ORCHIDEE_DF.
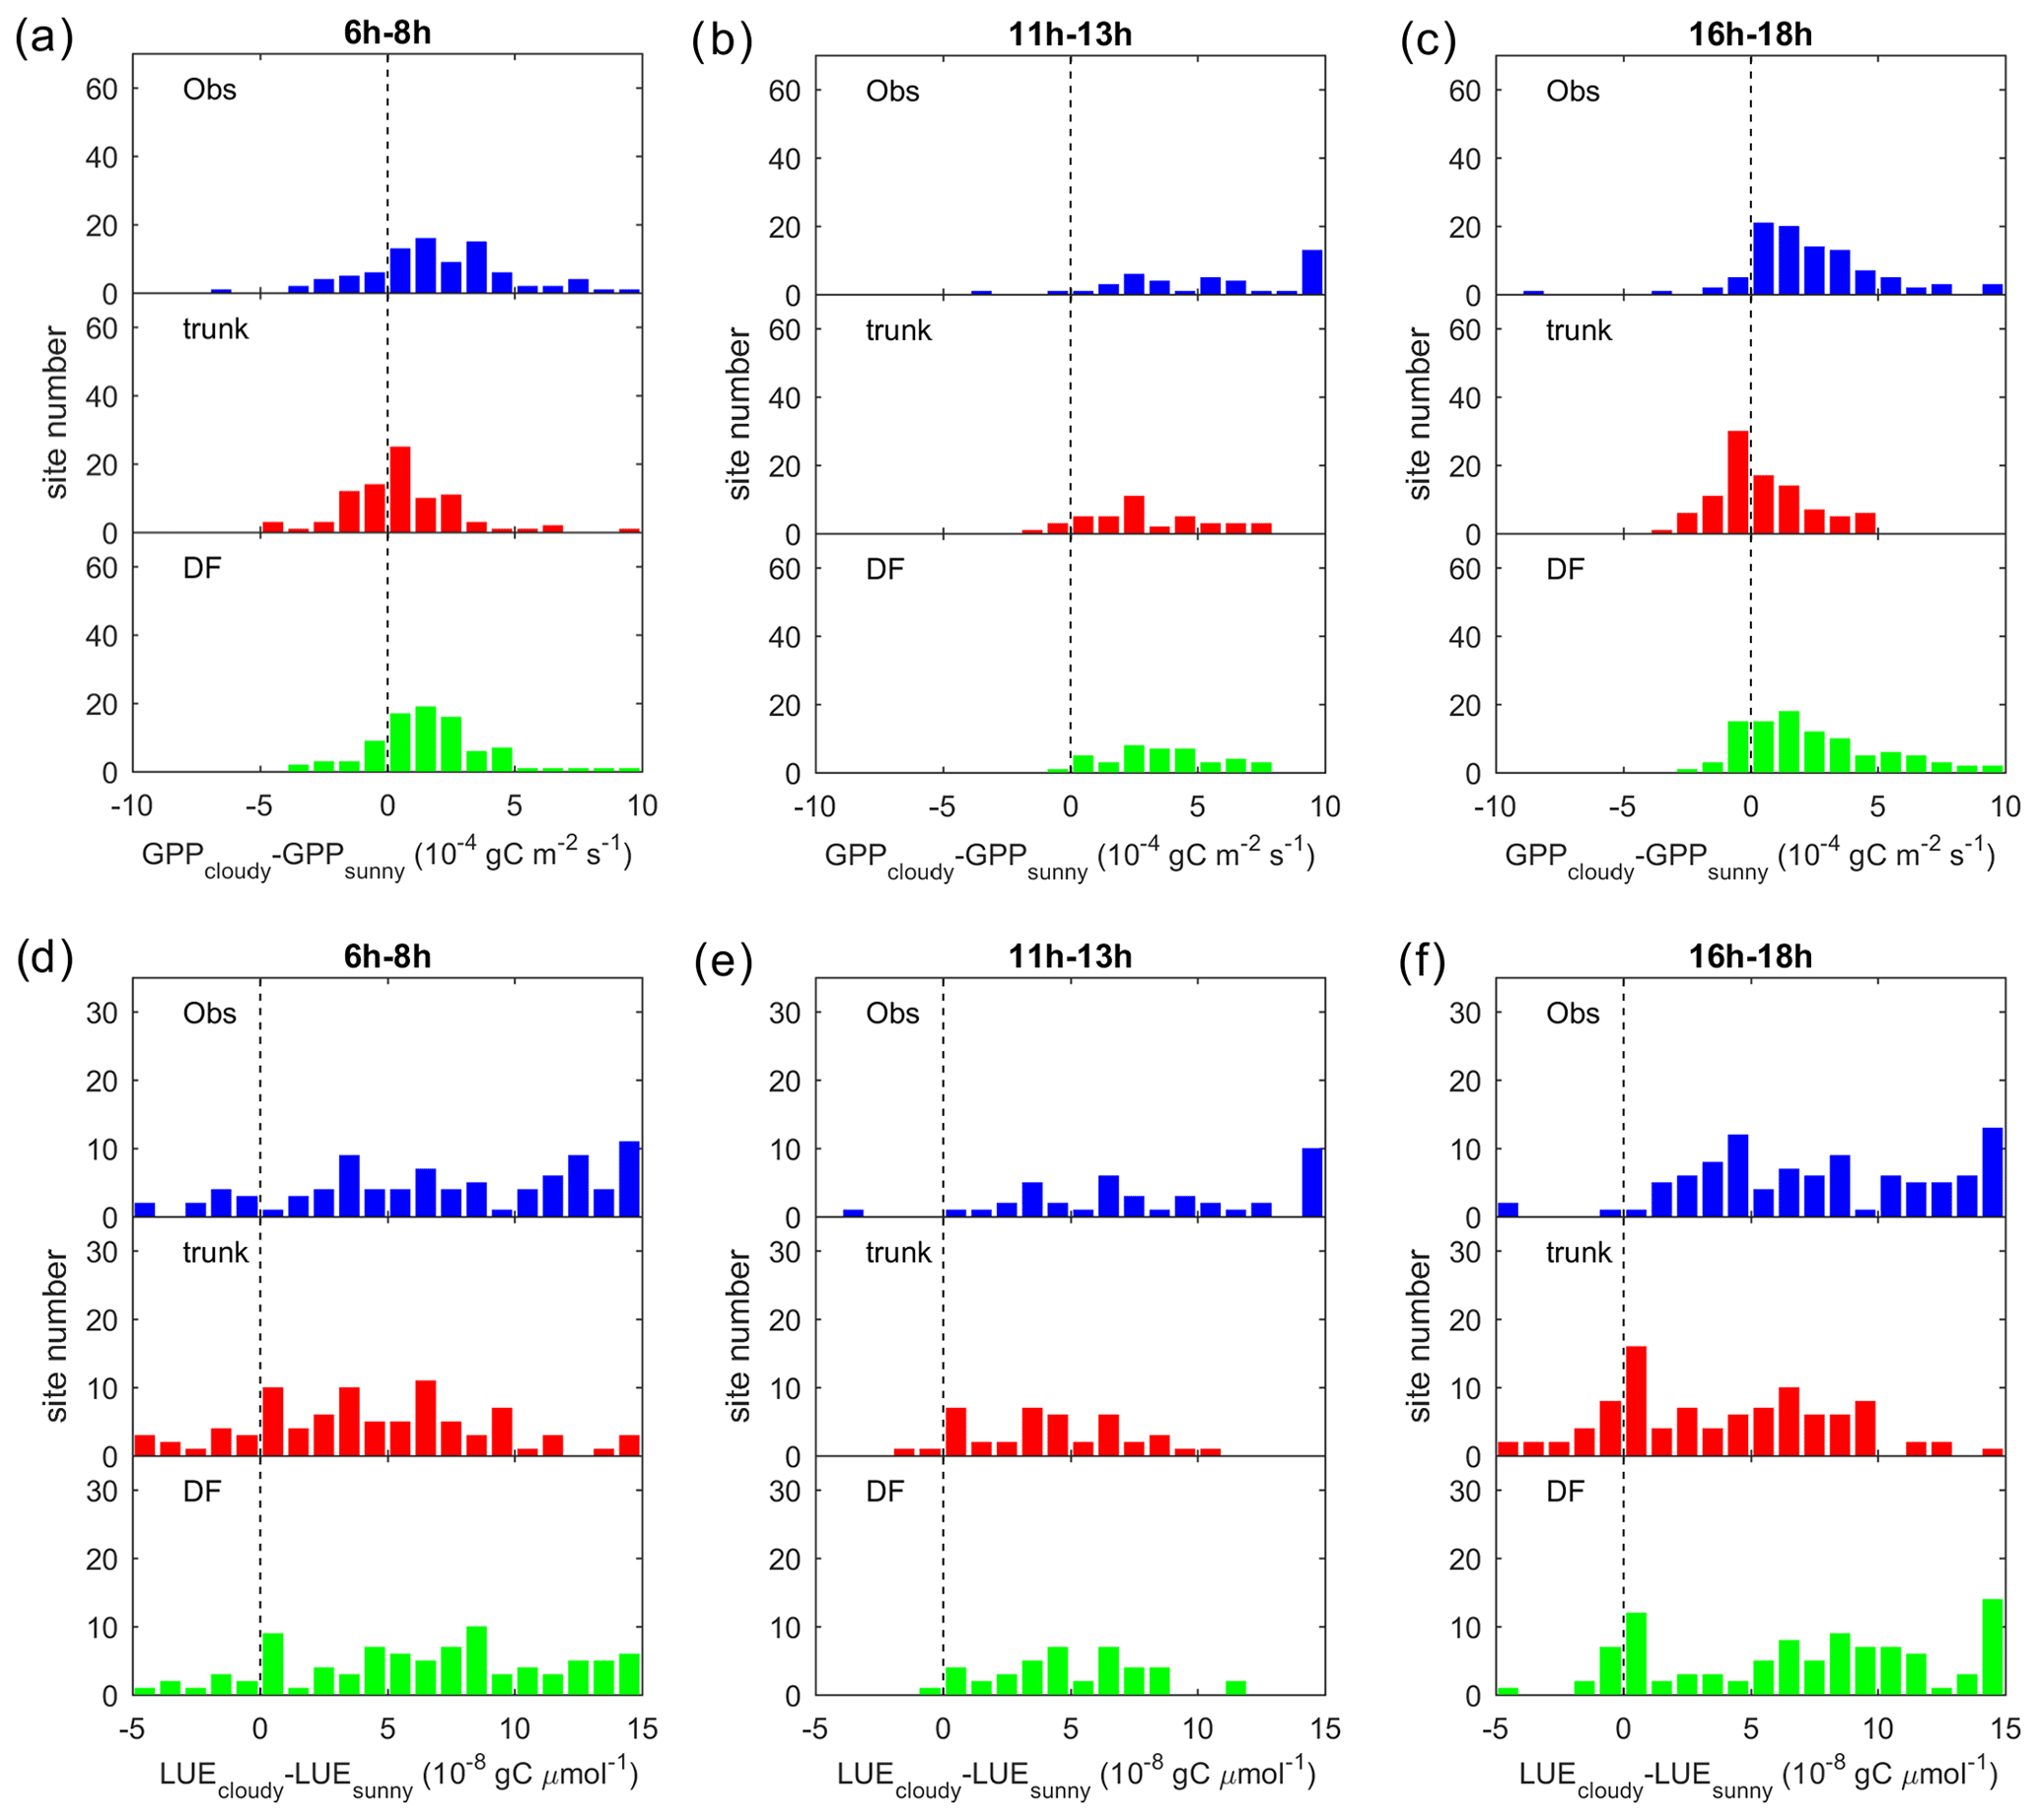
We further refined this analysis to investigate if the effects of diffuse light differ at different times of the day (Fig. 7). Results for three different periods of the day show that cloudy conditions result in a higher GPP of 0– gC m−2 s−1 than sunny conditions at most sites in the morning and afternoon, which is generally captured by ORCHIDEE_DF but missed by ORCHIDEE trunk in the morning (Fig. 6a, c). At midday, due to the dependence of Fdf on the PPFD (Eqs. 25, 26), we fail at many sites to find PPFD levels where sunny and cloudy conditions coexist. Nevertheless, the result generally indicates larger midday ΔGPP than those in the morning and afternoon, although the modeled ΔGPP is slightly smaller than the observation. It should be noted that this large difference is captured by both ORCHIDEE_DF and ORCHIDEE trunk (Fig. 7b). Because direct and diffuse light are not distinguished in ORCHIDEE trunk, this midday ΔGPP should be mainly contributed by environmental factors other than the diffuse light fraction. The underestimation of midday ΔGPP could be a result of error in the current ORCHIDEE parameterizations. The ΔLUE derived by ORCHIDEE_DF also shows a largely similar distribution to that in the observations, but ORCHIDEE trunk underestimates the morning and afternoon ΔLUE (Fig. 7d, e, f).
3.4 Interactions between diffuse light and environmental factors
As implied by Fig. 7, the diffuse light fraction is not the only factor causing ΔGPP; other possible factors include temperature and the VPD (Gu et al., 2002; Cheng et al., 2015; Li et al., 2014). Thus, we investigate the diffuse light effect along temperature and VPD gradients in Fig. 8. To remove the effect of PPFD level, we only show ΔLUE.
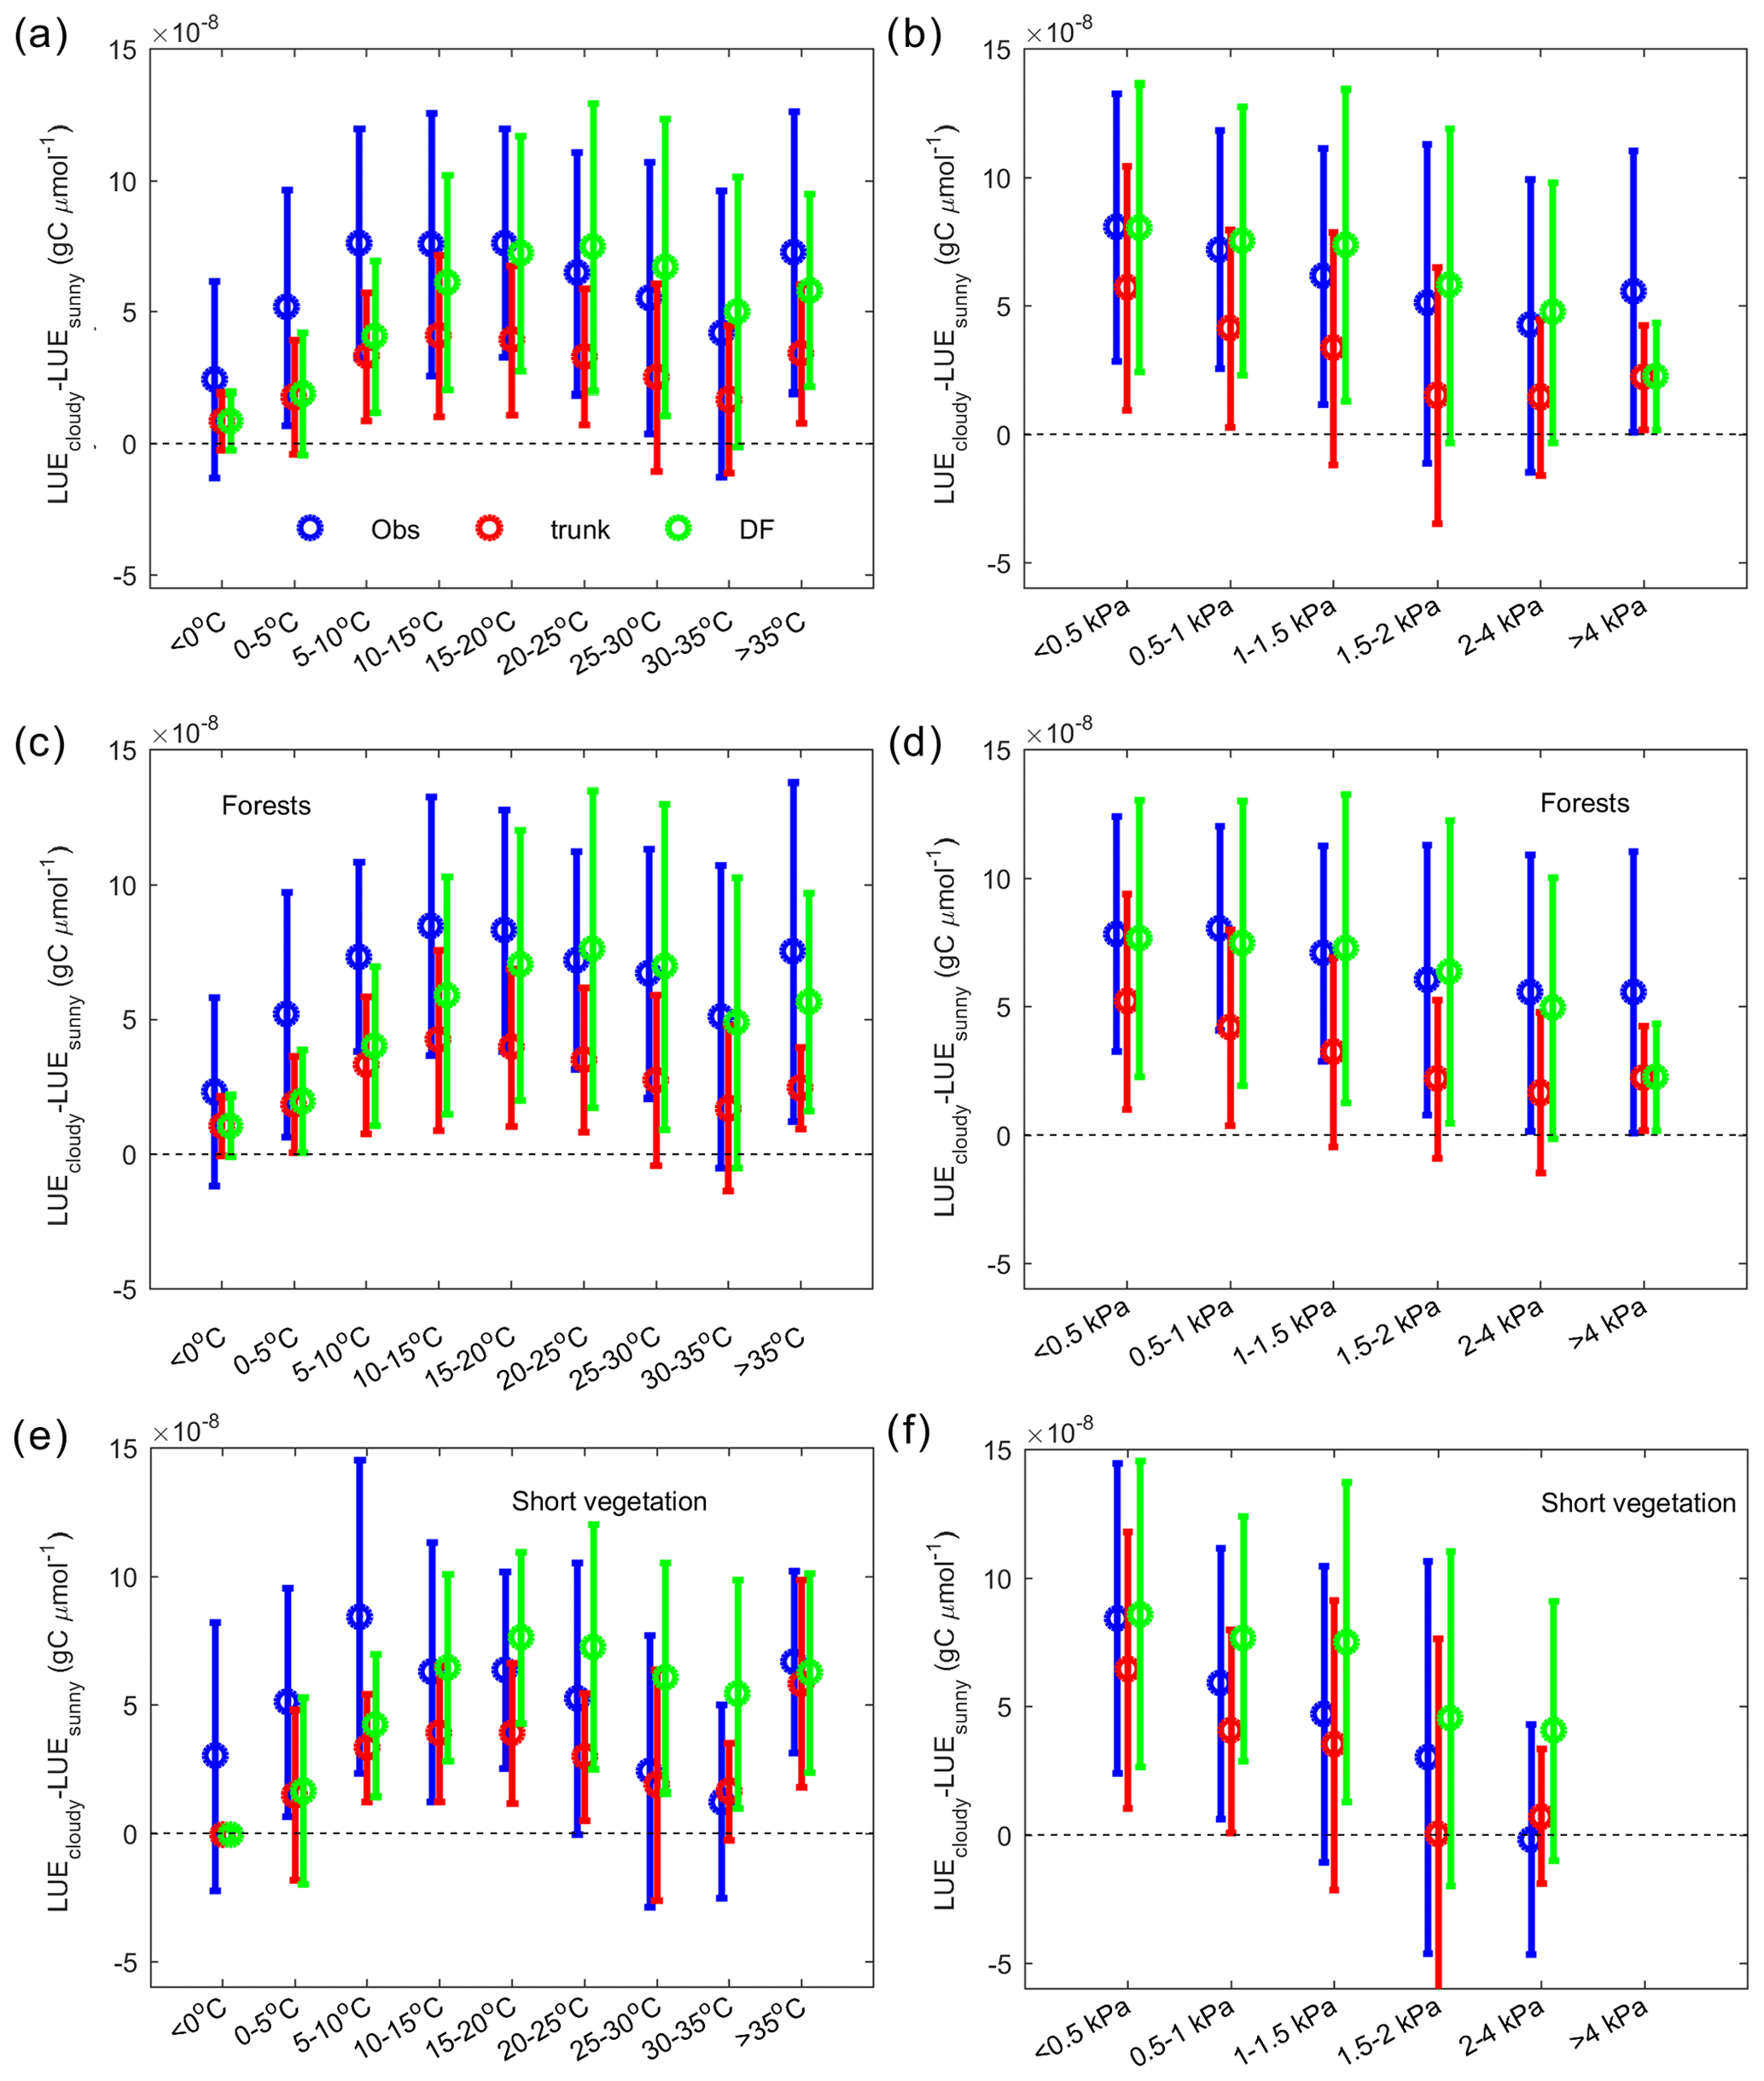
Figure 8The dependence of the LUE difference between cloudy and sunny conditions on climate factors. In the observations (blue), ORCHIDEE trunk (red) and ORCHIDEE_DF (green), the average and error bars indicate statistics of site-level means. (a) The dependence of the LUE difference on temperature. (b) The dependence of the LUE difference on VPD. Panels (c) and (e) are the same as panel (a) but for forest sites and short vegetation (grasslands and croplands) sites only. Panels (d) and (f) are the same as panel (b) but for forest sites and short vegetation sites only.
ΔLUE shows a unimodal curve along the temperature gradient for the observations and the two models (Fig. 8a). At low temperature, both models indicate a very low ΔLUE of 1 gC µmol−1, which is about one-third of the ΔLUE derived from observations. With increasing temperature, the observed ΔLUE shows a maximum at 10–20 ∘C, with a magnitude of gC µmol−1 and declines slightly at higher temperatures. The peak of ΔLUE simulated by ORCHIDEE_DF has a magnitude comparable to that of observations but at a higher temperature (20–25 ∘C) than for the observations. The ΔLUE simulated by ORCHIDEE trunk is much smaller, with a peak of gC µmol−1 at 10–15 ∘C.
The effect of the VPD on ΔLUE is shown in Fig. 8b. For observations and both model simulations, a monotonic decreasing trend of ΔLUE along the VPD gradient is found. The ΔLUE from observations and ORCHIDEE_DF show a comparable magnitude, from gC µmol−1 at VPD < 0.5 kPa to gC µmol−1 at a 2–4 kPa VPD level. The ΔLUE simulated by ORCHIDEE trunk is smaller than observations.
Apart from environmental factors, the effects of diffuse light may also differ among PFTs because different PFTs have different canopy structures and photosynthetic parameters (e.g., Vcmax). Here, we analyzed the ΔLUE in forests and short vegetation (grasslands and croplands) separately (Fig. 8c, d, ,e, f). In forests (Fig. 8c, d), ORCHIDEE_DF underestimates ΔLUE at temperatures lower than 20 ∘C; it also largely captures the observed ΔLUE trend with VPD. ORCHIDEE trunk, in comparison, underestimates ΔLUE in all cases. Compared with forests, observations in short vegetation (Fig. 8e, f) show a stronger decline of ΔLUE at high temperatures (> 25 ∘C) and high VPD conditions (> 0.5 kPa). However, for ORCHIDEE_DF, the short vegetation ΔLUE remains as high as for forests.
Figure 9 shows the distribution of ΔLUE in the temperature–VPD dimensions. Observations indicate that the largest ΔLUE is reached under conditions when temperature is in the range from 5 to 20 ∘C and the VPD < 1 kPa (Fig. 9a). This temperature is thought to be more favorable for photosynthesis, as it is generally consistent with the photosynthesis optimum temperature detected by Huang et al. (2019) at latitudes where most of the sites are located. Under these conditions, the ΔLUE is usually over gC µmol−1. When the temperature is lower than 5 ∘C or higher than 20 ∘C or when the VPD becomes larger than 1 kPa, ΔLUE tends to decline. Compared with observations, the ΔLUE simulated by ORCHIDEE_DF shows a similar decreasing trend with VPD at all temperature levels (Fig. 9c); however, no obvious decline in ΔLUE is found at high temperatures. The ΔLUE simulated by ORCHIDEE trunk is much smaller than that for the observations (Fig. 9b).
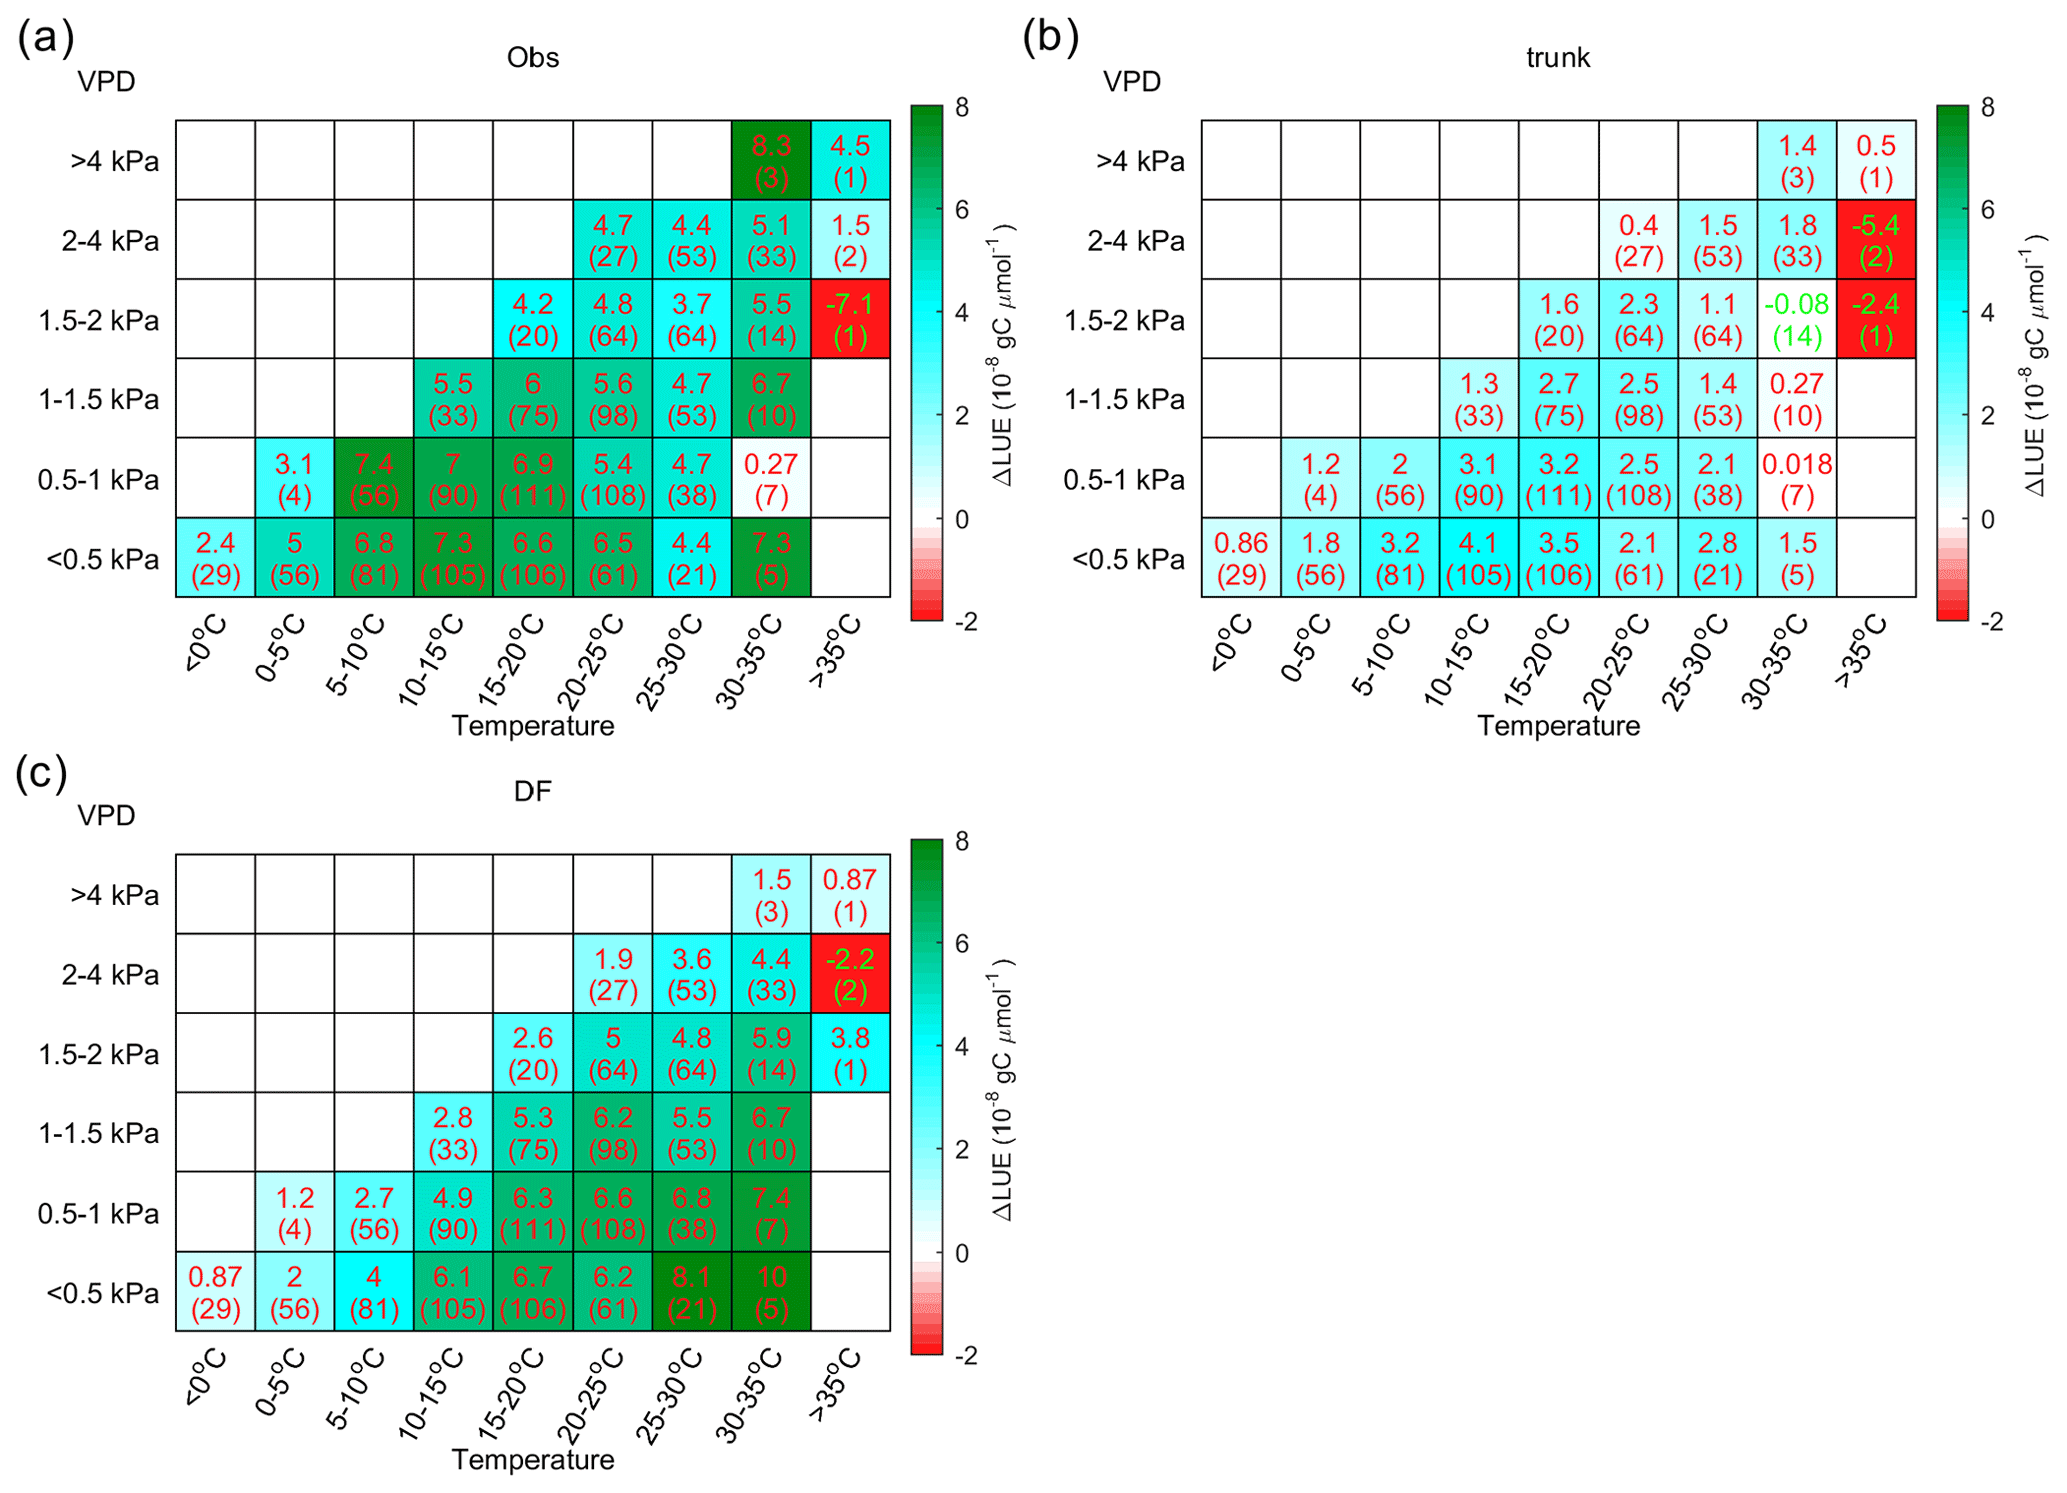
Figure 9The distribution of the LUE difference between cloudy and sunny conditions (ΔLUE) in the temperature–VPD field. The upper numbers in each grid square indicate the average of the site-level ΔLUE, while the numbers in parentheses indicate the number of sites with valid data. Panel (a) shows the ΔLUE based on observations, panel (b) shows the ΔLUE based on ORCHIDEE trunk, and panel (c) shows the ΔLUE based on ORCHIDEE_DF.
The ΔLUE from forests and short vegetation are shown separately in Fig. 10. Based on site-level observations (Fig. 10a), both vegetation types show a larger ΔLUE at lower VPD values between 5 and 20 ∘C. In forests, there is also large ΔLUE under high temperature conditions, which mainly occurs in tropical forests (Fig. S3). Nevertheless, ORCHIDEE_DF still overestimates the ΔLUE at high temperatures (Fig. 10e), which is mainly due to the overestimation of ΔLUE at high temperatures for temperate forests (Fig. S3).
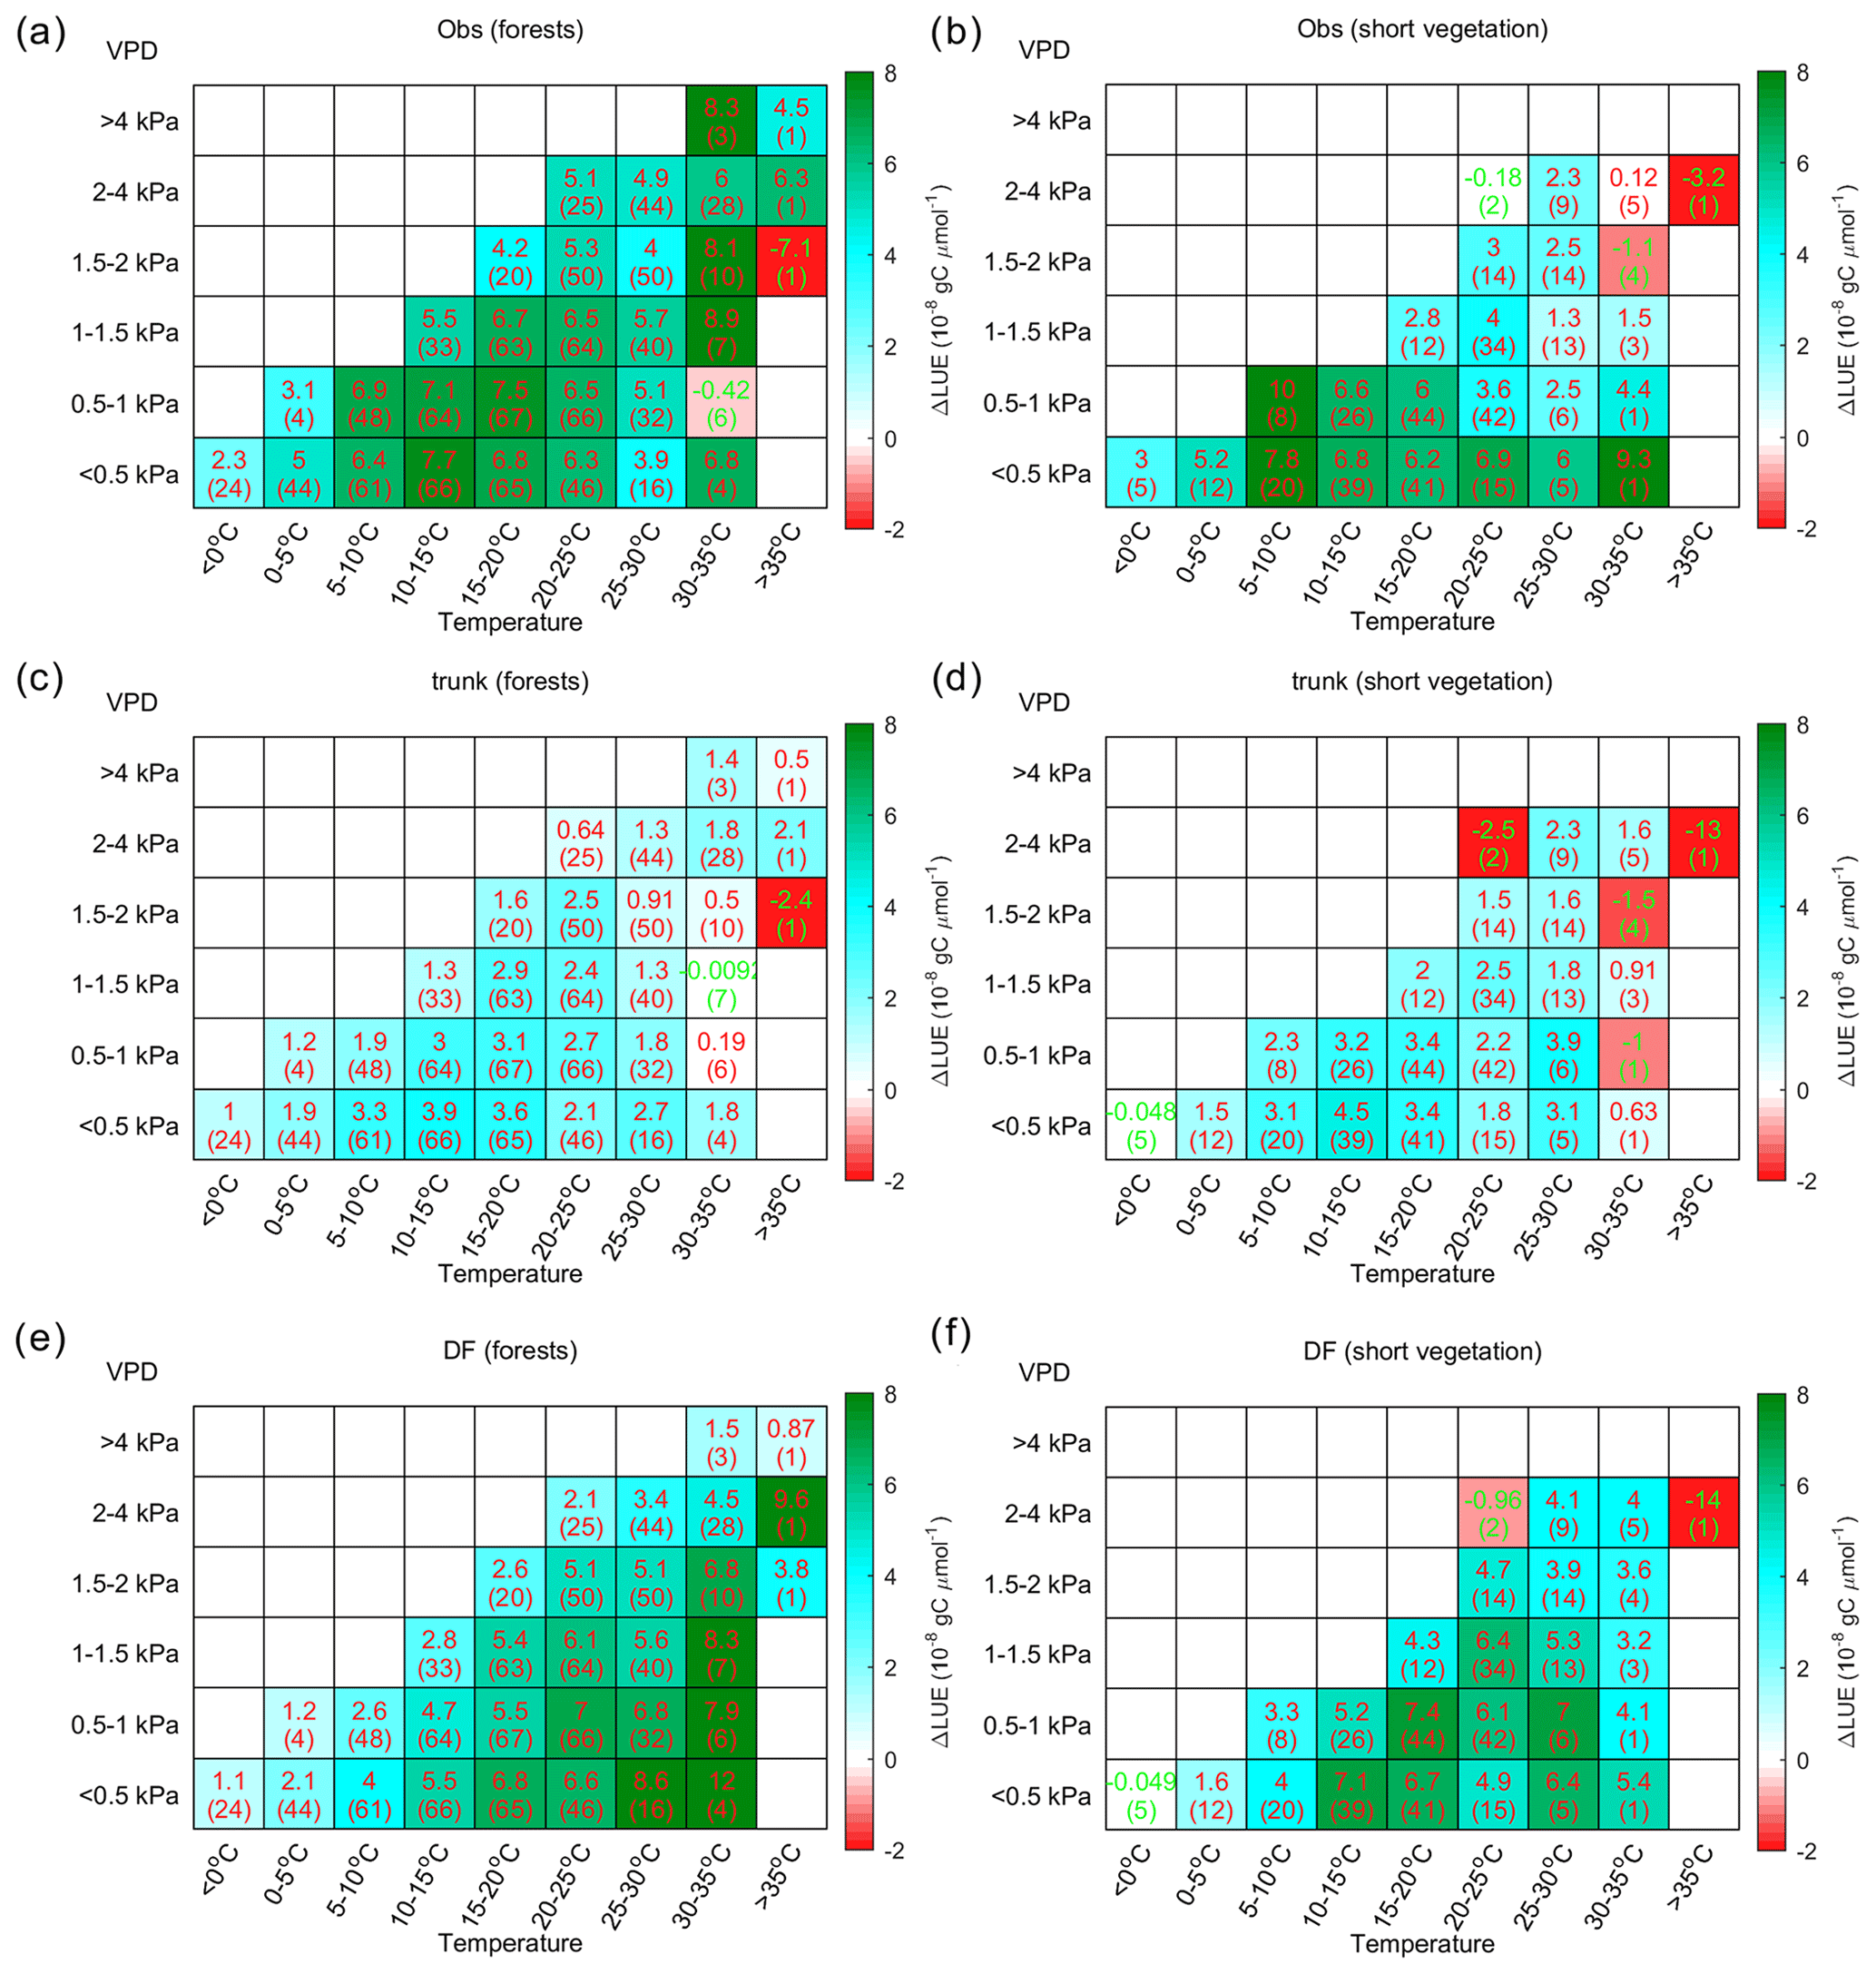
Compared with forests, short vegetation shows a much stronger decline in ΔLUE at higher VPD levels (Fig. 10b); however, it is not well captured by ORCHIDEE_DF (Fig. 10f). In most cases, ORCHIDEE trunk tends to strongly underestimate ΔLUE unless the observed ΔLUE is small or negative (e.g., VPD > 2 kPa for short vegetation).
4.1 Improvement of ORCHIDEE_DF
The role of diffuse light on photosynthesis has been found and modeled in different vegetation types (Gu et al., 2003; Niyogi et al., 2004; Misson et al., 2005; Alton et al., 2007b; Knohl and Baldocchi, 2008; Mercado et al. 2009; Oliphant et al., 2011; Kanniah et al., 2013; Williams et al., 2014; Cheng et al., 2015; Wang et al., 2018). However, very few studies have attempted to account for the diffuse light effect in a global land surface model, and fewer studies have used large FLUXNET datasets for evaluation. Here, by using flux observations from 159 sites over the globe, we show that – by separating the direct and diffuse light – ORCHIDEE_DF improves the simulation of GPP under sunny conditions and, more importantly, reproduces the observed impacts of diffuse light on GPP and LUE for most of the PFTs (Figs. 4, ,5, 6). Under cloudy conditions, ORCHIDEE_DF seems to perform slightly worse than ORCHIDEE trunk (Fig. 4). However, it should be noted that ORCHIDEE_DF has not been recalibrated, and all parameters are those from ORCHIDEE trunk despite the substantial changes in the code with respect to light partitioning and canopy light transmission. Furthermore, the GPP simulated by ORCHIDEE trunk shows different GPP SD biases under sunny and cloudy conditions, whereas ORCHIDEE_DF gives a more systematically underestimated GPP SD, which should be more easily corrected in a future calibration. The site-level comparison (Fig. 5) also explains how ORCHIDEE_DF reproduces the GPP increase compared with ORCHIDEE trunk. At most sites, the GPP simulated by the two models shows a similar magnitude under cloudy conditions, but the GPP simulated by ORCHIDEE_DF is significantly smaller under sunny conditions. This is because all light is considered to be diffuse light and is evenly distributed in each leaf layer in the one-stream canopy light transmission model in ORCHIDEE trunk. This simplified approach to the modeling of the light distribution leads to larger GPP under sunny conditions because the effect of light saturation on sunlit leaves is ignored. As ORCHIDEE trunk was calibrated using both sunny and cloudy data, but ORCHIDEE_DF corrected the overestimation under sunny conditions, ORCHIDEE_DF may give an overall underestimation using current parameters.
4.2 Factors affecting the response of GPP to diffuse light
Although diffuse light can increase the photosynthesis of shaded leaves, the GPP increase under cloudy conditions is not contributed solely by this effect. A recent field study suggested that photosynthesis from part of the canopy (especially sunlit leaves) benefits from the lower VPD rather than the higher diffuse light fraction under cloudier conditions (Wang et al., 2018). Our results show that higher diffuse PAR fraction is the main factor causing larger GPP under cloudy conditions compared with sunny conditions during the morning and the afternoon, as only ORCHIDEE_DF reproduced the observed positive ΔGPP during the two periods (Fig. 7). At midday, in comparison, the larger GPP under cloudy conditions should be mainly due to lower temperature or VPD rather than due to diffuse light, because ORCHIDEE trunk, which does not simulate the diffuse light effect, also reproduces this effect (Fig. 7). A similar effect is also reported by Cheng et al. (2015), who found that the midday GPP increase under cloudier conditions in croplands is mainly caused by lower temperature and lower VPD rather than by diffuse light. Photosynthesis is often considered to be limited by either carboxylation or electron transportation (Farquhar et al., 1980). It is when the shaded leaf photosynthesis is limited by light that diffuse light can increase GPP. At midday, large VPD values may cause stomatal closure, leading to a carboxylation-limited photosynthesis. Our results imply that it might be important to consider the diurnal cycle of environmental factors to better understand the effect of diffuse light.
It should be noted that the covariation of environmental factors with more diffuse light under cloudier conditions does not always benefit photosynthesis. For instance, if vegetation is cold stressed under cooler conditions, the decrease in temperature under cloudier conditions may strengthen this stress and offset the effect of diffuse light. Our analyses indicate that the effect of diffuse light on photosynthesis is weakened under most stressed conditions (Figs. 9, 10).
Another important factor is the light itself. When there is no light saturation of shaded leaves, under the same diffuse light fraction, stronger light levels are likely to benefit the shaded leaves more, resulting in higher ΔGPP (Fig. 5; ΔGPP tends to be larger at higher PPFD level at most sites). Nevertheless, apart from GPP, we also investigated the LUE (the photosynthesis per unit PPFD), which has removed this effect.
Besides environmental factors, canopy structure is also very important. Theoretically, thicker canopies with a large LAI tend to be more sensitive to diffuse light because a larger fraction of leaves are light limited due to shading (Fig. 1). As expected, ORCHIDEE_DF has shown an increasing ΔLUE with LAI (Fig. 11). However, the analyses based on LAI observations suggested a very weak positive effect of LAI on ΔLUE (Fig. 11). This insensitive response of ΔLUE to the LAI detected here should be treated with caution because the LAI observations are not well defined (maximum or average) and remain very limited in the current FLUXNET dataset (less than 10 in each LAI interval). Using more detailed LAI and CO2 flux observations, Wohlfahrt et al. (2008) clearly exhibited the influence of LAI on diffuse light-induced photosynthesis changes in a grassland.

4.3 Uncertainty and limitations
Many empirical methods have been proposed to partition solar radiation into diffuse and direct light (e.g., Spitters et al., 1986; Weiss and Norman, 1985; Erbs et al., 1982). However, biases remain in the predicted diffuse light fraction under all aerosol and cloud conditions, which inevitably introduce some uncertainties to our analyses. Nevertheless, such methods are currently the most feasible approach at the flux site level. More continuous measurements of direct and diffuse surface radiation at more sites are desirable.

Another source of uncertainty is from the light transmission model. In ORCHIDEE_DF, we used a two-stream radiative transfer approximation. In this model, the canopy trait parameters such as leaf scattering, leaf orientation and leaf clumping factors are assumed to be the same for all PFTs; however, real canopies are very diverse (Smith et al., 2004). In situ observations are required to obtain better parameters. Furthermore, the validity of the light transmission model in ORCHIDEE_DF depends on several assumptions described in Sect. 2.1. These assumptions are not always valid; for example, because direct solar beams are not exact parallels, leaves in canopies are not always sunlit or shaded, and they may also fall in penumbra regions, (i.e., regions where only part of the incoming direct solar beams are blocked; Smith et al., 1989; Cescatti and Niinemets, 2004). These more complex processes should be considered in future model development. Nevertheless, our simplified light transmission already succeeds at reproducing the observed diffuse light impact.
There are other sources of uncertainties in complex land surface models. Although ORCHIDEE_DF reproduces the magnitude of the diffuse light effects, it fails to reproduce the response of ΔLUE to temperature. For all PFTs, ORCHIDEE_DF underestimates the ΔLUE at low temperatures, and it overestimates ΔLUE at high temperatures (Fig. 8). The low temperature underestimation is also found in ORCHIDEE trunk, indicating that the models may have underestimated the tolerance of plants to low temperatures, whereas ORCHIDEE_DF tends to underestimate the impact of heat stress at high temperatures. This bias might be due to the parameterization of temperature acclimation which is based on observations mainly from a narrow temperature range (11–29 ∘C) (Kattge and Knorr, 2007). For short vegetation, the introduction of diffuse light into the model results in an increase in ΔLUE at high temperatures and high VPD (Figs. 8, 10), indicating that the vegetation simulated by ORCHIDEE trunk remains light limited under such conditions. However, the strong decreasing trend of the observed ΔLUE along temperature and VPD gradients indicates heat and VPD stress. This implies that parameters in the current ORCHIDEE version may have underestimated the response of grassland and cropland photosynthesis to heat and VPD stress.
Besides the possible bias in parameters, both ORCHIDEE trunk and ORCHIDEE_DF lack a representation of the response of leaf temperature to radiation. Instead, the air temperature is used directly to represent the leaf temperature throughout the canopy for simulating gas exchange processes in the current model. As shown by Chen and Zhuang (2014), the changes in the radiation regime due to aerosols can significantly affect leaf temperature, which could potentially affect GPP. For now, ORCHIDEE_DF remains incapable of dealing with this response of leaf temperature. Further developments are needed to disentangle the role of leaf temperature and diffuse light on GPP.
In this study, we added a module to partition the downward surface solar radiation into diffuse and direct components as well as a new canopy radiative transfer model, which separates the existing multilayer canopy into sunlit and shaded leaves, to the ORCHIDEE trunk model. The resulting new land surface model, ORCHIDEE_DF, is evaluated using the La Thuile flux dataset over 159 sites comprising 11 PFTs. Compared with ORCHIDEE trunk, ORCHIDEE_DF improves the GPP simulation under sunny conditions. This improvement successfully reproduces the observed enhancement of GPP under cloudier conditions at most of the sites.
Using observed and modeled GPP, we found an increase in GPP under cloudier conditions at all times of the day; however, the mechanisms causing this effect are different at midday from the morning and afternoon. During morning and afternoon, the increase in GPP is mainly caused by increased diffuse light fraction, whereas the GPP increase is mainly due to weaker stress from temperature and VPD at midday.
Observations indicate that the maximum LUE difference can be over gC µmol−1 under cloudy and sunny conditions for the same light level. The maximum LUE is found at temperature and VPD conditions more favorable for photosynthesis (5–20 ∘C for temperature and < 1 kPa for VPD). With increasing VPD or under lower or higher temperatures, the LUE may decrease. Compared with observations, ORCHIDEE_DF underestimates the diffuse light effect at low temperature and overestimates it at high temperatures, possibly due to imperfect temperature acclimation parameterization in the current ORCHIDEE model. In grasslands and croplands, ORCHIDEE_DF overestimates the diffuse light effect on LUE, which might be due to an overestimation of their tolerance to dry conditions.
As ORCHIDEE_DF is a land surface model which is able to capture the effect of diffuse light for a large number of sites over the globe, we are confident that, with this improved model framework and proper calibration, we can investigate the effect of aerosols on global biogeochemical cycles and assess the impact of aerosol emission policies and aerosol-related climate engineering on such cycles.
| Fdf | Fraction of diffuse radiation |
| GPP | Gross primary production |
| LAI | Leaf area index |
| LSM | Land surface model |
| LUE | Light use efficiency |
| NIR | Near-infrared radiation |
| PAR | Photosynthetically active radiation |
| PFT | Plant functional type |
| PPFD | Photosynthetic photon flux density |
| SW | Downward shortwave radiation at the top of canopy |
| TOA | Top of atmosphere |
| TOC | Top of canopy |
| VPD | Vapor pressure deficit |
The ORCHIDEE_DF model code is available at https://doi.org/10.14768/20200407003.1 (Zhang, 2020). The flux data (La Thuile) used in this study are available at https://fluxnet.fluxdata.org/data/la-thuile-dataset/ (Fluxdata, 2017).
The supplement related to this article is available online at: https://doi.org/10.5194/gmd-13-5401-2020-supplement.
PC, OB and LL designed the project. YZ developed the model code with help from AB, FM, DG and AC. NV provided the code for data gap filling. YZ prepared the paper with contributions from all co-authors.
The authors declare that they have no conflict of interest.
The authors are very grateful to the FLUXNET communities for their efforts with respect to making the sites and collecting data. We would especially like to thank the flux site PIs who are not in the author list but have given constructive suggestions on this paper. The authors also acknowledge Yves Balkanski and Nicolas Viovy for their suggestions during this work.
This research has been supported by the European Research Council (grant no. SyG-2013-610028), the ANR CLAND Convergence Institute (grant no. 16-CONV-0003), the ANR China Trend Stream and the new 4C project. Bogdan Chojnicki was supported by the National Science Foundation, Poland (grant no. UMO-2017/27/B/ST10/02228), within the framework of the “Carbon dioxide uptake potential of sphagnum peatlands in the context of atmospheric optical parameters and climate changes” (KUSCO2) project.
This paper was edited by Gerd A. Folberth and reviewed by two anonymous referees.
Alton, P., North, P., and Los, S.: The impact of diffuse sunlight on canopy light-use efficiency, gross photosynthetic product and net ecosystem exchange in three forest biomes, Global Change Biol., 13, 776–787, 2007a.
Alton, P., Ellis, R., Los, S., and North, P.: Improved global simulations of gross primary product based on a separate and explicit treatment of diffuse and direct sunlight, J. Geophys. Res.-Atmos., 112, D07203, https://doi.org/10.1029/2006JD008022, 2007b.
Baldocchi, D. D. and Wilson, K. B.: Modeling CO2 and water vapor exchange of a temperate broadleaved forest across hourly to decadal time scales, Ecol. Model., 142, 155–184, 2001.
Ball, J. T., Woodrow, I. E., and Berry, J. A.: A Model Predicting Stomatal Conductance and its Contribution to the Control of Photosynthesis under Different Environmental Conditions, in: Progress in Photosynthesis Research: Volume 4 Proceedings of the VIIth International Congress on Photosynthesis Providence, Rhode Island, USA, 10–15 August 1986, edited by: Biggins, J., Springer Netherlands, Dordrecht, 221–224, 1987.
Bodin, P. and Franklin, O.: Efficient modeling of sun/shade canopy radiation dynamics explicitly accounting for scattering, Geosci. Model Dev., 5, 535–541, https://doi.org/10.5194/gmd-5-535-2012, 2012.
Bonan, G. B., Oleson, K. W., Fisher, R. A., Lasslop, G., and Reichstein, M.: Reconciling leaf physiological traits and canopy flux data: Use of the TRY and FLUXNET databases in the Community Land Model version 4, J. Geophys. Res.-Biogeo., 117, G02026, https://doi.org/10.1029/2011JG001913, 2012.
Cescatti, A. and Niinemets, U.: Light harvesting: from leaf to landscape, in: Photosynthetic adaptation. Chloroplast to landscape. Ecological studies, edited by: Smith, W. K., Chritchley, C., and Vogelmann, T., Springer, Berlin, Heidelberg, 178, 42–85, 2004.
Chen, L., Yan, G., Wang, T., Ren, H., Calbó, J., Zhao, J., and McKenzie, R.: Estimation of surface shortwave radiation components under all sky conditions: Modeling and sensitivity analysis, Remote Sens. Environ., 123, 457–469, 2012.
Chen, M. and Zhuang, Q.: Evaluating aerosol direct radiative effects on global terrestrial ecosystem carbon dynamics from 2003 to 2010, Tellus B, 66, 21808, https://doi.org/10.3402/tellusb.v66.21808, 2014.
Cheng, S. J., Bohrer, G., Steiner, A. L., Hollinger, D. Y., Suyker, A., Phillips, R. P., and Nadelhoffer, K. J.: Variations in the influence of diffuse light on gross primary productivity in temperate ecosystems, Agr. Forest Meteorol., 201, 98–110, 2015.
Ciais, P., Sabine, C., Bala, G., Bopp, L., Brovkin, V., Canadell, J., Chhabra, A., DeFries, R., Galloway, J., Heimann, M., Jones, C., Le Quéré, C., Myneni, R. B., Piao, S., and Thornton, P.: Carbon and other biogeochemical cycles, in Climate change 2013: the physical science basis. Contribution of Working Group I to the Fifth Assessment Report of the Intergovernmental Panel on Climate Change, Cambridge University Press, Cambridge, United Kingdom and New York, NY, USA, 465–570, 2013.
Dai, Y., Dickinson, R. E., and Wang, Y.-P.: A two-big-leaf model for canopy temperature, photosynthesis, and stomatal conductance, J. Climate, 17, 2281–2299, 2004.
de Pury, D. and Farquhar, G.: Simple scaling of photosynthesis from leaves to canopies without the errors of big-leaf models, Plant Cell Environ., 20, 537–557, 1997.
Dye, D. G.: Spectral composition and quanta-to-energy ratio of diffuse photosynthetically active radiation under diverse cloud conditions, J. Geophys. Res.-Atmos., 109, D10203, https://doi.org/10.1029/2003JD004251, 2004.
Erbs, D., Klein, S., and Duffie, J.: Estimation of the diffuse radiation fraction for hourly, daily and monthly-average global radiation, Sol. Energ., 28, 293–302, 1982.
Farquhar, G. D., von Caemmerer, S., and Berry, J.: A biochemical model of photosynthetic CO2 assimilation in leaves of C3 species, Planta, 149, 78–90, 1980.
Fluxdata: La Thuile synthesis dataset, available at: https://fluxnet.fluxdata.org/data/la-thuile-dataset/ (last access: 1 November 2020), 2017.
Goudriaan, J.: Crop micrometeorology: a simulation study, Pudoc, Wageningen, the Netherlands, 1977.
Goudriaan, J.: Potential production processes, in Simulation of plant growth and crop production, Pudoc, Wageningen, the Netherlands, 98–113, 1982.
Gu, L., Baldocchi, D., Verma, S. B., Black, T., Vesala, T., Falge, E. M., and Dowty, P. R.: Advantages of diffuse radiation for terrestrial ecosystem productivity, J. Geophys. Res.-Atmos., 107, ACL 2-1–ACL 2-23, 2002.
Gu, L., Baldocchi, D. D., Wofsy, S. C., Munger, J. W., Michalsky, J. J., Urbanski, S. P., and Boden, T. A.: Response of a deciduous forest to the Mount Pinatubo eruption: Enhanced photosynthesis, Science, 299, 2035–2038, 2003.
Hikosaka, K., Niinemets, U., and Anten, N. P.: Canopy photosynthesis: from basics to applications, Springer, https://doi.org/10.1007/978-94-017-7291-4, 2016.
Howell, T., Meek, D., and Hatfield, J.: Relationship of photosynthetically active radiation to shortwave radiation in the San Joaquin Valley, Agr. Meteorol., 28, 157–175, 1983.
Huang, M., Piao, S., Ciais, P., Peñuelas, J., Wang, X., Keenan, T. F., Peng, S., Berry, J. A., Wang, K., Mao, J., Alkama, R., Cescatti, A., Cuntz, M., De Deurwaerder, H., Gao, M., He, Y., Liu, Y., Luo, Y., Myneni, R. B., Niu, S., Shi, X., Yuan, W., Verbeeck, H., Wang, T., Wu, J., and Janssens, I. A.: Air temperature optima of vegetation productivity across global biomes, Nat. Ecol. Evolut, 3, 772–779, https://doi.org/10.1038/s41559-019-0838-x, 2019.
Kanniah, K. D., Beringer, J., and Hutley, L.: Exploring the link between clouds, radiation, and canopy productivity of tropical savannas, Agr. Forest Meteorol., 182, 304–313, 2013.
Kattge, J. and Knorr, W.: Temperature acclimation in a biochemical model of photosynthesis: a reanalysis of data from 36 species, Plant Cell Environ., 30, 1176–1190, 2007.
Knohl, A. and Baldocchi, D. D.: Effects of diffuse radiation on canopy gas exchange processes in a forest ecosystem, J. Geophys. Res.-Biogeo., 113, G02023, https://doi.org/10.1029/2007JG000663, 2008.
Krinner, G., Viovy, N., de Noblet-Ducoudré, N., Ogée, J., Polcher, J., Friedlingstein, P., Ciais, P., Sitch, S., and Prentice, I. C.: A dynamic global vegetation model for studies of the coupled atmosphere-biosphere system, Global Biogeochem. Cy., 19, GB1015, https://doi.org/10.1029/2003GB002199, 2005.
Leuning, R., Kelliher, F. M., de Pury, D. G. G., and Schulze, E.-D.: Leaf nitrogen, photosynthesis, conductance and transpiration: scaling from leaves to canopies, Plant Cell Environ., 18, 1183–1200, 10.1111/j.1365-3040.1995.tb00628.x, 1995.
Le Quéré, C., Andrew, R. M., Friedlingstein, P., Sitch, S., Hauck, J., Pongratz, J., Pickers, P. A., Korsbakken, J. I., Peters, G. P., Canadell, J. G., Arneth, A., Arora, V. K., Barbero, L., Bastos, A., Bopp, L., Chevallier, F., Chini, L. P., Ciais, P., Doney, S. C., Gkritzalis, T., Goll, D. S., Harris, I., Haverd, V., Hoffman, F. M., Hoppema, M., Houghton, R. A., Hurtt, G., Ilyina, T., Jain, A. K., Johannessen, T., Jones, C. D., Kato, E., Keeling, R. F., Goldewijk, K. K., Landschützer, P., Lefèvre, N., Lienert, S., Liu, Z., Lombardozzi, D., Metzl, N., Munro, D. R., Nabel, J. E. M. S., Nakaoka, S., Neill, C., Olsen, A., Ono, T., Patra, P., Peregon, A., Peters, W., Peylin, P., Pfeil, B., Pierrot, D., Poulter, B., Rehder, G., Resplandy, L., Robertson, E., Rocher, M., Rödenbeck, C., Schuster, U., Schwinger, J., Séférian, R., Skjelvan, I., Steinhoff, T., Sutton, A., Tans, P. P., Tian, H., Tilbrook, B., Tubiello, F. N., van der Laan-Luijkx, I. T., van der Werf, G. R., Viovy, N., Walker, A. P., Wiltshire, A. J., Wright, R., Zaehle, S., and Zheng, B.: Global Carbon Budget 2018, Earth Syst. Sci. Data, 10, 2141–2194, https://doi.org/10.5194/essd-10-2141-2018, 2018.
Li, T., Heuvelink, E., Dueck, T., Janse, J., Gort, G., and Marcelis, L.: Enhancement of crop photosynthesis by diffuse light: quantifying the contributing factors, Ann. Bot.-London, 114, 145–156, 2014.
Malavelle, F. F., Haywood, J. M., Mercado, L. M., Folberth, G. A., Bellouin, N., Sitch, S., and Artaxo, P.: Studying the impact of biomass burning aerosol radiative and climate effects on the Amazon rainforest productivity with an Earth system model, Atmos. Chem. Phys., 19, 1301–1326, https://doi.org/10.5194/acp-19-1301-2019, 2019.
Medlyn, B. E., Duursma, R. A., Eamus, D., Ellsworth, D. S., Prentice, I. C., Barton, C. V. M., Crous, K. Y., de Angelis, P., Freeman, M., and Wingate, L.: Reconciling the optimal and empirical approaches to modelling stomatal conductance, Glob. Change Biol., 17, 2134–2144, https://doi.org/10.1111/j.1365-2486.2010.02375.x, 2011.
Meir, P., Kruijt, B., Broadmeadow, M., Barbosa, E., Kull, O., Carswell, F., Nobre, A., and Jarvis, P. G.: Acclimation of photosynthetic capacity to irradiance in tree canopies in relation to leaf nitrogen concentration and leaf mass per unit area, Plant Cell Environ., 25, 343–357, 10.1046/j.0016-8025.2001.00811.x, 2002.
Mercado, L. M., Bellouin, N., Sitch, S., Boucher, O., Huntingford, C., Wild, M., and Cox, P. M.: Impact of changes in diffuse radiation on the global land carbon sink, Nature, 458, 1014–1017, 2009.
Misson, L., Lunden, M., McKay, M., and Goldstein, A. H.: Atmospheric aerosol light scattering and surface wetness influence the diurnal pattern of net ecosystem exchange in a semi-arid ponderosa pine plantation, Agr. Forest Meteorol., 129, 69–83, 2005.
Monsi, M. and Saeki, T.: On the factor light in plant communities and its importance for matter production, Ann. Bot.-London, 95, 549–567, 2005.
Myneni, R. B., Ross, J., and Asrar, G.: A review on the theory of photon transport in leaf canopies, Agr. Forest Meteorol., 45, 1–153, 1989.
Niinemets, U., Kull, O., and Tenhunen, J. D.: An analysis of light effects on foliar morphology, physiology, and light interception in temperate deciduous woody species of contrasting shade tolerance, Tree Physiol., 18, 681–696, 1998.
Niyogi, D., Chang, H.-I., Saxena, V. K., Holt, T., Alapaty, K., Booker, F., Chen, F., Davis, K. J., Holben, B., Matsui, T., Meyers, T., Oechel, W. C., Pielke Sr., R. A., Wells, R., Wilson, K., and Xue, Y.: Direct observations of the effects of aerosol loading on net ecosystem CO2 exchanges over different landscapes, Geophys. Res. Lett., 31, L20506, https://doi.org/10.1029/2004gl020915, 2004.
Oleson, K. W., Lawrence, D. M., Bonan, G. B., Drewniak, B., Huang, M., Koven, C. D., Levis, S., Li, F., Riley, W. J., Subin, Z. M., Swenson, S. C., Thornton, P. E., Bozbiyik, A., Fisher, R., Heald, C. L., Kluzek, E., Lamarque, J.-F., Lawrence, P. J., Leung, L. R., Lipscomb, W., Muszala, S., Ricciuto, D. M., Sacks, W., Sun, Y., Tang, J., and Yang, Z.-L.: Technical Description of version 4.5 of the Community Land Model (CLM) (NCAR Technical Note No. NCAR/TN-503+STR). Citeseer, National Center for Atmospheric Research, P.O. Box 3000, Boulder, Colarado, 2013.
Oliphant, A., Dragoni, D., Deng, B., Grimmond, C., Schmid, H.-P., and Scott, S.: The role of sky conditions on gross primary production in a mixed deciduous forest, Agr. Forest Meteorol., 151, 781–791, 2011.
Piao, S., Ciais, P., Friedlingstein, P., de Noblet-Ducoudré, N., Cadule, P., Viovy, N., and Wang, T.: Spatiotemporal patterns of terrestrial carbon cycle during the 20th century, Global Biogeochem. Cy., 23, GB4026, https://doi.org/10.1029/2008GB003339, 2009.
Reichstein, M., Falge, E., Baldocchi, D., Papale, D., Aubinet, M., Berbigier, P., Bernhofer, C., Buchmann, N., Gilmanov, T., Granier, A., Grünwald, T., Havránková, K., Ilvesniemi, H., Janous, D., Knohl, A., Laurila, T., Lohila, A., Loustau, D., Matteucci, G., Meyers, T., Miglietta, F., Ourcival, J.-M., Pumpanen, J., Rambal, S., Rotenberg, E., Sanz, M., Tenhunen, J., Seufert, G., Vaccari, F., Vesala, T., Yakir, D., and Valentini, R.: On the separation of net ecosystem exchange into assimilation and ecosystem respiration: review and improved algorithm, Glob. Change Biol., 11, 1424–1439, https://doi.org/10.1111/j.1365-2486.2005.001002.x, 2005.
Roderick, M. L., Farquhar, G. D., Berry, S. L., and Noble, I. R.: On the direct effect of clouds and atmospheric particles on the productivity and structure of vegetation, Oecologia, 129, 21–30, 2001.
Saeki, T.: Interrelationships between leaf amount, light distribution and total photosynthesis in a plant community, Bot. Mag. Tokyo, 73, 55–63, 1960.
Sellers, P. J., Dickinson, R. E., Randall, D. A., Betts, A. K., Hall, F. G., Berry, J. A., Collatz, G. J., Denning, A. S., Mooney, H. A., Nobre, C. A., Sato, N., Field, C. B., and Henderson-Sellers, A.: Modeling the Exchanges of Energy, Water, and Carbon Between Continents and the Atmosphere, Science, 275, 502–509, https://doi.org/10.1126/science.275.5299.502, 1997.
Sitch, S., Huntingford, C., Gedney, N., Levy, P. E., Lomas, M., Piao, S. L., Betts, R., Ciais, P., Cox, P., Friedlingstein, P., Jones, C. D., Prentice, I. C., and Woodward, F. I.: Evaluation of the terrestrial carbon cycle, future plant geography and climate-carbon cycle feedbacks using five Dynamic Global Vegetation Models (DGVMs), Glob. Change Biol., 14, 2015–2039, https://doi.org/10.1111/j.1365-2486.2008.01626.x, 2008.
Sitch, S., Friedlingstein, P., Gruber, N., Jones, S. D., Murray-Tortarolo, G., Ahlström, A., Doney, S. C., Graven, H., Heinze, C., Huntingford, C., Levis, S., Levy, P. E., Lomas, M., Poulter, B., Viovy, N., Zaehle, S., Zeng, N., Arneth, A., Bonan, G., Bopp, L., Canadell, J. G., Chevallier, F., Ciais, P., Ellis, R., Gloor, M., Peylin, P., Piao, S. L., Le Quéré, C., Smith, B., Zhu, Z., and Myneni, R.: Recent trends and drivers of regional sources and sinks of carbon dioxide, Biogeosciences, 12, 653–679, https://doi.org/10.5194/bg-12-653-2015, 2015.
Smith, W. K., Knapp, A. K., and Reiners, W. A.: Penumbral effects on sunlight penetration in plant communities, Ecology, 70, 1603–1609, 1989.
Smith, W. K., Vogelmann, T. C., and Critchley, C.: Photosynthetic adaptation: chloroplast to landscape, Springer, New York, NY, USA, 2004.
Spitters, C.: Separating the diffuse and direct component of global radiation and its implications for modeling canopy photosynthesis Part II. Calculation of canopy photosynthesis, Agr. Forest Meteorol., 38, 231–242, 1986.
Spitters, C., Toussaint, H., and Goudriaan, J.: Separating the diffuse and direct component of global radiation and its implications for modeling canopy photosynthesis Part I. Components of incoming radiation, Agr. Forest Meteorol., 38, 217–229, 1986.
Urban, O., Klem, K., Ač, A., Havránková, K., Holišová, P., Navrátil, M., Zitová, M., Kozlová, K., Pokorný, R., Šprtová, M., Tomášková, I., Špunda, V., and Grace, J.: Impact of clear and cloudy sky conditions on the vertical distribution of photosynthetic CO2 uptake within a spruce canopy, Funct. Ecol., 26, 46–55, https://doi.org/10.1111/j.1365-2435.2011.01934.x, 2012.
Vuichard, N. and Papale, D.: Filling the gaps in meteorological continuous data measured at FLUXNET sites with ERA-Interim reanalysis, Earth Syst. Sci. Data, 7, 157–171, https://doi.org/10.5194/essd-7-157-2015, 2015.
Wang, X., Wu, J., Chen, M., Xu, X., Wang, Z., Wang, B., Wang, C., Piao, S., Lin, W., Miao, G., Deng, M., Qiao, C., Wang, J., Xu, S., and Liu, L.: Field evidences for the positive effects of aerosols on tree growth, Glob. Change Biol., 24, 4983–4992, https://doi.org/10.1111/gcb.14339, 2018.
Weiss, A. and Norman, J.: Partitioning solar radiation into direct and diffuse, visible and near-infrared components, Agr. Forest Meteorol., 34, 205–213, 1985.
Williams, M., Rastetter, E. B., Van der Pol, L., and Shaver, G. R.: Arctic canopy photosynthetic efficiency enhanced under diffuse light, linked to a reduction in the fraction of the canopy in deep shade, New Phytol., 202, 1267–1276, 2014.
Williams, I. N., Riley, W. J., Kueppers, L. M., Biraud, S. C., and Torn, M. S.: Separating the effects of phenology and diffuse radiation on gross primary productivity in winter wheat, J. Geophys. Res.-Biogeo., 121, 1903–1915, 2016.
Wohlfahrt, G., Hammerle, A., Haslwanter, A., Bahn, M., Tappeiner, U., and Cernusca, A.: Disentangling leaf area and environmental effects on the response of the net ecosystem CO2 exchange to diffuse radiation, Geophys. Res. Lett., 35, L16805, https://doi.org/10.1029/2008GL035090, 2008.
Yin, X. and Struik, P.: C3 and C4 photosynthesis models: an overview from the perspective of crop modelling, NJAS-Wagen, J. Life Sc., 57, 27–38, 2009.
Yue, X. and Unger, N.: The Yale Interactive terrestrial Biosphere model version 1.0: description, evaluation and implementation into NASA GISS ModelE2, Geosci. Model Dev., 8, 2399–2417, https://doi.org/10.5194/gmd-8-2399-2015, 2015.
Yue, X. and Unger, N.: Aerosol optical depth thresholds as a tool to assess diffuse radiation fertilization of the land carbon uptake in China, Atmos. Chem. Phys., 17, 1329–1342, https://doi.org/10.5194/acp-17-1329-2017, 2017.
Zhang, Y.: ORCHIDEE_DFv1.0_site, https://doi.org/10.14768/20200407003.1, 2020.
Zhang, Y., Rossow, W. B., Lacis, A. A., Oinas, V., and Mishchenko, M. I.: Calculation of radiative fluxes from the surface to top of atmosphere based on ISCCP and other global data sets: Refinements of the radiative transfer model and the input data, J. Geophys. Res.-Atmos., 109, D19105, https://doi.org/10.1029/2003JD004457, 2004.
Zhang, Y., Goll, D., Bastos, A., Balkanski, Y., Boucher, O., Cescatti, A., Collier, M., Gasser, T., Ghattas, J., Li, L., Piao, S., Viovy, N., Zhu, D., and Ciais, P.: Increased Global Land Carbon Sink Due to Aerosol-Induced Cooling, Global Biogeochem. Cy., 33, 439–457, https://doi.org/10.1029/2018gb006051, 2019.