the Creative Commons Attribution 4.0 License.
the Creative Commons Attribution 4.0 License.
 | 04 Jan 2019
Analysis fire patterns and drivers with a global SEVER-FIRE v1.0 model incorporated into dynamic global vegetation model and satellite and on-ground observations
Sergey Venevsky
Yannick Le Page
José M. C. Pereira
Biomass burning is an important environmental process with a strong influence on vegetation and on the atmospheric composition. It competes with microbes and herbivores to convert biomass to CO2 and it is a major contributor of gases and aerosols to the atmosphere. To better understand and predict global fire occurrence, fire models have been developed and coupled to dynamic global vegetation models (DGVMs) and Earth system models (ESMs).
We present SEVER-FIRE v1.0 (Socio-Economic and natural Vegetation ExpeRimental global fire model version 1.0), which is incorporated into the SEVER DGVM. One of the major focuses of SEVER-FIRE is an implementation of pyrogenic behavior of humans (timing of their activities and their willingness and necessity to ignite or suppress fire), related to socioeconomic and demographic conditions in a geographical domain of the model application. Burned areas and emissions from the SEVER model are compared to the Global Fire Emission Database version 2 (GFED), derived from satellite observations, while number of fires is compared with regional historical fire statistics. We focus on both the model output accuracy and its assumptions regarding fire drivers and perform (1) an evaluation of the predicted spatial and temporal patterns, focusing on fire incidence, seasonality and interannual variability; (2) analysis to evaluate the assumptions concerning the etiology, or causation, of fire, including climatic and anthropogenic drivers, as well as the type and amount of vegetation.
SEVER reproduces the main features of climate-driven interannual fire variability at a regional scale, for example the large fires associated with the 1997–1998 El Niño event in Indonesia and Central and South America, which had critical ecological and atmospheric impacts. Spatial and seasonal patterns of fire incidence reveal some model inaccuracies, and we discuss the implications of the distribution of vegetation types inferred by the DGVM and of assumed proxies of human fire practices. We further suggest possible development directions to enable such models to better project future fire activity.
- Article
(10348 KB) - Full-text XML
- BibTeX
- EndNote


The biosphere is affected by fires through physical and chemical pathways, involving interactions between the terrestrial and atmospheric components of carbon, water and nutrient cycles. As a natural phenomenon, fires are an integral part of the majority of ecosystems, influencing soil fertility, stand regeneration, vegetation composition and succession (Le Page et al., 2015; Levine et al., 1999). However, through its anthropogenic use for land management (agriculture, pasture, deforestation), fire incidence is considerably higher than under natural conditions in many regions, including savannas in Africa and Australia or tropical forests in South America and Southeast Asia (Bond et al., 2005).
Abundant literature points to a variety of impacts, roles, and drivers of fires and an extended range of spatial scales and timescales involved. It is estimated that, on average, an area equivalent to that of India burns every year, predominantly in savannas and grasslands (Tansey et al., 2004). Burned areas in tropical and boreal forests are smaller, but their high productivity and carbon storage capacity results in significant emissions of numerous greenhouse gases (e.g., CO2, CH4; Andreae and Merlet, 2001; Pereira et al., 1999). Globally, total fire emissions are equivalent to approximately one-third of fossil fuel burning emissions (Le Quéré et al., 2015; van der Werf et al., 2006; Wu et al., 2017). Net emissions, stemming from deforestation or increased fire activity, are much smaller but poorly constrained (van der Werf et al., 2006) and highly variable on interannual timescales, especially through induced changes in fire sensitivity of highly productive ecosystems by El Niño–La Niña and other climatic phenomena (Duncan et al., 2003; Langenfelds et al., 2002; Le Page et al., 2008; van der Werf et al., 2004, 2008).
The strong integration of fires with the biosphere system is also emphasized by their dependence on a complex system of interactive drivers, designated as the fire triangle (Schoennagel et al., 2004), dominated by climate, vegetation and human activities. Precipitation rates and temperature partly control the amount of fuel available to burn, its moisture content and fire behavior in case of ignition (Crevoisier et al., 2007; Turner et al., 2008). Fire incidence, fire severity and ensuing emissions are also dependent on the vegetation types, structure and productivity of the ecosystem (Andreae and Merlet, 2001; Hammill and Bradstock, 2006). Finally, anthropogenic activities, as mentioned above, greatly bias the natural occurrence of fires, increased in many regions as a land management tool or decreased through fire suppression strategies (firefighting, preventive fires; Veblen et al., 2000). Other factors are involved (topography, natural landscape breaks, grazing), but most important is the interaction among those drivers, which needs to be considered to yield relevant information about fire risk (Dwyer et al., 2000a).
Dynamic global vegetation models (DGVMs) and Earth system models (ESMs) simulate vegetation dynamics at a global scale; fire is included as an explicit process in some of these models (Arora and Boer, 2005; Bachelet et al., 2001; Li et al., 2013; Rabin et al., 2018; Thonicke et al., 2010, 2001; Venevsky et al., 2002; Wu et al., 2017; Yue et al., 2014). Given the importance of fires and their dependence on various model inputs or simulated processes, the development of fire modules is of great interest to understand and evaluate the fire-related coupling and feedback assumptions. Comprehensive review of global fire modeling activity is given by Hantson et al. (2016) and an overview of recent global fire models participating in the Fire Modeling Intercomparison Project (FireMIP) is presented by Rabin et al. (2017). Hantson et al. (2016) distinguish four levels of complexity for global fire models incorporated into DGVMs (see Fig. 2 in their study) depending on processes included in models.
-
The simplest statistical model relates burnt areas with climate and/or vegetation (Glob-FIRM; Thonicke et al., 2001) and/or human activities (Knorr et al., 2014).
-
Models statistically estimate the number of fires and expected size of fires (Pechony and Shindell, 2009).
-
Process-based quasi-mechanistic models use functional relationships among climate, vegetation and socioeconomic drivers of wildfires (MC-FIRE (Lenihan and Bachelet, 2015), CTEM (Arora and Boer, 2005), CLM-Li (Li et al., 2013), LM3-FINAL (Rabin et al., 2018), etc.). This approach was first introduced by the Reg-FIRM model (Venevsky et al., 2002) and further developed by the follow-up SPITFIRE (Thonicke et al., 2010) model and its derivatives JSBACH–SPITFIRE (Lasslop et al., 2014), LPJ-LMfire (Pfeiffer et al., 2013), LPJ-GUESS–SPITFIRE (Lehsten et al., 2009), ORCHIDEE–SPITFIRE (Yue et al., 2014) and LPX-Mv1 (Kelley and Harrison, 2014).
-
There is a complete representation of all processes in space and time (first-principle approach model).
Nine from the 11 global models participating in FireMIP experiment are process-oriented quasi-mechanistic models (Rabin et al., 2017); however, mainly due to complexity of the processes involved, all these models are still not at level 4. The closest to the complete representation of all fire related processes in time is the SPITFIRE model (see Table 1 in Hantson et al., 2016) and its modifications. The SPITFIRE modeling community achieved significant results in global and regional fire modeling describing dynamics of wildfires in a savanna–forest transition zone (Baudena et al., 2015), contemporary dynamics of burnt areas in Europe (Wu et al., 2015), global fire regimes in the preindustrial zone (Pfeiffer et al., 2013) and changes in global carbon balance (Prentice et al., 2011).
While complete representation of all processes which determine wildfire dynamics in space and time is still underway, quasi-mechanistic models use different parameterizations of ignitions and spread of wildfire. Parameterizations are based on either long-term fire statistics or on remote-sensing data, which are a valuable data source due to their availability and global coverage. SPITFIRE, for example, uses lightning frequency as an input for calculation of the number of lightning fires. We argue that it would be advantageous if one can produce long-term fire relationships without depending on remote sensing, which is only available for a relatively short period of time (a few decades). Fire return intervals can be of the order of hundreds of years, whereas remote sensing is available for several decades. Therefore, using remote sensing to derive relationships implicitly assumes a space-for-time substitution, which may or may not hold. Conversely, parameterizations based on ground-based measurements or laboratory-based experiments have their own problems, like insufficient accuracy and low representativeness in space, but are considered to be more robust in time and thus very useful in DGVMs or ESMs for investigation of future global change impacts or past global fire regime reconstruction.
We present in this study SEVER-FIRE v1.0 (Socio-Economic and natural Vegetation ExpeRimental global fire model version 1.0; simplified as SEVER-FIRE in the following text) incorporated into the SEVER DGVM (Venevsky and Maksyutov, 2007; Wu et al., 2017), which is a modification of LPJ-DGVM (Sitch et al., 2003) for daily time step computation. SEVER-FIRE is a quasi-mechanistic model, which is a follow-up of Reg-FIRM for the globe, with several new features aiming for complete representation of wildfire processes. We improve earlier algorithms of Reg-FIRM and introduce new functionality with respect (1) to estimating the number of lightning fires from data on convective activity in the atmosphere, (2) to estimating the number of human fires from urban vs. rural population (timing of their appearance in natural landscapes and their ratio) and regional wealth index, and (3) to more realistically estimating fire duration, which in the new model depends on human suppression and weather situations and can last for up to 2 days. One of the major focuses of SEVER-FIRE is an implementation of pyrogenic behavior of humans (timing of their activities and their willingness and necessity to ignite or suppress fire), related to socioeconomic and demographic conditions in a geographical domain of the model application. The importance of description of pyrogenic behavior of humans is confirmed by recent findings of bimodal fire regimes, reflecting the human fingerprint in global fire dynamics (Benali et al., 2017), as well as by differences in timing of ignitions determined by a religious background in sub-Sahara Africa (Pereira et al., 2015). Fire weather regimes set by climate dynamics and fuel state set by vegetation dynamics are other important drivers in SEVER-FIRE. The SEVER DGVM fire module, based on climate observations, external anthropogenic parameters and SEVER-DGVM-derived vegetation, estimates fire incidence and emissions. The resulting vegetation disturbance feeds back to the DGVM, ensuring a fully coupled system (see model description).
We perform a comparison of SEVER outputs with fire data derived from satellite sources, the Global Fire Emission Database version 2 (GFED) (van der Werf et al., 2006) and historical fire data (number of lightning and human fires and their burnt area) with two objectives. First, we aim for a global evaluation of a DGVM fire model, focusing on crucial and simple features, namely fire incidence, seasonality, interannual variability and emissions. Second, (the most important) by identifying the reasons for large inconsistencies, we propose further modifications to SEVER-FIRE. The work presented in this paper is partly based on the PhD thesis by Yannick Le Page. We therefore inform the reader that significant parts of the text in Sects. 3 and 4 already appeared in Le Page (2009).
We are making an effort to create a first-principle global mechanistic fire model. We have named our model “experimental” in order to show that some processes are included in SEVER-FIRE ad hoc (timing of ignition activity of rural versus urban population, others) as mechanisms are still not described or studied, some processes are simplified (e.g., setting maximum time of fire to 2 days but this may be updated and modified in the future by introducing the latest global fire duration datasets; Andela et al., 2018) and some processes are based on statistical descriptions from satellite data (number of on-ground flashes), as they wait their nearest time to be substituted by physically based mechanistic models.
Table 1Five of the 35 parameters defined for each of the 10 SEVER PFTs.
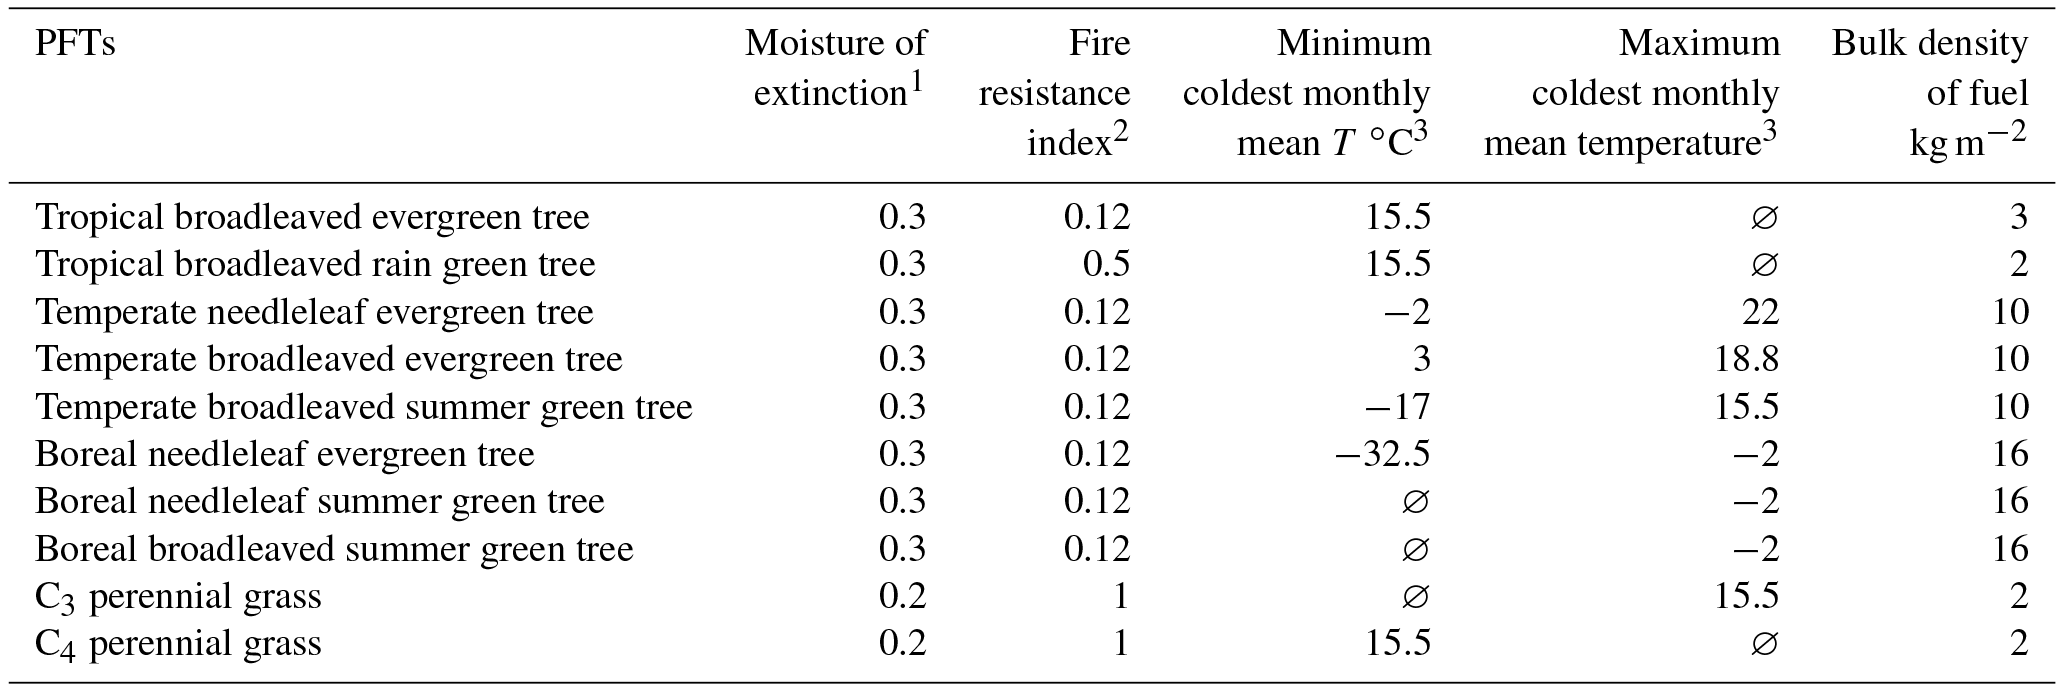
1 Involved in the computation of fire probability. 2 Involved in the computation of vegetation disturbance after a fire. 3 ∅ indicates no limitation from the considered parameter.
2.1 SEVER DGVM and SEVER-FIRE models
2.1.1 Input of DGVM to fire model
The SEVER DGVM is a coupled vegetation–fire mechanistic model designed to run at a range of temporal (daily to monthly) and spatial (10 km to 2.5∘ with 0.5∘ mostly tested) resolution levels (Venevsky and Maksyutov, 2007). The fire module SEVER-FIRE is a further development of the Reg-FIRM (Venevsky et al., 2002), which was applied only for the Iberian Peninsula, from a regional to a global scale. The aim of this model is to provide, at the global scale, a comprehensive mechanistic description of major characteristics registered in standard fire statistics and/or satellite observations around the world, namely number of fires, area burnt and carbon emissions. An important goal of SEVER-FIRE is inclusion in ESMs (Bonan and Doney, 2018; Bowman et al., 2009) in order to make realistic climate change predictions of global wildfire dynamics. The most important variables, provided by the SEVER DGVM for SEVER-FIRE include the distribution of 10 plant functional types (PFTs), which are similar to LPJ-DGVM vegetation types (see names of PFT in Table 1) over the globe, described as a distribution of fractions within a grid cell Cvegpft; net primary productivity NPPpft; carbon of aboveground vegetation cpft; fuel loading litpft, described as a mass of litter; and soil moisture moist in the upper 0.1 m layer m (see Table 1 for description of fire model variables and parameters).
2.1.2 External input to fire model
Gridded climate, demographic and socioeconomic data comprise external input for the fire module. Minimum and maximum daily temperature , daily precipitation and convective precipitation prec ∕ cprec and wind speed u are the climate variables used in SEVER-FIRE. Human population density P, ratio of rural to total population (rural and urban population) , wealth index (WI) and average distance from megacities (dist) (recalculated with simplified assumptions from population density and ratio of rural to urban population) comprise socioeconomic input to the fire model.
2.1.3 Output of fire model
The model separates human-induced (indexed as hum) and lightning fires (indexed as nat) by sources of ignition and all output variables of fire models can be obtained by either these two classes of fires or in total (not indexed). We omit the mentioned indexes in description of output variables further on for simplicity. The output of the model includes number of fires (Nfire), area burnt (aburnt), fire carbon emission (cfire), number of PFT's individuals killed (Nindpft), and updated vegetation carbon and NPP. The fire model feeds back to the DGVM through the increased area (equal to burnt areas by PFTs) and decreased number of PFT individuals for competitive occupation by PFTs after a fire and updated carbon fluxes and pools for carbon cycle simulation within vegetation model.
Thus, the DGVM and fire module work in interactive mode, incorporating a representation of fire–vegetation feedbacks.
2.1.4 Components of SEVER-FIRE
The SEVER-FIRE model consists of six related components described below:
-
estimation of fire weather danger index and fire probability,
-
simulation of lightning ignition events and number of lightning fires,
-
simulation of human ignition events and number of human fires,
-
simulation of fire spread after ignition,
-
fire termination,
-
estimation of fire effects (burnt areas, pyrogenic emissions, number of each PFT's individuals killed).
All six components are controlled by PFT-dependent fire parameters (see list in Table 1).
-
Estimation of fire weather danger index and fire probability. Fire weather danger index FDI(d), measured from 0 (“no fire danger”) to 1 (“extreme fire danger”), is estimated in SEVER-FIRE based on the Reg-FIRM fire danger index (Venevsky et al., 2002). It is calculated at a daily time step as a multiple of the exponentially normalized Nesterov index (based on accumulated difference of minimum and maximum temperature, forced to zero by a 3 mm daily precipitation threshold) and vegetation- and soil-moisture-dependent fire probability. Use of Reg-FIRM-based fire weather danger indexes became popular in contemporary global fire modeling (Arora and Boer, 2005; Thonicke et al., 2010) mainly due to calculation simplicity. Direct comparison of fire risk for Siberia, described by more sophisticated Canadian fire danger and Russian fire danger indexes (used by national forest service) in both countries with Reg-FIRM fire danger index, revealed that they are almost equivalent (Alexey Rubtsov, personal communication, 2009). The fire probability function is designed as a regression from observations (Thonicke et al., 2001). It depends on current soil moisture in the upper 10 cm layer and PFT-dependent fire moisture of extinction (Table 1), adapted from the experimental study of Albini (1976).
-
Simulation of lightning ignition events and number of lightning fires. The number of potential lightning ignitions in a grid cell is calculated from the daily number of cloud-to-ground flashes Nflashes, which is estimated from convective precipitation as a nonlinear regression polynomial function of the power of 4 (as in Allen and Pickering, 2002). Using of power of 4 polynomial function by convective precipitation to represent number of flashes has theoretical physical grounds (Vonnegut, 1963). Allen and Pickering (2002) prepared their parameterization of number of flashes for North America, so we made a validation test of Nflashes for the globe (Venevsky, 2014) using Optical Transient Detector–Lightning Imaging Sensor (OTD-LIS) observed lightning data (Christian et al., 2003) and found that the parametrization performs well at a global scale (R2=0.51). Cloud-to-ground flashes are divided into negatively charged (90 %) and positively charged (10 %) (Latham and Schlieter, 1989). Only the flashes with long continuous current (LCC flashes, 75 % of positively charged and 25 % of negatively charged flashes) can ignite wildfire (Latham and Schlieter, 1989). Efficiency of LCC flashes to ignite depends on bulk density of fuel as it was shown in the laboratory (Latham and Schlieter, 1989). Thus the number of efficient-to-ignite positive flashes and number of efficient-to-ignite negative flashes at first glance can be simplified as Eqs. (1) and (2):
where b=0.1 is efficiency of lightning to ignite (Latham and Schlieter, 1989), a=0.25 m2 kg C−1 is the regression coefficient (simplified from Latham and Schlieter, 1989), is an average daily time of thunder over a grid cell, set to 1 h and 20 min (Uman, 1987), and dens is the bulk density of fuel (kg C m−2). Bulk density of fuel is an important variable of SEVER-FIRE, used in several basic equations. We assume that all PFTs found in a grid cell are distributed homogeneously and bulk density of fuel in a grid cell is calculated as Eq. (3):
where Cvegpft(i) is foliar projection cover of ith PFT, denspft(i) is bulk density of ith PFT (see Table 1), which are taken from Reg-FIRM (Venevsky et al., 2002) and the study of Albini (1976), and Npft is total number of PFTs in a grid cell. Bulk density of fuel in the grid cell and depth of fuel (depth, cm) can be calculated as Eq. (4):
and they are translated into arriving daily number of natural ignitions from positive and negative flashes , using fitting into two functions of data for probability to ignite for positive and negative flashes by eight fuel types (see Table 1 of Anderson, 2002), obtained from laboratory experiments (Eqs. 5 and 6).
Total number of arriving ignitions from effective positive and negative LCC flashes is recalculated into number of surviving natural fires in a grid cell with area Sgrid, which depends on the daily fire danger index FDI(d) maximum rate of surviving ignitions rate, taken as 0.15 (Anderson, 2002), and soil moisture in 1 cm fuel layer, simplified as 10 % of soil moisture moist in the upper 10 cm; see Eq. (7):
Dependence of number of lightning fires in Eq. (7) by elevation (elev) in meters was obtained by linear regression from data of Vazquez and Moreno (1998) for peninsular Spain. The module of the number of lightning fires was validated using data for lightning and lightning fires in the central cordillera of Canada (Wierzchowski et al., 2002). This study contains data for number of lightning fires for the years 1961–1994 and annual number of lightning strikes for 1989–1994 for the central cordillera area 50–54∘ N, 114–120∘ W. The central mountain range in the area divides the cordillera into two parts, one is in British Columbia, another in Alberta. SEVER-FIRE is able to reproduce values for total annual number of lightning strikes for both provinces (see Fig. 1) and number of lightning fires in the provinces (see Fig. 2). The model reproduces 3- to 2-fold dominance of the annual number of lightning strikes in Alberta and 7- to 10-fold dominance of the annual number of lightning fires in British Columbia. Use of convective precipitation as a driver for the number of lightning fires was also confirmed by the study of Cardoso et al. (2007), who found that lightning fire occurrence in Brazil is related to zonal flux of moisture in the atmosphere.
-
Simulation of human ignition events and number of human fires. The number of potential human ignitions Nignitions_hum(d) is calculated as a power function from population density with saturation, suggested by the Russian forest service and also used in Reg-FIRM (Venevsky et al., 2002), multiplied by normalized socioeconomic characteristics of population and by fuel conditions (see Eq. 8):
where P is population density in persons per square kilometer; is a mathematical expectation of number of ignitions produced by one person for 1 million ha; [km2 (million ha)−1 m2 kg C−1] (scaling coefficient from million hectares to square kilometers (Venevsky et al., 2002) divided by average fuel density 8 kg C m−2); j is either rural (j= rur) or urban population (j= urb), is a ratio of rural to total population, so that ; and timingj(d) is daily timing of pyrogenic activity of the population. Timing of human pyrogenic activity (timingj(d)) at a first glance is defined separately for the Northern Hemisphere and Southern Hemisphere and for rural and urban population as a step function, and it is mostly based on agricultural and vacation calendars (for city inhabitants). It is set so that sum of timingrur(d) and timingurb(d) is equal always to 1. So, for example, for the entire Northern Hemisphere it was set to 1 in July and August (summer vacations) for urban population (zero for rural population in these months); set to 1 in March, April, May (spring agriculture activities), September, October, and November (autumn agriculture activities) for rural population (zero for urban population in these months); and set to 0.5 in the rest of the year.
Mathematical expectation of number of ignition produced by one person for 1 million ha is set to be an exponential function of WI, determined from the data of the UN Human Settlements Programme (see Eq. 9):
Equation (9) was obtained using logarithmic regression from the geographically distributed observed number of human fires (map of average over 1974–1994 annual number of human fires for Spain (Vazquez and Moreno, 1998), map of average over annual number of human fires by Canadian ecoregions for 1961–1995 (Stocks et al., 2002) and map of average over annual number of total fires (assumed to be all human) by African countries for 1981–1991 (Barbosa et al., 1999b); no division into rural and urban population was assumed when deriving Eq. 9). Equation (9) assumes that the maximum mathematical expectation of the number of ignitions produced by one person is equal to 1 million ha for a day (estimate of Russian forest service; see Melekhov, 1978), for a grid cell with the most theoretically possible poorest population (WI = 0) and ignition (day × person × million ha)−1 for a grid cell with the most theoretically wealthy population (WI = 30 – closest is the Stockholm metropolitan area). The average value of is equal to 0.22 ignition (day × person × million ha)−1 (WI = 20.5) for peninsular Spain as in Reg-FIRM (Venevsky et al., 2002).
The total number of human fires in a grid cell is calculated as Eq. (10):
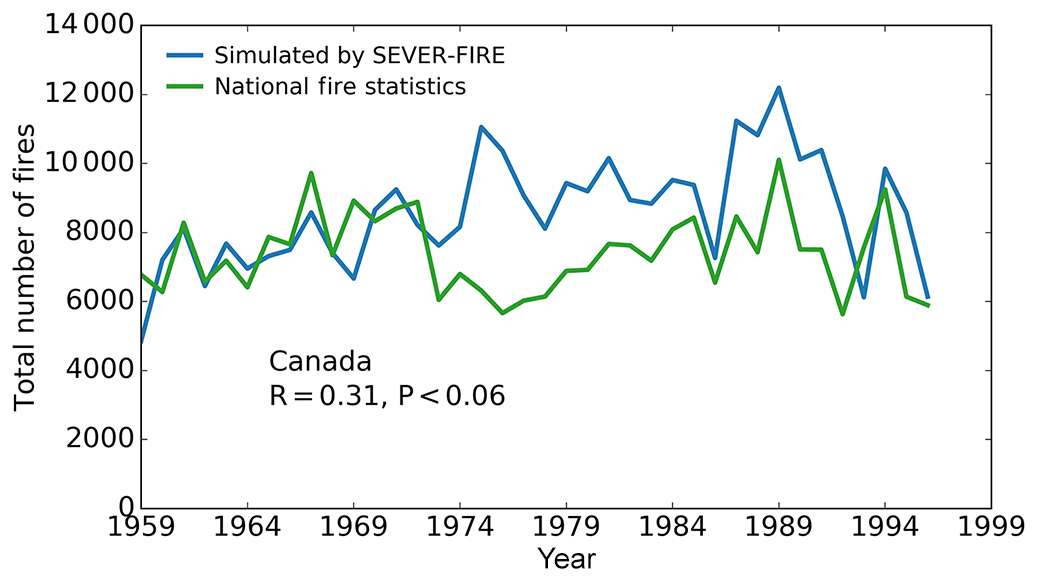
The number of human fires for peninsular Spain was validated for Reg-FIRM, which has the same equations as SEVER-FIRE in the region. To check plausibility of approach for calculation of the total number of fires, we carry out validation for Canada for 1961–1995 (Stocks et al., 2002) (see Fig. 3) because Canada has significant variation for climatic conditions, vegetation composition, population density and socioeconomic state of the population.
The description of human ignitions in SEVER-FIRE is very simplistic and does not have the intention of describing, to a major extent, complex economic, cultural and social practices of people (agricultural, hunting or pastoral, other) resulting in pyrogenic activities. We left out (or oversimplified, like in the timing function and mathematical expectation of the number of ignitions produced by one person) description of an influence of land use on the number of human ignitions in the fire model because the SEVER DGVM does not include description of human land use and/or its influence on natural vegetation. By application of the SEVER DGVM, we aim to describe relatively human-free global vegetation, which was given an additional control regulator, namely external human and/or lightning ignitions. This limitation of the SEVER DGVM implies certain constraints on our results in both vegetation distribution and burnt areas, but it also gives us an opportunity to identify and locate the areas where interaction among land use, fire regimes and vegetation should be described explicitly and accurately.
-
Simulation of fire spread after ignition. Rate of fire spread after an ignition event is simulated using a simplified version of the Rothermel thermodynamic equation (Venevsky et al., 2002) and depends on wind speed, fuel bulk density and soil moisture content in the upper layer as a proxy of fuel moisture. As in the Reg-FIRM approach, a fire cannot take place when the fuel loading threshold (100 g m−2), calculated as litter pool by a DGVM, is not crossed. Simulation of rate spread, using the Rothermel equation, in SEVER-FIRE is similar to the one used by some recent landscape fire models (Cary et al., 2006) and other global fire models (Li et al., 2013; Rabin et al., 2017; Yue et al., 2014). However, there is a large difference in translation of rate of fire spread into burnt areas in landscape models and SEVER-FIRE. Indeed, landscape models account for terrain and fuel discontinuity (water bodies, highways, etc.), while global fire models do not include this feature. Analysis of to what extent up-scaling from the landscape level to a rather coarse grid cell of SEVER-FIRE should be performed in the future is required.
-
Fire termination. Fire termination occurs with the onset of a significant rainfall event (more than 3 mm), causing weather danger to drop to zero. Close to cities, fire termination occurs after a delay dependent on distance to the city, which is a proxy for human fire suppression. Fire suppression function (time to eliminate a fire) was constructed as a log-linear regression function from distance to the city, using fire duration statistics for Europe and Russia from the EFFIS database (San Miguel-Ayanz et al., 2012). As a result, a single fire can continue in the model from 1 h up to 2 days (see Eq. 11):
where is a single fire duration (days) and dist is a distance (km) from a nearest city (area with P>400 persons km−2).
However, the limitation of maximum fire duration to 2 days was set due to range in the fire duration of the EFFIS database, which covers mainly European domain. Globally this limitation may be not valid for remote high-latitude areas, but even in these regions mathematical expectation of fire duration will be close to 1 day (see Korovin, 1996).
-
Estimation of fire effects. The rate of spread is converted to an absolute value of average area burnt for one fire, using an elliptic fire spread model (van Wagner, 1969) similarly to the Reg-FIRM approach (Venevsky et al., 2002), which is also adopted by the majority of other global fire models.
Daily burnt area in the DGVM grid cell is calculated as Eq. (12):
where Nfire(i) is number of fires ignited in a day i, Nfire(i−1) is number of fires continuing from the previous day (if any do exist) and S(i) is an area of spread for one fire, determined by vegetation and climate (see above). Equation (12) is a simplification of the increase in areas of continuing fires as it does not account for the fact that growth of a next-day fire starts from a perimeter of the previous-day fire.
Daily burned area estimates are aggregated annually to estimate fire effects. Percentage of vegetation individuals killed depends on area burned and on resistance of each PFT to fires (Table 1), taken directly from Glob-FIRM (Thonicke et al., 2001). The percentages are then converted to emissions, based on vegetation carbon content (dead PFT individuals are considered to be entirely burned), and redistributed daily following the profile of fire probability.
The model outlined above should be considered an approach to design a global comprehensive process-oriented fire model based mainly on field observations and physically based assumptions. Still more analysis needs to be done for representation of fire processes within the model and calibration of parameters used in the model. For instance, the study of Scott and Burgan (2005) indicated that moisture of extinction, used in SEVER-FIRE (see Table 1) may vary from 12 % to 40 % for different fuel types, i.e., has a larger range than in our model. We plan to make sensitivity and optimization tests to improve the SEVER-FIRE model parameters and modifications of equations when necessary.
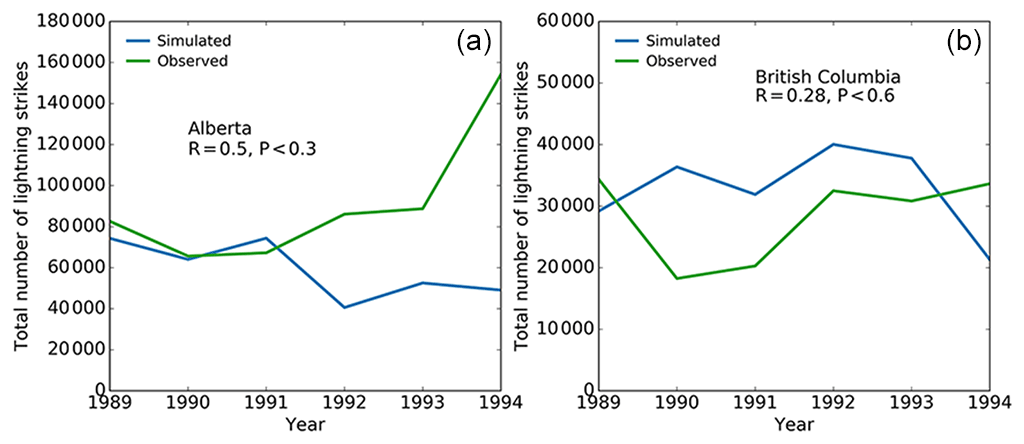
Figure 1Observed and simulated number of lightning strikes in the central cordillera of Canada (a) in Alberta and (b) in British Columbia.

Figure 2Total number of lightning fires observed (Wierzchowski et al., 2002) and simulated (a) in Alberta and (b) in British Columbia.
2.2 Data
2.2.1 Climate data
For this study, precipitation data from the National Centers for Environmental Prediction (NCEP climate data; minimum and maximum temperature, precipitation and convective precipitation, shortwave radiation and wind speed; http://www.cpc.ncep.noaa.gov/, last access: 26 December 2018) were interpolated to 0.5∘ longitude–latitude spatial resolution for the period of 1957 to 2006 (50 years). Daily wind speed is not well estimated in the reanalysis approach (Kalnay et al., 1996), so it was averaged over the entire period and applied in simulation runs without interannual variability. The input soil texture data and CO2 atmospheric concentration over the same period coincide with those of LPJ-DGVM (Sitch et al., 2003). The model is run globally from a bare soil state 15 times with the climate data for 50 years and the CO2 atmospheric concentration fixed for the year 1957 (spin-up period) in order to achieve equilibrium of soil carbon pools. From this equilibrium state, SEVER is forced by climate and atmospheric CO2 for the period of 1957–2006 (transient period).
2.2.2 Socioeconomic data
Distance from a city was precalculated from population density and the ratio of rural (urban) population. For this, areas where urban population density exceeds 400 persons km−2 were considered to be cities (UN definition of Human Settlements Programme). Gridded population and rural (urban) ratio datasets for the years 1940–2050, used by SEVER-FIRE, were elaborated using UN Development Programme estimates by major economic regions. WI was calculated first for 600 cities around the globe (Anastasia Svirejeva-Hopkins, personal communication, 2006) using the approach of the UN Human Settlement Programme as a sum of six socioeconomic components, each normalized to range between 0 (minimum) and 5 (maximum). Components included GDP per capita, number of persons with high education, number of doctors, crime rate, access to clean potable water and air pollution level. Data for the cities were extrapolated for the entire land area using a nonlinear spline at a regular grid of the DGVM. Socioeconomic data used in this study can be found in the code availability section.
2.3 Burned area and carbon emission validation data
GFED is a global 1∘ resolution database (van der Werf et al., 2006), which relies on three different active fire products calibrated to Moderate Resolution Imaging Spectrometer (MODIS) 500 m burned area, for a temporal coverage spanning 1997–2006 (Giglio et al., 2006). Fire activity data from the Tropical Rainfall Measuring Mission (TRMM) Visible and Infrared Scanner (VIRS; Giglio et al., 2003) and European Remote Sensing satellites (ERS) Along Track Scanning Radiometer (ATSR; Arino and Plummer, 2001) sensors are used for the 1997–2001 period. Over 2001–2006, the calibration was based on active fires from MODIS (Giglio et al., 2006). Carbon emissions were then estimated based on those burned area estimates, with fuel loads calculated by the Carnegie–Ames–Stanford approach (CASA) model (van der Werf et al., 2006).
The active fire to burned area calibration step and the use of three different sensors to build this dataset generate significant uncertainties on burned area estimates, which are considered to be about 50 % at regional scales, although not quantified in the version of GFED we used (van der Werf et al., 2006). The version of GFED used also does not contain small fires. Emission uncertainties are consequently higher, taking into account their further dependence on the CASA model and on fuel loads and emission factor values.
2.4 Fire incidence, fire variability and carbon emission evaluation
We chose to focus primarily on burned area to evaluate the model at a global scale, as this is a prerequisite to estimate carbon emissions. However, carbon emission being an essential aspect of biomass burning, its representation is briefly evaluated.
Fire incidence, seasonality and interannual variability from SEVER are compared to GFED data over the 1997–2006 period. The SEVER DGVM considers grid cells to be 100 % land or water. This required a few adjustments on both datasets (regridding of GFED data to SEVER lat–long grid and overlay of two datasets), causing minor changes in the original GFED statistics (less than 3 % for total global area burnt and global fire emissions). We consider burned fraction (BF) rather than burned areas, a latitudinal unbiased indicator of fire density given the use of a lat–long grid.
Fire incidence is mostly dependent on three key factors, conceptualized by the fire triangle (Schoennagel et al., 2004): fuel availability, readiness of fuel to burn and ignition source. SEVER spatial patterns of fire incidence are first compared to GFED, through the mean annual grid cell BF. BF drivers are then explored with a selection of relevant environmental variables, based on the fire triangle concept.
-
Annual amount of precipitation, from the CPC merged analysis of precipitation (CMAP, Xie and Arkin, 1997), provided by the NOAA/OAR/ESRL PSD, Boulder, Colorado, USA (http://www.cdc.noaa.gov/, last access: 26 December 2018) is used.
-
An indicator of dry season severity (DSS), which was constructed from precipitation (CMAP) and temperature data (NCEP/NCAR reanalysis project; Kalnay et al., 1996) is used. The indicator (Breckle, 2002), representing a rainfall deficit or a temperature excess, is computed as indicated by Fig. 4. Here we consider it as a rainfall deficit (unit: mm).
-
Net primary productivity (NPP) is used. Its influence on fires is estimated with NPP estimates from Imhoff et al. (2004) and from SEVER.
-
Land cover spatial distribution is used. The SEVER DGVM vegetation distribution and its impacts on BF patterns are evaluated with the global land cover for the year 2000 (GLC2000; Bartholomé and Belward, 2005).
-
Human rural and urban population density from global demographic data collection (Vorosmarty et al., 2000), provided by the University of New Hampshire, EOS-WEBSTER Earth Science Information Partner (ESIP) is used. An indicator of the rural predominance of the population was defined (Eq. 13):
where rpop and upop are, respectively, the rural and urban population of the considered grid cell. Rurality varies between 1, fully rural, and −1, fully urban populations.
-
Gross domestic product (GDP) gridded data (van Vuuren et al., 2007), provided by the Netherlands Environmental Assessment Agency is used.
We left aside wind speed, which significantly affects readiness of fuel to burn and fire to spread, as an analyzed environmental variable, due to constrains put on it in the presented SEVER-FIRE simulations (see description of input data in Sect. 2.2). However, Lasslop et al. (2015) demonstrated that modification of rate-of-spread dependence on wind speed may sufficiently influence burnt areas, so we plan to explore wind speed as a BF driver in the future.
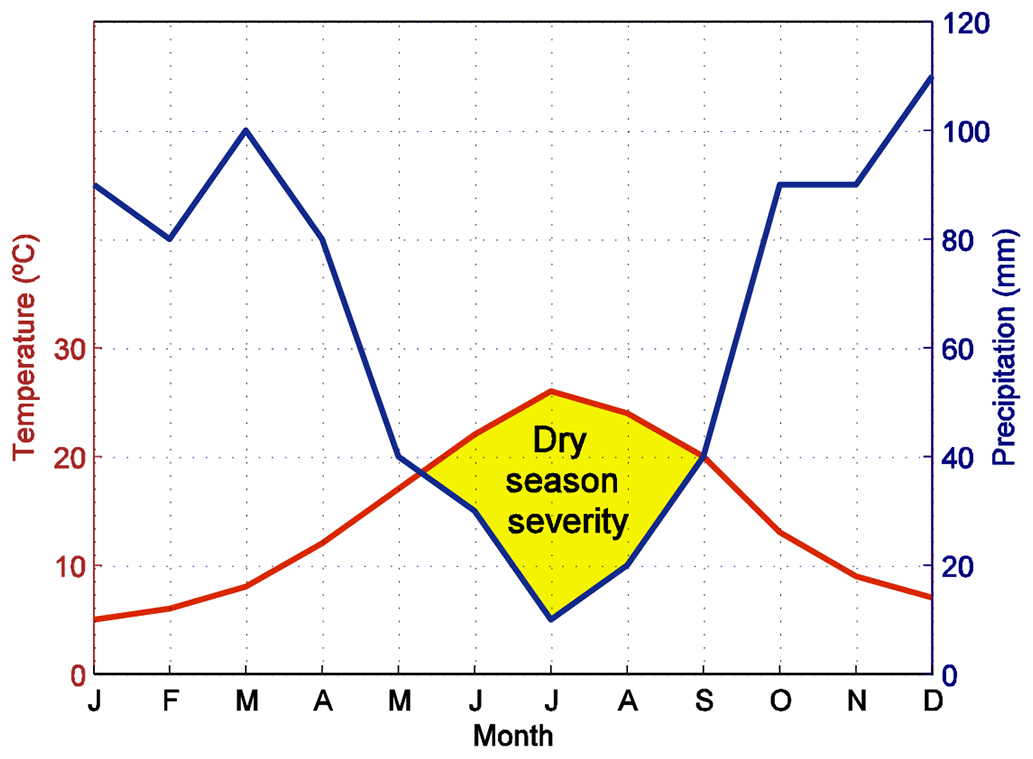
Figure 4Definition of the dry season indicator on a climatic diagram as the yellow patch area. On the y scales, 1 ∘C is equivalent to 2 mm yr−1 of precipitation, and dry season severity (DSS) is computed as the area of the region where the temperature profile is above the precipitation profile.
We used CMAP precipitation data (extracted mainly from remote-sensing data) in analysis to obtain a more realistic relationship between observed fire regimes and precipitation. We, however, could not use CMAP precipitation as climate input for the SEVER DGVM due to too short of a period of observations (CMAP started from 1979) and used instead the NCEP reanalysis precipitation data, which are longer and provide bigger ratios between lengths of transient and spin-up simulation periods in DGVM important for realistic description of vegetation and fires. Thus, discrepancies in relationships between fire and precipitation in our analysis for GFED and SEVER-FIRE cases can be, to some extent, explained by differences between NCEP and CMAP precipitation fields. These differences, however, have only a regional character and do not change our general conclusion.
The relationship of chosen variables with fire incidence is not linear, and it involves multivariable interactions. A more in-depth analysis of fire drivers would thus benefit from the use of multivariate statistics. We chose to avoid this level of complexity since the most important conclusions are likely to be drawn from straightforward analysis, as a first evaluation of a global fire model. We thus analyze fire incidence through simple bidimensional plots.
Seasonality is evaluated via the fire season peak, i.e., the month with maximum fire activity for each grid cell. Interannual variability is compared to GFED both globally and regionally to identify how the model performs on specific fire events and for different ecosystems. Again, in a way similar to fire incidence, fire interannual variability has been shown to depend on climatic and vegetation conditions. Meyn et al. (2007) highlight three types of fire ecosystems, depending on their annual fire limitation by fuel amount, readiness of fuel to burn or both, considering that the availability of ignition sources is relatively constant in time. Here, we further explore the climate impact on the readiness of fuel to burn, analyzing the implications of both fire season precipitation and fire season maximum temperature for fire interannual variability, along three ecosystem types (boreal, tropical humid and dry/semidry). To extract those variables, the extent of the fire season in a grid cell was defined as the months with more than 1∕12 of the mean annual BF. Fuel availability, the second factor highlighted by Meyn et al. (2007), is also discussed.
3.1 Fire incidence and emissions
Figure 5 shows the spatial distribution of the average annual BF for GFED and SEVER. GFED clearly depicts the most extensively burned continents, i.e., Africa and Australia. It also indicates high fire activity at the edges of the tropical forest, due to land clearing and pasture management, in Central and South America and Southeast Asia (Langner et al., 2007; Morton et al., 2006). Fire incidence is much lower in most temperate and boreal ecosystems, except for the northwestern Iberian Peninsula and Kazakhstan, both regularly affected by fires. A few other regions display high BF values, for example eastern Siberia and Alaska. Note, however, that for ecosystems with a long fire return interval, as is the case in boreal regions, the statistics computed over 10 years are very sensitive to the occurrence of important fire events during that period, and they cannot be considered representative of the long-term regional fire regime. Eastern Siberia, for example, was highly affected by fires in 1998, boosting the 10-year average (Kajii et al., 2002; Le Page et al., 2008).
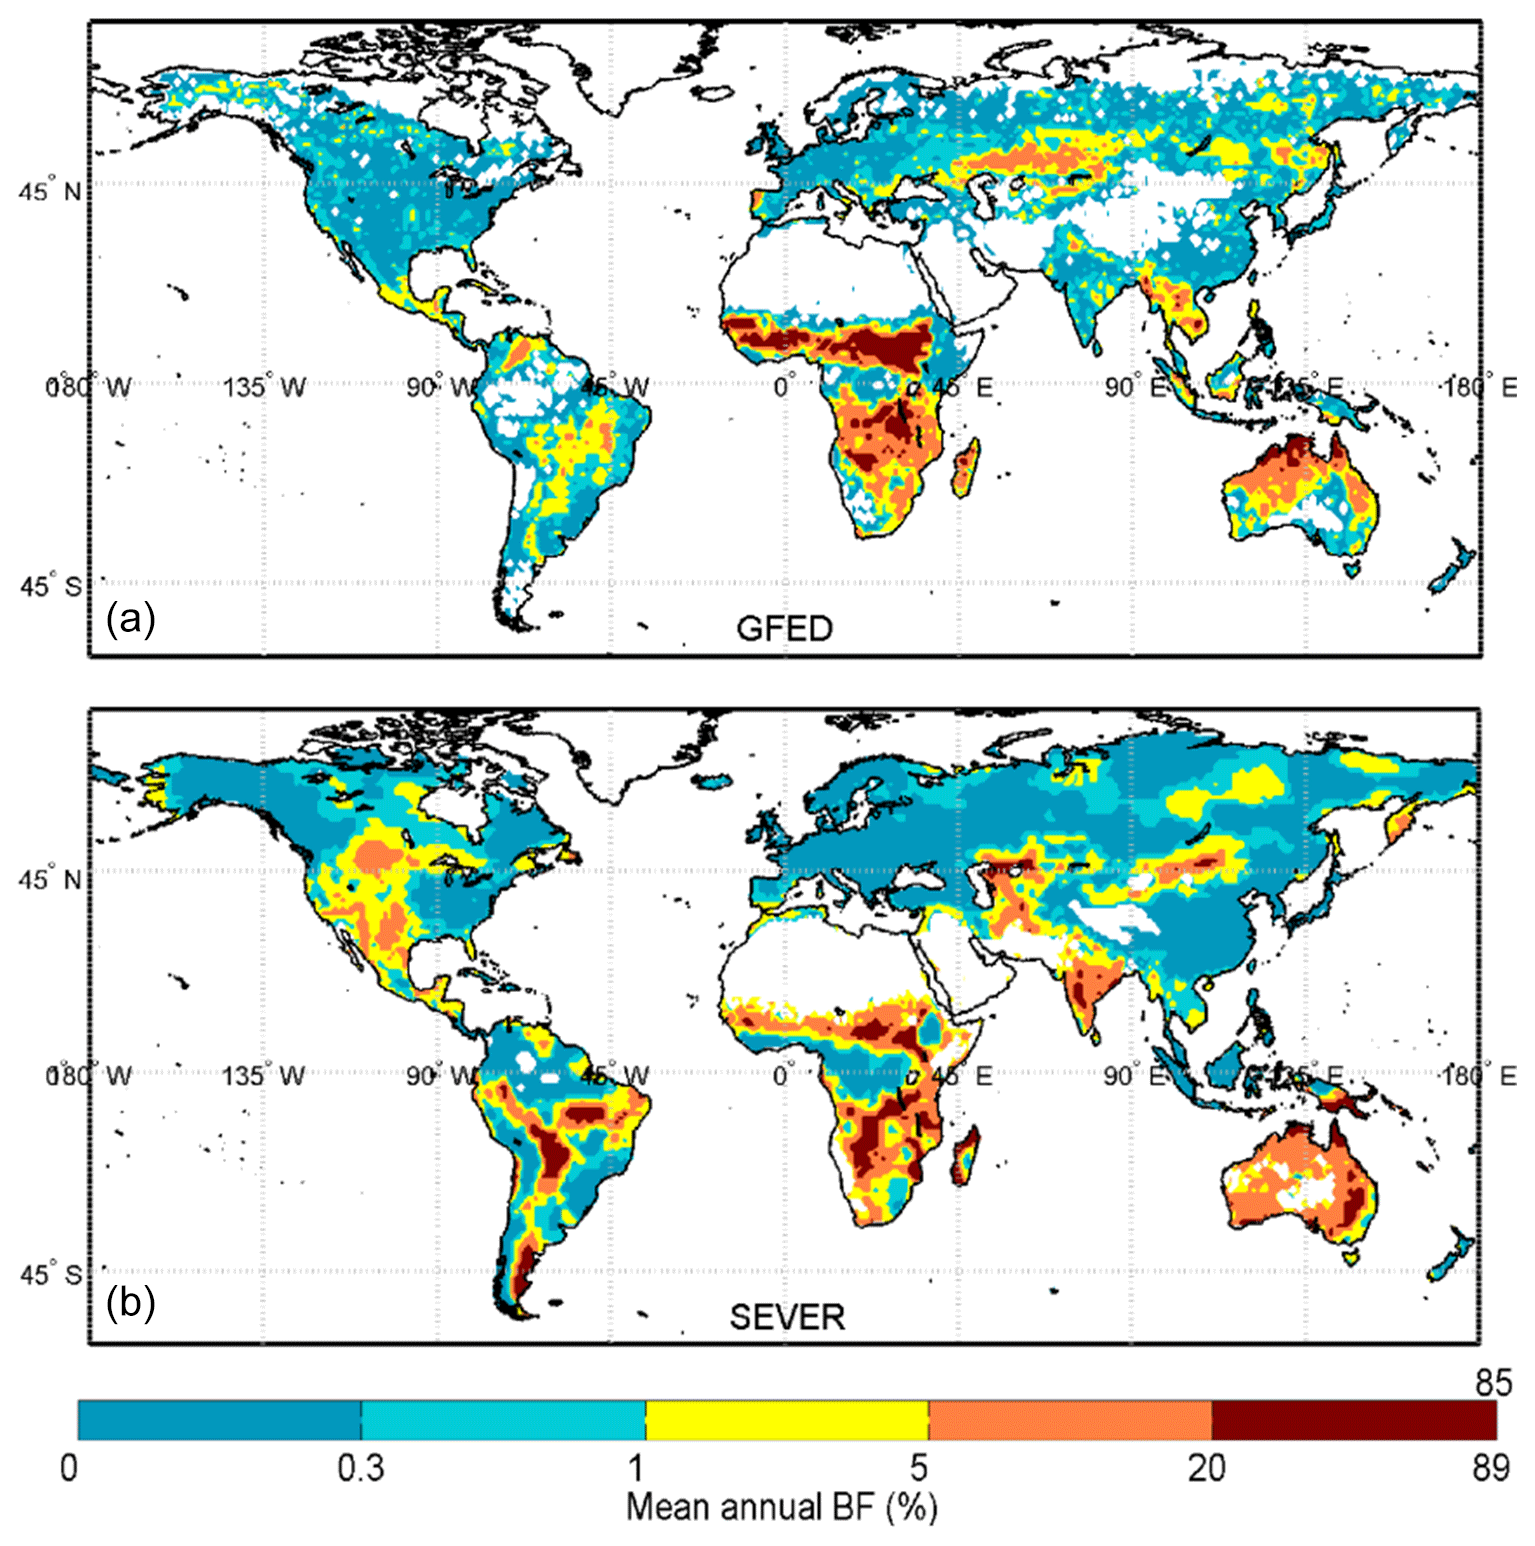
SEVER accurately reproduces some of the main spatial patterns of fire incidence, i.e., high BF values over Africa and Australia and very limited fire activity in the tropical evergreen forest and in most temperate and boreal regions. For a better emphasis of the discrepancies, Fig. 6 illustrates the mismatch between GFED and SEVER through a normalized difference burned fraction index (NDBF) computed as Eq. (14):
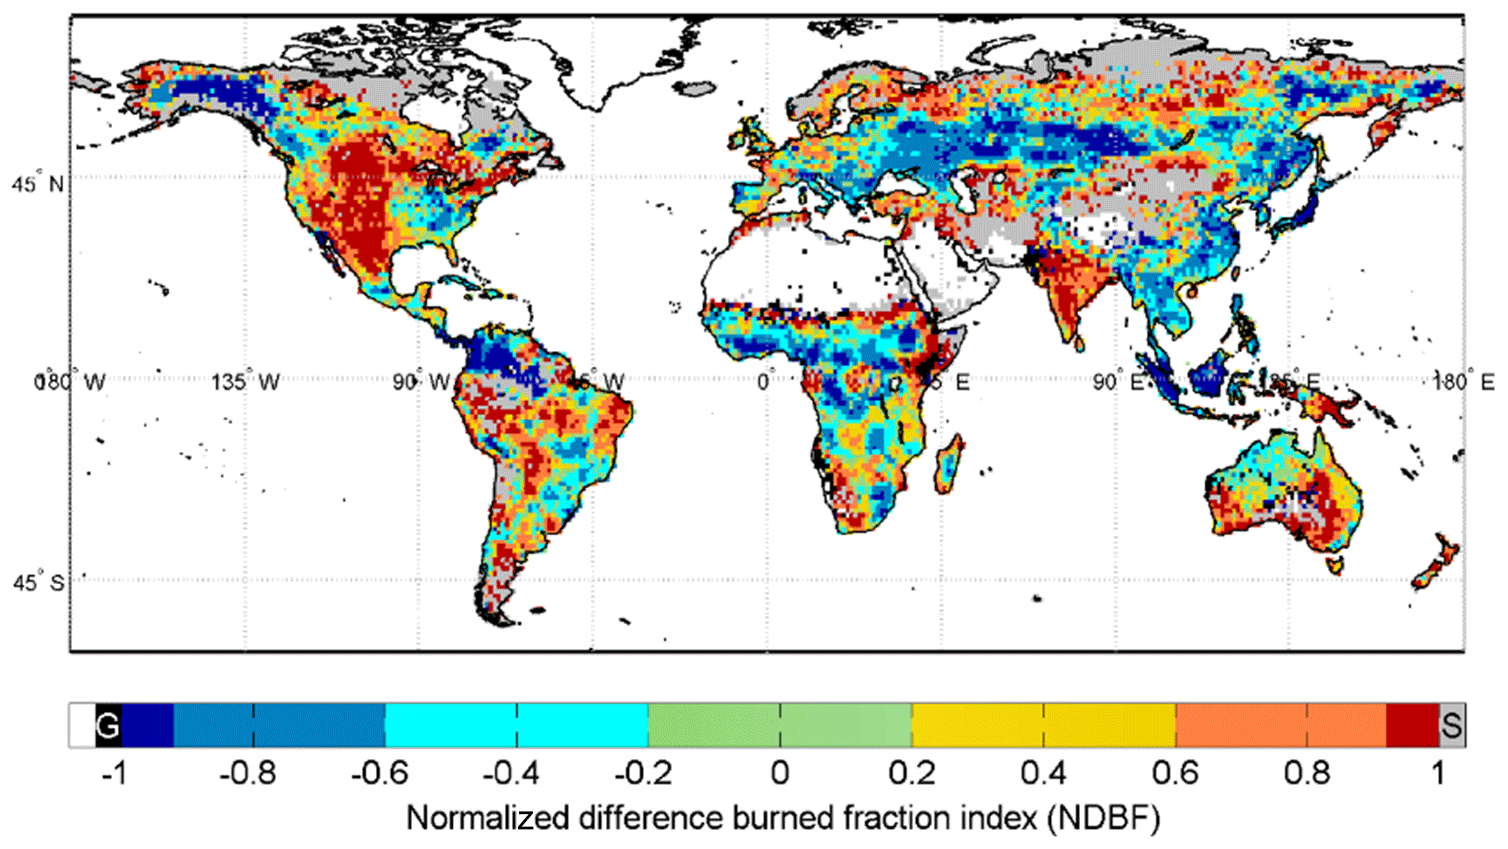
Figure 6Discrepancies in the model outputs relative to GFED observation-derived data, as represented by the normalized difference burned fraction index (see text). Black/grey colors represent grid cells in which fires only occur in GFED or SEVER.
where BFSEVER and BFGFED are the annual fire incidence averaged over 1997–2006 from the model and the observations, respectively. NDBF is constrained between −1 (large model underestimation) and 1 (large model overestimation). Finally, Fig. 7 shows the gradient of three broad PFT classes (bare soil, grass and trees), as modeled by SEVER, and the regions of large over- or underestimation of the actual tree cover percentage inferred from GLC2000. Those results and further comparison with GLC2000 clearly reveal the following patterns.
-
Regions with low observed fire incidence and the presence of grass in the model display fire overestimation, regardless of the GLC2000 land cover, and the more grass, the higher the overestimation. This is the case for example in North America, India, South America and Papua New Guinea. The overestimation in these areas can also be caused by high fractional coverage of croplands, not included in SEVER-FIRE model.
-
Regions with dominant tree cover, or with a large overestimation of trees in the model, display underestimation of fire incidence. This is the case in a large strip covering Kazakhstan and eastern Europe and in most of Southeast Asia, for example.
-
The model underestimates the very high fire incidence observed in sub-Saharan Africa.
Considering drivers of BF spatial distribution, Fig. 8 illustrates the interactive influence of paired combinations of the previously described variables. In GFED, the most affected regions are clearly constrained by annual precipitation between 500 and 1500 mm yr−1 and a dry season severity ranging from 150 to 500 mm of rainfall deficit (Fig. 8a, b). SEVER is less restrictive regarding this climatic limitation, but the general dependence patterns are similar to the observations. Concerning vegetation characteristics (Fig. 8c, d), fires affect ecosystems of all levels of NPP, although fire incidence is low at the extreme ends of the spectrum. Similar values of NPP and annual precipitation can be found in very different ecosystems, as in boreal and subtropical regions for example, with great differences in fire incidence, hence the low predictability of GFED BF by NPP and precipitation. SEVER also shows little constraint of the mean BF by the combination of those two variables. Finally, high fire incidence is biased towards rural regions with very low economic income (<600 USD capita−1 yr−1), as shown in Fig. 8e, f, with the exception of Australia, the only wealthy country highly affected by fires. SEVER also shows this rural bias, but on average allows higher fire incidence in wealthy regions, including North America.
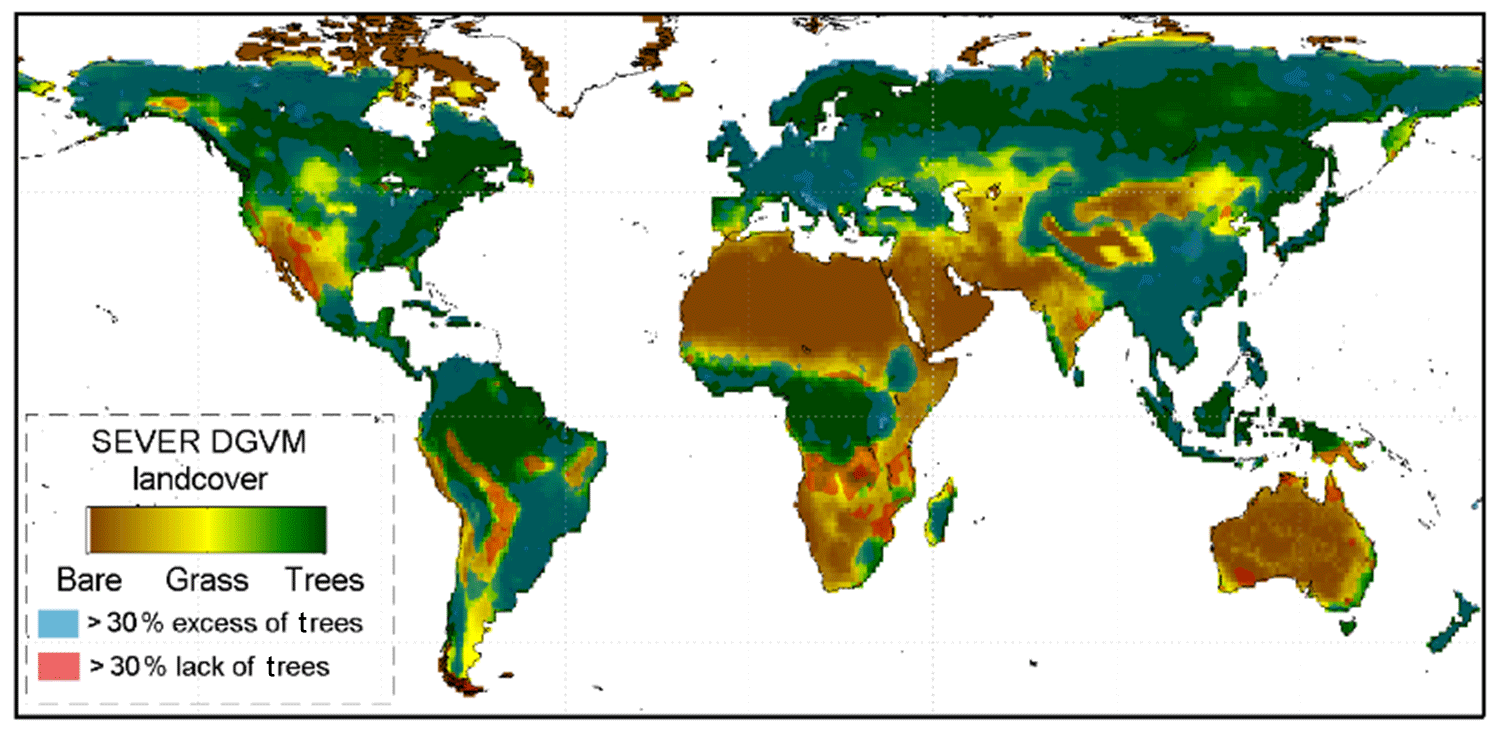
Figure 7SEVER DGVM land cover distribution, grouped in three broad classes: bare soil, grass (C3 and C4) and trees (all tree PFTs; see Table 1).
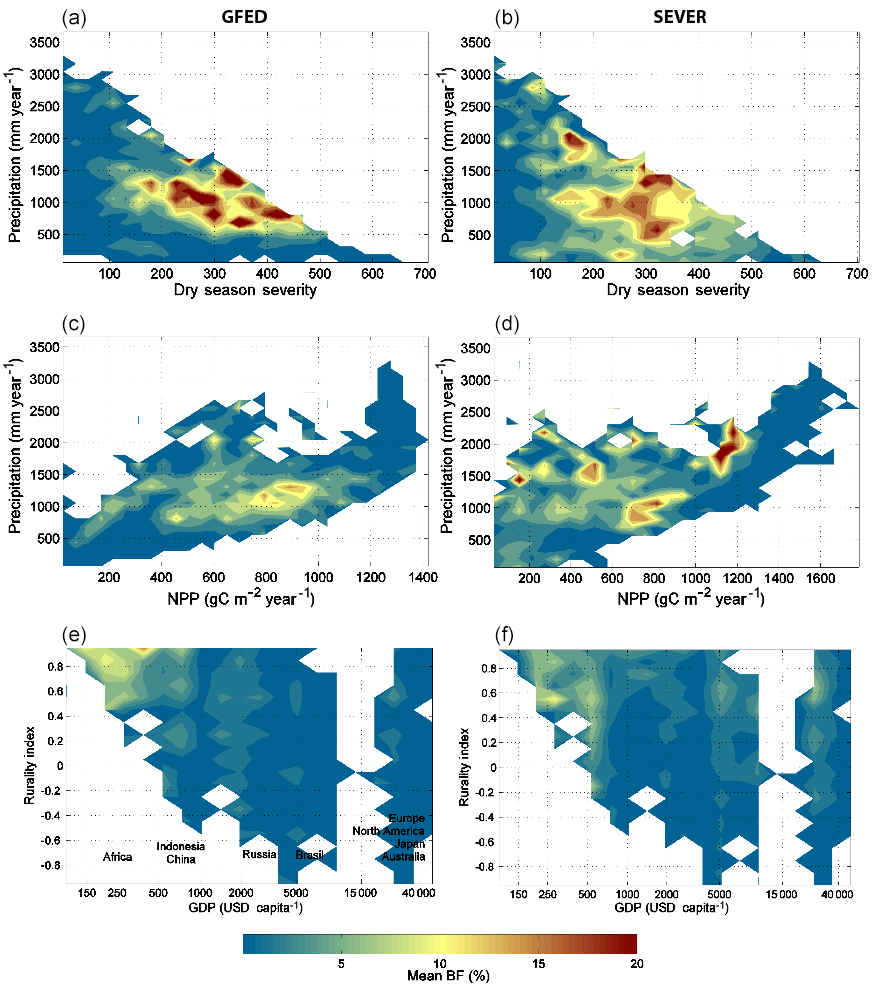
Figure 8Mean annual burned fraction over 1997–2006 (a, c, e: GFED; b, d, f: SEVER-FIRE) as a function of paired parameters. (a, b) Annual precipitation and dry season severity; (c, d) precipitation and NPP; (e, f) rurality indicator and GDP.
Finally, Fig. 9 displays the mean annual carbon emissions for GFED and SEVER. Emissions are mainly dependent on fire incidence, the type and moisture content of the affected vegetation, and fire severity. In SEVER, dead PFT individuals are entirely emitted to the atmosphere, while GFED takes into consideration combustion completeness. Consequently, the absolute level of emissions cannot be compared, being much higher in SEVER, as expected. However, the spatial patterns reveal the importance of tropical savannas and forests in the global partitioning of carbon emissions in both GFED and SEVER, as well as a significant contribution from boreal regions. We are planning to correct SEVER for combustion completeness as well as for post-fire mortality processes.
3.2 Seasonality
Figure 10 shows the spatial patterns of the month with maximum fire activity for each grid cell and the mismatch between GFED and SEVER. SEVER roughly reproduces the observed spatial patterns, with 73 % of the grid cells with a mismatch lower than or equal to 2 months. Significant discrepancies occur in sub-Saharan Africa, which peaks over March to June in the model, while GFED, along with other observation sources, indicate October to February (Barbosa et al., 1999a; Clerici et al., 2004; Dwyer et al., 2000b).

Sub-Saharan Africa is a major fire region (Dwyer et al., 2000c; Tansey et al., 2004), contributing to a large fraction of global fire activity from October to February, a period when most other regions experience little or no fire activity. As such, the inability of SEVER to reproduce fire seasonality in sub-Saharan Africa is one of its major current limitations. Delayed fire season is also significant in central North America and southeastern Australia.
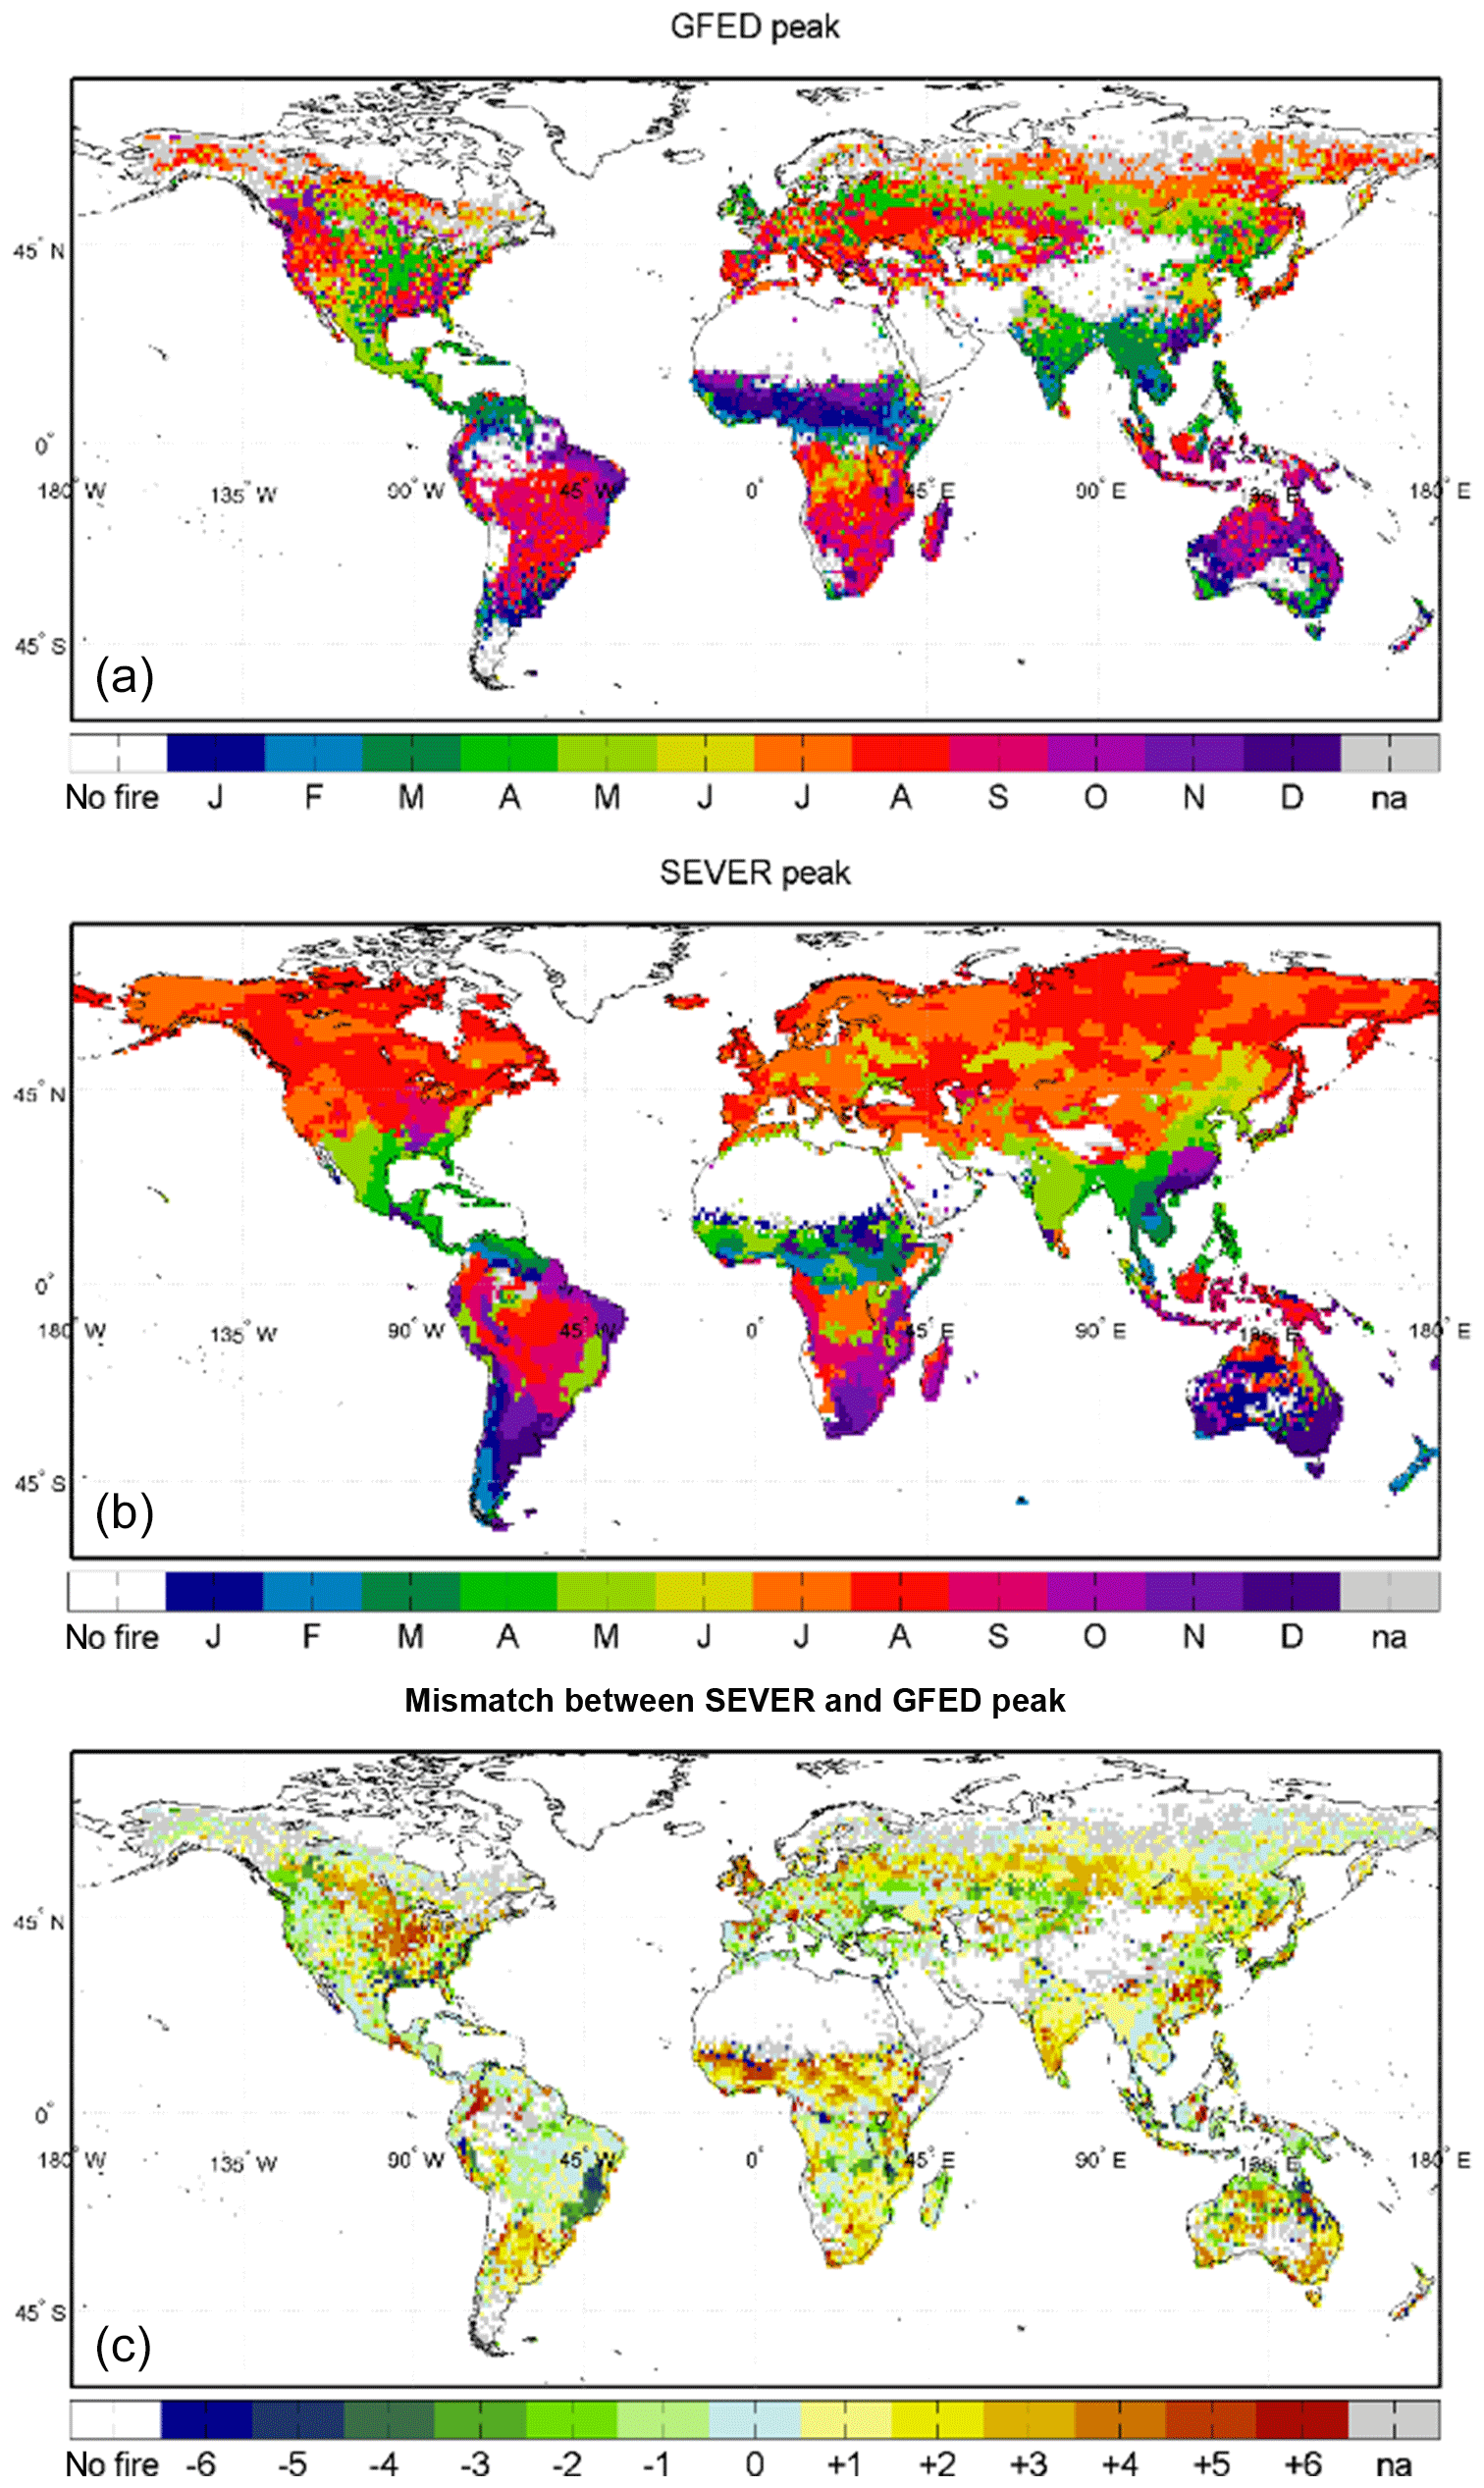
Figure 10(a) Peak of the fire season in GFED; (b) peak of the fire season in SEVER; (c) relative mismatch between SEVER and GFED peaking month of the fire season.

Figure 11Averaged correspondence of fire season with dry season anomalies over regions of sub-Saharan Africa with a delay in peak month superior or equal to 4.
The fire seasonal cycle is partially driven by climate, but it can also be strongly influenced by human activities. Figure 11 illustrates the averaged profile of the fire season and the dry season over sub-Saharan Africa for those grid cells with a SEVER fire peak discrepancy larger than or equal to 4 months. For each of these cells, we computed the monthly fire season, centered the peak month on the x axis and then derived the corresponding monthly DSS profile. Once averaged over all grid cells, the fire and DSS profiles show the temporal connection between both variables. Figure 11 clearly indicates that in the grid cells considered, the fire season is shifted towards the early dry season in GFED and towards the late dry season in SEVER.
In regions with lower use of fire as a management tool, as in boreal forests, the model performs much better and, along with the observations, tends to place the peak month in the middle or late dry season (not shown). The implication of these findings for model improvement is detailed in the discussion section.
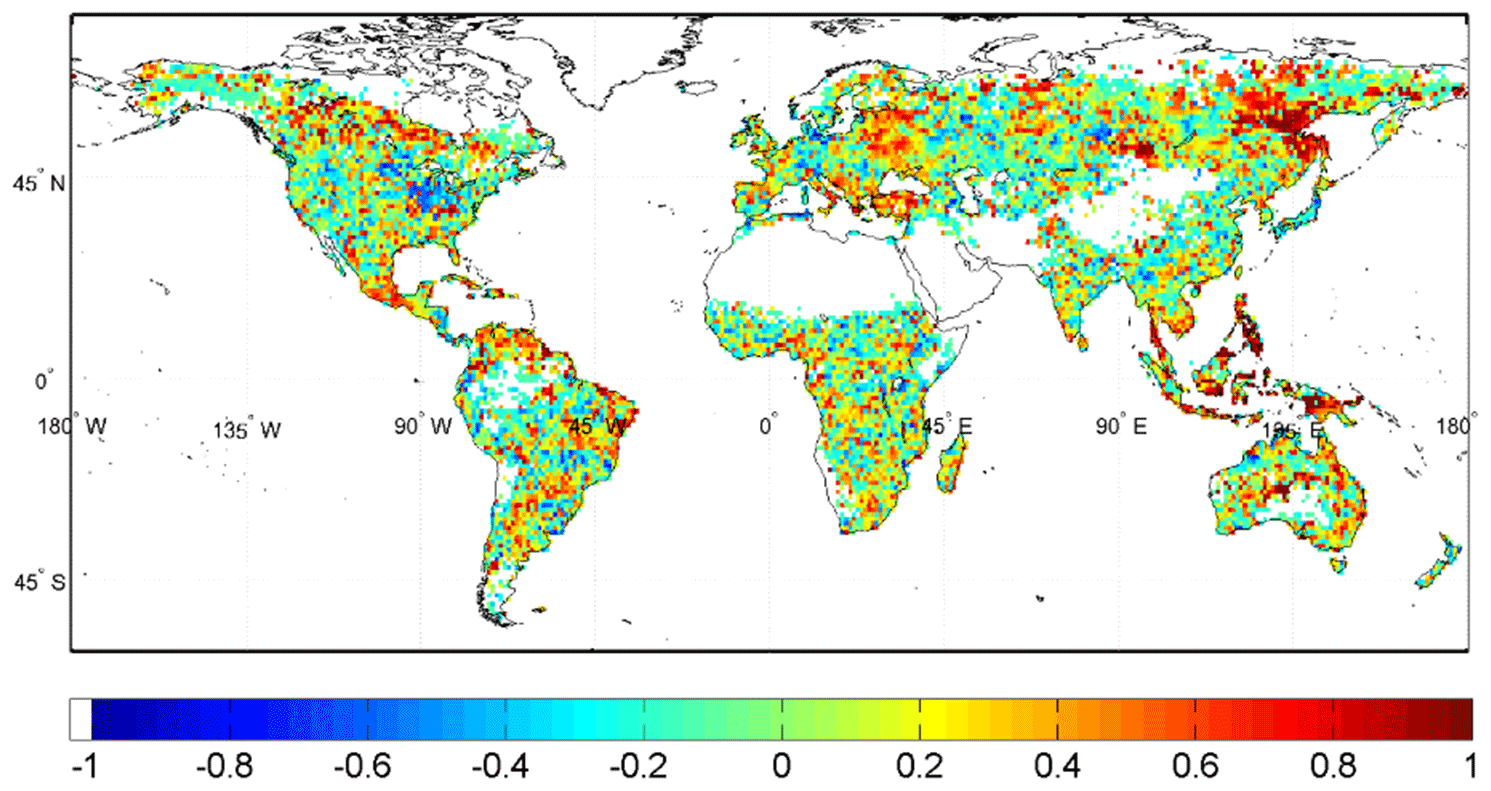
3.3 Interannual variability
Figure 12 shows the grid cell correlation between annual BF time series from GFED and SEVER. Equatorial Asia, Mexico and the majority of boreal regions, along with part of South America, are in good agreement. As discussed later, those regions are characterized by their sensitivity to climate variability, especially to the El Niño of 1997/98 (Le Page et al., 2008). The poorest agreement is found in Africa, India, China, western Russia, south of the US Great Lakes and in parts of South America.
Interannual variability is further analyzed using a set of 13 regions, originally created for GFED analysis (Giglio et al., 2006) as represented in Fig. 13. Globally, and for each of those regions, Fig. 14 shows the BF interannual anomalies from GFED and SEVER, along with the monthly distribution of fire activity as a further indicator of the timing of specific fire events and of fire seasonality. The very poor agreement in the global plot was to be expected, given the discrepancies in mean spatial fire incidence (Fig. 5), resulting in different contributions from regions to the total fire anomalies. This is clearly revealed by the monthly plot, showing that total fire activity in December–February, peaking in GFED with the large contribution of sub-Saharan Africa, is very low in SEVER. Consequently, a given fire anomaly in Africa has a much bigger global impact in GFED than in SEVER.
Regional partitioning allows identification and comparison of specific fire events more easily, especially the ones driven by large-scale climatic variability. The El Niño episode of 1997–1998 appears clearly in the BONA, CEAM, BOAS and EQAS regions in the observations and is generally captured by the model with precise timing. Annually, the importance of those events is also reproduced for EQAS and BOAS, with, respectively, 1997 and 1998 being the peaking years in GFED and SEVER. Generally, fire patterns in the other regions are not properly represented. The monthly resolution plots also give further insight into the regional scale seasonal cycle, which is generally reproduced very well, except for Northern Hemisphere Africa and Australia.
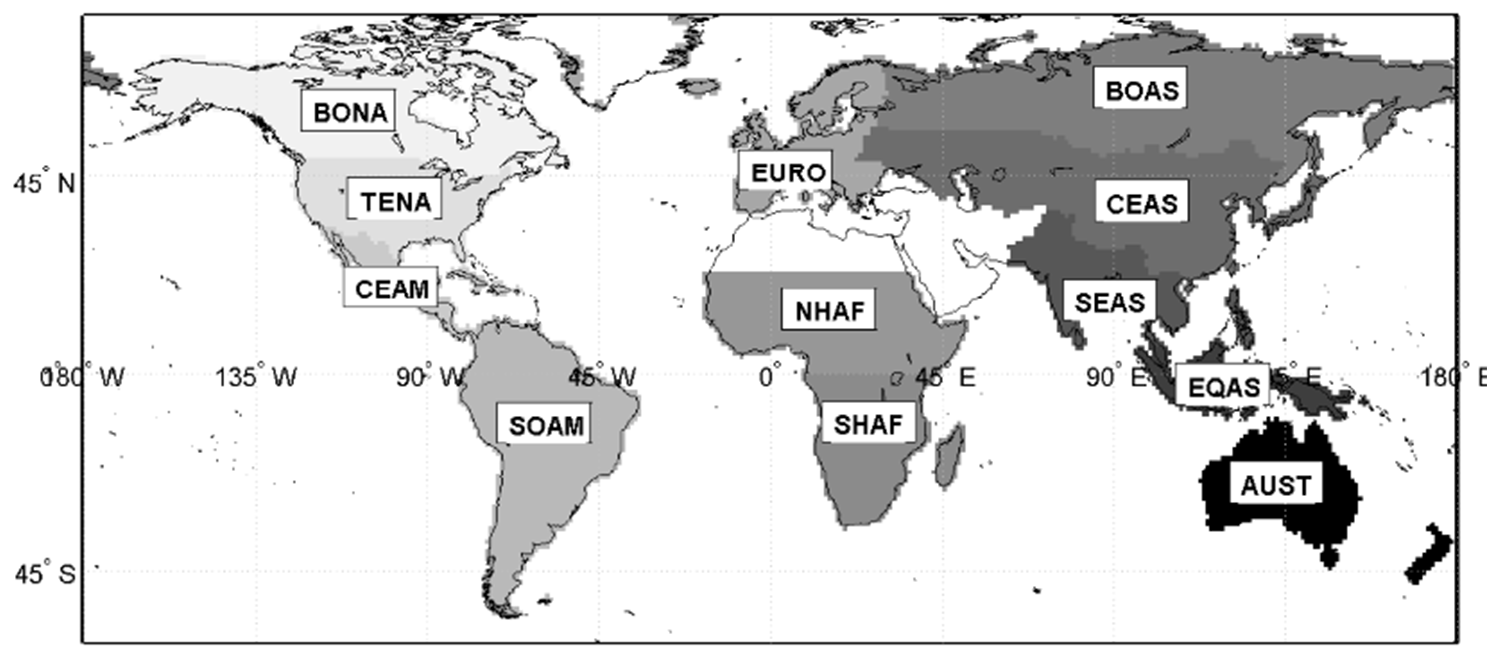
Figure 13Regions used for interannual variability analysis. BONA: boreal North America; TENA: temperate North America; CEAM: Central America; SOAM: South America; EURO: Europe; NHAF: Northern Hemisphere Africa; SHAF: Southern Hemisphere Africa; BOAS: boreal Asia; CEAS: Central Asia; SEAS: Southeast Asia; EQAS: equatorial Asia; AUST: Australia.
Figure 15 displays the dependence of fire anomalies on precipitation and temperature anomalies over the fire season, through their effect on soil and vegetation moisture status. Drought conditions are the main prerequisite for fire occurrence within all vegetation types, although in low NPP ecosystems low vegetation amount can be a limiting factor, resulting in a dependence of fire anomalies on growing season precipitation (Holmgren et al., 2006; van der Werf et al., 2008). The relationship is first pictured globally (Fig. 15), showing that both precipitation and temperature anomalies are strong drivers, constraining positive fire anomalies almost exclusively to precipitation deficits and towards positive temperature anomalies. This relationship is then analyzed in GFED for three types of ecosystems.
-
Boreal ecosystems, a spatial aggregation of the BONA and BOAS regions, are analyzed. Boreal fires are shown to be strongly dependent on temperature, at a level comparable to precipitation.
-
Tropical humid regions, selected within South America, Africa and Equatorial Asia, with the pixels with annual precipitation above 1500 mm, are analyzed. Their fire anomalies are also strongly related to precipitation, while temperature is a weak driver.
-
Semidry and dry African and Australian regions (annual precipitation below 500 mm), which are characterized by high anthropogenic fire activity, are analyzed. For those regions, both fire season precipitation and temperature anomalies are poor predictors of fire anomalies.
Those patterns are well reproduced on a global scale, such that the patterns of dependence on both climatic variables are similar in the model and in observations (Fig. 15). In boreal or tropical humid ecosystems, SEVER shows the same trends towards more or less dependence on temperature, although not as neatly as in GFED. In the case of semidry and dry African and Australian regions, the model also shows a weaker dependence on precipitation and temperature, but stronger than in the observations.
Perhaps one of the most important achievements of SEVER, as revealed by this study, is the realistic modeling of strong climate-driven fire anomalies, such as the large biomass burning events resulting from El Niño-induced droughts in various regions of the world (Figs. 12 and 14). This climate-induced variability is known to be considerable and has important consequences for atmospheric composition, the terrestrial carbon cycle and biodiversity, as discussed in the introduction. As such its accurate representation in DGVMs and ESMs is essential.
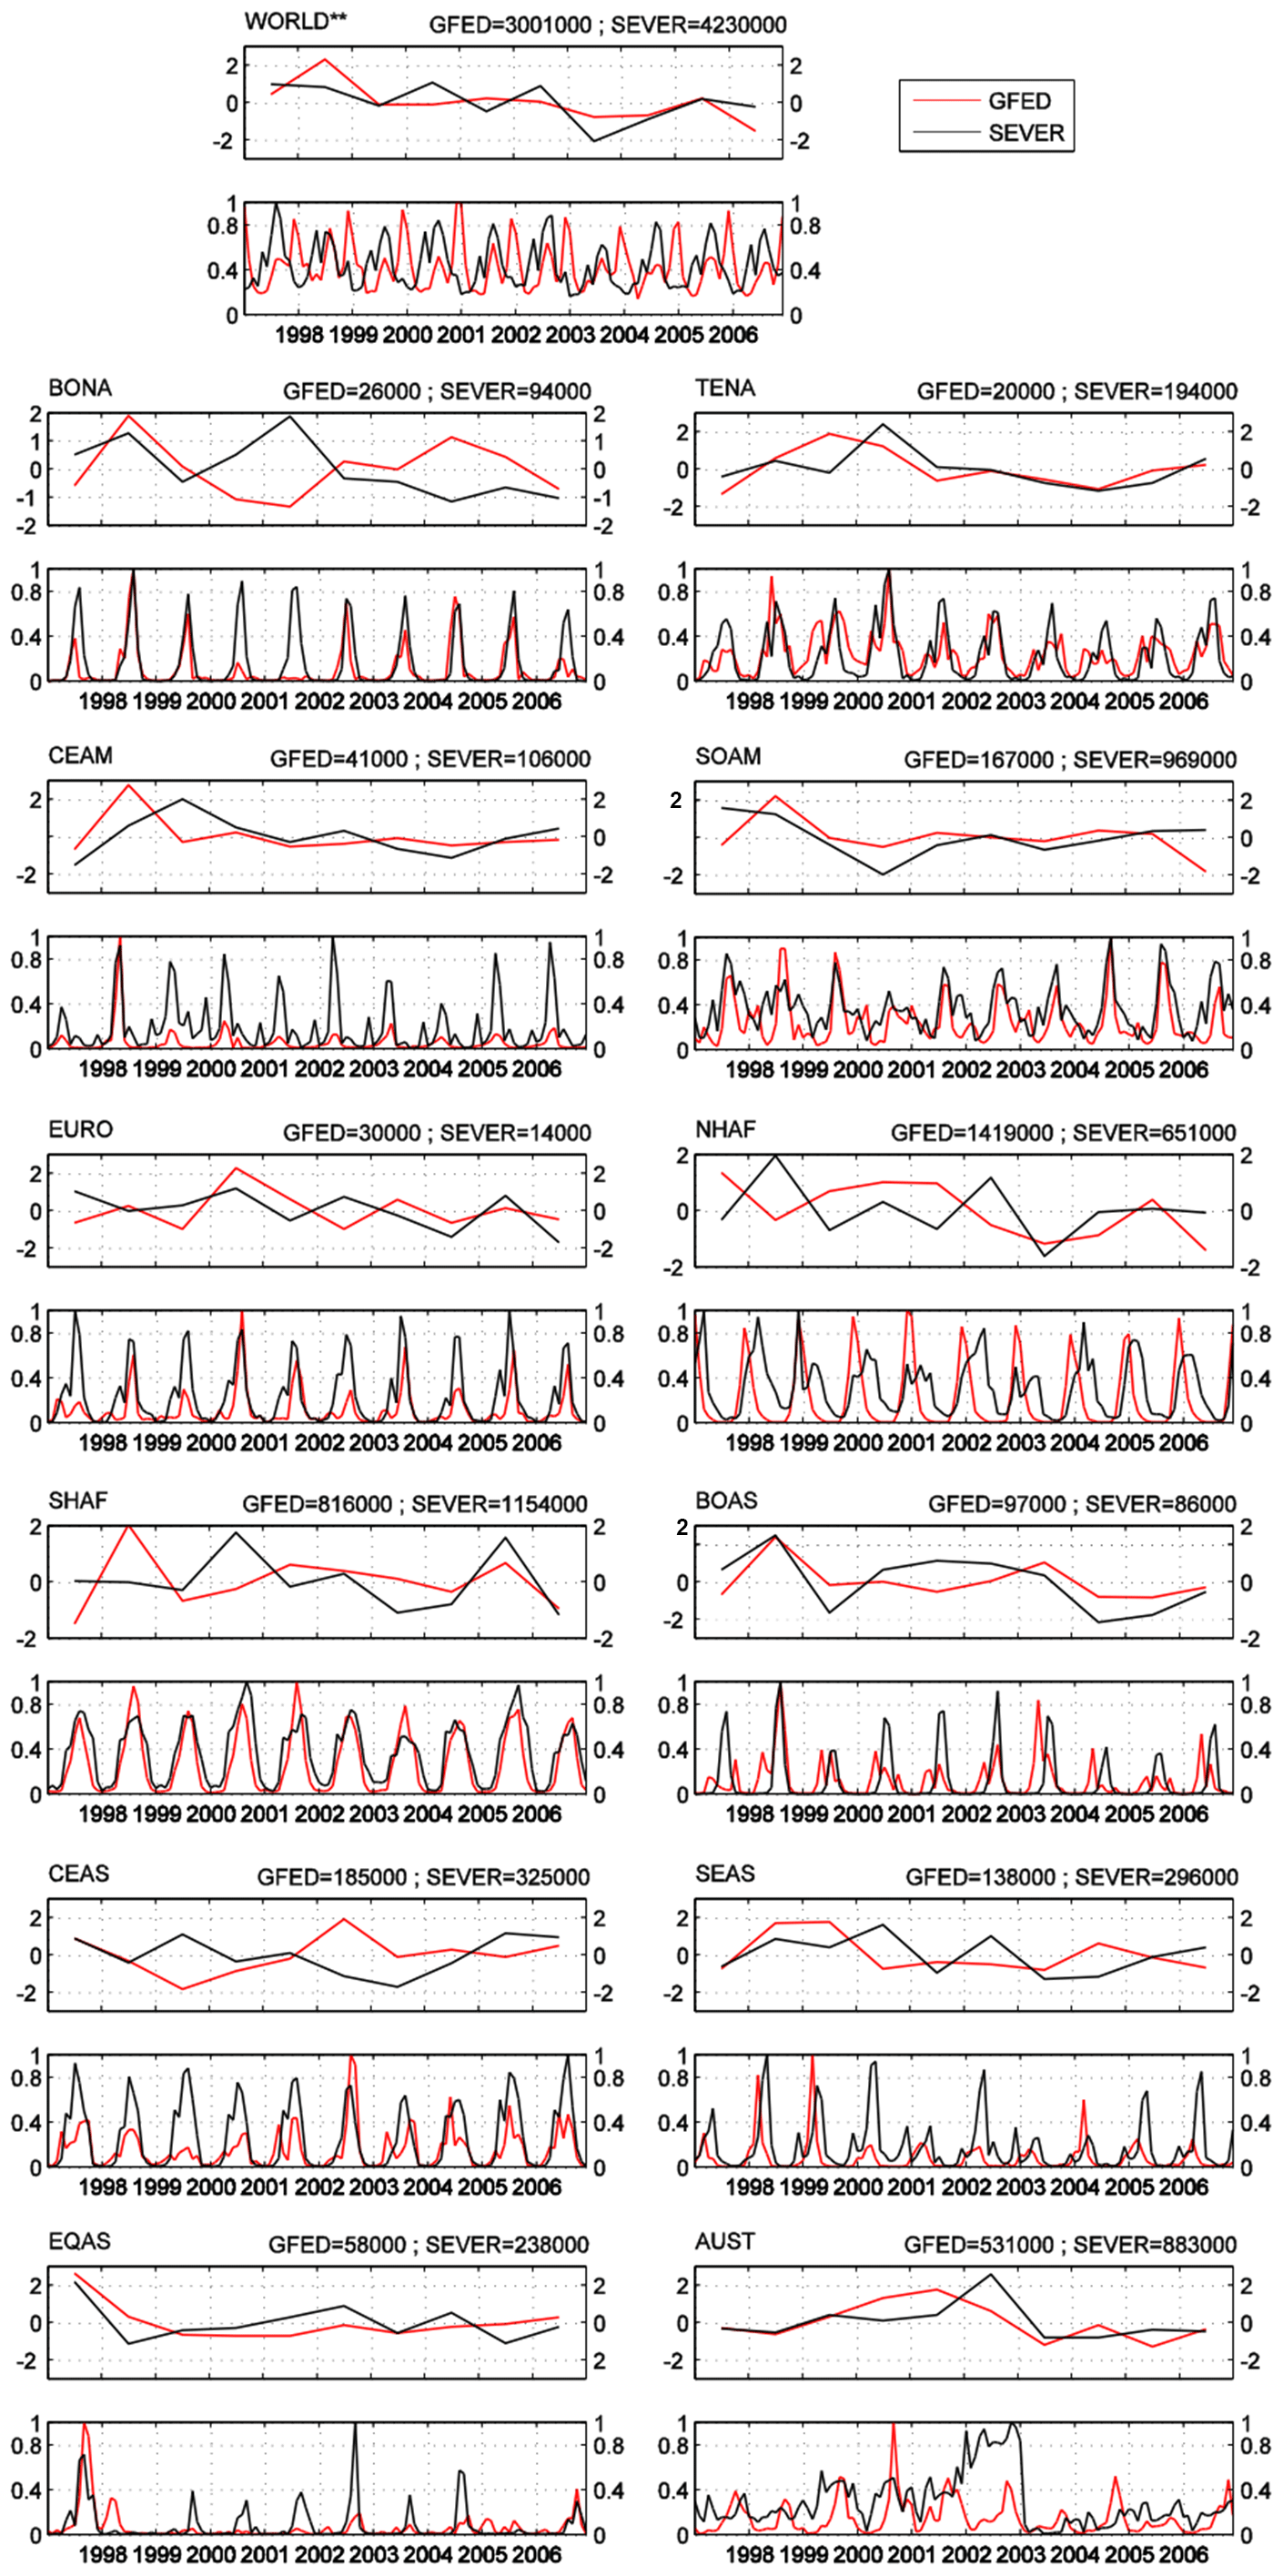
Figure 14Regional comparison of fire variability over 1997–2006. For each region subplot the top shows annual anomalies and the bottom shows monthly time series constrained to [0, 1]. The region name is indicated at the top left corner and the average fire incidence at the top right.
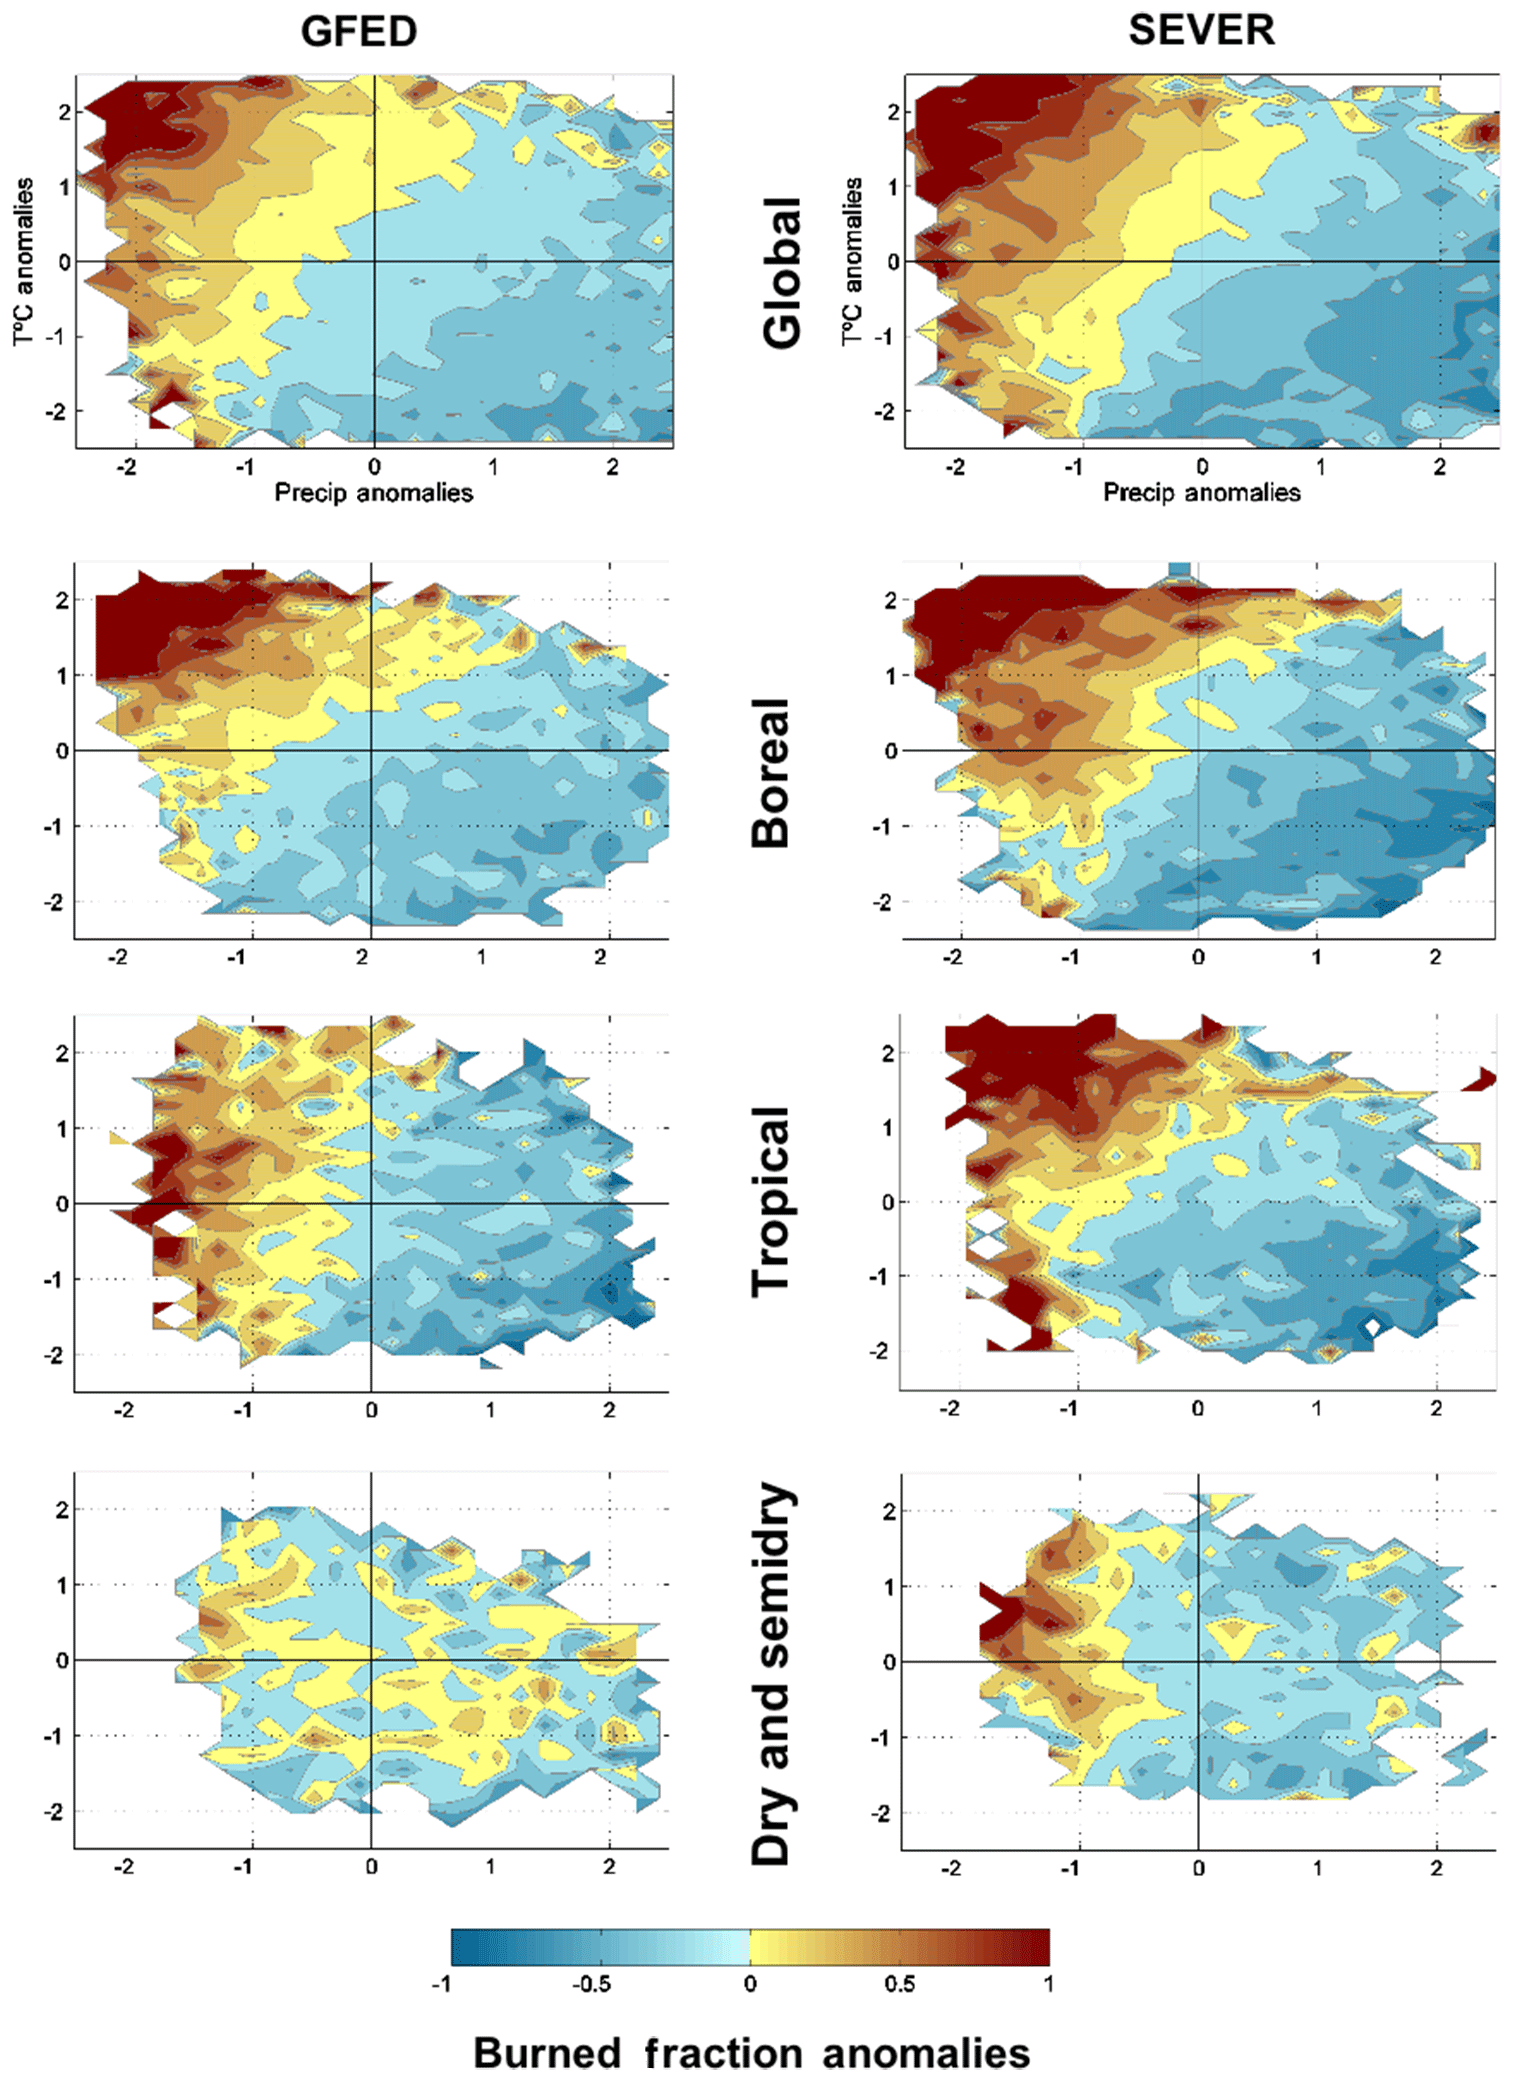
The in-depth analysis of this climatic influence highlights the variability in temperature–precipiation dependence patterns (Fig. 15). Boreal regions are characterized by great annual amplitudes of precipitation and temperature. As such, both play an important role in the dynamics of soil and vegetation moisture status, through rainfall and evaporation, and thus the strong fire dependence on both variables. In tropical humid regions, temperature variability is much lower, and only a major and prolonged precipitation deficit will result in fire-prone conditions (van der Werf et al., 2008).
Finally, semidry and dry regions of Africa and Australia are characterized by a low dependence on both parameters. Those regions are under specific climatic conditions, characterized by a rather short and irregular wet season for vegetation growth, followed by a long dry season (Peel et al., 2007). Under those conditions, fuel availability, rather than its readiness to burn, limits the occurrence of fires (Meyn et al., 2007). Under low wet season precipitation, vegetation buildup may be too low to sustain a fire. Under high wet season precipitation, vegetation growth leads to less patchy vegetation, which will dry out over the following dry season, becoming highly susceptible to fires. This scheme is very specific of those hot dry and semidry regions dominated by annual herbaceous vegetation. In the case of middle- to high-productivity ecosystems with the presence of woody vegetation, the relationship is generally reversed: enhanced wet season precipitation leads to a higher soil and vegetation moisture status, delaying desiccation over the dry season and thus reducing fire susceptibility. The contrast between those two distinct vegetation–climate–fire relationships is most evident in Australia (Fig. 16). The SEVER vegetation scheme did not perform very well over Australia, and so the role of wet season precipitation is not properly represented (not shown).
At a global scale, SEVER is shown to be fairly realistic regarding this temperature–precipitation dependence, which was to be expected since both variables are involved in the fire weather danger and fire spread calculations. However, the variability in the relationship along ecosystem types (boreal, tropical humid, semidry/dry), resulting from complex interactions among fire drivers, is not as straightforward to capture. The realistic results for such an interactive system suggest that the feedback mechanisms as defined in the SEVER DGVM–SEVER-FIRE coupled scheme do reach a reasonable level of complexity and accuracy, especially in the case of boreal and tropical ecosystems.
The mean BF (Fig. 5) is a more challenging feature for the model to replicate. Key associations represented in the fire triangle (Schoennagel et al., 2004) are, however, reproduced (Fig. 8), i.e., fire occurrence limitation by moisture in very humid ecosystems or by low fuel amount in arid regions. Unfortunately, SEVER models potential – not actual – vegetation cover, hampering an in-depth diagnostic of the fire incidence estimates. However, grass–trees appear to be over- or under-sensitive to fires, with the exception of highest-fire-incidence regions (Africa, northern Australia), where SEVER underestimates fire activity, independent from vegetation cover (Figs. 6 and 7). The main PFT parameters controlling fire incidence are bulk density (fire ignition and spread; see Table 1) and flammability (fire danger index computation). Flammability takes the same value for all tree PFTs and a distinct value for both C3 and C4 grasses together. As such, it may be a relevant factor to correct the over- or underestimation observed in grass–trees. Of critical importance for fires are also three vegetation types not yet included in the SEVER DGVM: croplands and pasture (land management fires; Pyne, 2001), savannas, and peatlands (modest land extent, but major carbon hot spot; Page et al., 2002; Turquety et al., 2007).
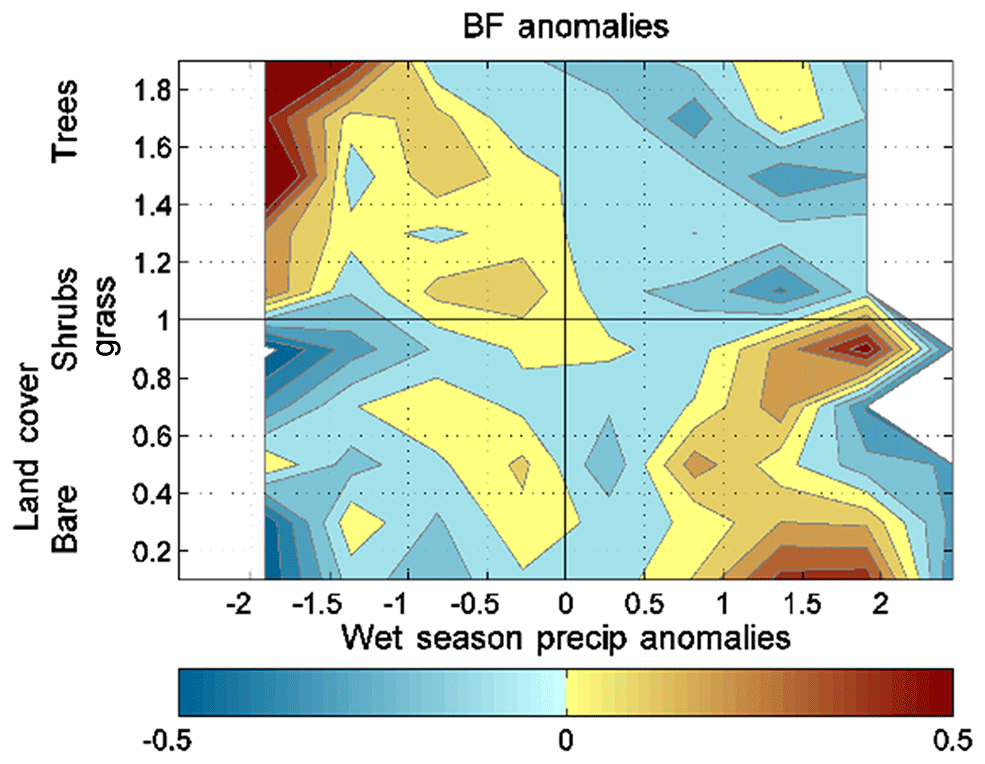
Figure 16Dependence of fire anomalies on wet season precipitation and land cover type in Australia for GFED data.
It is also essential to improve our understanding of anthropogenic impacts on fire incidence. The initial assumptions of the model, with population and wealth status as the most important human proxies, are to be reassessed carefully in regional studies, given the implication of other factors. In particular, the most evident cases of human-induced increased or decreased fire activity are related to land use type and agricultural practices, more than to economic and social status. For example, Pfeiffer et al. (2013) divided population into three according to their dominating land use types: farmers, pastorals and hunter–gathers. Kaplan et al. (2016) showed that this division determined structure of burnt areas during the Last Glacial Maximum. Thus, a simple timing function for rural population implemented into the SEVER DGVM may not work properly in Africa. Relating those ignitions to low wealth status, as in SEVER, is certainly functional after a few adjustments but seems less robust to other regions than an association of land use with timing of human pyrogenic activities and number of human ignitions. As an illustration, wealth status is not well adapted to account for high fire incidence induced by humans in northern Australia (Russell-Smith et al., 2007). Additional proxies for human pyrogenic activities implemented in SEVER-FIRE could include deforestation activities (Zhan et al., 2002) and land use and land cover data (Thenkabail et al., 2006). A fire management factor should be added to the model in the regions where a coordinated wildfire controlling program is in place (e.g., existence and actions of European Commission Emergency Response Coordination Centre in Europe; https://ec.europa.eu/echo/what-we-do/civil-protection/forest-fires_en, last access: 26 December 2018).
Advantages of including the relationship between land use and timing of pyrogenic activities in SEVER would possibly also extend to a better representation of fire seasonality. In sub-Saharan Africa for example, Fig. 11 reveals that the fire season (October–February, Fig. 10) is shifted towards early months of the dry season, which mainly results from the use of fires for agricultural and land management practices (Clerici et al., 2004). For the whole Southern Hemisphere, however, human pyrogenic activity in SEVER is set to reach a maximum from March to May and September to November, which is not realistic in the case of sub-Saharan Africa, a major fire region. Timing of pyrogenic activities in sub-Saharan Africa may be rather challenging as even implementation of land use in a global fire model (Le Page et al., 2015) still brings a 1- to 3-month delay in fire peak. Furthermore, it was demonstrated that religious affiliation modulates agricultural burning activities in the area (Pereira et al., 2015), which was not taken into account by global fire modelers at the time. It is seen that a set of regional case studies with an active use of available historical data is necessary to implement more realistic features of human pyrogenic activities in global fire models. Study and parameterization of fire duration in remote areas is necessary for improvement of burnt area calculation in these areas.
Description of lightning fires also needs improvements, starting from estimation of the number of lightning strikes effective for fire ignition. Despite lightning strike being considered, to a major extent, a stochastic event, there is visible room for better description of the number of cloud-to-ground flashes based on recent findings of the role of aerosols in electrification of thunder clouds (Stolz et al., 2015; Venevsky, 2014). In addition, a sensitivity study for critical newly implemented features timing and duration and further formal optimization for parameters of SEVER-FIRE using a teaching subset of remote-sensing data for observed burnt areas (Khvostikov et al., 2015; Rabin et al., 2015, 2018) can further improve performance of the presented global fire model.
This paper analysis results from a DGVM that includes an interactive, dynamically linked fire module. It reveals that the most important climate-driven fire features are reproduced by the model, while the dependence on vegetation characteristics and, especially, human pyrogenic activities prevents the further development of realistic estimates of fire incidence and of regional to global interannual variability. Regional adjustments of global fire models based on analysis of both historical fire statistics and records and recent satellite observations are necessary for further understanding of global fire dynamics in the past, present and future.
SEVER-FIRE is presented in its 1.0 version, which is realized in the FORTRAN language. It is open-use scientific software. The source code of SEVER-FIRE and the socioeconomic input data can be accessed freely from https://github.com/zjkwuchao/SEVER-FIRE-model.git (Wu and Venevsky, 2018).
SV developed equations of the fire model. SV and CW worked on the code. YLP and JMCP suggested the scheme of the model validation and made the validation. SV, YLP, JMCP and CW equally contributed to writing the paper.
The authors declare that they have no conflict of interest.
We thank Guido van der Werf for providing the GFED data and for helpful
comments on the paper. This study is funded by the Marie Curie Research
Training Network GREENCYCLES, contract number MRTN-CT-2004-512464
(https://www.greencycles.org/, last access: 26 December 2018), National Natural Science Foundation of China
(31570475), and Tsinghua University–Peter the Great St. Petersburg
Polytechnic University Joint Scientific Research Fund (20173080026). We
thank the editors, Iain Colin Prentice and the two anonymous
reviewers for their kind comments.
Edited by: Samuel Remy
Reviewed by: two anonymous referees
Albini, F. A.: Estimating wildfire behavior and effects, General Technical Report, INT-GTR-30,USDA Forest Service, Intermountain Forest and Range Experiment Station, Ogden Utah, 92 pp., available at: http://www.treesearch.fs.fed.us/pubs/29574 (last access: 26 December 2018), 1976.
Allen, D. J. and Pickering, K. E.: Evaluation of lightning flash rate parameterizations for use in a global chemical transport model, J. Geophys. Res.-Atmos., 107, ACH 15-11–ACH 15-21, https://doi.org/10.1029/2002jd002066, 2002.
Andela, N., Morton, D. C., Giglio, L., Paugam, R., Chen, Y., Hantson, S., van der Werf, G. R., and Randerson, J. T.: The Global Fire Atlas of individual fire size, duration, speed, and direction, Earth Syst. Sci. Data Discuss., https://doi.org/10.5194/essd-2018-89, in review, 2018.
Anderson, K.: A model to predict lightning-caused fire occurrences, Int. J. Wildland Fire, 11, 163–172, https://doi.org/10.1071/WF02001, 2002.
Andreae, M. O. and Merlet, P.: Emission of trace gases and aerosols from biomass burning, Global Biogeochem. Cy., 15, 955–966, https://doi.org/10.1029/2000GB001382, 2001.
Arino, O. and Plummer, S.: The Along Track Scanning Radiometer World Fire Altas – Detection of night-time fire activity. IGBP-DIS Working paper #23, Potsdam, Germany, available at: http://www.kalteng.org/userfiles/htmleditor/ATSR-World-Fire Atlas1998a.pdf (last access: 26 December 2018), 2001.
Arora, V. K. and Boer, G. J.: Fire as an interactive component of dynamic vegetation models, J. Geophys. Res.-Biogeo., 110, G02008, https://doi.org/10.1029/2005JG000042, 2005.
Bachelet, D., Lenihan, J., Daly, C., Neilson, R. P., Ojima, D. S., and Parton, W. J.: MC1: A Dynamic Vegetation Model for Estimating the Distribution of Vegetation and Associated Ecosystem Fluxes of Carbon, Nutrients, and Water, General Technical Report, PNW-GTR-508, USDA Forest Service, Pacific Northwest Research Station, Portland OR, 95 pp., available at: https://www.fs.usda.gov/treesearch/pubs/2923 (last access: 26 December 2018), 2001.
Barbosa, P. M., Gregoire, J. M., and Pereira, J. M. C.: An algorithm for extracting burned areas from time series of AVHRR GAC data applied at a continental scale, Remote Sens. Environ., 69, 253–263, https://doi.org/10.1016/S0034-4257(99)00026-7, 1999a.
Barbosa, P. M., Stroppiana, D., Grégoire, J.-M., and Cardoso Pereira, J. M.: An assessment of vegetation fire in Africa (1981–1991): Burned areas, burned biomass, and atmospheric emissions, Global Biogeochem. Cy., 13, 933–950, https://doi.org/10.1029/1999GB900042, 1999b.
Bartholomé, E. and Belward, A. S.: GLC2000: a new approach to global land cover mapping from Earth observation data, Int. J. Remote Sens., 26, 1959–1977, https://doi.org/10.1080/01431160412331291297, 2005.
Baudena, M., Dekker, S. C., van Bodegom, P. M., Cuesta, B., Higgins, S. I., Lehsten, V., Reick, C. H., Rietkerk, M., Scheiter, S., Yin, Z., Zavala, M. A., and Brovkin, V.: Forests, savannas, and grasslands: bridging the knowledge gap between ecology and Dynamic Global Vegetation Models, Biogeosciences, 12, 1833–1848, https://doi.org/10.5194/bg-12-1833-2015, 2015.
Benali, A., Mota, B., Carvalhais, N., Oom, D., Miller, L. M., Campagnolo, M. L., and Pereira, J. M. C.: Bimodal fire regimes unveil a global-scale anthropogenic fingerprint, Global Ecol. Biogeogr., 26, 799–811, https://doi.org/10.1111/geb.12586, 2017.
Bonan, G. B. and Doney, S. C.: Climate, ecosystems, and planetary futures: The challenge to predict life in Earth system models, Science, 359, eaam8328, https://doi.org/10.1126/science.aam8328, 2018.
Bond, W. J., Woodward, F. I., and Midgley, G. F.: The global distribution of ecosystems in a world without fire, New Phytol., 165, 525–537, https://doi.org/10.1111/j.1469-8137.2004.01252.x, 2005.
Bowman, D. M., Balch, J. K., Artaxo, P., Bond, W. J., Carlson, J. M., Cochrane, M. A., D'Antonio, C. M., Defries, R. S., Doyle, J. C., Harrison, S. P., Johnston, F. H., Keeley, J. E., Krawchuk, M. A., Kull, C. A., Marston, J. B., Moritz, M. A., Prentice, I. C., Roos, C. I., Scott, A. C., Swetnam, T. W., van der Werf, G. R., and Pyne, S. J.: Fire in the Earth system, Science, 324, 481–484, https://doi.org/10.1126/science.1163886, 2009.
Breckle, S.-W.: Walter's Vegetation of the Earth, Springer, available at: https://www.springer.com/us/book/9783540433156 (last access: 26 December 2018), 2002.
Cardoso, M. F., Nobre, C. A., Lapola, D. M., Oyama, M. D., and Sampaio, G.: Long-term potential for fires in estimates of the occurrence of savannas in the tropics, Global Ecol. Biogeogr., 17, 222–235, https://doi.org/10.1111/j.1466-8238.2007.00356.x, 2007.
Cary, G. J., Keane, R. E., Gardner, R. H., Lavorel, S., Flannigan, M. D., Davies, I. D., Li, C., Lenihan, J. M., Rupp, T. S., and Mouillot, F.: Comparison of the Sensitivity of Landscape-fire-succession Models to Variation in Terrain, Fuel Pattern, Climate and Weather, Landscape Ecol., 21, 121–137, https://doi.org/10.1007/s10980-005-7302-9, 2006.
Christian, H. J., Blakeslee, R. J., Boccippio, D. J., Boeck, W. L., Buechler, D. E., Driscoll, K. T., Goodman, S. J., Hall, J. M., Koshak, W. J., Mach, D. M., and Stewart, M. F.: Global frequency and distribution of lightning as observed from space by the Optical Transient Detector, J. Geophys. Res.-Atmos., 108, ACL 4-1–ACL 4-15, https://doi.org/10.1029/2002JD002347, 2003.
Clerici, N., Boschetti, L., Eva, H., and Gregoire, J. M.: Assessing vegetation fires activity and its drivers in West-Central Africa using MODIS and TRMM data, in: 2004 IEEE International Geoscience and Remote Sensing Symposium, Anchorage, AK, USA, 20–24 September 2004, https://doi.org/10.1109/IGARSS.2004.1370768, 2004.
Crevoisier, C., Shevliakova, E., Gloor, M., Wirth, C., and Pacala, S.: Drivers of fire in the boreal forests: Data constrained design of a prognostic model of burned area for use in dynamic global vegetation models, J. Geophys. Res.-Atmos., 112, D24112, https://doi.org/10.1029/2006JD008372, 2007.
Duncan, B. N., Martin, R. V., Staudt, A. C., Yevich, R., and Logan, J. A.: Interannual and seasonal variability of biomass burning emissions constrained by satellite observations, J. Geophys. Res.-Atmos., 108, ACH 1-1–ACH 1-22, https://doi.org/10.1029/2002JD002378, 2003.
Dwyer, E., Gregoire, J. M., and Pereira, J. M. C.: Climate and vegetation as driving factors in global fire activity. In: Biomass Burning and Its Inter-Relationships with the Climate System, edited by: Innes, J. L., Beniston, M., and Verstraete, M. M., Advances in Global Change Research, available at: https://link.springer.com/chapter/10.1007/0-306-47959-1_10 (last access: 26 December 2018), 2000a.
Dwyer, E., Pereira, J. M. C., Gregoire, J. M., and DaCamara, C. C.: Characterization of the spatio-temporal patterns of global fire activity using satellite imagery for the period April 1992 to March 1993, J. Biogeogr., 27, 57–69, https://doi.org/10.1046/j.1365-2699.2000.00339.x, 2000b.
Dwyer, E., Pinnock, S., Gregoire, J. M., and Pereira, J. M. C.: Global spatial and temporal distribution of vegetation fire as determined from satellite observations, Int. J. Remote Sens., 21, 1289–1302, 2000c.
Giglio, L., Kendall, J. D., and Mack, R.: A multi-year active fire dataset for the tropics derived from the TRMM VIRS, Int. J. Remote Sens., 24, 4505–4525, https://doi.org/10.1080/014311600210182, 2003.
Giglio, L., van der Werf, G. R., Randerson, J. T., Collatz, G. J., and Kasibhatla, P.: Global estimation of burned area using MODIS active fire observations, Atmos. Chem. Phys., 6, 957–974, https://doi.org/10.5194/acp-6-957-2006, 2006.
Hammill, K. A. and Bradstock, R. A.: Remote sensing of fire severity in the Blue Mountains: influence of vegetation type and inferring fire intensity, Int. J. Wildland Fire, 15, 213–226, https://doi.org/10.1071/WF05051, 2006.
Hantson, S., Arneth, A., Harrison, S. P., Kelley, D. I., Prentice, I. C., Rabin, S. S., Archibald, S., Mouillot, F., Arnold, S. R., Artaxo, P., Bachelet, D., Ciais, P., Forrest, M., Friedlingstein, P., Hickler, T., Kaplan, J. O., Kloster, S., Knorr, W., Lasslop, G., Li, F., Mangeon, S., Melton, J. R., Meyn, A., Sitch, S., Spessa, A., van der Werf, G. R., Voulgarakis, A., and Yue, C.: The status and challenge of global fire modelling, Biogeosciences, 13, 3359–3375, https://doi.org/10.5194/bg-13-3359-2016, 2016.
Holmgren, M., Stapp, P., Dickman, C. R., Gracia, C., Grahams, S., Gutierrez, J. R., Hice, C., Jaksic, F., Kelt, D. A., Letnic, M., Lima, M., Lopez, B. C., Meserve, P. L., Milstead, W. B., Polis, G. A., Previtali, M. A., Michael, R., Sabate, S., and Squeo, F. A.: Extreme climatic events shape arid and semiarid ecosystems, Front. Ecol. Environ., 4, 87–95, https://doi.org/10.1890/1540-9295(2006)004[0087:ECESAA]2.0.CO;2, 2006.
Imhoff, M. L., Bounoua, L., Ricketts, T., Loucks, C., Harriss, R., and Lawrence, W. T.: Global patterns in human consumption of net primary production, Nature, 429, 870–873, https://doi.org/10.1038/nature02619, 2004.
Kajii, Y., Kato, S., Streets, D. G., Tsai, N. Y., Shvidenko, A., Nilsson, S., McCallum, I., Minko, N. P., Abushenko, N., Altyntsev, D., and Khodzer, T. V.: Boreal forest fires in Siberia in 1998: Estimation of area burned and emissions of pollutants by advanced very high resolution radiometer satellite data, J. Geophys. Res.-Atmos., 107, ACH 4-1–ACH 4-8, https://doi.org/10.1029/2001JD001078, 2002.
Kalnay, E., Kanamitsu, M., Kistler, R., Collins, W., Deaven, D., Gandin, L., Iredell, M., Saha, S., White, G., Woollen, J., Zhu, Y., Chelliah, M., Ebisuzaki, W., Higgins, W., Janowiak, J., Mo, K. C., Ropelewski, C., Wang, J., Leetmaa, A., Reynolds, R., Jenne, R., and Joseph, D.: The NCEP/NCAR 40-Year Reanalysis Project, B. Am. Meteorol. Soc., 77, 437–472, https://doi.org/10.1175/1520-0477(1996)077<0437:TNYRP>2.0.CO;2, 1996.
Kaplan, J. O., Pfeiffer, M., Kolen, J. C. A., and Davis, B. A. S.: Large Scale Anthropogenic Reduction of Forest Cover in Last Glacial Maximum Europe, PLoS One, 11, e0166726, https://doi.org/10.1371/journal.pone.0166726, 2016.
Kelley, D. I. and Harrison, S. P.: Enhanced Australian carbon sink despite increased wildfire during the 21st century, Environ. Res. Lett., 9, 104015, https://doi.org/10.1088/1748-9326/9/10/104015, 2014.
Khvostikov, S., Venevsky, S., and Bartalev, S.: Regional adaptation of a dynamic global vegetation model using a remote sensing data derived land cover map of Russia, Environ. Res. Lett., 10, 125007, https://doi.org/10.1088/1748-9326/10/12/125007, 2015.
Knorr, W., Kaminski, T., Arneth, A., and Weber, U.: Impact of human population density on fire frequency at the global scale, Biogeosciences, 11, 1085–1102, https://doi.org/10.5194/bg-11-1085-2014, 2014.
Korovin, G. N.: Analysis of the Distribution of Forest Fires in Russia, in: Fire in Ecosystems of Boreal Eurasia, edited by: Goldammer, J. G. and Furyaev, V. V., 48, Springer, Dordrecht, available at: https://www.springer.com/la/book/9780792341376 (last access: 26 December 2018), 1996.
Langenfelds, R. L., Francey, R. J., Pak, B. C., Steele, L. P., Lloyd, J., Trudinger, C. M., and Allison, C. E.: Interannual growth rate variations of atmospheric CO2 and its δ13C, H2, CH4, and CO between 1992 and 1999 linked to biomass burning, Global Biogeochem. Cy., 16, 1048, https://doi.org/10.1029/2001GB001466, 2002.
Langner, A., Miettinen, J., and Siegert, F.: Land cover change 2002–2005 in Borneo and the role of fire derived from MODIS imagery, Glob. Change Biol., 13, 2329–2340, https://doi.org/10.1111/j.1365-2486.2007.01442.x, 2007.
Lasslop, G., Thonicke, K., and Kloster, S.: SPITFIRE within the MPI Earth system model: Model development and evaluation, J. Adv. Model. Earth Syst., 6, 740–755, https://doi.org/10.1002/2013MS000284, 2014.
Lasslop, G., Hantson, S., and Kloster, S.: Influence of wind speed on the global variability of burned fraction: a global fire model's perspective, Int. J. Wildland Fire, 24, 989–1000, https://doi.org/10.1071/WF15052, 2015.
Latham, D. J. and Schlieter, J. A.: Ignition probabilities of wildland fuels based on simulated lightning discharges, Research Paper INT-411, USDA Forest Service, Intermountain Forest and Range Experiment Station, Ogden Utah, 16 pp., available at: https://www.frames.gov/catalog/8165 (last access: 26 December 2018), 1989.
Lehsten, V., Tansey, K., Balzter, H., Thonicke, K., Spessa, A., Weber, U., Smith, B., and Arneth, A.: Estimating carbon emissions from African wildfires, Biogeosciences, 6, 349–360, https://doi.org/10.5194/bg-6-349-2009, 2009.
Lenihan, J. M. and Bachelet, D.: Historical Climate and Suppression Effects on Simulated Fire and Carbon Dynamics in the Conterminous United States, in: Global Vegetation Dynamics, John Wiley & Sons, Inc, https://doi.org/10.1002/9781119011705.ch2, 2015.
Le Page, Y.: Anthropogenic and climatic control upon vegetation fires: new insights from satellite observations to assess current and future impacts, PhD, Technical University of Lisbon, Lisbon, Portugal, 143 pp., 2009.
Le Page, Y., Pereira, J. M. C., Trigo, R., da Camara, C., Oom, D., and Mota, B.: Global fire activity patterns (1996–2006) and climatic influence: an analysis using the World Fire Atlas, Atmos. Chem. Phys., 8, 1911–1924, https://doi.org/10.5194/acp-8-1911-2008, 2008.
Le Page, Y., Morton, D., Bond-Lamberty, B., Pereira, J. M. C., and Hurtt, G.: HESFIRE: a global fire model to explore the role of anthropogenic and weather drivers, Biogeosciences, 12, 887–903, https://doi.org/10.5194/bg-12-887-2015, 2015.
Le Quéré, C., Moriarty, R., Andrew, R. M., Peters, G. P., Ciais, P., Friedlingstein, P., Jones, S. D., Sitch, S., Tans, P., Arneth, A., Boden, T. A., Bopp, L., Bozec, Y., Canadell, J. G., Chini, L. P., Chevallier, F., Cosca, C. E., Harris, I., Hoppema, M., Houghton, R. A., House, J. I., Jain, A. K., Johannessen, T., Kato, E., Keeling, R. F., Kitidis, V., Klein Goldewijk, K., Koven, C., Landa, C. S., Landschützer, P., Lenton, A., Lima, I. D., Marland, G., Mathis, J. T., Metzl, N., Nojiri, Y., Olsen, A., Ono, T., Peng, S., Peters, W., Pfeil, B., Poulter, B., Raupach, M. R., Regnier, P., Rödenbeck, C., Saito, S., Salisbury, J. E., Schuster, U., Schwinger, J., Séférian, R., Segschneider, J., Steinhoff, T., Stocker, B. D., Sutton, A. J., Takahashi, T., Tilbrook, B., van der Werf, G. R., Viovy, N., Wang, Y.-P., Wanninkhof, R., Wiltshire, A., and Zeng, N.: Global carbon budget 2014, Earth Syst. Sci. Data, 7, 47–85, https://doi.org/10.5194/essd-7-47-2015, 2015.
Levine, J. S., Bobbe, T., Ray, N., Witt, R. G., and Singh, A.: Wildland fires and the environment: A Global Synthesis, UNEP/DEIAEW/TR.99-1, United Nations Environ. Prog., Geneva, Switzerland, 1999.
Li, F., Levis, S., and Ward, D. S.: Quantifying the role of fire in the Earth system – Part 1: Improved global fire modeling in the Community Earth System Model (CESM1), Biogeosciences, 10, 2293–2314, https://doi.org/10.5194/bg-10-2293-2013, 2013.
Melekhov, I.: Lesnaia Pirologia, Lesnaia promyshlennost', Moskow, Moskow, Russia, 1978.
Meyn, A., White, P. S., Buhk, C., and Jentsch, A.: Environmental drivers of large, infrequent wildfires: the emerging conceptual model, Prog. Phys. Geogr., 31, 287–312, https://doi.org/10.1177/0309133307079365, 2007.
Morton, D. C., DeFries, R. S., Shimabukuro, Y. E., Anderson, L. O., Arai, E., Espirito-Santo, F. D., Freitas, R., and Morisette, J.: Cropland expansion changes deforestation dynamics in the southern Brazilian Amazon, P. Natl. Acad. Sci. USA, 103, 14637–14641, https://doi.org/10.1073/pnas.0606377103, 2006.
Page, S. E., Siegert, F., Rieley, J. O., Boehm, H. D. V., Jaya, A., and Limin, S.: The amount of carbon released from peat and forest fires in Indonesia during 1997, Nature, 420, 61–65, https://doi.org/10.1038/nature01131, 2002.
Pechony, O. and Shindell, D. T.: Fire parameterization on a global scale, J. Geophys. Res.-Atmos., 114, D16115, https://doi.org/10.1029/2009JD011927, 2009.
Peel, M. C., Finlayson, B. L., and McMahon, T. A.: Updated world map of the Köppen-Geiger climate classification, Hydrol. Earth Syst. Sci., 11, 1633–1644, https://doi.org/10.5194/hess-11-1633-2007, 2007.
Pereira, J. M. C., Pereira, B. S., Barbosa, P., Stroppiana, D., Vasconcelos, M. J. P., and Gregoire, J. M.: Satellite monitoring of fire in the EXPRESSO study area during the 1996 dry season experiment: Active fires, burnt area, and atmospheric emissions, J. Geophys. Res.-Atmos., 104, 30701–30712, https://doi.org/10.1029/1999JD900422, 1999.
Pereira, J. M. C., Oom, D., Pereira, P., Turkman, A. A., and Turkman, K. F.: Religious Affiliation Modulates Weekly Cycles of Cropland Burning in Sub-Saharan Africa, PLoS One, 10, e0139189, https://doi.org/10.1371/journal.pone.0139189, 2015.
Pfeiffer, M., Spessa, A., and Kaplan, J. O.: A model for global biomass burning in preindustrial time: LPJ-LMfire (v1.0), Geosci. Model Dev., 6, 643–685, https://doi.org/10.5194/gmd-6-643-2013, 2013.
Prentice, I. C., Kelley, D. I., Foster, P. N., Friedlingstein, P., Harrison, S. P., and Bartlein, P. J.: Modeling fire and the terrestrial carbon balance, Global Biogeochem. Cy., 25, GB3005, https://doi.org/10.1029/2010GB003906, 2011.
Pyne, S. J.: Fire: A brief history. University of Washington Press, available at: http://www.environmentandsociety.org/mml/fire-brief-history (last access: 26 December 2018), 2001.
Rabin, S. S., Magi, B. I., Shevliakova, E., and Pacala, S. W.: Quantifying regional, time-varying effects of cropland and pasture on vegetation fire, Biogeosciences, 12, 6591–6604, https://doi.org/10.5194/bg-12-6591-2015, 2015.
Rabin, S. S., Melton, J. R., Lasslop, G., Bachelet, D., Forrest, M., Hantson, S., Kaplan, J. O., Li, F., Mangeon, S., Ward, D. S., Yue, C., Arora, V. K., Hickler, T., Kloster, S., Knorr, W., Nieradzik, L., Spessa, A., Folberth, G. A., Sheehan, T., Voulgarakis, A., Kelley, D. I., Prentice, I. C., Sitch, S., Harrison, S., and Arneth, A.: The Fire Modeling Intercomparison Project (FireMIP), phase 1: experimental and analytical protocols with detailed model descriptions, Geosci. Model Dev., 10, 1175–1197, https://doi.org/10.5194/gmd-10-1175-2017, 2017.
Rabin, S. S., Ward, D. S., Malyshev, S. L., Magi, B. I., Shevliakova, E., and Pacala, S. W.: A fire model with distinct crop, pasture, and non-agricultural burning: use of new data and a model-fitting algorithm for FINAL.1, Geosci. Model Dev., 11, 815–842, https://doi.org/10.5194/gmd-11-815-2018, 2018.
Russell-Smith, J., Yates, C. P., Whitehead, P. J., Smith, R., Craig, R., Allan, G. E., Thackway, R., Frakes, I., Cridland, S., Meyer, M. C. P., and Gill, M.: Bushfires “down under”: patterns and implications of contemporary Australian landscape burning, Int. J. Wildland Fire, 16, 361–377, https://doi.org/10.1071/WF07018, 2007.
San Miguel-Ayanz, J., Schulte, E., Schmuck, G., Camia, A., Strobl, P., Liberta, G., Giovando, C., Boca, R., Sedano, F., Kempeneers, P., McInerney, D., Withmore, C., Santos de Oliveira, S., Rodrigues, M., Durrant, T., Corti, P., Oehler, F., Vilar, L., and Amatulli, G.: Comprehensive Monitoring of Wildfires in Europe: The European Forest Fire Information System (EFFIS), in: Approaches to Managing Disaster – Assessing Hazards, Emergencies and Disaster Impacts, edited by: Tiefenbacher, J., InTech, 87–108, available at: http://effis.jrc.ec.europa.eu/ (last access: 26 December 2018), 2012.
Schoennagel, T., Veblen, T. T., and Romme, W. H.: The interaction of fire, fuels, and climate across rocky mountain forests, Bioscience, 54, 661–676, https://doi.org/10.1641/0006-3568(2004)054[0661:TIOFFA]2.0.CO;2, 2004.
Scott, J. H. and Brugan, R. E.: Standard Fire Behavior Fuel Models: A Comprehensive Set for Use with Rothermel's Surface Fire Spread Model, General Technical Report, RMRS-GTR-153, USDA Forest Service, Rocky Mountain Research Station, Fort Collins, CO, 72 pp., available at: https://www.fs.fed.us/rm/pubs_series/rmrs/gtr/rmrs_gtr153.pdf (last access: 26 December 2018), 2005.
Sitch, S., Smith, B., Prentice, I. C., Arneth, A., Bondeau, A., Cramer, W., Kaplan, J. O., Levis, S., Lucht, W., Sykes, M. T., Thonicke, K., and Venevsky, S.: Evaluation of ecosystem dynamics, plant geography and terrestrial carbon cycling in the LPJ dynamic global vegetation model, Glob. Change Biol., 9, 161–185, https://doi.org/10.1046/j.1365-2486.2003.00569.x, 2003.
Stocks, B. J., Mason, J. A., Todd, J. B., Bosch, E. M., Wotton, B. M., Amiro, B. D., Flannigan, M. D., Hirsch, K. G., Logan, K. A., Martell, D. L., and Skinner, W. R.: Large forest fires in Canada, 1959–1997, J. Geophys. Res.-Atmos., 107, FFR 5-1–FFR 5-12, https://doi.org/10.1029/2001JD000484, 2002.
Stolz, D. C., Rutledge, S. A., and Pierce, J. R.: Simultaneous influences of thermodynamics and aerosols on deep convection and lightning in the tropics, J. Geophys. Res.-Atmos., 120, 6207–6231, https://doi.org/10.1002/2014JD023033, 2015.
Tansey, K., Gregoire, J. M., Stroppiana, D., Sousa, A., Silva, J., Pereira, J. M. C., Boschetti, L., Maggi, M., Brivio, P. A., Fraser, R., Flasse, S., Ershov, D., Binaghi, E., Graetz, D., and Peduzzi, P.: Vegetation burning in the year 2000: Global burned area estimates from SPOT VEGETATION data, J. Geophys. Res.-Atmos., 109, D14S03, https://doi.org/10.1029/2003JD003598, 2004.
Thenkabail, P. S., Biradar, C. M., Turral, H., Noojipady, P., Li, Y. J., Vithanage, J., Dheeravath, V., Velpuri, M., Schull, M., Cai, X. L., and Dutta, R.: An Irrigated Area Map of the World (1999) derived from Remote Sensing, Res., Rep., 105, Tech. rep., International Water Management Institute, Colombo, Sri Lanka, p. 74, 2006.
Thonicke, K., Venevsky, S., Sitch, S., and Cramer, W.: The role of fire disturbance for global vegetation dynamics: coupling fire into a Dynamic Global Vegetation Model, Globol Ecol. Biogeogr., 10, 661–677, https://doi.org/10.1046/j.1466-822x.2001.00175.x, 2001.
Thonicke, K., Spessa, A., Prentice, I. C., Harrison, S. P., Dong, L., and Carmona-Moreno, C.: The influence of vegetation, fire spread and fire behaviour on biomass burning and trace gas emissions: results from a process-based model, Biogeosciences, 7, 1991–2011, https://doi.org/10.5194/bg-7-1991-2010, 2010.
Turner, D., Ostendorf, B., and Lewis, M.: An introduction to patterns of fire in arid and semi-arid Australia, 1998–2004, Rangeland J., 30, 95–107, https://doi.org/10.1071/RJ07039, 2008.
Turquety, S., Logan, J. A., Jacob, D. J., Hudman, R. C., Leung, F. Y., Heald, C. L., Yantosca, R. M., Wu, S. L., Emmons, L. K., Edwards, D. P., and Sachse, G. W.: Inventory of boreal fire emissions for North America in 2004: Importance of peat burning and pyroconvective injection, J. Geophys. Res.-Atmos., 112, D12S03, https://doi.org/10.1029/2006JD007281, 2007.
Uman, M. A.: The Lightning Discharge, Academic Press, San Diego, CA, available at: https://www.elsevier.com/books/the-lightning-discharge/uman/978-0-12-708350-6 (last access: 26 December 2018), 1987.
van der Werf, G. R., Randerson, J. T., Collatz, G. J., Giglio, L., Kasibhatla, P. S., Arellano, A. F., Olsen, S. C., and Kasischke, E. S.: Continental-scale partitioning of fire emissions during the 1997 to 2001 El Nino/La Nina period, Science, 303, 73–76, https://doi.org/10.1126/science.1090753, 2004.
van der Werf, G. R., Randerson, J. T., Giglio, L., Collatz, G. J., Kasibhatla, P. S., and Arellano Jr., A. F.: Interannual variability in global biomass burning emissions from 1997 to 2004, Atmos. Chem. Phys., 6, 3423–3441, https://doi.org/10.5194/acp-6-3423-2006, 2006.
van der Werf, G. R., Randerson, J. T., Giglio, L., Gobron, N., and Dolman, A. J.: Climate controls on the variability of fires in the tropics and subtropics, Global Biogeochem. Cy., 22, GB3028, https://doi.org/10.1029/2007GB003122, 2008.
van Vuuren, D. P., Lucas, P. L., and Hilderink, H.: Downscaling drivers of global environmental change: Enabling use of global SRES scenarios at the national and grid levels, Global Environ. Change, 17, 114–130, https://doi.org/10.1016/j.gloenvcha.2006.04.004, 2007.
van Wagner, C. E.: A simple fire-growth model, Forest. Chron., 45, 103–104, 1969.
Vazquez, A. and Moreno, J. M.: Patterns of Lightning-, and People-Caused Fires in Peninsular Spain, Int. J. Wildland Fire, 8, 103–115, https://doi.org/10.1071/WF9980103, 1998.
Veblen, T. T., Kitzberger, T., and Donnegan, J.: Climatic and human influences on fire regimes in ponderosa pine forests in the Colorado Front Range, Ecol. Appl., 10, 1178–1195, https://doi.org/10.1890/1051-0761(2000)010[1178:CAHIOF]2.0.CO;2, 2000.
Venevsky, S.: Importance of aerosols for annual lightning production at global scale, Atmos. Chem. Phys. Discuss., 14, 4303–4325, https://doi.org/10.5194/acpd-14-4303-2014, 2014.
Venevsky, S. and Maksyutov, S.: SEVER: A modification of the LPJ global dynamic vegetation model for daily time step and parallel computation, Environ. Model. Softw., 22, 104–109, https://doi.org/10.1016/j.envsoft.2006.02.002, 2007.
Venevsky, S., Thonicke, K., Sitch, S., and Cramer, W.: Simulating fire regimes in human-dominated ecosystems: Iberian Peninsula case study, Glob. Change Biol., 8, 984–998, https://doi.org/10.1046/j.1365-2486.2002.00528.x, 2002.
Vonnegut, B.: Some Facts and Speculations Concerning the Origin and Role of Thunderstorm Electricity. In: Severe Local Storms. Meteorological Monographs, American Meteorological Society, Boston, MA, available at: https://link.springer.com/chapter/10.1007/978-1-940033-56-3_11 (last access: 26 December 2018), 1963.
Vorosmarty, C. J., Green, P., Salisbury, J., and Lammers, R. B.: Global water resources: Vulnerability from climate change acid population growth, Science, 289, 284–288, https://doi.org/10.1126/science.289.5477.284, 2000.
Wierzchowski, J., Heathcott, M., and Flannigan, M. D.: Lightning and lightning fire, central cordillera, Canada, Int. J. Wildland Fire, 11, 41–51, https://doi.org/10.1071/WF01048, 2002.
Wu, C. and Venevsky, S.: Codes of SEVER-FIRE v1.0 global fire model, available at: https://github.com/zjkwuchao/SEVER-FIRE-model.git, last access: 26 December 2018.
Wu, C., Venevsky, S., Sitch, S., Yang, Y., Wang, M. H., Wang, L., and Gao, Y.: Present-day and future contribution of climate and fires to vegetation composition in the boreal forest of China, Ecosphere, 8, e01917, https://doi.org/10.1002/ecs2.1917, 2017.
Wu, M. C., Knorr, W., Thonicke, K., Schurgers, G., Camia, A., and Arneth, A.: Sensitivity of burned area in Europe to climate change, atmospheric CO2 levels, and demography: A comparison of two fire-vegetation models, J. Geophys. Res.-Biogeo., 120, 2256–2272, https://doi.org/10.1002/2015jg003036, 2015.
Xie, P. P. and Arkin, P. A.: Global precipitation: A 17-year monthly analysis based on gauge observations, satellite estimates, and numerical model outputs, B. Am. Meteorol. Soc., 78, 2539–2558, https://doi.org/10.1175/1520-0477(1997)078<2539:GPAYMA>2.0.CO;2, 1997.
Yue, C., Ciais, P., Cadule, P., Thonicke, K., Archibald, S., Poulter, B., Hao, W. M., Hantson, S., Mouillot, F., Friedlingstein, P., Maignan, F., and Viovy, N.: Modelling the role of fires in the terrestrial carbon balance by incorporating SPITFIRE into the global vegetation model ORCHIDEE – Part 1: simulating historical global burned area and fire regimes, Geosci. Model Dev., 7, 2747–2767, https://doi.org/10.5194/gmd-7-2747-2014, 2014.
Zhan, X., Sohlberg, R. A., Townshend, J. R. G., DiMiceli, C., Carroll, M. L., Eastman, J. C., Hansen, M. C., and DeFries, R. S.: Detection of land cover changes using MODIS 250 m data, Remote Sens. Environ., 83, 336–350, https://doi.org/10.1016/S0034-4257(02)00081-0, 2002.