the Creative Commons Attribution 4.0 License.
the Creative Commons Attribution 4.0 License.
 | 29 Jan 2019
Interactive impacts of fire and vegetation dynamics on global carbon and water budget using Community Land Model version 4.5
Hocheol Seo
Fire plays an important role in terrestrial ecosystems. The burning of biomass affects carbon and water fluxes and vegetation distribution. To understand the effect of interactive processes of fire and ecological succession on surface carbon and water fluxes, this study employed the Community Land Model version 4.5 to conduct a series of experiments that included and excluded fire and dynamic vegetation processes. Results of the experiments that excluded the vegetation dynamics showed a global increase in net ecosystem production (NEP) in post-fire regions, whereas the inclusion of vegetation dynamics revealed a fire-induced decrease in NEP in some regions, which was depicted when the dominant vegetation type was changed from trees to grass. Carbon emissions from fires are enhanced by reduction in NEP when vegetation dynamics are considered; however, this effect is somewhat mitigated by the increase in NEP when vegetation dynamics are not considered. Fire-induced changes in vegetation modify the soil moisture profile because grasslands are more dominant in post-fire regions. This results in less moisture within the top soil layer than that in unburned regions, even though transpiration is reduced overall. These findings are different from those of previous fire model evaluations that ignored vegetation dynamics and thus highlight the importance of interactive processes between fires and vegetation dynamics in evaluating recent model developments.
- Article
(6017 KB) - Full-text XML
- BibTeX
- EndNote


Wildfire is a natural process that influences ecosystems and the global carbon and water cycle (Gorham, 1991; Bowman et al., 2009; Harrison et al., 2010). Climate and vegetation control the occurrence of fires and their spread, which in turn affects climate and vegetation (Vilà et al., 2001; Balch et al., 2008). When fire destroys forests and grasslands, the distribution of vegetation is also affected (Clement and Touffet, 1990; Rull, 1999). Wildfires are major sources of trace gases and aerosols, which are important elements in the radiative balance of the atmosphere (Scholes et al., 1996; Fiebig et al., 2003). Aerosols affect surface air temperature, precipitation, and circulation (Tarasova et al., 1999; Lau and Kim, 2006; Andreae and Rosenfeld, 2008).
Changes in soil properties occur in regions affected by fire; leaves and roots can be annihilated in those regions (Noble et al., 1980; Swezy and Agee, 1991). Each year, fires transport approximately 2.1 Pg of carbon from soil and vegetation into the atmosphere in the form of carbon dioxide and other carbon compounds (van der Werf et al., 2010). Harden et al. (2000) report that approximately 10 %–30 % of annual net primary productivity (NPP) disappears through fires in upland forests. Transpiration and canopy evaporation decrease with the reduction in leaf numbers (Clinton et al., 2011; Beringer et al., 2015). Soil develops a water-repellent layer during fires due to intense heating (DeBano, 1991) and ash produced by biomass combustion impacts the quality of runoff (Townsend and Douglas, 2000).
In post-fire regions, plant distribution gradually changes over time from bare ground to grassland, shrubland, and finally to forest during ecological succession (Prach and Pyšek, 2001). Therefore, the structure and distribution of vegetation can be altered by fires in post-fire regions (Wardle et al., 1997). The existence of grass and trees in the savanna can be attributed to fires (Hochberg et al., 1994; Sankaran et al., 2004; Baudena et al., 2010). However, fires can also wipe out succession.
Fire affects many aspects of the Earth system. Therefore, a process-based representation of fires is included in dynamic global vegetation models (DGVMs), land surface models (LSMs), and Earth system models (ESMs; Rabin et al., 2017). Previous studies reported the incorporation of fire models into global climate models to investigate the occurrence and spread of fires and how they impact climate and vegetation (e.g., Pechony and Shindell, 2010; Li et al., 2012, 2013). Bond et al. (2005) used the Sheffield DGVM and performed the first global study on the extent to which fires determine global vegetation patterns by preventing ecosystems from achieving potential height, biomass, and dominant functional types expected under ambient conditions (i.e., potential vegetation).
In recent years, global fire models have become more complex (Hantson et al., 2016). Different fire models parameterize different impact factors such as fuel moisture, fuel size, probability of lightning, and human effects. In this respect, the Fire Model Intercomparison Project (FireMIP) evaluates the strength and weakness of each fire model by comparing the performance of different fire models and suggesting improvements for individual models (Rabin et al., 2017).
A process-based fire parameterization of intermediate complexity has been developed and assessed within the framework of the National Center for Atmospheric Research (NCAR) Community Earth System Model (CESM) (Li et al., 2012, 2013, 2014). The satellite-based Global Fire Emission Database version 3 (GFED3), which is derived from the Moderate Resolution Imaging Spectroradiometer (MODIS), fire count products and the burned area, has been used to improve fire parameterization. The impact of fires on carbon, water, and energy balance has also been investigated within the CESM framework (Li et al., 2014; Li and Lawrence, 2017). However, although these studies have considered land–atmosphere interactions using the Community Land Model (CLM) coupled with an atmospheric model, they have ignored the changes in global vegetation patterns caused by fires, even though the initial model developed by Li et al. (2012) was designed to consider the vegetation dynamics (i.e., changes in vegetation distribution) within the CLM–DGVM.
It is important to understand the individual and combined impacts of fires and vegetation distribution on water and carbon exchange; however, few studies to date have assessed these complicated global processes. Therefore, in this study, we aim to understand the interactive effects of fires and ecological succession on carbon and water fluxes on the land surface. Specifically, using the NCAR CLM, we conduct a series of numerical experiments that include and exclude fire and dynamic vegetation processes. Our results show that the impact of fires on carbon and water balance (especially in net ecosystem production (NEP) and soil moisture) on ecological succession is different from that on static vegetation.
2.1 Model description
This study used CLM version 4.5, which is the land model of the NCAR CESM version 1.2. The CESM is maintained by NCAR's Climate Global Dynamics Laboratory (CGD) and comprises different components such as land, atmosphere, ocean, land ice, and ocean ice (Worley at el., 2011; Kay et al., 2012). Each component utilizes various formulae to represent the complex interplay of physical, chemical, and biological processes, and each can be used either independently or coupled (Smith et al., 2010; Neale et al., 2012; Bonan et al., 2013). Land surface in the CLM is represented by sub-grid land cover (glacier, lake, wetland, urban, or vegetated), and vegetation coverage is represented by 17 plant functional types (PFTs) comprising 11 tree PFTs, 2 crop PFTs, 3 grass PFTs, and bare ground. For a detailed description of the model, please refer to Lawrence et al. (2011).
CLM can be run by including different levels of vegetation processes. In the satellite phenology (SP) option, vegetation coverage of different PFTs is prescribed using satellite-based land cover data (Lawrence and Chase, 2007), derived from a variety of satellite products including MODIS and Advanced Very High-Resolution Radiometer data. Land fractions are divided into bare ground, grass, shrub, and evergreen/deciduous trees. In addition, grass, shrub, and tree PFTs are classified as tropical, temperate, and boreal types, based on the physiology and climate rules of Nemani et al. (1996). Vegetation is further divided into C3 or C4 plants based on MODIS-derived leaf area index (LAI) values and the mapping methods of Still et al. (2003). Crop is also prescribed based on the merged dataset of the MODIS-derived land cover product and the global land cover in 2000 (GLC2000) (Ramankutty et al., 2008). Furthermore, the vegetation state (i.e., LAI) of different PFTs on land surface can be set based on the satellite-derived climatological data (Lawrence and Chase, 2007), which differ between months but not between years.
In addition to the SP option, CLM 4.5 can be extended using the biogeochemistry model (BGC) and dynamic vegetation model (DV); CLM simulations with BGC without DV (BGConly) and BGC with DV (BGC-DV) can be configured. BGConly simulates the carbon and nitrogen cycles in addition to biophysics and hydrology in a given distribution of vegetation PFTs (Paudel et al., 2016). In BGConly, phenological variations of LAI are simulated and whole-plant mortality is assumed as an annual mortality rate of 2 % without biogeographical changes in the vegetation distribution. In contrast, BGC-DV simulates biogeographical changes in the natural vegetation distribution and mortality as well as seasonal changes in LAI (Castillo et al., 2012; Castillo and Gurney, 2013). A PFT can occupy a region or degenerate by competing with other PFTs, or PFTs can coexist under various environmental factors, such as light, soil moisture, temperature, and fire (Zeng, 2010; Song and Zeng, 2014). Plant mortality in BGC-DV is determined by heat stress, fire, and growth efficiency (Rauscher et al., 2015). Note that BGC-DV does not simulate the crop PFTs, which is included in BGConly, because it simulates the changes in the natural vegetation only.
In the fire model (Li et al., 2012, 2013; Bonan et al., 2013), fire types are divided into four groups: non-peat fires outside cropland and tropical closed forests, agricultural fires, deforestation fires in tropical closed forests, and peat fires. Fire counts are determined based on natural and artificial ignition, fuel availability, fuel combustibility, and anthropogenic and unsuppressed natural fires related to socioeconomic conditions. The burned area is calculated by multiplying the fire count by the average fire spread, which is considered to be driven by wind speed, PFT, fuel wetness, and socioeconomic factors. In other words, the burning and spread of fire are related to the CLM input parameters of climate and weather conditions, vegetation conditions, socioeconomic conditions, and population density. After biomass and peat burning are calculated, trace gas and aerosol emissions as well as carbon emissions, which are the by-products of fires, are estimated.
Once the burned area is identified, impacts of the fire on vegetation mortality, peat burning, and the carbon cycle can be addressed. The amount of carbon emitted from the fire (E) is calculated as follows:
where A is the burned area; C is a vector of elements including carbon density of the leaf stem and the root and transfer and storage of carbon; CC is the corresponding combustion completeness factor vector.
Burned area also impacts the carbon and nitrogen pools of the vegetation, which are related to leaf, stem, and root; fire changes the vegetation state (e.g., LAI) and vegetation height during the burning period in both BGConly and BGC-DV runs. However, the number of individual PFTs does not change in BGConly but decreases by biomass burning in BGC-DV. In other words, individual plants are killed by fire only when the DV option is included in the model. The number of PFTs killed by fire (Pdistrub) is calculated using Eq. (2).
where P is the population density for each PFT, ξ is the whole-plant mortality factor for each PFT, Ag is the grid cell area, Ab is the burned area of each PFT, and f is the fraction of coverage of each PFT. The whole-plant mortality, the rate at which plants die completely by fire, is a calibrated PFT-dependent parameter, which is 0.1 for broadleaf evergreen trees, 0.13 for needleleaf evergreen trees, 0.07 for deciduous trees, 0.15 for shrubs, and 0.2 for grass (Li et al., 2012).
The terrestrial carbon balance is affected when biomass is burned. The net ecosystem exchange (NEE) can be estimated using NEP (NEP=NPP–heterotrophic respiration (Rh)) and carbon loss due to biomass burning (Cfe).
2.2 Experimental design
A series of global numerical experiments were conducted in this study using a spatial resolution of 1.9∘ longitude ×2.5∘ latitude. Global climate data from the Climate Research Unit (CRU)-National Centers for Environmental Prediction (NCEP) reanalysis were used for atmospheric driving forcing of CLM. Data from 1901 to 2000 included 6 h precipitation, air temperature, wind speed, specific humidity, longwave radiation, and shortwave radiation. Figure 1 and Table 1 summarize the experimental process used in this study. The BGC run for the year of 1850 was initialized with the PFT distribution from the Land Use Harmonization (LUH) transient dataset for 1850 to 2005 (Hurtt et al., 2006) to simulate the year 1850 equilibrium state, used to initialize the 20th-century transient run. In the transient run, the amount of atmospheric carbon dioxide is increased since the onset of the Industrial Revolution in 1850 and the composition of land cover and vegetation is changed with the LUH dataset of Hurtt et al. (2006) (Vitousek et al., 1997; Pitman et al., 2004). The final surface conditions should represent those of the year 2000 after running the transient simulation using the CLM-BGC model.
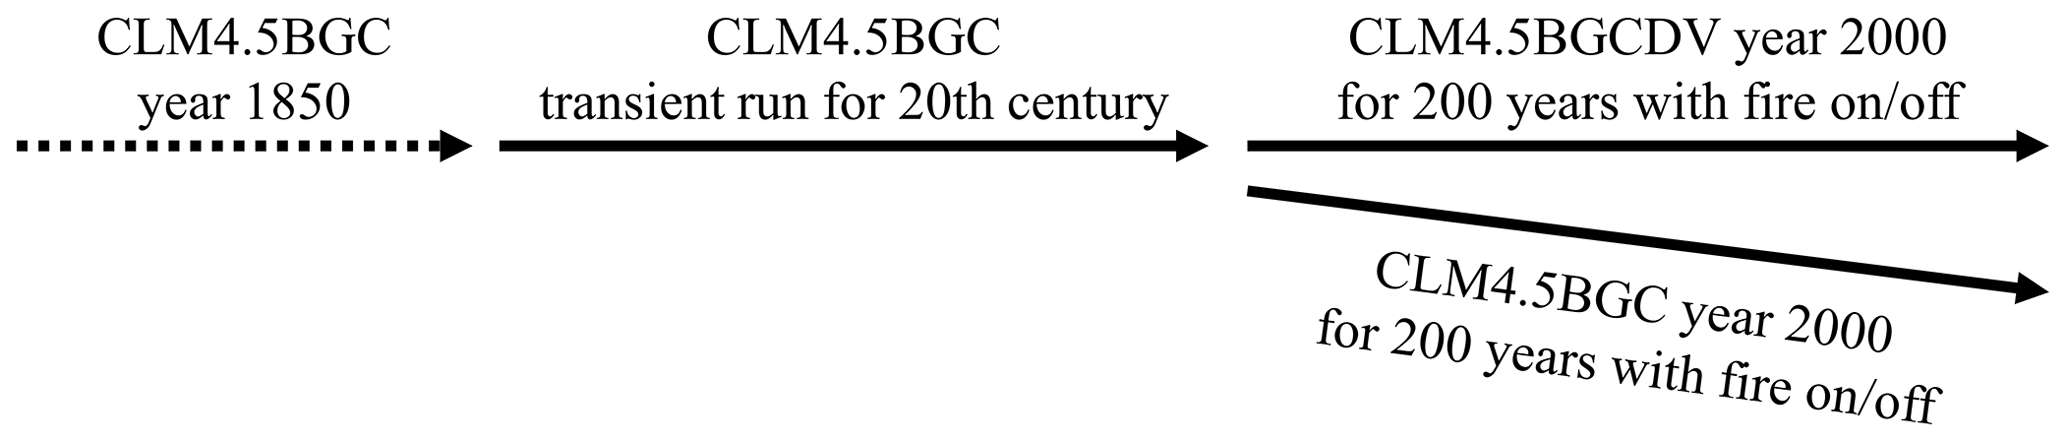
Figure 1Flowchart showing model simulations conducted to investigate the interactive impact of fires and ecological succession on the Earth system using Community Land Model (CLM4.5) simulations extended with biogeochemistry (CLM4.5BGC) and BGC with dynamic vegetation (CLM4.5BGCDV).
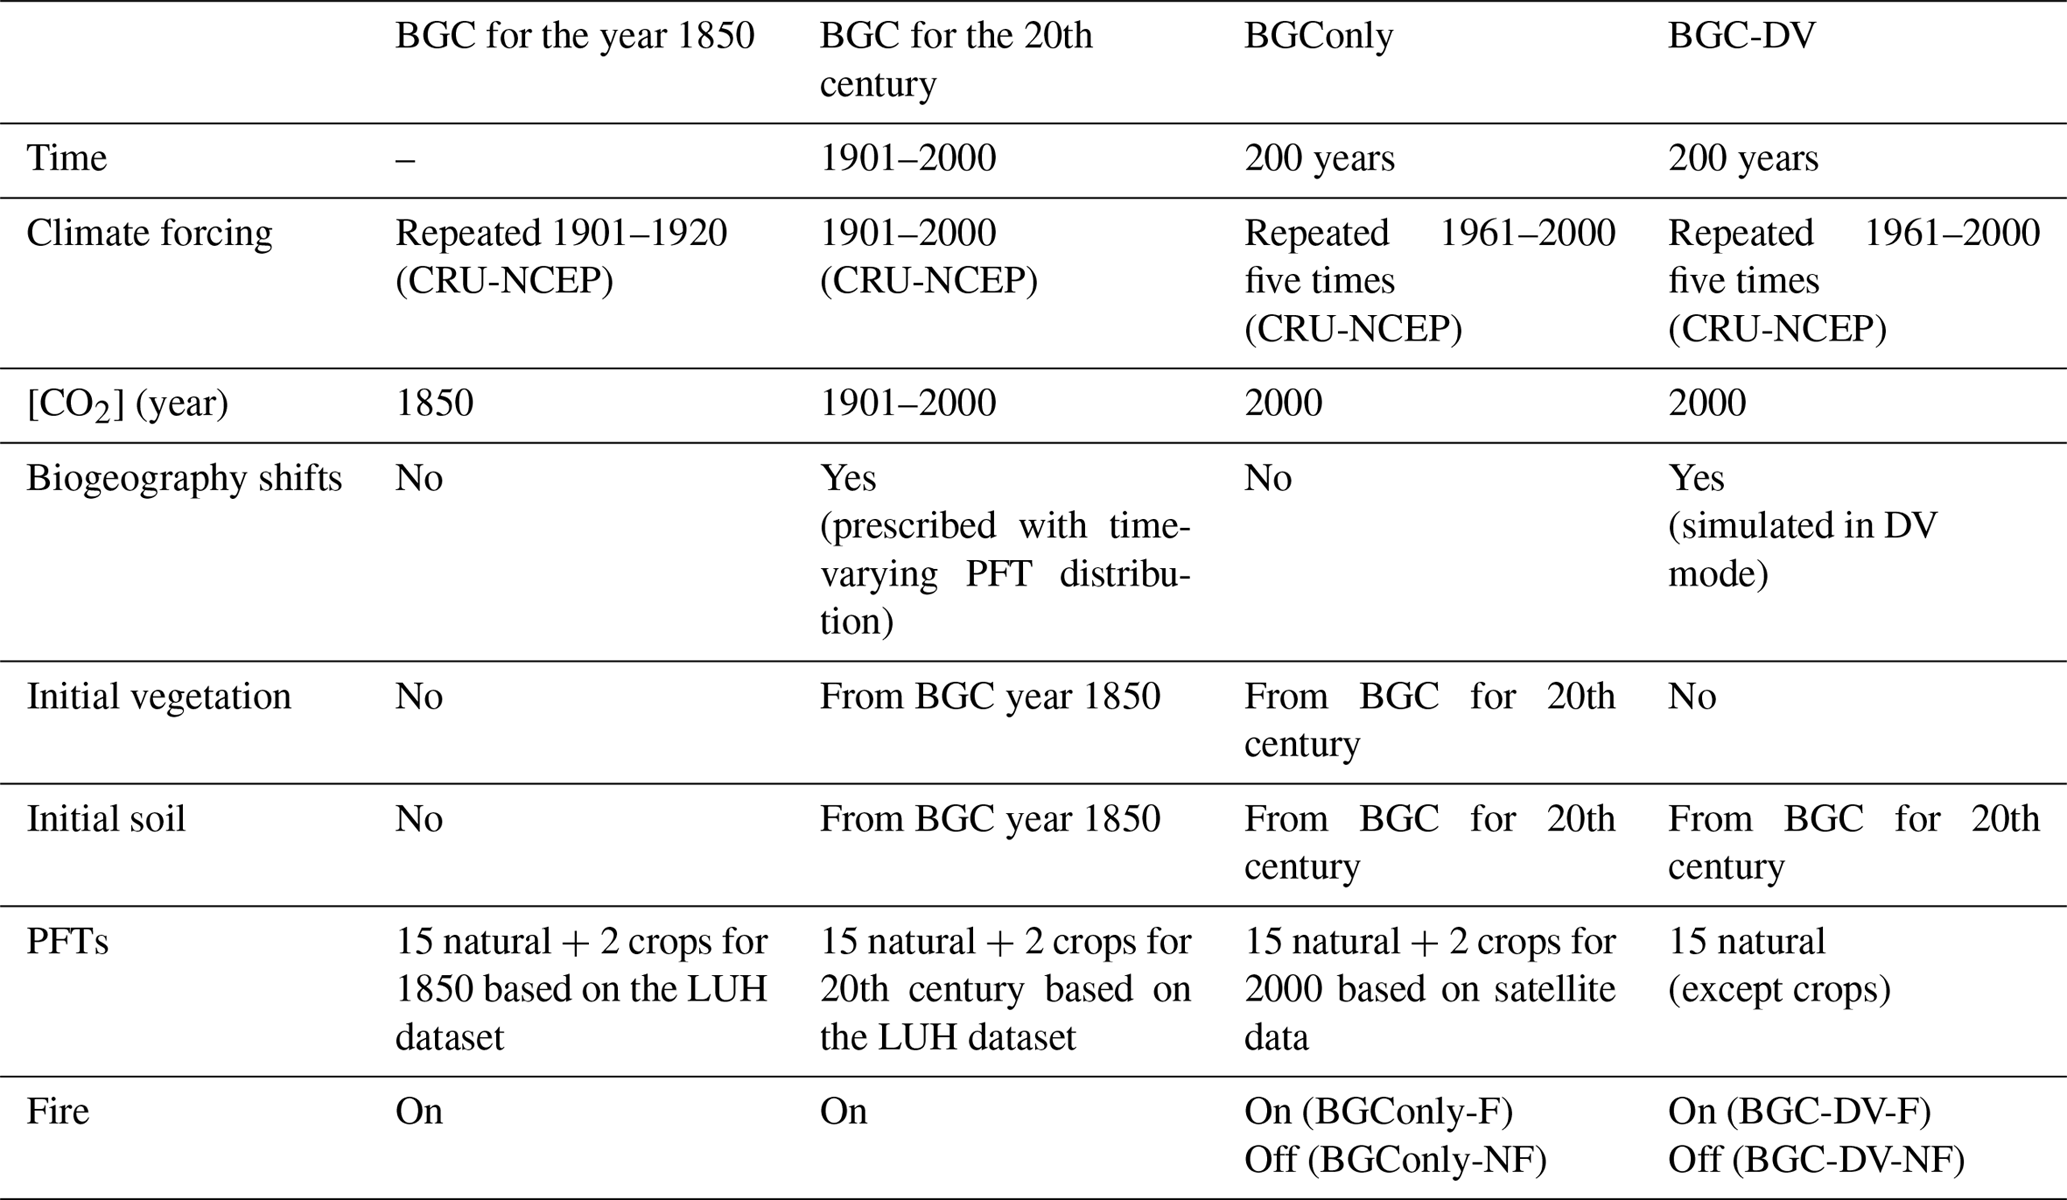
Using the simulated surface conditions for the year 2000, four different 200-year equilibrium CLM simulations (BGConly and BGC-DV simulations with and without the fire model) were conducted (Table 1). For BGConly runs, a restart file from the transient run was used with and without the fire model (hereafter, BGConly-F and BGConly-NF, respectively). Similarly, the BGC-DV runs were performed using the same restart file to simulate the equilibrium vegetation in 200-year offline BGC-DV runs both with and without the fire model (hereafter, BGC-DV-F and BGC-DV-NF, respectively; Erfanian et al., 2016). In BGC-DV runs, the initial land surface state was bare ground with the vegetation previously in the system being entirely removed while soil conditions were adjusted with a restart file from the transient run (i.e., BGC run for the 20th century in Table 1) (Castillo et al., 2012; Rauscher et al., 2015; Qiu and Liu, 2016; Wang et al., 2016). Therefore, the vegetation state is quickly stabilized for 200 years of the BGC-DV runs since the runs restart from the spun-up soil carbon condition (i.e., after decomposition spin-up). Furthermore, the last 30-year results of the 200-year runs are analyzed to focus on the equilibrium states of both BGConly and BGC-DV runs. While the fire model is optional when using CLM with BGC, it is always run when using CLM with BGC-DV. Hence, the model was modified when conducting the BGC-DV-NF run, and the burned area was set to zero to neglect any fire incidences.
A comparison between the BGConly-F and BGConly-NF runs enables the isolation of the impact of fire on land surface, regardless of DV. In addition, the impact of fires and the interactive impacts of fires and vegetation distribution on the Earth system can be identified by comparing the BGC-DV-F and BGC-DV-NF runs. Note that this study focuses on the impact of fires and vegetation dynamics on land carbon and water fluxes by forcing the CLM with the CRU-NCEP climate data (1961–2000) without considering the land–atmosphere feedbacks. Simulations were run for 200 years from the initial surface conditions of the year 2000 to derive equilibrium land surface conditions. In addition, the average surface conditions of the last 30 years were compared with the simulation results.
3.1 Burned area
In this section, we evaluate how the simulated burned areas differ between the runs with and without vegetation dynamics, i.e., BGC-DV-F and BGConly-F runs. On average, the BGC-DV-F and BGConly-F runs show burned areas of 320 and 487 Mha yr−1, respectively. These results are similar to those of previous studies that applied CLM (i.e., Li et al., 2012; Li and Lawrence, 2017). The fire model of Li et al. (2012) was originally developed by comparing the BGC-DV-F-type CLM simulations and resulted in 322 Mha yr−1 for 1997–2004. The BGC-DV-F simulation, under the equilibrium condition driven by the 1961–2000 CRU-NCEP data in this study, estimates a similar burned area (320 Mha yr−1) to that of Li et al. (2012). Li and Lawrence (2017) estimated the annual burned area as 489 Mha, which is similar to that of BGConly-F (487 Mha), using a BGC-F-type simulation coupled with Community Atmosphere Model (CAM).
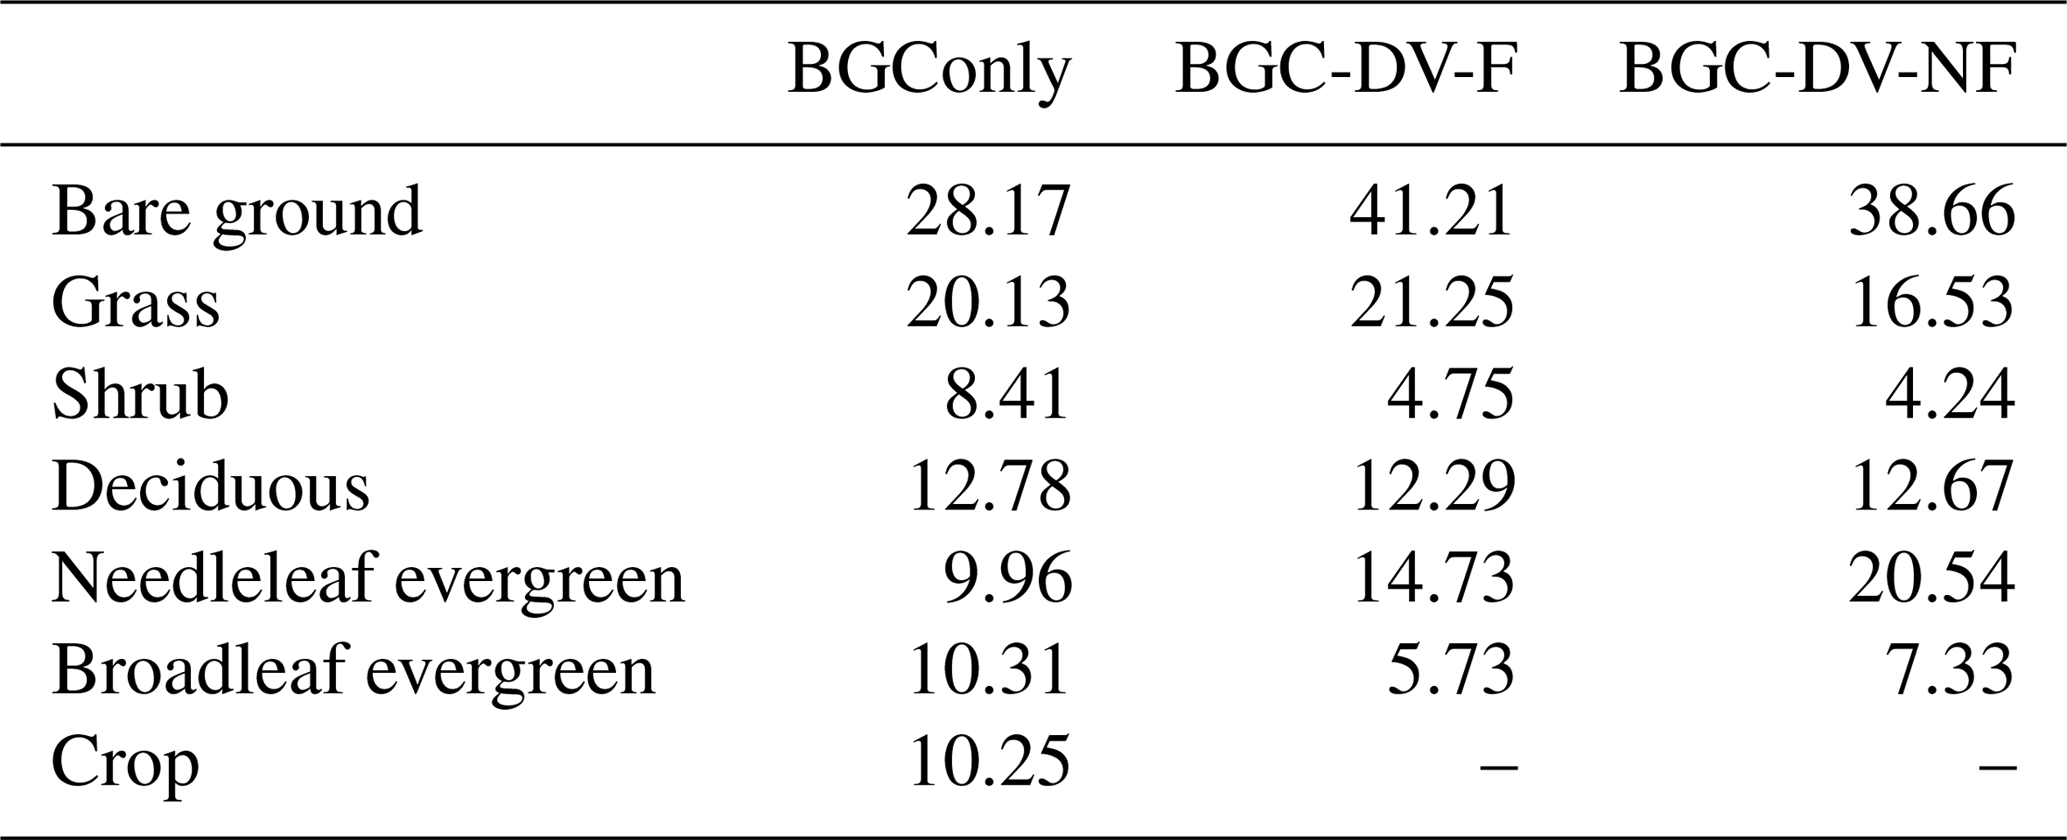
In comparison to the burned area of BGConly-F, BGC-DV-F simulates a relatively small burned area (1) because agricultural fires are excluded in BGC-DV-F and only natural vegetation is simulated (Castillo et al., 2012) and (2) because fewer trees and thus less fuel, fed back from fire, are simulated in BGC-DV-F than in BGConly-F. Furthermore, the spatial distribution of burned areas in Fig. 2 shows that BGC-DV-F particularly underestimates the burned area in Africa and Oceania compared to BGConly-F. The differences in vegetation distribution between BGC-DV-F and BGConly-F in Fig. 3, where PFTs, excluding two crop PFTs, are simplified into six vegetation groups (broadleaf evergreen trees, needleleaf evergreen trees, deciduous trees, shrubs, grasses, and bare ground) (Rauscher et al., 2015), may impact the size of the burned area. In BGC-DV-F (Fig. 3a), evergreen and deciduous trees show limited growth whereas grass and bare ground are dominant in some regions such as southern Africa. Overall, BGC-DV-F simulates trees on 37.5 % of the global land area while BGConly-F, which is derived from observations (Fig. 3b), indicates that trees cover 41.46 % of the global land area (Table 2). More trees provide increased fuel for the occurrence and spread of fires in BGConly-F than in BGC-DV-F, consistent with the larger burned area in BGConly-F than in BGC-DV-F.
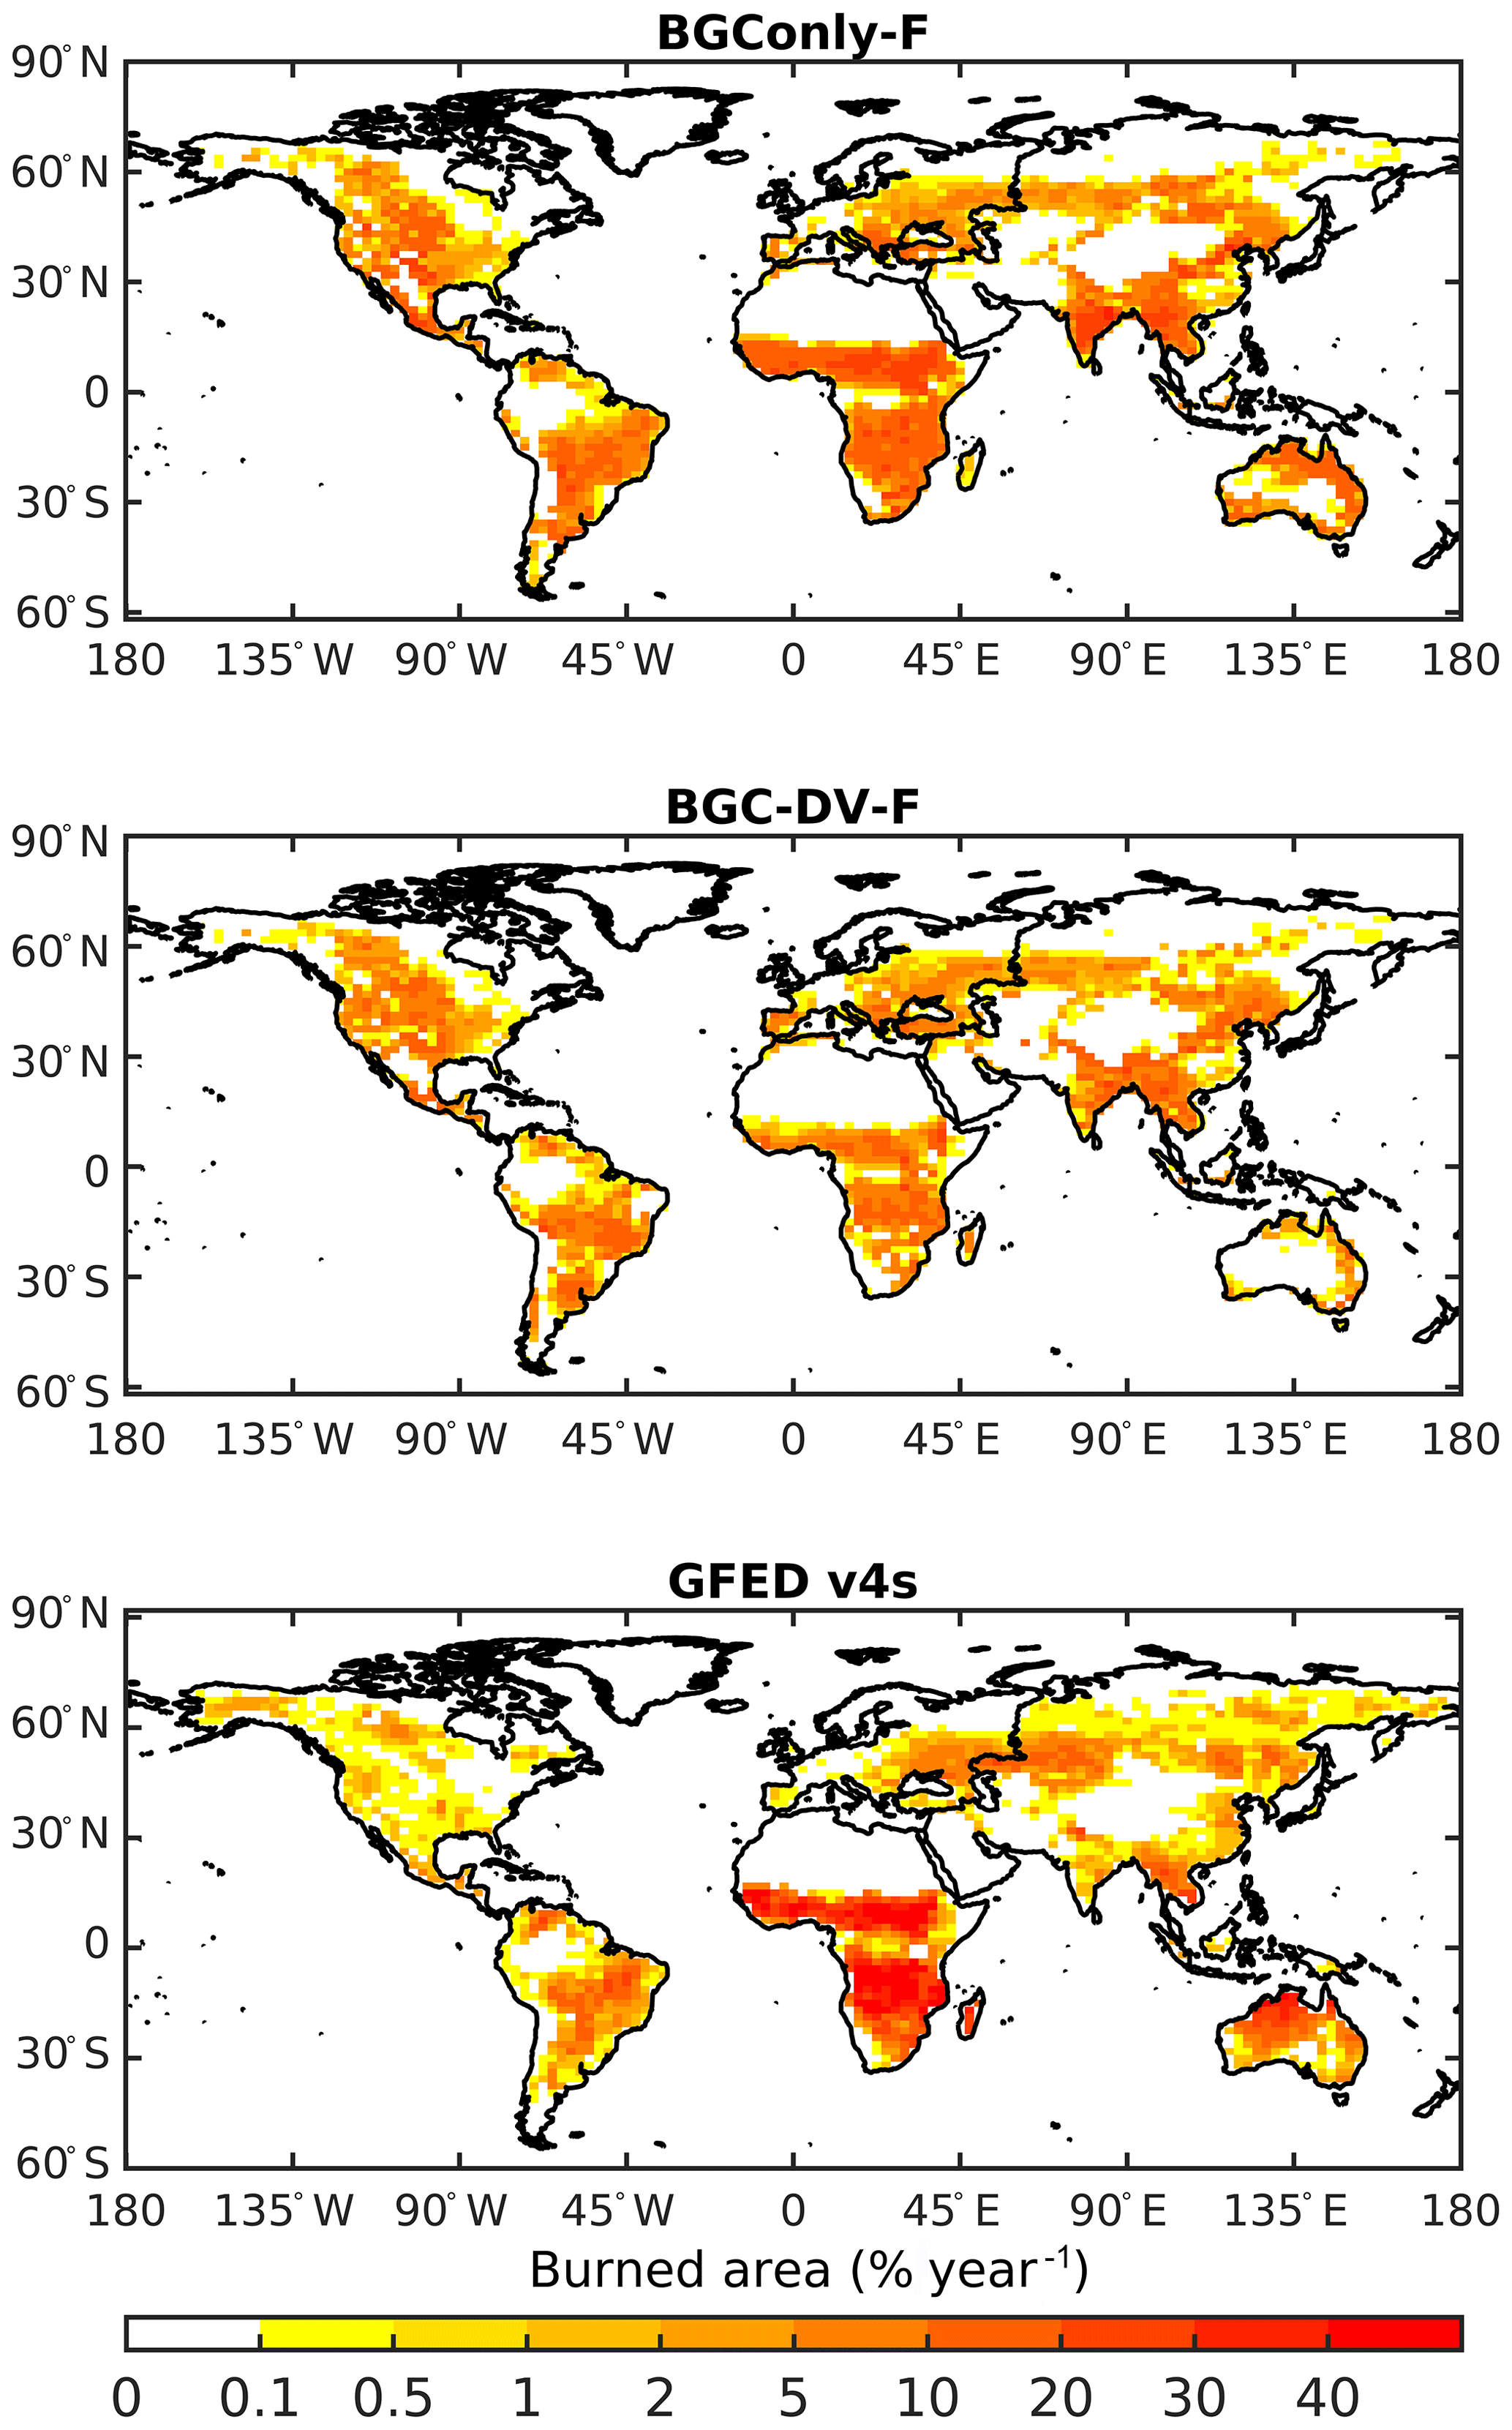
Figure 2Annual burned area percentage by grid cell for CLM4.5BGC with fire (BGConly-F), CLM4.5BGCDV with fire (BGC-DV-F), and Global Fire Emission Database version 4 with small fires (GFED4s).

Figure 3Percentages of land cover type (broadleaf evergreen (BE)), needleleaf evergreen (NE), deciduous (DE), shrub (SH), grass (GR), bare ground (BG) and crop (CR)) in BGC-DV-F and BGConly (the same for both BGConly-F and BGConly-NF).
Table 2Percentage (%) land cover types (bare ground, grass, shrub, deciduous, needleleaf evergreen, and broadleaf evergreen) in BGConly, BGC-DV-F, and BGC-DV-NF.
We also compare the model estimates to the satellite-based observational datasets of GFED (van der Werf et al., 2010, 2017; Giglio et al., 2013) (Fig. 3). Although the model simulations are not intended to reflect the reality but rather to understand the model mechanisms under the equilibrium states under the 1961–2000 climate forcing, it is still valuable to assess the model results using the observations. Different versions of GFED datasets provided different sized burned areas: GFED3 (van der Werf et al., 2010), GFED4 (Giglio et al., 2013), and GFED4 with small fires, i.e., GFED4s (van der Werf et al., 2017), suggest burned areas of 371 Mha yr−1 for 1997–2009, 348 Mha yr−1 for 1997–2011 and 513 Mha yr−1 for 1997–2016, respectively. In comparison to the most recent data, i.e., GFED4s, both BGConly-F and BGC-DV-F runs, especially BGC-DV-F, underestimate the burned area. Possible reasons for this underestimation in BGC-DV-F include the exclusion of agricultural fires and relatively small tree-dominated land coverage. The initial model development with a BGC-DV-F-type simulation (Li et al., 2012) was carried out in comparison to GFED3 (van der Werf et al., 2010), and BGC-DV-F estimated a burned area (320 Mha yr−1) similar to that of GFED3 (i.e., 371 Mha yr−1).
3.2 Interactions between vegetation and fire processes
The impact of fires on vegetation distribution is assessed by comparing BGC-DV-F and BGC-DV-NF simulations (Table 2 and Figs. 4 and 5). Figure 4 shows the vegetation distribution of BGC-DV-NF (Fig. 4a) and BGC-DV-F minus BGC-DV-NF (Fig. 4b: Fig. 4a minus 3a). The plots clearly indicate large differences in vegetation cover in areas of high fire frequency (i.e., southern Africa, South America, western North America, India, and a portion of China) (Table 2), whereas areas with relatively low fire occurrence (i.e., the Arctic and desert regions) show small differences.
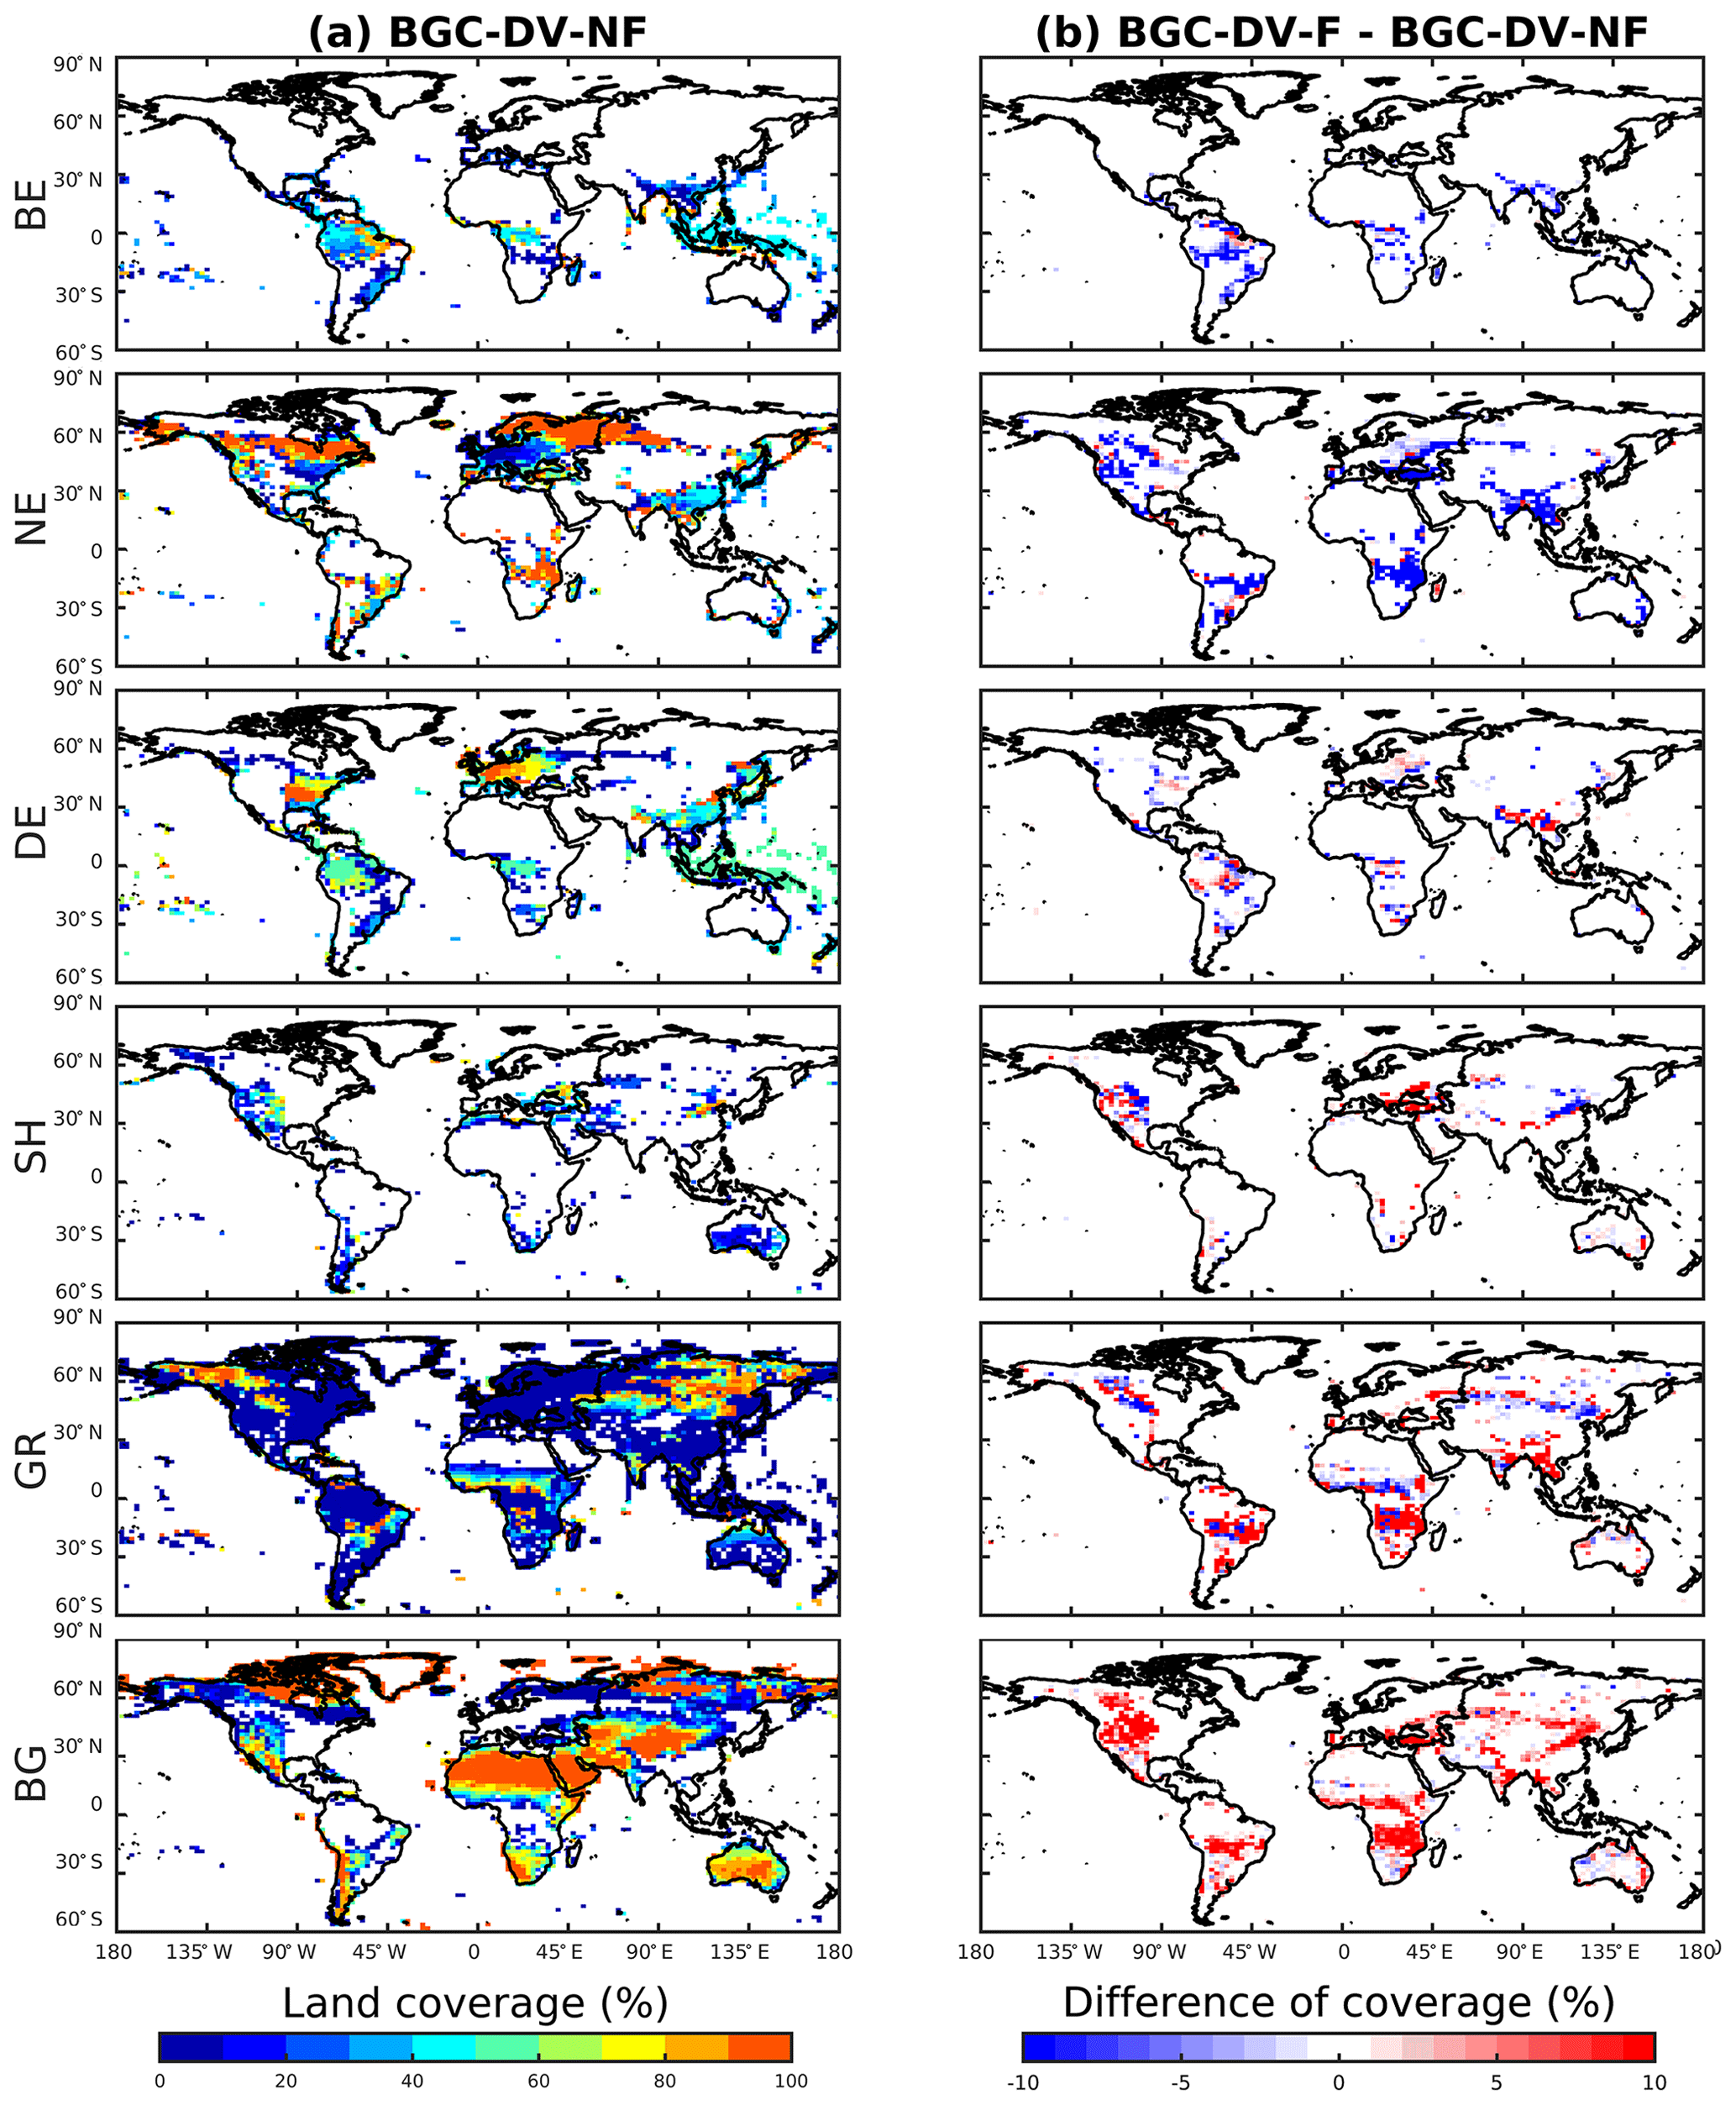
Figure 4Percentages of land cover (broadleaf evergreen (BE), needleleaf evergreen (NE), deciduous (DE), shrub (SH), grass (GR), and bare ground (BG)) in BGC-DV-NF and differences in plant cover between BGC-DV-F and BGC-DV-NF.
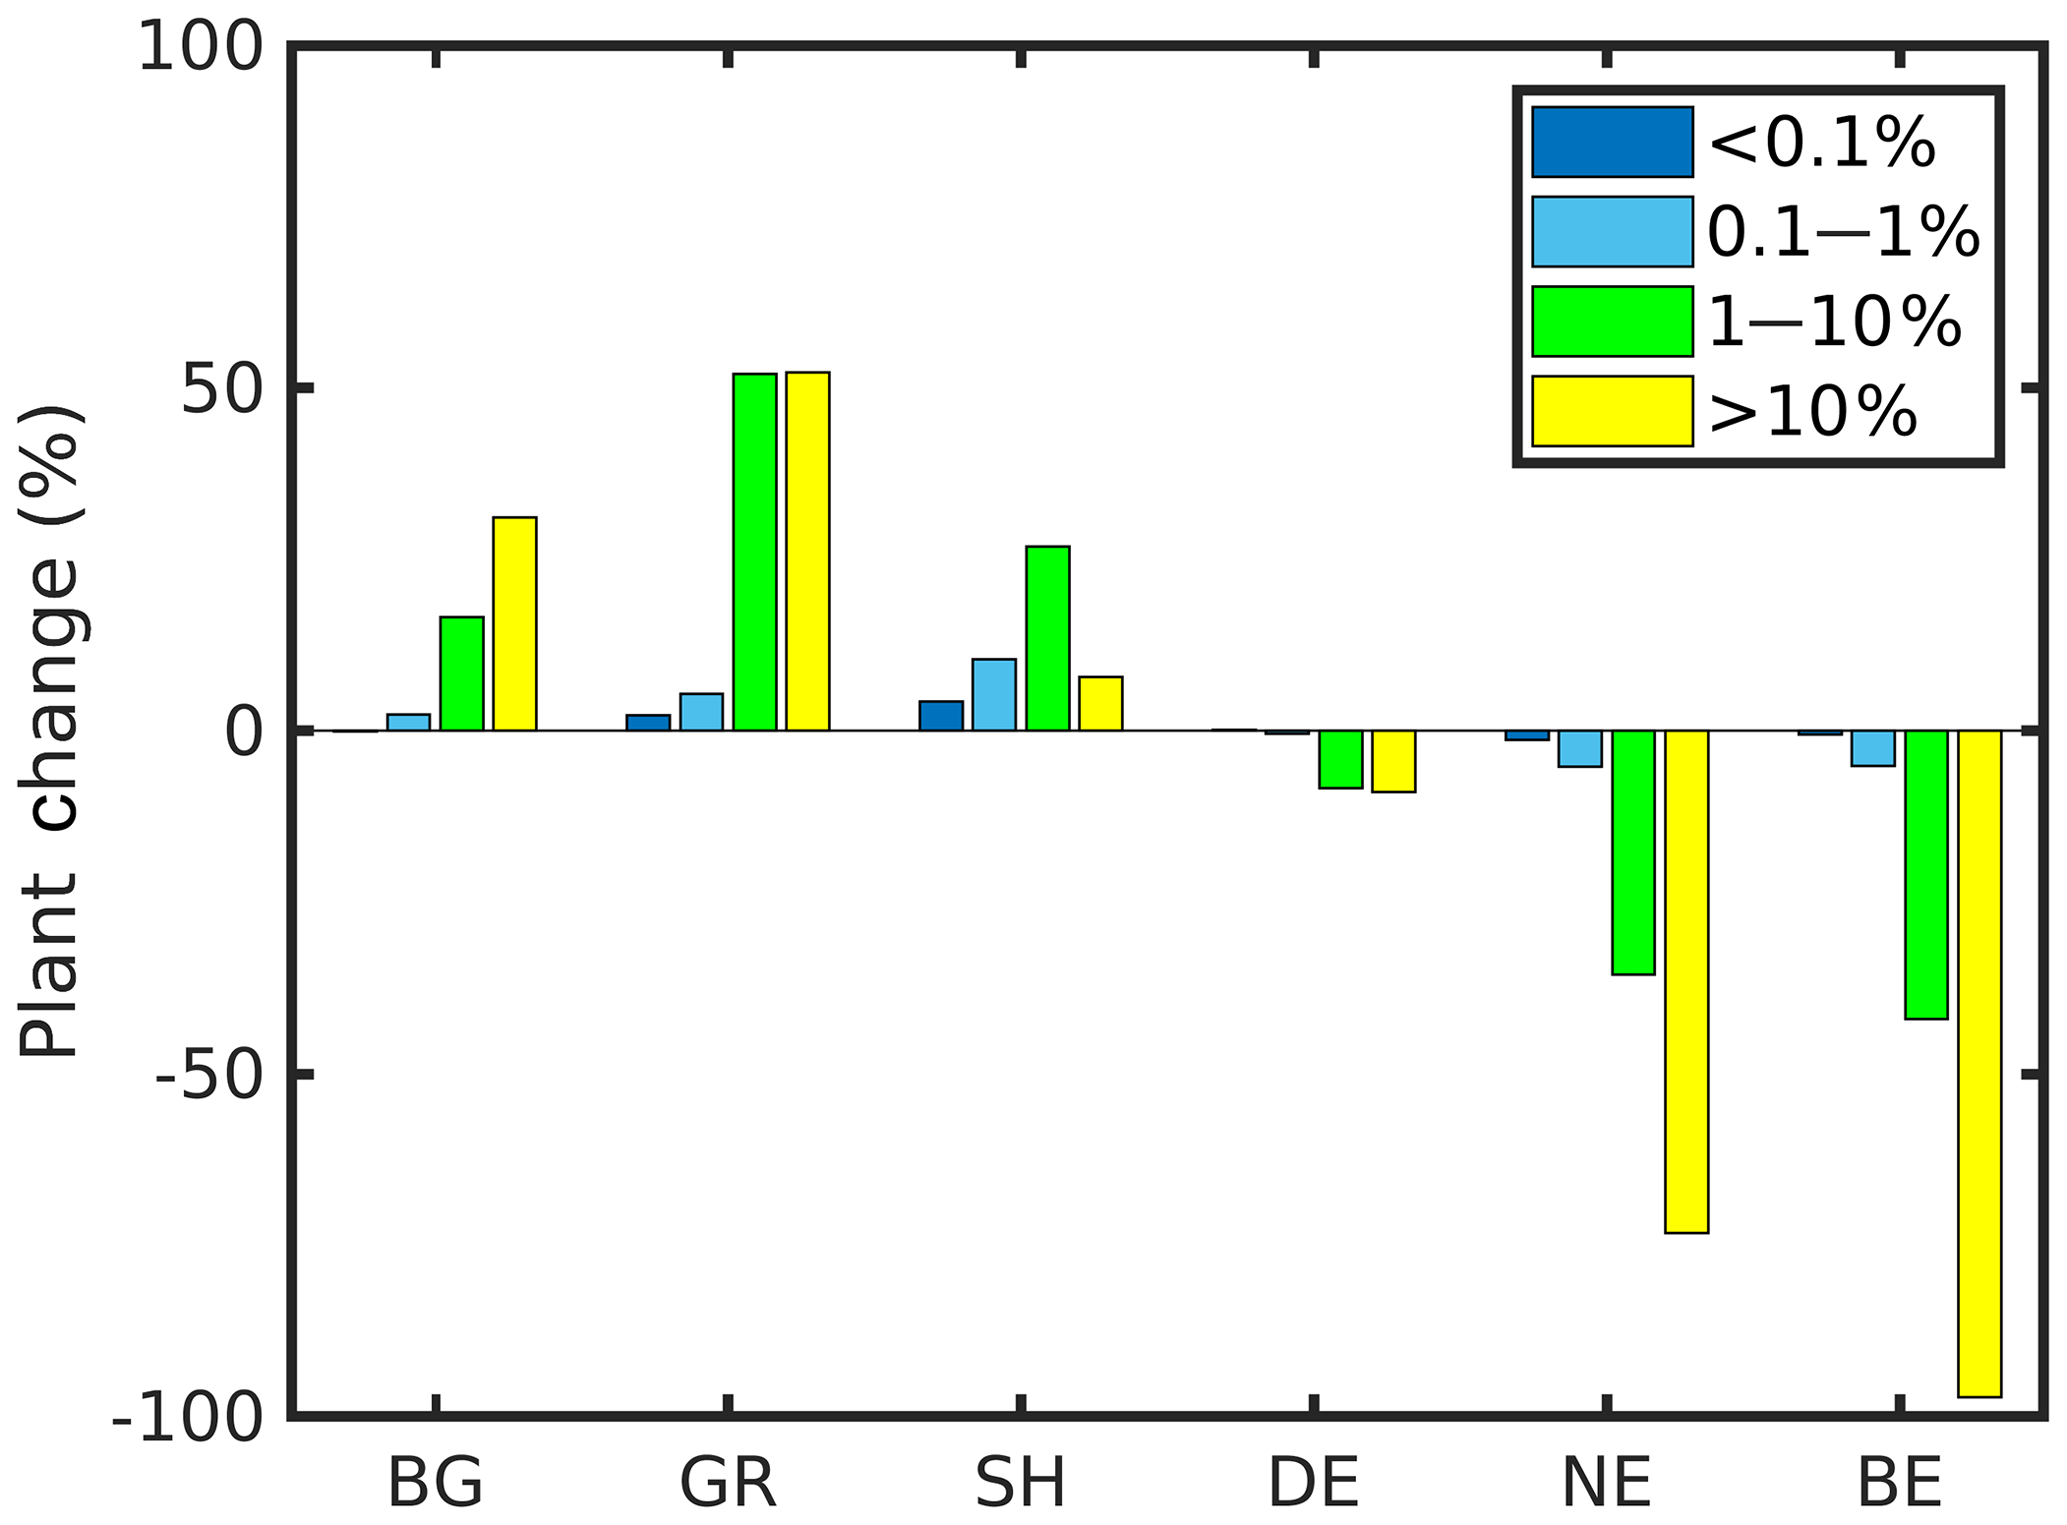
Figure 5Differences in vegetation distribution (bare ground (BG), grass (GR), shrub (SH), deciduous (DE), broadleaf evergreen (BE), and needleleaf evergreen (NE)) ratios between BGC-DV-F and BGC-DV-NF for four burned area categories: under 0.1 %, 0.1 %–1 %, 1 %–10 %, and greater than 10 %.
We estimated the fraction of burned areas, where fractions are grouped into four categories (>10 %, 10 %–1 %, 1 %–0.1 %, and <0.1 %) for each vegetation type and investigated the relationship between vegetation distribution and fire occurrence. Differences in the vegetation distribution between BGC-DV-F and BGC-DV-NF in Fig. 5 illustrate a nonlinear change in vegetation distribution in response to post-fire area. The changes are small in areas with minimal fire occurrence or where the burned area fraction is small (0.1 %–1 %). However, relatively large changes in vegetation distribution occur when the burned area fraction exceeds 1 %. Furthermore, there are large changes in the vegetation distribution in areas with burned area fractions above 10 %, including increases in bare ground, grass, and shrubs (31.19 %, 52.28 %, and 7.91 %, respectively) but decreases in deciduous, needleleaf evergreen, and broadleaf evergreen trees (8.85 %, 79.22 %, and 91.17 %, respectively).
In ecosystems, plants die in regions where fires occur and grass with rapid growth rates occupies those regions. Therefore, fire increases the ratio of bare ground and grassland but reduces the number of trees. However, there are no significant changes in the global fraction of shrubs and deciduous trees in the middle of the ecological succession process with respect to the presence or absence of fires (Table 2). When a fire occurs in a region where shrubs grow, the ratio of shrubland is diminished (e.g., in the middle of North America in Fig. 4b), but fire increases the ratio of shrubland in regions where trees grow (e.g., in the southwestern Asia in Fig. 4b). Similarly, the number of deciduous trees increases or decreases due to fires. Thus, the role of fires in areas of shrubland and deciduous trees varies with the region, and the actual vegetation distribution is a result of many factors including fire, climate, topography, and soil conditions (He et al., 2007; Cimalová and Lososová, 2009).
3.3 Fire impact on carbon balance
The direct and indirect impacts of fires on carbon balance were investigated for static and dynamic vegetation cover (Fig. 6 and Table 3). The impact of fires in BGConly was estimated by calculating the difference between BGConly-F and BGConly-NF, averaged over the final 30 years of each 200-year simulation. Similarly, the impact of fires in BGC-DV was estimated by calculating the difference between BGC-DV-F and BGC-DV-NF.
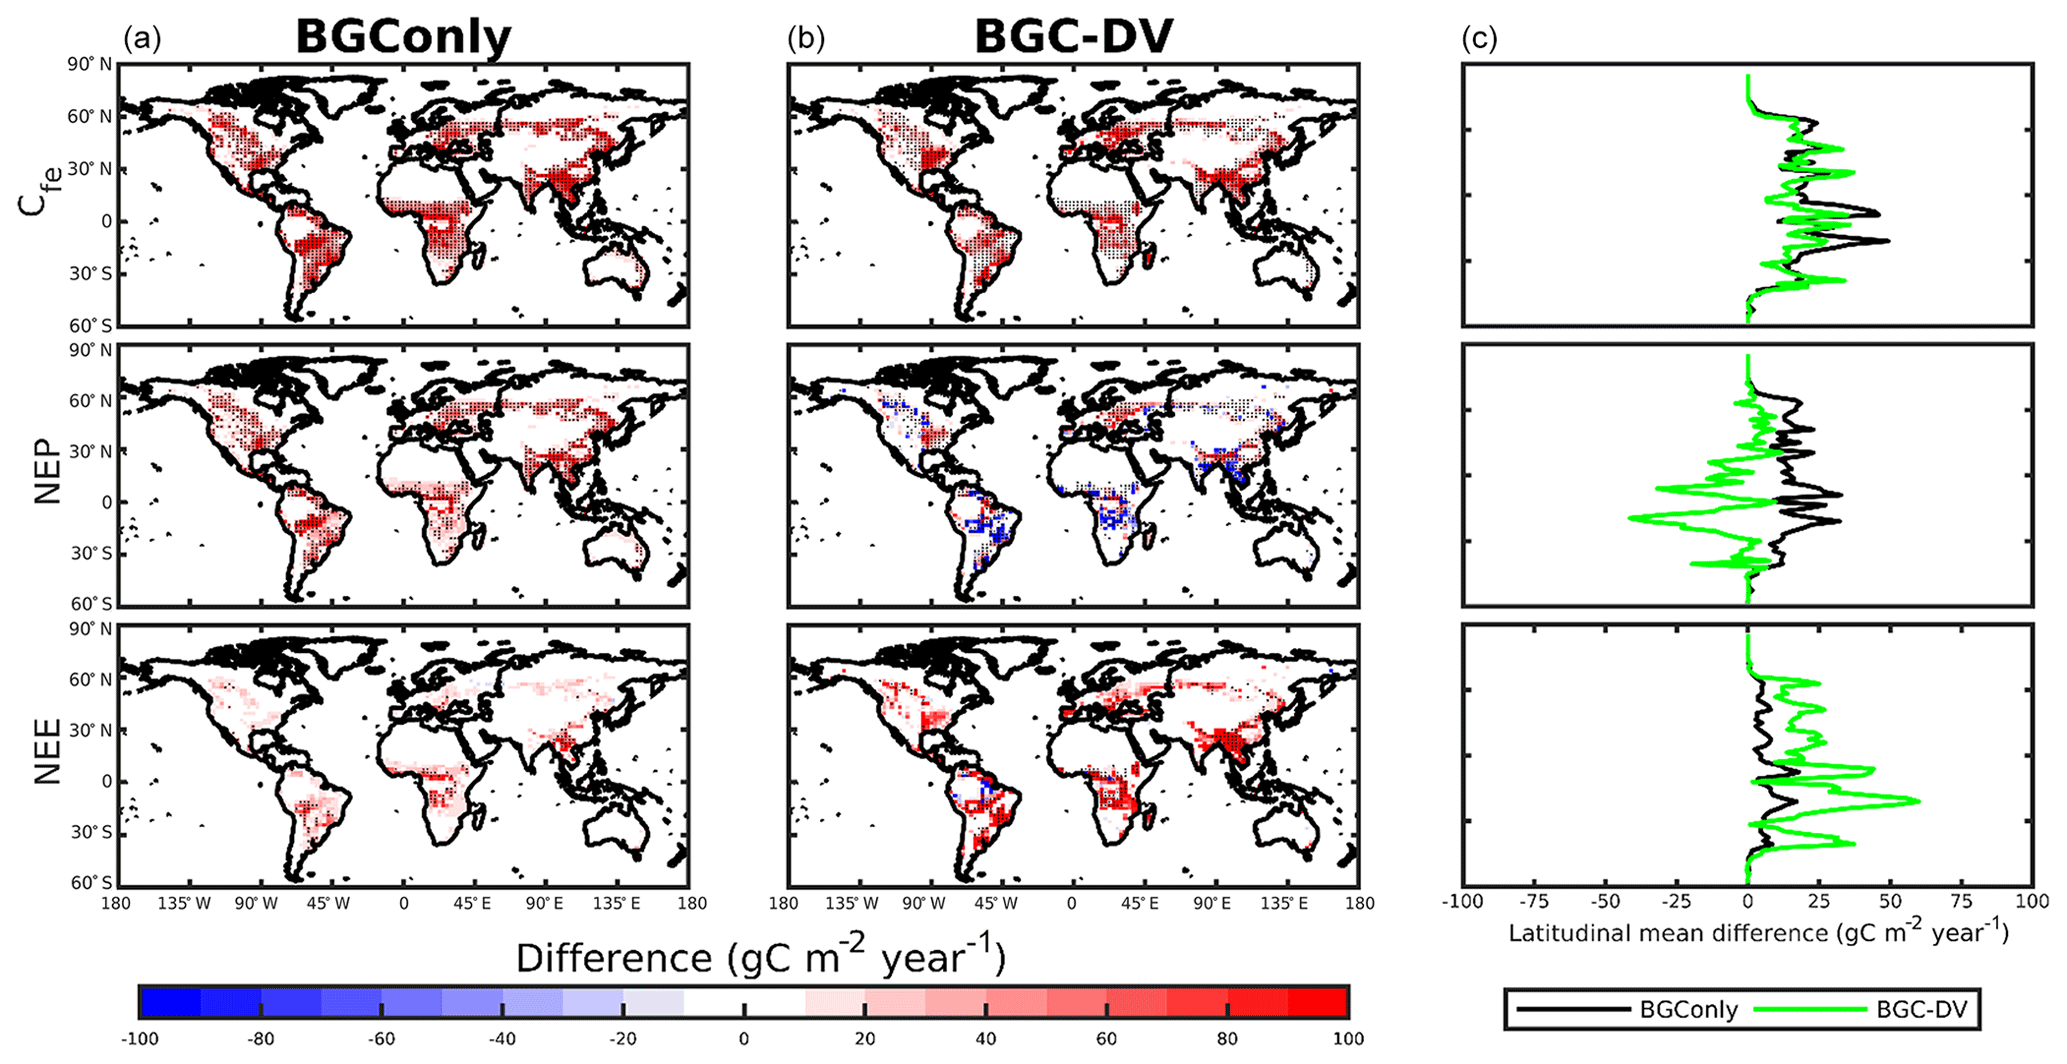
Figure 6Differences in carbon emissions (Cfe), net ecosystem production (NEP), and net ecosystem exchange (NEE) caused by fires in BGConly (BGConly-F minus BGConly-NF; a) and BGC-DV (BGC-DV-F minus BGC-DV-NF; b). Hashed areas indicate that the difference passed the Student's t test at the 0.05 significance level. Latitudinal mean differences are plotted in (c).
Table 3Annual means of carbon budget for gross primary production (GPP), NPP, Ra, Rh, NEP, NEE, and Cfe and their differences between one with fire and one without fire (i.e., BGConly-F minus BGConly-NF and BGC-DV-F minus BGC-DV-NF) in Pg C yr−1. Asterisk (*) indicates that the difference passed the Student's t test at the α=0.05 significance level.
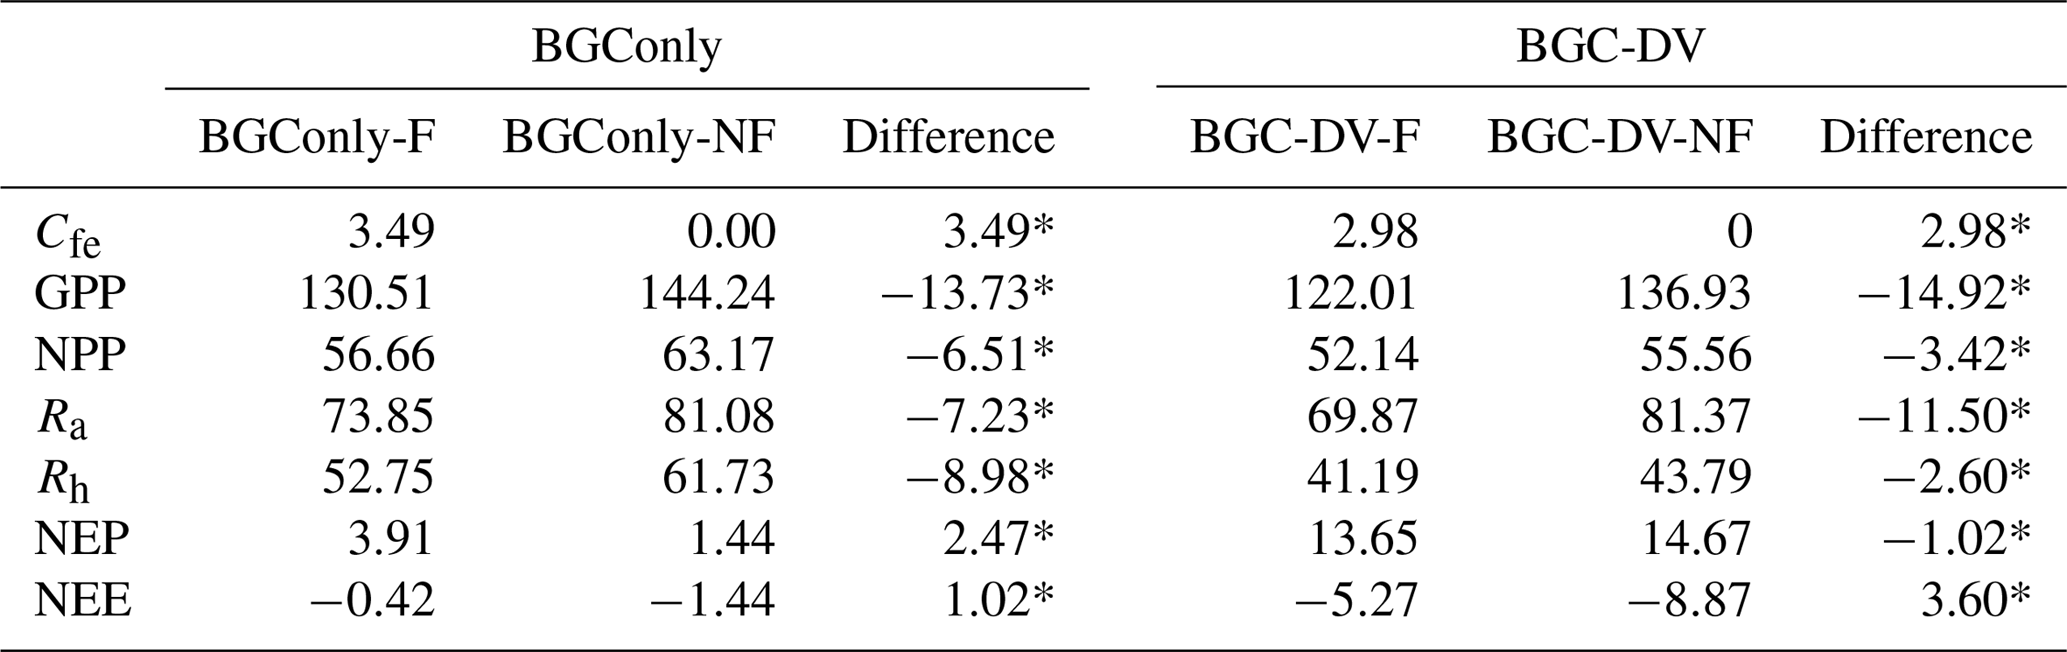
Carbon emissions from fires (direct impacts) are shown in Fig. 6. The spatial distribution of the BGConly and BGC-DV runs is similar, but average annual emissions are higher in BGConly (3.5 Pg) than in BGC-DV (3.0 Pg) because trees are less dominant in BGC-DV than in BGConly, which causes a reduced fuel load.
Carbon emission estimates from both BGConly and BGC-DV simulations are relatively high; however, they do fall within the range of previous findings. For example, 1997–2014 GFED4s data estimated annual direct carbon emissions as 2.3 Pg. Mouillot et al. (2006) estimated annual carbon emissions as 3.0 Pg for the end of the 20th century and the 20th-century average as 2.5 Pg. Li et al. (2012) estimated the 20th-century emissions as 3.5 Pg C yr−1 using the CLM3-DGVM and Li et al. (2014) and Yue et al. (2015) both estimated the 20th-century emissions as 1.9 Pg C yr−1 using the CLM4.5 and Organising Carbon and Hydrology In Dynamic Ecosystems (ORCHIDEE) land surface models, respectively.
In addition to direct carbon emissions from fires, fire influences terrestrial carbon sinks by impacting ecosystem processes (Fig. 6). Fire increases the NEP in post-fire regions in BGConly simulations (i.e., difference between BGConly-F and BGConly-NF, Fig. 6a), which is consistent with the findings of the previous studies (Li et al., 2014). The overall NEP increase is 2.5 Pg C yr−1 in this study, which is greater than the value of 1.9 Pg C yr−1 calculated by Li et al. (2014). However, Li et al. (2014) performed a transient simulation from 1850 to 2004, whereas the BGConly runs in our study were conducted following an equilibrium simulation using the year 2000 as the reference year, which means that no fire exchanges are caused by land cover changes.
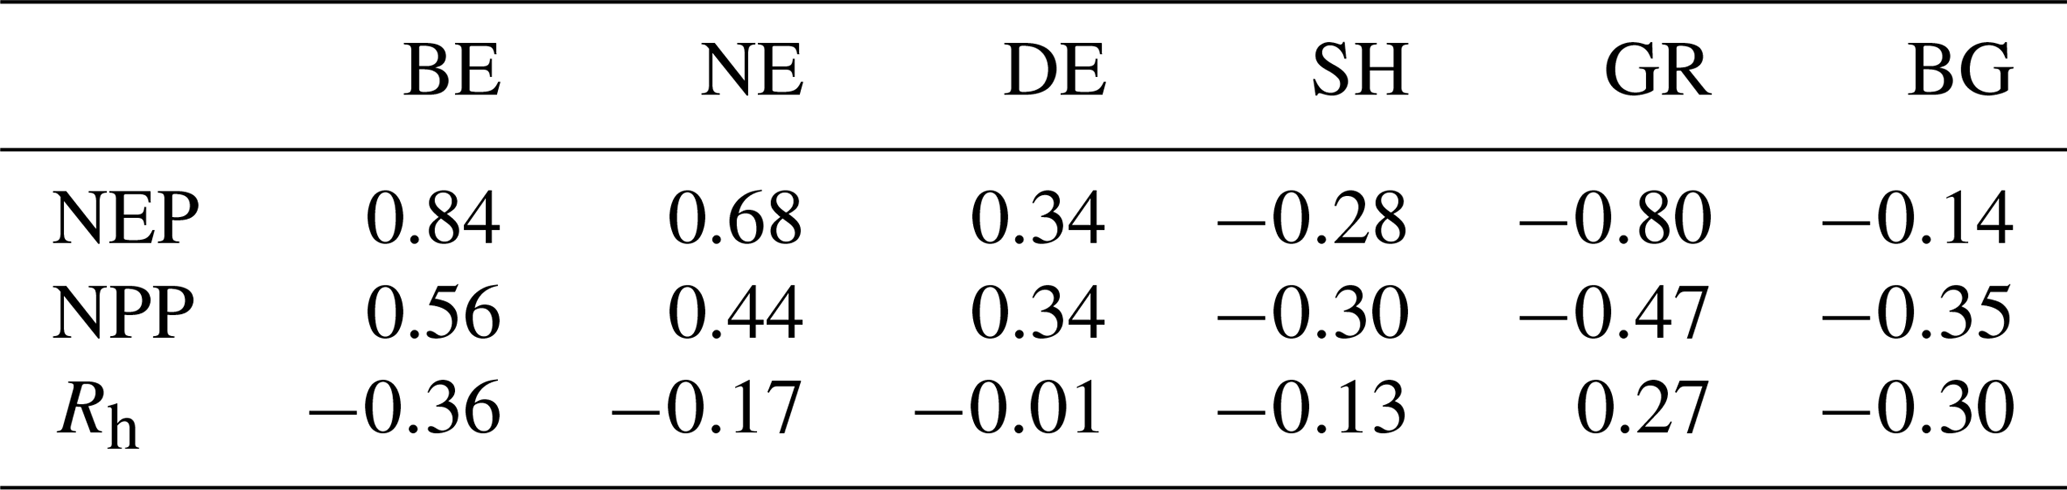
Simulations that ignore vegetation dynamics (i.e., the BGConly runs in this study; Li et al., 2014; Yue et al., 2015) show a global fire-induced NEP increase when comparing fire-on and fire-off runs. However, a decrease in fire-induced NEP is apparent in some regions in BGC-DV simulations (i.e., differences between BGC-DV-F and BGC-DV-NF, Fig. 6b). This carbon sink reduction occurs in regions where dominant PFTs change from broadleaf and needleleaf evergreen trees to grass (Table 3 and Fig. 6). Table 4 shows the correlation coefficients between percent changes in vegetation types and changes in carbon fluxes (NEP, NPP, and Rh) for six different PFTs in each grid cell, and Fig. 7 shows the broadleaf evergreen tree, needleleaf evergreen tree, and grass PFTs. NEP changes are strongly linked to changes in dominant PFTs, for example, decreases in broadleaf evergreen and needleleaf evergreen trees and increases in grass. Furthermore, the changes in NEP and PFTs are related to the changes in NPP and Rh to some extent. Our results differ from those of previous studies that did not consider vegetation dynamics (e.g., Amiro et al., 2010) because the inclusion of vegetation dynamics enables the model to capture NEP decreases in post-fire regions at the beginning of the post-fire succession.
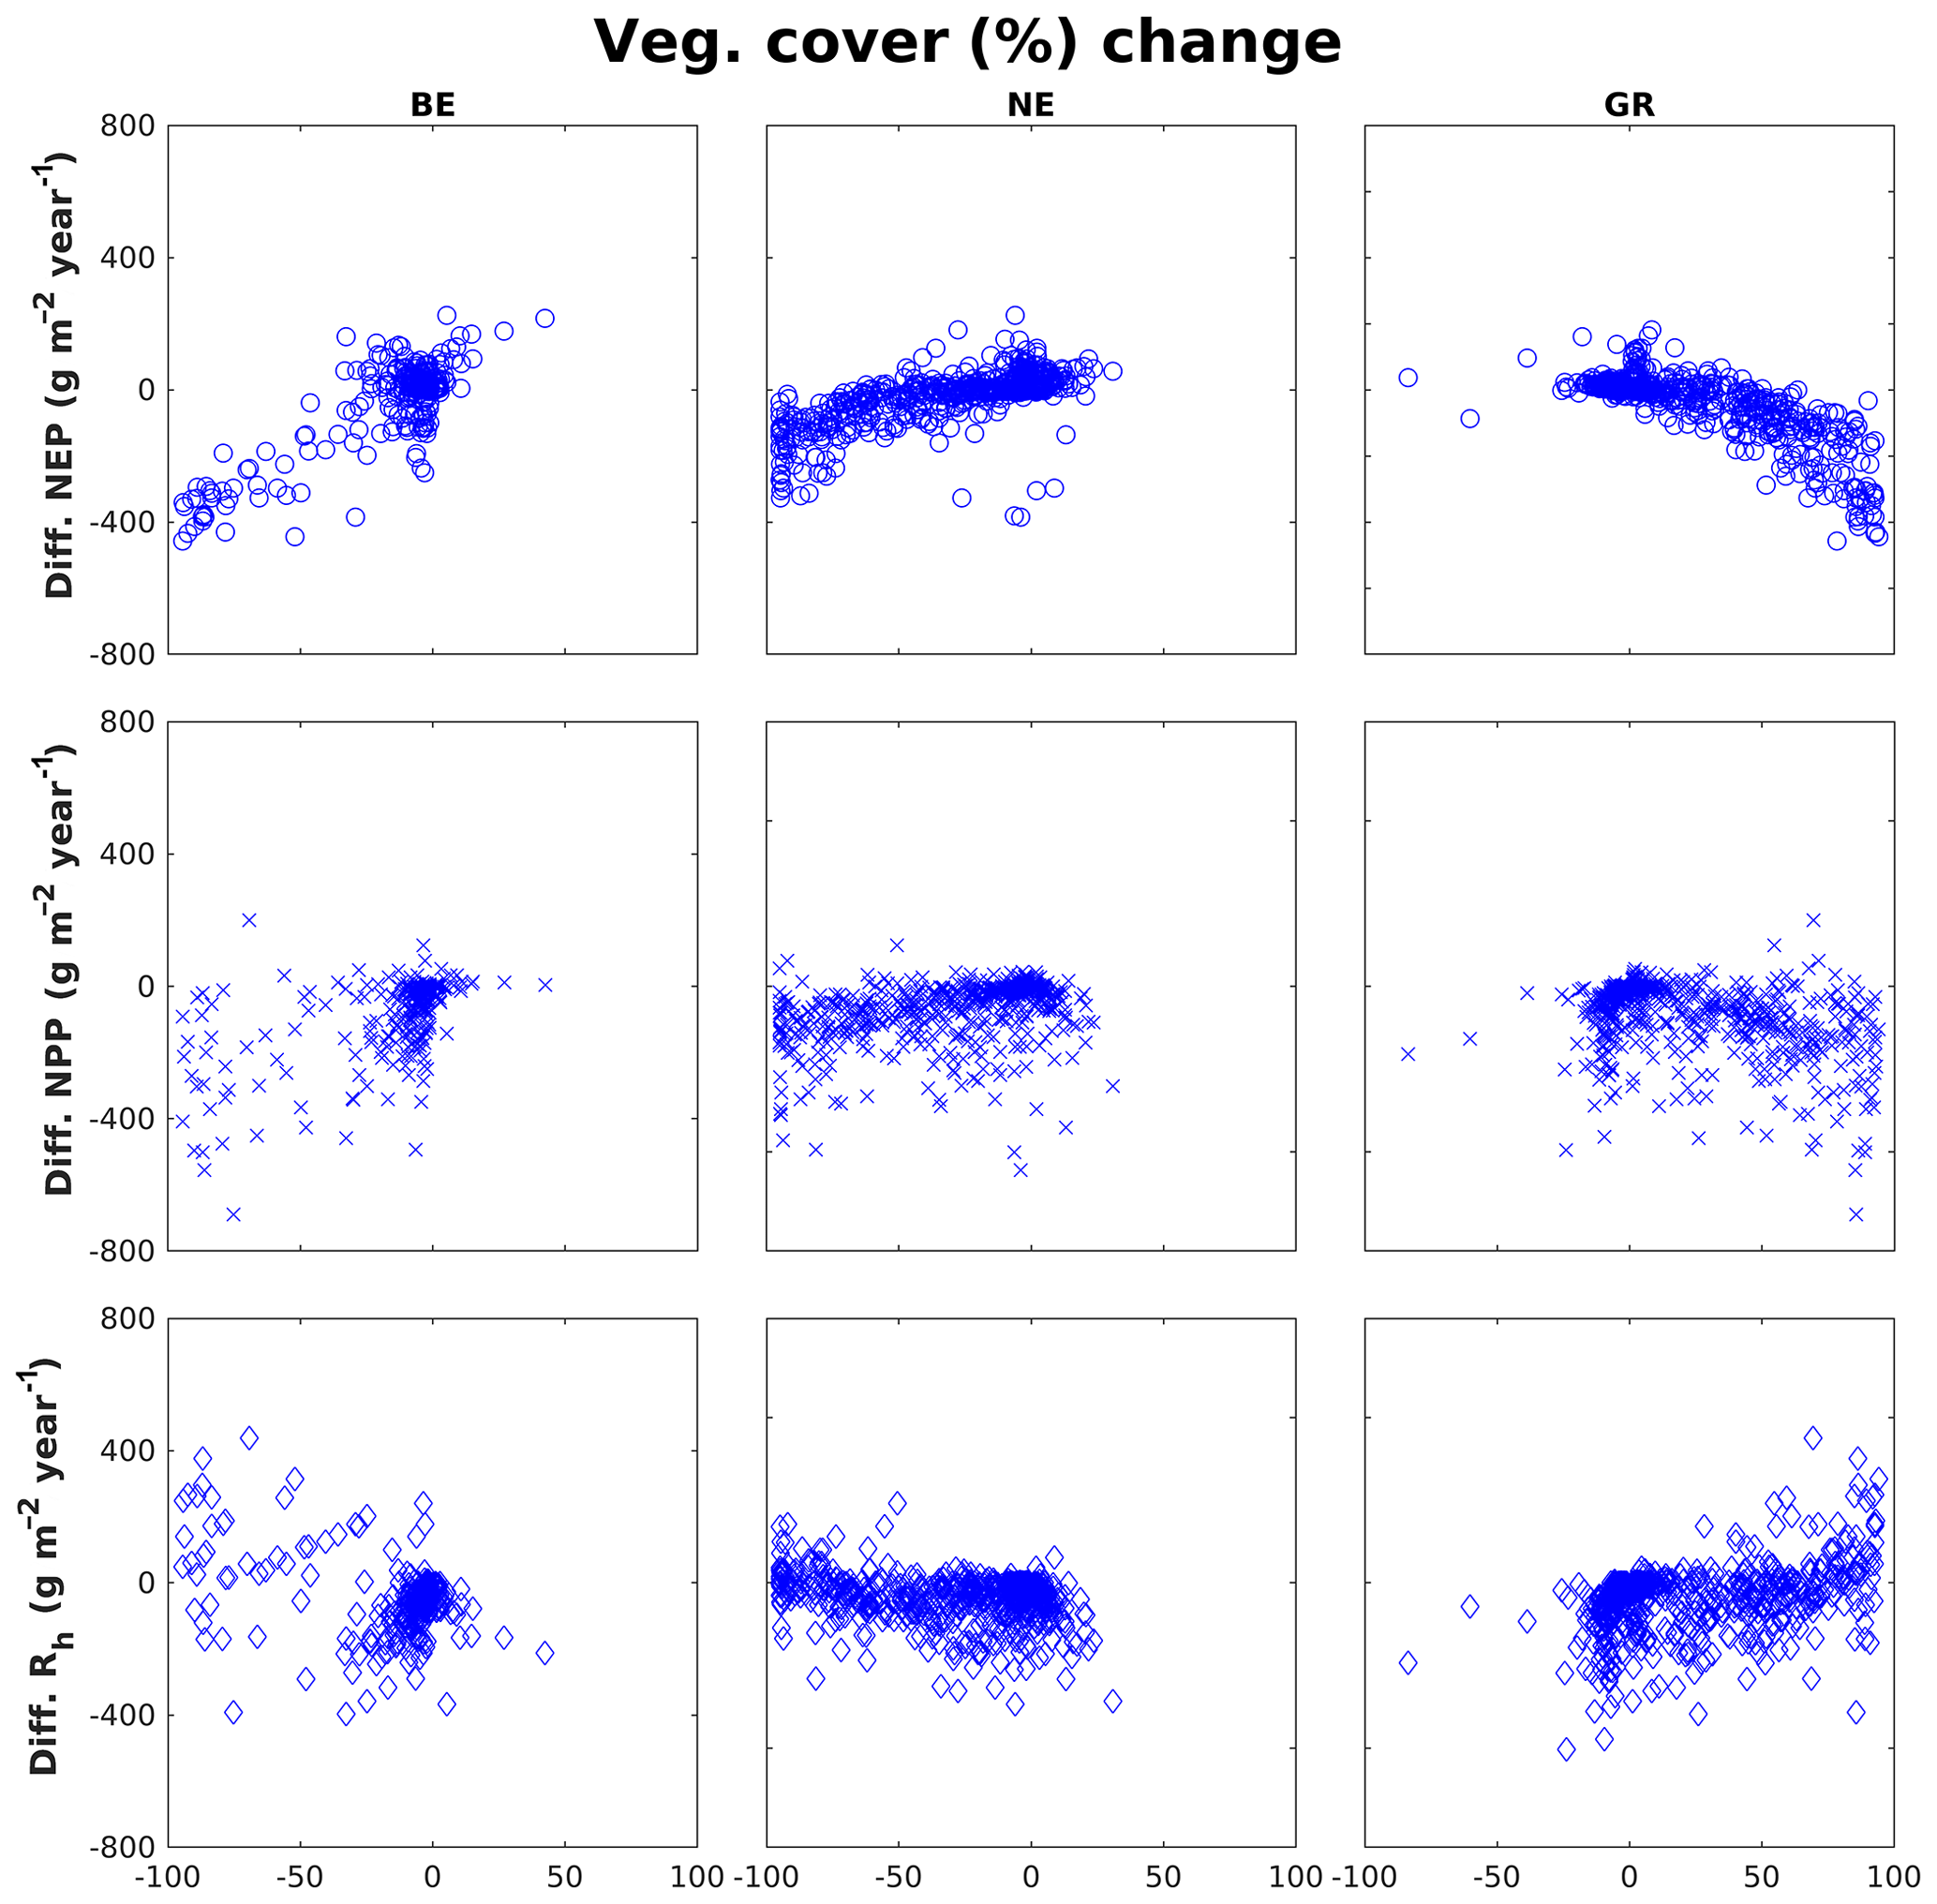
Figure 7Differences in net ecosystem production (NEP), net primary productivity (NPP), and heterotrophic respiration (Rh)) due to fires in BGC-DV (i.e., BGC-DV-F minus BGC-DV-NF) according to percent changes in broadleaf evergreen (BE), needleleaf evergreen (NE), and grass (GR) vegetation types.
Table 4Pearson correlation coefficients between carbon fluxes (NEP, NPP, Rh) and percentage changes in vegetation cover for broadleaf evergreen (BE), needleleaf evergreen (NE), deciduous (DE), shrub (SH), grass (GR), and bare ground (BG).
Since land use changes are not considered in this study, the overall impact of fires was estimated by the sum of direct carbon emissions from fires and terrestrial carbon sinks, i.e., NEP (Eq. 3). Both simulations resulted in net carbon sources in the post-fire regions, even though different processes were involved. Direct carbon emissions from fires (Cfe in Eq. 3) were partly negated by the increased NEP in the BGConly runs, but they were enhanced by the reduction in NEP in BGC-DV runs.
3.4 Fire impact on water balance
The impact of fires on water balance was examined by estimating the changes in runoff, evapotranspiration, and soil moisture between cases with and without fire. The differences between BGConly-F and BGConly-NF were assessed for the case without considering the vegetation dynamics, and differences between BGC-DV-F and BGC-DV-NF were assessed for the case considering the vegetation dynamics (Table 5 and Fig. 8). Increases in runoff and decreases in evapotranspiration (ET) were observed in post-fire regions to a different degree, which is consistent with the results of the previous studies (Neary et al., 2005; Li and Lawrence, 2017). Our study used CLM as a stand-alone model without coupling it with atmospheric or ice models, whereas Li and Lawrence (2017) examined the impact of fires on global water budget using CLM-BGC coupled with the CAM and Community Ice CodE (CICE) models and showed that the impact of fires on global annual precipitation was limited.

Figure 8Differences in evapotranspiration (ET) and runoff due to fire in BGConly (BGConly-F minus BGConly-NF; a) and BGC-DV (BGC-DV-F minus BGC-DV-NF; b). Hashed areas indicate that the difference passed the Student's t test at the 0.05 significance level. Latitudinal mean differences are plotted in (c).
Table 5Annual mean water budgets for ground evaporation (GE), canopy evaporation (CE), canopy transpiration (CT), evapotranspiration (ET), and total runoff (RO) and the difference between the one with fire and the one without fire (i.e., BGConly-F minus BGConly-NF and BGC-DV-F minus BGC-DV-NF) in 103 km3 yr−1. Asterisk (*) indicates that the difference passed the Student's t test at the α=0.05 significance level.
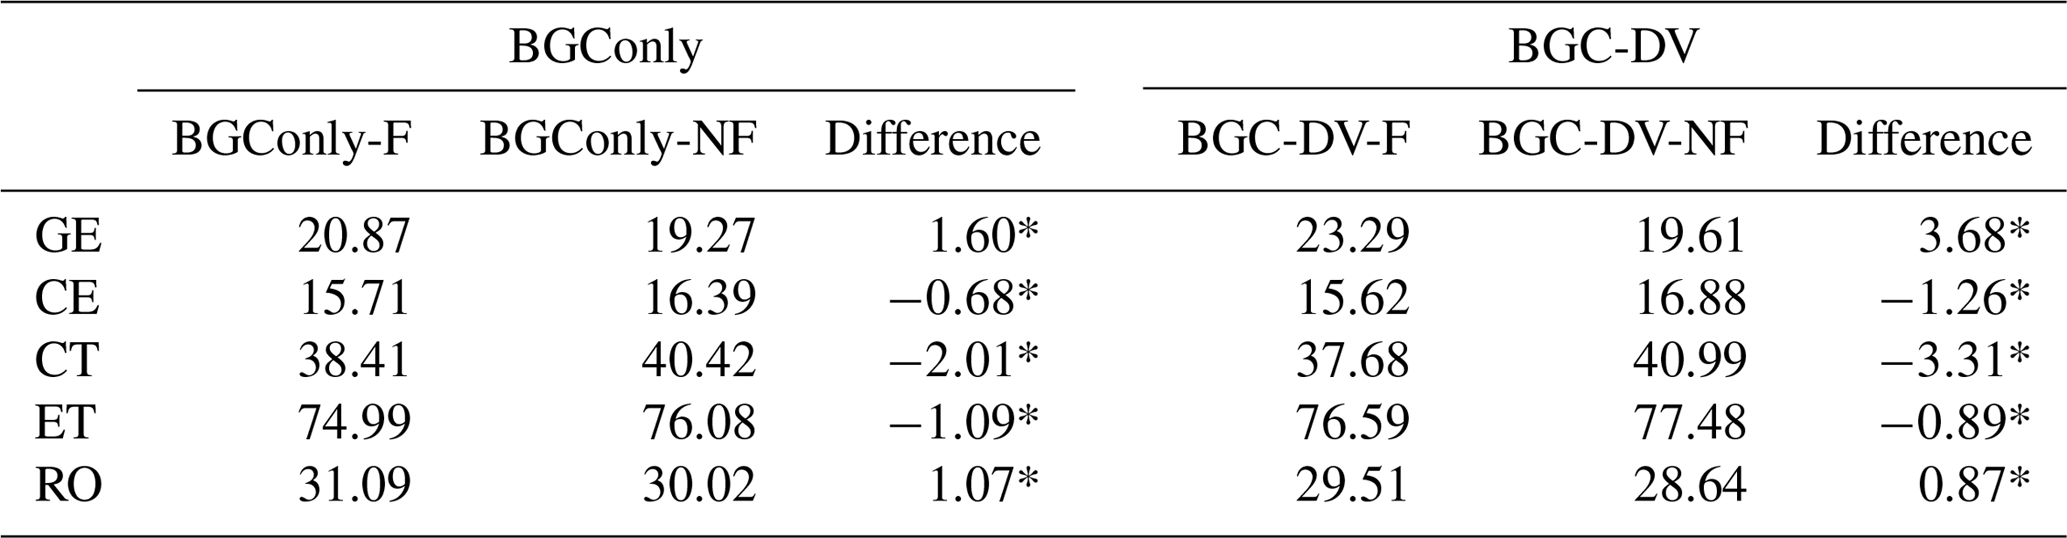
Li and Lawrence (2017) demonstrated that a reduction in vegetation canopy (LAI; Table 6) is a critical pathway for fires that decrease ET. Fire events lower the leaf area, which decreases vegetation transpiration and canopy evaporation; however, they also expose more of the soil to the air and sunlight, which increases soil evaporation. Post-fire decreases in vegetation height (Table 6) can increase and decrease ET because the resulting decrease in land surface roughness potentially reduces water and energy exchange and leads to higher leaf temperatures and wind speeds. In this study, both BGConly and BGC-DV runs show that the vegetation canopy is the main pathway leading to a decrease in ET, which is similar to the findings of Li and Lawrence (2017). In addition, an examination of the changes in the vegetation composition in post-fire regions shows that the overall impact of those changes in ET and runoff does not differ greatly when dynamic vegetation is employed in the model.
Table 6Annual mean values for LAI (m2 m−2) and vegetation height (m) and the difference between the one with fire and the one without fire (i.e., BGConly-F minus BGConly-NF and BGC-DV-F minus BGC-DV-NF). Asterisk (*) indicates that the difference passed the Student's t test at the α=0.05 significance level.

Table 7Annual mean soil moisture (%) at each soil depth and the difference between with fire and without fire cases (i.e., BGConly-F minus BGConly-NF and BGC-DV-F minus BGC-DV-NF). Asterisk (*) indicates that the difference passed the Student's t test at the α=0.05 significance level.
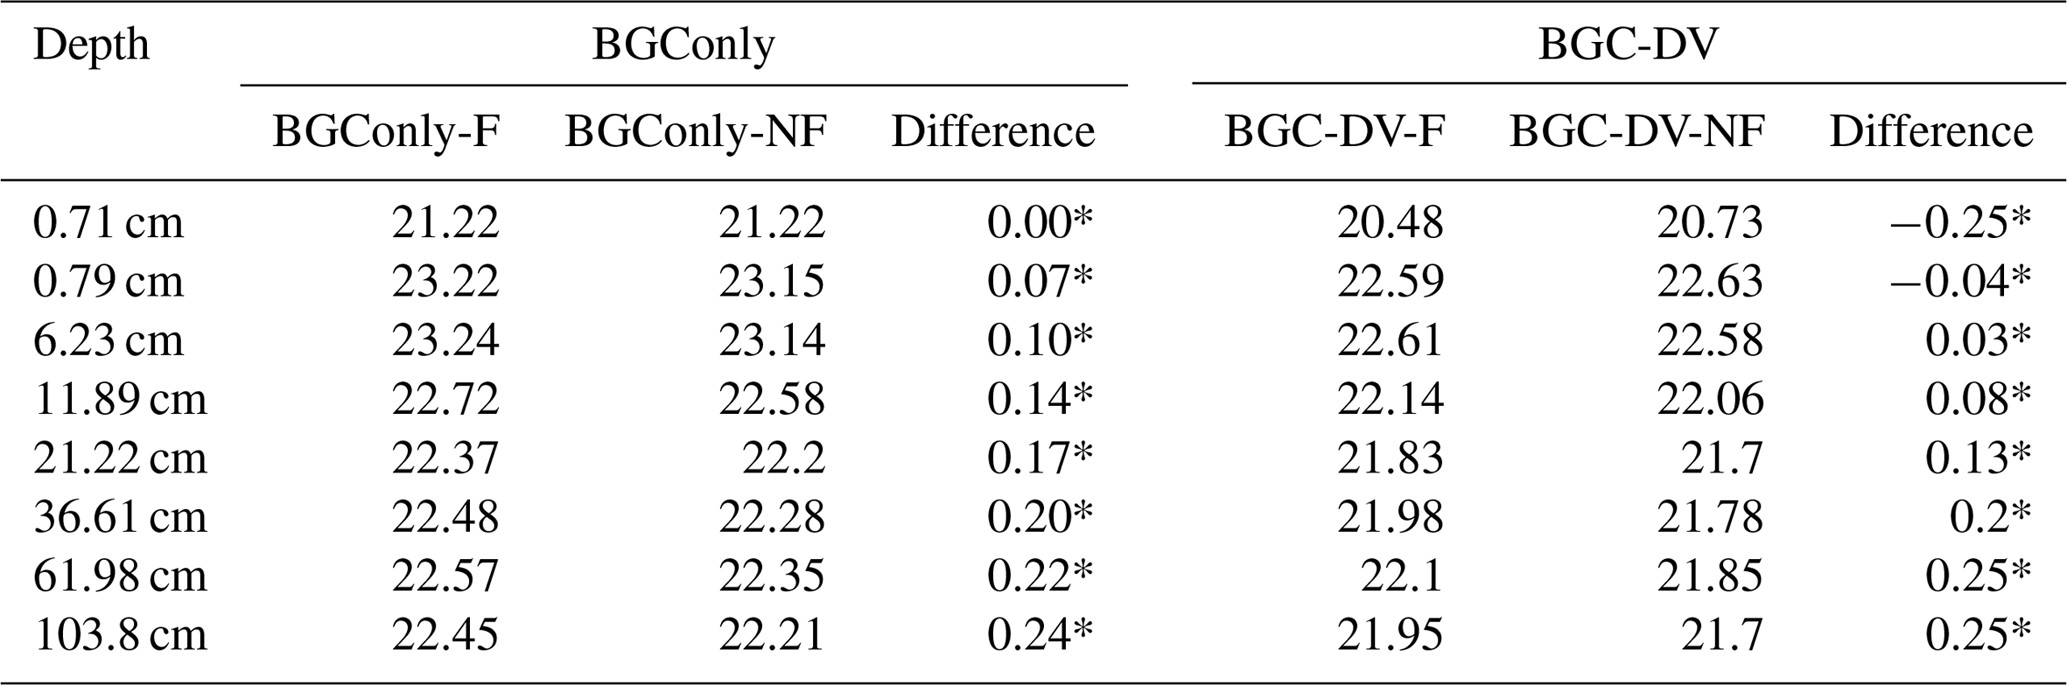
The results show that fire-induced vegetation changes (from trees to grass or bare ground) in BGC-DV lead to a significant decrease in canopy transpiration and increase in soil evaporation relative to BGConly runs. Fire destroys plant roots and leaves; changes in the dominant vegetation types in BGC-DV lead to changes in the soil moisture profile through reduced transpiration (Fig. 9 and Table 7). Consequently, there is less water stress in each soil layer in the burned areas than in unburned areas. Grasslands dominate the post-fire regions in BGC-DV runs, and they absorb and transpire more water from the top soil layer than trees (Mazzacavallo and Kulmatiski, 2015). Therefore, there is less moisture in the top soil layers in fire-affected regions than in unburned regions, although the overall transpiration is diminished. In summary, fire has an impact on vegetation distribution, which in turn impacts the soil water profile.
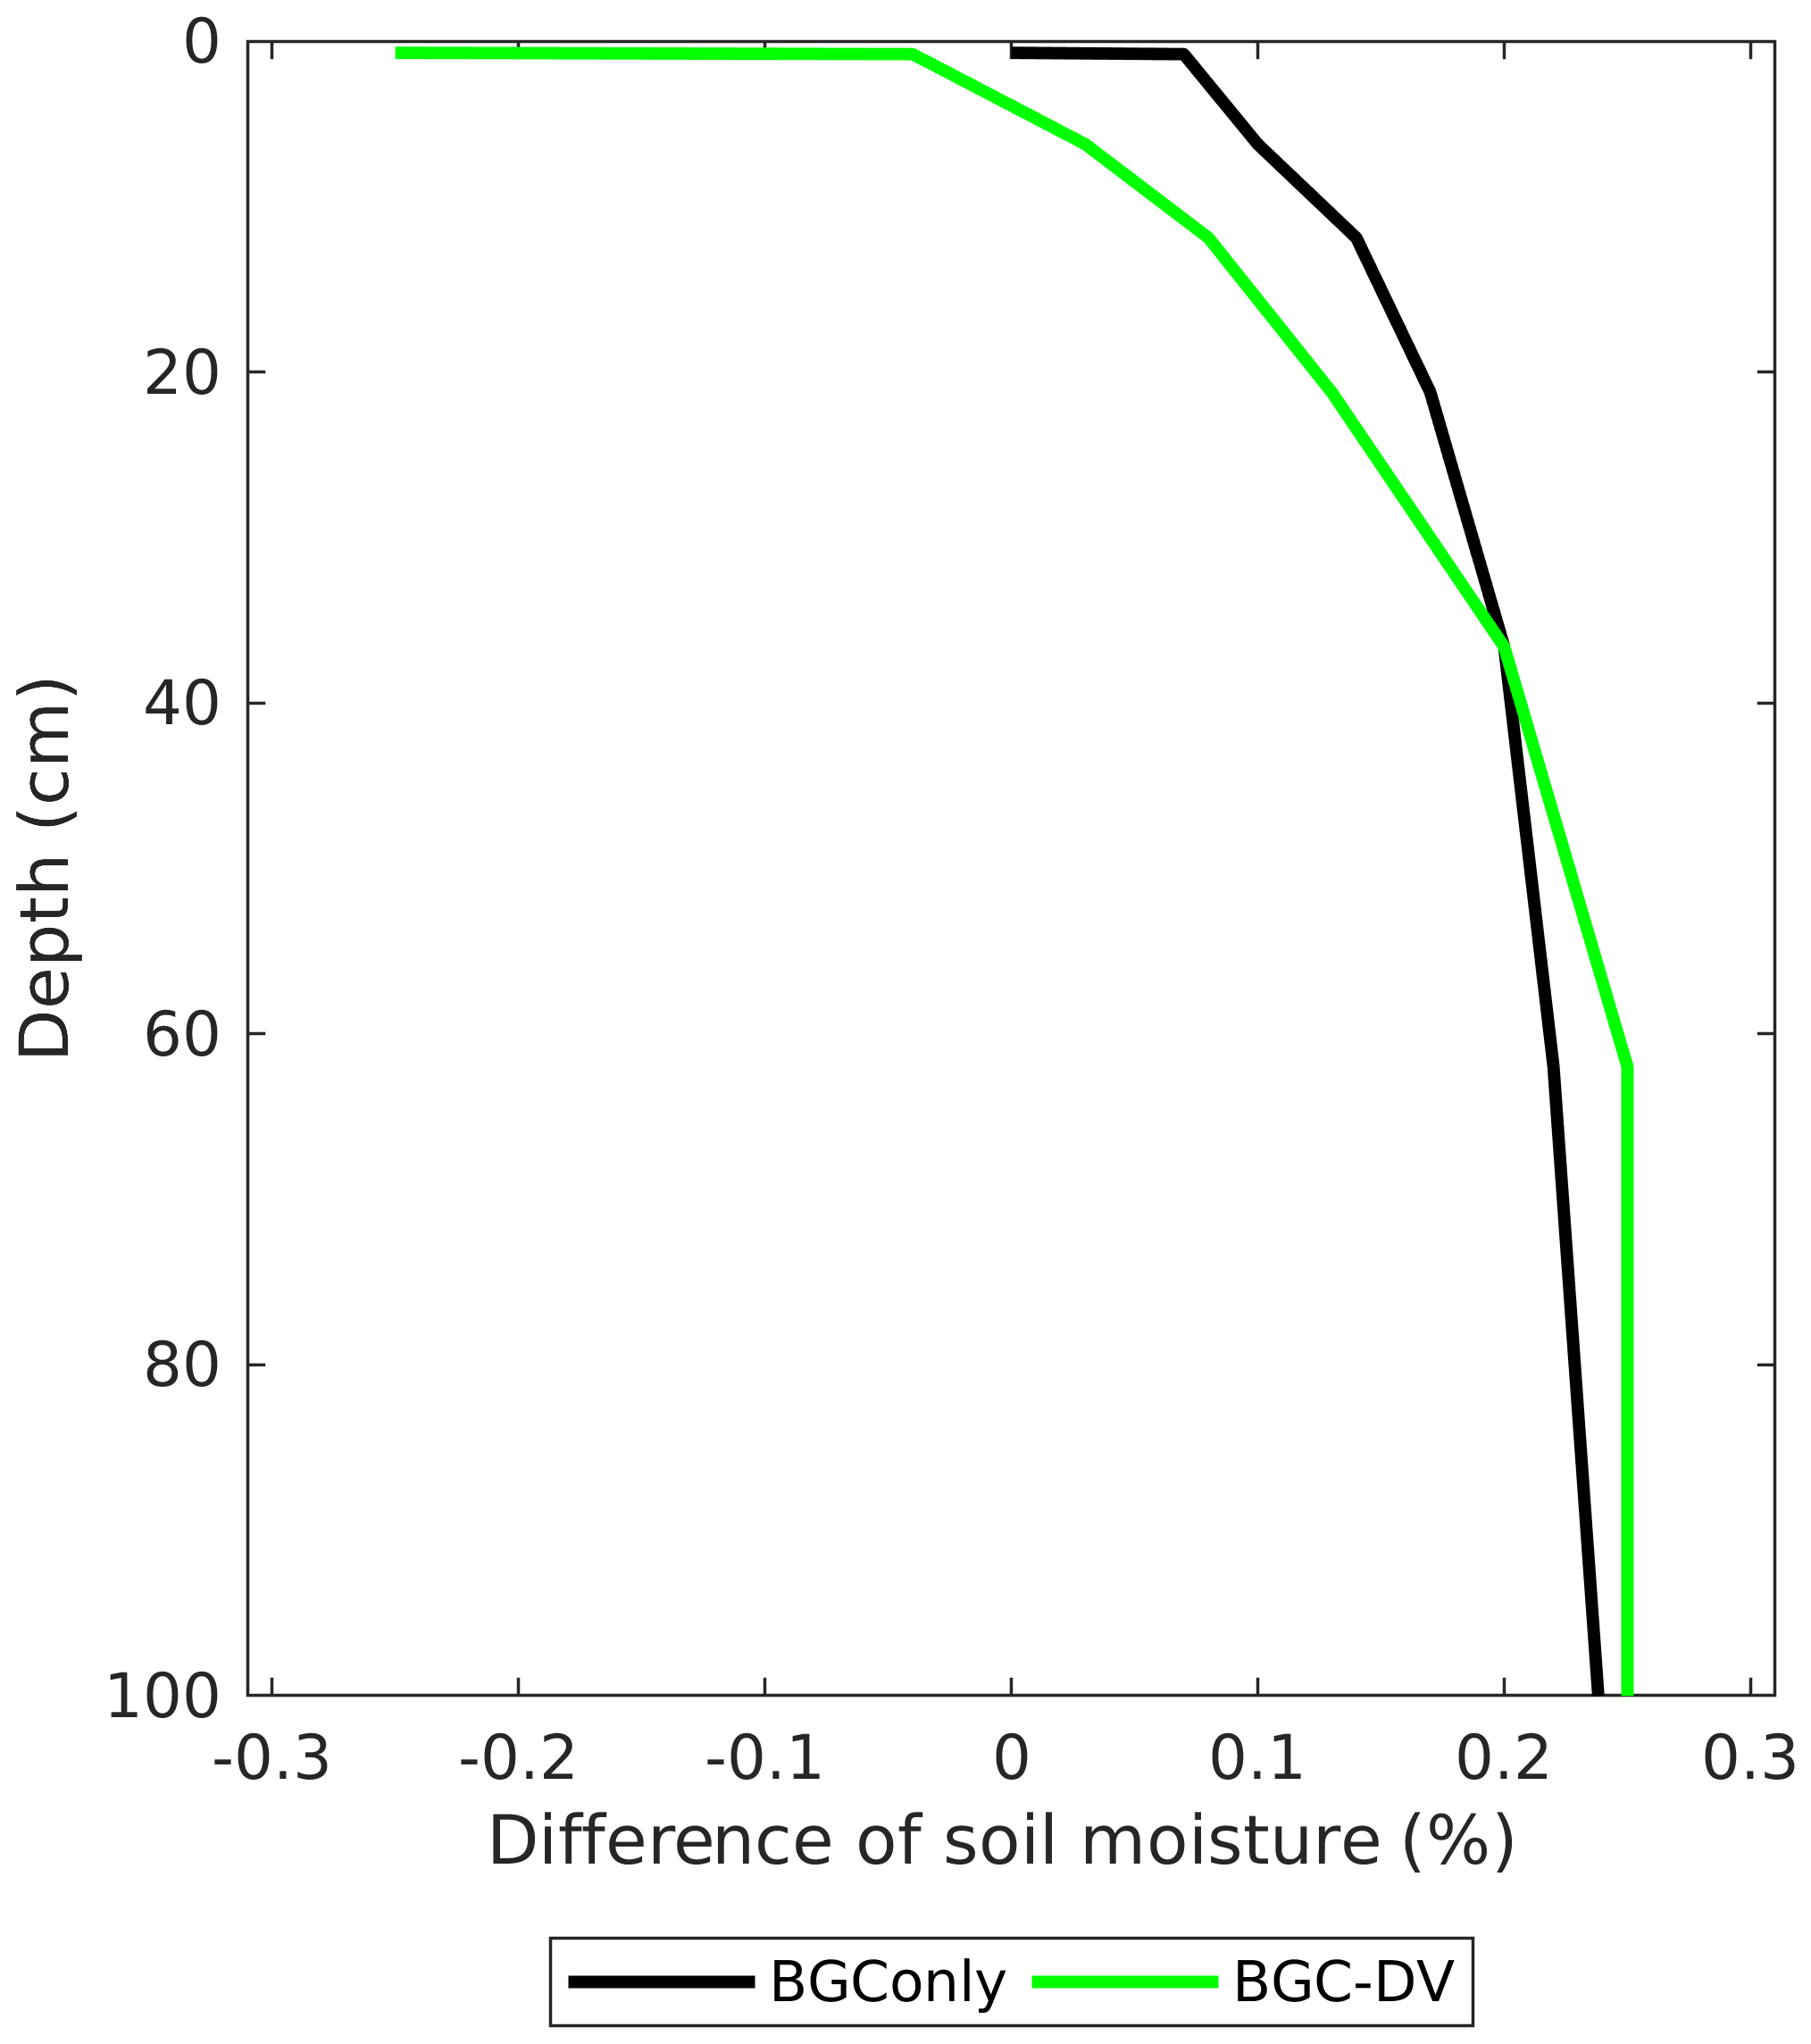
Figure 9Difference in soil moisture (%) due to fire in BGConly (i.e., BGConly-F minus BGConly-NF) and BGC-DV (i.e., BGC-DV-F minus BGC-DV-NF).
Despite the differences in soil moisture and vegetation canopy and height, changes in ET and runoff do not vary significantly between BGConly and BGC-DV. Thus, including dynamic vegetation does not impact the physiological and physical processes of evapotranspiration and runoff, respectively. However, changes in ET and runoff can be amplified in BGC-DV than in BGConly by modeling the land–atmosphere interactions with a coupled land–atmosphere model (e.g., CLM–CAM) because changes in land characteristics in BGC-DV would feed back to the changes in precipitation. Therefore, the limited impact of fires on precipitation in Li and Lawrence (2017) with the coupled model would be increased by including dynamic vegetation in the model.
To understand the interplay between the vegetation dynamics and the impact of fires, we conducted a series of numerical experiments using CLM with and without fires and dynamic vegetation. In particular, we investigated the impact of fires on vegetation distribution and how these changes influence terrestrial carbon and water fluxes.
The results show that fire interrupts the process of ecological succession, which impacts the global vegetation distribution. Fire transforms some regions into bare ground, and grassland starts to quickly dominate those landscapes because grass grows faster than trees. For shrubs and deciduous trees in the mid-stages of ecological succession, there were no large differences in the overall coverage ratios between simulations that included vegetation dynamics and those that did not. Simulations that did not consider vegetation dynamics showed a fire-induced global increase in NEP; however, a fire-induced decrease in NEP was detected in some regions in BGC-DV runs. A carbon sink reduction was also detected in regions where the dominant PFT changed from broadleaf and needleleaf evergreen trees to grass. While carbon emissions from fires were partly negated by increased terrestrial carbon sinks (NEP) in BGConly runs, they were enhanced by the reduction in terrestrial carbon sinks in BGC-DV runs when dynamic vegetation was considered.
Fire-induced changes in vegetation from trees to grass or bare ground resulted in a decrease in canopy transpiration and increased soil evaporation in post-fire regions in BGC-DV runs; however, there were no significant differences in the overall impact on ET and runoff between the simulations that used dynamic vegetation and those that did not. However, changes in dominant vegetation types in BGC-DV led to changes in the soil moisture profile. Furthermore, the increased distribution of grassland cover was more dominant in post-fire regions, which then resulted in less moisture in the top soil layers than in unburned areas, although transpiration diminished overall.
Enabling the vegetation dynamics module in the CLM improves the understanding of the interactive impacts of fires and vegetation dynamics. However, uncertainty still exists because of the limitations in the simulations of equilibrium vegetation distribution using CLM with BGC-DV-F; the final equilibrium vegetation state of the BGC-DV model did not always correspond to the observed distribution (Fig. 3). For example, shrubs in the tundra were rare in both BGC-DV-F and BGC-DV-NF runs. Furthermore, crops, needleleaf evergreen boreal, and shrub boreal cannot be simulated by the DV module, as also reported in previous studies (Zeng et al., 2008).
The fire module in CLM is parameterized to estimate the occurrence, spread, and impacts of fires. Thresholds used to estimate fuel combustibility depend on relative humidity and surface air temperature; however, these values may not be suitable for all regions (Zhang et al., 2016). In addition, the economic impact of fire occurrence and the socioeconomic impact of fire spread are estimated using the input datasets of population density (person km−2) and GDP (USD per capita), respectively (Li et al., 2013). Uncertainty due to socioeconomic factors should be noted for both historical and future simulations because changes in these factors may vary by country (Steelman and Burke, 2006). It is evident that our understanding of fires needs to improve because fires play an important role in the distribution of vegetation and in carbon, water, and energy cycles. This study shows that fire models are strongly impacted by vegetation distribution; therefore, fire simulations would improve with the advancement of dynamic vegetation models.
The code of and input datasets for CLM were downloaded from the NCAR CLM website (refer to http://www.cesm.ucar.edu, NCAR, 2019).
YK and HS designed the study, and HS performed the model simulations by processing the data and modifying the code. Both YK and HS analyzed the results and wrote the manuscript.
The authors declare that they have no conflict of interest.
This study was supported by the Basic Science Research Program through the
National Research Foundation of Korea, which was funded by the Ministry of
Science, ICT and Future Planning (2018R1A1A3A04079419), and by the Korea
Polar Research Institute (KOPRI, PN17900).
Edited by: Gerd A.
Folberth
Reviewed by: two anonymous referees
Amiro, B. D., Barr, A. G., Barr, J. G., Black, T. A., Bracho, R., Brown, M., Chen, J., Clark, K. L., Davis, K. J., Desai, A. R., Dore, S., Engel, V., Fuentes, J. D., Goldstein, A. H., Goulden, M. L., Kolb, T. E., Lavigne, M. B., Law, B. E., Margolis, H. A., Martin, T., McCaughey, J. H., Misson, L., Montes-Helu, M., Noormets, A., Randerson, J. T., Starr, G., and Xiao, J.: Ecosystem carbon dioxide fluxes after disturbance in forests of North America, J. Geophys. Res.-Biogeo., 115, G00K02, https://doi.org/10.1029/2010JG001390, 2010.
Andreae, M. O. and Rosenfeld, D.: Aerosol-cloud-precipitation interactions. Part 1. The nature and sources of cloud-active aerosols, Earth Sci. Rev., 89, 13–41, https://doi.org/10.1016/j.earscirev.2008.03.001, 2008.
Balch, J. K., Nepstad, D. C., Brando, P. M., Curran, L. M., Portela, O., de Carvalho, O., and Lefebvre, P.: Negative fire feedback in a transitional forest of southeastern Amazonia, Glob. Change Biol., 14, 2276–2287, https://doi.org/10.1111/j.1365-2486.2008.01655.x, 2008.
Baudena, M., D'Andrea, F., and Provenzale, A.: An idealized model for tree-grass coexistence in savannas: The role of life stage structure and fire disturbances, J. Ecol., 98, 74–80, https://doi.org/10.1111/j.1365-2745.2009.01588.x, 2010.
Beringer, J., Hutley, L., Abramson, D., Arndt, S., Briggs, P., Bristow, M., Canadell, J., Cernusak, L., Eamus, D., Edwards, A., Evans, B., Fest, B., Goergen, K., Grover, S., Hacker, J., Haverd, V., Kanniah, K., Livesley, S., Lynch, A., Maier, S., Moore, C., Raupach, M., Russell-Smith, J., Scheiter, S., Tapper, N., and Uotila, P.: Fire in Australian savannas: From leaf to landscape, Glob. Change Biol., 21, 62–81, https://doi.org/10.1111/gcb.12686, 2015.
Bonan, G. B., Drewniak, B., Huang, M., Koven, C. D., Levis., S., Li, F., Riley, W. J., Subin, Z. M., Swenson, S. C., and Thronton, P. E.: Technical Description of Version 4.5 of the Community Land Model (CLM), NCAR/TN-486+STR, NCAR, Boulder, Colo., 2013.
Bond, W. J., Woodward, F. I., and Midgley, G. F.: The global distribution of ecosystems in a world without fire, New Phytol., 165, 525–538, https://doi.org/10.1111/j.1469-8137.2004.01252.x, 2005.
Bowman, D., Balch, J., Artaxo, P., Bond, W., Carlson, J., Cochrane, M., Antonio, C., Defries, R., Doyle, J., Harrison, S., Johnston, F., Keeley, J., Krawchuk, M., Kull, C., Marston, J., Moritz. M., Prentice,I., Roos, C., Scott, A., Swetnam, T., van der Werf, G., and Pyne, S.: Fire in the Earth System, Science, 324, 481–484, https://doi.org/10.1126/science.1163886, 2009.
Castillo, C. K. G. and Gurney, K. R.: A sensitivity analysis of surface biophysical, carbon, and climate impacts of tropical deforestation rates in CCSM4-CNDV, J. Climate, 26, 805–821, https://doi.org/10.1175/JCLI-D-11-00382.1, 2013.
Castillo, C. K. G., Levis, S., and Thornton, P.: Evaluation of the new CNDV option of the community land model: Effects of dynamic vegetation and interactive nitrogen on CLM4 means and variability, J. Climate, 25, 3702–3714, https://doi.org/10.1175/JCLI-D-11-00372.1, 2012.
Cimalová, Š. and Lososová, Z.: Arable weed vegetation of the northeastern part of the Czech Republic: Effects of environmental factors on species composition, Plant Ecol., 203, 45–57, https://doi.org/10.1007/s11258-008-9503-1, 2009.
Clement, B. and Touffet, J.: Plant Strategies and Secondary Succession on Brittany Heathlands after Severe Fire, J. Veg. Sci., 1, 195–202, https://doi.org/10.2307/3235658, 1990.
Clinton, B. D., Maier, C. A., Ford, C. R., and Mitchell, R. J.: Transient changes in transpiration, and stem and soil CO2efflux in longleaf pine (Pinus palustris Mill.) following fire-induced leaf area reduction, Trees-Struct. Funct., 25, 997–1007, https://doi.org/10.1007/s00468-011-0574-6, 2011.
DeBano, L. F.: The effects of fire on soil properties, United States Department of Agriculture Forestry Service General Technical Report, INT-2, 151–156, 1991.
Erfanian, A., Wang, G., Yu, M., and Anyah, R.: Multimodel ensemble simulations of present and future climates over West Africa: Impacts of vegetation dynamics, J. Adv. Model. Earth Sy., 8, 1411–1431, https://doi.org/10.1002/2016MS000660, 2016.
Fiebig, M., Stohl, A., Wendisch, M., Eckhardt, S., and Petzold, A.: Dependence of solar radiative forcing of forest fire aerosol on ageing and state of mixture, Atmos. Chem. Phys., 3, 881–891, https://doi.org/10.5194/acp-3-881-2003, 2003.
Giglio, L., Randerson, J. T., and van der Werf, G. R.: Analysis of daily, monthly, and annual burned area using the fourth-generation global fire emissions database (GFED4), J. Geophys. Res.-Biogeo., 118, 317–328, https://doi.org/10.1002/jgrg.20042, 2013.
Gorham, E.: Northern Peatlands: Role in the Carbon Cycle and Probable Responses to Climatic Warming, Ecol. Appl., 1, 182–195, https://doi.org/10.2307/1941811, 1991.
Hantson, S., Arneth, A., Harrison, S. P., Kelley, D. I., Prentice, I. C., Rabin, S. S., Archibald, S., Mouillot, F., Arnold, S. R., Artaxo, P., Bachelet, D., Ciais, P., Forrest, M., Friedlingstein, P., Hickler, T., Kaplan, J. O., Kloster, S., Knorr, W., Lasslop, G., Li, F., Mangeon, S., Melton, J. R., Meyn, A., Sitch, S., Spessa, A., van der Werf, G. R., Voulgarakis, A., and Yue, C.: The status and challenge of global fire modelling, Biogeosciences, 13, 3359–3375, https://doi.org/10.5194/bg-13-3359-2016, 2016.
Harden, J. W., Trumbore, S. E., Stocks, B. J., Hirsch, A., Gower, S. T., O'Neill, K. P., and Kasischke, E. S.: The role of fire in the boreal carbon budget, Glob. Change Biol., 6, 174–184, https://doi.org/10.1046/j.1365-2486.2000.06019.x, 2000.
Harrison, S. P., Marlon, J. R., and Bartlein, P. J.: Fire in the Earth System, Changing climates, earth systems and society, edited by: Dodson, J., 21–48, Springer, Dordrecht, 2010.
He, M. Z., Zheng, J. G., Li, X. R., and Qian, Y. L.: Environmental factors affecting vegetation composition in the Alxa Plateau, China, J. Arid. Environ., 69, 473–489, https://doi.org/10.1016/j.jaridenv.2006.10.005, 2007.
Hochberg, M. E., Menaut, J. C., and Gignoux, J.: The Influences of Tree Biology and Fire in the Spatial Structure of the West African Savannah, J. Ecol., 82, 217–226, https://doi.org/10.2307/2261290, 1994.
Hurtt, G. C., Frolking, S., Fearon, M. G., Moore, B., Shevliakova, E., Malyshev, S., Pacala, S., and Houghton, R.: The underpinnings of land-use history: three centuries of global gridded land-use transitions, woodharvest activity, and resulting secondary lands, Glob. Change Biol., 12, 1208–1229, https://doi.org/10.1111/j.1365-2486.2006.01150.x, 2006.
Kay, J. E., Hillman, B. R., Klein, S. A., Zhang, Y., Medeiros, B., Pincus, R., Gettelman, A., Eaton, B., Boyle, J., Marchand, R., and Ackerman, T. P.: Exposing global cloud biases in the Community Atmosphere Model (CAM) using satellite observations and their corresponding instrument simulators, J. Climate, 25, 5190–5207, https://doi.org/10.1175/JCLI-D-11-00469.1, 2012.
Lau, K. M. and Kim, K. M.: Observational relationships between aerosol and Asian monsoon rainfall, and circulation, Geophys. Res. Lett., 33, L21810, https://doi.org/10.1029/2006GL027546, 2006.
Lawrence, D. M., Oleson, K. W., Flanner, M. G., Thornton, P. E., Swenson, S. C., Lawrence, P. J., Zeng, X., Yang, Z., Levis, S., Sakaguchi, K., Bonan, G. B., and Slater, A. G.: Parameterization improvements and functional and structural advances in Version 4 of the Community Land Model, J. Adv. Model. Earth Sy., 3, M03001, https://doi.org/10.1029/2011MS00045, 2011.
Lawrence, P. J. and Chase, T. N.: Representing a new MODIS consistent land surface in the Community Land Model (CLM 3.0), J. Geophys. Res.-Biogeo., 112, G01023, https://doi.org/10.1029/2006JG000168, 2007.
Li, F. and Lawrence, D. M.: Role of fire in the global land water budget during the twentieth century due to changing ecosystems, J. Climate, 30, 1893–1908, https://doi.org/10.1175/JCLI-D-16-0460.1, 2017.
Li, F., Zeng, X. D., and Levis, S.: A process-based fire parameterization of intermediate complexity in a Dynamic Global Vegetation Model, Biogeosciences, 9, 2761–2780, https://doi.org/10.5194/bg-9-2761-2012, 2012.
Li, F., Levis, S., and Ward, D. S.: Quantifying the role of fire in the Earth system – Part 1: Improved global fire modeling in the Community Earth System Model (CESM1), Biogeosciences, 10, 2293–2314, https://doi.org/10.5194/bg-10-2293-2013, 2013.
Li, F., Bond-Lamberty, B., and Levis, S.: Quantifying the role of fire in the Earth system – Part 2: Impact on the net carbon balance of global terrestrial ecosystems for the 20th century, Biogeosciences, 11, 1345–1360, https://doi.org/10.5194/bg-11-1345-2014, 2014.
Mazzacavallo, M. G. and Kulmatiski, A.: Modelling water uptake provides a new perspective on grass and tree coexistence, PLoS ONE, 10, e0144300, https://doi.org/10.1371/journal.pone.0144300, 2015.
Mouillot, F., Narasimha, A., Balkanski, Y., Lamarque, J.-F., and Feld, C. B.: Global carbon emissions from biomass burning in the 20th century, Geophys. Res. Lett., 33, L01801, https://doi.org/10.1029/2005GL024707, 2006.
NCAR (National Center for Atmospheric Research): Community Earth System Model (CESM), available at: http://www.cesm.ucar.edu, last access: 25 January 2019.
Neale, R., Chen, C., Gettelman, A., Lauritzen, P., Park, S., Williamson, D., Conley, A., Garcia, R., Kinnison, D., Lamarque, J., Marsh, D., Mills, M., Smith, A., Tilmes, S., Vitt, F., Morrison, H., Camerson-Smith, P., Collins, W., Iacono, M., Easter, R., Ghan, S., Liu, X., Rasch, P., and Taylor, M.: Description of the NCAR Community Atmosphere Model (CAM5.0), NCAR/TN-486+STR, NCAR, Boulder, Colo., 2012.
Neary, D. G., Ryan, K. C., and DeBano, L. F.: Wildland Fire in Ecosystems, effects of fire on soil and water, General Technical Report RMRS-GTR-42, 4. U.S. Department of Agriculture, Forest Service, Rocky Mountain Research Station, Ogden, UT., 2005.
Nemani, R. R., Running, S. W., Pielke, R. A., and Chase, T. N.: Global vegetation cover changes from coarse resolution satellite data, J. Geophys. Res.-Atmos., 101, 7157–7162, https://doi.org/10.1029/95jd02138, 1996.
Noble, J. C., Smith, A. W., and Leslie, H. W.: Fire in the mallee shrublands of western New South Wales, Rangeland J., 2, 104–114, 1980.
Paudel, R., Mahowald, N. M., Hess, P. G. M., Meng, L., and Riley, W. J.: Attribution of changes in global wetland methane emissions from pre-industrial to present using Attribution of changes in global wetland methane emissions from pre-industrial to present using CLM4.5-BGC, Environ. Res. Lett., 11, 034020, https://doi.org/10.1088/1748-9326/11/3/034020, 2016.
Pechony, O. and Shindell, D. T.: Driving forces of global wildfires over the past millennium and the forthcoming century, P. Natl. Acad. Sci. USA, 107, 19167–19170, https://doi.org/10.1073/pnas.1003669107, 2010.
Pitman, A. J., Narisma, G. T., Pielke, R. A., and Holbrook, N. J.: Impact of land cover change on the climate of southwest Western Australia, J. Geophys. Res.-Atmos., 109, D18109, https://doi.org/10.1029/2003JD004347, 2004.
Prach, K. and Pyšek, P.: Using spontaneous succession for restoration of human-disturbed habitats: Experience from Central Europe, Ecol. Eng., 17, 55–62, https://doi.org/10.1016/S0925-8574(00)00132-4, 2001.
Qiu, L. and Liu, X.: Sensitivity analysis of modelled responses of vegetation dynamics on the Tibetan Plateau to doubled CO2 and associated climate change, Theor. Appl. Climatol., 124, 229–239, https://doi.org/10.1007/s00704-015-1414-1, 2016.
Rabin, S. S., Melton, J. R., Lasslop, G., Bachelet, D., Forrest, M., Hantson, S., Kaplan, J. O., Li, F., Mangeon, S., Ward, D. S., Yue, C., Arora, V. K., Hickler, T., Kloster, S., Knorr, W., Nieradzik, L., Spessa, A., Folberth, G. A., Sheehan, T., Voulgarakis, A., Kelley, D. I., Prentice, I. C., Sitch, S., Harrison, S., and Arneth, A.: The Fire Modeling Intercomparison Project (FireMIP), phase 1: experimental and analytical protocols with detailed model descriptions, Geosci. Model Dev., 10, 1175–1197, https://doi.org/10.5194/gmd-10-1175-2017, 2017.
Ramankutty, N., Evan, A., Monfreda, C., and Foley, J.: Farming the planet: 1. Geographic distribution of global agricultural lands in the year 2000, Global Biogeochem. Cy., 22, GB1003, https://doi.org/10.1029/2007GB002952, 2008.
Rauscher, S. A., Jiang, X., Steiner, A., Williams, A. P., Michael Cai, D., and McDowell, N. G.: Sea surface temperature warming patterns and future vegetation change, J. Climate, 28, 7943–7961, https://doi.org/10.1175/JCLI-D-14-00528.1, 2015.
Rull, V.: A palynological record of a secondary succession after fire in the Gran Sabana, Venezuela, J. Quaternary Sci., 14, 137–152, https://doi.org/10.1002/(SICI)1099-1417(199903)14:2<137::AID-JQS413>3.0.CO;2-3, 1999.
Sankaran, M., Ratnam, J., and Hanan, N. P.: Tree-grass coexstence in savannas revisited – Insights from an examination of assumptions and mechanisms invoked in existing models, Ecol. Lett., 7, 480–490, https://doi.org/10.1111/j.1461-0248.2004.00596.x, 2004.
Scholes, R. J., Ward, D. E., and Justice, C. O.: Emissions of trace gases and aerosol particles due to vegetation burning in southern hemisphere Africa, J. Geophys. Res., 101, 23623–23682, 1996.
Smith, R., Jones, P., Briegbel, B., Bryan. F., Danabasoglu, G., Dennis, J., Dukowicz, J., Eden, C., Fox-Kemper, B., Gent, P., Hecht, M., Jayne, S., Jochum, M., Large, W., Lindsay, K., Maltrud, M., Norton, N., Peacock, S., Vertenstein, M., and Yeager, S.: The Parallel Ocean Program (POP) reference manual: Ocean component of the Community Climate System Model (CCSM), Technical Report LAUR-10-01853, Los Alamos National Laboratory, 2010.
Song, X. and Zeng, X.: Investigation of uncertainties of establishment schemes in dynamic global vegetation models, Adv. Atmos. Sci., 31, 85–94, https://doi.org/10.1007/s00376-013-3031-1, 2014.
Steelman, T. A. and Burke, C. A.: Is wildfire policy in the United States sustainable?, J. Forest., 33, 67–72, https://doi.org/10.2139/ssrn.1931057, 2007.
Still, C. J., Berry, J. A., Collatz, G. J., and DeFries, R. S.: Global distribution of C3 and C4 vegetation: Carbon cycle implications, Global Biogeochem. Cy., 17, 6-1-6–14, https://doi.org/10.1029/2001GB001807, 2003.
Swezy, D. M. and Agee, J. K.: Prescribed-fire effects on fine-root and tree mortality in old-growth ponderosa pine, Can. J. Forest Res., 21, 626–634, https://doi.org/10.1139/x91-086, 1991.
Tarasova, T. A., Nobre, C. A., Holben, B. N., Eck, T. F., and Setzer, A.: Assessment of smoke aerosol impact on surface solar irradiance measured in the Rondônia region of Brazil during Smoke, Clouds, and Radiation – Brazil, J. Geophys. Res.-Atmos., 104, 19161–19170, https://doi.org/10.1029/1999JD900258, 1999.
Townsend, S. and Douglas, M. M.: The effect of three fire regimes on stream water quality, water yield and export coefficients in a tropical savanna (Northern Australia), J. Hydrol., 229, 118–137, 2000.
van der Werf, G. R., Randerson, J. T., Giglio, L., Collatz, G. J., Mu, M., Kasibhatla, P. S., Morton, D. C., DeFries, R. S., Jin, Y., and van Leeuwen, T. T.: Global fire emissions and the contribution of deforestation, savanna, forest, agricultural, and peat fires (1997–2009), Atmos. Chem. Phys., 10, 11707–11735, https://doi.org/10.5194/acp-10-11707-2010, 2010.
van der Werf, G. R., Randerson, J. T., Giglio, L., van Leeuwen, T. T., Chen, Y., Rogers, B. M., Mu, M., van Marle, M. J. E., Morton, D. C., Collatz, G. J., Yokelson, R. J., and Kasibhatla, P. S.: Global fire emissions estimates during 1997–2016, Earth Syst. Sci. Data, 9, 697–720, https://doi.org/10.5194/essd-9-697-2017, 2017.
Vilà, M., Lloret, F., Ogheri, E., and Terradas, J.: Positive fire-grass feedback in Mediterranean Basin woodlands, Forest Ecol. Manag., 147, 3–14, 2001.
Vitousek, P. M., Mooney, H. A., Lubchenco, J., and Melillo, J. M.: Human Domination of Earth' s Ecosystems, Science, 277, 494–499, https://doi.org/10.1126/science.277.5325.494, 1997.
Wang, G., Yu, M., Pal, J. S., Mei, R., Bonan, G. B., Levis, S., and Thornton, P. E.: On the development of a coupled regional climate–vegetation model RCM–CLM–CN–DV and its validation in Tropical Africa, Clim. Dynam., 46, 515–539, https://doi.org/10.1007/s00382-015-2596-z, 2016.
Wardle, D., Olle, Z., Greger, H., and Gallet, C.: The Influence of Island Area on Ecosystem Properties The Influence of Island Area on Ecosystem Properties, Science, 277, 1296–1300, https://doi.org/10.1126/science.277.5330.1296, 1997.
Worley, P. H., Mirin, A. A., Craig, A. P., Taylor, M. A., Dennis, J. M., and Vertenstein, M.: Performance of the community earth system model, in: High Performance Computing, Networking, Storage and Analysis (SC), 2011 International Conference, Seattle, WA, 2011.
Yue, C., Ciais, P., Cadule, P., Thonicke, K., and van Leeuwen, T. T.: Modelling the role of fires in the terrestrial carbon balance by incorporating SPITFIRE into the global vegetation model ORCHIDEE – Part 2: Carbon emissions and the role of fires in the global carbon balance, Geosci. Model Dev., 8, 1321–1338, https://doi.org/10.5194/gmd-8-1321-2015, 2015.
Zeng, X.: Evaluating the dependence of vegetation on climate in an improved dynamic global vegetation model, Adv. Atmos. Sci., 27, 977–991, 2010.
Zeng, X., Zeng, X., and Barlage, M.: Growing temperate shrubs over arid and semiarid regions in the Community Land Model-Dynamic Global Vegetation Model, Global Biogeochem. Cy., 22, GB3003, https://doi.org/10.1029/2007GB003014, 2008.
Zhang, L., Mao, J., Shi, X., Ricciuto, D., He, H., Thornton, P., Yu, G., Li, P., Liu, M., Ren, X., Han, S., Li, Y., Yan, J., Hao, Y., and Wang, H.: Evaluation of the Community Land Model simulated carbon and water fluxes against observations over ChinaFLUX sites, Agr. Forest Meteorol., 226–227, 174–185, https://doi.org/10.1016/j.agrformet.2016.05.018, 2016.