the Creative Commons Attribution 4.0 License.
the Creative Commons Attribution 4.0 License.
 | 15 Jul 2019
Modelling northern peatland area and carbon dynamics since the Holocene with the ORCHIDEE-PEAT land surface model (SVN r5488)
Dan Zhu
Philippe Ciais
Bertrand Guenet
Shushi Peng
Gerhard Krinner
Ardalan Tootchi
Agnès Ducharne
Adam Hastie
The importance of northern peatlands in the global carbon cycle has been recognized, especially for long-term changes. Yet, the complex interactions between climate and peatland hydrology, carbon storage, and area dynamics make it challenging to represent these systems in land surface models. This study describes how peatlands are included as an independent sub-grid hydrological soil unit (HSU) in the ORCHIDEE-MICT land surface model. The peatland soil column in this tile is characterized by multilayered vertical water and carbon transport and peat-specific hydrological properties. The cost-efficient version of TOPMODEL and the scheme of peatland initiation and development from the DYPTOP model are implemented and adjusted to simulate spatial and temporal dynamics of peatland. The model is tested across a range of northern peatland sites and for gridded simulations over the Northern Hemisphere (>30∘ N). Simulated northern peatland area (3.9 million km2), peat carbon stock (463 Pg C), and peat depth are generally consistent with observed estimates of peatland area (3.4–4.0 million km2), peat carbon (270–540 Pg C), and data compilations of peat core depths. Our results show that both net primary production (NPP) and heterotrophic respiration (HR) of northern peatlands increased over the past century in response to CO2 and climate change. NPP increased more rapidly than HR, and thus net ecosystem production (NEP) exhibited a positive trend, contributing a cumulative carbon storage of 11.13 Pg C since 1901, most of it being realized after the 1950s.
- Article
(4207 KB) - Full-text XML
-
Supplement
(3372 KB) - BibTeX
- EndNote


Northern peatland carbon (C) stock is estimated between 270 and 540 Pg C across an area of 3.4–4 million km2 (Gorham, 1991; Turunen et al., 2002; Yu et al., 2010), amounting to approximately one-fourth of the global soil C pool (2000–2700 Pg C) and one-half of the current atmospheric C pool (828 Pg C) (Ciais et al., 2013; Jackson et al., 2017). Due to waterlogged, acidic, and low-temperature conditions, plant litter production exceeds decomposition in northern peatlands. More than half of northern peat carbon was accumulated before 7000 years ago during the Holocene (Yu, 2012). While being one of the most effective ecosystems at sequestering CO2 from the atmosphere over the long term, northern peatlands are one of the largest natural sources of methane (CH4), playing a pivotal role in the global greenhouse gas balance (MacDonald et al., 2006; Mikaloff Fletcher et al., 2004; Smith, 2004).
The carbon balance of peatlands is sensitive to climate variability and climate change (Chu et al., 2015; Lund et al., 2012; Yu et al., 2003a). Projected climate warming and precipitation changes press us to understand the mechanisms of peat growth and stability and further to assess the fate of the substantial amount of carbon stored in peatlands and its potential feedbacks on the climate. Several land surface models (LSMs) have included representations of the biogeochemical and physical processes of peatlands to simulate the observed past extent and carbon balance of peatlands and predict their responses to future climate change (Chaudhary et al., 2017a, b; Frolking et al., 2010; Kleinen et al., 2012; Spahni et al., 2013; Stocker et al., 2014; Wania et al., 2009a, b; Wu et al., 2016). Water table is one of the most important factors controlling the accumulation of peat because it limits oxygen supply to the saturated zone and reduces decomposition rates of buried organic matter (Kleinen et al., 2012; Spahni et al., 2013). It is highlighted by observed and experimental findings that variations in ecosystem respiration (ER) depend on water table depth (Aurela et al., 2007; Flanagan and Syed, 2011). However, some studies showed that changes in soil water content could be very small while the water table was lowering; the drawdown of the water table caused only small changes in soil air-filled porosity and hence exerted no significant effect on ER (Lafleur et al., 2005; Parmentier et al., 2009; Sulman et al., 2009). Therefore, while studying the interactions between peatland water and carbon balances, the dynamics of soil moisture deserve special attention.
The two-layered (acrotelm–catotelm) conceptual framework was chosen by many Earth system models (ESMs) to describe peatland structures. The peat profile was divided into an upper layer with a fluctuating water table (acrotelm) and a lower, permanently saturated layer (catotelm) – using depth in relation to a drought water table or a constant value (a widely used depth is 0.3 m below the soil surface) as the discrete boundary of these two layers (Kleinen et al., 2012; Spahni et al., 2013; Wania et al., 2009a). This diplotelmic model assumes that all threshold changes in peatland soil ecological, hydrological, and biogeochemical processes occur at the same depth, causing the lack of generality and flexibility in the model, and thus possibly hindering the representation of the horizontal and vertical heterogeneity of peatlands (Fan et al., 2014; Morris et al., 2011).
To our knowledge, only two models attempted to simulate peatland area dynamics for large-scale gridded applications (Kleinen et al., 2012; Stocker et al., 2014). Kleinen et al. (2012) modelled wetland extent and peat accumulation in boreal and arctic peatlands over the past 8000 years using the LPJ model. In their study, simulated summer mean, maximum and minimum wetland extent by TOPMODEL are used as surrogates for peatland area, from the assumption that peatland will only initiate and grow in frequently inundated areas. Stocker et al. (2014) extended the scope of Kleinen et al. (2012) in the DYPTOP model. In their model, soil water storage and retention were enhanced and runoff was reduced by accounting for peatland-specific hydraulic properties. A positive feedback on the local water balance and on peatland expansion was therefore exerted by the peatland water table and peatland area fraction within a grid cell. Areas that are suitable for peatland development were distinguished from wetland extent according to temporal persistency of inundation, water balance, and peatland C balance. While both studies made pioneering progress in the modelling of peatland ecosystems, they adopted a simple bucket approach to model peatland hydrology and peatland C accumulation, and neither of them resolved the diel cycle of surface energy budget.
To tackle these above-mentioned discrepancies and estimate the C dynamic as well as the peat area, we used the ORCHIDEE-MICT land surface model incorporating peatland as a sub-grid hydrological soil unit (HSU). The vertical water fluxes and dynamic carbon profiles in peatlands are simulated with a multilayer scheme instead of a bucket model or a diplotelmic model (Sect. 2.1). Peatland extent is modelled following the approach of DYPTOP (Stocker et al., 2014) but with some adaptions and improvements (Sect. 2.2). The aim of this study is to model the spatial extent of northern peatlands since the Holocene and to reproduce peat carbon accumulation over the Holocene.
ORCHIDEE-MICT is an updated version of the ORCHIDEE land surface model with an improved and evaluated representation of high-latitude processes. Soil water freezing and melting, and subsequent changes in thermal and hydrological properties, as well as latent heat release and consumption involved in the freeze–thaw processes are all simulated by this model (Guimberteau et al., 2018). The model simulates a more rapid thermal signal propagation and a reduction in soil water infiltration and movement in frozen soil (Gouttevin et al., 2012). The model calculates the active layer thickness (ALT) from simulated soil temperatures and adjusts root distribution and soil carbon inputs relative to the ALT to represent impacts of permafrost physics on plant water availability and soil carbon profiles. It is worth mentioning that the model resolves one energy budget for all soil tiles in one grid cell, but soil thermal properties of a specific grid cell are defined as the weighted average of mineral soil and pure organic soil in that grid, with C content of the grid cell derived from the soil organic C map from NCSCD (Hugelius et al., 2013) for permafrost regions and from HWSD (FAO, 2012) for non-permafrost regions (Guimberteau et al., 2018). This makes it possible to include the impacts of peat carbon on the grid cell soil thermodynamics.
Based on ORCHIDEE-MICT, ORCHIDEE-PEAT is specifically developed to dynamically simulate northern peatland extent and peat accumulation. ORCHIDEE-PEAT version 1 was evaluated and calibrated against eddy-covariance measurements of CO2 and energy fluxes, water table depth, and soil temperature from 30 northern peatland sites (Qiu et al., 2018). Parameterizations of peatland vegetation and water dynamics are unchanged from ORCHIDEE-PEAT version 1: vegetation growing in peatlands is represented by one C3 grass plant functional type (PFT) with shallow roots (see dedicated Sect. 2.2.1 of Qiu et al., 2018, for additional discussion on peatland PFT); surface runoff of non-peatland areas in the grid cell is routed into peatland; vertical water fluxes in peatland HSU are modelled with peat-specific hydraulics (Text S1 in the Supplement). The large porosity (0.9 m3 m−3) and the large saturated water conductivity (2120 mm d−1) of the peatland HSU, as well as the addition of an above-surface water reservoir, reduce runoff and increase soil water storage and retention (Qiu et al., 2018). Therefore, the occurrence and expansion of peatland increase the grid cell mean water table and enhance inundation.
In ORCHIDEE-PEAT, the hydrology of peatland is resolved by an 11-layer physically based diffusion scheme (Qiu et al., 2018). Compared to the two-layer bucket approach, this multilayer diffusion scheme allowed a more realistic representation of surface water fluxes and showed better performance at simulating soil water storage and soil water storage variations (Guimberteau et al., 2014; De Rosnay et al., 2002). Here, we improve peatland C dynamics by replacing the diplotelmic peatland C model in ORCHIDEE-PEAT version 1 with a multilayered one. The 32-layered thermal and C models in the standard ORCHIDEE-MICT are used to simulate peatland C accumulation and decomposition (Sect. 2.1). With fine resolution in the soil surface (10 layers for the top 1 m), this 32-layer model better represents the effects of soil temperature, soil freezing, and soil moisture on carbon decomposition continuously within the peat profile than a diplotelmic model. Furthermore, the approach proposed by Stocker et al. (2014) is incorporated into the model to simulate dynamics of peatland area (Sect. 2.2). This model simulating the dynamics of peatland extent and the vertical buildup of peat is hereinafter referred to as ORCHIDEE-PEAT v2.0.
2.1 Modelling peat accumulation and decomposition
The model has two litter C pools (metabolic and structural) and three soil C pools (active, slow, and passive); all pools are vertically discretized into 32 layers, with exponentially coarser vertical resolution as depth increases and a total depth of 38 m. Decomposition of the C in each pool and the C fluxes between the pools are calculated at each layer, with each pool having a distinct residence time. A detailed description of the litter and soil C pools and carbon flows between them can be found in the Supplement Text S2.
2.1.1 Peat carbon decomposition
Decomposition of peat soil C is calculated at each layer, controlled by base decomposition rates of different pools modified by soil temperature, moisture, and depth:
where ki,l is the decomposition rate of pool i at layer l, k0,i is the base decomposition rate of pool i, fT,l is the temperature modifier at layer l, fM,l is the moisture modifier, and fZ,l is a depth modifier that further reduces decomposition at depth. For unfrozen soils, the temperature modifier is an exponential function of soil temperature, while below 0∘ when liquid water enabling decomposition disappears, respiration linearly drops to zero at −1∘ (Koven et al., 2011). The soil moisture modifier is prescribed from the meta-analysis of soil volumetric water content (m3 m−3) and respiration relationship for organic soils conducted by Moyano et al. (2012). See Supplement Text S3 for a more detailed description of the temperature and moisture modifier.
Following Koven et al. (2013), we implement a depth modifier (fZ,l) to represent unresolved depth controls (i.e. priming effects, sorption of organic molecules to mineral surfaces) on C decomposition. This depth modifier decreases exponentially with depth:
where zl (m) is the depth of the layer l, and z0 (m) is the e-folding depth of base decomposition rate.
2.1.2 Vertical buildup of peat
Waterlogging and cold temperatures in northern peatland regions prevent complete decomposition of dead plant material, causing an imbalance between litter production and decay (Parish et al., 2008). The un-decomposed plant residue accumulates as peat, and consequently the peat surface shows an upward growth. Instead of modelling this upward accumulation of peat, we simulate a downward movement of C by adapting the method that Jafarov and Schaefer (2016) used to build up a dynamic surface organic layer.
We first calculate the empirical carbon content at each model layer (Cobs,l) according to measured data from 102 peat cores from 73 sites (Lewis et al., 2012; Loisel et al., 2014; McCarter and Price, 2013; Price et al., 2005; Tfaily et al., 2014; Turunen et al., 2001; Zaccone et al., 2011). Cobs,l is calculated as
where BDl (kg m−3) is the soil bulk density at model layer l, which is the median observed bulk density after compiling all bulk density measurements into model depth bins (Fig. S1a). αc,l is the mass fraction of carbon in the soil (% weight) for the layer, derived from a regression of measured carbon fraction on measured bulk density from 39 cores from 29 sites (Fig. S1b). ΔZl (m) is the thickness of the layer.
We then model the vertical downward movement of C between soil layers to mimic the aggradation of carbon in the peat as follows. If carbon in layer l (Cl) exceeds a threshold amount (Cth,l), a prescribed fraction (f) of the carbon is moved to the layer below (l+1). Here, the carbon flux from layer l to the layer below (l+1) is calculated as
where Cl (kg m−2) is the carbon content of layer l. The threshold amount of carbon of layer l (Cth,l) is a prescribed fraction (fth) of the empirically determined Cobs,l:
The values of model parameters f and fth do not change with soil depth.
Finally, the total peat depth is defined as the depth to which carbon can be transferred:
where k is the deepest soil layer where carbon content is greater than 0, Ck (kg m−2) is the carbon content of layer k, Cobs,k (kg m−2) is the empirical amount of carbon that layer k can hold, and ΔZk (m) is the thickness of layer k.
2.2 Simulating dynamic peatland area extent
In grid-based simulations, each grid cell is characterized by fractional coverages of PFTs. The dynamic coverage of each non-peatland PFT is determined by the dynamic global vegetation model (DGVM) equations as functions of bioclimatic limitations, sapling establishment, light competition, and natural plant mortality (Krinner et al., 2005; Zhu et al., 2015). Here, a cost-efficient TOPMODEL from the DYPTOP model (Stocker et al., 2014) is incorporated and calibrated for each grid cell by present-day wetland areas that are regularly inundated or subject to shallow water tables to simulate wetland extent (Sect. 2.2.1). Then, the criteria for peatland expansion are adapted from DYPTOP to distinguish peatland from wetland (Sect. 2.2.2).
2.2.1 The cost-efficient TOPMODEL
Concepts of TOPMODEL (Beven and Kirkby, 1979) have been proven to be effective at outlining wetland areas in current state-of-the-art LSMs (Kleinen et al., 2012; Ringeval et al., 2012; Stocker et al., 2014; Zhang et al., 2016). Based on TOPMODEL, sub-grid-scale topography information and soil properties of a given watershed/grid cell are used to redistribute the mean water table depth to delineate the extent of sub-grid area at maximum soil water content. The empirical relationship between the flooded fraction of a grid cell and the grid cell mean water table position () can be established (Fig. 1a) and approximated by an asymmetric sigmoid function, which is more computationally efficient than determining water table depth for each sub-grid pixel (Stocker et al., 2014). Here, we adopted the cost-efficient TOPMODEL from Stocker et al. (2014) and calibrated TOPMODEL parameters for each grid cell to match the spatial distribution of northern wetlands (see more details in Text S4). Tootchi et al. (2019) reconciled multiple current wetland datasets and generated several high-resolution composite wetland (CW) maps. The one used here (CW-WTD) was derived by combining regularly flooded wetlands (RFWs), which is obtained by overlapping three open-water and inundation datasets (ESA-CCI; Herold et al. 2015; GIEMS-D15, Fluet-Chouinard et al., 2015; and JRC, Fluet-Chouinard et al., 2015), with areas that have shallow (WT≤20 cm) water tables from groundwater modelling of Fan et al. (2013). CW-WTD wetlands are static and aim at representing the climatological maximum extent of active wetlands and inundation. We therefore compare simulated maximum monthly mean wetland extent over 1980–2015 with CW-WTD to calibrate TOPMODEL parameters. Note that lakes from the HydroLAKES database have been excluded from the CW-WTD map because of their distinct hydrology and ecology compared with wetlands (Tootchi et al., 2019).

Figure 1Information flow of dynamic peatland area module in ORCHIDEE-PEAT v2.0. Num is a grid-cell-specific parameter, and SWB and Clim are globally uniform parameters (Sect. 2.2).
2.2.2 Peatland development criteria
The criteria used to constrain peatland area development are greatly inspired by DYPTOP (Stocker et al., 2014), but with some adaptions.
The initiation of peatland only depends on moisture conditions of the grid cell (Fig. 1b, nos. 1–3). First, only the sub-grid-cell area fraction that is frequently inundated has the potential to become peatland (fpot). Stocker et al. (2014) introduced a “flooding persistency” parameter (N in Eq. 13 in Stocker et al., 2014) for the DYPTOP model to represent the temporal frequency of inundation. N is a globally uniform parameter in DYPTOP, set to 18 months during the preceding 31 years. However, the formation of peat is a function of local climate, and thus suitable formation conditions for peatland vary between geographic regions. To be specific, the accumulation of peat in arctic and northern latitudes is due to both high water table and low temperature, while it is mainly a result of waterlogging conditions in subtropical and tropical latitudes (Parish et al., 2008). Therefore, it is essential to apply different values for the flooding persistency parameter for different regions, according to local climate conditions. We redefined the requirement of persistent flooding for peatland formation as follows: the area fraction that has the potential to become peatland needs to be flooded at least Num months during the preceding 30 years, with Num being the total number of growing season months (monthly air temperature >5 ∘C) in 30 years (Fig. 1b, no. 5). In this case, with the help of relatively low air temperature making shorter growing seasons, arctic and boreal latitudes need shorter inundation periods than subtropical and tropical regions to form peatland. Furthermore, as Sphagnum-dominated peatlands are sensitive to summer moisture conditions (Alexandrov et al., 2016; Gignac et al., 2000), the summer water balance of the grid cell needs to pass a specific threshold (SWB) to form peat and to achieve the potential peatland area (Fig. 1b, no. 7). The summer water balance is calculated as the difference between total precipitation (P) and total potential evapotranspiration (PET) of May–September. We consider SWB as a tunable parameter in the model and run simulations with SWB = −6, 0, 3, and 6 cm. SWB = 6 cm is selected so that the model captures the southern frontier of peatland in Eurasia and western North America (Text S5). Note that the definitions of summer (May–September) and SWB are not applicable for tropical regions and the Southern Hemisphere.
After the initiation, the development of peatland area is controlled by both moisture conditions of the grid cell and the long-term carbon balance of the peatland HSU (Fig. 1c, nos. 9–17). If the climate becomes drier and the calculated potential peatland area is smaller than the current peatland area, the peatland HSU area will contract to the new potential peatland area fraction (Fig. 1c, no. 12). Otherwise (Fig. 1c, no. 13), the peatland has the possibility to expand when the summer water balance threshold is passed. If these criteria are satisfied, the final decision depends on the carbon density of the peatland (Cpeat): the peatland can expand only when long-term input exceeds decay and a certain amount of C (Clim) has accumulated (Fig. 1c, no. 17). Clim is defined here as a long-term peatland C balance condition, it is a product of a mean measured peat depth (1.07 m) from 40 peat cores (with peat age greater than 1.8 ka but smaller than 2.2 ka) from North American peatland (Gorham et al., 2007, 2012) and from the West Siberian lowlands (Kremenetski et al., 2003), with a dry bulk density assumption of 100.0 kg m−3 and a mean C fraction of 47 % in total peat (Loisel et al., 2014). Our estimation for Clim is 50.3 kg C m−2, which matches well with the C density criterion (50 kg C m−2) chosen by Stocker et al. (2014) to represent typical peatland soil.
The moisture conditions are evaluated every month throughout the simulation, while Cpeat is checked only in the first month after the SubC in Spin-up1 and is checked every month in Spin-up2 and the transient simulation (see Sect. 3.2). The peatland area fraction (fpeat) is updated every month. During the simulation, the contracted area and C are allocated to an “old peat” pool and are kept track of by the model. It should be noted that drainage (drought) may cause a decrease in porosity and saturated moisture content of peat soils (Oleszczuk and Truba, 2013) and changes in peatland vegetation compositions (Benavides, 2014). But the current model structure does not allow us to take these potential changes in peatland into consideration. Therefore, parameterizations of the old peat pool are identical to mineral soils, following the study of Stocker et al. (2014). When peatland expansion happens, the peatland will first expand into this old peat area and inherit its stored C (Stocker et al., 2014).
The difference between our model and the DYPTOP model in simulating peatland area dynamics can be summarized as follows. (1) For the TOPMODEL calibration, TOPMODEL parameters are globally uniform in the DYPTOP model, but grid-cell-specific in ORCHIDEE-PEAT v2.0. (2) For criteria for peatland expansion, in DYPTOP, the flooding persistency parameter is globally uniform, being 18 months in the preceding 31 years. And the ecosystem water balance is expressed as annual precipitation over actual evapotranspiration (POAET). In ORCHIDEE-PEAT v2.0, the flooding persistency parameter is grid-cell-specific, being the total number of growing season months in the preceding 30 years. And peatland expansion is limited only by summer water balance. The relative areal change in peatland is limited to 1 % per year in DYPTOP, but not limited in our model. (3) For peatland initiation, DYPTOP prescribes a very small peatland area fraction (0.001 %) in each grid cell to simulate peatland C balance condition. Peatland can expand from this “seed” once water and carbon balance criteria are met. In ORCHIDEE-PEAT v2.0, no seed is needed because only the flooding persistency and summer water balance criteria need to be met for the first initiation of peatland (Fig. 1b); carbon balance is only checked after initiation (Fig. 1c).
3.1 Critical model parameters
The base decomposition rates of active, slow, and passive peat soil carbon pools in the model are 1.0, 0.027, and 0.0006 a−1 at a reference temperature of 30 ∘C, respectively (Table 1, Sect. 5: Choice of model parameters). The e-folding depth of the depth modifier (z0, Eq. 2) determines the general shape of increases in soil C turnover time with depth; the prescribed threshold to allow downward C transfer between soil layers (fth, Eq. 5) and the prescribed fraction of C to be transferred (f, Eq. 4) determine movement and subsequent distribution of soil C along the soil profile. We compare simulated C vertical profiles with observed C profiles at 15 northern peatland sites (Table S1) (Loisel et al., 2014) using different combinations of parameters (, , and ) and eventually selected z0=1.5 m, fth=0.7, and f=0.1 based on visual examinations to match the observed C content. Model sensitivity to the selection will be discussed in Sect. 5.

3.2 Simulation protocol
We conduct both site-level and regional simulations with ORCHIDEE-PEAT v2.0 at spatial resolution. Regional simulations are performed for the Northern Hemisphere (>30∘ N), while site-level simulations are performed for 60 grid cells containing at least one peat core (Table S1, Fig. S2). Peat cores used in site-level simulations are from the Holocene Perspective on Peatland Biogeochemistry (HPPB) database (Loisel et al., 2014). Both site-level and regional simulations are forced by the 6-hourly meteorological forcing from the CRUNCEP v8 dataset, which is a combination of the CRU TS monthly climate dataset and NCEP reanalysis (ftp://nacp.ornl.gov/synthesis/2009/frescati/temp/land_use_change/original/readme.htm, last access: 10 July 2019).
All simulations start with a two-step spin-up followed by a transient simulation after the pre-industrial period (Fig. S3). The first spin-up (Spin-up1) includes N cycles of a peat carbon accumulation acceleration procedure consisting of (1) 30 years with the full ORCHIDEE-PEAT (FullO) run on a 30 min time step followed by (2) a stand-alone soil carbon sub-model (SubC) run to simulate the soil carbon dynamics in a cost-effective way on monthly steps (fixed monthly litter input, soil water, and soil thermal conditions from the preceding FullO simulation). Repeated 1961–1990 climate forcing is used in Spin-up1 to approximate the higher Holocene temperatures relative to the pre-industrial period (Marcott et al., 2013). The atmospheric CO2 concentration is fixed at the pre-industrial level (286 ppm). Each time we run the SubC for 2000 years in the first N−1 sets of acceleration procedures, and the value of N and the time length of the last set of acceleration procedures (X) are defined according to the age of the peat core in site-level simulations, and are defined according to the reconstructed glacial retreat in regional simulations (Figs. S4, S5). The reconstructed glacial retreat used in this study is from Dyke (2004) for North America and from Hughes et al. (2016) for Eurasia (Text S6).
In the second spin-up step (Spin-up2), the full ORCHIDEE-PEAT model was run for 100 years, forced by looped 1901–1920 climate forcing and pre-industrial atmospheric CO2 concentration so that physical and carbon fluxes can approach the pre-industrial equilibrium. After the two spin-ups, a transient simulation is run, forced by historical climate forcing from CRUNCEP and rising atmospheric CO2 concentration. For site-level simulations, the transient period starts from 1860 and ends at the year of coring (Table S1). For regional simulations, the transient period starts from 1860 and ends at 2009.
3.3 Evaluation datasets
3.3.1 Evaluation datasets for site-level simulations
All peatland sites used in this study are from the HPPB database (Loisel et al., 2014). All the peat cores measured peat ages and depths (60 sites, Table S1), and are hence used to evaluate simulated peat depth, with sites being grouped into different peatland types, climate zones, and ages. For peat cores where peat ages, depths, fraction of C, and bulk density were recorded (15 sites marked in red in Table S1), we construct vertical C profiles with this measured information to compare with our simulated C profiles.
3.3.2 Northern peatland evaluation datasets for regional simulations
Area
Simulated peatland area in 2009 is evaluated against the (1) World Inventory of Soil Emission potentials (WISE) database (Batjes, 2016); (2) an improved global peatland map (PEATMAP) by reviewing a wide variety of global-, regional-, and local-scale peatland distribution information (Xu et al., 2018); (3) International Mire Conservation Group Global Peatland Database (IMCG GPD) (Joosten, 2010); and the (4) peatland distribution map by Yu et al. (2010).
Soil organic carbon stocks
Simulated peatland soil organic carbon (SOC) is evaluated against (1) the WISE database (Batjes, 2016) and (2) the IMCG GPD (Joosten, 2010).
All the above-mentioned datasets used to evaluate ORCHIDEE-PEAT v2.0 at a regional scale are described in the Supplement Text S7.
Peat depth
Gorham et al. (2007, 2012) and Kremenetski et al. (2003) collected depth and age of 1685 and 130 peat cores, respectively, from literature data on peatlands in North America (NA) and in the West Siberian lowlands (WSL). These compilations make it possible for us to validate peat depths simulated by ORCHIDEE-PEAT v2.0 at regional scales, in addition to the detailed site runs in Sect. 3.3.1. Compared to the HPPB database, these datasets lack detailed peat properties (i.e. C content, peatland type), but contain more samples and cover larger areas. Note that as this study aims to reproduce development of northern peatlands since the Holocene, peat cores that are older than 12 ka are removed from the model evaluation. Finally, 1521 out of 1685 observed peat cores in NA and 127 out of 130 observed peat cores in WSL are used in model evaluation (Sect. 4.2: Peat depth).
4.1 Site simulation
We first evaluate the performance of ORCHIDEE-PEAT v2.0 in reproducing peat depths and vertical C profiles at the 60 sites from HPPB (Table S1). Out of the 60 grid cells (each grid cell corresponding to one peat core), ORCHIDEE-PEAT v2.0 produces peatlands in 57 of them. The establishment of peatlands at Zoige, Altay, and IN-BG-1 (Table S1) is prevented in the model by the summer water balance criterion of these grid cells. Peat depths are underestimated for most sites (Fig. 2). Simulated depth of these 57 sites ranges from 0.37 to 6.64 m and shows a median depth of 2.18 m, while measured peat depth ranges from 0.96 to 10.95 m, with the measured median depth being 3.10 m (Table 2). The root-mean-square error (RMSE) between observations and simulations is 2.45 m.
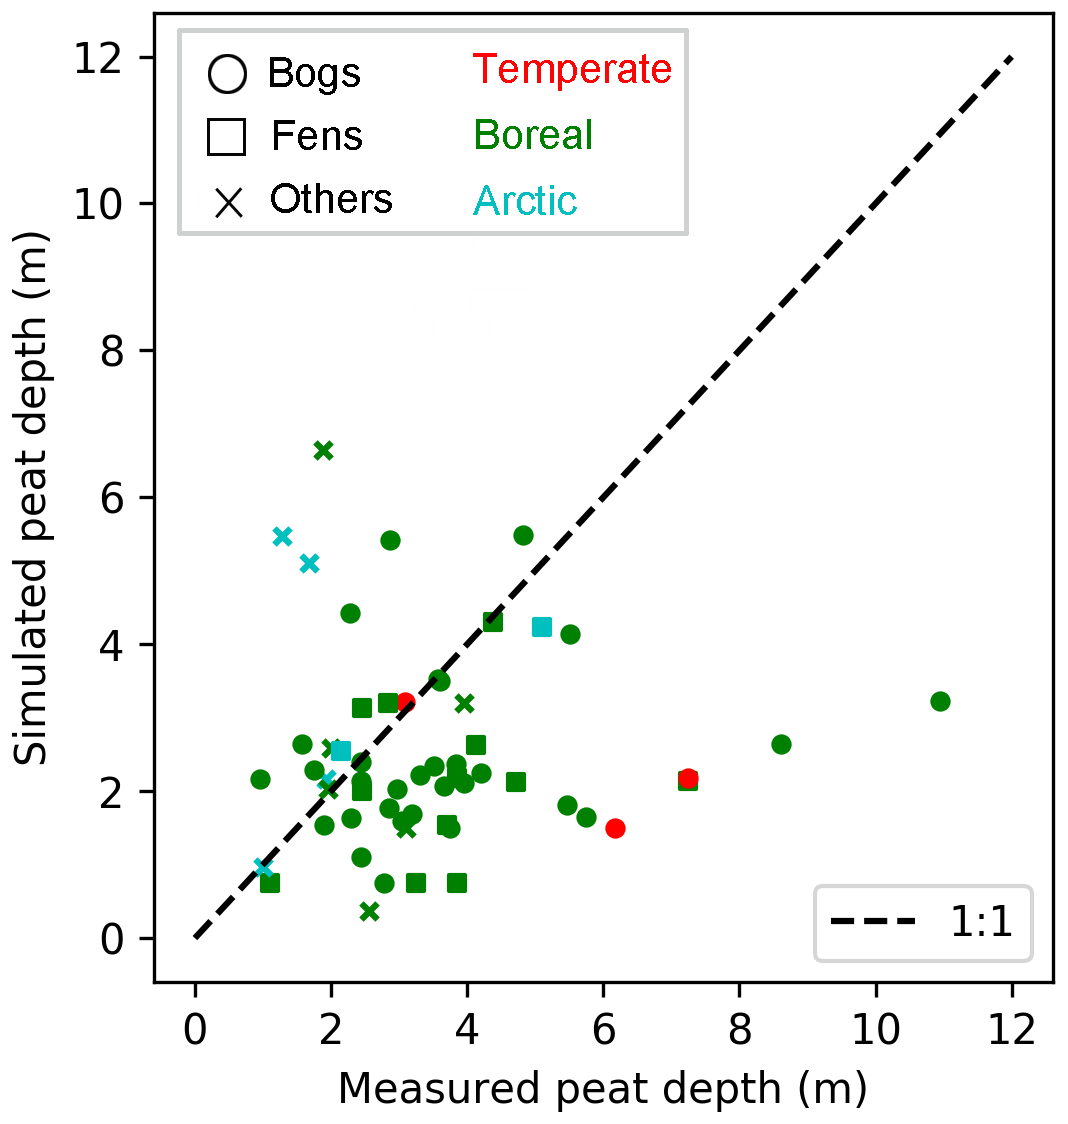
Figure 2Measured and simulated peat depth at 60 peatland sites (Table S1). Shapes of markers indicate peatland types (bogs, fens, others); colours of markers imply climatic zones (temperate, boreal, arctic) of site locations.
Table 2Measured and simulated minimum, maximum, and median depth (m) of peat cores, grouped by peatland types, ages, and climatic regions. The root-mean-square errors between observations and simulations are also listed.

The measured and simulated median peat depths for the 14 fen sites are 3.78 and 2.16 m, compared to 3.30 and 2.18 m, respectively, for the 33 bog sites (Table 2). The model shows slightly higher accuracy for fens than for bogs, with the RMSE for fens being 2.08 and 2.59 m for bogs. RMSEs for peat depths of sites that are older than 8 ka are greater than those of younger sites, but are smaller than the measured mean depth (3.5 m) of all peat cores. Simulated median depth of the six arctic sites is larger than observations, but that of the 47 boreal sites and the four temperate sites is smaller than observations (Table 2). The RMSE for temperate sites is larger than that for arctic or boreal sites.
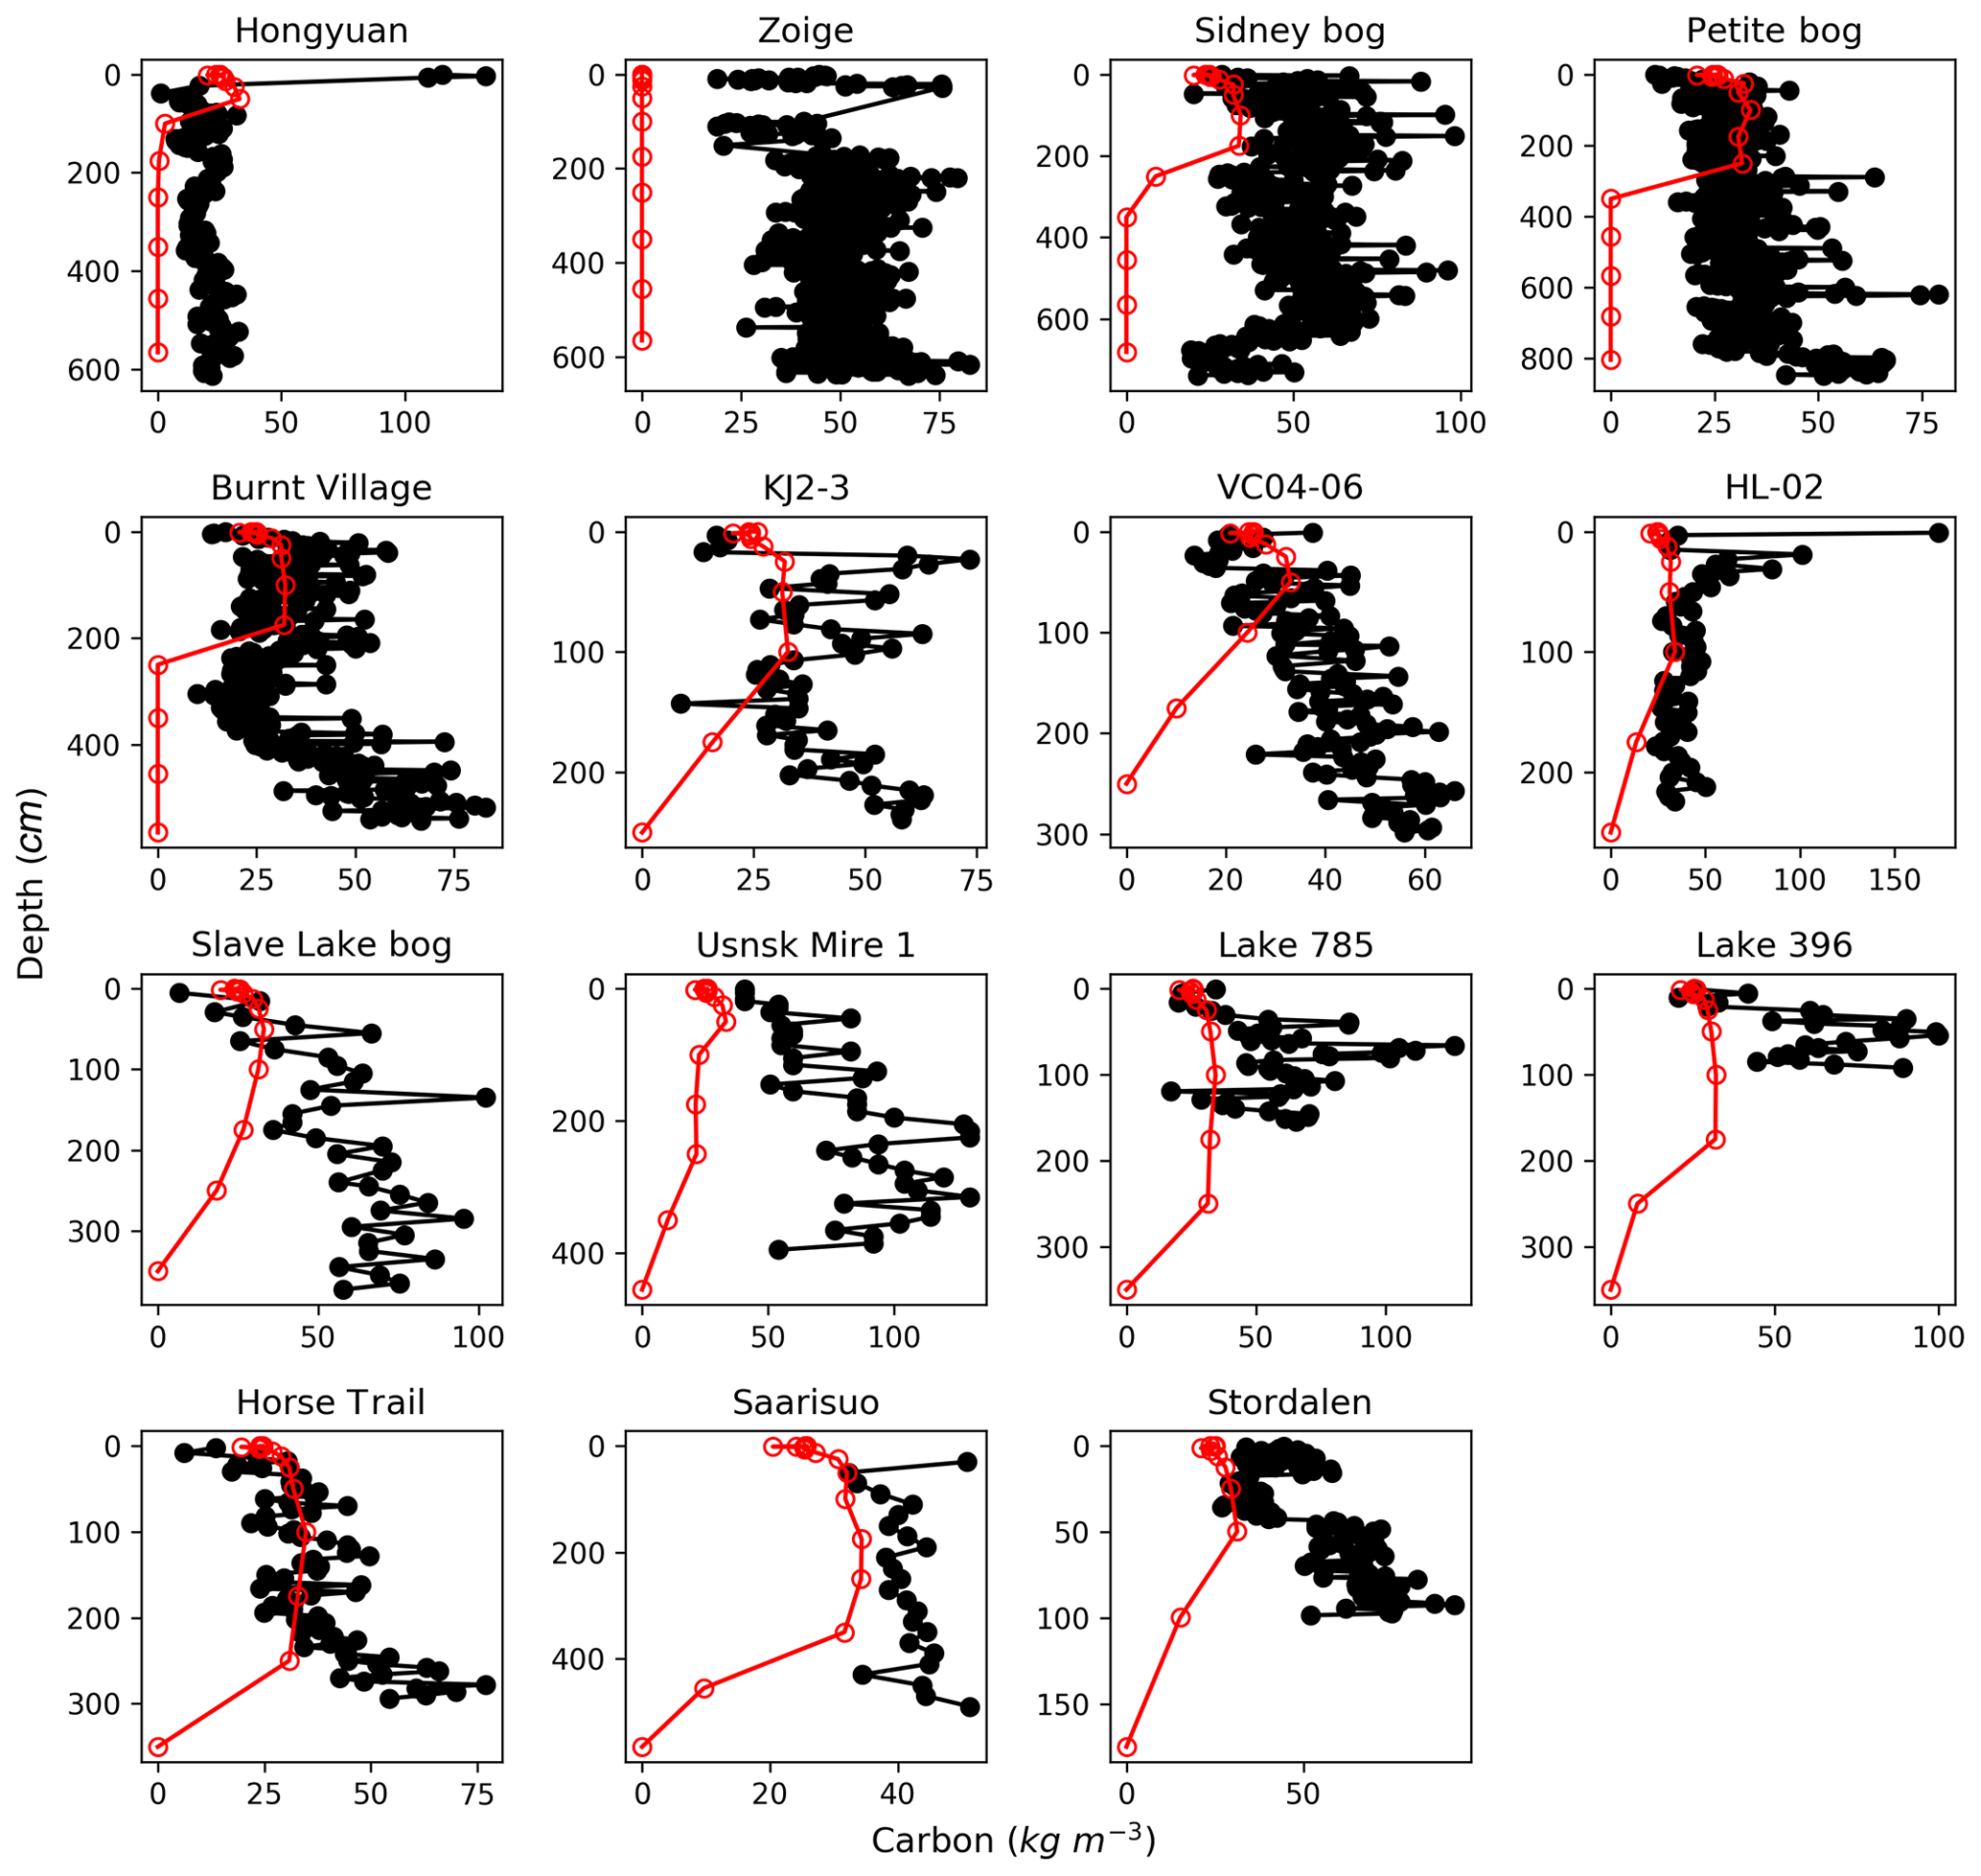
Figure 3Observed (black) and simulated (red) vertical profiles of soil C, at the 15 sites where peat age, depth, bulk density, and carbon fraction have been measured (Table S1). The black circles indicate depths of measurements; the red circles indicate the depth of each soil layer in the model.
The simulated and observed vertical profiles of soil C for the 15 sites are shown in Fig. 3, simulated C concentrations are generally within the range of measurements at most of the sites, but are underestimated at Sidney bog, Usnsk Mire 1, Lake 785, and Lake 396. In the model, the buildup of peat is parameterized by downward movement of C between soil layers, with the empirical amount of C that each layer can hold being calculated from median observed bulk density and C fraction of peat core samples (Sect. 2.1.2). High C concentration of cores that have significantly larger bulk density and/or C fraction than the median of the measurements thus cannot be reproduced. This is the case of Lake 785 and Lake 396 (Table S1), where C concentrations are underestimated and depths are overestimated (Fig. 2), while simulated total C content is close to observations (for Lake 785, measured and simulated C content is 86.14 and 96.13 kg C m−2, respectively, while values for Lake 396 are 57.2 and 70.2 kg C m−2).
As shown in Fig. 4, there is considerable variability in depth and C concentration profiles among peat cores within a grid cell, even though these cores have a similar age. We rerun the model at the five grid cells where more than one peat core has been sampled, with time length of the simulation being defined as the mean age of cores in the same one grid cell. The simulated peat depth and C concentration profiles at G2, G4, and G5 are generally within the range of peat core measurements (Fig. 4). Observed C fraction at grid cell G1 and G3 is much greater than the median value of all peat core samples (Sect. 2.1.2); thus simulated C concentration along the peat profile is smaller than observations, but peat depth is still overestimated by the model. This is also the case with Lake 785 and Lake 396.
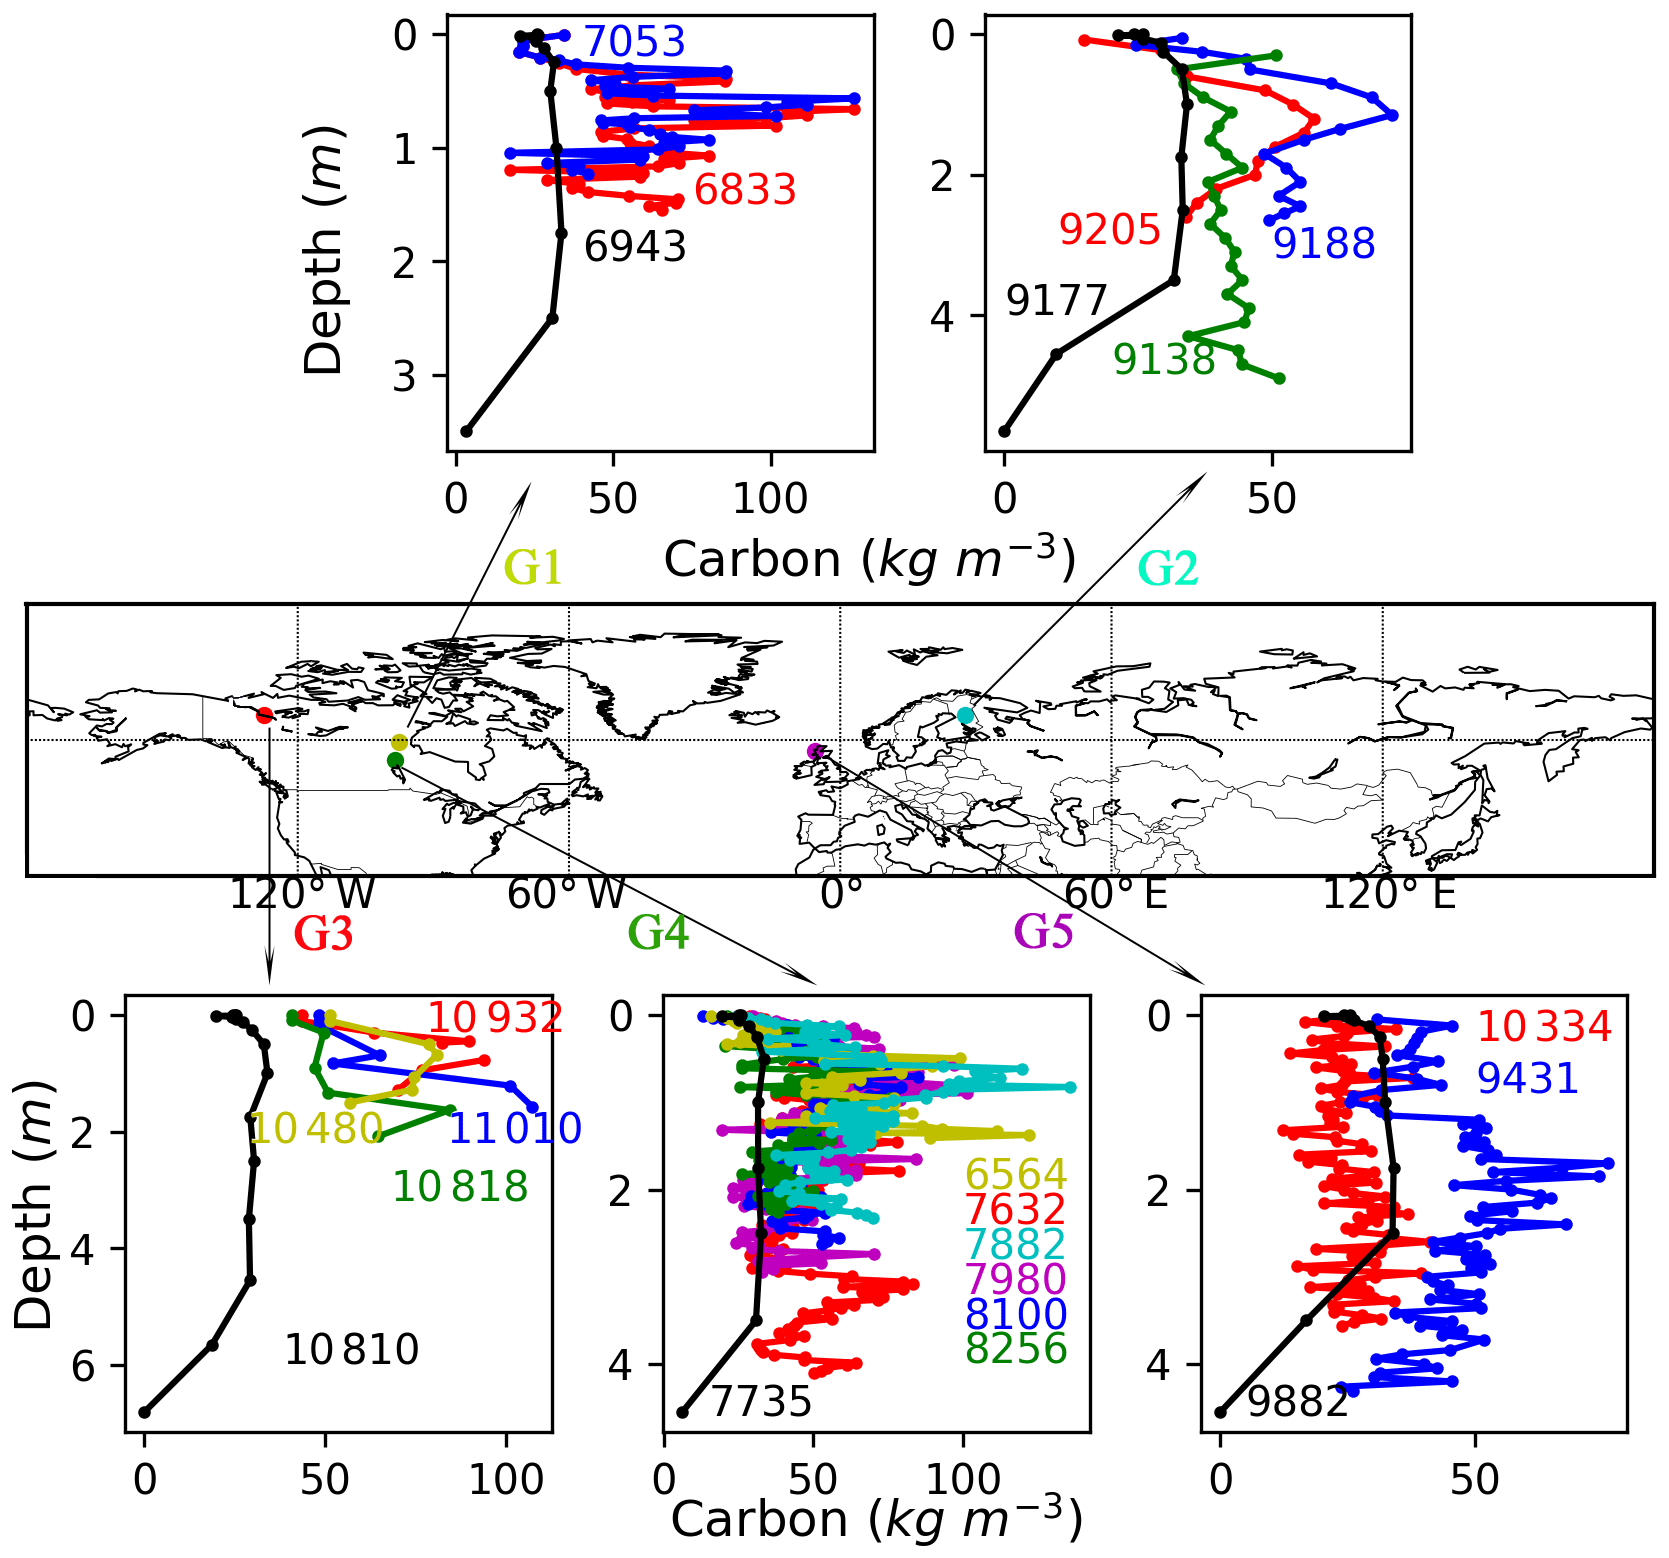
Figure 4Observed (coloured, with each coloured line representing one peat core) and simulated (black) vertical C profiles of five grid cells where there is more than one core. The numbers in the figure indicate ages of sampled peat cores (coloured) and time length of the simulation (black is the mean age of all cores in the same grid cell).
4.2 Regional simulation
4.2.1 Northern peatland area and C stock
Simulated maximum inundated area of the Northern Hemisphere is 9.1 million km2, smaller than the wetland areas in CW-WTD (∼13.2 million km2 after excluding lakes). TOPMODEL gives an area fraction at maximum soil water content while CW-WTD includes both areas seasonally to permanently flooded and areas that are persistently saturated or near-saturated (the maximum water table shallower than 20 cm) at soil surface. Therefore, an exact match between CW-WTD and the model prediction is not expected. The model generally captures the spatial pattern of wetland areas represented by CW-WTD (Fig. 5). The multi-sensor satellite-based GIEMS dataset (Prigent et al., 2007, 2012), which provides observed monthly inundation extent over the period of 1993–2007, is used to evaluate simulated seasonality of inundation. Figure 6 shows that the seasonality of inundation is generally well captured by the model, although simulated seasonal maximum of inundation extent occurs earlier than observations (except in WSL) and simulated duration of inundation is longer than observations.
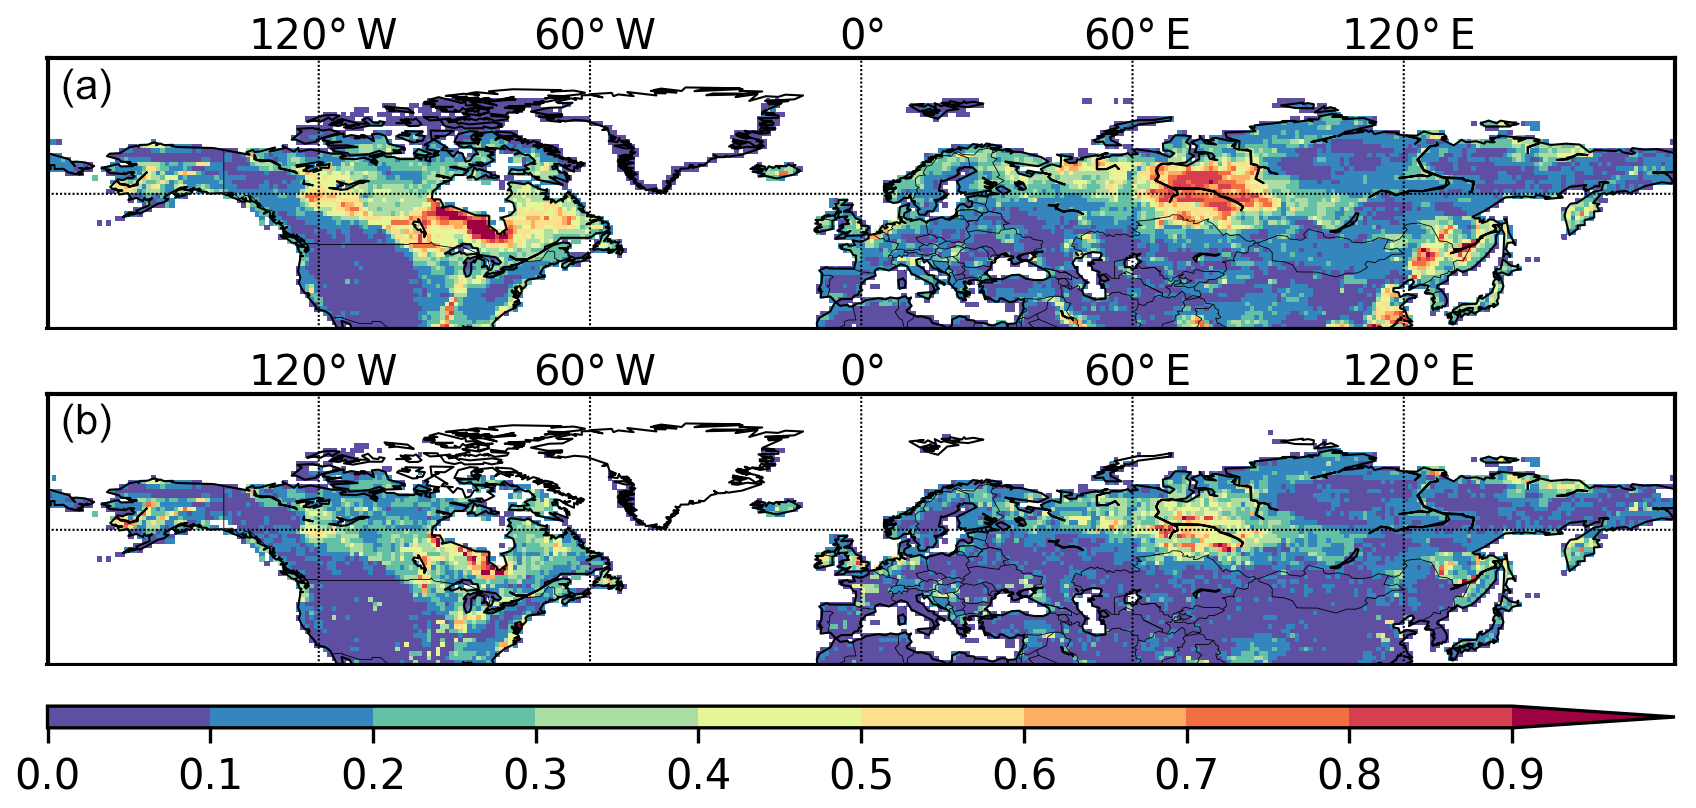
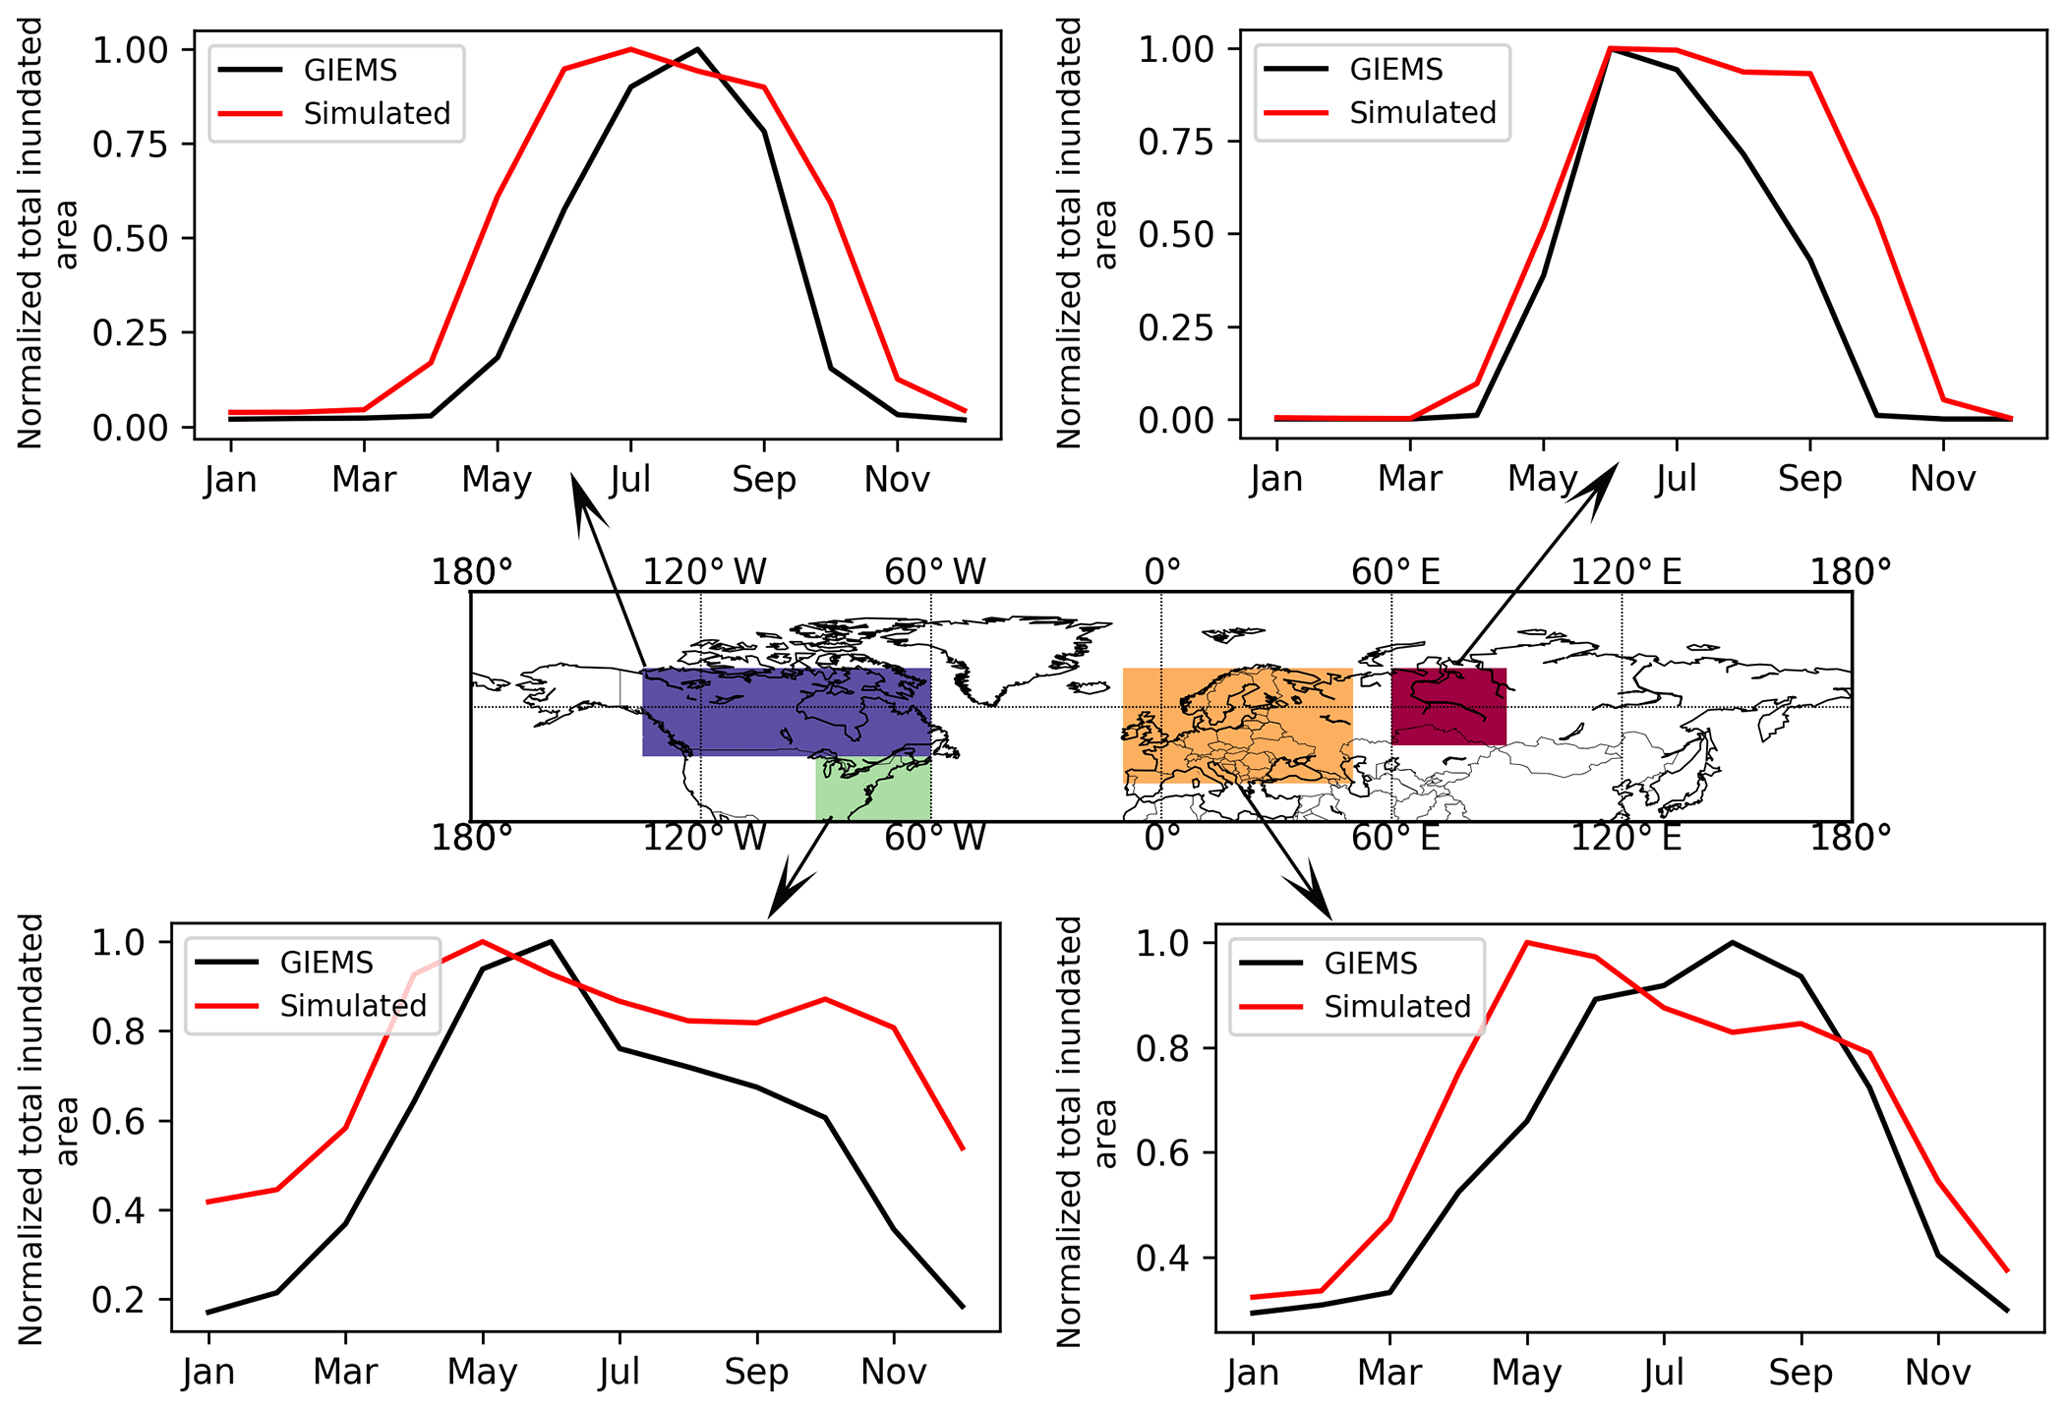
Figure 6Simulated and observed (GIEMS; Prigent et al., 2007, 2012) mean seasonality (averaged over 1993–2007) of total inundated area. Note that the simulated and observed total inundated areas of each month are divided by the simulated and observed maximum monthly values, respectively, to highlight seasonality of inundation rather than comparing absolute values of inundated area.
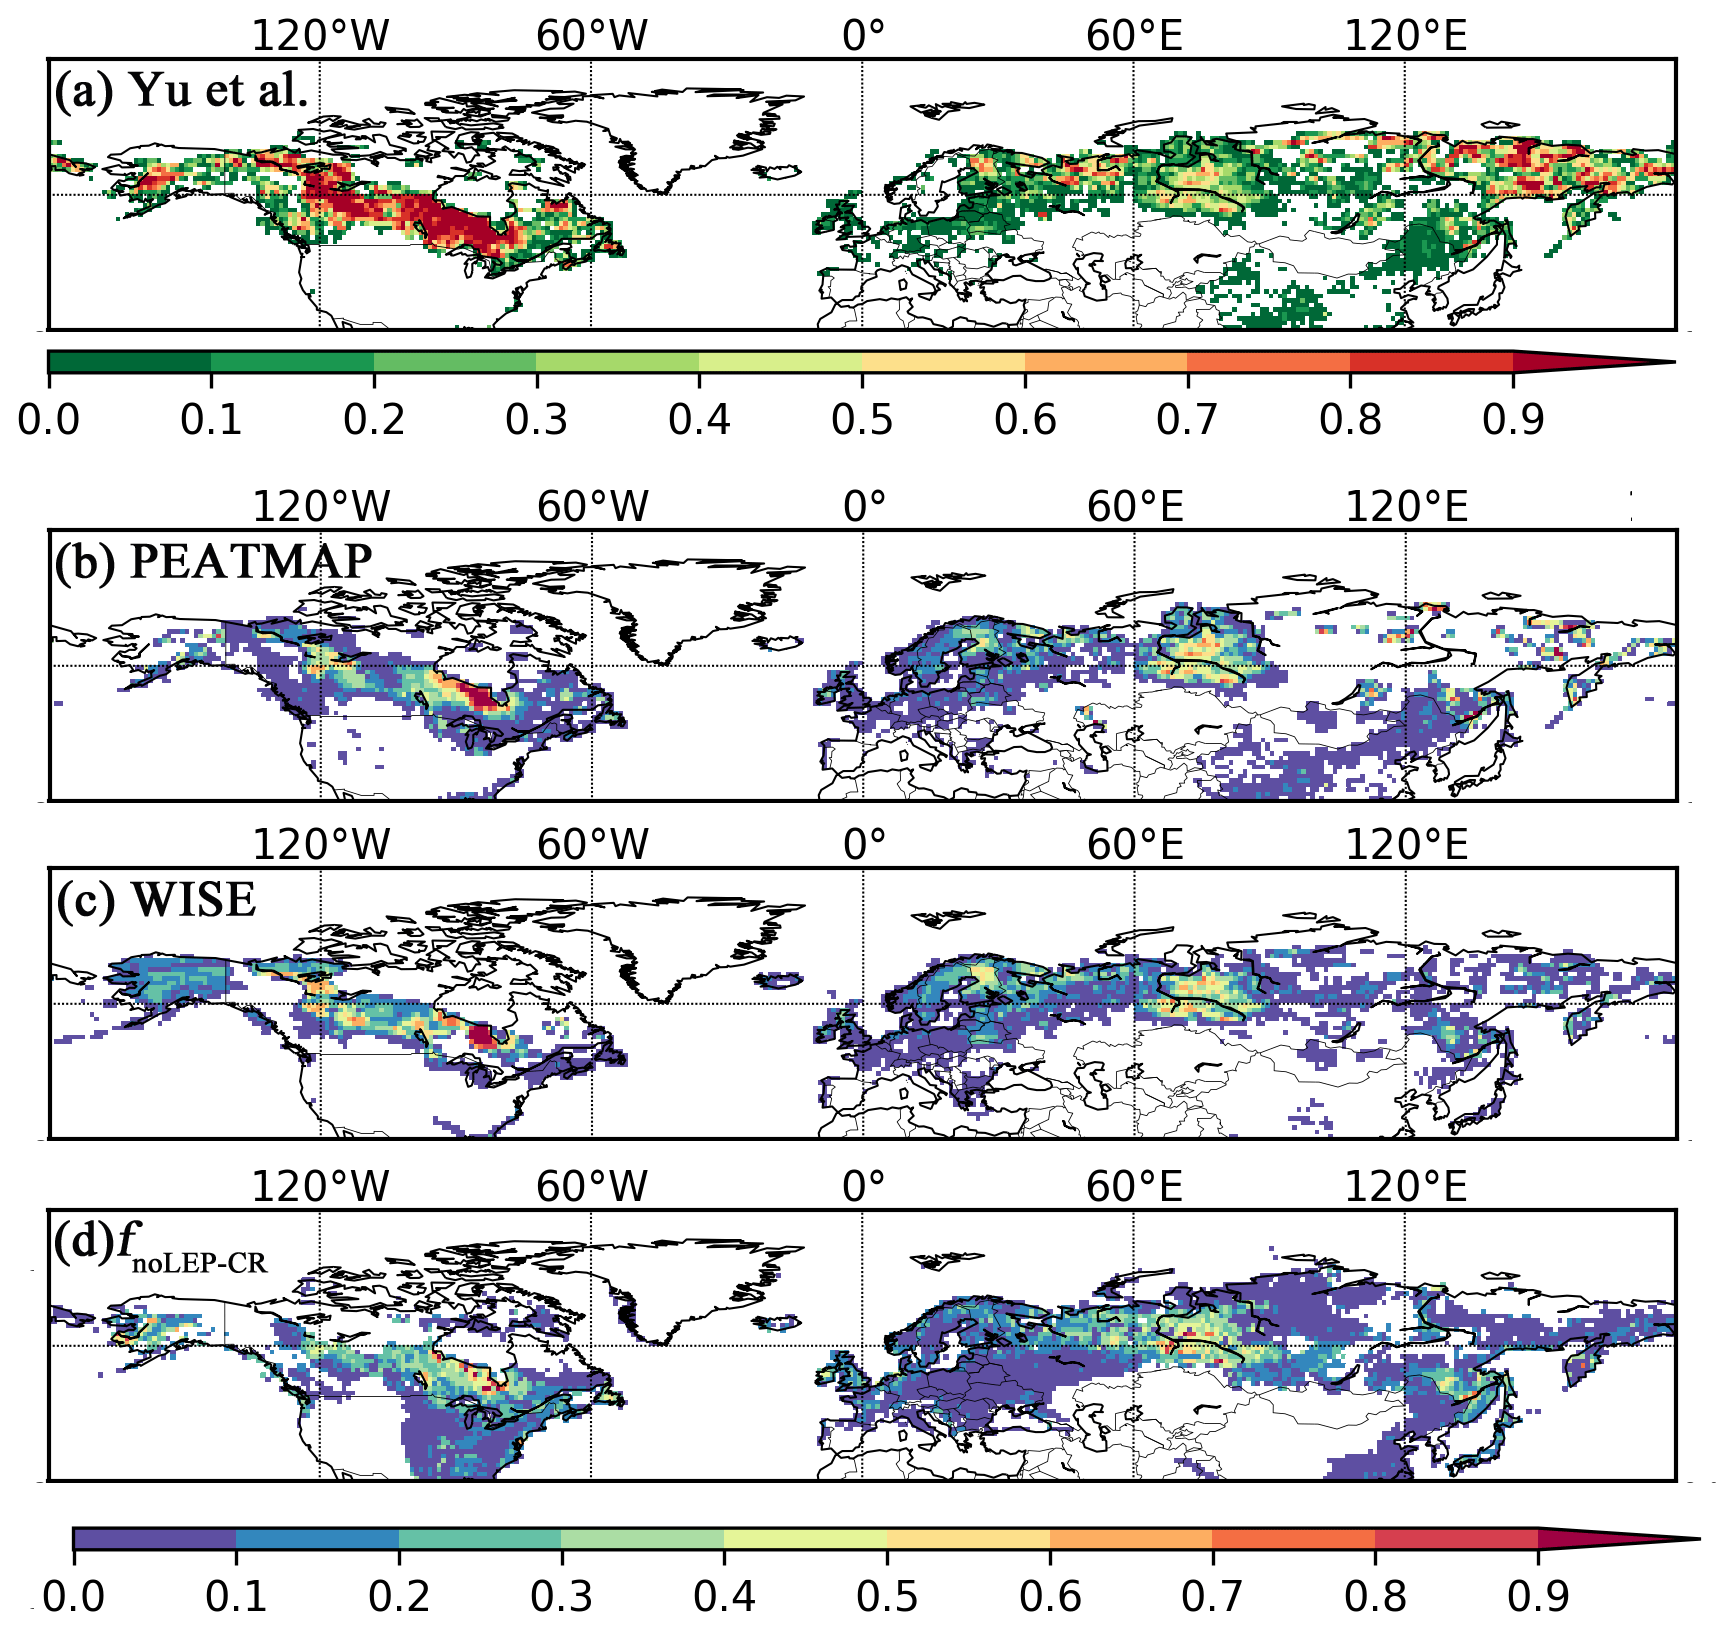
Figure 7Observed and simulated peatland area fraction. (a) Peatland fractions obtained from qualitative map of Yu et al. (2010). The original qualitative map only delineates areas with peatland coverage greater than 5 %; the quantitative data here are derived by aggregating the interpolated grid cells into fractions. Thus it is not directly comparable to the fractional peatland area of other datasets and the model output. We illustrate this with a distinct colour key, (b) peatland area fraction derived from the PEATMAP, (c) histosol fractions from the WISE soil database, and (d) simulated peatland area fraction (fnoLEP-CR); pattern and timing of deglaciation have been considered. Areas dominated by Leptosols have been masked and areas occupied by crops have been excluded, under the assumption that cropland occupied peatland in proportion to grid cell peat fraction.
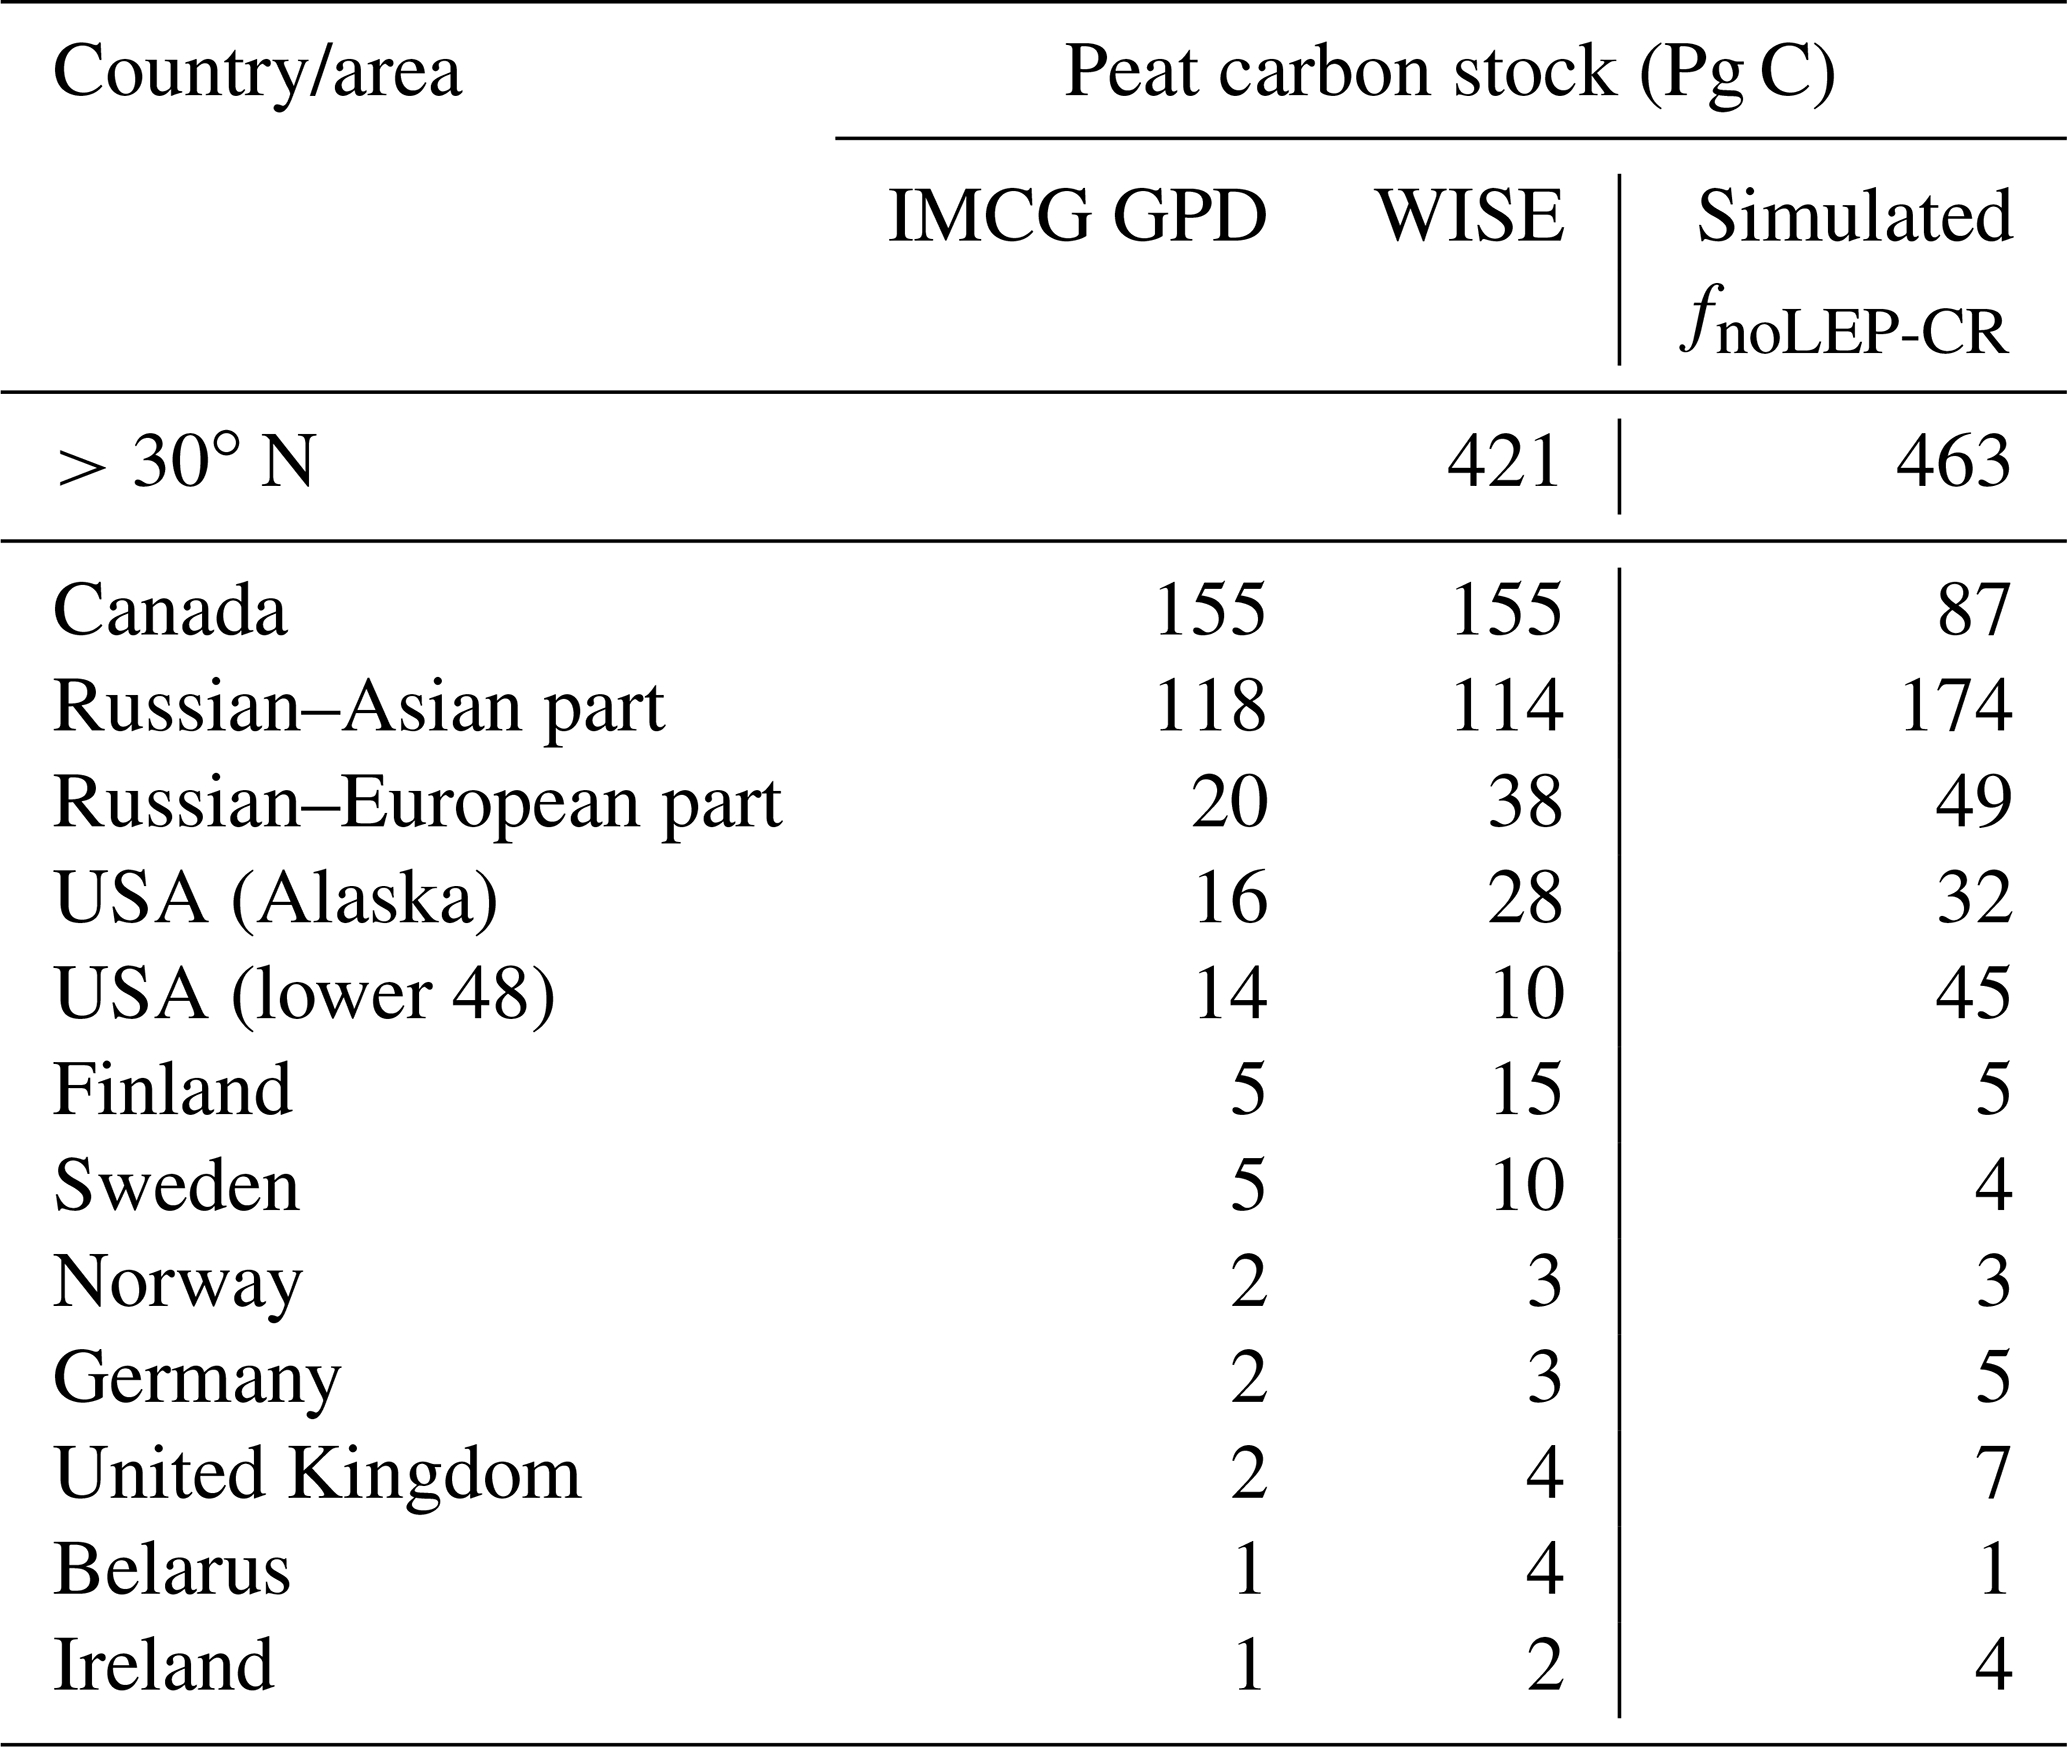
While our model predicts the natural extent of peatlands under suitable climate conditions, soil formation processes and soil erosion are not included in the model. We mask grid cells that are dominated by Leptosols, which are shallow or stony soils over hard rock, or highly calcareous material (Nachtergaele, 2010) (Figs. S6, S7). Peatlands have been extensively used for agriculture after drainage and/or partial extraction worldwide (Carlson et al., 2016; Joosten, 2010; Leifeld and Menichetti, 2018; Parish et al., 2008). Intensive cultivation practices might cause rapid loss of peat C and ensuing disappearance of peatland. Additionally, agricultural peatlands are often classified as cropland, not as organic soils (Joosten, 2010). Therefore, we masked agricultural peatland from the results by assuming that crops occupy peatland in proportion to the grid cell peatland area (Carlson et al., 2016). The distribution and area of cropland used here is from the MIRCA2000 dataset (Portmann et al., 2010), which provides monthly crop areas for 26 crop classes around the year 2000 and includes multicropping explicitly (Fig. S8). After masking Leptosols and agricultural peatlands from the simulated peatland areas and peatland C stocks, the simulated total northern peatland area is 3.9 million km2 (fnoLEP-CR, Fig. 7d), holding 463 Pg C (CnoLEP-CR, Fig. 8b). These estimates fall well within estimated ranges of northern peatland area (3.4–4 million km2) and carbon stock (270–540 Pg C) (Gorham, 1991; Turunen et al., 2002; Yu et al., 2010). Simulated peatland area matches relatively well with PEATMAP data in Asian Russia but overestimates peat area in European Russia (Table 3). The simulated total peatland area of Canada is in relatively good agreement with the three evaluation datasets, though the world's second largest peatland complex at the Hudson Bay lowlands (HBL) is underestimated and a small part of the northwest Canada peatlands is missing. Packalen et al. (2014) stressed that initiation and development of HBL peatlands are driven by both climate and glacial isostatic adjustment (GIA), with initiation and expansion of HBL peatlands tightly coupled with land emergence from the Tyrrell Sea, following the deglaciation of the Laurentide ice sheet and under suitable climatic conditions. The pattern of peatlands at southern HBL was believed to be driven by the differential rates of GIA rather than climate (Glaser et al., 2004a, b). More specifically, Glaser et al. (2004a, b) suggested that the faster isostatic uplift rates on the lower reaches of the drainage basin reduce regional slope, impede drainage and shift river channels. Our model, however, cannot simulate the tectonic and hydrogeologic controls on peatland development. In addition, the development of permafrost at depth as peat grows in thickness over time acts to expand peat volume and uplift peat when liquid water-filled pores at the bottom of the peat become ice-filled pores (Seppälä, 2006). This process is not accounted for in the model and may explain why the HBL does not show up as a large flooded area today whereas peat developed in this region during the early development stages of the HBL complex. The simulated distribution of peatland area in Alaska agrees well with Yu et al. (2010) and WISE. There is a large overestimation of peatland area in the southeastern US (Table 3, Fig. 7d). The simulated peat C stock in Russia (both the Asian and the European part) and in the US is overestimated compared to IMCG GPD and WISE, but that of Canada is underestimated (Table 4, Fig. 8b).
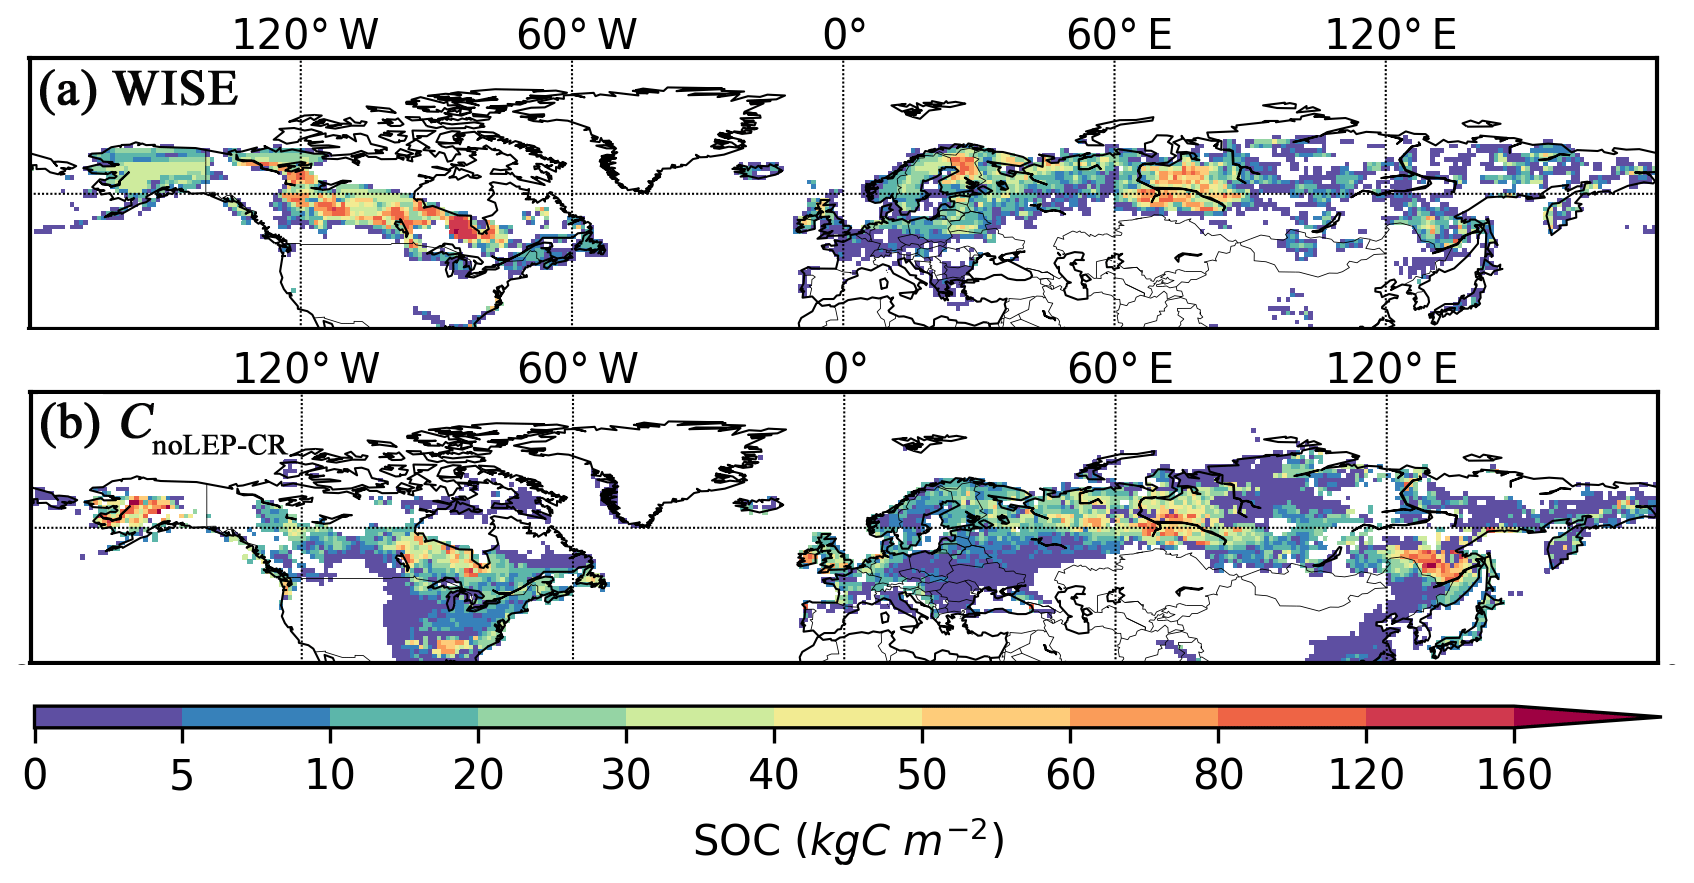
Figure 8Observed and simulated peatland soil carbon density. (a) Peatland (Histosols) soil carbon density from the WISE soil database and (b) simulated peatland soil carbon density (CnoLEP-CR); pattern and timing of deglaciation have been considered. Areas dominated by Leptosols have been masked and areas occupied by crops have been excluded, under the assumption that cropland occupied peatland in proportion to grid cell peat fraction.
Table 3Observed (estimates from peatland inventories and soil database) and simulated northern peatland area; countries are sorted in descending order according to the estimate of IMCG GPD.
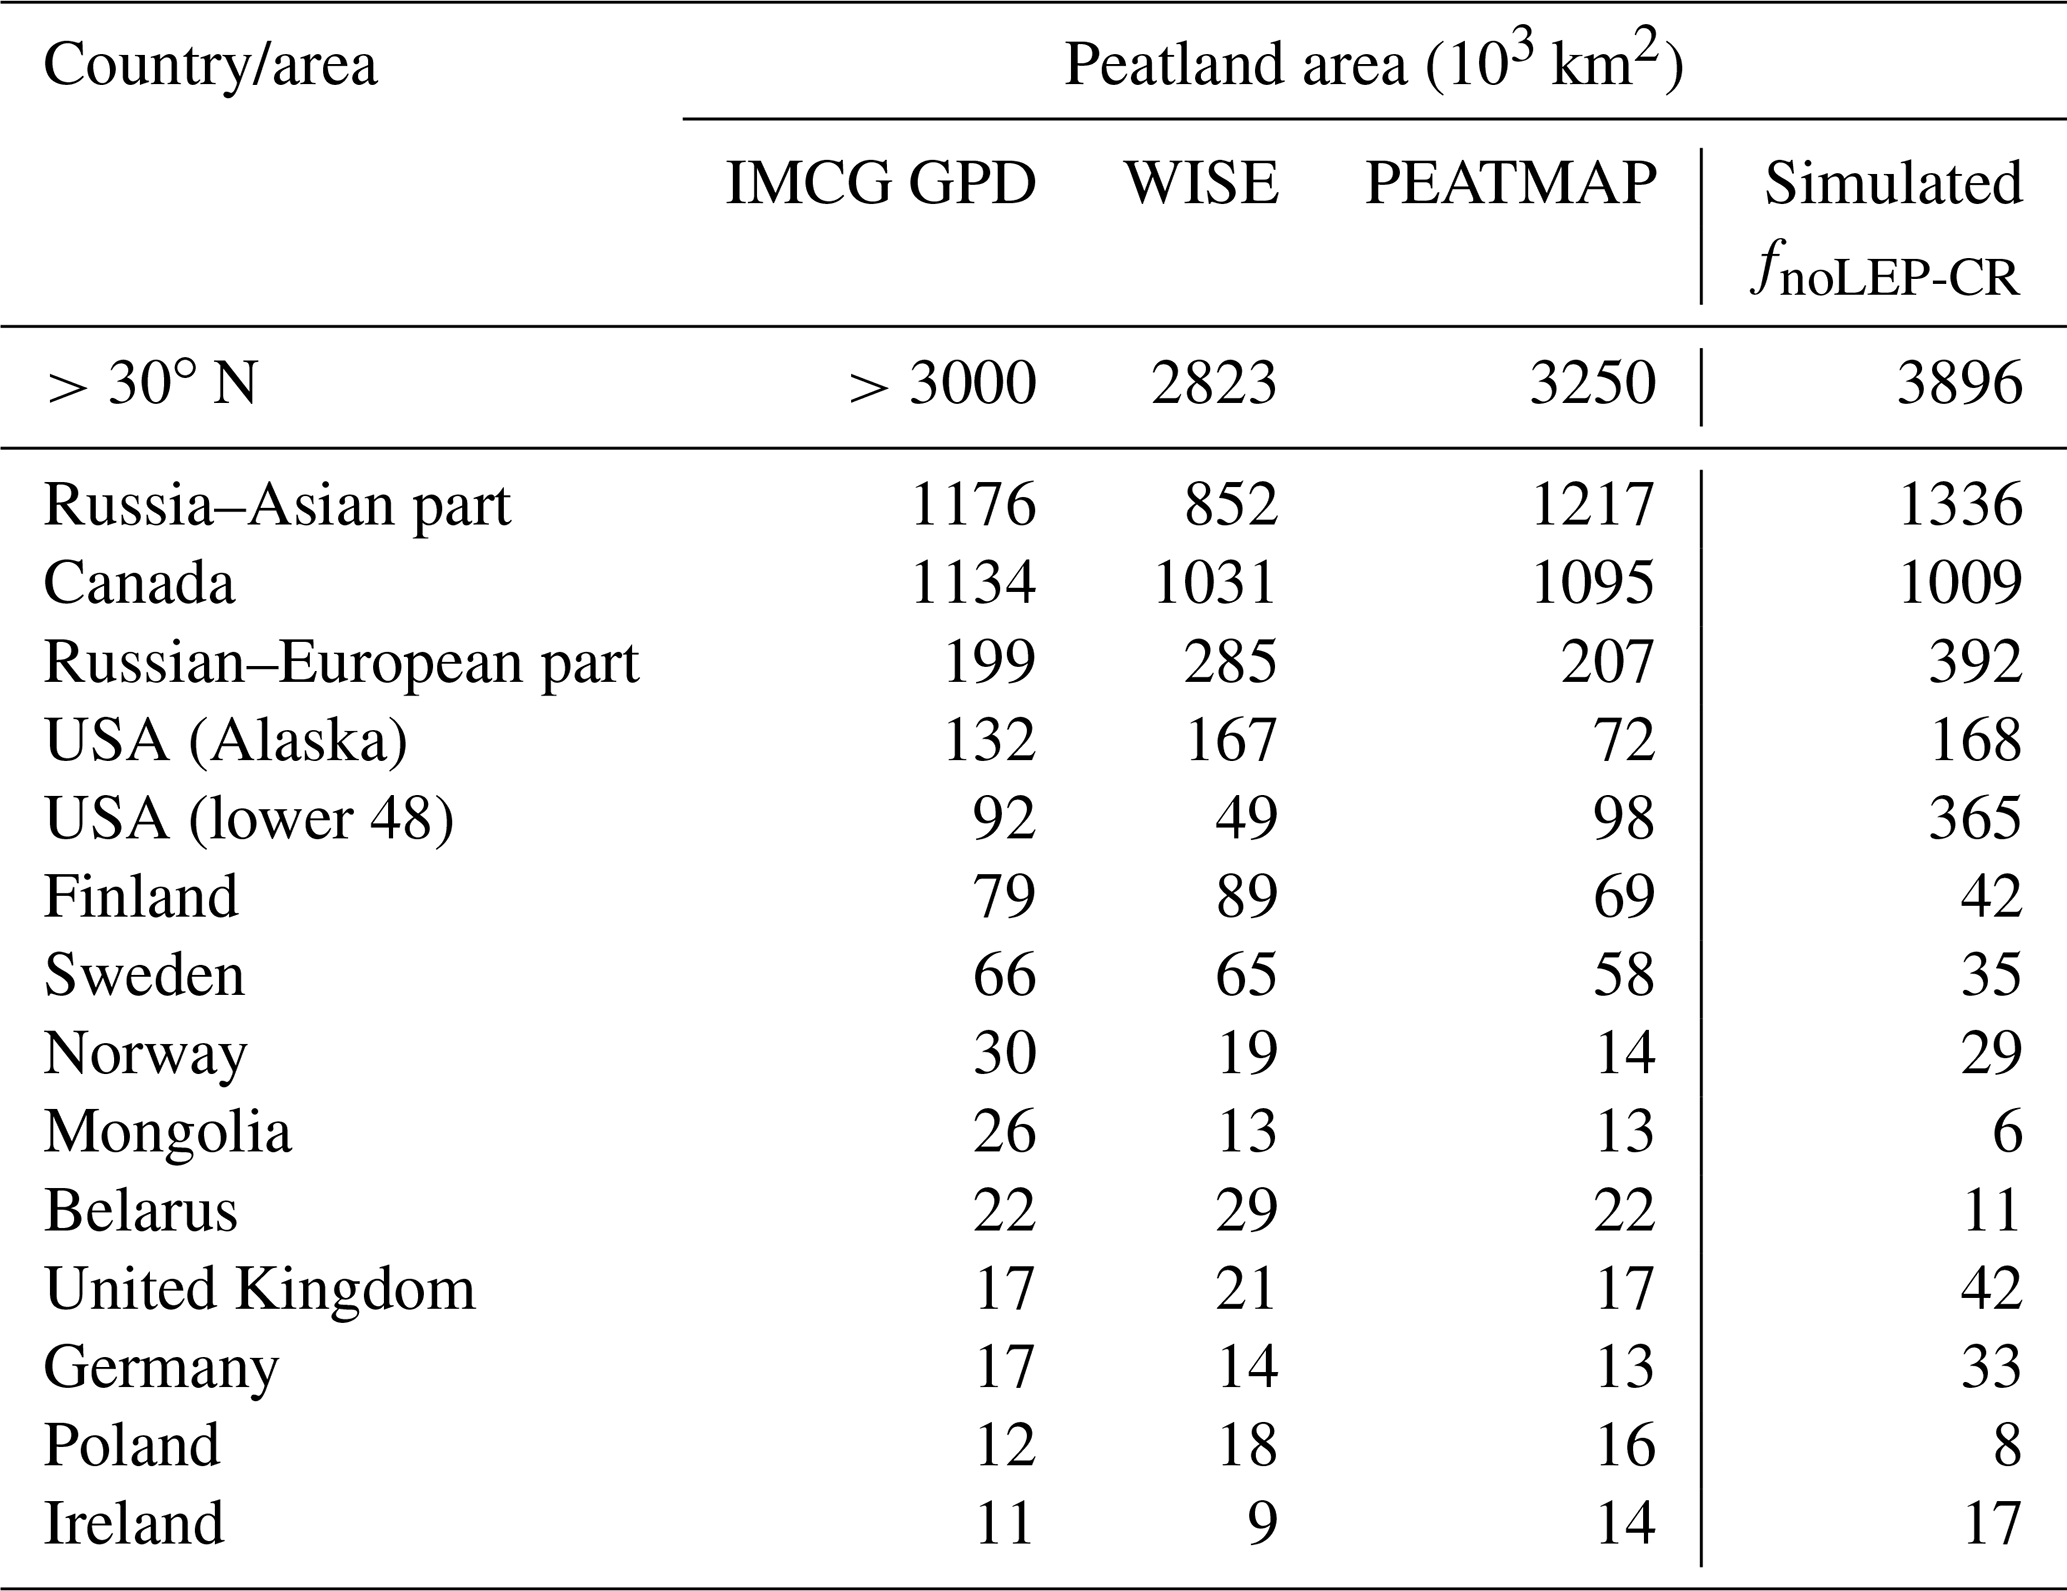
Table 4Observed and simulated northern peatland C; countries are sorted in descending order according to the estimate of IMCG GPD.
4.2.2 Peat depth
Figure 9 shows measured and simulated peat depth in NA and WSL. Some peat cores are sampled from the Canadian Arctic Archipelago, southwestern US, and the northern tip of Quebec, where there is no peatland in peat inventories or the soil database. These sites support the notion that the formation and development of peatland are strongly dependent on local conditions, i.e. retreat of glaciers, topography, drainage, vegetation succession (Carrara et al., 1991; Madole, 1976). As a large-scale LSM, the model cannot capture every single peatland: 429 out of 596 grid cells that contain observed peat cores in NA are captured by the model, while the model simulates peatlands in 54 out of 60 observed grid cells in WSL. Cores that are not captured by the model are removed from further analysis (319 out of 1521 peat cores in NA and 18 out of 127 peat cores in WSL are removed).
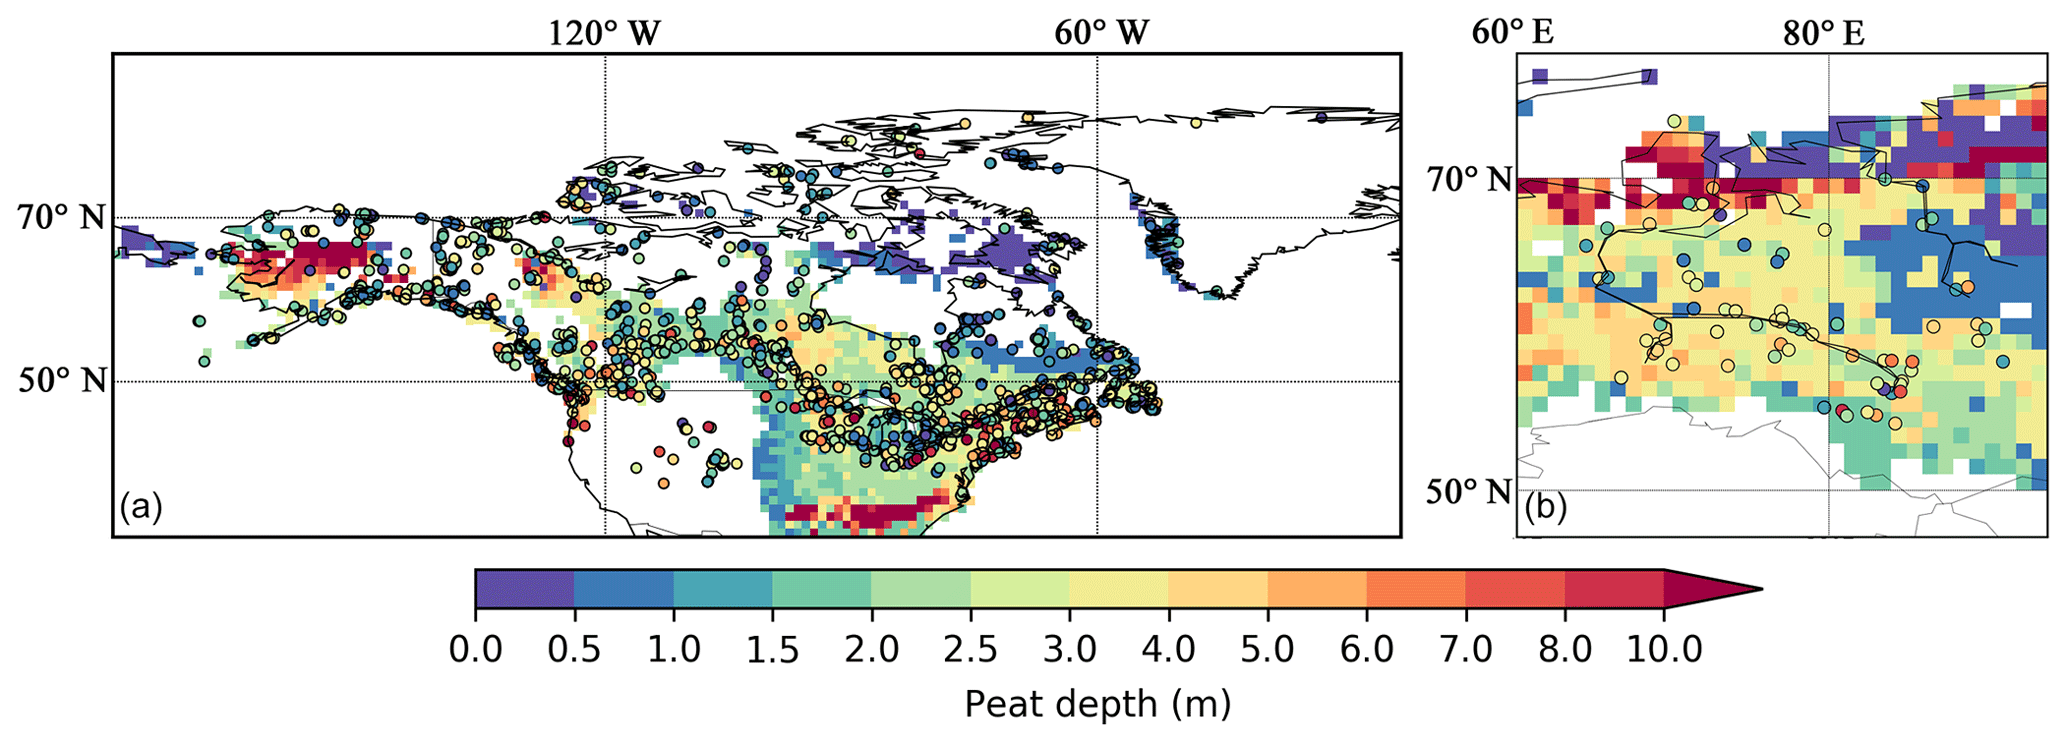
Figure 9Measured (colour-filled circles, with colours indicating measured values) and simulated (background maps) peat depth in North America (a) and in the West Siberian lowlands (b). Measured peat cores from North America are from Gorham et al. (2012), while those from the West Siberian lowlands are from Kremenetski et al. (2003).
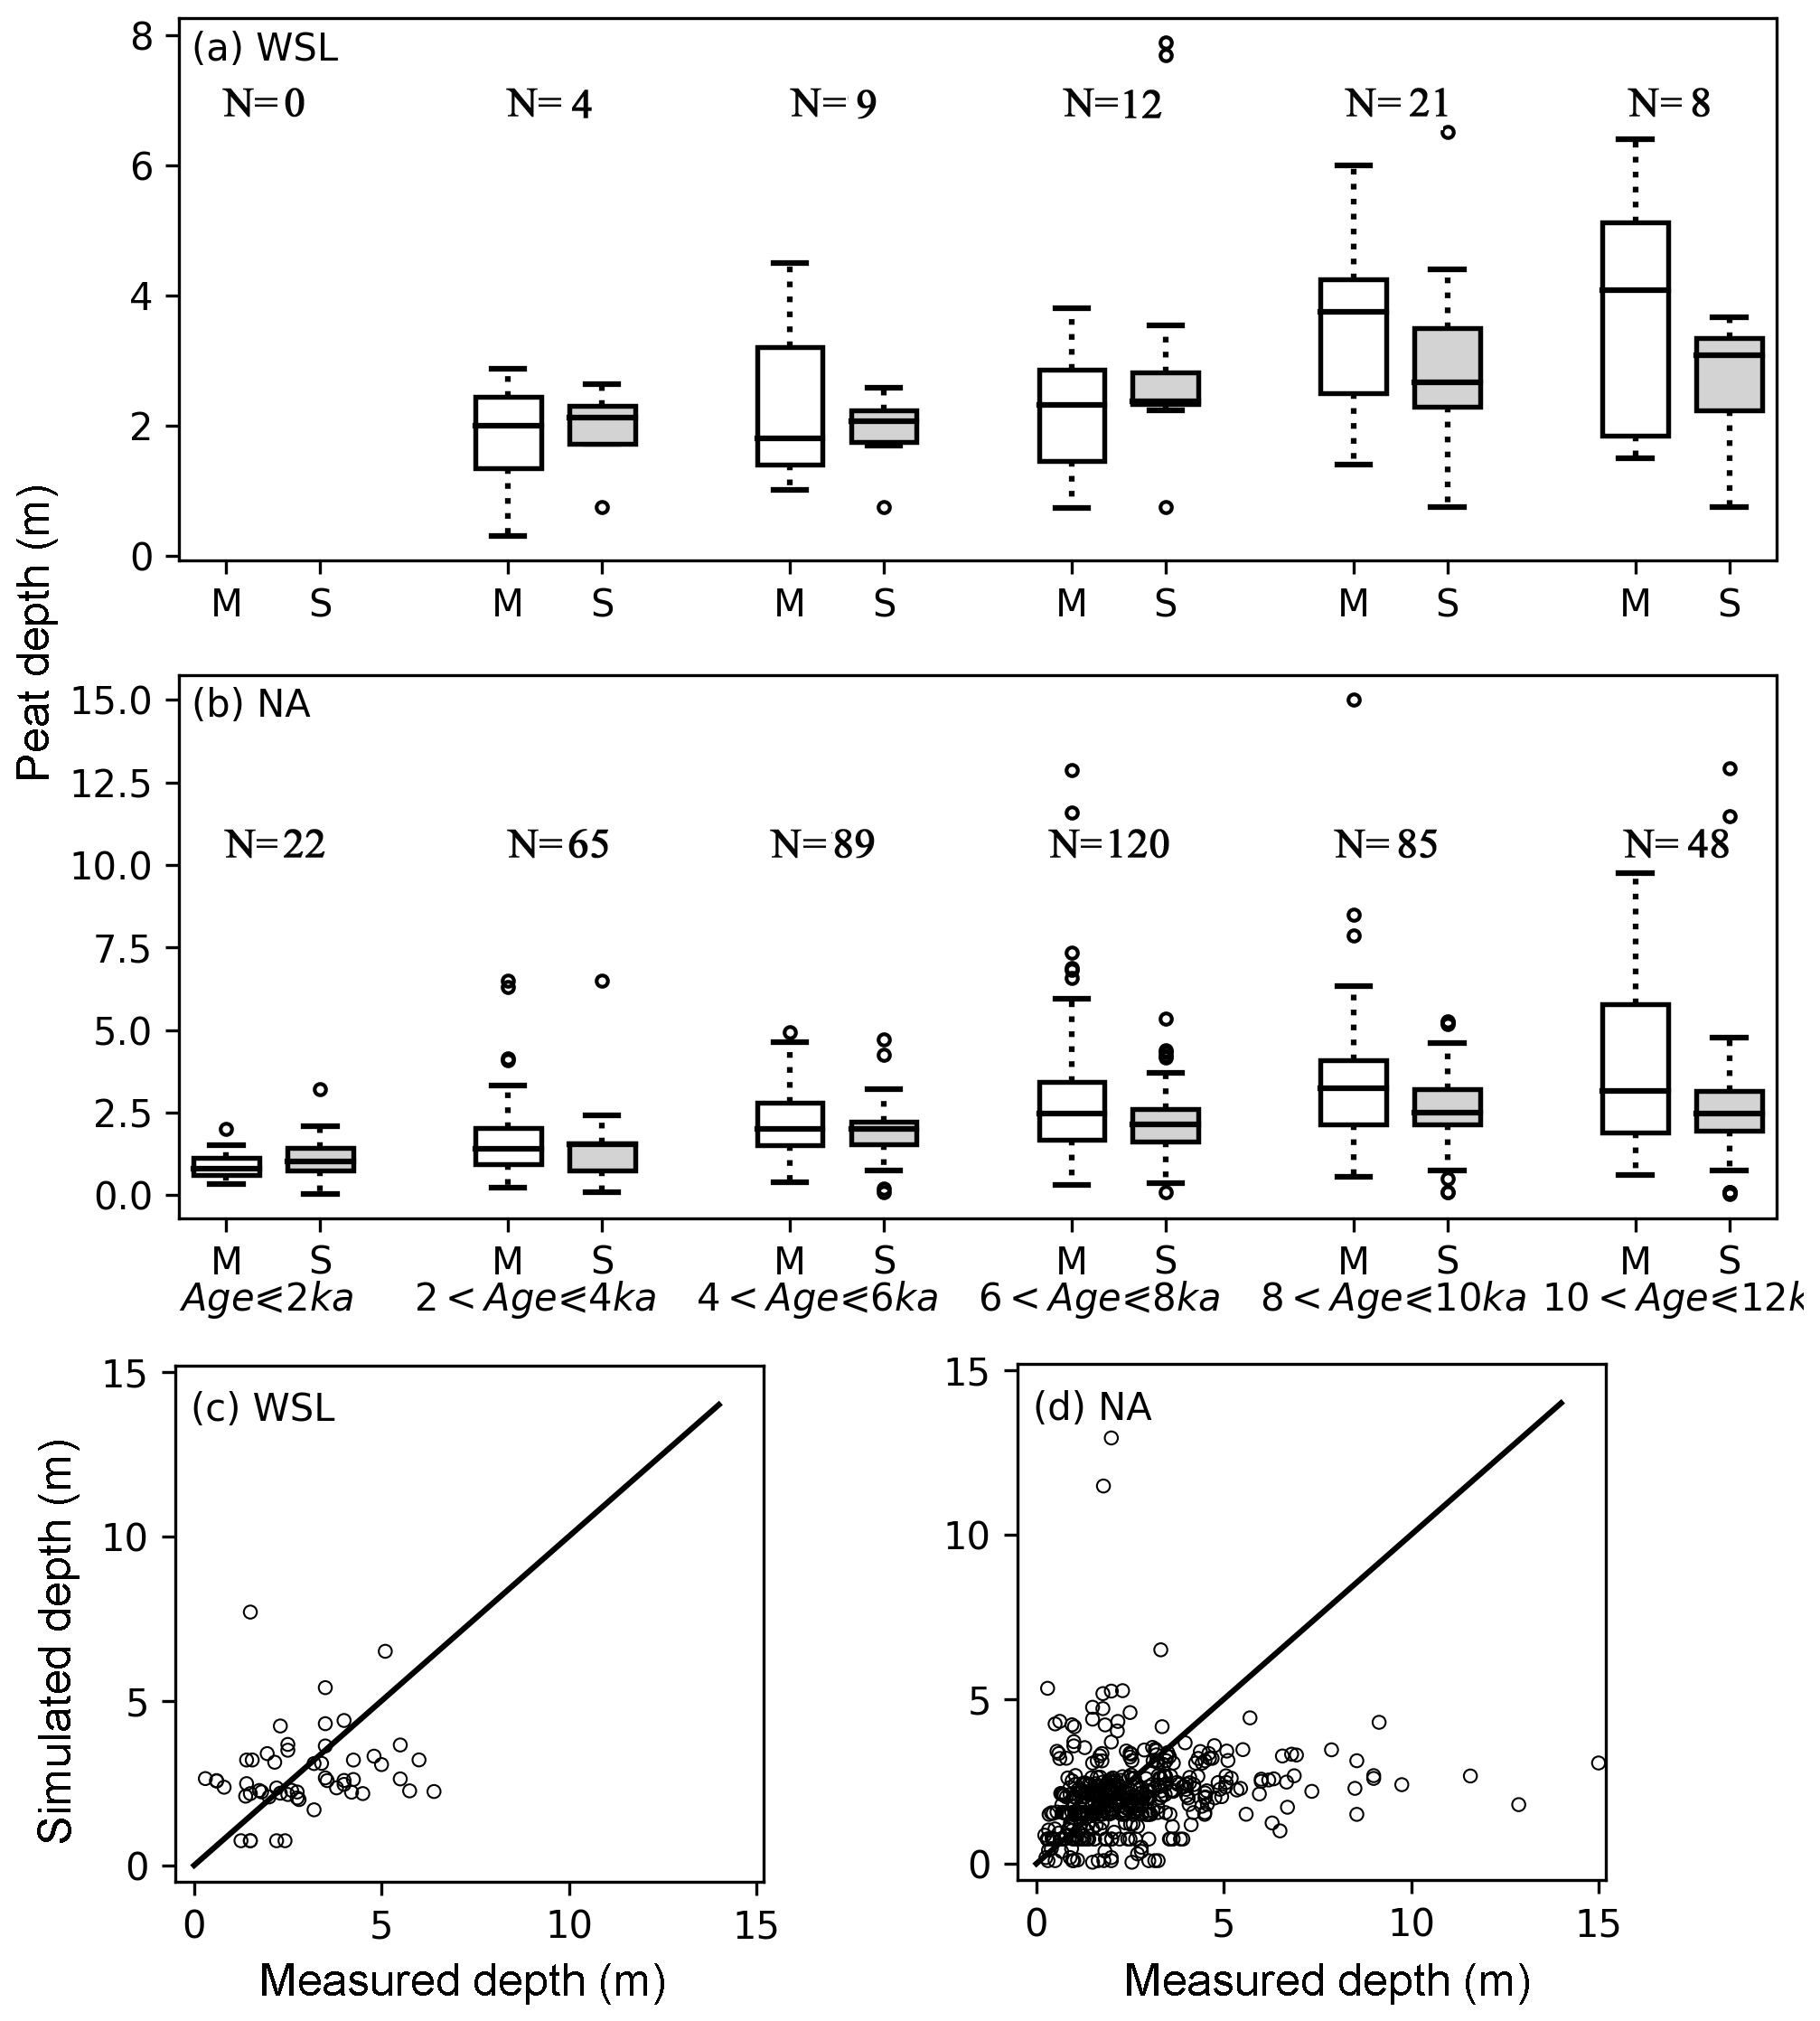
Figure 10(a, b) Measured (M) and simulated (S) mean peat depth at the West Siberian lowlands (a) and North America (b), grouped according to the mean age of peat cores. Measured peat cores are from Gorham et al. (2012) and Kremenetski et al. (2003). The horizontal box lines: the upper line – the 75th percentile, the central line – the median (50th percentile), the lower line – the 25th percentile. The dashed lines represent 1.5 times the interquartile range (IQR). The circles are outliers. Number of included grid cells in each age group is indicated by N. (c, d) The scatter plot of measured and simulated peat depth for the West Siberian lowlands (c) and North America (d). For a grid cell that has multiple measured peat cores, the median depth of all measurements is plotted against the simulated depth in the scatter plot.
As shown in Fig. 4, within a grid cell, sampled peat cores can have very different depths and/or ages. We calculate the mean depth of cores in each of the grid cells and compare it against the simulated mean depth. The mean age of cores in each of the grid cells is used to determine which output of the model should be examined. For instance, the mean age of the four cores in grid cell (40.5∘ N, 74.5∘ W) is 2.5 ka, and accordingly we pick out the simulated depth of this grid cell right after the first run of SubC (Fig. S3) to compare with the mean depth of these cores. We acknowledge that this is still a crude comparison since the simulation protocol implies that we can only make the comparison at 2000-year intervals. Nonetheless, it is a compromise between running the model for 1815 peat cores independently and comparing the mean depth of measured points with grid-based simulated depth. As shown in Fig. 10, for each age interval (of both the West Siberian lowlands and North America), the variation in simulated depth is smaller than that in the measurement. The two deepest simulated peat measurements in WSL belong to the fourth age group ( ka) and are the result of a shallow active layer; while C is moving downward to deeper and deeper layers, the decomposition is greatly limited by cold conditions at depth. At both WSL and NA, simulated median peat depths (2.07–2.36 m at WSL, 1.02–2.15 m at NA) are in relatively good agreement with measurements (1.8–2.31 m at WSL, 0.8–2.46 m at NA) for cores younger than 8 ka (Fig. 10). For the two oldest groups (peat age >8 ka), the simulated median depths are about 0.70 m shallower than measurements at NA and about 1.04 m shallower at WSL.
4.2.3 Undisturbed northern peatland carbon balance in the past century
Simulated mean annual (averaged over 1901–2009) net ecosystem production (NEP) of northern peatlands varies from −63 to 46 g C m−2 a−1 (Fig. 11). The West Siberian lowlands, the Hudson Bay lowlands, Alaska, and the China–Russia border are significant hotspots of peatland C uptake. Simulated mean annual NEP of all northern peatlands over 1901–2009 is 0.1 Pg C a−1, consistent with the previous estimate of 0.076 Pg C a−1 by Gorham (1991) and the estimate of 0.07 Pg C a−1 by Clymo et al. (1998). From 1901 to 2009, both simulated net primary production (NPP) and simulated heterotrophic respiration (HR) show an increasing trend, but NPP rises faster than HR during the second half of the century (Fig. 12a). The increase in NPP is caused by atmospheric CO2 concentration and increasing air temperature (Figs. 12, S9). As air (soil) temperature increases, HR also increases but lags behind NPP (Figs. 12, S9). Simulated annual NEP ranges from −0.03 to 0.23 Pg C a−1, with a significant positive trend over the second half of the century (Fig. 12b). NEP shows a significant positive relationship with air (soil) temperature and with atmospheric CO2 concentration (Fig. S9). CH4 and dissolved organic carbon (DOC) are not yet included in the model; both of them are significant losses of C from peatland (Roulet et al., 2007).

Figure 11Simulated annual net ecosystem production (NEP), averaged over 1901–2009. Obtained by multiplying peatland NEP (g C m−2 peatland a−1) with peatland fraction for each grid cell.
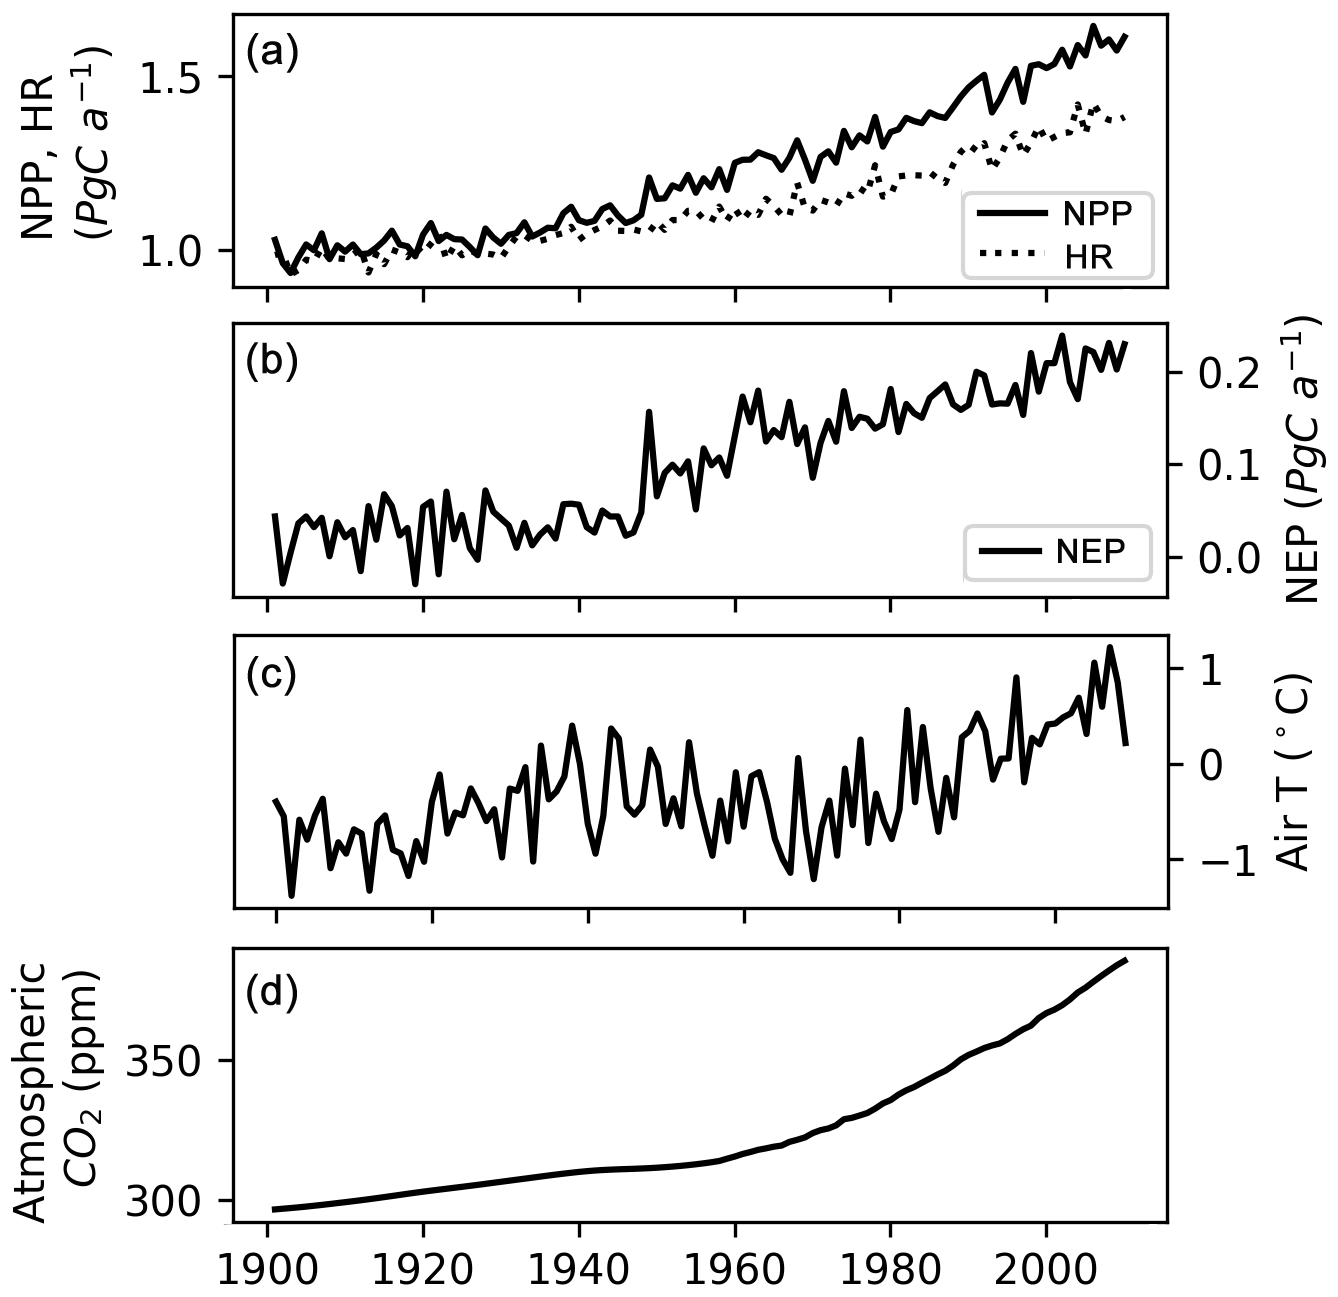
Figure 12(a) Simulated annual net primary production (NPP), heterotrophic respiration (HR) of northern peatlands, (b) simulated net ecosystem production (NEP) of northern peatlands, (c) mean air temperature (T) of grid cells that have peatland, and (d) atmospheric CO2 concentration.
5.1 Peat depth
We found a general underestimation of peat depth (Figs. 2, 10), possibly due to the following reasons. Firstly, there is a lack of specific local climatic and topographic conditions. The surfaces of peatlands are mosaics of microforms, with accumulation of peat occurring at each individual microsite of hummocks, lawns, and hollows. Differences in vegetation communities, thickness of the unsaturated zone, local peat hydraulic conductivity, and transmissivity between microforms result in considerable variation in peat formation rate and total C mass (Belyea and Clymo, 2001; Belyea and Malmer, 2004; Borren et al., 2004; Packalen et al., 2016). Cresto Aleina et al. (2015) found that the inclusion of microtopography in the hummock–hollow model delayed the simulated runoff and maintained wetter peat soil for a longer time at a peatland of northwest Russia, thus contributing to enhanced anoxic conditions. Secondly, site-specific parameters are not included in gridded simulations. Parameters describing peat soil properties, i.e. soil bulk density and soil carbon fraction, determine the amount of C that can be stored across the vertical soil profile. Hydrological parameters, i.e. the hydraulic conductivity and diffusivity, and the saturated and residual water content regulate vertical fluxes of water in the peatland soil and expansion–contraction of the peatland area, and hence influence the decomposition and accumulation of C at the sites considered. Plant trait parameters, i.e. the maximal rate of carboxylation (Vcmax), and the light saturation rate of electron transport (Jmax) determine the carbon budgets of the sites (Qiu et al., 2018). The depth modifier, which parameterizes depth dependence of decomposition, controls C decomposition at depth and is an important control on simulated total C and the vertical C profile. A third reason is sample selection bias. Ecologists and geochemists tend to take samples from the deepest part of a peatland complex to obtain the longest possible records (Gorham, 1991; Kuhry and Turunen, 2006). In contrast, the model is designed to model an average age and C stock of peatlands in a grid location, and thus preferably the simulated C concentrations of a grid cell should only be validated against grids represented by a number of observed cores. We do try to compare the model output with multiple peat cores (Figs. 4, 10), but we need to note that shallow peat is not sufficiently represented in field measurements. A fourth source of error is that simulated initiation time of peat development at some sites is too late compared to ages of measured cores. The model multiple-spin-up strategy accounts for coarse-scale ice sheet distribution at discrete Holocene intervals (Sect. 3.2, Fig. S3), and if the modelled occurrence of peatland is too late, the accumulated soil C may be underestimated. For example, at the Patuanak site, where the core age is 9017 years, the model was run with 4 times' SubC (Table S1). However, there was no peatland before the first SubC, meaning that simulated peatland at this grid cell was 2000 years younger than the observation and that our simulation missed C accumulation during the first 2000 years at this site. This may be another source of bias associated with the model resolution, namely that local site conditions fulfilled the initiation of peatland at specific locations, but the average topographic and climatic conditions of the coarse model grid cell were not suitable for peatland initiation. Also, one has to keep in mind that a single (a few) sample(s) from a large peat complex may not be enough to capture the lateral spread of peat area, which may be an important control on accumulation of C (Charmen, 1992; Gallego-Sala et al., 2016; Parish et al., 2008). The underestimation of peat depth can also come from biased climate input data: spin-ups of the model are forced with repeated 1961–1990 climate, assuming that Holocene climate is equal to recent climate. While peatland carbon sequestration rates are sensitive to climatic fluctuations, centennial- to millennial-scale climate variability, i.e. cooling during the Younger Dryas period and the Little Ice Age period and warming during the Bølling-Allerød period, is not included in the climate forcing data (Yu et al., 2003a, b). An early Holocene carbon accumulation peak was found during the Holocene Thermal Maximum when the climate was warmer than present (Loisel et al., 2014; Yu et al., 2009). Finally, effects of landscape morphology on drainage as well as drainage of glacial lakes are not incorporated and can represent a source of uncertainty.
5.2 Vertical profiles of peatland soil organic carbon
We note that caution is needed in interpreting the comparison between simulated peat C profile and measured C profile from peat cores (Figs. 3, 4). In reality, peat grows both vertically and laterally since inception, with peat deposits tending to be deeper and basal age tending to be older at the original nucleation sites/center of the peatland complex (Bauer et al., 2003; Mathijssen et al., 2017). As mentioned earlier, field measurements tend to take samples from the deeper part of a peatland complex and shallow peat is underrepresented. The model, however, only simulates peat growth in the vertical dimension and lacks an explicit representation of the lateral development of a peatland in grid-based simulations; thus simulated peat C (per unit peatland area) is diluted when the simulated peatland area fraction in the grid cell increases. In addition, we cannot compare the simulated peat C profile against the observed profile from dated peat cores because the model does not track age bins explicitly.
The above-noted discrepancies between the simulation and the observation highlight both the need for more peat core data collected with more rigorous sampling methodologies and the need to improve the model. In parallel with this study, 14C dynamics in the soil have been incorporated into the ORCHIDEE-SOM model (Tifafi et al., 2018), which may give us an opportunity to compare simulated 14C age–depth profiles with dated peat C profiles in the future after being merged with our model.
5.3 Simulated peatland area development
The initiation and development of peatlands in NA followed the retreat of the ice sheets, as a result of the continuing emergence of new land with the potential to become suitable for peatland formation (Gorham et al., 2007; Halsey et al., 2000). To take glacial extent into account for simulating the Holocene development of peatlands, we use ice sheet reconstructions in NA and Eurasia (Figs. S4, S5). Not surprisingly, when ice cover is considered, the area of peatlands that developed before 8 ka is significantly decreased, while the area that developed after 6 ka is increased (Fig. 13). We use observed frequency distribution of peat basal age from MacDonald et al. (2006) as a proxy of peatland area change over time, following the assumption proposed by Yu (2011) that peatland area increases linearly with the rate of peat initiation. We grouped the data of MacDonald et al. (2006) into 2000-year bins to compare with simulated peatland area dynamics (Fig. 13). The inclusion of dynamic ice sheet coverage triggering peat inception clearly improved the model performance in replicating peatland area development during the Holocene, though the peatland area before 8 ka is still overestimated by the model in comparison with the observed frequency distribution of basal ages (Fig. 13). In spite of the difference in peatland area expansion dynamics between the simulation that considered dynamic ice sheets and the one that did not, the model estimates of present-day total peatland area and carbon stock are generally similar (Fig. S10). Without dynamic ice sheets, the model would predict only 0.1 million km2 more peatland area and 24 Pg more peat C over the Northern Hemisphere (>30∘ N). We are aware of two studies that attempted to account for the presence of ice sheets during the Holocene (Kleinen et al., 2012) and the Last Glacial Maximum (Spahni et al., 2013) while simulating peatland C dynamics. Kleinen et al. (2012) modelled C accumulation over the past 8000 years in the peatland areas north of 40∘ N using the coupled climate–carbon cycle model CLIMBER2-LPJ. A decrease of 10 Pg C was found when ice sheet extent at 8 ka BP (from the ICE-5G model) was accounted for. Another peatland modelling study conducted by Spahni et al. (2013) with the Land surface Processes and eXchanges (LPX) model also prescribed ice sheets and land area from the ICE-5G ice sheet reconstruction (Peltier, 2004), but influences of ice sheet margin fluctuations on simulated peatland area and C accumulation were not explicitly assessed in their study.
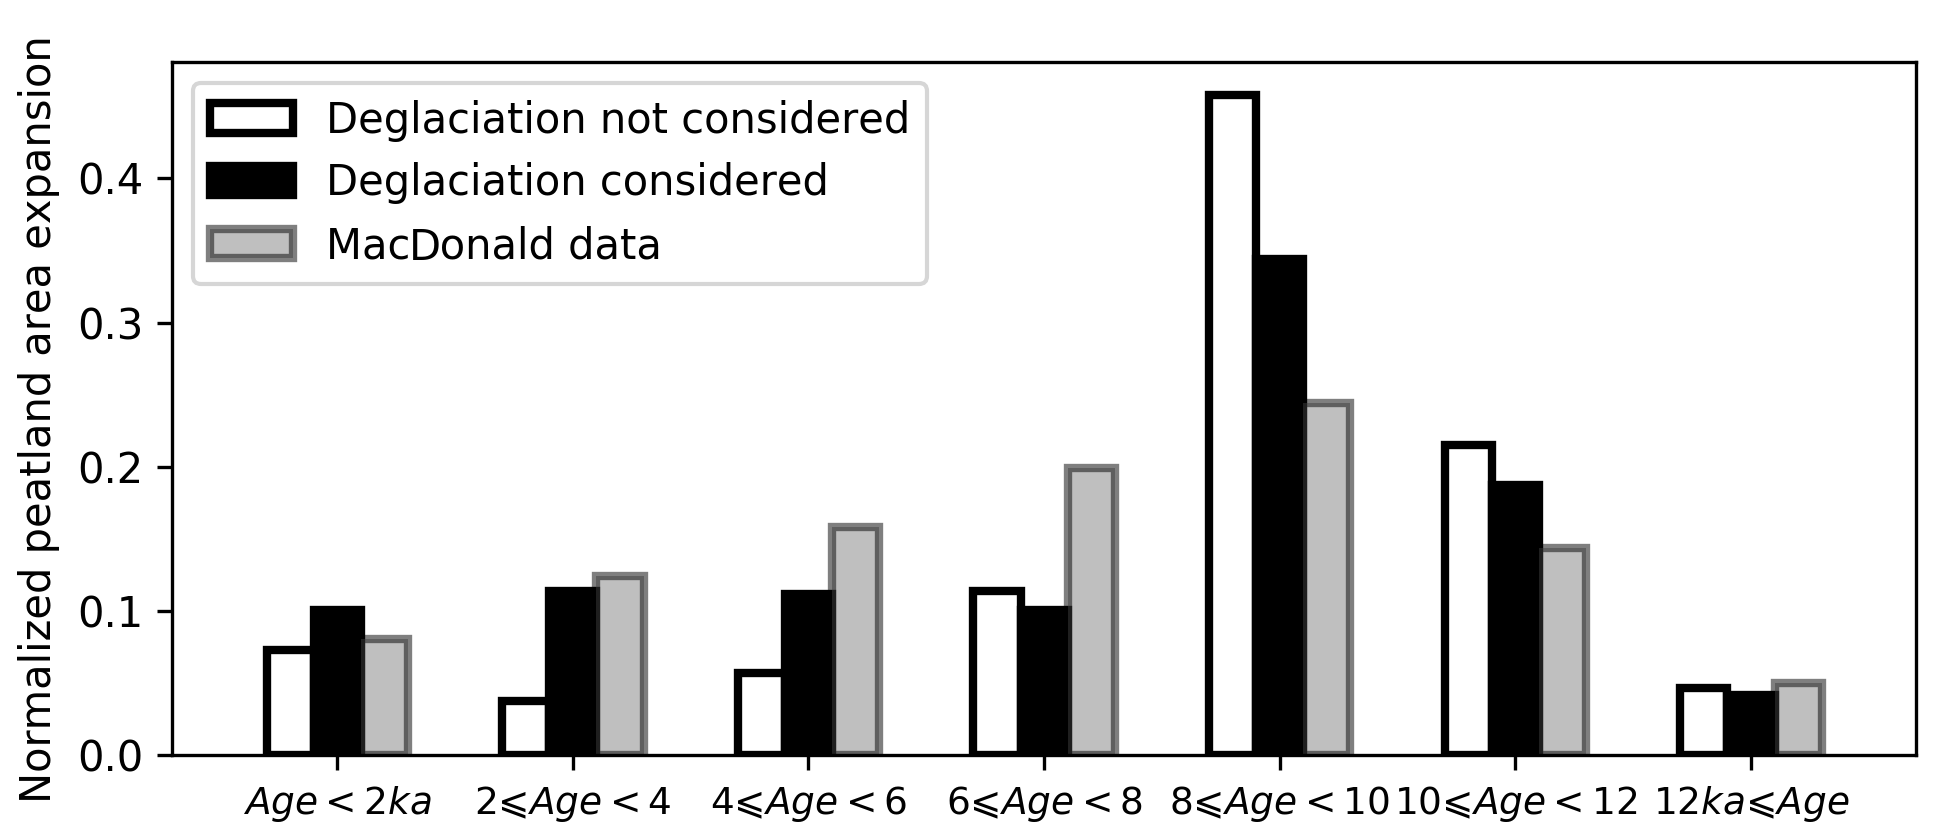
Figure 13Grey bars show the percentage of observed peatland initiation in 2000-year bins. Peat basal dates of 1516 cores are from MacDonald et al. (2006); peat basal age frequency of each 2000-year bin is divided by the total peat basal age frequency. White bars show the percentage of simulated peatland area developed in each 2000-year bin; deglaciation of ice sheets is not considered (the model was run with SubC six times, 2000 years each time). The peatland area developed in each bin is divided by the simulated modern (the year 2009) peatland area. Black bars show the percentage of simulated peatland area developed in each 2000-year bin; pattern and timing of deglaciation are read from maps in Figs. S5 and S6.
The peatland carbon density criterion for peatland expansion (Clim) is an important factor impacting the simulated Holocene trajectory of peatland development. Without the limitation of Clim, a larger expansion of northern peatlands would occur before 10 ka (Fig. S11). Such a premature, “explosive” increase in peatland area would result in the overestimation of C accumulated in the early Holocene in the model. In the meantime, peatland area in regions that only have small C input, i.e. Baffin Island and northeast Russia, would be overestimated (Fig. S12).
5.4 Choice of model parameters
For the active, slow, and passive peat soil carbon pool, the base decomposition rates are 1.0, 0.027, and 0.0006 a−1 at a reference temperature of 30 ∘C, respectively, meaning that the residence times at 10 ∘C (no moisture and depth limitation) of these three pools are 4, 148, and 6470 years. In equilibrium/near-equilibrium state, simulated C in the active pool takes up only a small fraction of the total peat C, while generally 40 %–80 % of simulated peat C is in the slow C pool and about 20 %–60 % is in the passive C pool. Assuming that in a peatland, the active, slow, and passive pools account for 3 %, 60 %, and 37 % (median values from the model output of the year 2009) of the total peat C, we can get a mean peat C residence time of 2500 years. If depth modifier is considered, the C residence time will vary from 2500 years at the soil surface to 13 200 years at the 2.5 m depth. For the record, in previous published large-scale diplotelmic peatland models, at 10 ∘C, C residence time for the acrotelm (depth = 0.3 m) ranged from 10 to 33 years and ranged from 1000 to 30 000 years for the catotelm (Kleinen et al., 2012; Spahni et al., 2013; Wania et al., 2009b). We performed sensitivity tests to show the sensitivity of the modelled peat C to model parameters at the 15 northern peatland sites where observed vertical C profiles can be constructed (Table S1). Tested parameters are the e-folding decreasing depth of the depth modifier (z0, Eq. 2), the prescribed thresholds to start C transfer between soil layers (fth, Eq. 5), and the prescribed fraction of C transferred vertically (f, Eq. 4). We found that changing fth or f leads to only small effects on the vertical soil C profile (see, e.g. Burnt Village peat site in Fig. S13). The parameter z0, by contrast, exerts a relatively strong control over C profiles. It is noteworthy that while our model resolves water diffusion between soil layers according to the Fokker–Planck equation (Qiu et al., 2018), simulated soil moisture does not necessarily increase with depth (Fig. S14). z0 is therefore an important parameter to constrain peat decomposition rates at depth. With smaller z0, decomposition of C decreases rapidly with depth, resulting in a deeper C profile (Fig. S14). Regional-scale tests verified these behaviours of the model: when fth=0.9 is used (instead of fth=0.7), changes in peatland area and peat C stock are negligible (Fig. S15). Without z0, simulated northern peatland area will not change (3.9 million km2), but northern peatland C stock will be underestimated (only 300 Pg C). If z0=0.5 m is applied (instead of z0=1.5 m), the simulated total peat C would triple while the total peatland area would only increase by 0.2 million km2 (Fig. S16).
5.5 Uncertainties in peatland area and soil C estimations
There are large uncertainties in estimates of peatland distribution and C storage. Some studies prescribe peatlands from wetlands. However, in spite of the fact that there are extensive disagreements between wetland maps, it is a challenge to distinguish peatlands from non-peat-forming wetlands (Gumbricht et al., 2017; Kleinen et al., 2012; Melton et al., 2013; Xu et al., 2018). Estimates based on peatland inventories are impeded by poor availability of data, non-uniform definitions of peatlands among regions, and coarse resolution (Joosten, 2010; Yu et al., 2010). In addition, as peatlands are normally defined as waterlogged ecosystems with a minimum peat depth of 30 or 40 cm, shallow peat is underrepresented. Another approach to estimate peatland area and peat C is to use a soil organic matter map to outline organic-rich areas, such as Histosols and Histels (Köchy et al., 2015; Spahni et al., 2013). This approach overlooks local hydrological conditions and vegetation composition (Wu et al., 2017). Our model estimates of peatland area and C stock generally fall well within the range of published estimates, except in the southeastern US, where there is only 0.05–0.10 million km2 of peatland in observations but 0.37 million km2 in the model prediction (Fig. 7d, Table 3). From the early 1600s to 2009, ∼50 % of the original wetlands in the lower 48 states of the US have been lost to agricultural, urban development, and other development (Dahl, 2011; Tiner, 1984). Although wetlands are not necessarily peatlands, the reported losses of wetlands in the US indicate that a potentially large area of peatlands in the US may have been lost to land use change. However, historical losses of peatlands due to land use change and the impact of agricultural drainage of peatlands have not been taken into account by our model. Another factor that might have contributed to the overestimation is a limitation of TOPMODEL, namely that the “floodability” of a pixel in the model is determined by its compound topographic index (CTI) value regardless of the pixel's location along the stream, and thus the floodability of an upstream pixel with a large CTI might be affected by downstream pixels that have a small CTI. The model's inability to resolve small-scale streamflows might be another cause of the overestimation.
The simulated mean annual NPP, HR, and NEP of northern peatlands increase from about 1950 onwards. We find positive relationships between NPP and temperature, NPP and atmospheric CO2 concentration, and HR and temperature over the past century (Fig. S9). From a future perspective, it is unclear whether the increasing trend of NEP can be maintained. While photosynthetic sensitivity to CO2 decreases with increasing atmospheric CO2 concentration and photosynthesis may finally reach a saturation point in the future, decomposition is not limited by CO2 concentration and may continue to increase with increasing temperature (Kirschbaum, 1994; Wania et al., 2009b).
Our model applies a multilayer approach to simulate process-based vertical water fluxes and dynamic C profiles of northern peatlands and highlights the vertical heterogeneities in the peat profile in comparison to previous diplotelmic models (Kleinen et al., 2012; Spahni et al., 2013; Stocker et al., 2014; Wania et al., 2009b). While simulating peatland dynamics, large-scale models used a static peatland distribution map obtained from peat inventories and soil classification maps (Largeron et al., 2018; Wania et al., 2009b, a), prescribed the trajectory of peatland area development over time (Spahni et al., 2013), or used wetland area dynamics as a proxy (Kleinen et al., 2012). We adapt the scheme of DYPTOP to simulate spatial and temporal dynamics of northern peatland area by combing simulated inundation and a set of peatland expansion criteria (Stocker et al., 2014).
As a large-scale LSM which is designed for large-scale gridded applications, ORCHIDEE-PEAT v2.0 cannot explicitly model the lateral development of a peatland. The model therefore aims to simulate large-scale average peat depth and C profile rather than capturing local peat inception time and age–depth profiles at the location of specific peat cores. Tracers like 14C are not included in the model, making some site-to-site evaluation in particular regarding peat inception time and age–depth profiles of peat cores difficult. For tropical peatlands, the model needs to be improved to represent its tree dominance, oxidation of deeper peat due to pneumatophore (breather roots) of tropical trees, and the greater water table fluctuations as a result of the higher hydraulic conductivity of wood peats and tropical climates (Lawson et al., 2014). In addition, tropical peat is formed in riparian seasonally flooded wetlands with water coming from upstream river networks, whereas the TOPMODEL equations used here implicitly assume a peatland is formed in a grid cell only from rainfall water falling into that grid cell. Further work to improve this simulation framework is needed in areas such as an accurate representation of the Holocene climate, higher spatial resolution, and distinguishing bogs from fens to better parameterize water inflows into peatland. Including CH4 emissions and leaching of DOC will be helpful to get a more complete picture of peatland C budget.
Multilayer schemes have been proven to be superior to simple box configurations in ESMs at realistic modelling of energy, water, and carbon fluxes over multilayer ecosystems (De Rosnay et al., 2000; Jenkinson and Coleman, 2008; Best et al., 2011; Wu et al., 2016). We apply multilayer approaches to model vertical profiles of water fluxes and vertical C profiles of northern peatlands. In addition to representations of peatland hydrology, peat C decomposition, and accumulation, a dynamic model of peatland extent is also included. The model shows good performance at simulating average peat depth and vertical C profile in grid-based simulations. Modern total northern peatland area and C stock is simulated as 3.9 million km2 and 463 Pg C (Leptosols and agricultural peatlands have been masked), respectively. While this study investigated the capability of ORCHIDEE-PEAT v2.0 to hindcast the past, in ongoing work, the model is being used to explore how peatland area and C cycling may change under future climate scenarios.
The source code is available online via https://doi.org/10.14768/20190423001.1 (Qiu, 2019).
Readers interested in running the model should follow the instructions at http://orchidee.ipsl.fr/index.php/you-orchidee (last access: July 2019
The supplement related to this article is available online at: https://doi.org/10.5194/gmd-12-2961-2019-supplement.
CQ implemented peatland water and carbon processes into ORCHIDEE-MICT, introduced the dynamic peatland area module, and performed the simulation. DZ contributed to ensuring consistency between the peatland modules and various other processes and modules in the model. PC conceived the project. PC, BG, GK, DZ, and CQ contributed to improving the research and interpreting results. SP assisted in implementing the cost-efficient TOPMODEL. AT and AD provided the dataset of wetland areas. SP, AT, AD, and AH contributed to the calibration of the TOPMODEL. All authors contributed to the paper.
The authors declare that they have no conflict of interest.
This study was supported by the European Research Council Synergy grant ERC-2013-SyG-610028 IMBALANCE-P. Adam Hastie received financial support from the European Union's Horizon 2020 research and innovation programme under the Marie Skłodowska-Curie grant agreement no. 643052 (C-CASCADES project). We thank Zicheng Yu for providing the peatland distribution map.
This research has been supported by the European Research Council Synergy (grant ERC-2013-SyG-610028 IMBALANCE-P).
This paper was edited by Tomomichi Kato and reviewed by Benjamin Stocker and Joe Melton.
Alexandrov, G. A., Brovkin, V. A., and Kleinen, T.: The influence of climate on peatland extent in Western Siberia since the Last Glacial Maximum, Sci. Rep., 6, 24784, https://doi.org/10.1038/srep24784, 2016.
Aurela, M., Riutta, T., Laurila, T., Tuovinen, J., Vesala, T., Tuittila, E., Rinne, J., Haapanala, S., and Laine, J.: CO2 exchange of a sedge fen in southern Finland – the impact of a drought period, Tellus B, 59, 826–837, 2007.
Batjes, N. H.: Harmonized soil property values for broad-scale modelling (WISE30sec) with estimates of global soil carbon stocks, Geoderma, 269, 61–68, https://doi.org/10.1016/j.geoderma.2016.01.034, 2016.
Bauer, I. E., Gignac, L. D., and Vitt, D. H.: Development of a peatland complex in boreal western Canada: lateral site expansion and local variability in vegetation succession and long-term peat accumulation, Can. J. Bot., 81, 833–847, 2003.
Belyea, L. R. and Clymo, R. S.: Feedback control of the rate of peat formation, P. Roy. Soc. B-Biol. Sci., 268, 1315–1321, https://doi.org/10.1098/rspb.2001.1665, 2001.
Belyea, L. R. and Malmer, N.: Carbon sequestration in peatland: Patterns and mechanisms of response to climate change, Glob. Change Biol., 10, 1043–1052, https://doi.org/10.1111/j.1529-8817.2003.00783.x, 2004.
Benavides, J. C.: The effect of drainage on organic matter accumulation and plant communities of high-altitude peatlands in the Colombian tropical Andes, Mires Peat, 15, 1–15, 2014.
Best, M. J., Pryor, M., Clark, D. B., Rooney, G. G., Essery, R. L. H., Ménard, C. B., Edwards, J. M., Hendry, M. A., Porson, A., Gedney, N., Mercado, L. M., Sitch, S., Blyth, E., Boucher, O., Cox, P. M., Grimmond, C. S. B., and Harding, R. J.: The Joint UK Land Environment Simulator (JULES), model description – Part 1: Energy and water fluxes, Geosci. Model Dev., 4, 677–699, https://doi.org/10.5194/gmd-4-677-2011, 2011.
Beven, K. J. and Kirkby, M. J.: A physically based, variable contributing area model of basin hydrology bassin versant, Hydrolog. Sci. J., 24, 43–69, 1979.
Borren, W., Bleuten, W., and Lapshina, E. D.: Holocene peat and carbon accumulation rates in the southern taiga of western Siberia, Quaternary Res., 61, 42–51, https://doi.org/10.1016/j.yqres.2003.09.002, 2004.
Carlson, K. M., Gerber, J. S., Mueller, N. D., Herrero, M., MacDonald, G. K., Brauman, K. A., Havlik, P., O'Connell, C. S., Johnson, J. A., Saatchi, S., and West, P. C.: Greenhouse gas emissions intensity of global croplands, Nat. Clim. Change, 1, 1–34, https://doi.org/10.1038/nclimate3158, 2016.
Carrara, P. E., Trimble, D. A., and Rubin, M.: Holocene treeline fluctuations in the northern San Juan Mountains, Colorado, USA, as indicated by radiocarbon-dated conifer wood, Arct. Alp. Res., 23, 233–246, 1991.
Charmen, D. J.: Blanket mire formation at the Cross Lochs, Sutherland, northern Scotland, Boreas, 21, 53–72, https://doi.org/10.1111/j.1502-3885.1992.tb00013.x, 1992.
Chaudhary, N., Miller, P. A., and Smith, B.: Modelling Holocene peatland dynamics with an individual-based dynamic vegetation model, Biogeosciences, 14, 2571–2596, https://doi.org/10.5194/bg-14-2571-2017, 2017a.
Chaudhary, N., Miller, P. A., and Smith, B.: Modelling past, present and future peatland carbon accumulation across the pan-Arctic region, Biogeosciences, 14, 4023–4044, https://doi.org/10.5194/bg-14-4023-2017, 2017b.
Chu, H., Gottgens, J. F., Chen, J., Sun, G., Desai, A. R., Ouyang, Z., Shao, C., and Czajkowski, K.: Climatic variability, hydrologic anomaly, and methane emission can turn productive freshwater marshes into net carbon sources, Glob. Change Biol., 21, 1165–1181, https://doi.org/10.1111/gcb.12760, 2015.
Ciais, P., Sabine, C., Bala, G., Bopp, L., Brovkin, V., Canadell, J., Chhabra, A., DeFries, R., Galloway, J., and Heimann, M.: Carbon and Other Biogeochemical Cycles, in: Climate Change 2013: The Physical Science Basis. Contribution of Working Group I to the Fifth Assessment Repo, edited by: Stocker, T. F., Qin, D., Plattner, G.-K., Tignor, M., Allen, S. K., Boschung, J., Nauels, A., Xia, Y., Bex, V., and Midgley, P. M., Cambridge University Press, Cambridge, UK and New York, NY, USA, 2013.
Clymo, R. S., Turunen, J., and Tolonen, K.: Carbon Accumulation in Peatland, Oikos, 81, 368–388, https://doi.org/10.2307/3547057, 1998.
Cresto Aleina, F., Runkle, B. R. K., Kleinen, T., Kutzbach, L., Schneider, J., and Brovkin, V.: Modeling micro-topographic controls on boreal peatland hydrology and methane fluxes, Biogeosciences, 12, 5689–5704, https://doi.org/10.5194/bg-12-5689-2015, 2015.
Dahl, T. E.: Status and trends of wetlands in the conterminous United States 2004 to 2009, US Department of the Interior, US Fish and Wildlife Service, Fisheries and Habitat Conservation, Washington, D.C., USA, 2011.
De Rosnay, P., Bruen, M., and Polcher, J.: Sensitivity of surface fluxes to the number of layers in the soil model used in GCMs, Geophys. Res. Lett., 27, 3329–3332, https://doi.org/10.1029/2000GL011574, 2000.
De Rosnay, P., Polcher, J., Bruen, M.. and Laval, K.: Impact of a physically based soil water flow and soil-plant interaction representation for modeling large-scale land surface processes, J. Geophys. Res.-Atmos., 107, 4118, https://doi.org/10.1029/2001JD000634, 2002.
Dyke, A. S.: An outline of North American deglaciation with emphasis on central and northern Canada, Dev. Quat. Sci., 2, 373–424, https://doi.org/10.1016/S1571-0866(04)80209-4, 2004.
Fan, Y., Li, H., and Miguez-Macho, G.: Global patterns of groundwater table depth, Science, 339, 940–943, 2013.
Fan, Z., Neff, J. C., Waldrop, M. P., Ballantyne, A. P., and Turetsky, M. R.: Transport of oxygen in soil pore-water systems: implications for modeling emissions of carbon dioxide and methane from peatlands, Biogeochemistry, 121, 455–470, https://doi.org/10.1007/s10533-014-0012-0, 2014.
FAO: FAO, IIASA, ISRIC, ISSCAS and JRC: Harmonized World Soil Database (version 1.2), Tech. rep., FAO, Rome, Italy and IIASA, Laxenburg, Austria, 2012.
Flanagan, L. B. and Syed, K. H.: Stimulation of both photosynthesis and respiration in response to warmer and drier conditions in a boreal peatland ecosystem, Glob. Change Biol., 17, 2271–2287, https://doi.org/10.1111/j.1365-2486.2010.02378.x, 2011.
Fluet-Chouinard, E., Lehner, B., Rebelo, L.-M., Papa, F., and Hamilton, S. K.: Development of a global inundation map at high spatial resolution from topographic downscaling of coarse-scale remote sensing data, Remote Sens. Environ., 158, 348–361, 2015.
Frolking, S., Roulet, N. T., Tuittila, E., Bubier, J. L., Quillet, A., Talbot, J., and Richard, P. J. H.: A new model of Holocene peatland net primary production, decomposition, water balance, and peat accumulation, Earth Syst. Dynam., 1, 1–21, https://doi.org/10.5194/esd-1-1-2010, 2010.
Gallego-Sala, A. V., Charman, D. J., Harrison, S. P., Li, G., and Prentice, I. C.: Climate-driven expansion of blanket bogs in Britain during the Holocene, Clim. Past, 12, 129–136, https://doi.org/10.5194/cp-12-129-2016, 2016.
Gignac, L. D., Halsey, L. A., and Vitt, D. H.: A bioclimatic model for the distribution of Sphagnum-dominated peatlands in North America under present climatic conditions, J. Biogeogr., 27, 1139–1151, 2000.
Glaser, P. H., Hansen, B. C. S., Siegel, D. I., Reeve, A. S., and Morin, P. J.: Rates, pathways and drivers for peatland development in the Hudson Bay Lowlands, northern Ontario, Canada, J. Ecol., 92, 1036–1053, https://doi.org/10.1111/j.0022-0477.2004.00931.x, 2004a.
Glaser, P. H., Siegel, D. I., Reeve, A. S., Janssens, J. A. N. A., and Janecky, D. R.: Tectonic drivers for vegetation patterning and landscape evolution in the Albany River region of the Hudson Bay, J. Ecol., 92, 1054–1070, 2004b.
Gorham, E.: Northern peatlands: Role in the carbon cycle and probably responses to climate warming, Ecol. Appl., 1, 182–195, https://doi.org/10.2307/1941811, 1991.
Gorham, E., Lehman, C., Dyke, A., Janssens, J., and Dyke, L.: Temporal and spatial aspects of peatland initiation following deglaciation in North America, Quaternary Sci. Rev., 26, 300–311, https://doi.org/10.1016/j.quascirev.2006.08.008, 2007.
Gorham, E., Lehman, C., Dyke, A., Clymo, D., and Janssens, J.: Long-term carbon sequestration in North American peatlands, Quaternary Sci. Rev., 58, 77–82, https://doi.org/10.1016/j.quascirev.2012.09.018, 2012.
Gouttevin, I., Krinner, G., Ciais, P., Polcher, J., and Legout, C.: Multi-scale validation of a new soil freezing scheme for a land-surface model with physically-based hydrology, The Cryosphere, 6, 407–430, https://doi.org/10.5194/tc-6-407-2012, 2012.
Guimberteau, M., Ducharne, A., Ciais, P., Boisier, J. P., Peng, S., De Weirdt, M., and Verbeeck, H.: Testing conceptual and physically based soil hydrology schemes against observations for the Amazon Basin, Geosci. Model Dev., 7, 1115–1136, https://doi.org/10.5194/gmd-7-1115-2014, 2014.
Guimberteau, M., Zhu, D., Maignan, F., Huang, Y., Yue, C., Dantec-Nédélec, S., Ottlé, C., Jornet-Puig, A., Bastos, A., Laurent, P., Goll, D., Bowring, S., Chang, J., Guenet, B., Tifafi, M., Peng, S., Krinner, G., Ducharne, A., Wang, F., Wang, T., Wang, X., Wang, Y., Yin, Z., Lauerwald, R., Joetzjer, E., Qiu, C., Kim, H., and Ciais, P.: ORCHIDEE-MICT (v8.4.1), a land surface model for the high latitudes: model description and validation, Geosci. Model Dev., 11, 121–163, https://doi.org/10.5194/gmd-11-121-2018, 2018.
Gumbricht, T., Roman-Cuesta, R. M., Verchot, L., Herold, M., Wittmann, F., Householder, E., Herold, N., and Murdiyarso, D.: An expert system model for mapping tropical wetlands and peatlands reveals South America as the largest contributor, Glob. Change Biol., 23, 3581–3599, https://doi.org/10.1111/gcb.13689, 2017.
Halsey, L. A., Vitt, D. H., and Gignac, L. D.: Sphagnum-dominated peatlands in North America since the last glacial maximum: their occurrence and extent, Bryologist, 334–352, 2000.
Herold, M., Van Groenestijn, A., Kooistra, L., Kalogirou, V., and Arino, O.: Land Cover CCI, Product User Guide Version 2.0, available at: http://maps.elie.ucl.ac.be/CCI/viewer/download/ESACCI-LC-Ph2-PUGv2_2.0.pdf (last access: 10 July 2019), 2015.
Hugelius, G., Tarnocai, C., Broll, G., Canadell, J. G., Kuhry, P., and Swanson, D. K.: The Northern Circumpolar Soil Carbon Database: spatially distributed datasets of soil coverage and soil carbon storage in the northern permafrost regions, Earth Syst. Sci. Data, 5, 3–13, https://doi.org/10.5194/essd-5-3-2013, 2013.
Hughes, A. L. C., Gyllencreutz, R., Lohne, Ø. S., Mangerud, J., and Svendsen, J. I.: The last Eurasian ice sheets – a chronological database and time-slice reconstruction, DATED-1, Boreas, 45, 1–45, https://doi.org/10.1111/bor.12142, 2016.
Jackson, R. B., Lajtha, K., Crow, S. E., Hugelius, G., Kramer, M. G., and Piñeiro, G.: The Ecology of Soil Carbon: Pools, Vulnerabilities, and Biotic and Abiotic Controls, Annu. Rev. Ecol. Evol. Syst., 48, 419–445, https://doi.org/10.1146/annurev-ecolsys-112414-054234, 2017.
Jafarov, E. and Schaefer, K.: The importance of a surface organic layer in simulating permafrost thermal and carbon dynamics, The Cryosphere, 10, 465–475, https://doi.org/10.5194/tc-10-465-2016, 2016.
Jenkinson, D. S. and Coleman, K.: The turnover of organic carbon in subsoils. Part 2. Modelling carbon turnover, Eur. J. Soil Sci., 59, 400–413, https://doi.org/10.1111/j.1365-2389.2008.01026.x, 2008.
Joosten, H.: The Global Peatland CO2 picture. Peatland status and drainage related emissions in all countries of the world, Wetl. Int. Ede, 2010, available at: https://www.wetlands.org/publications/the-global-peatland-co2-picture/ (last access: 10 July 2019), 2010.
Kirschbaum, M. U. F.: The Sensitivity of C3 Photosynthesis to Increasing CO2 Concentration – a Theoretical-Analysis of Its Dependence on Temperature and Background CO2 Concentration, Plant Cell Environ., 17, 747–754, https://doi.org/10.1111/j.1365-3040.1994.tb00167.x, 1994.
Kleinen, T., Brovkin, V., and Schuldt, R. J.: A dynamic model of wetland extent and peat accumulation: results for the Holocene, Biogeosciences, 9, 235–248, https://doi.org/10.5194/bg-9-235-2012, 2012.
Köchy, M., Hiederer, R., and Freibauer, A.: Global distribution of soil organic carbon – Part 1: Masses and frequency distributions of SOC stocks for the tropics, permafrost regions, wetlands, and the world, SOIL, 1, 351–365, https://doi.org/10.5194/soil-1-351-2015, 2015.
Koven, C. D., Ringeval, B., Friedlingstein, P., Ciais, P., Cadule, P., Khvorostyanov, D., Krinner, G., and Tarnocai, C.: Permafrost carbon-climate feedbacks accelerate global warming, P. Natl. Acad. Sci. USA, 108, 14769–14774, 2011.
Koven, C. D., Riley, W. J., Subin, Z. M., Tang, J. Y., Torn, M. S., Collins, W. D., Bonan, G. B., Lawrence, D. M., and Swenson, S. C.: The effect of vertically resolved soil biogeochemistry and alternate soil C and N models on C dynamics of CLM4, Biogeosciences, 10, 7109–7131, https://doi.org/10.5194/bg-10-7109-2013, 2013.
Kremenetski, K. V., Velichko, A. A., Borisova, O. K., MacDonald, G. M., Smith, L. C., Frey, K. E., and Orlova, L. A.: Peatlands of the Western Siberian lowlands: Current knowledge on zonation, carbon content and Late Quaternary history, Quaternary Sci. Rev., 22, 703–723, https://doi.org/10.1016/S0277-3791(02)00196-8, 2003.
Krinner, G., Viovy, N., de Noblet-Ducoudré, N., Ogée, J., Polcher, J., Friedlingstein, P., Ciais, P., Sitch, S., and Prentice, I. C.: A dynamic global vegetation model for studies of the coupled atmosphere-biosphere system, Global Biogeochem. Cy., 19, 1–33, https://doi.org/10.1029/2003GB002199, 2005.
Kuhry, P. and Turunen, J.: The postglacial development of boreal and subarctic peatlands, in: Boreal peatland ecosystems, 25–46, Springer, New York, USA, 2006.
Lafleur, P. M., Moore, T. R., Roulet, N. T., and Frolking, S.: Ecosystem respiration in a cool temperate bog depends on peat temperature but not water table, Ecosystems, 8, 619–629, https://doi.org/10.1007/s10021-003-0131-2, 2005.
Largeron, C., Krinner, G., Ciais, P., and Brutel-Vuilmet, C.: Implementing northern peatlands in a global land surface model: description and evaluation in the ORCHIDEE high-latitude version model (ORC-HL-PEAT), Geosci. Model Dev., 11, 3279–3297, https://doi.org/10.5194/gmd-11-3279-2018, 2018.
Lawson, I. T., Jones, T. D., Kelly, T. J., Coronado, E. N. H., and Roucoux, K. H.: The geochemistry of Amazonian peats, Wetlands, 34, 905–915, 2014.
Leifeld, J. and Menichetti, L.: The underappreciated potential of peatlands in global climate change mitigation strategies, Nat. Commun., 9, 1071, https://doi.org/10.1038/s41467-018-03406-6, 2018.
Lewis, C., Albertson, J., Xu, X., and Kiely, G.: Spatial variability of hydraulic conductivity and bulk density along a blanket peatland hillslope, Hydrol. Process., 26, 1527–1537, https://doi.org/10.1002/hyp.8252, 2012.
Loisel, J., Yu, Z., Beilman, D. W., Camill, P., Alm, J., Amesbury, M. J., Anderson, D., Andersson, S., Bochicchio, C., Barber, K., Belyea, L. R., Bunbury, J., Chambers, F. M., Charman, D. J., De Vleeschouwer, F., Fia kiewicz-Kozie, B., Finkelstein, S. A., Ga ka, M., Garneau, M., Hammarlund, D., Hinchcliffe, W., Holmquist, J., Hughes, P., Jones, M. C., Klein, E. S., Kokfelt, U., Korhola, A., Kuhry, P., Lamarre, A., Lamentowicz, M., Large, D., Lavoie, M., MacDonald, G., Magnan, G., Makila, M., Mallon, G., Mathijssen, P., Mauquoy, D., McCarroll, J., Moore, T. R., Nichols, J., O'Reilly, B., Oksanen, P., Packalen, M., Peteet, D., Richard, P. J., Robinson, S., Ronkainen, T., Rundgren, M., Sannel, A. B. K., Tarnocai, C., Thom, T., Tuittila, E.-S., Turetsky, M., Valiranta, M., van der Linden, M., van Geel, B., van Bellen, S., Vitt, D., Zhao, Y., and Zhou, W.: A database and synthesis of northern peatland soil properties and Holocene carbon and nitrogen accumulation, Holocene, 24, 1028–1042, https://doi.org/10.1177/0959683614538073, 2014.
Lund, M., Christensen, T. R., Lindroth, A., and Schubert, P.: Effects of drought conditions on the carbon dioxide dynamics in a temperate peatland, Environ. Res. Lett., 7, 45704, https://doi.org/10.1088/1748-9326/7/4/045704, 2012.
Macdonald, G. M., Beilman, D. W., Kremenetski, K. V, Sheng, Y., Smith, L. C., and Velichko, A. A.: Rapid early development of circumarctic peatlands and atmospheric CH4 and CO2 variations, Science, 314, 285–288, https://doi.org/10.1126/science.1131722, 2006.
Madole, R. F.: Bog Stratigraphy, Radiocarbon-Dates, and Pinedale to Holocene Glacial History in Front Range, Colorado, J. Res. Us Geol. Surv., 4, 163–169, 1976.
Marcott, S. A., Shakun, J. D., Clark, P. U., and Mix, A. C.: A Reconstruction of Regional and Global Temperature for the Past 11,300 Years, Science, 339, 1198–1201, https://doi.org/10.1126/science.1228026, 2013.
Mathijssen, P. J. H., Kähkölä, N., Tuovinen, J. P., Lohila, A., Minkkinen, K., Laurila, T., and Väliranta, M.: Lateral expansion and carbon exchange of a boreal peatland in Finland resulting in 7000 years of positive radiative forcing, J. Geophys. Res.-Biogeo., 122, 562–577, https://doi.org/10.1002/2016JG003749, 2017.
McCarter, C. P. R. and Price, J. S.: The hydrology of the Bois-des-Bel bog peatland restoration: 10 years post-restoration, Ecol. Eng., 55, 73–81, https://doi.org/10.1016/j.ecoleng.2013.02.003, 2013.
Melton, J. R., Wania, R., Hodson, E. L., Poulter, B., Ringeval, B., Spahni, R., Bohn, T., Avis, C. A., Beerling, D. J., Chen, G., Eliseev, A. V., Denisov, S. N., Hopcroft, P. O., Lettenmaier, D. P., Riley, W. J., Singarayer, J. S., Subin, Z. M., Tian, H., Zürcher, S., Brovkin, V., van Bodegom, P. M., Kleinen, T., Yu, Z. C., and Kaplan, J. O.: Present state of global wetland extent and wetland methane modelling: conclusions from a model inter-comparison project (WETCHIMP), Biogeosciences, 10, 753–788, https://doi.org/10.5194/bg-10-753-2013, 2013.
Mikaloff Fletcher, S. E., Tans, P. P., Bruhwiler, L. M., Miller, J. B., and Heimann, M.: CH4 sources estimated from atmospheric observations of CH4 and its 13C/12C isotopic ratios: 1. Inverse modeling of source processes, Global Biogeochem. Cy., 18, GB4005, https://doi.org/10.1029/2004GB002224, 2004.
Morris, P. J., Waddington, J. M., Benscoter, B. W., and Turetsky, M. R.: Conceptual frameworks in peatland ecohydrology: looking beyond the two-layered (acrotelm–catotelm) model, Ecohydrology, 4, 1–11, 2011.
Moyano, F. E., Vasilyeva, N., Bouckaert, L., Cook, F., Craine, J., Curiel Yuste, J., Don, A., Epron, D., Formanek, P., Franzluebbers, A., Ilstedt, U., Kätterer, T., Orchard, V., Reichstein, M., Rey, A., Ruamps, L., Subke, J.-A., Thomsen, I. K., and Chenu, C.: The moisture response of soil heterotrophic respiration: interaction with soil properties, Biogeosciences, 9, 1173–1182, https://doi.org/10.5194/bg-9-1173-2012, 2012.
Nachtergaele, F.: The classification of Leptosols in the World Reference Base for Soil Resources, in: 19th World Congress of Soil Science, Soil Solutions for a Changing World, 1–6 August 2010, Brisbane, Australia, 1–6, 2010.
Oleszczuk, R. and Truba, M.: The analysis of some physical properties of drained peat-moorsh soil Layers, Ann. Warsaw Univ. Life Sci. L. Reclam., 45, 41–48, 2013.
Packalen, M. S., Finkelstein, S. A., and McLaughlin, J. W.: Carbon storage and potential methane production in the Hudson Bay Lowlands since mid-Holocene peat initiation, Nat. Commun., 5, 4078, https://doi.org/10.1038/ncomms5078, 2014.
Packalen, M. S., Finkelstein, S. A., and McLaughlin, J. W.: Climate and peat type in relation to spatial variation of the peatland carbon mass in the Hudson Bay Lowlands, Canada, J. Geophys. Res.-Biogeo., 121, 1104–1117, https://doi.org/10.1002/2015JG002938, 2016.
Parish, F., Sirin, A., Charman, D., Joosten, H., Minaeva, T., and Silvius, M. (Eds.): Assessment of Peatlands, Biodiversity and Climate Change. Global Environment Centre, Kuala Lumpur, Malaysia, and Wetlands International, Wageningen, the Netherlands, 2008.
Parmentier, F. J. W., van der Molen, M. K., de Jeu, R. A. M., Hendriks, D. M. D., and Dolman, A. J.: CO2 fluxes and evaporation on a peatland in the Netherlands appear not affected by water table fluctuations, Agr. Forest Meteorol., 149, 1201–1208, https://doi.org/10.1016/j.agrformet.2008.11.007, 2009.
Peltier, W. R.: Global glacial isostasy and the surface of the ice-age Earth: the ICE-5G (VM2) model and GRACE, Annu. Rev. Earth Pl. Sc., 32, 111–149, 2004.
Portmann, F. T., Siebert, S., and Döll, P.: MIRCA2000-Global monthly irrigated and rainfed crop areas around the year 2000: A new high-resolution data set for agricultural and hydrological modeling, Global Biogeochem. Cy., 24, GB1011, https://doi.org/10.1029/2008GB003435, 2010.
Price, J. S., Cagampan, J., and Kellner, E.: Assessment of peat compressibility: Is there an easy way?, Hydrol. Process., 19, 3469–3475, https://doi.org/10.1002/hyp.6068, 2005.
Prigent, C., Papa, F., Aires, F., Rossow, W. B., and Matthews, E.: Global inundation dynamics inferred from multiple satellite observations, 1993–2000, J. Geophys. Res.-Atmos., 112, 1–13, https://doi.org/10.1029/2006JD007847, 2007.
Prigent, C., Papa, F., Aires, F., Jimenez, C., Rossow, W. B., and Matthews, E.: Changes in land surface water dynamics since the 1990s and relation to population pressure, Geophys. Res. Lett., 39, 2–6, https://doi.org/10.1029/2012GL051276, 2012.
Qiu, C.: ORCHIDEE_PEAT_V2 revision 5488, https://doi.org/10.14768/20190423001.1, 2019.
Qiu, C., Zhu, D., Ciais, P., Guenet, B., Krinner, G., Peng, S., Aurela, M., Bernhofer, C., Brümmer, C., Bret-Harte, S., Chu, H., Chen, J., Desai, A. R., Dušek, J., Euskirchen, E. S., Fortuniak, K., Flanagan, L. B., Friborg, T., Grygoruk, M., Gogo, S., Grünwald, T., Hansen, B. U., Holl, D., Humphreys, E., Hurkuck, M., Kiely, G., Klatt, J., Kutzbach, L., Largeron, C., Laggoun-Défarge, F., Lund, M., Lafleur, P. M., Li, X., Mammarella, I., Merbold, L., Nilsson, M. B., Olejnik, J., Ottosson-Löfvenius, M., Oechel, W., Parmentier, F.-J. W., Peichl, M., Pirk, N., Peltola, O., Pawlak, W., Rasse, D., Rinne, J., Shaver, G., Schmid, H. P., Sottocornola, M., Steinbrecher, R., Sachs, T., Urbaniak, M., Zona, D., and Ziemblinska, K.: ORCHIDEE-PEAT (revision 4596), a model for northern peatland CO2, water, and energy fluxes on daily to annual scales, Geosci. Model Dev., 11, 497–519, https://doi.org/10.5194/gmd-11-497-2018, 2018.
Ringeval, B., Decharme, B., Piao, S. L., Ciais, P., Papa, F., de Noblet-Ducoudré, N., Prigent, C., Friedlingstein, P., Gouttevin, I., Koven, C., and Ducharne, A.: Modelling sub-grid wetland in the ORCHIDEE global land surface model: evaluation against river discharges and remotely sensed data, Geosci. Model Dev., 5, 941–962, https://doi.org/10.5194/gmd-5-941-2012, 2012.
Roulet, N. T., Lafleur, P. M., Richard, P. J. H., Moore, T. R., Humphreys, E. R., and Bubier, J.: Contemporary carbon balance and late Holocene carbon accumulation in a northern peatland, Glob. Change Biol., 13, 397–411, https://doi.org/10.1111/j.1365-2486.2006.01292.x, 2007.
Seppälä, M.: Palsa mires in Finland, Finnish Environ., 23, 155–162, 2006.
Smith, L. C.: Siberian Peatlands a Net Carbon Sink and Global Methane Source Since the Early Holocene, Science, 303, 353–356, https://doi.org/10.1126/science.1090553, 2004.
Spahni, R., Joos, F., Stocker, B. D., Steinacher, M., and Yu, Z. C.: Transient simulations of the carbon and nitrogen dynamics in northern peatlands: from the Last Glacial Maximum to the 21st century, Clim. Past, 9, 1287–1308, https://doi.org/10.5194/cp-9-1287-2013, 2013.
Stocker, B. D., Spahni, R., and Joos, F.: DYPTOP: a cost-efficient TOPMODEL implementation to simulate sub-grid spatio-temporal dynamics of global wetlands and peatlands, Geosci. Model Dev., 7, 3089–3110, https://doi.org/10.5194/gmd-7-3089-2014, 2014.
Sulman, B. N., Desai, A. R., Cook, B. D., Saliendra, N., and Mackay, D. S.: Contrasting carbon dioxide fluxes between a drying shrub wetland in Northern Wisconsin, USA, and nearby forests, Biogeosciences, 6, 1115–1126, https://doi.org/10.5194/bg-6-1115-2009, 2009.
Tfaily, M. M., Cooper, W. T., Kostka, J. E., Chanton, P. R., Schadt, C. W., Hanson, P. J., Iversen, C. M., and Chanton, J. P.: Organic matter transformation in the peat column at Marcell Experimental Forest: humification and vertical stratification, J. Geophys. Res.-Biogeo., 119, 661–675, 2014.
Tifafi, M., Camino-Serrano, M., Hatté, C., Morras, H., Moretti, L., Barbaro, S., Cornu, S., and Guenet, B.: The use of radiocarbon 14C to constrain carbon dynamics in the soil module of the land surface model ORCHIDEE (SVN r5165), Geosci. Model Dev., 11, 4711–4726, https://doi.org/10.5194/gmd-11-4711-2018, 2018.
Tiner Jr., R. W.: Wetlands of the United States: current status and recent trends, United States Fish and Wildlife Service, Washington, D.C., USA, 1984.
Tootchi, A., Jost, A., and Ducharne, A.: Multi-source global wetland maps combining surface water imagery and groundwater constraints, Earth Syst. Sci. Data, 11, 189–220, https://doi.org/10.5194/essd-11-189-2019, 2019.
Turunen, J., Tahvanainen, T., Tolonen, K., and Pitkänen, A.: Carbon accumulation in West Siberian mires, Russia, Global Biogeochem. Cy., 15, 285–296, https://doi.org/10.1029/2000GB001312, 2001.
Turunen, J., Tomppo, E., Tolonen, K., and Reinikainen, A.: Estimating carbon accumulation rates of undrained mires in Finland – application to boreal and subarctic regions, Holocene, 12, 69–80, https://doi.org/10.1191/0959683602hl522rp, 2002.
Wania, R., Ross, I., and Prentice, I. C.: Integrating peatlands and permafrost into a dynamic global vegetation model: 1. Evaluation and sensitivity of physical land surface processes, Global Biogeochem. Cy., 23, 1–19, https://doi.org/10.1029/2008GB003412, 2009a.
Wania, R., Ross, I. and Prentice, I. C.: Integrating peatlands and permafrost into a dynamic global vegetation model: 2. Evaluation and sensitivity of vegetation and carbon cycle processes, Global Biogeochem. Cy., 23, 1–15, https://doi.org/10.1029/2008GB003413, 2009b.
Wu, Y., Verseghy, D. L., and Melton, J. R.: Integrating peatlands into the coupled Canadian Land Surface Scheme (CLASS) v3.6 and the Canadian Terrestrial Ecosystem Model (CTEM) v2.0, Geosci. Model Dev., 9, 2639–2663, https://doi.org/10.5194/gmd-9-2639-2016, 2016.
Wu, Y., Chan, E., Melton, J. R., and Verseghy, D. L.: A map of global peatland distribution created using machine learning for use in terrestrial ecosystem and earth system models, Geosci. Model Dev. Discuss., https://doi.org/10.5194/gmd-2017-152, 2017.
Xu, J., Morris, P. J., Liu, J., and Holden, J.: PEATMAP: Refining estimates of global peatland distribution based on a meta-analysis, Catena, 160, 134–140, https://doi.org/10.1016/j.catena.2017.09.010, 2018.
Yu, Z.: Holocene carbon flux histories of the world's peatlands: Global carbon-cycle implications, Holocene, 21, 761–774, https://doi.org/10.1177/0959683610386982, 2011.
Yu, Z., Campbell, I. D., Campbell, C., Vitt, D. H., Bond, G. C., and Apps, M. J.: Carbon sequestration in western Canadian peat highly sensitive to Holocene wet-dry climate cycles at millennial timescales, Holocene, 13, 801–808, https://doi.org/10.1191/0959683603hl667ft, 2003a.
Yu, Z., Vitt, D. H., Campbell, I. D., and Apps, M. J.: Understanding Holocene peat accumulation pattern of continental fens in western Canada, Can. J. Bot., 81, 267–282, 2003b.
Yu, Z., Beilman, D. W., and Jones, M. C.: Sensitivity of Northern Peatland Carbon Dynamics to Holocene Climate Change, Carbon Cycl. North. Peatlands, 184, 55–69, https://doi.org/10.1029/2008GM000822, 2009.
Yu, Z., Loisel, J., Brosseau, D. P., Beilman, D. W., and Hunt, S. J.: Global peatland dynamics since the Last Glacial Maximum, Geophys. Res. Lett., 37, 1–5, https://doi.org/10.1029/2010GL043584, 2010.
Yu, Z. C.: Northern peatland carbon stocks and dynamics: a review, Biogeosciences, 9, 4071–4085, https://doi.org/10.5194/bg-9-4071-2012, 2012.
Zaccone, C., Sanei, H., Outridge, P. M., and Miano, T. M.: Studying the humification degree and evolution of peat down a Holocene bog profile (Inuvik, NW Canada): A petrological and chemical perspective, Org. Geochem., 42, 399–408, https://doi.org/10.1016/j.orggeochem.2011.02.004, 2011.
Zhang, Z., Zimmermann, N. E., Kaplan, J. O., and Poulter, B.: Modeling spatiotemporal dynamics of global wetlands: comprehensive evaluation of a new sub-grid TOPMODEL parameterization and uncertainties, Biogeosciences, 13, 1387–1408, https://doi.org/10.5194/bg-13-1387-2016, 2016.
Zhu, D., Peng, S. S., Ciais, P., Viovy, N., Druel, A., Kageyama, M., Krinner, G., Peylin, P., Ottlé, C., Piao, S. L., Poulter, B., Schepaschenko, D., and Shvidenko, A.: Improving the dynamics of Northern Hemisphere high-latitude vegetation in the ORCHIDEE ecosystem model, Geosci. Model Dev., 8, 2263–2283, https://doi.org/10.5194/gmd-8-2263-2015, 2015.