the Creative Commons Attribution 4.0 License.
the Creative Commons Attribution 4.0 License.
 | 08 Jul 2019
Modeling extreme precipitation over East China with a global variable-resolution modeling framework (MPASv5.2): impacts of resolution and physics
Chun Zhao
Mingyue Xu
Yu Wang
Meixin Zhang
Jianping Guo
Zhiyuan Hu
L. Ruby Leung
Michael Duda
William Skamarock
The non-hydrostatic atmospheric Model for Prediction Across Scales (MPAS-A), a global variable-resolution modeling framework, is applied at a range of resolutions from hydrostatic (60, 30, 16 km) to non-hydrostatic (4 km) scales using regional refinement over East Asia to simulate an extreme precipitation event. The event is triggered by a typical wind shear in the lower layer of the Meiyu front in East China on 25–27 June 2012 during the East Asian summer monsoon season. The simulations are evaluated using ground observations and reanalysis data. The simulated distribution and intensity of precipitation are analyzed to investigate the sensitivity to model configuration, resolution, and physics parameterizations. In general, simulations using global uniform-resolution and variable-resolution meshes share similar characteristics of precipitation and wind in the refined region with comparable horizontal resolution. Further experiments at multiple resolutions reveal the significant impacts of horizontal resolution on simulating the distribution and intensity of precipitation and updrafts. More specifically, simulations at coarser resolutions shift the zonal distribution of the rain belt and produce weaker heavy precipitation centers that are misplaced relative to the observed locations. In comparison, simulations employing 4 km cell spacing produce more realistic features of precipitation and wind. The difference among experiments in modeling rain belt features is mainly due to the difference in simulated wind shear formation and evolution during this event. Sensitivity experiments show that cloud microphysics have significant effects on modeling precipitation at non-hydrostatic scales, but their impacts are relatively small compared to that of convective parameterizations for simulations at hydrostatic scales. This study provides the first evidence supporting the use of convection-permitting global variable-resolution simulations for studying and improving forecasting of extreme precipitation over East China and motivates the need for a more systematic study of heavy precipitation events and the impacts of physics parameterizations and topography in the future.
The key points are as follows.
-
Model for Prediction Across Scales (MPAS) simulations at global uniform and variable resolutions share similar characteristics of precipitation and wind in the refined region.
-
Numerical experiments reveal significant impacts of resolution on simulating the distribution and intensity of precipitation and updrafts.
-
This study provides evidence supporting the use of convection-permitting global variable-resolution simulation to study extreme precipitation.
- Article
(7053 KB) - Full-text XML
-
Supplement
(4592 KB) - BibTeX
- EndNote


Extreme precipitation receives great attention because of its potential for generating floods, landslides, and other hazardous conditions. East China, occupied by more than 70 % of the total population of China, is one of the areas with the most frequent, intense, and extreme precipitation around the world (Zhai et al., 2005; Z. Li et al., 2016). The socioeconomic development in regions such as the Yangtze River Delta (YRD) in East China is remarkably vulnerable to extreme precipitation, making accurate forecasts of extreme precipitation of great importance. The spatiotemporal variations of extreme precipitation over East China and their possible causes and underlying mechanisms have been investigated in many previous studies using observations and models (e.g., Ding et al., 2008; Zhang and Zhai, 2011; Li et al., 2013; W. Li et al., 2016; Q. Zhang et al., 2011, 2017; Hui et al., 2015; Liu et al., 2015; Lin and Wang, 2016; Zhao et al., 2016; Zheng et al., 2016). Zhang et al. (2017) established a relationship between the western North Pacific subtropical high (WNPSH) and precipitation over East China and explored the underlying processes. Liu et al. (2015) analyzed data from meteorological stations in East China and found significant increases in heavy precipitation at both rural and urban stations during 1955–2011. This enhanced precipitation intensity in East China has been partly attributed to localized daytime precipitation events (Guo et al., 2017). Recently, a regional climate model was used to simulate the regional climate extremes of China and noted large sensitivity of the simulated summer heavy precipitation over East China to the choice of cumulus parameterizations (Hui et al., 2015).
Numerical modeling is an important tool for understanding the underlying mechanisms of extreme precipitation and predicting the precipitation characteristics that contribute to environmental impacts. Although precipitation modeling has improved in the last decades, accurate prediction of extreme precipitation remains challenging because of the multiscale nonlinear interactions of processes that generate heavy rainfall (Fritsch and Carbone, 2004; L. Zhang et al., 2011; Sukovich et al., 2014). Although not a panacea for weather and climate modeling (NRC, 2012), previous studies suggested that increasing grid resolution could significantly improve the modeling of extreme precipitation because the impacts of topography, land use, land–atmosphere interaction, and other important processes are better resolved (e.g., Giorgi and Mearns, 1991; Giorgi and Marinucci, 1996; Leung and Qian, 2003; Bacmeister et al., 2014; ECMWF, 2016). With advances in computing and numerical modeling, convection-permitting modeling offers even more hope for reducing biases in simulating precipitation as convection and the strong vertical motion that are key to generating extreme precipitation are more explicitly resolved (Pedersen and Winther, 2005; Déqué et al., 2007; Gao et al., 2017; Yang et al., 2017; Prein et al., 2015, 2017). Previous studies suggested that convection-permitting modeling is needed for more accurate predictions of the timing, distribution, and intensity of extreme precipitation events over China (e.g., Zhang et al., 2013; Xu et al., 2015).
Most studies of convection-permitting simulations have adopted non-hydrostatic regional models developed for weather forecasting or regional climate modeling (Prein et al., 2015). Global models capable of simulating non-hydrostatic dynamics are not as common as regional models, but they offer some advantages including the ability to provide global forecasts or simulations while avoiding numerical issues associated with lateral boundary conditions that are major sources of uncertainty in regional modeling and also limit regional feedback to large-scale circulation (e.g., Giorgi and Mearns, 1991; Wang et al., 2004; Laprise, 2008; Leung et al., 2013; Prein et al., 2015). Non-hydrostatic global variable-resolution models, in particular, are useful as they allow convection-permitting simulations to be performed using regional refinement that significantly reduces computational cost compared to global convection-permitting modeling. Although global hydrostatic variable-resolution climate models, such as the variable-resolution version of Community Earth System Model, have been used in various applications in the last few years (e.g., Rauscher et al., 2013; Zarzycki et al., 2014, 2015; Rhoades et al., 2016; Huang et al., 2016; Wu et al., 2017; Gettelman, et al., 2018; Wang and Ullrich, 2018; Burakowski et al., 2019), so far few studies have used global non-hydrostatic variable-resolution models to investigate weather or climate simulations, particularly at convection-permitting scales (e.g., Prein et al., 2015). This study explores the use of a non-hydrostatic global variable-resolution model, the Model for Prediction Across Scales (MPAS), to model an extreme precipitation event in East China.
MPAS is a new multiscale modeling approach developed to take advantage of advances in mesh generation by employing the spherical centroidal Voronoi tessellations (SCVTs) (Du et al., 1999; Ringler et al., 2008). The SCVTs in MPAS enable local mesh refinement through the mesh generation process whereby a specified scalar density function determines higher- and lower-resolution regions in the mesh (see, e.g., Ju et al., 2011). Meshes can be configured with multiple high-resolution regions, and high resolution in one region does not need to be balanced by coarser resolution elsewhere. The underlying theory of SCVTs is robust concerning mesh properties and mesh generation. The atmospheric solver in MPAS (Skamarock et al., 2012) integrates the non-hydrostatic equations, and as such it is suitable for both weather and climate simulation, i.e., for both non-hydrostatic and hydrostatic flow simulation. MPAS has been evaluated and used in previous studies to investigate the resolution impact on modeling clouds and precipitation (O'Brien et al., 2013; Zhao et al., 2016), the structure of the intertropical convergence zone (ITCZ) (Landu et al., 2014), precipitation extremes (Yang et al., 2014), atmospheric river frequency (Hagos et al., 2015), the position and strength of the eddy-driven jet (Lu et al., 2015), global atmospheric predictability at convection-permitting scales (Judt, 2018), and regional climate modeling (Sakaguchi et al., 2015, 2016). Except for Zhao et al. (2016) and Judt (2018), the aforementioned studies used a hydrostatic version of MPAS applied at resolutions ranging from ∼25 to 200 km.
To date, few studies have examined the MPAS performance in modeling extreme precipitation events, particularly at grid scales of ∼10 km or less. In this study, we examine the MPAS performance in simulating a heavy precipitation event over the YRD region of East China and investigate its sensitivity to horizontal resolution and physics parameterizations. A heavy precipitation event that occurred on 25–27 June 2012 over the YRD region of East China is selected as it is one of the 10 heaviest precipitation events in 2012. This rainfall event was triggered by a typical southwest vortex in the middle and high troposphere and wind shear in the lower layer of the Meiyu front over East China during the East Asian summer monsoon (e.g., Xiang et al., 2013; Yao et al., 2017); it initiated around 12:00 UTC on 25 June. Most (more than two-thirds) heavy precipitation events over East China were caused by wind shear associated with the Meiyu front in recent decades (Yao et al., 2017). During this period, a heavy-precipitating system propagated along the Yangtze River and produced as much as 244 mm of precipitation in 24 h at some locations. The continuous precipitation led to 17 deaths and about RMB 3.68 billion in total damage; it affected more than 685 million people in the provinces of central and eastern China. Simulations are performed using MPAS (v5.2) with different cumulus and microphysics schemes. We first compare simulations produced using a global mesh with uniform resolution and a global variable-resolution mesh with a refined region that has the same resolution as that of the global uniform mesh. The goal is to demonstrate the fidelity of global variable-resolution modeling relative to the more computationally expensive global high-resolution modeling approach in regions that share the same horizontal resolution. The impacts of resolutions at hydrostatic scales (with convective parameterizations) and non-hydrostatic scales (i.e., convection-permitting scales with convection processes largely resolved) are also examined. The MPAS simulations are evaluated against weather station observations from the National Meteorological Information Center of the China Meteorological Administration (CMA). In addition, the modeling results are also compared with the forecasts produced by the Global Forecast System (GFS) of the National Centers for Environmental Prediction (NCEP).
The rest of the paper is organized as follows. Section 2 describes briefly the MPAS, the physics parameterizations, and the model configuration for this study, followed by a description of data for evaluation. The series of global uniform- and variable-resolution experiments are analyzed in Sect. 3. The findings are then summarized in Sect. 4.
2.1 Model and experiments
2.1.1 MPAS-Atmosphere (MPAS-A)
This study uses a fully compressible non-hydrostatic model (MPASv5.2) developed for weather prediction and climate applications. The non-hydrostatic dynamical core of MPAS is described in Skamarock et al. (2012). MPAS uses C-grid staggering of the prognostic variables and centroidal Voronoi meshes to discretize the sphere. The unstructured spherical centroidal Voronoi tessellation (SCVT) generation algorithms can provide global quasi-uniform-resolution meshes as well as variable-resolution meshes through the use of a single scalar density function, hence opening opportunities for regional downscaling and upscaling between mesoscales and non-hydrostatic scales to hydrostatic scales within a global framework. The vertical discretization uses the height-based hybrid terrain-following coordinate (Klemp, 2011), in which coordinate surfaces are progressively smoothed with height to remove the impact of small-scale terrain structures. The dynamical solver applies the split-explicit technique (Klemp et al., 2007) to integrate the flux-form compressible equations. The basic temporal discretization uses the third-order Runge–Kutta scheme and explicit time-splitting technique (Wicker and Skamarock, 2002), similar to that used in the Weather Research and Forecasting (WRF) model (Skamarock and Klemp, 2008). The scalar transport scheme used by MPAS on its Voronoi mesh is described in Skamarock and Gassmann (2011), and the monotonic option is used for all moist species. The extensive tests of MPAS using idealized and realistic cases verify that smooth transitions between the fine- and coarse-resolution regions of the mesh lead to no significant distortions of the atmospheric flow (e.g., Skamarock et al., 2012; Park et al., 2013).
In the current version (v5.2) of MPAS, there are a few physics schemes available. Three convective parameterizations can be used. The Kain–Fritsch (KF; Kain, 2004) and the new Tiedtke (NTD; Bechtold et al., 2004, 2008, 2014) schemes represent both deep and shallow convection using a mass flux approach with a convective available potential energy (CAPE) removal timescale (Kain, 2004). The third one, the GF scheme (Grell and Freitas, 2014), is based on the Grell–Dévényi ensemble scheme (Grell and Dévényi, 2002) using the multi-closure, multi-parameter, ensemble method but with improvements to smooth the transition to cloud-resolving scales following Arakawa et al. (2011). This scale awareness is critical for global variable-resolution simulation across hydrostatic (e.g., tens of kilometers) and non-hydrostatic scales (e.g., 4 km). Fowler et al. (2016) implemented the GF convective parameterization in MPAS and examined the impacts of horizontal resolution on the partitioning between convective-parameterized and grid-resolved precipitation using a variable-resolution mesh in which the horizontal resolution varies between hydrostatic scales (∼50 km) in the coarsest region of the mesh to non-hydrostatic scales (∼3 km) in the most refined region of the mesh. For cloud microphysics, the WSM6 (Hong and Lim, 2006) and Thompson (Thompson et al., 2008) schemes, both of which are bulk microphysical parameterizations, are selected and compared. Both schemes include six hydrometeor species: water vapor, cloud water, rain, cloud ice, snow, and graupel (Gettelman et al., 2019). The WSM6 scheme is a one-moment prognostic parameterization, while the Thompson scheme includes a two-moment prognostic parameterization for cloud ice and the single-moment parameterization for the other hydrometeor species. The two schemes apply the same formula for the gamma distribution of hydrometeor species: , where D is the particle diameter, N0 is the intercept parameter, μ is the shape factor, and λ is the slope parameter, although the parameter values or functions vary in the two schemes. The mass–size relationship in WSM6 and Thompson is also expressed in the same formula as m(D)=aDb. The mean falling speed is calculated as in WSM6 and in Thompson, respectively (Hong and Lim, 2006; Thompson et al., 2008). In the formula, the WSM6 scheme assumes a power-law fit between terminal velocity and particle size as in Locatelli and Hobbs (1974), while the Thompson scheme incorporates an exponential decay parameter to allow for a decrease in falling speed with increasing size (Molthan and Colle, 2012). Two options are available to represent the planetary boundary layer (PBL) processes: the Mellor–Yamada–Nakanishi–Niino (MYNN) scheme (Nakanishi and Niino, 2006, 2009) and the Yonsei University (YSU) scheme (Hong et al., 2006; Hong, 2010). This study used the MYNN scheme for the PBL processes. The Noah scheme (Chen and Dudhia, 2001) and the Rapid Radiative Transfer Model for GCMs (RRTMG) scheme (Mlawer et al., 1997; Iacono et al., 2000) were implemented, respectively, for the land surface and radiative transfer processes.
2.1.2 Numerical experiments
In this study, the height coordinate of MPAS is configured with 55 layers, and the model top is at 30 km. Multiple experiments are conducted with MPAS using quasi-uniform-resolution meshes and variable-resolution meshes. Two quasi-uniform-resolution meshes and three variable-resolution meshes are configured, similar to those shown in Fig. 1a and b that are coarsened to display the structure of the individual mesh cells. The quasi-uniform mesh has essentially the same mesh spacing globally, while the variable-resolution mesh has finer mesh spacing in the refined region with a transition zone between the fine- and coarse-resolution meshes. More details about the mesh generation can be found in Ringler et al. (2011). The two quasi-uniform meshes have grid spacing that approximately equals 15 km (U15km) and 60 km (U60km). The three variable-resolution meshes feature a circular refined high-resolution region centered over East China as shown in Fig. 1c. Figure 1c shows the exact mesh size distribution of the 4–60 km variable-resolution mesh (V4km) that has a refined region with grid spacing of approximately 4 km, and the mesh spacing gradually increases through a transition zone to approximately 60 km for the rest of the globe. The other two variable-resolution meshes (V16km and V30km) have a similar mesh structure as the V4km mesh but with a mesh spacing of 16 and 30 km, respectively, over the refined region that gradually increases to 128 and 120 km, respectively, elsewhere.
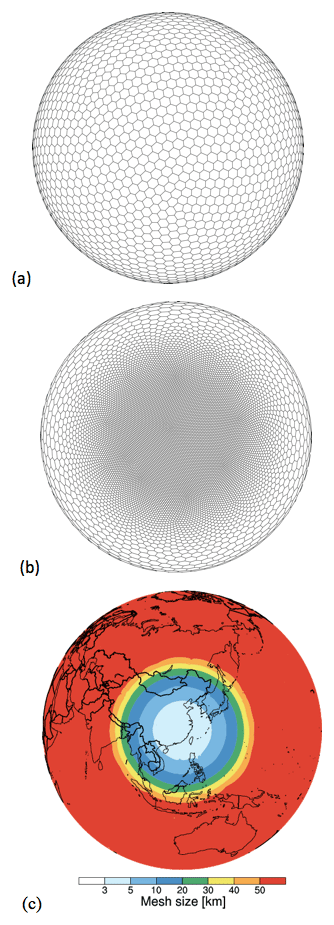
Figure 1(a) Quasi-uniform mesh and (b) variable-resolution mesh used in the MPAS experiments. Both meshes are plotted at resolutions significantly lower than used in the experiments to show the mesh cells. (c) Global variable-resolution mesh size distribution in the variable-resolution 4–60 km experiment.
Experiments U15km and V16km are compared to examine the difference between global uniform- and variable-resolution simulations in capturing the precipitation in the refined region in order to explore the potential of regional refinement for regional weather and climate simulation. It is noteworthy here that the U15km mesh comprises ∼2.5 million cells and the V16km mesh only comprises ∼0.11 million cells. The difference in the number of mesh cells leads to a difference in computational and storage demand. With the TH-2 supercomputer of the National Supercomputer Center in Guangzhou (NSCC-GZ), it takes ∼9000 and ∼240 CPU h to finish a 1 d simulation for U15km and V16km, respectively. In addition, with the standard MPASv5.2, the sizes of output data per 1 d simulation for U15km and V16km are 0.5 and 0.02 T, respectively. The same time step of 60 s is used for physics and dynamics for both the U15km and V16km simulations. In order to investigate the potential impact of physics parameterizations, two available convective parameterizations (GF and NTD) are used for each experiment with the two meshes. Two cloud microphysics schemes (WSM6 and Thompson) are also tested, but the precipitation differences in the U15km and V16km experiments are small. Therefore, only the results using WSM6 with two different convective parameterizations are shown in this study for the two meshes (U15km.NTD, U15km.GF, V16km.NTD, and V16km.GF).
The U60km, V30km, V16km, and V4km experiments are conducted to quantify the impacts of horizontal resolution on simulating precipitation characteristics. The numbers of grid cells in the U60km, V30km, V16km, and V4km meshes are ∼0.16, 0.10, ∼0.11, and ∼0.8 million, respectively. A difference in the number of cells and minimum cell size also leads to a difference in computational and storage demand. With the TH-2 supercomputer of NSCC-GZ, it takes ∼200, ∼150, ∼240, and ∼1800 CPU h to finish a 1 d simulation for U60km, V30km, V16km, and V4km meshes, respectively. In addition, with the standard MPASv5.2, the sizes of output data per 1 d simulation for the four meshes are 0.03, 0.02, 0.02, and 0.15 T, respectively. The time steps used for physics and dynamics for the four meshes are 300, 120, 60, and 20 s, respectively.
As discussed above, GF is the only convective parameterization that has been tested with scale-aware capability for use across hydrostatic (e.g., tens of kilometers) and non-hydrostatic scales (e.g., 4 km). Therefore, in order to investigate the difference among the experiments with the four meshes (U60km, V30km, V16km, and V4km), they are all conducted with the GF convective parameterization. Since the cloud microphysics has a significant impact on the V4km simulations (discussed latter), the experiments of V4km with both the WSM6 (V4km.WSM6) and Thompson (V4km.Thompson) cloud microphysics schemes are analyzed in this study. When examining the difference between the global uniform- and variable-resolution simulations and investigating the impact of mesh spacing, the same physics schemes and parameter values are used in multiple experiments if not specified explicitly. All the numerical experiments discussed above are summarized in Table 1.
Table 1Numerical experiments conducted and analyzed in this study.
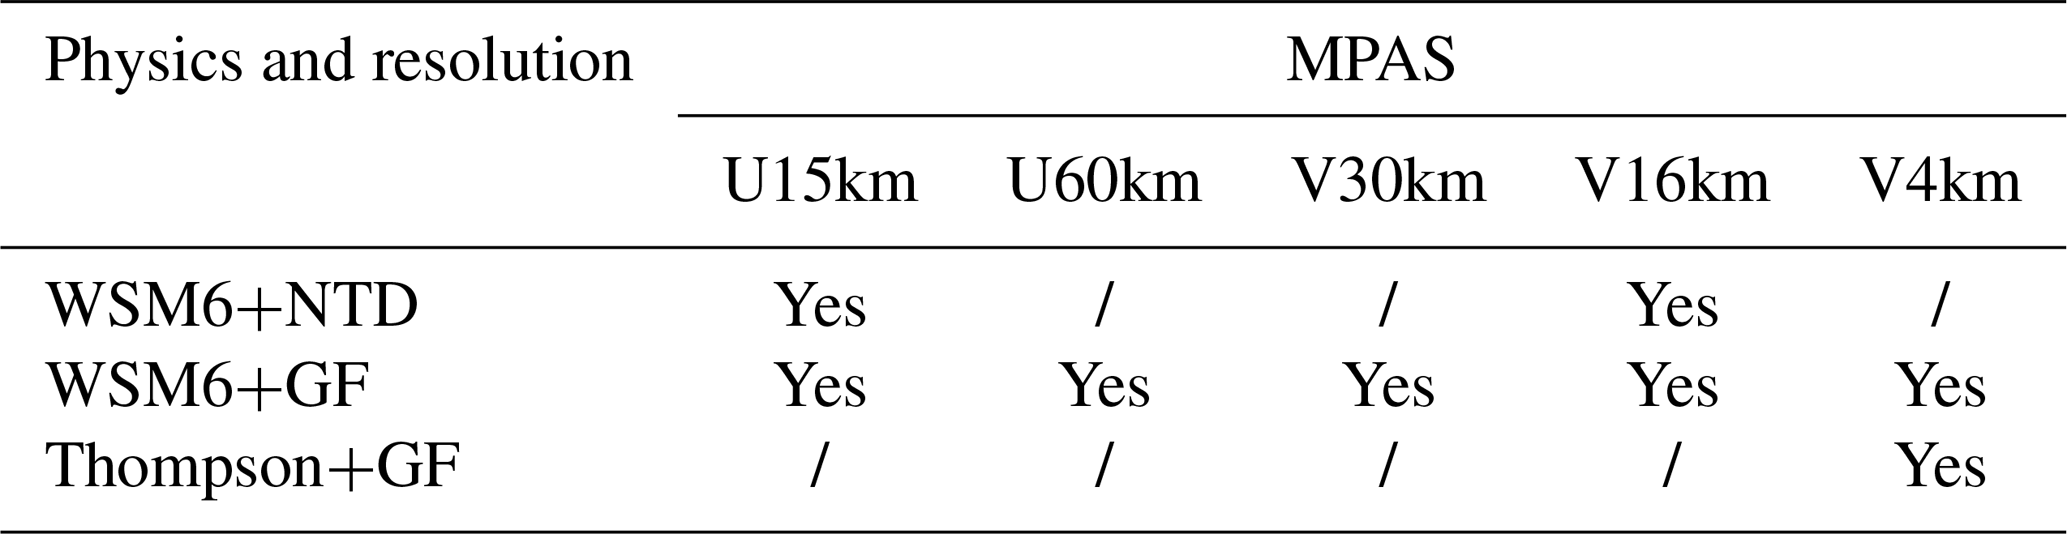
(1) U and V represent quasi-uniform and variable-resolution meshes, respectively, as described in Sect. 2.1.2. (2) “WSM6” and “Thompson” represent two cloud microphysics schemes as described in Sect. 2.1.1. NTD and GF represent two cumulus parameterizations as described in Sect. 2.1.1.
Due to the large computing cost and data storage of the experiments conducted, particularly for the U15km and V4km experiments, this study does not perform ensemble simulations. Instead, bootstrapping statistical analysis is used to test the statistical significance of the difference among multiple experiments investigated in this study. The bootstrap method uses a resampling technique to extract certain samples, called bootstrap samples, within the range of the original data. Statistical metrics, such as averages, variances, and correlation coefficients, can be calculated for each bootstrap sample. For a given confidence level (e.g., 95 %), bootstrap confidence intervals for specific statistical metrics can be estimated (e.g., Efron, 1992; Efron and Tibshirani, 1994).
To simulate the heavy precipitation event that occurred during 25–27 June 2012 over the YRD in East China, all the MPAS experiments were initialized at 00:00 UTC on 23 June 2012 to allow for appropriate spin-up time, and the modeling results for 25–27 June 2012 are analyzed. The simulations were initialized using the analysis data at 1∘ horizontal resolution at 00:00 UTC on 23 June 2012 from the Global Forecast System (GFS) of the National Center for Environmental Prediction (NCEP), the same as that used by the GFS forecast for the period. The sea surface temperature (SST) is also prescribed the same as that used by the GFS forecast for the period. This way, the MPAS simulation results can also be compared against the GFS forecast starting from 00:00 UTC on 23 June 2012.
2.2 Dataset
Several datasets are used to evaluate the MPAS simulations. The hourly precipitation dataset from the National Meteorological Information Center of CMA is used to evaluate the simulated precipitation characteristics. In this dataset, rainfall was measured by tipping buckets, self-recording siphon rain gauges, or automatic rain gauges. The data were subject to strict three-step quality control by station, provincial, and national departments. The methods of quality control mainly include checking the climate threshold value, extreme value, spatial and temporal consistency, and human–computer interaction. All the data used in this study are quality controlled. The distribution of stations over the study domain is shown as the color-filled circles in Fig. 2. Over the YRD region of East China (25–36∘ N, 114–123∘ E; denoted as the black box in Fig. 2), there are 511 stations. The minimum and maximum distances between two stations are ∼3 km and ∼70 km, respectively, and the mean is ∼25 km. The hourly wind field dataset from the European Centre for Medium-Range Weather Forecasts (ECMWF) Reanalysis (ERA5) (0.28∘ × 0.28∘) (https://rda.ucar.edu/datasets/ds630.0/, last access: 28 June 2019) is used as a reference to evaluate the simulated distributions of winds. Lastly, the global forecast products at 0.5 and 1∘ horizontal resolutions starting from 00:00 UTC on 23 June 2012 are also used for comparison. The GFS forecast products are downloaded from https://www.ncdc.noaa.gov/data-access/model-data/model-datasets/global-forcast-system-gfs (last access: 27 May 2019). Since the focus of this study is not to investigate the difference between MPAS and GFS or to evaluate the performance of GFS, details about the GFS are not discussed here but can be found on the website listed above.
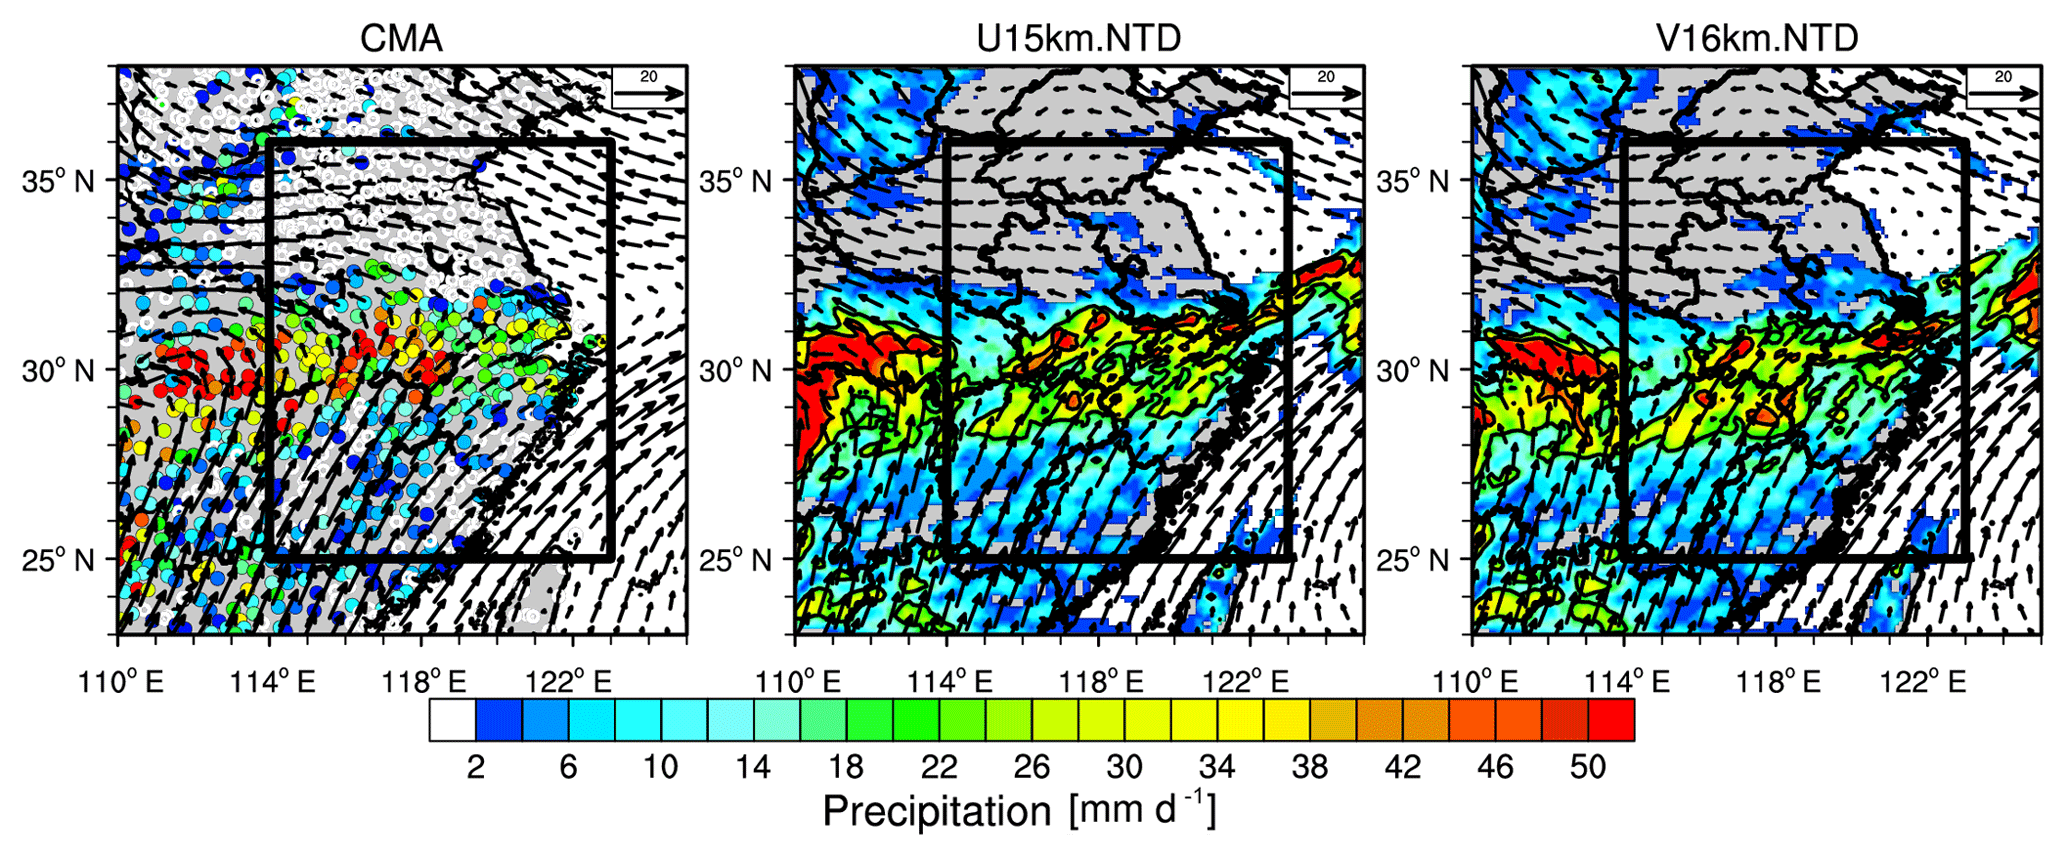
Figure 2Spatial distributions of precipitation and wind fields at 850 hPa averaged during the event (25 June 00:00 to 27 June 12:00 UTC) from the simulations with global uniform (15 km) and variable (16 km over the refined region as shown in Fig. 1c) resolutions. The observed mean precipitation from the CMA stations and the wind fields from the ERA5 reanalysis are shown. The black contour lines represent precipitation larger than 20 mm d−1. The black box denotes the region of East China (25–36∘ N, 114–123∘ E) for the analysis in the following.
3.1 Simulations at quasi-uniform and variable resolutions
Figure 2 shows the spatial distributions of precipitation and wind at 850 hPa averaged during the event (25 June 00:00 UTC to 27 June 12:00 UTC) from the simulations with global uniform (15 km) and variable (16 km over East China) resolutions (U15km.NTD and V16km.NTD). The mean precipitation from the CMA stations and the winds from the ERA5 reanalysis are also shown. The CMA observations show an average precipitation rate exceeding 50 mm d−1 over central East China with a heavy rain belt extending from west to east along 31∘ N. The rain belt is associated with the wind shear near the surface that is typically accompanied by the Meiyu front during the East Asian summer monsoon. In general, both simulations capture the observed precipitation pattern. It is evident that the modeling results over the refined region are consistent between the uniform- and variable-resolution simulations. The spatial correlation coefficient between the two simulations over the refined region (entire region shown in Fig. 2) is 0.85. Besides precipitation, both simulations also capture the distribution of winds from the reanalysis data. The wind fields between the two simulations are also consistent with a spatial correlation coefficient of 0.99.
As mentioned above, the precipitation during this event is concentrated in a narrow west–east belt. For a more quantitative comparison, Fig. 3 shows the zonal averaged precipitation during the event over the YRD region of East China (25–36∘ N, 114–123∘ E; denoted as the black box in Fig. 2) from observations and simulations. The CMA observations show an evident precipitation peak reaching ∼40 mm d−1 around 31∘ N. All four simulations with different resolutions and convective parameterizations capture the zonal distribution of observed precipitation well. The correlation coefficients are 0.9 and 0.89 for the U15km and V16km simulations with the GF scheme, respectively, and 0.89 and 0.86 for the same simulations but with the NTD scheme. This comparison further indicates that the simulations at global uniform and variable resolutions are consistent with each other, and the different convective parameterizations only have a negligible impact on this consistency. Although this consistency does not depend on the convective schemes, simulations with the GF parameterization produce larger peak precipitation than those with the NTD parameterization and are more consistent with observations for this event. The impact of cloud microphysics (WSM6 and Thompson) on the consistency in modeling total precipitation is also examined and found to be negligible (Figs. S1 and S2 in the Supplement), although there are some impacts on the simulated grid-resolved precipitation (Fig. S3).
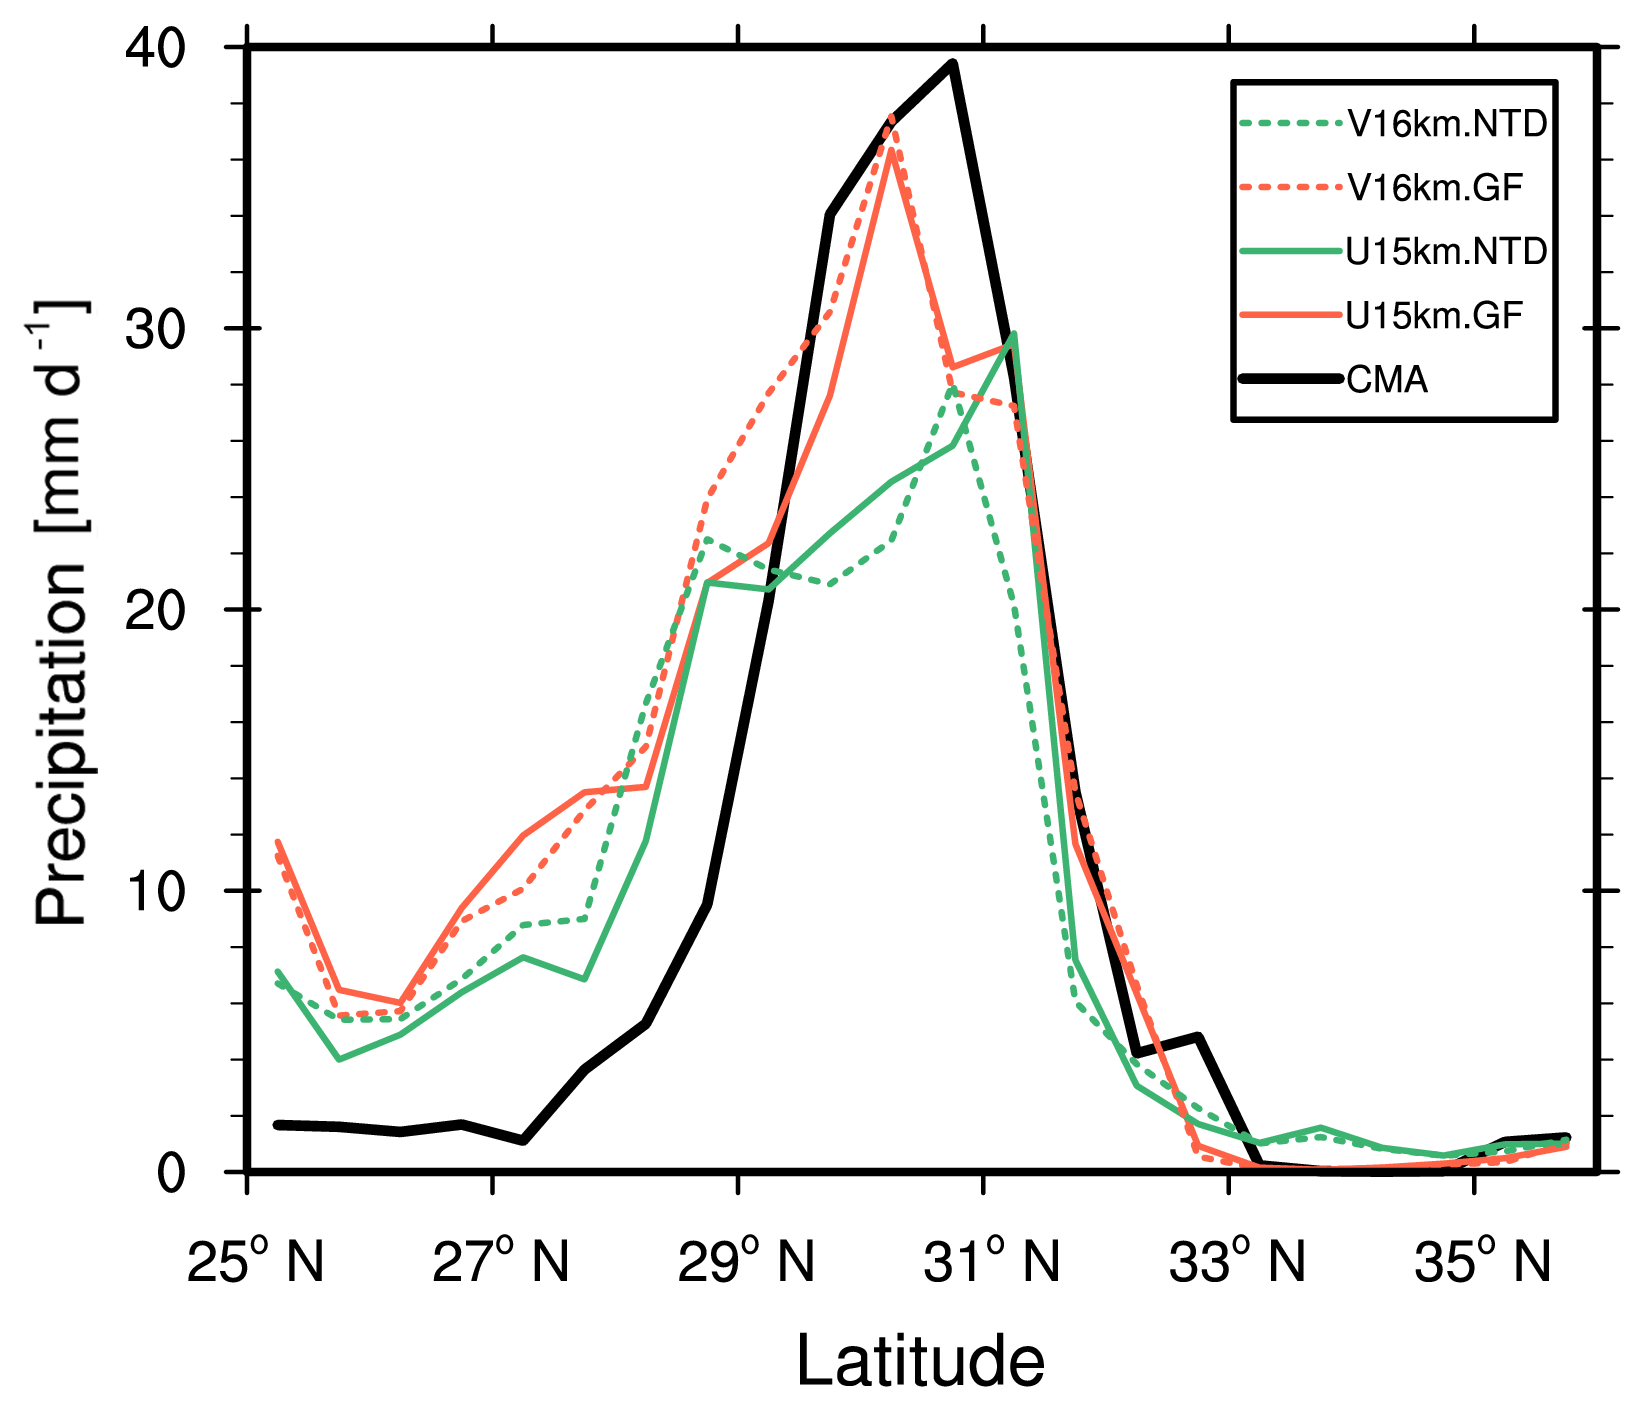
Figure 3Zonal distributions of precipitation averaged during the event (25 June 00:00 UTC to 27 June 12:00 UTC) averaged over East China (denoted as the black box in Fig. 2) from the CMA station observations and the simulations with global uniform (15 km, solid lines) and variable (16 km over the refined region as shown in Fig. 1c, dashed lines) resolutions with two convective parameterizations (GF, red lines; NTD, green lines). The modeling results are sampled at the CMA station.
Figure 4 shows the meridional precipitation propagation over East China (denoted as the black box in Fig. 2) during the event. The CMA observations indicate that the rain belt propagates from 26∘ N at 06:00 UTC on 25 June to 31∘ N at 00:00 UTC on 26 June and includes two precipitation peaks around 31∘ N. The rainfall reaches the first peak around 00:00 UTC on 26 June. The rain belt stays around 31∘ N and reaches the second peak around 00:00 UTC on 27 June. The event ends around 12:00 UTC on 27 June (Fig. S4). The first precipitation peak was generated by the southwest–northeast wind shear line formed over central East China along with a vortex over the southwest at 00:00 UTC on 26 June. The shear line gradually extended eastward, leading to the second precipitation peak around 00:00 UTC on 27 June (Fig. S5). All four experiments generally simulate the southwest vortex and wind shear during the event, although the strength and location do not perfectly match the reanalysis. As the large-scale environment is quite well represented in the model, the simulations also generally capture the two peaks of precipitation along 31∘ N as observed. However, both U15km and V16km simulate a broader rain belt, resulting in positive biases of precipitation south of 30∘ N (Fig. S6). Both simulations shift the first peak precipitation southward. In addition, the simulations extend the first peak precipitation period and shorten the second one to some extent (Fig. S6). The lower averaged total precipitation around 31∘ N from the simulation with the NTD parameterization (Fig. 3) is mainly due to the lower rainfall before 26 June compared to the one with the GF parameterization (Fig. S6). For the two precipitation peaks, the simulation with NTD is comparable to the one with GF. Although the two convective parameterizations lead to a significant difference in simulating total precipitation before 26 June, both simulations generate consistent wind circulation at 700 hPa before 26 June with spatial correlation coefficients above 0.9 (over the domain as shown in Fig. S5). Although the two convective parameterizations lead to different total precipitation, they have a negligible impact on consistency in modeling precipitation propagation using uniform and variable resolutions during this event. The correlation coefficients are 0.48 and 0.42 for the simulations with the GF scheme at the resolutions of U15km and V16km, respectively, and 0.55 and 0.54 for the simulations with the NTD scheme at the two resolutions. The results again indicate consistency between the simulations at the global uniform and variable resolutions at the hydrostatic scale over the refined region regardless of the convective parameterization used.
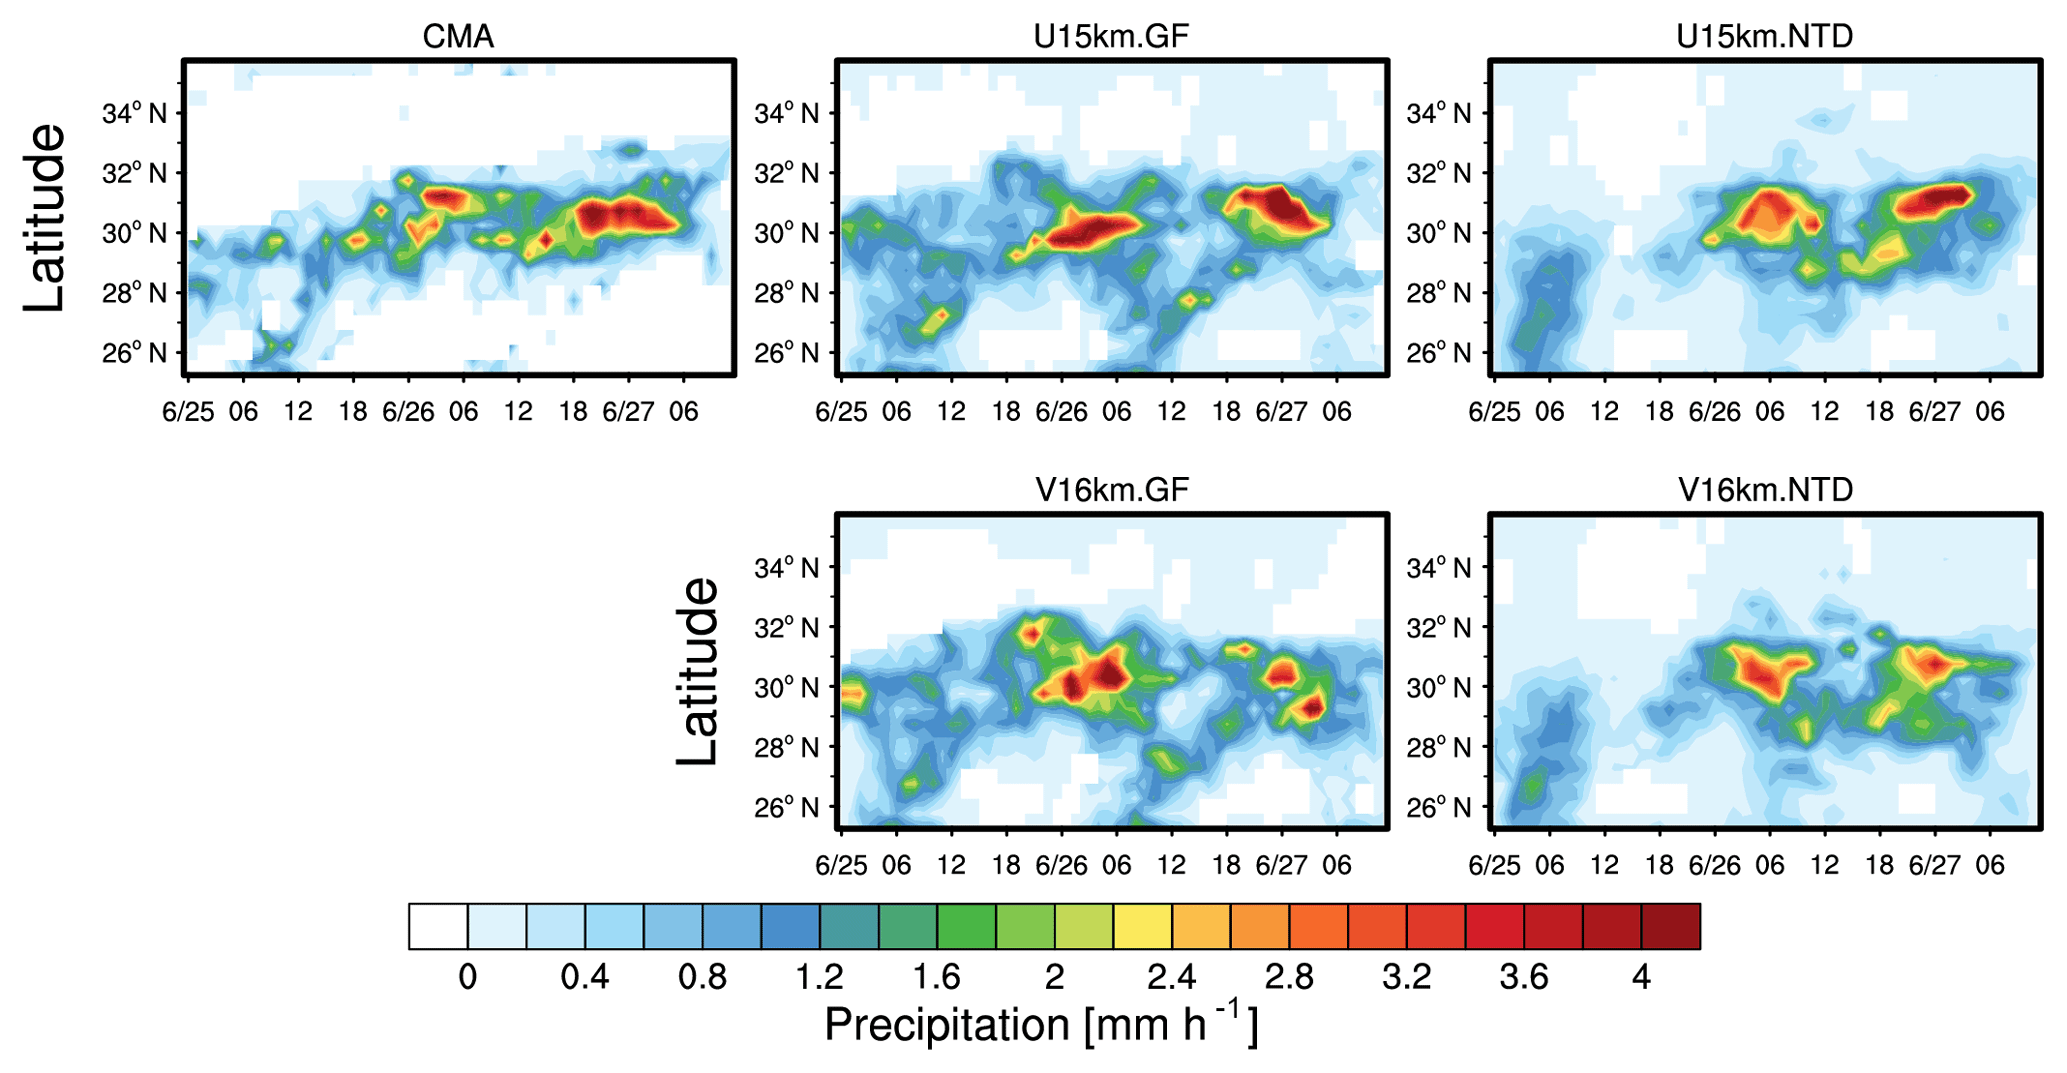
Figure 4Time–latitude cross section of precipitation during the event averaged over East China (denoted as the black box in Fig. 2) from the CMA station observations and the simulations with global uniform and variable resolutions with two convective parameterizations. The modeling results are sampled at the CMA stations.
Overall, for the selected event, the MPAS simulations at global uniform and variable resolutions produce consistent results over the refined region with comparable horizontal resolution in terms of the spatial patterns of precipitation and wind fields as well as the precipitation propagation. This finding is in general agreement with findings from previous studies for MPAS with idealized experiments (e.g., Zhao et al., 2016) and real-world experiments (e.g., Sakaguchi et al., 2015). These findings provide the basis for using global variable-resolution configurations of MPAS to model extreme precipitation over East China. In the following, the impacts of resolution on modeling extreme precipitation during this event are investigated with multiple global variable-resolution experiments.
3.2 Impacts of resolution
3.2.1 Parameterized and resolved precipitation
Multiple experiments using MPAS at various resolutions are conducted as stated in the “Data and methodology” section. The resolution crosses the scales from 60, 30, and 16 to 4 km. For global variable-resolution configurations, a scale-aware convective parameterization is needed, especially for the configuration that crosses hydrostatic (convective parameterization is required) and non-hydrostatic scales (convection permitting). Therefore, the experiments analyzed below are all conducted with the GF scheme that is developed for simulations down to ∼4 km resolution (details can be found in Grell and Freitas, 2014). To demonstrate the scale-aware performance of the GF convective parameterization across various resolutions, Fig. 5 shows the spatial distributions of convective-parameterized and resolved precipitation averaged during the event. At resolutions of 60 and 16 km, precipitation produced from the convective parameterization dominates the total precipitation amount. In contrast, at the resolution of 4 km, the total precipitation amount from simulations with two different microphysics is dominated by the resolved precipitation. The fraction of parameterized precipitation in the total decreases significantly from the simulations at 16 km to the ones at 4 km over the heavy precipitation region (Fig. S7). It is also interesting that the fraction of parameterized precipitation increases from the simulations at 60 km to the ones at 16 km to some extent. This demonstrates that the GF scheme is aware of the resolution change, so precipitation from the simulations at the convection-permitting scale is mostly produced by the cloud microphysics in MPAS.
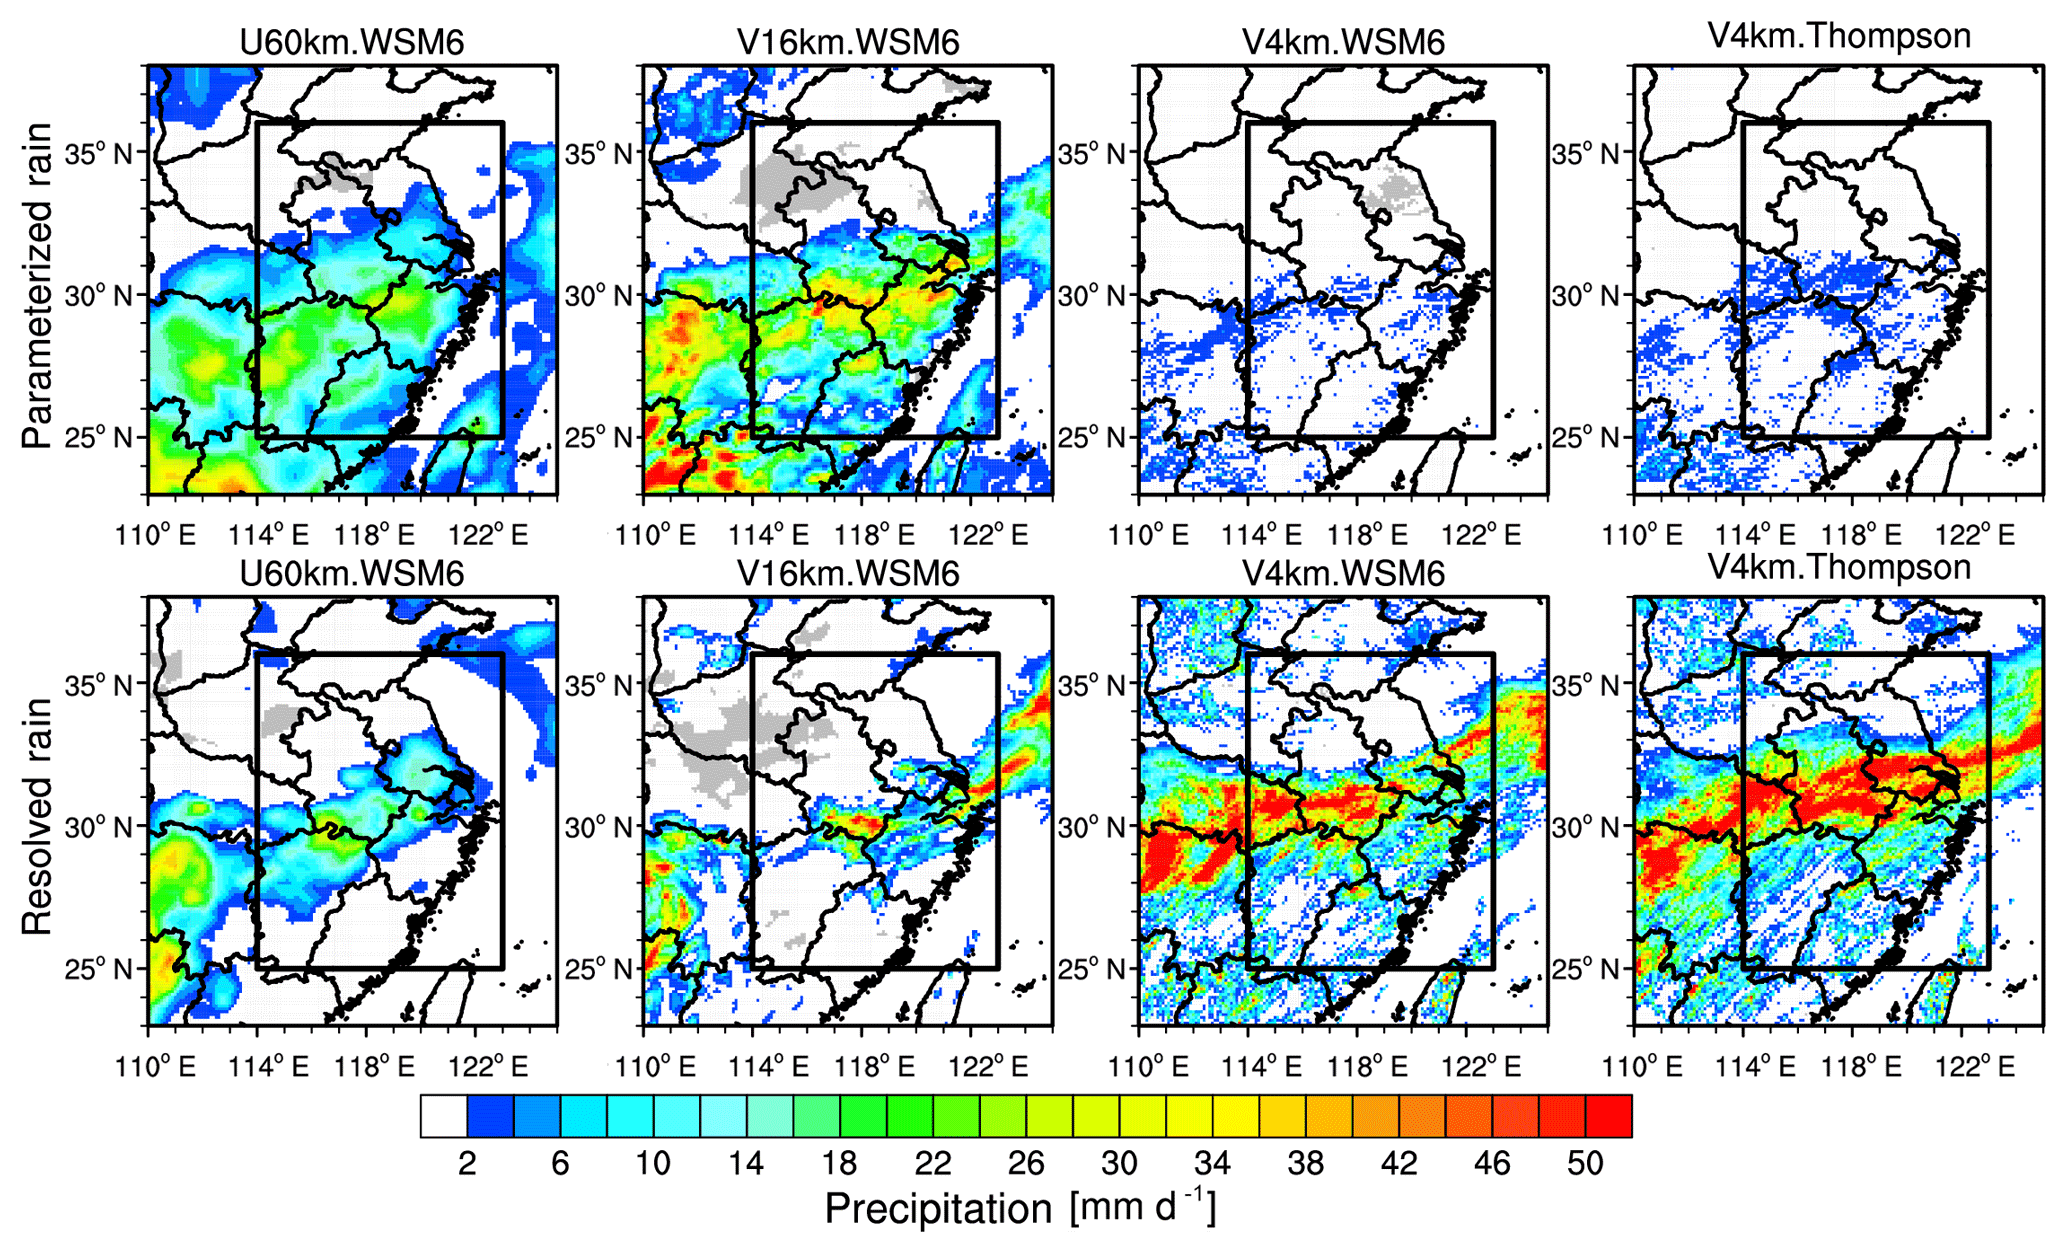
Figure 5Spatial distribution of averaged parameterized and resolved precipitation during the event over East China from the simulations with resolutions of 60, 16, and 4 km.
3.2.2 Spatial and temporal variation
Figure 6 shows the observed and simulated spatial distributions of precipitation and wind fields at 850 hPa averaged during the event. For comparison, the GFS forecast results at resolutions of 1.0 and 0.5∘ are also included. The GFS forecast results from the two resolutions are similar, both showing a northward-shifted rain belt compared to the CMA observation. Due to the northern shift of the rain belt, the spatial correlation coefficients between the GFS and the CMA observations over the entire region in Fig. 6 are only 0.06 and 0.03 for resolutions of 1.0 and 0.5∘, respectively. In comparison, the spatial correlation coefficients between the CMA observations and the MPAS simulations at resolutions of 60, 30, and 16 km are 0.49, 0.47, and 0.56, respectively. The correlation coefficients for the 4 km simulations with the WSM6 and Thompson microphysics schemes are 0.63 and 0.54, respectively. In general, the experiments at the convection-permitting scale (4 km) better capture the observed precipitation pattern than simulations with convective parameterization over the refined region, although the performance is affected by the microphysics scheme to some extent. On average for the entire region as shown in Fig. 6, all the simulations overestimate the observed precipitation with mean biases ranging from +0.59 to +5.11 mm d−1 (Table 2).
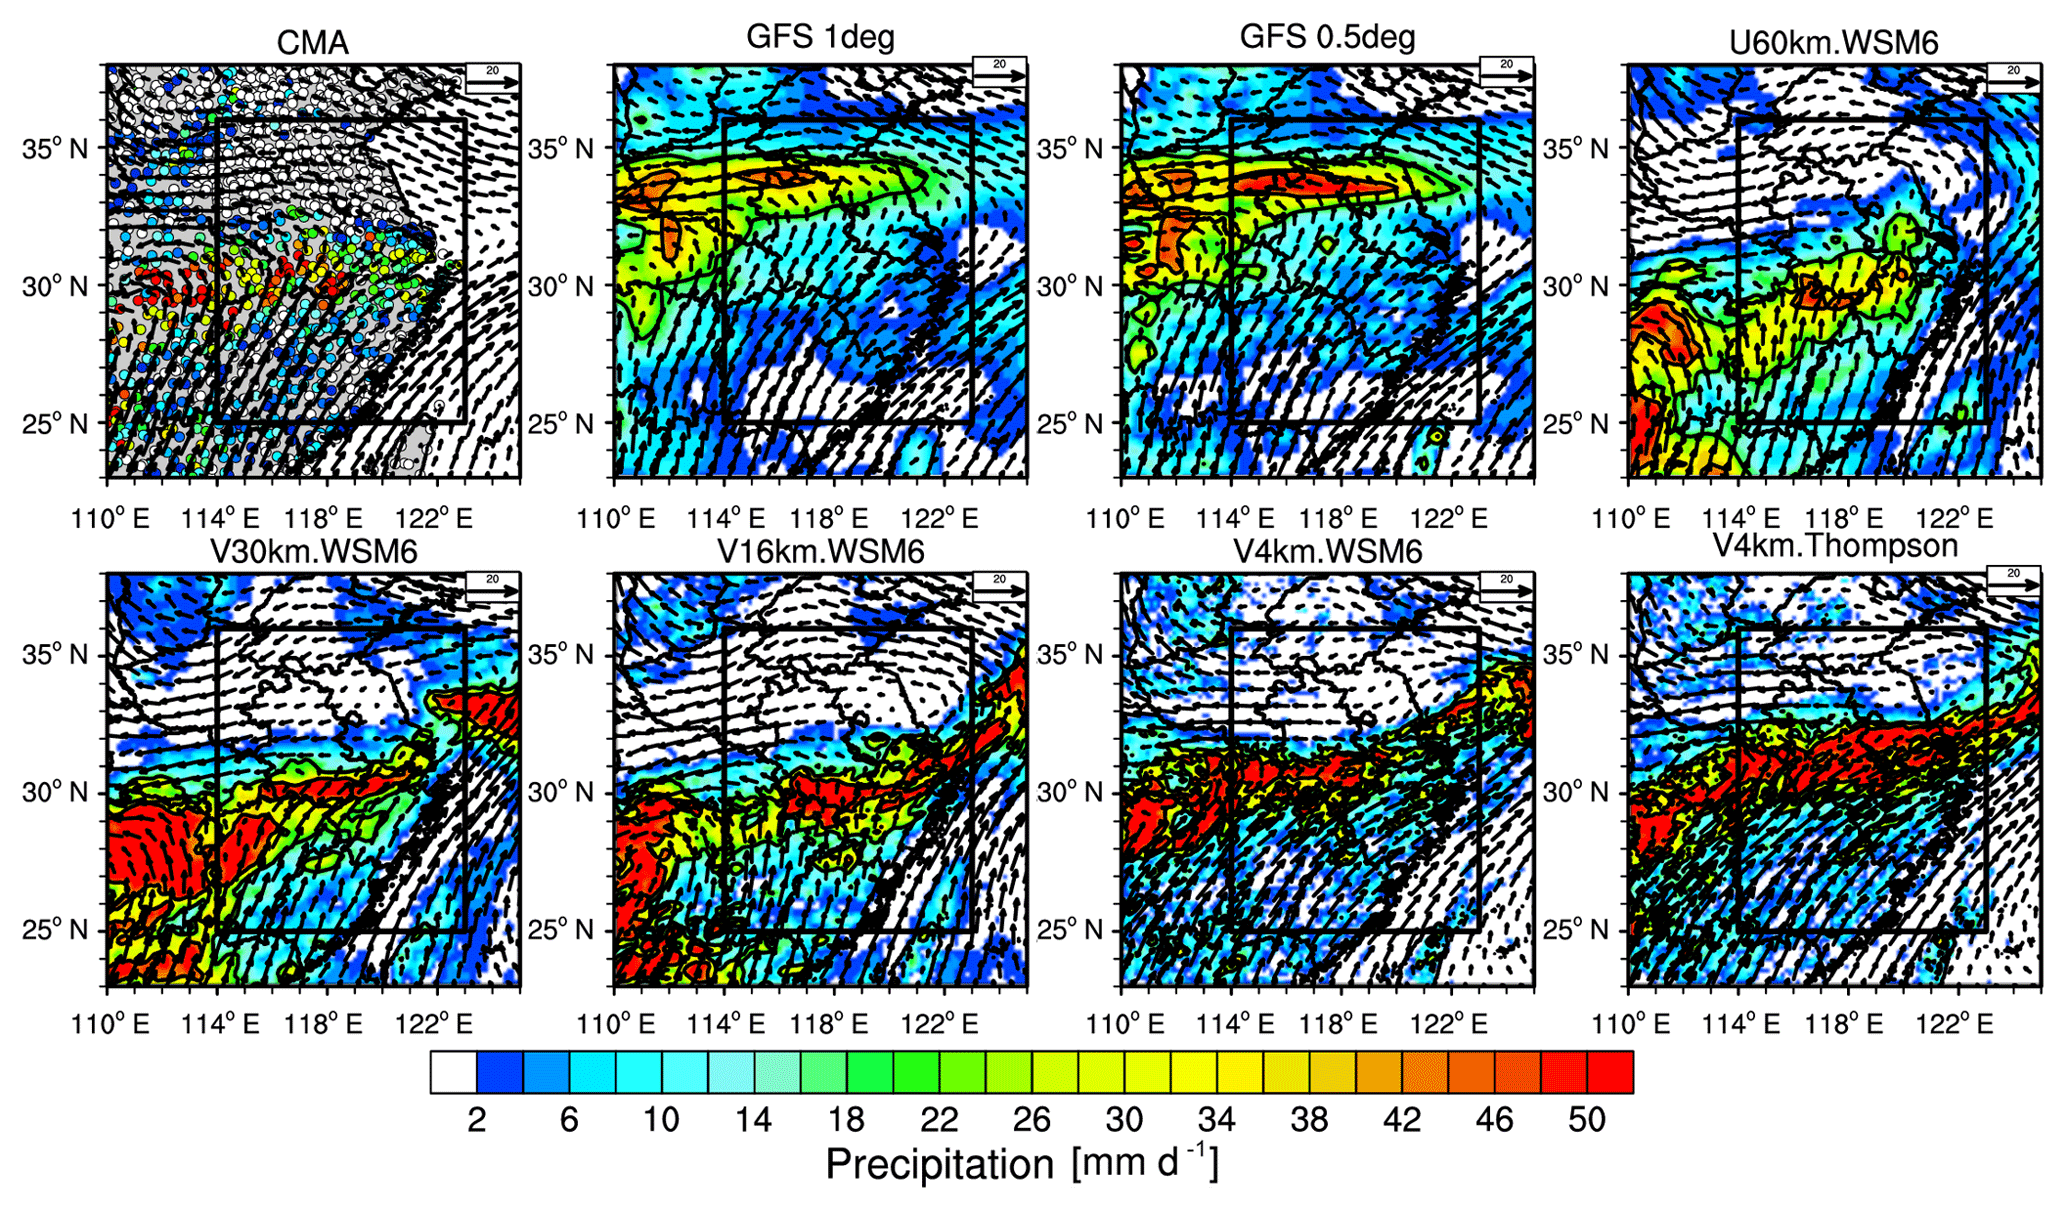
Figure 6Spatial distributions of precipitation and wind fields at 850 hPa averaged during the event from the MPAS simulations at resolutions of 60, 30, 16, and 4 km. The observed mean precipitation from the CMA stations and the wind fields from the ERA5 reanalysis are shown as well. The black contour lines represent precipitation larger than 20 mm d−1. The black box denotes the region of East China (25–36∘ N, 114–123∘ E) for the analysis in the following. For comparison, the GFS forecasts at 1 and 0.5∘ resolutions are also shown.
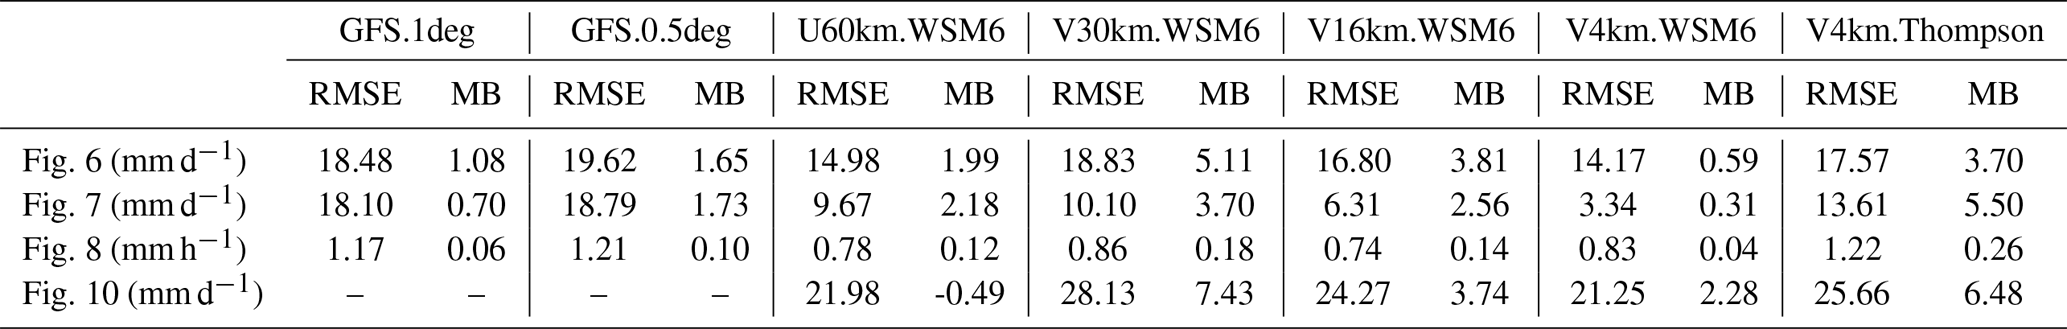
Table 2The mean bias (MB) and root mean square root (RMSE) of the simulated results shown in Figs. 6–8 and 10 against CMA observations.
In order to test the statistical significance of the difference in spatial distributions among the experiments, the 95 % confidence intervals of spatial correlation are estimated based on the bootstrap analysis. Although the correlation coefficients estimated above have an uncertain range, at the 95 % confidence level the results still indicate that the V16km simulation produces a better spatial pattern of precipitation than other hydrostatic-scale simulations. In addition, the simulation at the convection-permitting scale is comparable to, if not better than, the V16km simulation. The results are summarized in Table 3. It is noteworthy that, although the difference in precipitation over East China is significant among the GFS forecasts at 0.5 and 1.0∘ resolutions and MPAS at various resolutions, their global distributions of precipitation and wind averaged during the event period are similar with spatial correlation coefficients of 0.40–0.43 (precipitation) and 0.86–0.93 (wind), respectively, against the satellite-retrieved precipitation and ERA5 reanalysis wind (Fig. S8).
The zonal distributions of precipitation can better demonstrate the difference among the simulations. Figure 7 shows the observed and simulated zonal distributions of precipitation averaged during the event over the YRD region of East China. For comparison, the GFS forecasts at 1 and 0.5∘ resolutions are also included. The modeling results are sampled at the CMA stations. Consistent with the spatial distributions of precipitation shown in Fig. 6, the GFS forecasts at both 0.5 and 1.0∘ resolutions reproduce the precipitation peak of ∼40 mm d−1 but shift the rain belt northward by about 4.0∘ latitude from 31 to 35∘ N. The MPAS simulations at 16 and 30 km with the GF scheme can capture the peak precipitation around 31∘ N well, although the simulation at 30 km produces a second lower peak of precipitation around 29∘ N. The simulation at 60 km produces a much lower precipitation peak of ∼25 mm d−1 and shifts the rain belt southward to around 30∘ N. The underestimate of the simulation at 60 km is mainly due to the underestimate of the convective-parameterized rain (Fig. 5). It is noteworthy that on regional average the simulation at 60 km overestimates the observed precipitation with a mean bias of +2.18 mm d−1 (Table 2). For the two MPAS simulations at 4 km, the precipitation is mainly generated by cloud microphysics (Fig. 5) and can therefore be significantly affected by the cloud microphysics schemes. The MPAS simulations at 4 km with WSM6 and Thompson produce different zonal distributions of the rain belt. The simulation using WSM6 reproduces the peak of precipitation, while the simulation using Thompson produces higher precipitation with a peak at 50 mm d−1 and shifts the peak northward by about 1∘. The simulation at 4 km with the Thompson scheme has a much higher positive bias than the one with the WSM6 scheme (Table 2). Overall, the correlation coefficients between the CMA observations and the GFS forecasts are −0.19 and −0.15 for 0.5 and 1.0∘, respectively, and the correlation coefficients are 0.68, 0.71, 0.89, and 0.97 (0.72) for the MPAS simulations at 60, 30, 16, and 4 km with the WSM6 (Thompson) cloud microphysics. At the 95 % confidence level, the difference among the experiments is significant (Table 3).
Table 3The correlation coefficients and the corresponding 95 % confidence intervals based on the bootstrap analysis for the results shown in Figs. 6–10.
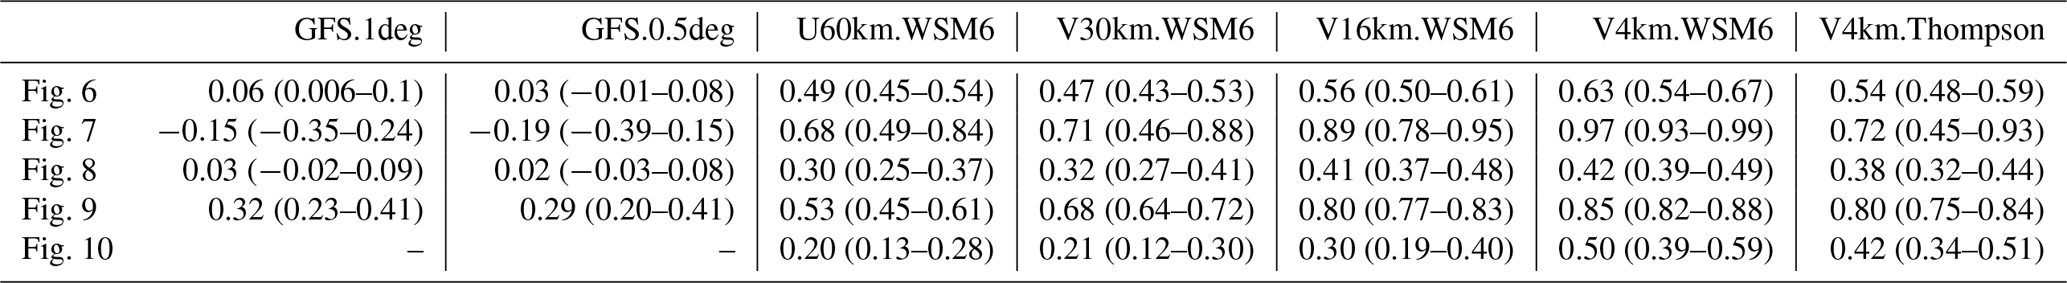
The values inside the parentheses indicate the lower and higher bounds of the 95 % confidence intervals; the values outside are estimated directly based on the results shown in Figs. 6–10.

Figure 7Zonal distributions of precipitation averaged during the event averaged over East China (denoted as the black box in Fig. 6) from the CMA station observations and the simulations with resolutions of 60, 30, 16, and 4 km. For comparison, the GFS forecasts at 1 and 0.5∘ resolutions are also included. The modeling results are sampled at the CMA stations.
Figure 8 compares the observed and simulated precipitation propagation during the event over East China. The modeling results are sampled at the CMA stations. The GFS forecasts at 0.5 and 1.0∘ are similar, and both generate a heavy precipitation zone between 34 and 35∘ N that lasts for about 18 h from 12:00 UTC on 26 June. This is largely different from the CMA observations, so the correlation coefficients between the forecasts and observations are only 0.02 and 0.03 for 0.5 and 1.0∘, respectively. The northward shift of rain belt during the event (shown in Figs. 6 and 7) is related to the GFS forecast that only produced the second peak of precipitation around 00:00 UTC on 27 June, while it totally missed the first peak (Fig. S9). In addition, the GFS forecast overestimates the second peak and shifts it towards the north by about 4∘. The timing and location shift of the rain belt in the GFS forecast are mainly because of the bias of GFS in simulating the wind shear in this event. The GFS forecast failed to produce the southwest–northeast wind shear line around 00:00 UTC on 26 June and generated a vortex over the west that is too broad. Around 00:00 UTC on 27 June, GFS simulated the wind shear line but located it further north (Fig. S10).
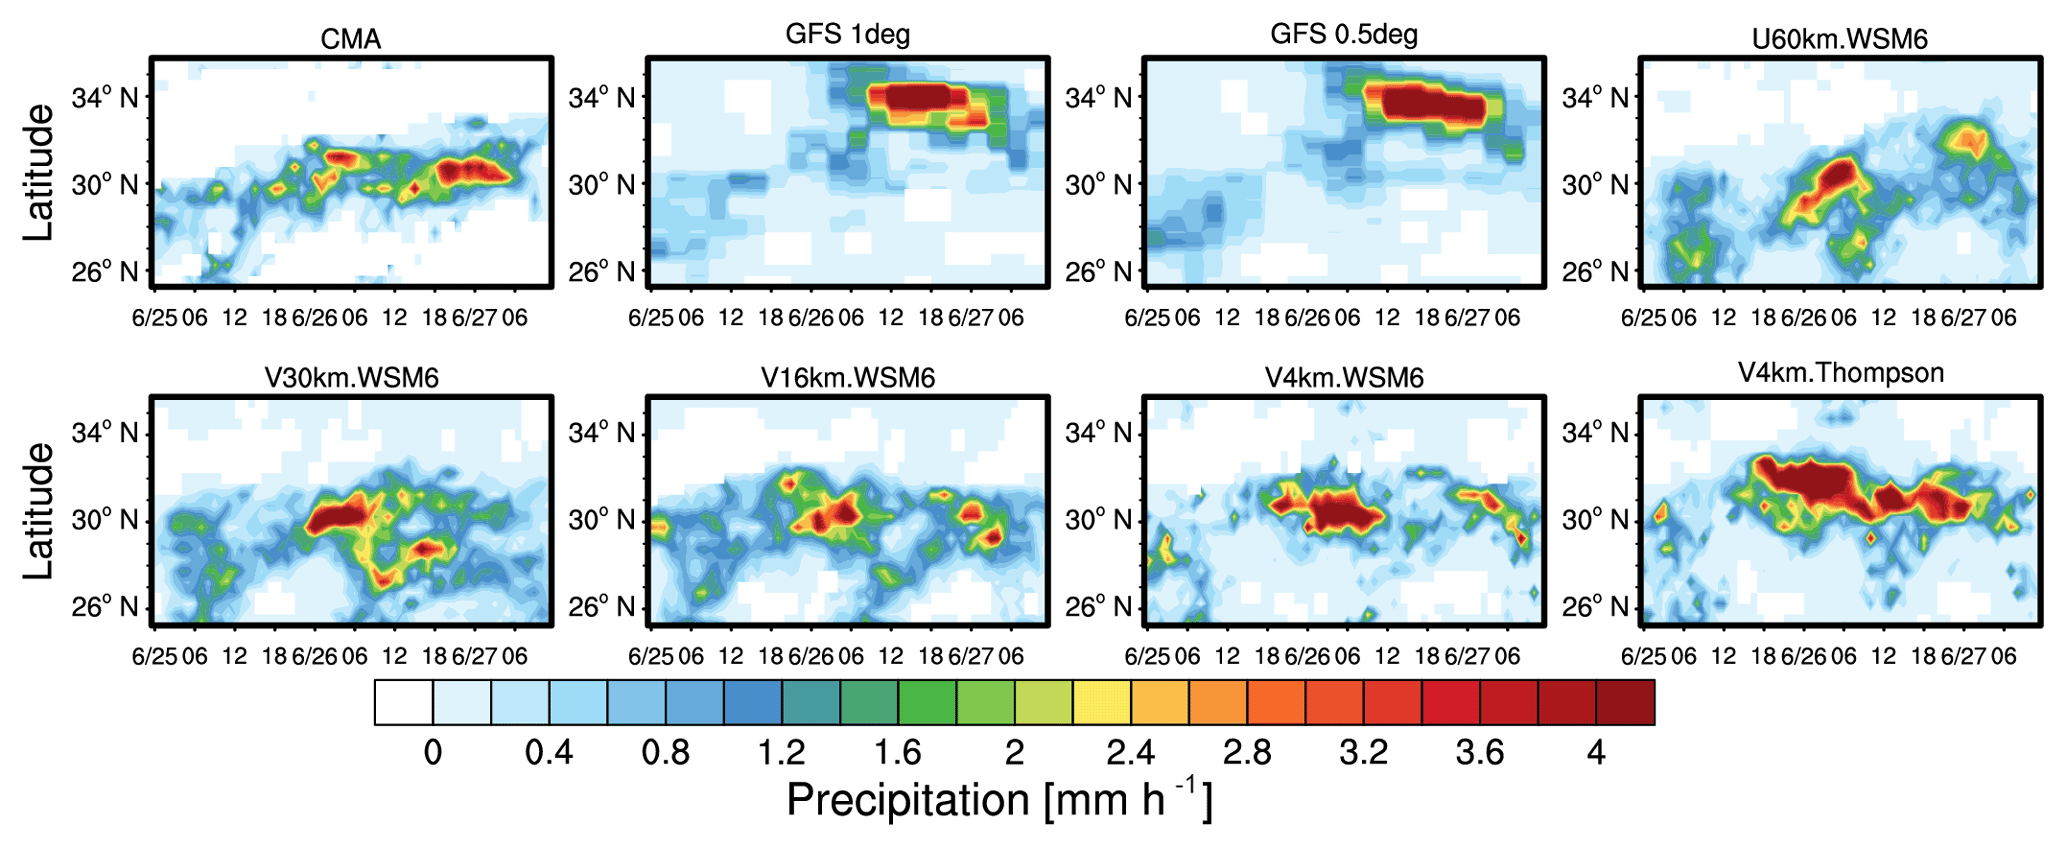
Figure 8Time–latitude cross section of precipitation during the event averaged over East China (denoted as the black box in Fig. 6) from the CMA station observations, GFS forecasts at 0.5 and 1.0∘ resolutions, and the MPAS simulations at resolutions of 60, 30, 16, and 4 km. The simulations at 4 km are with two cloud microphysics schemes (WSM6 and Thompson). The modeling results are sampled at the CMA stations.
The MPAS simulations are highly dependent on the resolutions. All simulations roughly produce the two peaks of precipitation as observed during the event. However, the experiment at 60 km simulates the first precipitation peak southward and the second peak northward of the observations, while the experiment at 30 km simulates the second peak further south and a few hours earlier. The time and location shifts correspond well to biases in simulated wind shear (Fig. S10). The spatial correlation coefficients of precipitation are 0.30 and 0.32 between the observations and the simulations at 60 and 30 km, respectively. The experiments at 16 and 4 km with the WSM6 cloud microphysics scheme can better capture the timing and latitude of the observed precipitation event than U60km and V30km (Fig. S11); however, both V16km and V4km overestimate the first peak precipitation and underestimate the second peak. The experiment at 4 km with the Thompson scheme overestimates the precipitation amount of both peaks. Overall, all the simulations overestimate the observed precipitation during the event (Table 2). The correlation coefficients are 0.41 and 0.42 (0.38) for 16 and 4 km with the WSM6 (Thompson) cloud microphysics schemes, respectively. At the 95 % confidence level (Table 3), the experiments at 16 and 4 km are comparable in terms of simulating the propagation of this rain belt and better than the experiments at other resolutions. It is interesting to note that MPAS and GFS forecasts share the same initial condition and simulate different large-scale circulation, particularly the wind shear structure, with the system evolution (Fig. S10). The model capability in successfully capturing the wind shear structure during this event determines the performance in generating the rain belt evolution. The formation and evolution of wind shear during the Meiyu front over East China have been found to interact with multiscale processes and systems, including terrain and convective latent heat (Yao et al., 2017). A different representation of the terrain over East China in various resolutions may impact the simulated wind shear structure. Previous studies also found that convective latent heat may vary with resolutions and physics (Hagos et al., 2015; Zhao et al., 2016), which can further affect the simulation of wind shear structure. Therefore, the difference in resolution and physics between MPAS and GFS may result in their difference in simulating the formation and evolution of wind shear structure during the event. A more detailed exploration of the differences between the MPAS and GFS simulations is beyond the scope of this study.
The spatial distribution of the rain belt can also be reflected by the vertical wind distributions. Figure 9 compares the height–latitude cross section of the winds averaged over the region (shown as in Fig. 6) during the event from the ERA5 reanalysis, the GFS forecasts, and the MPAS simulations. In the ERA5 reanalysis wind fields, vertical motion is located primarily around 31∘ N, extending from the lower troposphere (∼900 hPa) to the upper troposphere (∼200 hPa). The GFS simulates the vertical motion primarily around 33∘ N, but the vertical motion is also strong around 35∘ N from 600 to 200 hPa, which can be linked to the heavy precipitation generated there. These biases result in weaker correlation in vertical winds between the reanalysis and the GFS forecasts with coefficients of 0.29 and 0.32 for 0.5 and 1.0∘ resolutions, respectively. The MPAS experiment at 60 km simulates the vertical motion toward the south around 28∘ N. The MPAS experiments at 30 and 16 km generally agree well with the ERA5 reanalysis, although both generate higher vertical motion in the south (e.g., 25∘ N) to some extent. The correlation coefficients between the reanalysis and the MPAS experiments at 60, 30, and 16 km are 0.53, 0.68, and 0.80, respectively. The MPAS experiment at 4 km with the WSM6 scheme produces consistent vertical motion with that in the ERA5 reanalysis, while the one with the Thompson scheme shifts the vertical motion a little further north. Both experiments at 4 km have the highest correlation in the distributions of vertical motion with the reanalysis with coefficients of 0.85 and 0.80 for WSM6 and Thompson, respectively. The statistical significance tests based on the bootstrap analysis indicate that at the 95 % confidence level the model performance at 16 and 4 km in terms of simulating the vertical structure of winds is comparable and better than the simulations at coarser resolution (Table 3). The zonal distributions of precipitation discussed above correspond well with the distributions of vertical motion in all the experiments. Differences in the spatial distribution of vertical motion suggest that model resolution, and to some degree cloud microphysics parameterizations, have important effects on simulating the structure of the wind shear over East China during the East Asian summer monsoon and the embedded precipitation.
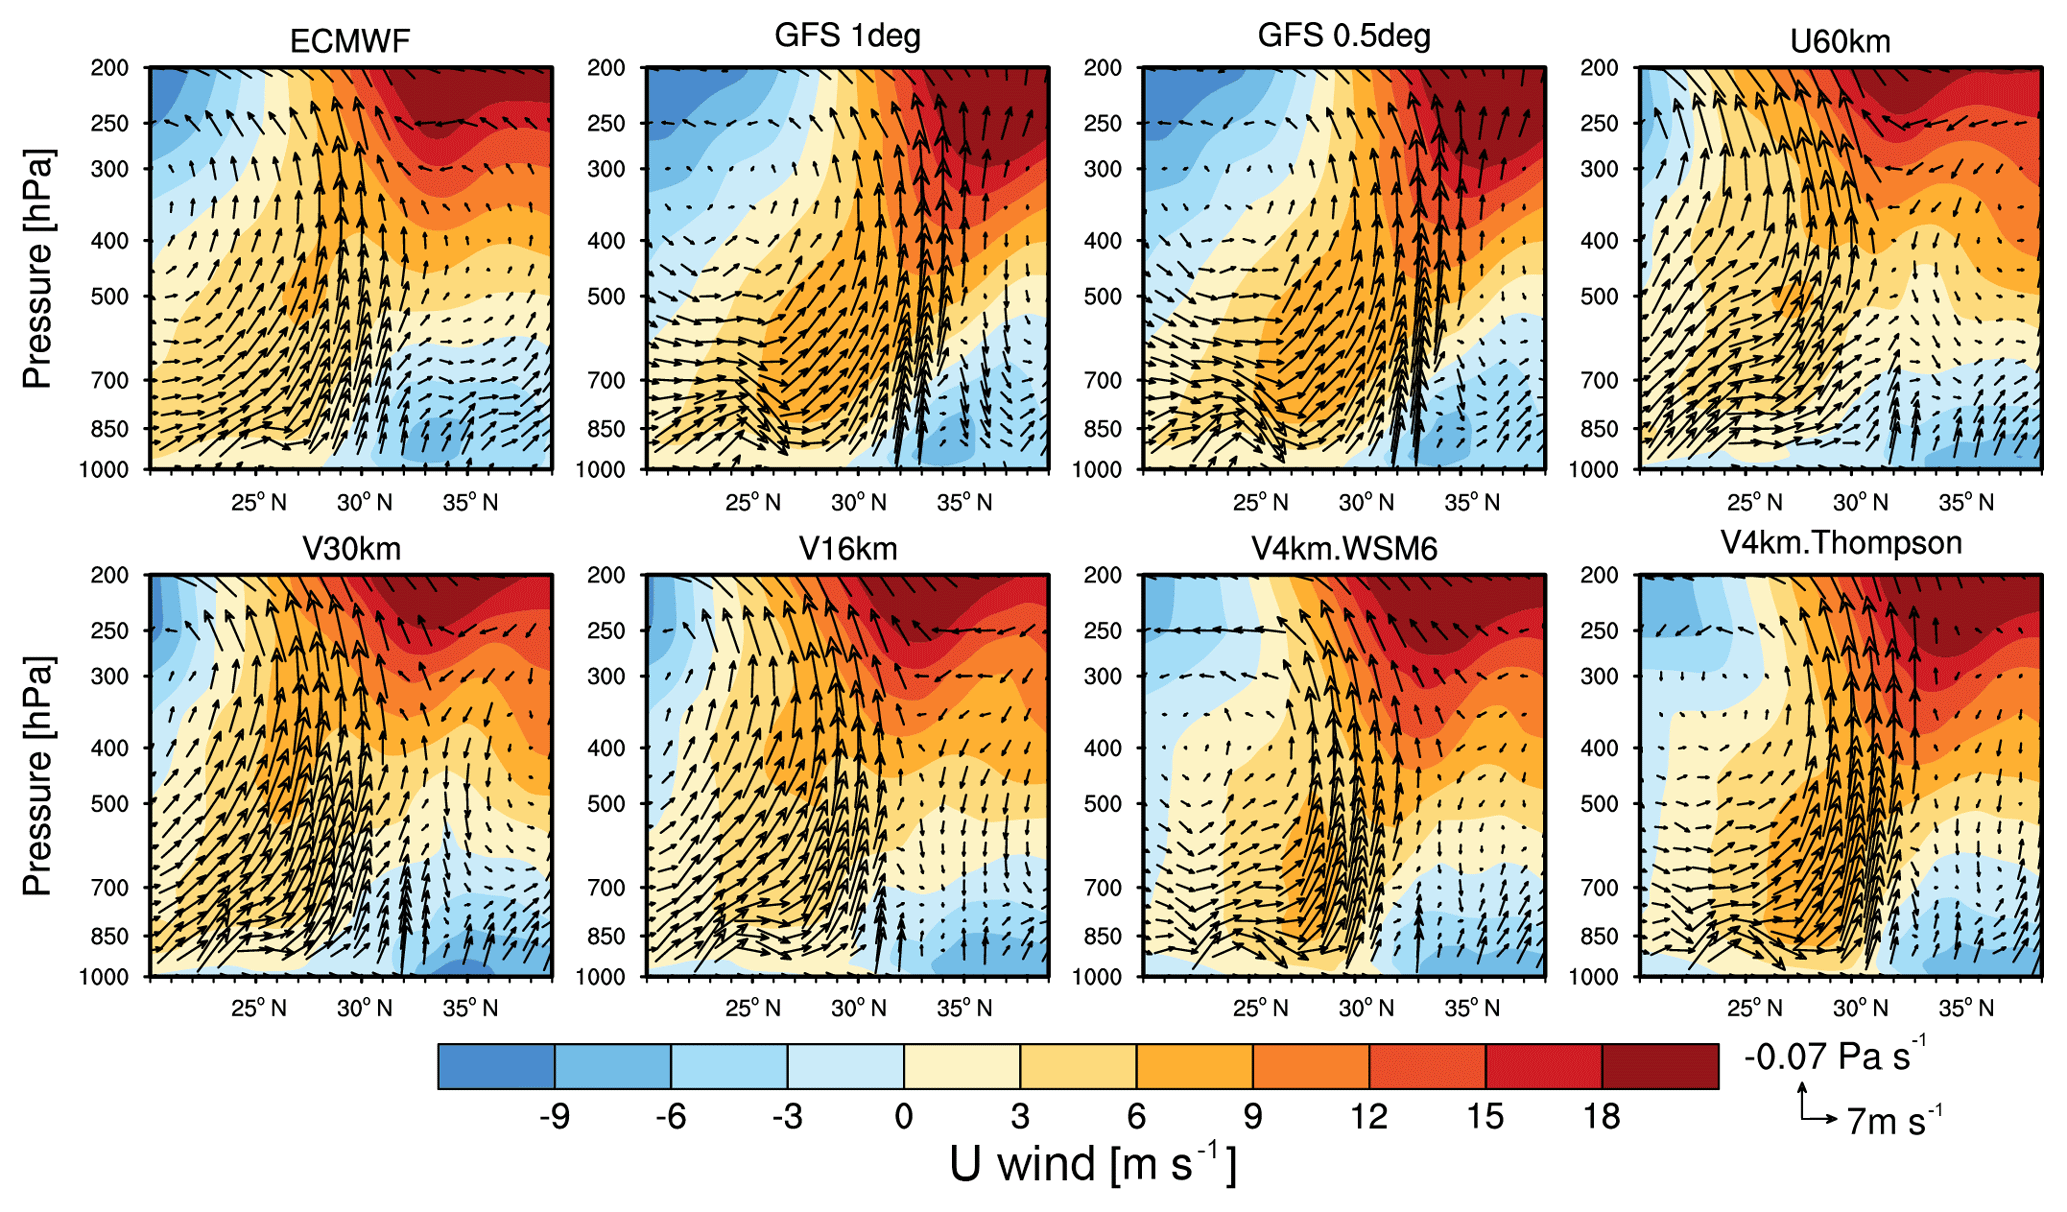
Figure 9Height–latitude cross section of wind fields averaged over the region (the entire domain as shown in Fig. 6) during the event from the ERA5 reanalysis, the GFS forecasts at 0.5 and 1.0∘ resolutions, and the MPAS simulations at resolutions of 60, 30, 16, and 4 km. The simulations at 4 km are with two cloud microphysics schemes (WSM6 and Thompson). The positive color represents eastward wind. All the datasets are regridded into 0.25∘ horizontal resolution.
3.2.3 Distribution of extreme precipitation
Besides predicting the spatial and temporal variations of the rain belt, it is also critical to capture the location and intensity of extreme precipitation within the heavy rain belt. Since the GFS forecasts shift the entire rain belt northward, only the MPAS simulations are analyzed here. Figure 10 shows the spatial distributions of precipitation averaged during the event over the heavy rain region (27–32∘ N and 110–122∘ E). The CMA observations show that heavy precipitation exceeding 50 mm d−1 mainly occurs over the plains of the southern Anhui province, the southeast Hubei province, and part of the Huang Mountains. The MPAS experiment at 60 km simulates much smaller areas with heavy precipitation exceeding 50 mm d−1. In addition, it simulates heavy precipitation over some areas of Hunan province, which is not observed by the CMA stations. The experiment at 30 km produces more numerous areas with heavy precipitation and captures the locations of heavy precipitation over the Huang Mountains. However, it misses the heavy precipitation over the plains of southern Anhui province and southeast Hubei province; instead, it produces heavy precipitation over large areas in mountainous regions over Hunan and Jiangxi provinces. The experiment at 16 km simulates a better spatial distribution of heavy precipitation, particularly capturing the heavy precipitation over the Huang Mountains and the plains of southern Anhui province, although it still shifts the heavy precipitation from southeast Hubei province to Hunan province. The experiments at 4 km are affected by the cloud microphysics. The 4 km experiment with the WSM6 scheme produces the best spatial distribution among the MPAS experiments. It generally captures the observed heavy precipitation areas during this event as discussed above, although the locations do not perfectly match the observations. On the other hand, the 4 km experiment with the Thompson microphysics produces more areas of heavy precipitation over central Anhui province. As a result, the correlation coefficients between the observations and the MPAS experiments at resolutions of 60, 30, 16, and 4 km are 0.20, 0.21, 0.29, 0.50 (WSM6), and 0.42 (Thompson), respectively. The statistical significance test based on the bootstrap analysis indicates that at the 95 % confidence level the simulations at 4 km can better capture the spatial distribution of heavy precipitation than the simulations at resolutions on the hydrostatic scale (Table 3). On average in the entire region as shown in Fig. 10, all the simulations overestimate the observed precipitation with mean biases ranging from +2.28 to +7.43 mm d−1, except the simulation at 60 km with a small negative mean bias (Table 2). The simulation at 4 km with the WSM6 scheme has the smallest positive bias.

Figure 10Spatial distributions of precipitation averaged during the event over the heavy precipitation region (27–32∘ N and 110–122∘ E) from the CMA observations and the MPAS simulations at resolutions of 60, 30, 16, and 4 km. The simulations are sampled at the CMA stations. The topography is also shown. In the panel with CMA results, AH, ZJ, HB, HN, JX, and Mt. H denote the provinces of Anhui, Zhejiang, Hubei, Hunan, and Jiangxi and the Huang Mountains, respectively.
Figure 11 shows the probability density functions (PDFs) of hourly precipitation at all the CMA stations over East China during the event. The simulations are sampled at the CMA stations. Precipitation above ∼5 mm h−1 (∼120 mm d−1) is considered very heavy (an extra heavy storm and rain event; refer to the CMA definition), which may cause dramatic flooding and local or regional damage. During this event, for precipitation lower than ∼5 mm h−1, the MPAS simulations at hydrostatic scales (60, 30, and 16 km) overestimate the frequency, while above ∼5 mm h−1, these simulations significantly underestimate the frequency. In contrast, the MPAS simulations at the convection-permitting scale (4 km) produce a much higher frequency of extreme precipitation above ∼5 mm h−1, more consistent with the observations. However, the simulated frequency of extreme precipitation at the convection-permitting scale depends on the cloud microphysics schemes. Although the simulations at the convection-permitting scale with both microphysics schemes overestimate extreme precipitation (>10 mm h−1), the Thompson scheme produces a much higher frequency of extreme precipitation than the WSM6 scheme and results in a larger positive bias relative to the observations during this event, which deserves further investigation in the future. The coverage of observational stations with a mean distance of ∼25 km between them over the study area may not be enough and results in some extreme precipitation being missed, which may partly contribute to the positive biases in the simulations. However, since the simulations are sampled at the CMA stations, the inconsistency of comparison between observations and simulations should be reduced, particularly at the scale of 4 km. The results also indicate that the convective parameterization appears unable to produce higher-intensity precipitation.
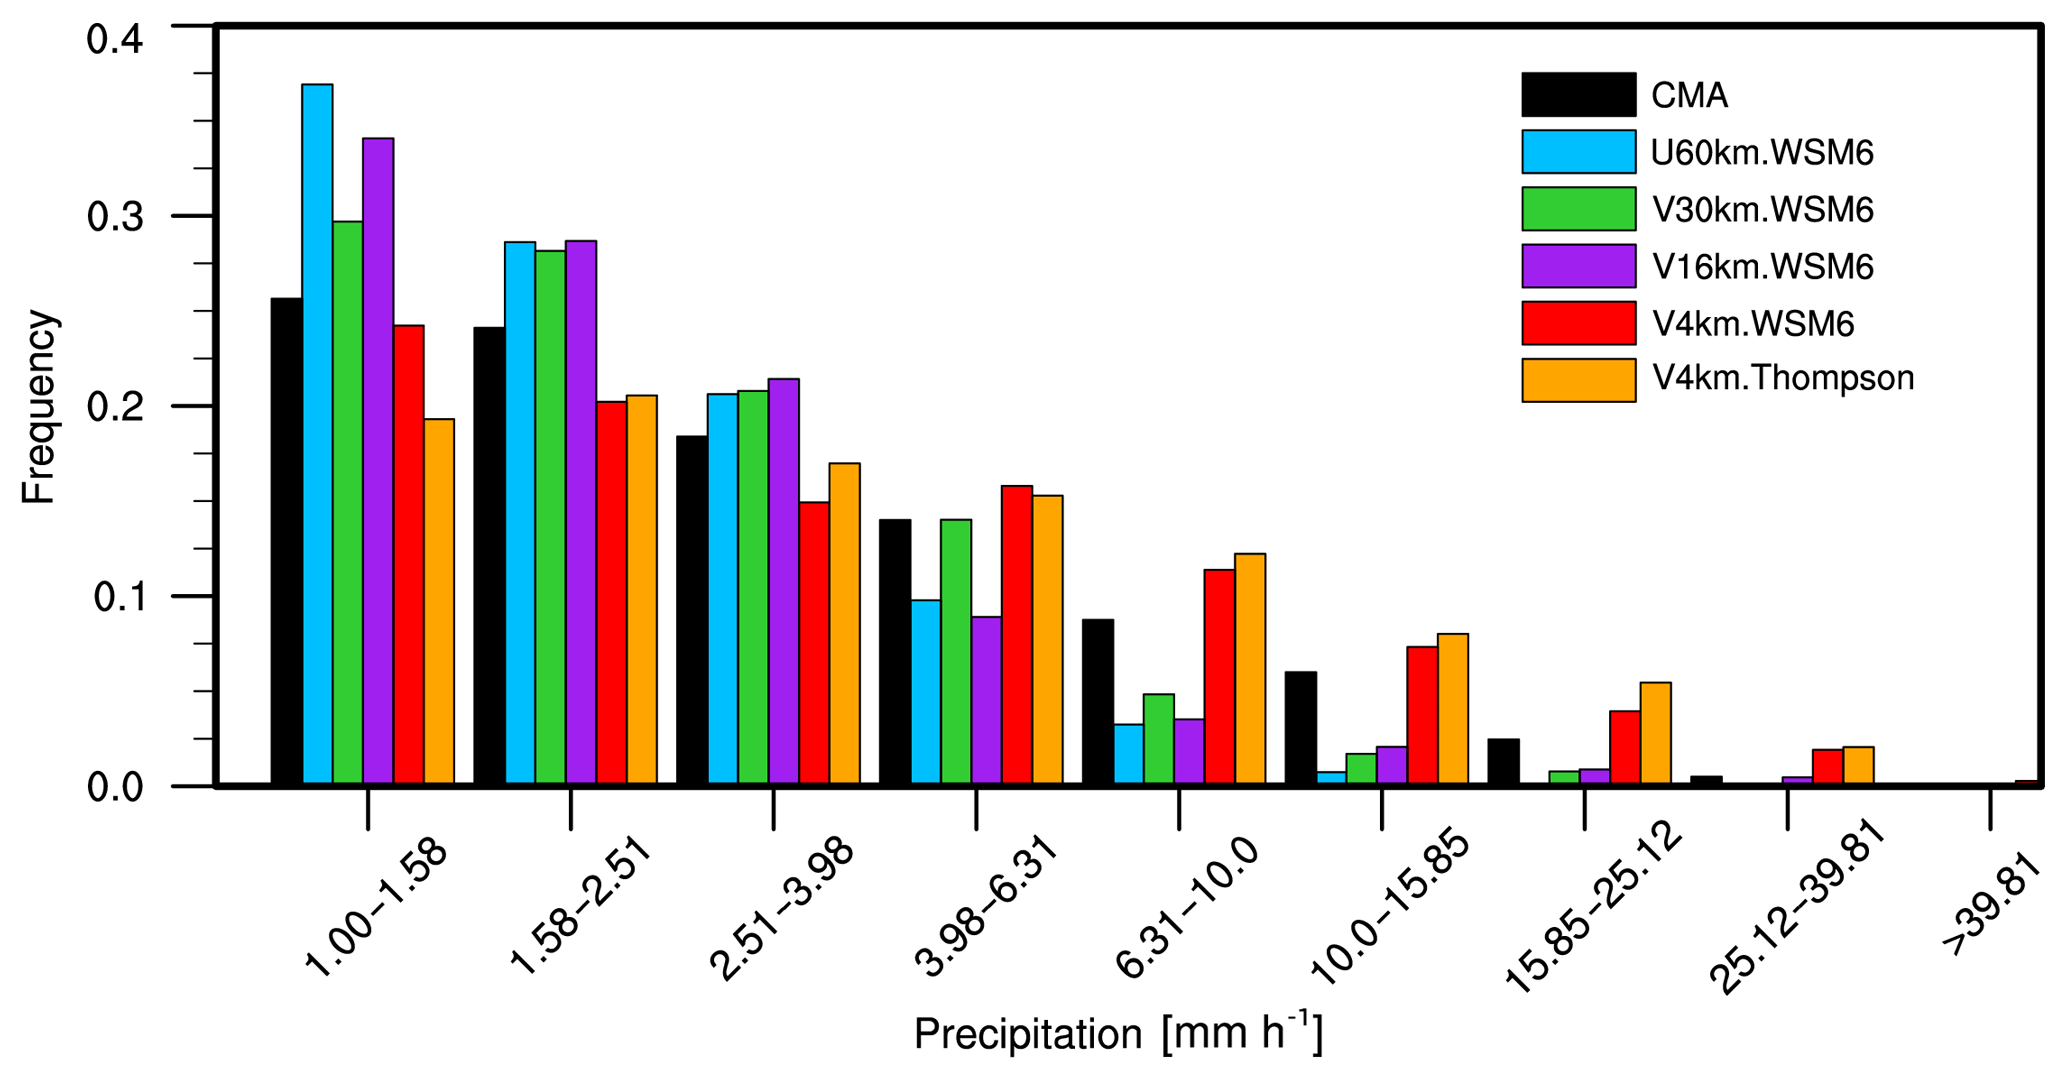
Figure 11Probability density functions (PDFs) of hourly precipitation at all the CMA stations during the event over East China (denoted as the black box in Fig. 6) from the CMA observations and the MPAS simulations at resolutions of 60, 30, 16, and 4 km. The simulations are sampled at the CMA stations.
Previous studies found that the distribution of extreme precipitation correlates well with that of the lower-tropospheric upward vertical velocity (e.g., Zhao et al., 2016). Figure 12 shows the PDFs of hourly upward vertical velocity averaged below 700 hPa at all the CMA stations during the event from the MPAS simulations. In general, the comparison of lower-level upward vertical velocity among the experiments is consistent with that of precipitation (Fig. 11) in simulations at hydrostatic scales (i.e., 60, 30, and 16 km in this study) that produce higher frequencies of updrafts <4 cm s−1 than simulations at 4 km and vice versa for stronger updrafts. The difference in updrafts between the 4 km MPAS simulations with two different cloud microphysics schemes is negligible. Another analysis with the simulated updrafts at various resolutions all regridded to 0.5∘ resolution shows similar PDFs as Fig. 12. Previous studies have proposed some mechanisms underlying the resolution impacts on modeling vertical velocity (e.g., Rauscher et al., 2016; Jeevanjee, 2017; Herrington and Reed, 2017; O'Brien et al., 2016; Fildier et al., 2018). Among these mechanisms, Rauscher et al. (2016) argued that resolution-dependent vertical velocity is caused by the interaction between the constraint of fluid continuity and macroscale turbulence. They suggested that the vertical velocity should be more intense at higher resolution because the horizontal velocity increment approximately follows a power law of resolution. Therefore, the resolved vertical transport must increase as grid spacing decreases. Assuming that atmospheric moisture is relatively insensitive to resolution, the upward moisture flux should increase as grid spacing decreases, hence producing more precipitation.
Figure 13 shows the PDFs of the upward moisture flux and the relationship between hourly precipitation versus upward moisture flux at 850 hPa during the event from the MPAS simulations at 60, 30, 16, and 4 km. It is evident that the simulations at higher resolutions produce more frequent intense upward moisture fluxes at 850 hPa, consistent with Rauscher et al. (2016) and O'Brien et al. (2016). Rauscher et al. (2016) found a linear relationship between precipitation and upward moisture fluxes at the lower level. The relationship lines from this study as shown in Fig. 13 parallel the 1:1 reference line for all resolutions. However, the lines are consistently below the reference line for the convection-permitting simulations (4 km) and above the reference line for the hydrostatic simulations with convective parameterization (e.g., 16, 30, 60 km). The simulated precipitation can be larger than the lower-level upward moisture fluxes at the hydrostatic scale because part of the precipitation is contributed by the convective parameterization rather than contributed by the resolved upward moisture flux (Rauscher et al., 2016). In contrast, precipitation could be lower than the upward moisture flux at the convection-permitting scale (e.g., 4 km) as moisture is removed from cloud updrafts due to detrainment (e.g., O'Brien et al., 2016). Overall, our results for resolution-dependent updraft and precipitation are consistent with Rauscher et al. (2016) and O'Brien et al. (2016).
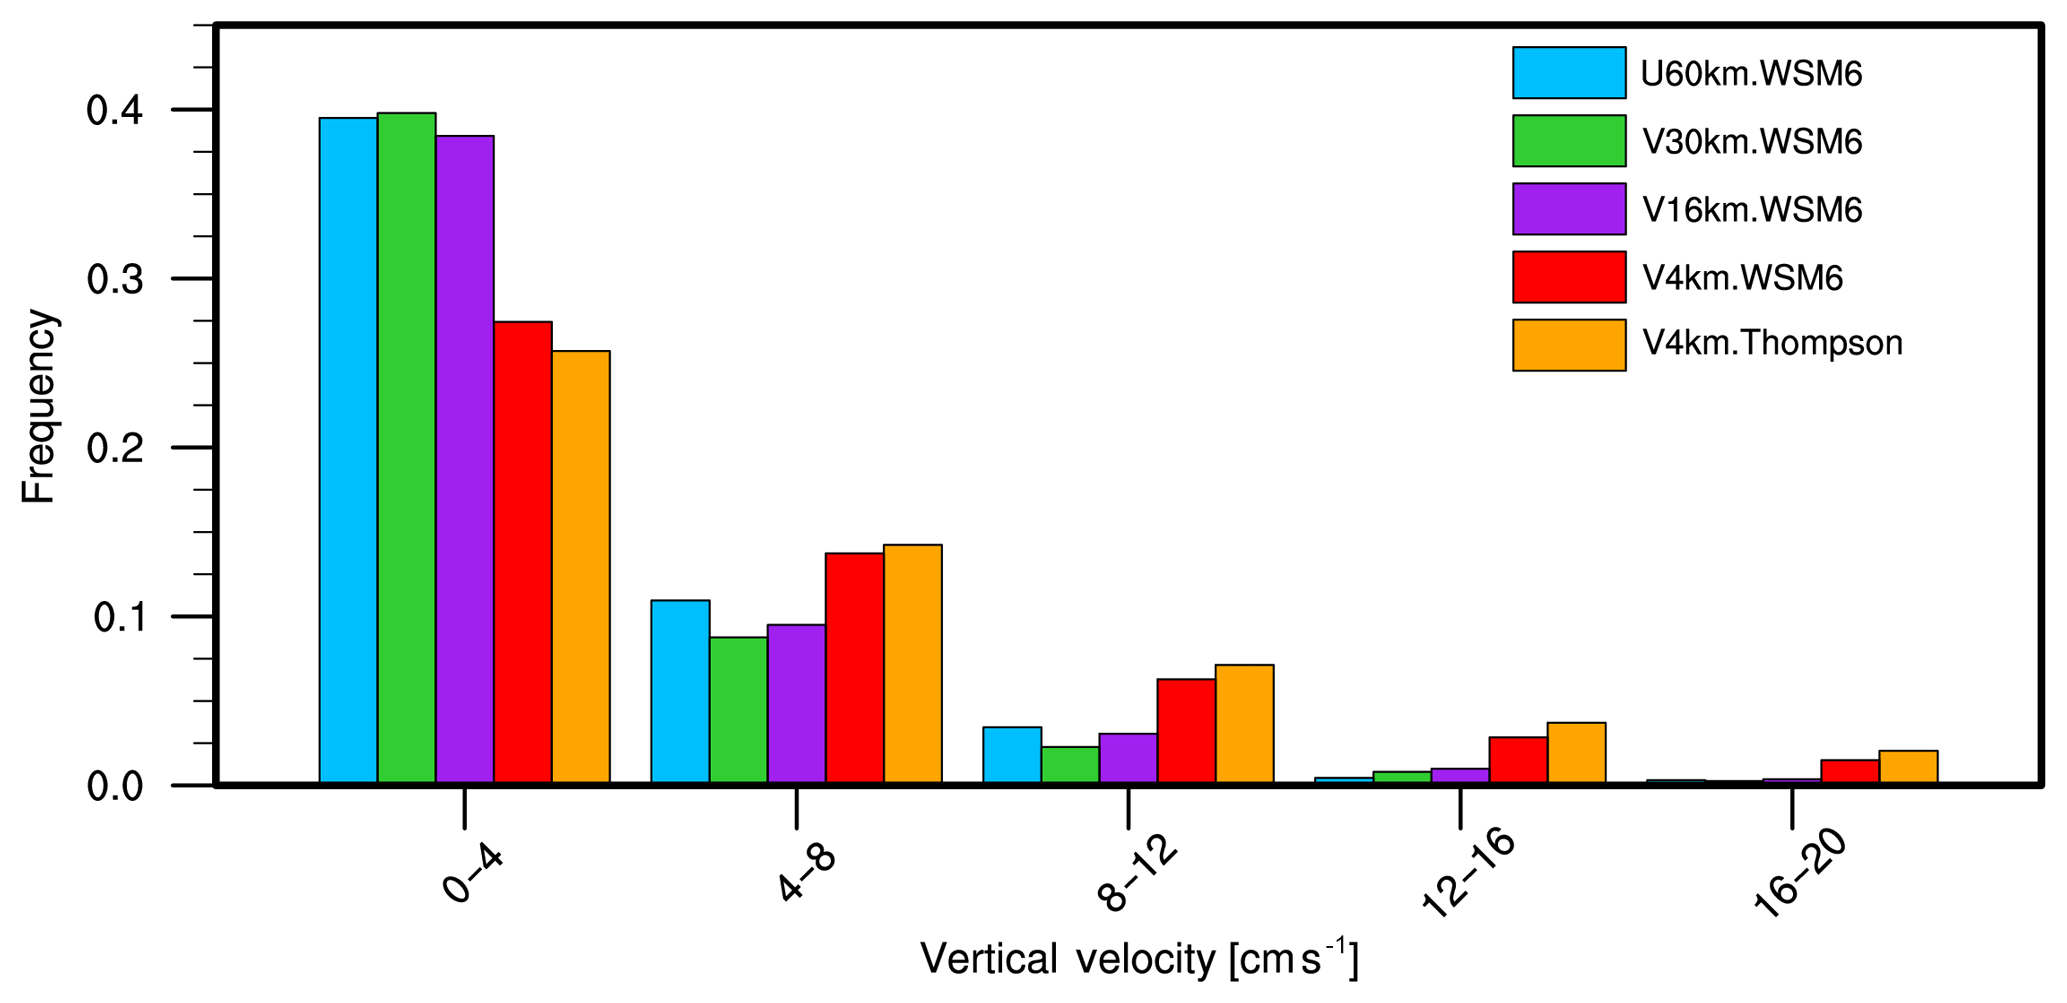
Figure 12Probability density functions (PDFs) of hourly upward vertical velocity averaged below 700 hPa at all the CMA stations during the event over East China (denoted as the black box in Fig. 6) from the MPAS simulations at resolutions of 60, 30, 16, and 4 km.
In this study, a series of MPAS simulations of a heavy precipitation event over East China, triggered by a typical southwest vortex in the middle and high troposphere and wind shear in the lower layer of the Meiyu front during the East Asian summer monsoon, are compared. The simulations are performed at various resolutions from hydrostatic (60, 30, 16 km) to non-hydrostatic (4 km) scales. Consistency between the MPAS simulations at global uniform and variable resolutions is also investigated. Besides the impacts of resolution on simulating heavy precipitation, the impacts of convective and cloud microphysics schemes are also examined. All the MPAS simulations are evaluated using the CMA station observations of precipitation and the ERA5 reanalysis of winds; they are compared against the NCEP GFS forecasts that share the same initial condition as the MPAS simulations.
In general, the MPAS simulations at global uniform (U15km) and variable (V16km) resolutions produce similar results in terms of the spatial and temporal distributions of precipitation and winds inside the refined region over East China. Both experiments can capture the observed precipitation characteristics. This suggests that the global variable-resolution configuration of MPAS may be appropriate to simulate heavy precipitation over East China, which is also consistent with findings from previous studies using variable-resolution MPAS with regional refinement over other parts of the globe (e.g., Sakaguchi et al., 2015; Zhao et al., 2016). The simulations with two different convective parameterizations show that the MPAS-simulated distributions of precipitation are affected by the convective schemes at hydrostatic scales, while the impacts from the cloud microphysics schemes are small.
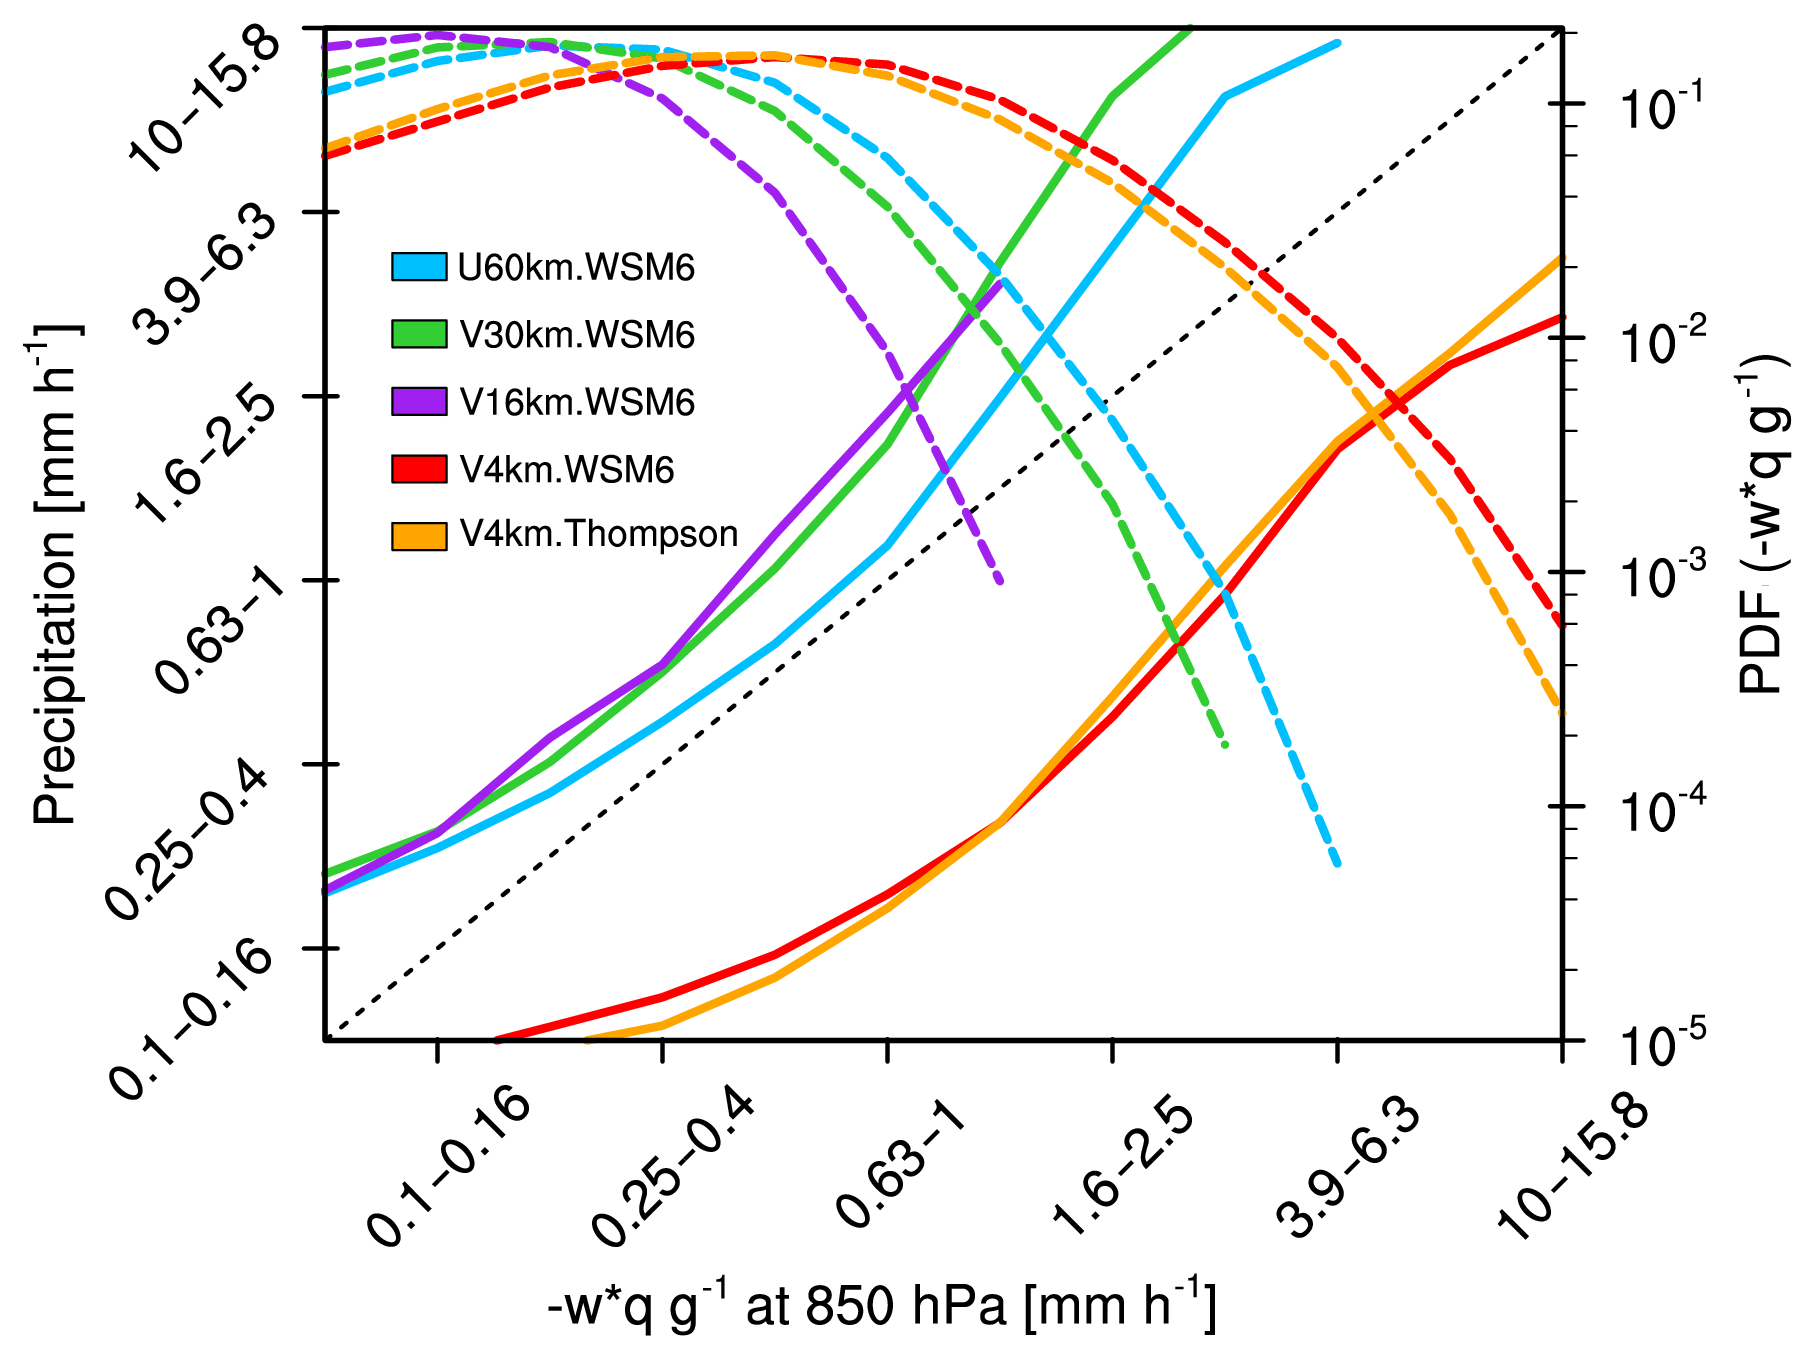
Figure 13Hourly precipitation versus upward moisture flux at 850 hPa during the event over East China (denoted as the black box in Fig. 6) from the MPAS simulations at resolutions of 60, 30, 16, and 4 km (solid line, left axis), with the PDFs of the upward moisture flux (dashed line, right axis).
The variable-resolution simulations spanning hydrostatic and non-hydrostatic scales reveal that the scale-aware GF convective parameterization produces less convective-parameterized precipitation as the horizontal resolution increases. Comparison against the station observations indicates that the MPAS simulations at 16 and 4 km can generally better capture the observed temporal and zonal distribution of the rain belt in the simulated event than the simulations at coarser resolutions. The experiments at 4 km can better capture the areas with heavy precipitation (>50 mm d−1) than the experiments at coarser resolutions compared to the observations, although the simulations at 4 km overestimate the first peak of precipitation and underestimate the second one. This may indicate that the convective parameterization is not able to produce intense precipitation. The analysis also shows that the underestimation of intense precipitation is consistent with the underestimation of resolved upward motion in the simulations at coarser resolutions. The biases in the locations of the rain belt are mainly due to failure of the model to simulate the wind shear structure of the Meiyu front during this event. This suggests that the position and structure of the wind shear of the Meiyu front, which produces the vertical motion, are sensitive to the models and their specific configurations even though all simulations share the same initial condition. Previous studies have found that the formation and evolution of wind shear during the Meiyu front can interact with multiscale processes and systems over East China, including terrain and convective latent heat (Yao et al., 2017). Therefore, a different representation of the terrain over East China in various resolutions and convective latent heat resulting from different physics schemes may affect the simulated wind shear structure among the MPAS experiments at various resolutions and between MPAS and GFS.
The performance of MPAS at the convection-permitting scale is quite sensitive to the cloud microphysics scheme in terms of the distribution and intensity of extreme precipitation. This is consistent with Feng et al. (2018), who found that cloud microphysics parameterizations in convection-permitting regional simulations have important effects on macroscale properties such as the lifetime, precipitation amount, and stratiform versus convective rain volumes of mesoscale convective systems in the US. They attributed the impacts to the representation of ice-phase hydrometeor species that influence mesoscale convective systems through their influence on the diabatic heating profiles that provide dynamic feedback to the circulation (Yang et al., 2017). Hence, more efforts may be needed to improve cloud microphysics processes for modeling extreme precipitation at the convection-permitting scale in the future. In the meantime, aerosols have been found to play a critical role in simulating some heavy precipitation events over China through their impacts on cloud microphysics and/or radiation (e.g., Zhong et al., 2015, 2017; Fan et al., 2015). The current version of MPAS does not represent aerosol–radiation and aerosol–cloud interactions, which may also contribute to the biases of extreme precipitation at convection-permitting scales. Lastly, it is also noteworthy that the resolution of 4 km may still be insufficient to resolve some convective cells, which may also contribute to the modeling biases (Bryan and Morrison, 2012).
This study provides the first evidence supporting the use of the global variable-resolution configuration of MPAS to simulate extreme precipitation events over East China. In particular, the MPAS variable-resolution experiment at the convection-permitting scale (4 km) improves the simulated distribution and intensity of precipitation over the area of interest, which is consistent with previous studies using regional convection-permitting models (e.g., Zhang et al., 2013; Prein et al., 2015; Yang et al., 2017; Gao et al., 2017; Feng et al., 2018). The higher-resolution MPAS experiments better simulate the spatial distribution of heavy precipitation over the complex topographic region of East China, which suggests that topography may play a critical role and deserves further investigation in the future. Our results show that cloud microphysics parameterizations have important effects on convection-permitting simulations, but modeling other physical processes such as boundary layer turbulence, radiation, and aerosols may also affect the skill of convection-permitting simulations. The GFS forecasts analyzed in this study show significant biases in precipitation distribution. The zonal shift of the rain belt by the MPAS simulations at coarser resolutions compared to simulations at finer resolutions suggests that resolution may have contributed to the GFS forecast biases. A more detailed exploration of the differences between the MPAS and GFS simulations is beyond the scope of this study.
Previous studies (Xue et al., 2007; Clark et al., 2016) noted the importance of ensemble simulations in predicting heavy precipitation. Due to the computational limitation, only one set of experiments with different physics and resolutions is evaluated in this study. The MPAS simulations of heavy precipitation with different initial conditions and refinement sizes deserve more evaluations. Finally, some studies noted that convection-permitting modeling does not always add value in simulating heavy precipitation compared to hydrostatic-scale modeling (e.g., Kain et al., 2008; Rhoades et al., 2018; Xu et al., 2018). Rhoades et al. (2018) found that improvement through increasing resolution may also depend on the cloud microphysics parameterization. Increasing horizontal resolution alone can sometimes even lead to worse model performance. The impacts of increasing horizontal resolution on the overall model performance in simulating extreme precipitation may also be affected by the model structure and coupling among model components and processes (Jeevanjee et al., 2017; O'Brien et al., 2016; Herrington and Reed, 2017, 2018; Gross et al., 2018). This study also found some sensitivity of modeling extreme precipitation to cloud microphysics, particularly at the convection-permitting scale. More events involving heavy precipitation over East China should be investigated in the future to more systematically evaluate the MPAS variable-resolution modeling framework and the impacts of resolution and physical parameterizations.
The MPAS release v5.2 can be obtained at mpas-dev.github.io. Global meshes generated for the experiments used in this study are available upon request by contacting the corresponding author Yu Wang (wangyu09@ustc.edu.cn) or Chun Zhao (chunzhao@ustc.edu.cn).
The supplement related to this article is available online at: https://doi.org/10.5194/gmd-12-2707-2019-supplement.
CZ and YW designed research. MX performed the simulations. CZ, MX, MZ, and ZH analyzed the simulations. JG collected and analyzed the observations. CZ, MX, and YW wrote the paper. LRL, MD, and WS guided the experiment design and edited the paper.
The authors declare that they have no conflict of interest.
This research was supported by the Ministry of Science and Technology of China under grant 2017YFC1501401 and the Fundamental Research Funds for the Central Universities. The study used computing resources from the High-Performance Computing Center of the University of Science and Technology of China (USTC) and the TH-2 of the National Supercomputer Center in Guangzhou (NSCC-GZ). L. Ruby Leung was supported by the U.S. Department of Energy Office of Science Biological and Environmental Research as part of the Regional and Global Modeling and Analysis program. PNNL is operated for the Department of Energy under contract DE-AC05-76RL01830.
This research has been supported by the Ministry of Science and Technology of China (grant no. 2017YFC1501401) and the Fundamental Research Funds for the Central Universities (grant no. NA).
This paper was edited by Jason Williams and reviewed by three anonymous referees.
Arakawa, A., Jung, J.-H., and Wu, C.-M.: Toward unification of the multiscale modeling of the atmosphere, Atmos. Chem. Phys., 11, 3731–3742, https://doi.org/10.5194/acp-11-3731-2011, 2011.
Bacmeister, J. T., Wehner, M. F., Neale, R. B., Gettelman, A., Hannay, C., Lauritzen, P. H., and Truesdale, J. E.: Exploratory high-resolution climate simulations using the Community Atmosphere Model (CAM), J. Climate, 27, 3073–3099, https://doi.org/10.1175/JCLI-D-13-00387.1, 2014.
Bechtold, P., Chaboureau, J. P., Beljaars, A., Betts, A. K., Köhler, M., Miller, M., and Redelsperger, J. L.: The simulation of the diurnal cycle of convective precipitation over land in a global model, Q. J. Roy. Meteorol. Soc., 130, 3119–3137, https://doi.org/10.1256/qj.03.103, 2004.
Bechtold, P., Köhler, M., Jung, T., Doblas-Reyes, F., Leutbecher, M., Rodwell, M. J., and Balsamo, G.: Advances in simulating atmospheric variability with the ECMWF model: From synoptic to decadal time-scales, Q. J. Roy. Meteorol. Soc., 134, 1337–1351, https://doi.org/10.1002/qj.289, 2008.
Bechtold, P., Semane, N., Lopez, P., Chaboureau, J. P., Beljaars, A., and Bormann, N.: Representing equilibrium and nonequilibrium convection in large-scale models, J. Atmos. Sci., 71, 734–753, https://doi.org/10.1175/JAS-D-13-0163.1, 2014.
Bryan, G. H. and Morrison, H.: Sensitivity of a simulated squall line to horizontal resolution and parameterization of microphysics, Mon. Weather Rev., 140, 202–225, https://doi.org/10.1175/MWR-D-11-00046.1, 2012.
Burakowski, E. A., Tawfik, A., Ouimette, A., Lepine, L., Zarzycki, C., Novick, K., and Bonan, G.: Simulating surface energy fluxes using the variable-resolution Community Earth System Model (VR-CESM), Theor. Appl. Climatol., 1–19, https://doi.org/10.1007/s00704-019-02785-0, 2019.
Chen, F. and Dudhia, J.: Coupling an advanced land surface–hydrology model with the Penn State–NCAR MM5 modeling system. Part I: Model implementation and sensitivity, Mon. Weather Rev., 129, 569–585, https://doi.org/10.1175/1520-0493(2001)129<0569:CAALSH>2.0.CO;2, 2001.
Clark, P., Roberts, N., Lean, H., Ballard, S. P., and Charlton-Perez, C.: Convection-permitting models: a step-change in rainfall forecasting, Meteorol. Appl., 23, 165–181, https://doi.org/10.1002/met.1538, 2016.
Déqué, M., Rowell, D. P., Lüthi, D., Giorgi, F., Christensen, J. H., Rockel, B., and van den Hurk, B. J. J. M.: An intercomparison of regional climate simulations for Europe: assessing uncertainties in model projections, Clim. Change, 81, 53–70, https://doi.org/10.1007/s10584-006-9228-x, 2007.
Ding, Y., Wang, Z., and Sun, Y.: Inter-decadal variation of the summer precipitation in East China and its association with decreasing Asian summer monsoon. Part I: Observed evidences, Int. J. Climatol., 28, 1139–1161, https://doi.org/10.1002/joc.1615, 2008.
Du, Q., Faber, V., and Gunzburger, M.: Centroidal Voronoi tessellations: Applications and algorithms, SIAM rev., 41, 637–676, https://doi.org/10.1137/S0036144599352836, 1999.
ECMWF: ECMWF strategy 2016–2025: The strength of a common goal, European Centre for Medium-Range Weather Forecasts Tech. Rep., 32 pp., available at: https://www.ecmwf.int/sites/default/files/ECMWF_Strategy_ 2016-2025.pdf (last access: 28 June 2019), 2016.
Efron, B.: Bootstrap methods: another look at the jackknife, in: Breakthroughs in statistics (569–593), Springer, New York, NY, https://doi.org/10.1007/978-1-4612-4380-9_41, 1992.
Efron, B. and Tibshirani, R. J.: An introduction to the bootstrap, CRC press, 1994.
Fan, J., Rosenfeld, D., Yang, Y., Zhao, C., Leung, L. R., and Li, Z.: Substantial contribution of anthropogenic air pollution to catastrophic floods in Southwest China, Geophys. Res. Lett., 42, 6066–6075, https://doi.org/10.1002/2015GL064479, 2015.
Feng, Z., Leung, L. R., Houze Jr., R. A., Hagos, S., Hardin, J., Yang, Q., Han, B., and Fan, J.: Structure and evolution of mesoscale convective systems: sensitivity to cloud microphysics in convection-permitting simulations over the U.S., J. Adv. Model. Earth Syst., 10, 1470–1494, https://doi.org/10.1029/2018MS001305, 2018.
Fildier, B., Parishani, H., and Collins, W. D.: Prognostic Power of Extreme Rainfall Scaling Formulas Across Space and Time Scales, J. Adv. Model. Earth Syst., 10, 3252–3267, https://doi.org/10.1029/2018MS001462, 2018.
Fowler, L. D., Skamarock, W. C., Grell, G. A., Freitas, S. R., and Duda, M. G.: Analyzing the Grell–Freitas convection scheme from hydrostatic to nonhydrostatic scales within a global model, Mon. Weather Rev., 144, 2285–2306, https://doi.org/10.1175/MWR-D-15-0311.1, 2016.
Fritsch, J. M. and Carbone, R. E.: Improving quantitative precipitation forecasts in the warm season: A USWRP research and development strategy, B. Am. Meteorol. Soc., 85, 955–966, https://doi.org/10.1175/BAMS-85-7-955, 2004.
Gao, Y., Leung, L. R., Zhao, C., and Hagos, S.: Sensitivity of summer precipitation to model resolution and convective parameterizations across gray zone resolutions, J. Geophys. Res., 122, 2714–2733, https://doi.org/10.1002/2016JD025896, 2017.
Gettelman, A., Callaghan, P., Larson, V. E., Zarzycki, C. M., Bacmeister, J. T., Lauritzen, P. H., and Neale, R. B.: Regional climate simulations with the community earth system model, J. Adv. Model. Earth Syst., 10, 1245–1265, https://doi.org/10.1002/2017MS001227, 2018.
Gettelman, A., Morrison, H., and Thompson, G.: Cloud Microphysics Across Scales for Weather and Climate, in: Current Trends in the Representation of Physical Processes in Weather andClimate Models, edited by: Randall, D., Srinivasan, J., Nanjundiah, R., and Mukhopadhyay, P., Springer Atmospheric Sciences, Springer, Singapore, 2019.
Giorgi, F. and Marinucci, M. R.: A investigation of the sensitivity of simulated precipitation to model resolution and its implications for climate studies, Mon. Weather Rev., 124, 148–166, https://doi.org/10.1175/1520-0493(1996)124<0148:AIOTSO>2.0.CO;2, 1996.
Giorgi, F. and Mearns, L. O.: Approaches to the simulation of regional climate change: a review, Rev. Geophys., 29, 191–216, https://doi.org/10.1029/90RG02636, 1991.
Grell, G. A. and Dévényi, D.: A generalized approach to parameterizing convection combining ensemble and data assimilation techniques, Geophys. Res. Lett., 29, 38–1, https://doi.org/10.1029/2002GL015311, 2002.
Grell, G. A. and Freitas, S. R.: A scale and aerosol aware stochastic convective parameterization for weather and air quality modeling, Atmos. Chem. Phys., 14, 5233–5250, https://doi.org/10.5194/acp-14-5233-2014, 2014.
Gross, M., Wan, H., Rasch, P. J., Caldwell, P. M., Williamson, D. L., Klocke, D., Christiane, J, Diana, T., Nigel, W., Mike, C, Bob, B., Martin, W., Florian, L., Eric, B., Sylvie, M., Piet, T., Almut, G., Peter, L., Hans, J., Colin, Z., Sakaguchi, K., and Leung, R.: Physics–Dynamics Coupling in Weather, Climate, and Earth System Models: Challenges and Recent Progress, Mon. Weather Rev., 146, 3505–3544, https://doi.org/10.1175/MWR-D-17-0345.1, 2018.
Guo, J., Su, T., Li, Z., Miao, Y., Li, J., Liu, H., Xu, H., Cribb, M., and Zhai, P.: Declining frequency of summertime local-scale precipitation over eastern China from 1970 to 2010 and its potential link to aerosols, Geophys. Res. Lett., 44, 5700–5708, 2017.
Hagos, S., Leung, L. R., Yang, Q., Zhao, C., and Lu, J.: Resolution and dynamical core dependence of atmospheric river frequency in global model simulations, J. Climate, 28, 2764–2776, https://doi.org/10.1175/JCLI-D-14-00567.1, 2015.
Herrington, A. R. and Reed, K. A.: An explanation for the sensitivity of the mean state of the community atmosphere model to horizontal resolution on aquaplanets, J. Climate, 30, 4781–4797, https://doi.org/10.1175/JCLI-D-16-0069.1, 2017.
Herrington, A. R. and Reed, K. A.: An Idealized Test of the Response of the Community Atmosphere Model to Near-Grid-Scale Forcing Across Hydrostatic Resolutions, J. Adv. Model. Earth Syst., 10, 560–575, https://doi.org/10.1002/2017MS001078, 2018.
Hong, S. Y.: A new stable boundary-layer mixing scheme and its impact on the simulated East Asian summer monsoon, Q. J. Roy. Meteorol. Soc., 136, 1481–1496, https://doi.org/10.1002/qj.665, 2010.
Hong, S. Y. and Lim, J. O. J.: The WRF single-moment 6-class microphysics scheme (WSM6), J. Korean Meteor. Soc., 42, 129–151, 2006.
Hong, S. Y., Noh, Y., and Dudhia, J.: A new vertical diffusion package with an explicit treatment of entrainment processes, Mon. Weather Rev., 134, 2318–2341, https://doi.org/10.1175/MWR3199.1, 2006.
Huang, X., Rhoades, A. M., Ullrich, P. A., and Zarzycki, C. M.: An evaluation of the variable-resolution CESM for modeling California's climate, J. Adv. Model. Earth Syst., 8, 345–369, https://doi.org/10.1002/2015MS000559, 2016.
Hui, P., Tang, J., Wang, S., and Wu, J.: Sensitivity of simulated extreme precipitation and temperature to convective parameterization using RegCM3 in China, Theor. Appl. Climatol., 122, 315–335, https://doi.org/10.1007/s00704-014-1300-2, 2015.
Iacono, M. J., Mlawer, E. J., Clough, S. A., and Morcrette, J. J.: Impact of an improved longwave radiation model, RRTM, on the energy budget and thermodynamic properties of the NCAR community climate model, CCM3, J. Geophys. Res.-Atmos., 105, 14873–14890, https://doi.org/10.1029/2000JD900091, 2000.
Jeevanjee, N.: Vertical velocity in the gray zone, J. Adv. Model. Earth Syst., 9, 2304–2316, https://doi.org/10.1002/2017MS001059, 2017.
Ju, L., Ringler, T., and Gunzburger, M.: Voronoi tessellations and their application to climate and global modeling, in: Numerical techniques for global atmospheric models (313–342), Springer, Berlin, Heidelberg, https://doi.org/10.1007/978-3-642-11640-7_10, 2011.
Judt, F.: Insights into Atmospheric Predictability through Global Convection-Permitting Model Simulations, J. Atmos. Sci., 75, 1477–1497, https://doi.org/10.1175/JAS-D-17-0343.1, 2018.
Kain, J. S.: The Kain–Fritsch convective parameterization: an update, J. Appl. Meteorol., 43, 170–181, https://doi.org/10.1175/1520-0450(2004)043<0170:TKCPAU>2.0.CO;2, 2004.
Kain, J. S., Weiss, S. J., Bright, D. R., Baldwin, M. E., Levit, J. J., Carbin, G. W., and Thomas, K. W.: Some practical considerations regarding horizontal resolution in the first generation of operational convection-allowing NWP, Weather Forecast., 23, 931–952, https://doi.org/10.1175/WAF2007106.1, 2008.
Klemp, J. B.: A terrain-following coordinate with smoothed coordinate surfaces, Mon. Weather Rev., 139, 2163–2169, https://doi.org/10.1175/MWR-D-10-05046.1, 2011.
Klemp, J. B., Skamarock, W. C., and Dudhia, J.: Conservative split-explicit time integration methods for the compressible nonhydrostatic equations, Mon. Weather Rev., 135, 2897–2913, https://doi.org/10.1175/MWR3440.1, 2007.
Landu, K., Leung, L. R., Hagos, S., Vinoj, V., Rauscher, S. A., Ringler, T., and Taylor, M.: The dependence of ITCZ structure on model resolution and dynamical core in aquaplanet simulations, J. Climate, 27, 2375–2385, https://doi.org/10.1175/JCLI-D-13-00269.1, 2014.
Laprise, R.: Regional climate modelling, J. Comput. Phys., 227, 3641–3666, https://doi.org/10.1016/j.jcp.2006.10.024, 2008.
Leung, L. R. and Qian, Y.: The sensitivity of precipitation and snowpack simulations to model resolution via nesting in regions of complex terrain, J. Hydrometeorol., 4, 1025–1043, https://doi.org/10.1175/1525-7541(2003)004<1025:TSOPAS>2.0.CO;2, 2003.
Leung, L. R., Ringler, T., Collins, W. D., Taylor, M., and Ashfaq, M.: A hierarchical evaluation of regional climate simulations, Eos, Trans. Am. Geophys. Union, 94, 297–298, https://doi.org/10.1002/2013EO340001, 2013.
Li, J., Zhang, Q., Chen, Y. D., and Singh, V. P.: GCMs-based spatiotemporal evolution of climate extremes during the 21st century in China, J. Geophys. Res.-Atmos., 118, 11-017, https://doi.org/10.1002/jgrd.50851, 2013.
Li, W., Jiang, Z., Xu, J., and Li, L.: Extreme Precipitation Indices over China in CMIP5 Models. Part II: Probabilistic Projection, J. Climate, 29, 8989–9004, https://doi.org/10.1175/JCLI-D-16-0377.1, 2016.
Li, Z., Lau, W. K. M., Ramanathan, V., Wu, G., Ding, Y., Manoj, M. G., Liu, J., Qian, Y., Li, J., Zhou, T., Fan, J., Rosenfeld, D., Ming, Y., Wang, Y., Huang, J., Wang, B., Xu, X., Lee, S. S., Cribb, M., Zhang, F., Yang, X., Zhao, C., Takemura, T., Wang, K., Xia, X., Yin, Y., Zhang, H., Guo, J., Zhai, P. M., Sugimoto, N., Babu, S. S., and Brasseur, G. P. : Aerosol and monsoon climate interactions over Asia, Rev. Geophys., 54, 866–929, https://doi.org/10.1002/2015RG000500, 2016.
Lin, Z. and Wang, B.: Northern East Asian low and its impact on the interannual variation of East Asian summer rainfall, Clim. Dynam., 46, 83–97, https://doi.org/10.1007/s00382-015-2570-9, 2016.
Liu, R., Liu, S. C., Cicerone, R. J., Shiu, C. J., Li, J., Wang, J., and Zhang, Y.: Trends of extreme precipitation in eastern China and their possible causes, Adv. Atmos. Sci., 32, 1027–1037, https://doi.org/10.1007/s00376-015-5002-1, 2015.
Locatelli, J. D. and Hobbs, P. V.: Fall speeds and masses of solid precipitation particles, J. Geophys. Res., 79, 2185–2197, https://doi.org/10.1029/JC079i015p02185, 1974.
Lorant, V. and Royer, J. F.: Sensitivity of equatorial convection to horizontal resolution in aquaplanet simulations with a variable-resolution GCM, Mon. Weather Rev., 129, 2730–2745, https://doi.org/10.1175/1520-0493(2001)129<2730:SOECTH>2.0.CO;2, 2001.
Lu, J., Chen, G., Leung, L. R., Burrows, D. A., Yang, Q., Sakaguchi, K., and Hagos, S.: Toward the dynamical convergence on the jet stream in aquaplanet AGCMs, J. Climate, 28, 6763–6782, https://doi.org/10.1175/JCLI-D-14-00761.1, 2015.
Mlawer, E. J., Taubman, S. J., Brown, P. D., Iacono, M. J., and Clough, S. A.: Radiative transfer for inhomogeneous atmospheres: RRTM, a validated correlated-k model for the longwave, J. Geophys. Res.-Atmos., 102, 16663–16682, https://doi.org/10.1029/97JD00237, 1997.
Molthan, A. L. and Colle, B. A.: Comparisons of single-and double-moment microphysics schemes in the simulation of a synoptic-scale snowfall event, Mon. Weather Rev., 140, 2982–3002, https://doi.org/10.1175/MWR-D-11-00292.1, 2012.
Nakanishi, M. and Niino, H.: An improved Mellor–Yamada level-3 model: Its numerical stability and application to a regional prediction of advection fogm Bound.-Lay. Meteorol., 119, 397–407, https://doi.org/10.1007/s10546-005-9030-8, 2006.
Nakanishi, M. and Niino, H.: Development of an improved turbulence closure model for the atmospheric boundary layer, J. Meteorol. Soc. JPN Ser. II, 87, 895–912, https://doi.org/10.2151/jmsj.87.895, 2009.
NRC: National Research Council Board, A National Strategy for Advancing Climate Modeling, The National Academies Press, Washington, DC, available at: http://www.nap.edu/catalog/13430/a-national-strategy-for-advancing-climate-modeling (last access: 25 April 2019), 2012.
O'Brien, T. A., Li, F., Collins, W. D., Rauscher, S. A., Ringler, T. D., Taylor, M., Hagos, S. M., and Leung, L. R.: Observed scaling in clouds and precipitation and scale incognizance in regional to global atmospheric models, J. Climate, 26, 9313–9333, https://doi.org/10.1175/JCLI-D-13-00005.1, 2013.
O'Brien, T. A., Collins, W. D., Kashinath, K., Rübel, O., Byna, S., Gu, J., Krishnan, H, and Ullrich, P.: Resolution dependence of precipitation statistical fidelity in hindcast simulations, J. Adv. Model. Earth Syst., 8, 976–990, https://doi.org/10.1002/2016MS000671, 2016.
Park, S. H., Skamarock, W. C., Klemp, J. B., Fowler, L. D., and Duda, M. G.: Evaluation of global atmospheric solvers using extensions of the Jablonowski and Williamson baroclinic wave test case, Mon. Weather Rev., 14, 3116–3129, https://doi.org/10.1175/MWR-D-12-00096.1, 2013.
Pedersen, C. A. and Winther, J. G.: Intercomparison and validation of snow albedo parameterization schemes in climate models, Clim. Dynam., 25, 351–362, https://doi.org/10.1007/s00382-005-0037-0, 2005.
Prein, A. F., Langhans, W., Fosser, G., Ferrone, A., Ban, N., Goergen, K., and Brisson, E.: A review on regional convection-permitting climate modeling: Demonstrations, prospects, and challenges, Rev. Geophys., 53, 323–361, https://doi.org/10.1002/2014RG000475, 2015.
Prein, A. F., Rasmussen, R. M., Ikeda, K., Liu, C., Clark, M. P., and Holland, G. J.: The future intensification of hourly precipitation extremes, Nat. Clim. Change, 7, 48, https://doi.org/10.1038/nclimate3168, 2017.
Rauscher, S. A., Ringler, T. D., Skamarock, W. C., and Mirin, A. A.: Exploring a global multiresolution modeling approach using aquaplanet simulations, J. Climate, 26, 2432–2452, https://doi.org/10.1175/JCLI-D-12-00154.1, 2013.
Rauscher, S. A., O'Brien, T. A., Piani, C., Coppola, E., Giorgi, F., Collins, W. D., and Lawston, P. M.: A multimodel intercomparison of resolution effects on precipitation: simulations and theory, Clim. Dynam., 47, 2205–2218, https://doi.org/10.1007/s00382-015-2959-5, 2016.
Rhoades, A. M., Huang, X., Ullrich, P. A., and Zarzycki, C. M.: Characterizing Sierra Nevada snowpack using variable-resolution CESM, J. Appl. Meteorol. Climatol., 55, 173–196, https://doi.org/10.1175/JAMC-D-15-0156.1, 2016.
Rhoades, A. M., Ullrich, P. A., Zarzycki, C. M., Johansen, H., Margulis, S. A., Morrison, H., and Collins, W. D.: Sensitivity of Mountain Hydroclimate Simulations in Variable-Resolution CESM to Microphysics and Horizontal Resolution, J. Adv. Model. Earth Syst., 10, 1357–1380, https://doi.org/10.1029/2018MS001326, 2018.
Ringler, T., Ju, L., and Gunzburger, M.: A multiresolution method for climate system modeling: Application of spherical centroidal Voronoi tessellations, Ocean Dynam., 58, 475–498, https://doi.org/10.1007/s10236-008-0157-2, 2008.
Ringler, T. D., Jacobsen, D., Gunzburger, M., Ju, L., Duda, M., and Skamarock, W.: Exploring a multiresolution modeling approach within the shallow-water equations, Mon. Weather Rev., 139, 3348–3368, https://doi.org/10.1175/MWR-D-10-05049.1, 2011.
Sakaguchi, K., Leung, L. R., Zhao, C., Yang, Q., Lu, J., and Hagos, S.: Exploring a multiresolution approach using AMIP simulations, J. Climate, 28, 5549–5574, https://doi.org/10.1175/JCLI-D-14-00729.1, 2015.
Sakaguchi, K., Lu, J., Leung, L. R., Zhao, C., Li, Y., and Hagos, S.: Sources and pathways of the upscale effects on the Southern Hemisphere jet in MPAS-CAM4 variable-resolution simulations, J. Adv. Model. Earth Syst., 8, 1786–1805, https://doi.org/10.1002/2016MS000743, 2016.
Skamarock, W. C. and Gassmann, A.: Conservative transport schemes for spherical geodesic grids: High-order flux operators for ODE-based time integration, Mon. Weather Rev., 139, 2962–2975, https://doi.org/10.1175/MWR-D-10-05056.1, 2011.
Skamarock, W. C. and Klemp, J. B.: A time-split nonhydrostatic atmospheric model for weather research and forecasting applications, J. Comput. Phys., 227, 3465–3485, https://doi.org/10.1016/j.jcp.2007.01.037, 2008.
Skamarock, W. C., Klemp, J. B., Duda, M. G., Fowler, L. D., Park, S. H., and Ringler, T. D.: A multiscale nonhydrostatic atmospheric model using centroidal Voronoi tesselations and C-grid staggering, Mon. Weather Rev., 140, 3090–3105, https://doi.org/10.1175/MWR-D-11-00215.1, 2012.
Sukovich, E. M., Ralph, F. M., Barthold, F. E., Reynolds, D. W., and Novak, D. R.: Extreme quantitative precipitation forecast performance at the Weather Prediction Center from 2001 to 2011, Weather Forecast., 29, 894–911, https://doi.org/10.1175/WAF-D-13-00061.1, 2014.
Thompson, G., Field, P. R., Rasmussen, R. M., and Hall, W. D.: Explicit forecasts of winter precipitation using an improved bulk microphysics scheme. Part II: Implementation of a new snow parameterization, Mon. Weather Rev., 136, 5095–5115, https://doi.org/10.1175/2008MWR2387.1, 2008.
Wang, M. and Ullrich, P.: Marine air penetration in California's Central Valley: Meteorological drivers and the impact of climate change, J. Appl. Meteorol. Climatol., 57, 137–154, https://doi.org/10.1175/JAMC-D-17-0089.1, 2018.
Wang, Y., Leung, L. R., McGREGOR, J. L., Lee, D. K., Wang, W. C., Ding, Y., and Kimura, F.: Regional climate modeling: progress, challenges, and prospects, J. Meteorol. Soc. JPN Ser. II, 82, 1599–1628, https://doi.org/10.2151/jmsj.82.1599, 2004.
Wicker, L. J. and Skamarock, W. C.: Time-splitting methods for elastic models using forward time schemes, Mon. Weather Rev., 130, 2088–2097, https://doi.org/10.1175/1520-0493(2002)130<2088:TSMFEM>2.0.CO;2, 2002.
Wu, C., Liu, X., Lin, Z., Rhoades, A. M., Ullrich, P. A., Zarzycki, C. M., and Rahimi-Esfarjani, S. R.: Exploring a variable-resolution approach for simulating regional climate in the Rocky Mountain region using the VR-CESM, J. Geophys. Res.-Atmos., 122, 10–939, https://doi.org/10.1002/2017JD027008, 2017.
Xiang, S., Li, Y., Li, D., and Yang, S.: An analysis of heavy precipitation caused by a retracing plateau vortex based on TRMM data, Meteorol. Atmos. Phys., 122, 33-45, https://doi.org/10.1007/s00703-013-0269-1, 2013.
Xu, H. and Yao, W.: A numerical study of the Beijing extreme rainfall of 21 July 2012 and the impact of topography, Adv. Meteorol., 2015, 980747, https://doi.org/10.1155/2015/980747, 2015.
Xu, Z., Rhoades, A. M., Johansen, H., Ullrich, P. A., and Collins, W. D.: An intercomparison of GCM and RCM dynamical downscaling for characterizing the hydroclimatology of California and Nevada, J. Hydrometeorol., 19, 1485–1506, https://doi.org/10.1175/JHM-D-17-0181.1, 2018.
Xue, M., Kong, F., Weber, D., Thomas, K. W., Wang, Y., Brewster, K., and Coniglio, M. C.: CAPS realtime storm-scale ensemble and high-resolution forecasts as part of the NOAA Hazardous Weather Testbed 2007 spring experiment, in: 22nd Conf. Wea. Anal. Forecasting/18th Conf. Num. Wea. Pred, 2007.
Yang, Q., Leung, L. R., Rauscher, S. A., Ringler, T. D., and Taylor, M. A.: Atmospheric moisture budget and spatial resolution dependence of precipitation extremes in aquaplanet simulations, J. Climate, 27, 3565–3581, https://doi.org/10.1175/JCLI-D-13-00468.1, 2014.
Yang, Q., Houze Jr., R., Leung, L. R., and Feng, Z.: Environments of long-lived mesoscale convective systems over the Central United States in convection permitting climate simulations, J. Geophys. Res., 122, 13288–13307, https://doi.org/10.1002/2017JD027033, 2017.
Yao, X. P., Sun, J. Y., and Ma, J. L.: Advances on research of Yangtze-Huaihe shear line, Plateau Meteorol., 36, 1138–1151 (in Chinese), 2017.
Zarzycki, C. M., Jablonowski, C., and Taylor, M. A.: Using variable resolution meshes to model tropical cyclones in the community atmosphere model, Mon. Weather Rev., 142, 1221–1239, https://doi.org/10.1175/MWR-D-13-00179.1, 2014.
Zarzycki, C. M., Jablonowski, C., Thatcher, D. R., and Taylor, M. A.: Effects of localized grid refinement on the general circulation and climatology in the community atmosphere model, J. Climate, 28, 2777–2803, https://doi.org/10.1175/JCLI-D-14-00599.1, 2015.
Zhai, P., Zhang, X., Wan, H., and Pan, X.: Trends in total precipitation and frequency of daily precipitation extremes over China, J. Climate, 18, 1096–1108, https://doi.org/10.1175/JCLI-3318.1, 2005.
Zhang, D. L., Lin, Y., Zhao, P., Yu, X., Wang, S., Kang, H., and Ding, Y.: The Beijing extreme rainfall of 21 July 2012: “Right results” but for wrong reasons, Geophys. Res. Lett., 40, 1426–1431, https://doi.org/10.1002/grl.50304, 2013.
Zhang, H. and Zhai, P.: Temporal and spatial characteristics of extreme hourly precipitation over eastern China in the warm season, Adv. Atmos. Sci., 28, 1177, https://doi.org/10.1007/s00376-011-0020-0, 2011.
Zhang, L., Dong, M., and Wu, T.: Changes in precipitation extremes over eastern China simulated by the Beijing Climate Center Climate System Model (BCC_CSM1.0), Clim. Res., 50, 227–245, https://doi.org/10.3354/cr01066, 2011.
Zhang, Q., Xiao, M., Singh, V. P., Liu, L., and Xu, C. Y.: Observational evidence of summer precipitation deficit-temperature coupling in China, J. Geophys. Res.-Atmos., 120, 10-040, https://doi.org/10.1002/2015JD023830, 2011.
Zhang, Q., Zheng, Y., Singh, V. P., Luo, M., and Xie, Z.: Summer extreme precipitation in eastern China: Mechanisms and impacts, J. Geophys. Res.-Atmos., 122, 2766–2778, https://doi.org/10.1002/2016JD025913, 2017.
Yu, P., Zhang, L., and Zhong: An interdecadal change in the relationship between the western North Pacific Ocean and the East Asian summer monsoon, Clim. Dynam., 49, 1139–1156, https://doi.org/10.1007/s00382-016-3370-6, 2017.
Zhao, C., Leung, L. R., Park, S. H., Hagos, S., Lu, J., Sakaguchi, K., ... and Duda, M. G.: Exploring the impacts of physics and resolution on aqua,planet simulations from a nonhydrostatic global variablemresolution modeling framework, J. Adv. Model. Earth Syst, 8, 1751–1768, https://doi.org/10.1002/2016MS000727, 2016.
Zhao, Y., Xu, X., Zhao, T., Xu, H., Mao, F., Sun, H., and Wang, Y.: Extreme precipitation events in East China and associated moisture transport pathways, Sci. China Earth Sci., 59, 1854–1872, https://doi.org/10.1007/s11430-016-5315-7, 2016.
Zheng, Y., Xue, M., Li, B., Chen, J., and Tao, Z.: Spatial characteristics of extreme rainfall over China with hourly through 24-hour accumulation periods based on national-level hourly rain gauge data, Adv. Atmos. Sci., 33, 1218–1232, https://doi.org/10.1007/s00376-016-6128-5, 2016.
Zhong, S., pQian, Y., Zhao, C., Leung, R., and Yang, X. Q.: A case study of urbanization impact on summer preciitation in the Greater Beijing Metropolitan Area: Urban heat island versus aerosol effects, J. Geophys. Res.-Atmos., 120, 10–903, https://doi.org/10.1002/2015JD023753, 2015.
Zhong, S., Qian, Y., Zhao, C., Leung, R., Wang, H., Yang, B., Fan, J., Yan, H., Yang, X.-Q., and Liu, D.: Urbanization-induced urban heat island and aerosol effects on climate extremes in the Yangtze River Delta region of China, Atmos. Chem. Phys., 17, 5439–5457, https://doi.org/10.5194/acp-17-5439-2017, 2017.
Zhou, T. J. and Li, Z.: Simulation of the East Asian summer monsoon using a variable resolution atmospheric GCM, Clim. Dynam., 19, 167–180, https://doi.org/10.1007/s00382-001-0214-8, 2002.