the Creative Commons Attribution 4.0 License.
the Creative Commons Attribution 4.0 License.
 | 28 Jun 2019
The roles of volatile organic compound deposition and oxidation mechanisms in determining secondary organic aerosol production: a global perspective using the UKCA chemistry–climate model (vn8.4)
Jamie M. Kelly
Ruth M. Doherty
Fiona M. O'Connor
Graham W. Mann
Dantong Liu
The representation of volatile organic compound (VOC) deposition and oxidation mechanisms in the context of secondary organic aerosol (SOA) formation are developed in the United Kingdom Chemistry and Aerosol (UKCA) chemistry–climate model. Impacts of these developments on both the global SOA budget and model agreement with observations are quantified. Firstly, global model simulations were performed with varying VOC dry deposition and wet deposition fluxes. Including VOC dry deposition reduces the global annual-total SOA production rate by 2 %–32 %, with the range reflecting uncertainties in surface resistances. Including VOC wet deposition reduces the global annual-total SOA production rate by 15 % and is relatively insensitive to changes in effective Henry's law coefficients. Without precursor deposition, simulated SOA concentrations are lower than observed with a normalised mean bias (NMB) of −51 %. Hence, including SOA precursor deposition worsens model agreement with observations even further (NMB %). Secondly, for the anthropogenic and biomass burning VOC precursors of SOA (VOCANT∕BB), model simulations were performed by (a) varying the parent hydrocarbon reactivity, (b) varying the number of reaction intermediates, and (c) accounting for differences in volatility between oxidation products from various pathways. These changes were compared to a scheme where VOCANT∕BB adopts the reactivity of a monoterpene (α-pinene), and is oxidised in a single-step mechanism with a fixed SOA yield. By using the chemical reactivity of either benzene, toluene, or naphthalene for VOCANT∕BB, the global annual-total VOCANT∕BB oxidation rate changes by −3 %, −31 %, or −66 %, respectively, compared to when using α-pinene. Increasing the number of reaction intermediates, by introducing a peroxy radical (RO2), slightly slows the rate of SOA formation, but has no impact on the global annual-total SOA production rate. However, RO2 undergoes competitive oxidation reactions, forming products with substantially different volatilities. Accounting for the differences in product volatility between RO2 oxidation pathways increases the global SOA production rate by 153 % compared to using a single SOA yield. Overall, for relatively reactive compounds such as toluene and naphthalene, the reduction in reactivity for VOCANT∕BB oxidation is outweighed by accounting for the difference in volatility of RO2 products, leading to a net increase in the global annual-total SOA production rate of 85 % and 145 %, respectively, and improvements in model agreement (NMB of −46 % and 56 %, respectively). However, for benzene, the reduction in VOCANT∕BB oxidation is not outweighed by accounting for the difference in SOA yield pathways, leading to a small change in the global annual-total SOA production rate of −3 %, and a slight worsening of model agreement with observations (NMB %). These results highlight that variations in both VOC deposition and oxidation mechanisms contribute to substantial uncertainties in the global SOA budget and model agreement with observations.
- Article
(8521 KB) - Full-text XML
- BibTeX
- EndNote


Aerosols are detrimental to human health (WHO, 2013) and are linked to climate change (Forster and Ramaswamy, 2007). The development of air quality and climate management plans are hindered by the challenges in representing aerosol within models. Secondary organic aerosol (SOA) is formed in the atmosphere from a variety of hydrocarbons. Gas-phase production of SOA occurs by condensation of volatile organic compound (VOC) oxidation products (Odum et al., 1996, 1997) and from semi-volatile and intermediate-volatility organic compounds (S/IVOCs) (Donahue et al., 2006, 2011). Additionally, SOA formation can take place within the aqueous phase of cloud and aerosol liquid water (McNeill, 2015; Ervens, 2015). The treatment of hydrocarbon physicochemical processes within SOA schemes varies sizably across global chemistry–climate and chemical transport models, and this is reflected in both an uncertain global SOA budget and poor model agreement with observations (Tsigaridis et al., 2014).
The diversity in model treatment of SOA formation is partially due to the myriad of unique organic molecules in the atmosphere, a small fraction of which have been measured (Goldstein and Galbally, 2007). In the simplest of schemes, production of SOA is calculated as a function of emissions, hence SOA is “emitted” as opposed to being formed in the atmosphere (Tsigaridis et al., 2014). In cases where gas-phase oxidation of SOA precursors is treated, several simplifications are commonly made. For example, biogenic VOCs, such as isoprene and monoterpenes, are known to have multi-generational oxidation mechanisms, but the mechanisms are often reduced to less than two reaction steps when implemented in global models (Chung and Seinfeld, 2002; Heald et al., 2011; Scott et al., 2014, 2015). Similarly, multi-generational oxidation mechanisms of aromatic compounds are often represented by less than two reaction steps (Tsigaridis and Kanakidou, 2003; Heald et al., 2011). Gas-phase oxidation schemes can also be simplified by grouping organic compounds together (i.e. “lumping”). In some schemes, organic compounds are lumped according to emissions types, anthropogenic or biomass burning (Spracklen et al., 2011; Hodzic et al., 2016), whereas in others they are grouped according to volatility (Donahue et al., 2006, 2011). By lumping organic species together, chemical ageing can be accounted for, even if the exact mechanism is not known. However, in grouping species together, molecular information is lost and therefore it is challenging to select the appropriate reaction coefficients and SOA yields from laboratory studies (Kelly et al., 2018). In more complex SOA schemes, gas-phase oxidation is treated explicitly (Lin et al., 2012, 2014;Khan et al., 2017), but this method is limited to SOA precursors with relatively well-known oxidation mechanisms.
The sources and physicochemical processes of hydrocarbons included within SOA schemes also vary between models. Examples of model diversity include the inclusion of SOA formation within the aqueous phase (Lin et al., 2014) and from S/IVOCs (Pye and Seinfeld, 2010), as well as SOA being treated as semi-volatile as opposed to non-volatile (Shrivastava et al., 2015). The treatment of dry (Bessagnet et al., 2010) and wet deposition (Knote et al., 2015) of SOA precursors is an another aspect of SOA which varies from model to model. Recent field and modelling studies have provided evidence that several known SOA precursors are susceptible to deposition. For example, explicit modelling of the oxidation of terpene and aromatic VOCs has identified extremely soluble products, with effective Henry's constants (Heff) ranging from 105 to 109 M atm−1 (Hodzic et al., 2014). This suggests efficient wet removal of SOA precursors, considering Heff for nitric acid (HNO3) is (Seinfeld and Pandis, 2006). However, the molecule-specific deposition parameters determined in field studies (Nguyen et al., 2015) can be difficult to apply to the lumped compounds used in global SOA schemes. On a global scale, some modelling studies have indicated a sensitivity of SOA to variations in precursor deposition (Henze and Seinfeld, 2006; Pye and Seinfeld, 2010; Hodzic et al., 2016). A few global modelling studies include both dry and wet deposition of SOA precursors, but the deposition parameters used vary by several orders of magnitude. For example, Shrivastava et al. (2015) use a value for Heff of 7×10³ M atm−1, whereas other studies use values ranging from 1×10⁵ to 5.3×10⁹ M atm−1 (Knote et al., 2015; Hodzic et al., 2016). In relation to dry deposition, field studies over forested regions of the USA have observed significant dry deposition of highly oxygenated VOCs (Nguyen et al., 2015). The most rigorous studies on dry deposition have only been conducted using regional-scale models. They found that dry removal of SOA precursors reduces modelled July-mean surface SOA concentrations by 20 %–40 % over Europe (Bessagnet et al., 2010), and reduces annual-average surface SOA concentrations by 46 % over the USA (Knote et al., 2015). Wet removal of SOA precursors reduces simulated annual-average surface SOA concentrations by 10 % over the USA, which reduces simulated positive biases in summertime SOA (Knote et al., 2015). However, previous studies have found that observed SOA concentrations in mid-latitude emission source regions tend to be lower compared to SOA concentrations simulated without the inclusion of VOC deposition (Kelly et al., 2018), but noted that elsewhere the lack of measurements precluded robust conclusions.
Vegetation is estimated to release around 1000 Tg (C) of VOCs into the atmosphere annually (Guenther et al., 2006, 2012). Estimates of the global annual-total SOA production rate from biogenic VOCs range from 27.6 to 97.5 Tg (SOA) a−1, which represents 54 % to 95 % of production from all sources (Farina et al., 2010; Hodzic et al., 2016). However, other emissions, such as fossil fuel and biofuel combustion as well as savannah and forest fires, may also be important sources of SOA. In urban environments, aromatic compounds, which are typically emitted from anthropogenic and biomass burning activities, account for 20 % to 30 % of total VOC emissions (Calvert et al., 2002). Therefore, in some cities such as Beijing (Guo et al., 2012), Shanghai (Peng et al., 2013), Guangzhou (Ding et al., 2012), and Jerusalem (Von Schneidemesser et al., 2010), SOA is primarily composed of aromatic compounds, as opposed to biogenic species. One observationally constrained global modelling study estimates an anthropogenically controlled global annual-total SOA production rate of 100 Tg (SOA) a−1, representing ∼70 % of production from all sources (Spracklen et al., 2011). In other regions, SOA can be dominated by biomass burning sources (Tiitta et al., 2014). The extrapolation of observations from aircraft campaigns (Cubison et al., 2011) and environmental chamber experiments (Bruns et al., 2016) suggests a global annual-total SOA production rate from biomass burning of 8 and 43 Tg (SOA) a−1, respectively. Furthermore, one global-scale modelling study predicts a global annual-total SOA production rate of 44 to 95 Tg (SOA) a−1 from biomass burning S/IVOCs (Shrivastava et al., 2015). Therefore, the dominant sources of SOA remain largely unknown.
The first studies to quantify the SOA yields from aromatic compounds (Odum et al., 1997, 1996) provide yields that are not high enough to account for the concentrations of aromatic SOA observed in field studies (Tsigaridis and Kanakidou, 2003; Hoyle et al., 2007). For instance, early estimates of SOA yields from aromatic compounds, which were conducted in relatively high nitrogen oxide (NOx = NO and NO2) concentrations, range between 5 % and 10 % (Odum et al., 1997, 1996). Consequently, the use of low SOA yields for aromatic compounds in global models results in low global annual-total SOA production rates ranging from just 0.05 to 2.5 Tg (SOA) a−1, which are negligible in comparison to biogenic sources (Tsigaridis and Kanakidou, 2003; Hoyle et al., 2007). However, more recent chamber studies suggest the SOA yields from aromatic compounds are strongly influenced by NOx concentrations (Hurley et al., 2001; Song et al., 2005; Ng et al., 2007; Chan et al., 2009). For example, in agreement with early estimates (Odum et al., 1996, 1997), Ng et al. (2007) also observed an SOA yield from aromatic VOCs of 5 %–10 % under high-NOx conditions. However, under lower NOx concentrations, Ng et al. (2007) measured substantially higher SOA yields of 37 %, 30 %, and 36 % for benzene (C6H6), toluene (C7H8), and xylene (C8H10), respectively. Similarly, under low-NOx conditions, Chan et al. (2009) observed an SOA yield of 73 % from naphthalene (C10H8). Zhang et al. (2014) further corroborates this negative sensitivity of SOA yields from aromatic compounds to NOx concentrations and also highlights how chamber studies frequently underestimate SOA yields due to wall losses.
The exact mechanism describing aromatic oxidation is not yet fully understood, despite considerable progress to date (Kautzman et al., 2010; Li et al., 2016, 2017b; Al-Naiema and Stone, 2017; Schwantes et al., 2017). As aromatic oxidation is initiated by the hydroxyl radical (OH), the influence of NOx on SOA production is probably due to reaction of NO with subsequent reaction intermediates or products. Oxidation of the parent aromatic hydrocarbon by OH is followed by addition of molecular oxygen (O2) and isomerisation, forming a bicyclic peroxy radical, RO2 (Koch et al., 2007; Birdsall et al., 2010). Under high-NOx conditions, the peroxy radical reacts with the nitric oxide radical (NO) to form fragmented products, whereas under low-NOx conditions the peroxy radical reacts with the hydroperoxyl radical (HO2) to form functionalised products (Ng et al., 2007). Hence, due to the difference in volatility of products, the RO2+HO2 yields a greater mass of SOA compared to the RO2+NO pathway. Water vapour may also be involved in the gas-phase oxidation of aromatic compounds (Hinks et al., 2018). However, as both positive (White et al., 2014) and negative (Cocker et al., 2001) correlations between aromatic SOA yields and relative humidity have been observed in chamber studies, the role of water vapour in aromatic oxidation is not yet clear. The exact mechanism describing aromatic oxidation may not be fully understood but the observed influence of NOx on SOA yields suggests that simulating SOA production from aromatic compounds necessitates multi-generational oxidation mechanisms, with SOA yields responding to oxidant availability.
The peroxy radical reaction intermediate, together with competitive NO and HO2 reactions with varying SOA yields, has been applied to several different SOA schemes. Benzene, toluene, and xylene have been incorporated into both global- (Henze et al., 2008; Heald et al., 2011) and regional-scale models (Li et al., 2017a). Henze et al. (2008) applied the laboratory-derived yields from Ng et al. (2007) to aromatic compounds (16 Tg (VOC) a−1), which resulted in a global annual-total SOA production rate of 4 Tg (SOA) a−1, with 61 % of SOA being produced via the RO2+HO2 pathway. Peroxy radical chemistry has also been applied to IVOCs, which are a mixture of species emitted from both anthropogenic and biomass burning. Pye and Seinfeld (2010) applied the laboratory-derived yields from Chan et al. (2009) to IVOCs (18 Tg (VOC) a−1), which resulted in global annual-total SOA production rate of 5 Tg (SOA) a−1, with 75 % of SOA being produced via the RO2+HO2 pathway. Despite peroxy radical chemistry being included in some SOA schemes, the influence on the global SOA budget and model agreement with observations has not been quantified.
The objective of this study is to further develop the SOA scheme within a chemistry–climate model, the United Kingdom Chemistry and Aerosol (UKCA) model. Firstly, the model is updated to include the wet and dry deposition of SOA precursors. Secondly, the mechanism describing SOA formation from anthropogenic and biomass burning VOCs is updated to account for the influence of NOx on SOA yields. Several simulations are conducted to test the sensitivity of SOA to both precursor deposition and oxidation mechanisms. The impact of these model developments on SOA is assessed through a comprehensive comparison with available observations. The paper is organised as follows. The global chemistry–climate model used in this study is described in Sect. 2; this section also includes a description of the model developments applied to the SOA scheme. Observations used to evaluate the model are discussed in Sect. 3. Next, the influence of precursor deposition on SOA is investigated (Sect. 4). In Sect. 5, the sensitivity of modelled SOA to oxidation mechanisms and VOC reactivity is explored. Concluding remarks and further work are discussed in Sect. 6.
In this section, the model is briefly described. This begins with a brief description of the default configuration, followed by the model developments made in this study. The chemistry–climate model used in this study is the United Kingdom Chemistry and Aerosol (UKCA) model (Morgenstern et al., 2009; Mann et al., 2010; O'Connor et al., 2014) which is coupled to the Global Atmosphere 4.0 (GA4.0) configuration (Walters et al., 2014) of the Hadley Centre Global Environmental Model (Hewitt et al., 2011) version 3 (HadGEM3). The atmosphere-only configuration with prescribed sea surface temperature and sea ice fields based on 1995–2004 reanalyses data (Reynolds et al., 2007) was used. The model was run at a horizontal resolution of N96 (1.875∘ longitude by 1.25∘ latitude) with 85 terrain-following hybrid-height levels distributed from the surface to 85 km. Horizontal winds and temperature in the model were nudged towards ERA-Interim reanalyses for the 1999–2000 period (Dee et al., 2011) using a Newtonian relaxation technique with a relaxation time constant of 6 h (Telford et al., 2008). There was no feedback from the chemistry or aerosols onto the dynamics of the model; this ensured identical meteorology across all simulations so that differences in SOA were solely due to differences in precursor oxidation mechanisms and deposition.
2.1 Gaseous chemistry (UKCA)
The United Kingdom Chemistry and Aerosol (UKCA) model used in this study combines the “TropIsop” tropospheric chemistry scheme from O'Connor et al. (2014) with the stratospheric chemistry scheme from Morgenstern et al. (2009). There are 75 species with 285 reactions. This includes odd oxygen (Ox), nitrogen (NOy), hydrogen (HOx = OH+HO2), and carbon monoxide (CO). Explicit hydrocarbons included are methane, ethane, propane, isoprene, and monoterpene. Isoprene oxidation follows the Mainz Isoprene Mechanism (Pöschl et al., 2000) which is described in detail in O'Connor et al. (2014). In addition to the aforementioned explicit hydrocarbons, two additional non-explicit VOCs are included: VOCANT and VOCBB are lumped compounds representing anthropogenic and biomass burning VOCs, respectively. Together, isoprene, monoterpene, VOCANT, and VOCBB are the precursors of SOA. The reactivity and production of SOA from these species are discussed in further detail in Sect. 2.5. For bimolecular gas-phase reactions, rate constants are calculated following the Arrhenius expression
where k0 is a constant, β is the ratio of the activation energy over the universal gas constant (EA∕R), and T is temperature. The rate constant is then used to calculate the rate of reaction:
where k is the rate coefficient, and [A] and [B] are concentrations of gases A and B, respectively.
2.1.1 Gaseous wet deposition
Within UKCA, wet deposition of gases is calculated as a first-order process as a function of precipitation, following Walton et al. (1988). For a detailed description of the wet deposition within UKCA, see O'Connor et al. (2014). Within each grid box, the scavenging rate, r, is calculated as
where Sj is the scavenging coefficient for precipitation type j and pj(l) is the precipitation rate for type j from model vertical level l. The two precipitation types, j, considered are convective and large-scale types. For nitric acid (HNO3), the scavenging coefficient is taken from Penner et al. (1991). For all remaining species, the scavenging coefficient is calculated by scaling down the scavenging coefficient of HNO3. This is done by calculating the fraction of each species in the aqueous phase as
where L is the liquid water content, R is the universal gas constant, and T is the temperature. Heff is the effective Henry's coefficient, which depends on the solubility of a species and the effects of dissociation and complex formation. The effective Henry's coefficient is calculated as
where ΔH is the enthalpy of vaporisation and k(298) is the rate coefficient at 298 K. The [H+] is the hydrogen ion concentration (i.e. pH). All cloud liquid water droplets are assumed to have a pH of 5.0 (Giannakopoulous, 1998). The kaq is calculated for species which dissociate upon dissolution, and is calculated as
where kd and ΔHd are the rate coefficients and enthalpy of vaporisation for dissociation, respectively.
2.1.2 Gaseous dry deposition
Dry deposition refers to the transfer of chemical species from the atmosphere to the surface in the absence of precipitation. Dry deposition of gas-phase species within UKCA has also been described in detail before (O'Connor et al., 2014) so is only described briefly here. The dry deposition velocity (vd) is calculated using a resistance-based approach (Wesely, 1989). This approach is analogous to an electrical circuit, where the transport of chemical species is dependent on three resistances, ra, rb, and rc:
The aerodynamic resistance term, ra, represents the resistance to transport of chemical species through the boundary layer to a thin layer of air just above the surface. This term is calculated from the wind profile, taking into account the atmospheric stability and the surface roughness
where z is the height, z0 is the roughness length, Ψ is the Businger dimensionless stability function, k is Karman's constant, and u* is the friction velocity.
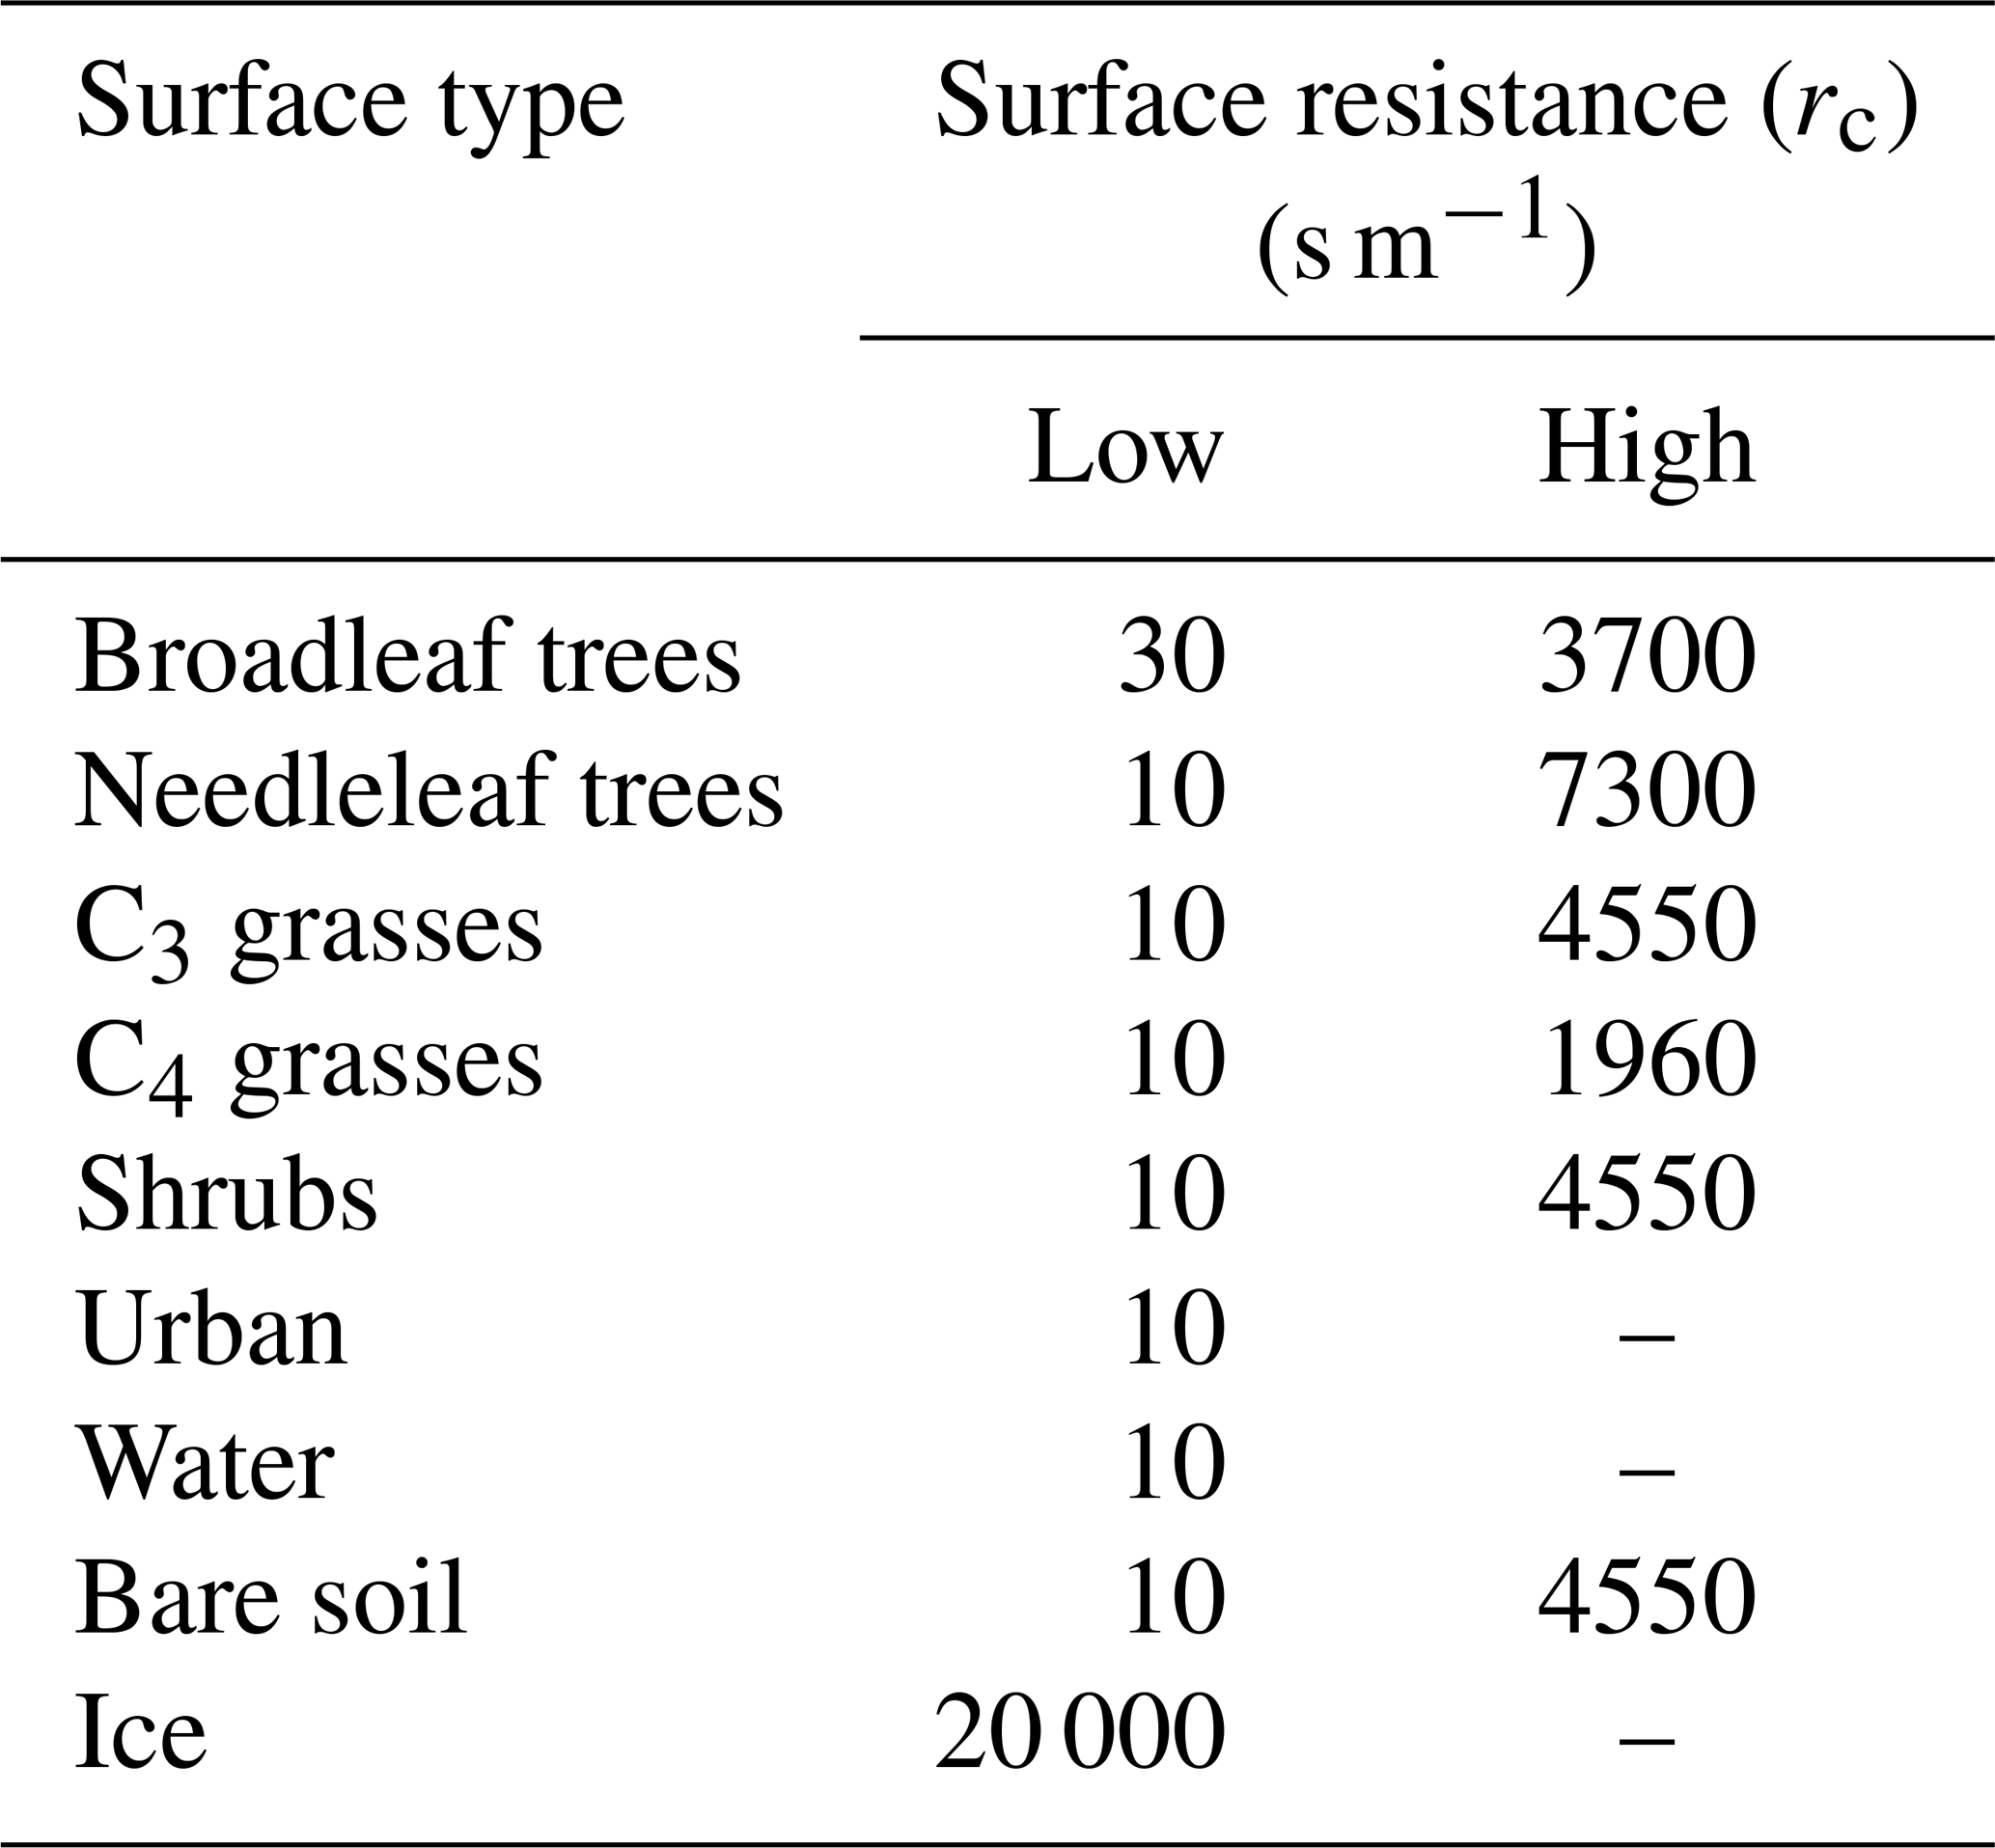
The quasi-laminar resistance term, rb, refers to the resistance to transport though the thin layer of air close to the surface. The surface resistance term, rc, otherwise known as the canopy resistance term, refers to resistance to uptake at the surface. This term is dependent on the absorbing surface as well as the physical and chemical properties of species. The canopy resistance term is related to surface conditions, time of day, and season. There are nine surface types considered by the model. These are broad-leaved trees, needle-leaf trees, C3 and C4 grasses, shrubs, urban, water, bare soil, and land ice. These surface types are prescribed from the International Geosphere-Biosphere Programme (IGBP) dataset (Loveland et al., 2000). Within each grid box, the multiple resistances are calculated for each surface type and then combined to provide a grid box mean deposition velocity and first-order loss rate.
2.2 Aerosol (GLOMAP-mode)
The aerosol component of UKCA is the 2-moment modal version of the Global Model of Aerosol Processes (GLOMAP-mode; Mann et al., 2010). Both aerosol mass and number are transported in seven internally mixed log-normal modes (four soluble and three insoluble). Aerosol components considered are sulfate (SO4), sea salt (SS), black carbon (BC), primary organic aerosol (POA), and secondary organic aerosol (SOA). Aerosol microphysical processes included are nucleation, coagulation, condensation, condensation ageing, hygroscopic growth, and cloud processing. Species such as POA and BC are assumed to be emitted in insoluble forms. Condensation ageing refers to soluble vapours condensing on these insoluble POA and BC particles, and thus rendering them soluble. Ten monolayers of soluble particles are assumed sufficient for condensation ageing. No ageing processes are applied to SOA. Dry deposition and gravitational settling of aerosol follows Slinn (1982) and Zhang et al. (2012), respectively. Grid-scale wet deposition of aerosol occurs via nucleation scavenging and impact scavenging. Subgrid-scale wet removal occurs via plume scavenging (Kipling et al., 2013). New particle formation from binary homogenous nucleation of sulfuric acid (H2SO4) follows that described by Kulmala et al. (2006). Gaseous sulfur compounds (sulfur dioxide, SO2, and dimethyl sulfide, DMS) and VOCs are oxidised, forming low-volatility gases, which condense irreversibly onto pre-existing aerosol. Condensation is calculated following Fuchs and Sutugin (1971) which is described in Mann et al. (2010). Mineral dust is also included in the model simulations, but treated in a separate aerosol module (Woodward, 2001).
2.3 Emissions
The emissions used in this study are all monthly-varying decadal-average values centred on the year 2000. Anthropogenic and biomass burning gas-phase emissions are prescribed following Lamarque et al. (2010). Biogenic emissions of isoprene, monoterpene, and methanol (CH3OH) are also prescribed, taken from the Global Emissions Inventory Activity (GEIA), based on Guenther et al. (1995). A diurnal cycle in isoprene emissions is imposed based on solar zenith angle. POA and BC emissions from fossil fuel combustion are prescribed following Lamarque et al. (2010). POA and BC emissions from savannah burning and forest fires are prescribed, taken from the Global Fire Emissions Database (GFEDv2; van der Werf et al., 2010). For VOCBB, monthly-mean CO emissions from biomass burning were used to define its spatial distribution (Lamarque et al., 2010) and scaled to reproduce the global annual VOC total emissions from biomass burning estimated from the Emissions Database for Atmospheric Research (EDGAR) (49 Tg (VOCBB) a−1). For VOCANT, monthly-mean anthropogenic emissions of benzene, toluene, and xylene were taken from Lamarque et al. (2010), and scaled to reproduce the global annual anthropogenic VOC total emissions estimated by EDGAR (127 Tg (VOCANT) a−1). Scaling both VOCBB and VOCANT to the emission type's totals (i.e. biomass burning and anthropogenic, respectively) represents an upper limit for the SOA precursor emissions. The emissions of VOCBB and VOCANT described here have been used in Kelly et al. (2018), with the corresponding impacts on SOA rigorously evaluated against observations. Briefly, the locations of SOA observations are well suited to constrain the anthropogenic source of SOA, but not so well suited for evaluating VOCBB. Inclusion of VOCANT in SOA production gives rise to a substantial improvement in model agreement with observations (Kelly et al., 2018).
2.4 Default treatment of SOA
In this section, the current treatment of SOA in the UKCA model is first described, followed by descriptions of new treatments of precursor deposition and oxidation mechanisms. Within the model, SOA is treated by a coupling between the UKCA gas-phase chemistry and GLOMAP-mode. Emitted parent hydrocarbon gases undergo a single-step oxidation, forming a secondary organic gas (SOG) which condenses, forming SOA. This is shown in Eq. (8),
where VOC is the concentration of the emitted parent hydrocarbon, [o] is the oxidant concentration, kVOC+[o] is the temperature-dependent rate coefficient (Eq. 1), αVOC+[o] is the stoichiometric coefficient, and SOG is the secondary organic gas. SOG is treated as non-volatile, and although there is evidence that organic aerosol (OA) is both semi-volatile (Robinson et al., 2007; Donahue et al., 2012) and non-volatile (Jimenez et al., 2009; Cappa and Jimenez, 2010), SOG condenses irreversibly to form SOA in UKCA. The yield is identical for all oxidation reactions (13 %), regardless of VOC or oxidant. Essentially, the volatility distribution is assumed to be identical for all reactions, irrespective of parent VOC and oxidant. In the model, no SOA precursor undergoes dry or wet deposition.
In this study, SOA production is considered from gas-to-particle partitioning of VOC oxidation products. S/IVOC emissions are not considered and aqueous-phase SOA production is not included. These include monoterpene, isoprene, VOCBB, and VOCANT. Monoterpene and isoprene contain both single and double carbon bonds and therefore react with ozone (O3) and the hydroxyl (OH) and nitrate (NO3) radicals, forming SOG and subsequently SOA (Eq. 8). Note, for isoprene, oxidation in the context of SOA production (Eq. 8) occurs independently to isoprene oxidation in the Mainz Isoprene Mechanism described in Sect. 2.1. Reaction kinetics for isoprene and monoterpene (α-pinene) oxidation are taken from Atkinson and Arey (2003), and are shown in Table 1. As discussed in Sect. 2.4, VOCANT and VOCBB are surrogate compounds, which do not retain molecular information, and therefore do not have laboratory-derived rate constants. Initially, the assumption is made that VOCANT and VOCBB are reduced compounds, with only single carbon bond and react predominantly with OH. VOCANT and VOCBB are also assumed to have a similar reactivity to monoterpene towards OH oxidation, but do not react with O3 or NO3. These assumptions in the parent hydrocarbon reactivity are discussed further in Sect. 2.4.2. As stated above, none of the SOA precursors in this scheme are wet or dry deposited. In summary, the current SOA scheme suffers from a lack of mechanistic detail in oxidation mechanisms, and neglects precursor deposition. In the following subsections, modifications to the model are described and the impacts of these processes quantified.
Table 1Kinetic parameters used to calculate rate coefficient (Eq. 1) for both existing and new SOA precursors, taken from Atkinson and Arey (2003). Note, VOCANT∕BB reacts with OH with reaction kinetics based on either monoterpene, naphthalene, toluene, or benzene.

2.4.1 Addition of SOA precursor deposition
Precursors of SOA include the emitted parent hydrocarbons (monoterpene, isoprene, VOCANT, VOCBB) and the secondary organic product (SOG). Several modifications were made to UKCA to investigate the influence of precursor deposition on SOA. Firstly, wet deposition of the gas-phase species, as described in Sect. 2.1.1, was extended to include all SOA precursors. The effective Henry's law coefficient, for all SOA precursors, was either set to 105 or 109 M atm−1. These values of Heff were taken from estimates by Hodzic et al. (2014). Secondly, the treatment of dry removal of gas-phase species (Sect. 2.1.2) was extended to include all SOA precursors and they were assumed to have identical surface resistances. Table 2 shows the surface resistances for the SOA precursors over the nine surface types. The aerodynamic and quasi-laminar surface resistances were calculated on-line, based on relative molecular mass and meteorology. During field studies over forested regions, organic hydroperoxides (ROOH) were observed to undergo significant dry deposition (Hall et al., 1999; Valverde-Canossa et al., 2006; Nguyen et al., 2015). Surface resistances derived from these field studies range from 5–40 s m−1 (Hall et al., 1999; Nguyen et al., 2015). Hence, these field-derived surface resistances of ROOH (“Low”; Table 2) were used to provide a lower estimate of the surface resistances of SOA precursors. Surface resistances corresponding to the dry deposition of CO (“High”; Table 2) were used to provide an upper limit of the surface resistances of SOA precursors.
Table 2Surface resistances for SOA precursors over the nine different surface types in the model. “Low” represents surface resistances of ROOH, which are taken field studies (Hall et al., 1999; Nguyen et al., 2015). “High” represents surface resistances of CO.
2.4.2 Addition of a new oxidation mechanism for VOCANT∕BB
As discussed in Sect. 2.4, initially VOCANT∕BB follows a single-step oxidation mechanism, with a single fixed SOA yield, and with a reactivity based on α-pinene (Table 1). However, of the anthropogenic and biomass burning VOCs related to SOA production, aromatic compounds have been identified as important components in field studies (Von Schneidemesser et al., 2010; Ding et al., 2012; Guo et al., 2012; Peng et al., 2013). Furthermore, environmental chamber studies suggest aromatic hydrocarbons undergo multi-generational oxidation reactions, with SOA yields dependent on oxidant concentrations (Ng et al., 2007; Chan et al., 2009; Kautzman et al., 2010; Li et al., 2016, 2017b; Al-Naiema and Stone, 2017; Schwantes et al., 2017). Therefore, in order to examine how SOA is affected by variations in oxidation mechanisms, chamber-derived aromatic oxidation pathways are applied to VOCANT∕BB. This section outlines how the chamber-derived aromatic oxidation pathway, postulated by Ng et al. (2007), is applied to the mechanistic description of SOA production from VOCANT∕BB within UKCA.
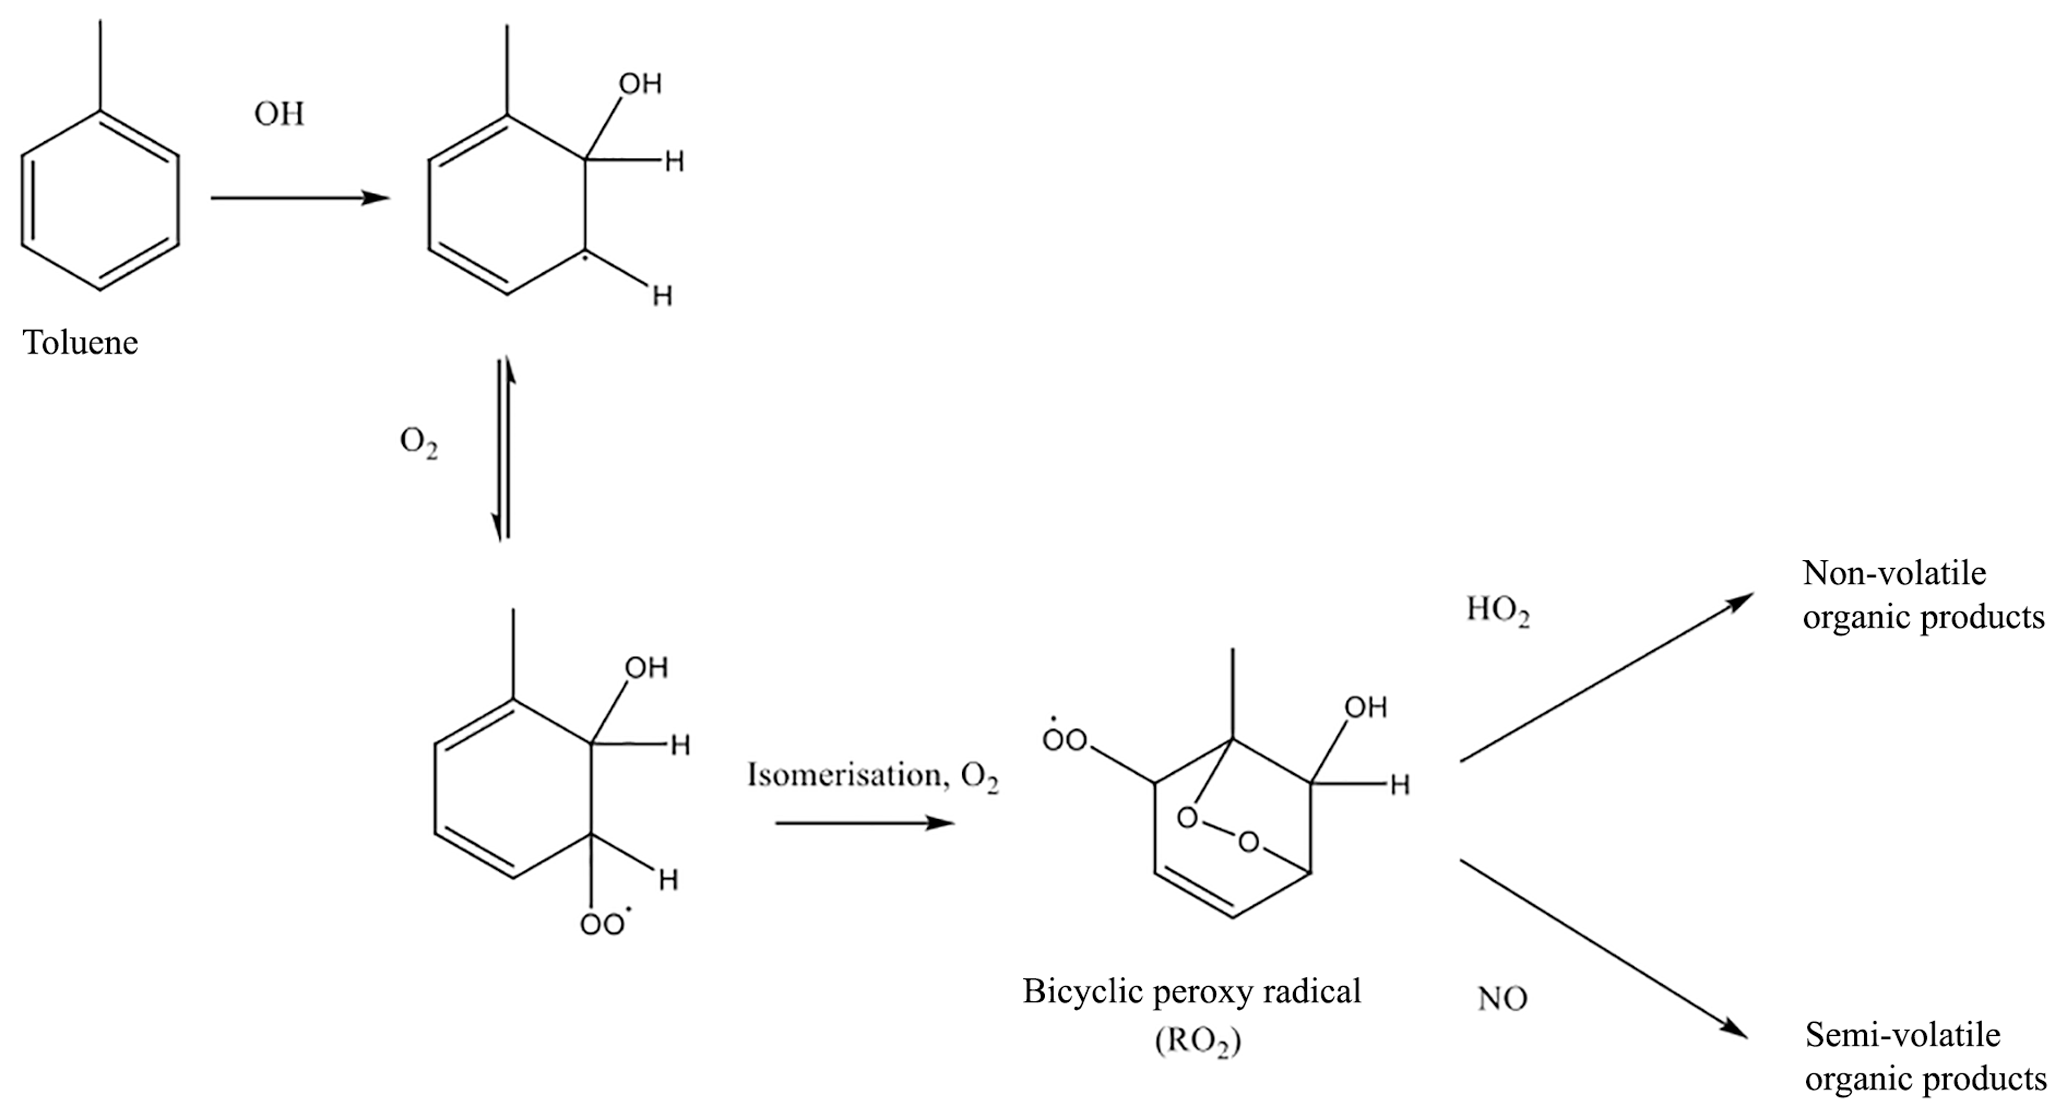
Figure 1Formation of lower volatility vapours from toluene photooxidation, as described in Ng et al. (2007).
Figure 1 shows a mechanistic description of SOA production from toluene, accounting for the influence of NOx on SOA production, adapted from Ng et al. (2007). Briefly, toluene undergoes oxidation by OH, followed by addition of oxygen and isomerisation, to form a bicyclic peroxy radical, RO2. The bicyclic peroxy radical undergoes competitive reactions with hydroperoxyl radical (HO2) and NO. The HO2 pathway forms functionalised products, whereas products of the NO pathway are fragmented. Although Fig. 1 shows a mechanistic description of toluene oxidation, the oxidation of other methylated aromatic compounds will also follow a similar pathway. This mechanism for aromatic oxidation, as shown in Fig. 1, was applied to VOCANT∕BB oxidation. The rate determining step in Fig. 1 is the initial oxidation by OH and, therefore, the mechanism can be simplified as follows:
where VOC represents VOCANT∕BB, kVOC+OH represents the rate constant for aromatic oxidation by OH, RO2 represents the bicyclic peroxy radical, and represent the rate constant and the stoichiometric coefficient for the RO2+HO2 reaction, respectively, and and represent the rate constant and the stoichiometric coefficient for the RO2+NO reaction, respectively. Both RO2 reactions form the same non-volatile species, SOG, but the yields associated with the formation rates of this product are variable ( and ). Hence, this mechanism allows the sensitivity of SOA production to HO2 or NO to be accounted for. However, note that the differences in volatility between RO2 oxidation products are not explicitly accounted for. Within the model, the difference in volatility distribution between the products of the RO2 reactions are controlled by the stoichiometric coefficients ( and ). Previous modelling studies use a similar method to treat SOA production via the RO2+HO2 pathway. Assuming that the products from oxidation of explicit aromatic compounds are non-volatile, Henze et al. (2008) use a stoichiometric yield of around 18 %. Using IVOC emissions based on naphthalene, Pye and Seinfeld (2010) use a stoichiometric coefficient of 73 %. However, both Henze et al. (2008) and Pye and Seinfeld (2010) treat products from the RO2+NO pathway as semi-volatile, with stoichiometric yields ranging from 2 % to 107 %, and equilibrium partitioning coefficients ranging from 0.0037 to 3.3150 m3 µg−1. The reaction kinetics for aromatic oxidation used here are shown in Table 1. At 298 K, the rate coefficients for the reaction of OH with naphthalene, toluene, and benzene are 23.2, 5.62, and cm3 molecule−1 s−1, respectively (Table 1). At 298 K, the rate coefficients for the reactions of the peroxy radical with HO2 and NO are 14.7 and cm3 molecule−1 s−1, respectively (Table 1). Note, these rate coefficients are used for the peroxy radical irrespective of the identity of the parent VOC (i.e. naphthalene, toluene, or benzene).
2.5 Model simulations
In this study, 10 simulations were performed to explore the influence of hydrocarbon deposition and oxidation mechanisms on SOA, and are described in Table 3. The duration of all simulations is 2 years, spanning from 1999 to 2000. The first year was discarded as spin-up, and analysis was performed on the second year – 2000. Firstly, a control simulation was conducted, where the oxidation of all parent hydrocarbons (isoprene, monoterpene, VOCANT, and VOCBB) followed Eq. (8) and no SOA precursors were lost by wet or dry deposition processes. Next, the influence of VOC deposition on SOA was explored. To begin with, precursors were assumed to have low surface resistances (Low; Table 2), thus testing the upper limit for precursor dry deposition (Dry_High; Table 3). Next, the strength of precursor surface resistance was increased (High; Table 2), testing the lower limit for deposition rates (Dry_Low; Table 3). Next, SOA precursors were treated as soluble and were, therefore, included in the wet deposition scheme. As with dry removal, the upper and lower limits of precursor wet deposition were tested by carrying out two simulations: one with a higher solubility (Wet_High) and one with a lower solubility (Wet_Low). An additional simulation was conducted to test whether the effects of precursor dry and wet deposition on SOA are additive (DryH_WetL). Note, for this simulation, dry and wet deposition are included with low surface resistances (Low; Table 2) and low solubility. Alternative combinations of surface resistances and solubility could have been used to quantify the combined influence of precursor dry and wet deposition on SOA.
Table 3Simulations conducted in this study. Surface resistances, Low and High, are shown in Table 2. For both surface resistances and Heff, all SOA precursors are assumed to have identical parameters. The oxidation mechanism for isoprene and monoterpene follows Eq. (8) in all simulations. Emissions for all SOA precursors are identical across all simulations.

Next, the influence of VOC oxidation mechanisms on SOA was explored by modifying the mechanistic description of SOA production from anthropogenic and biomass burning VOCs. As discussed in Sect. 1, oxidation mechanisms within SOA schemes vary substantially. Therefore, in this section, where necessary, changes to VOCANT∕BB oxidation were made in a stepwise fashion in order to isolate the effects of individual changes. Firstly, the combined effects of the use of a reactive aromatic compound (naphthalene) and introducing a reaction intermediate (RO2) were explored in the Multi_nap simulation, where VOCANT∕BB follows Eq. (9). In this simulation, stoichiometric reaction yields of 13 % are applied to both RO2 oxidative pathways, which is identical to the reaction yield applied to simulations following the single-step mechanism (Eq. 8). The effects of changes to parent VOCANT∕BB reactivity, the chemical fate of the new reaction intermediate and SOA production from this intermediate are discussed separately in Sect. 5.1.1, 5.1.2, and 5.1.3, respectively. Next, the influence of accounting for the difference in volatility distribution of products between the peroxy radical pathways was accounted for in a further model experiment (Multi_nap_yield), which is discussed in Sect. 5.1.4. This was achieved by increasing the SOA yield from 13 % to 66 % for the HO2 pathway, whilst leaving the reaction yield for the NO pathway unchanged at 13 %. A stoichiometric yield of 66 % was selected as this allows for quantification of the theoretical upper limit of SOA production from this pathway. Note, RO2 and SOG have relative molecular masses of 100 and 150 g mol−1, respectively. Because of these differences in relative molecular masses between reactants and products, the stoichiometric yield applied to the conversion of RO2 and SOG is not equivalent to the mass yield. For example, a stoichiometric yield of 66 % corresponds to a mass yield of 100 %. A mass yield of 100 % would be the case if all reacted RO2 ended up forming non-volatile products (with no addition of oxygen atoms). Next, the influence of parent hydrocarbon reactivity was explored, whilst maintaining identical reaction mechanisms and yields (Sect. 5.1.5). In this simulation, VOCANT∕BB adopts the reactivity of toluene (Multi_tol_yield) and benzene (Multi_benz_yield) (Table 3). Note, for the simulations investigating the influence of oxidation mechanisms on SOA, isoprene and monoterpene oxidation is unchanged. The emissions of all SOA precursors (isoprene, monoterpene, and VOCANT∕BB) are identical in all the simulations.
This section describes the observations used to test the effects of variations in hydrocarbon physicochemical processes on model performance. To make direct comparisons, and provide a consistent method for evaluating model performance, a suite of observations were chosen which are identical to those used in previous studies involving the UKCA model (Kelly et al., 2018).
The aerosol mass spectrometer (AMS) allows on-line detection of submicron non-refractory aerosol (Jayne et al., 2000; Canagaratna et al., 2007). This method was used to measure OA concentrations for all observations utilised in this study. Uncertainties associated with this method are estimated to be between 30 % and 50 % (Bahreini et al., 2009). All observations used in this study can be accessed on the AMS global network website (https://sites.google.com/site/amsglobaldatabase/, last access: 3 June 2019).
Surface OA observations from the AMS network, originally compiled by Zhang et al. (2007), span the time period 2000–2010. The 37 observed surface measurement locations are shown in Fig. 2 and coloured according to the environment sampled: urban, urban downwind, or remote. With the exceptions of Manaus (Brazil; Martin et al., 2010) and Welgegund (South Africa; Tiitta et al., 2014), all surface OA spectra were analysed further using factor analysis, classifying OA as either oxygenated OA (OOA) or hydrocarbon-like OA (HOA). Here, measured OOA is assumed comparable to modelled SOA, and measured HOA is assumed comparable to POA. For each observation, the corresponding model-grid box was selected. Also, observations were compared to the simulated monthly-mean from the year 2000.
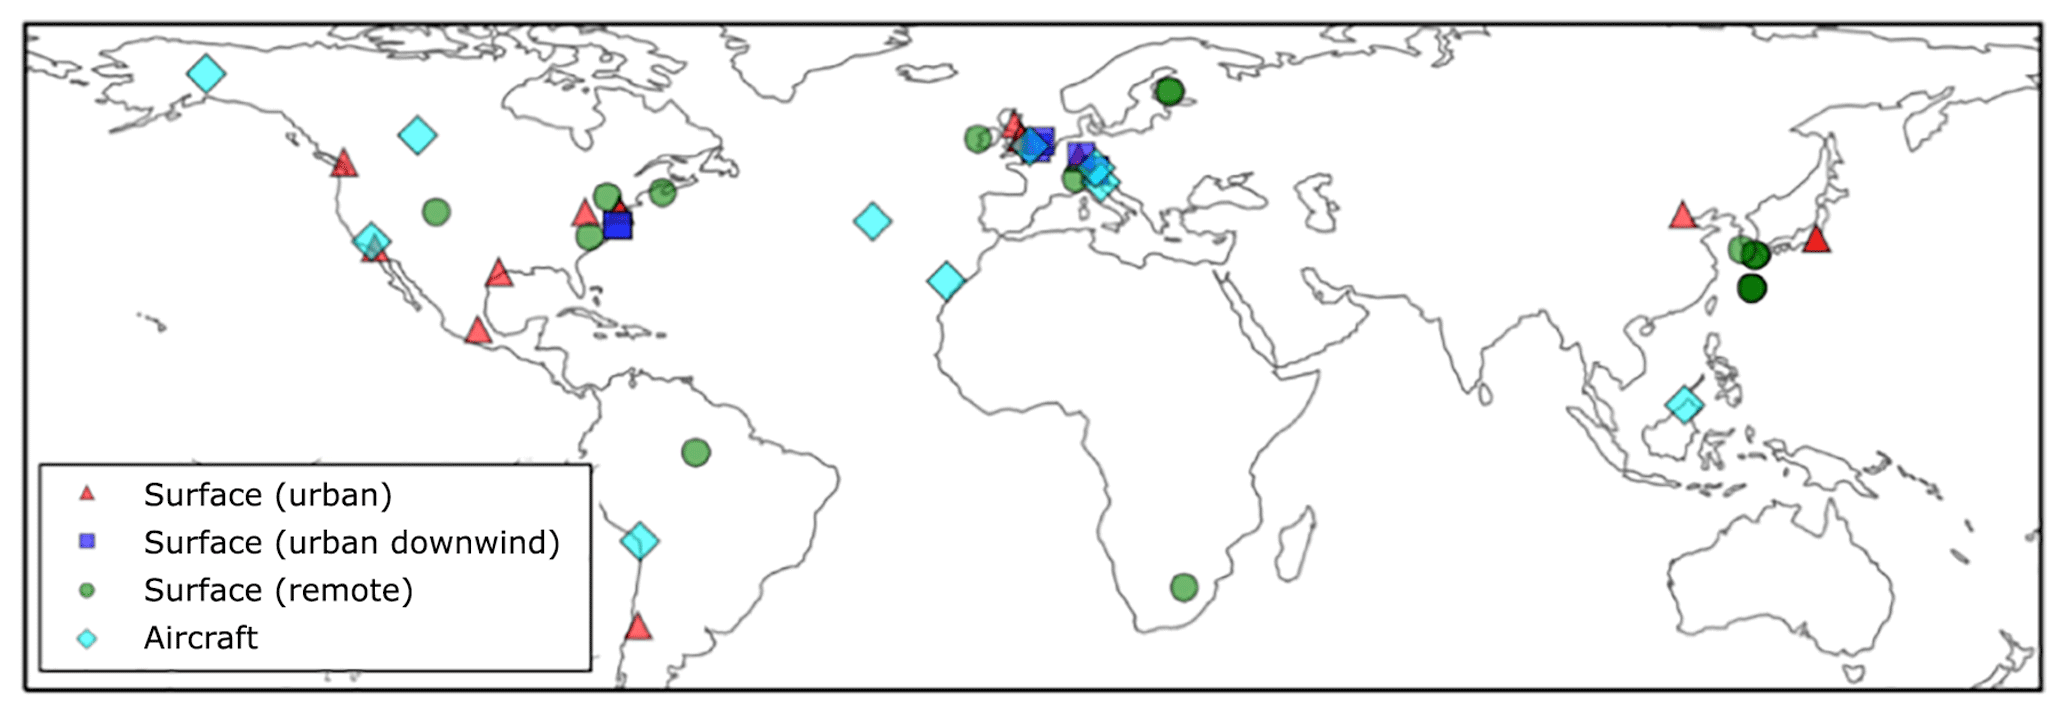
Figure 2Global map showing the 40 surface AMS observations, originally compiled by Zhang et al. (2007) and classified as urban (red triangles), urban downwind (blue squares), or remote (green circles). Of the surface observations, 37 have been classified as hydrocarbon-like OA and oxygenated OA. Observations from 10 aircraft campaigns, originally compiled by Heald et al. (2011), are also shown (light-blue diamonds); these remain as total OA.
Observed OA concentrations from several aircraft campaigns were also used. Observation data from these aircraft campaigns, which were originally compiled by Heald et al. (2011), can also be accessed on the AMS global network website (https://sites.google.com/site/amsglobaldatabase/, last access: 3 June 2019). Aircraft observations utilised in this study are also shown in Fig. 2. These campaigns span the period 2000–2010. Four campaigns were carried out in remote regions, located over the north Atlantic Ocean (TROMPEX and ITOP), Borneo (OP3), and the tropical Pacific Ocean (VOCALS-UK). Three campaigns were also carried out in polluted regions of Europe (EUCAARI, ADIENT, and ADRIEX). Three campaigns were carried out in North America and were influenced heavily by biomass burning (ARCTAS-A, ARCTAS-B, and ARCTAS-CARB). This observational dataset was supplemented with a campaign conducted over West Africa (AMMA; Capes et al., 2008). Observed OA from each aircraft campaign was first interpolated onto the vertical grid of the model. The model's horizontal grid cell was then matched to the observations. Again, the month of the observations were matched to the monthly mean estimate for the year 2000 simulated by UKCA. For evaluations of surface and aircraft data against simulated OA concentrations, the mismatch in measurement and simulation years is a potential contributor to the model–observation bias. This mismatch in time may be particularly important for regions influenced by biomass burning as the interannual variability in this emissions source is substantially high (Tsimpidi et al., 2016).
In this section, the influence of VOC deposition (Sect. 2.4.1) on simulated SOA is quantified. Next, the influence of VOC deposition on model agreement with observations is evaluated.
4.1 Simulated SOA budget and concentrations
When precursor deposition is neglected from the model, the simulated global annual-total SOA production rate is 75 Tg (SOA) a−1 (Control; Table 3). The inclusion of VOC dry deposition with high surface resistances (High; Table 2) reduces the global annual-total SOA production rate by only 2 Tg (SOA) a−1 (2 %) (Dry_Low; Table 3). However, the rate of VOC dry deposition is highly sensitive to the value of surface resistance. The inclusion of VOC dry deposition with lower surface resistances (Low; Table 2) reduces the global annual-total SOA production rate by 24 Tg (SOA) a−1 (32 %) (Dry_High; Table 3). Therefore, inclusion of precursor dry deposition reduces the global annual-total SOA production rate by 2–24 Tg (SOA) a−1, or 2 %–32 %, with this range reflecting uncertainties in surface resistances (Table 3).
Wet removal also has a substantial impact on SOA. For example, under the assumption of an effective Henry's coefficient of 105 M atm−1, wet deposition reduces the global annual-total SOA production rate by 12 Tg (SOA) a−1 (15 %) compared to when no precursors undergo deposition (Wet_Low; Table 3). However, as discussed in Sect. 1, Heff has been calculated to range from 105 to 109 M atm−1 for VOC precursors of SOA from different sources (Hodzic et al., 2014). In this study, when Heff of SOA precursors is increased to 109 M atm−1, wet removal reduces the global annual-total SOA production rate by only 13 Tg (SOA) a−1 (17 %) (Wet_High; Table 3). Therefore, the influence of precursor wet deposition on SOA is rather insensitive to uncertainties in the range of effective Henry's coefficients.
Generally, global- (Hodzic et al., 2016) and regional-scale modelling studies (Bessagnet et al., 2010; Knote et al., 2015) suggest that dry deposition of precursor dominates over wet deposition. Therefore, for subsequent simulations, where both dry and wet removal were included in the model (DryH_WetL), surface resistances corresponding to Dry_High, which had the largest impact on global SOA production, were used, along with Heff of 105 M atm−1 (Wet_Low). The influence of dry and wet deposition of precursors on the global SOA budget are not additive. The combination of dry and wet deposition of VOCs reduces the global annual-total SOA production rate by 28 Tg (SOA) a−1 (37 %) (DryH_WetL; Table 3). Overall, deposition of SOA precursors has a substantial impact on the global SOA budget, with the global annual-total SOA production rate from all VOC sources ranging from 47 to 75 Tg (SOA) a−1, with the range reflecting uncertainties in precursor deposition (Table 3).
Prior to including deposition of SOA precursors, biogenic VOCs account for 57 % of the global annual-total SOA production rate, with VOCANT∕BB accounting for the remaining 43 %. By including deposition of SOA precursors, the relative importance of biogenic VOCs to global SOA increases; considering deposition of SOA precursors, biogenic VOCs account for 62 % of the global annual-total SOA production rate with VOCANT∕BB accounting for the remaining 38 %. Hence, biogenic VOCs appear to be less susceptible to deposition than anthropogenic and biomass burning VOCs.
Figure 3 shows the sensitivity of annual-average surface SOA concentrations to precursor deposition. The spatial distribution of SOA closely reflects the location of biogenic, anthropogenic, and biomass burning emissions, as noted previously (Kelly et al., 2018). Over India, extremely high anthropogenic emissions combine with moderate biogenic emissions to result in annual-average surface SOA concentrations reaching up to 17 µg (SOA) m−3 (Fig. 3a). Over tropical forest regions of South America and Africa, biogenic and biomass burning emissions are extremely high, resulting in annual-average surface SOA concentrations ranging from 2 to 10 µg (SOA) m−3 (Fig. 3a). Over Europe and North America, moderate emissions from anthropogenic and biogenic sources generate annual-average surface SOA concentrations in the range of 0.3–6 µg (SOA) m−3 (Fig. 3a).
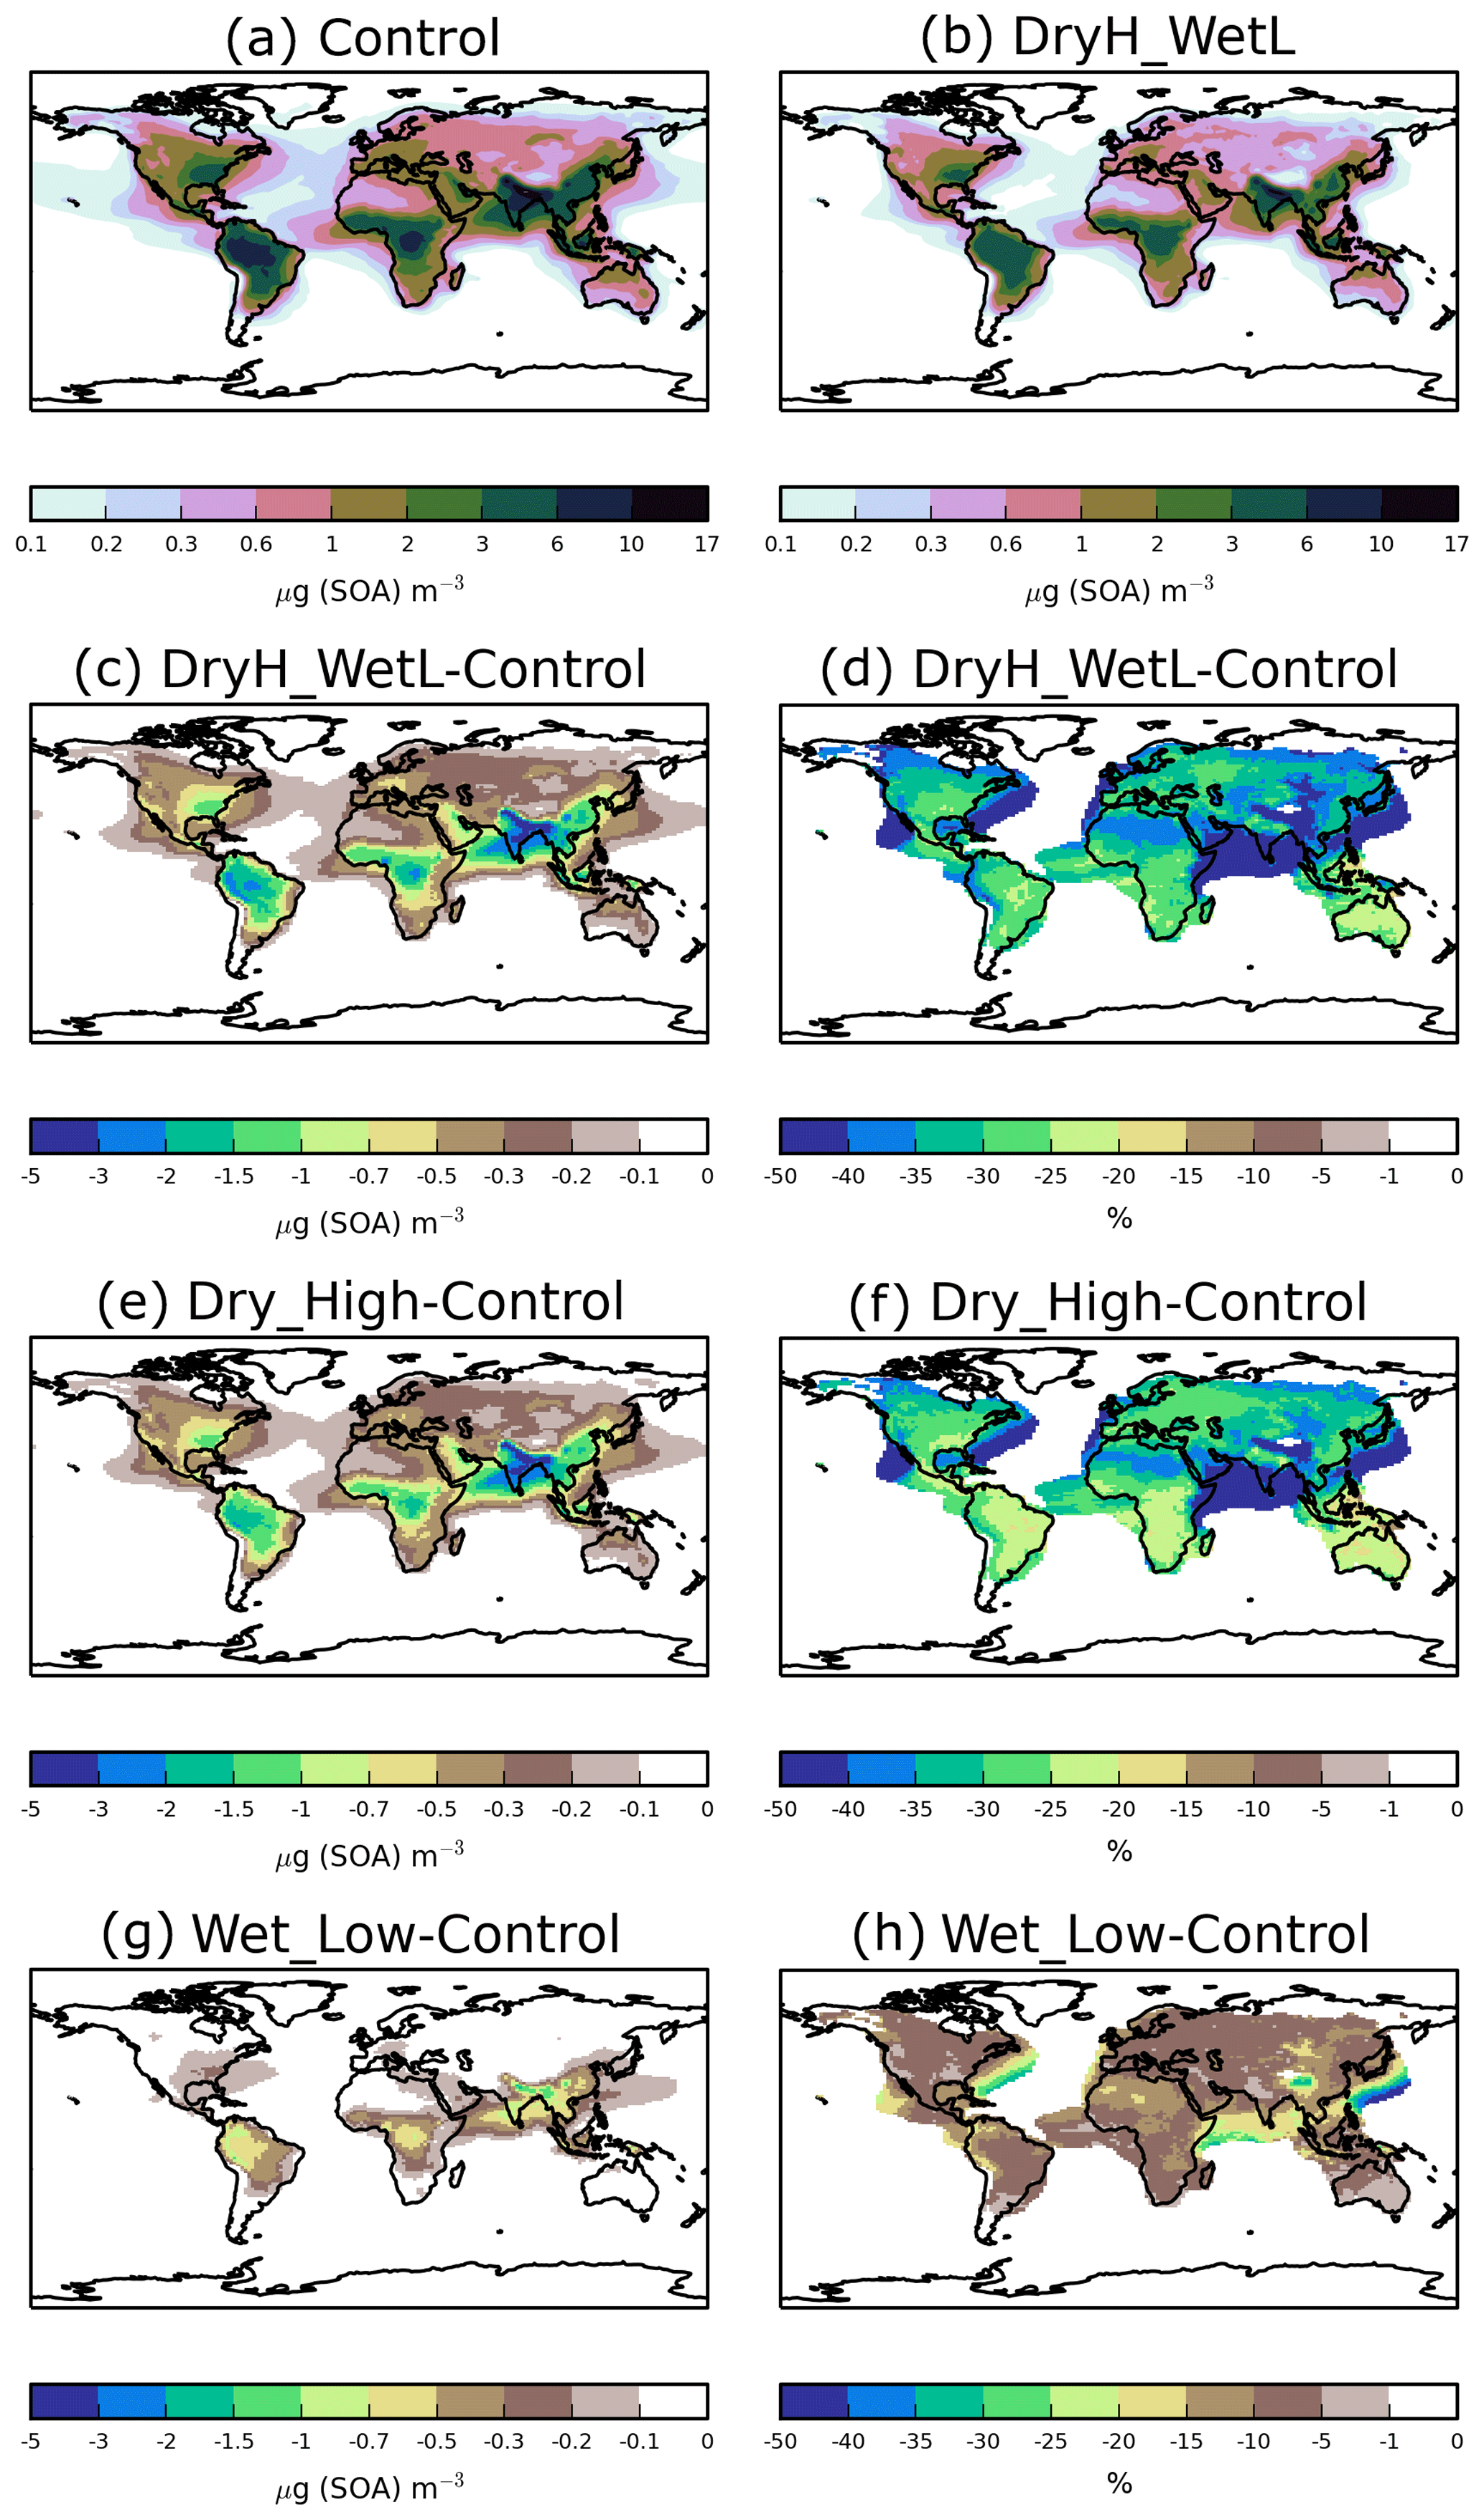
Figure 3Annual-average surface SOA concentrations for (a) Control and (b) DryH_WetL simulations, and absolute and percentage differences in annual-average surface SOA concentrations for (c, d) DryH_WetL, (e, f) Wet_Low, and (g, h) Dry_High simulations relative to Control.
Over India and tropical forest regions of South America and Africa, including VOC dry deposition reduces annual-average surface SOA concentrations by 1.5 to 5 µg (SOA) m−3 (Fig. 3e), corresponding to reductions of 15 % to 50 % (Fig. 3f). Over these same regions, inclusion of precursor wet deposition reduces annual-average surface SOA concentrations by 0.5 to 1.5 µg (SOA) m−3 (Fig. 3g), corresponding to reductions of 5 %–10 % (Fig. 3h). Over North America, annual-average surface SOA concentrations are reduced by 0.3–1.5 µg (SOA) m−3 when precursor dry removal is included (Fig. 3e), corresponding to a reduction of around 20 % to 35 % (Fig. 3f). Over Europe, dry deposition lowers annual-average surface SOA concentrations by around 0.2 µg (SOA) m−3 (25 %–40 %, Fig. 3e, f). Over both North America and Europe, the inclusion of wet deposition reduces annual average surface SOA concentrations by less than 0.2 µg (SOA) m−3 (Fig. 3g), but this corresponds to reductions of 20 % to 35 % (Fig. 3h).
Until now, the impacts of precursor deposition on SOA concentrations have only been quantified over Europe (Bessagnet et al., 2010) and North America (Knote et al., 2015), both of which use regional-scale models and treat SOA as semi-volatile. Note, Bessagnet et al. (2010) treat SOA formation by a single-step oxidation of parent VOC followed by reversible condensation into the aerosol phase. Knote et al. (2015) treat SOA formation using the volatility basis set (VBS). The sensitivity of SOA to precursor dry removal is in broad agreement with Bessagnet et al. (2010), who estimate that precursor dry deposition reduces July-average surface SOA concentrations by 20 %–40 % over Europe compared to 25 %–35 % for the same period in our study. Also, Knote et al. (2015) estimate that precursor dry deposition reduces annual-average surface SOA concentrations by 46 % over North America, compared to up to 20 %–35 % in our study. The modelled sensitivity of SOA concentrations to wet deposition in this study is in relatively good agreement with Knote et al. (2015), who estimate a 10 % reduction in annual-average surface SOA concentrations over North America when precursor wet deposition is included, which agrees with the 5 %–15 % reduction found here.
When dry and wet removal of VOC precursors are both included, SOA concentrations are substantially lower. However, as noted before, the effects of these removal processes do not add linearly. Inclusion of both dry and wet deposition of SOA precursors reduces annual-average surface SOA concentrations by 25 %–40 % over most continental regions (Fig. 3d), with maximum reductions of 5 µg (SOA) m−3 over India (Fig. 3c).
The lifetime of SOA precursors with respect to both oxidation and deposition is small. Hence, SOA precursors undergo very little transport before removal. Therefore, dry and wet deposition rates of VOCs are largest over terrestrial environments, where they are released. Across these simulations where the deposition of SOA precursors is altered, the global-average annual-average SOA lifetime varies from 4.3 to 4.7 d (not shown).
4.2 Comparison of simulated and observed OA concentrations
In this section, the influence of SOA precursor deposition on model agreement with observations is quantified. First, simulated SOA and OA concentrations are evaluated against surface observations in the Northern Hemisphere (NH) and Southern Hemisphere (SH), respectively. Next, vertical profiles of simulated OA concentrations are compared against aircraft observations.
Figure 4 shows SOA concentrations for the simulations described in Table 2 compared to observed surface SOA concentrations across the NH mid-latitudes, which are shown in Fig. 2. Observed SOA concentrations are in the form of averages over the campaign period (which ranges from a few days to 1 year), and span from 2000 to 2010. These observed concentrations are then matched to the grid box which they fall in, with the simulated monthly averages being selected for the year 2000. Hence, there is a mismatch in terms of the measurement year and the simulated year. When deposition of SOA precursors is omitted from the model, simulated SOA concentrations are substantially lower than observed, with a normalised mean bias (NMB) of −50 % (Fig. 4a). The model negative bias is present for each site-environment type but most evident in urban environments. For several sites in urban environments, observed SOA concentrations exceed simulated SOA concentrations by greater than a factor of 10 (Fig. 4a – red triangles). The model negative bias is also consistent regionally. Without SOA precursor deposition, the NMBs for Europe, North America and Asia is −50 %, −37 % and −62 %, respectively.
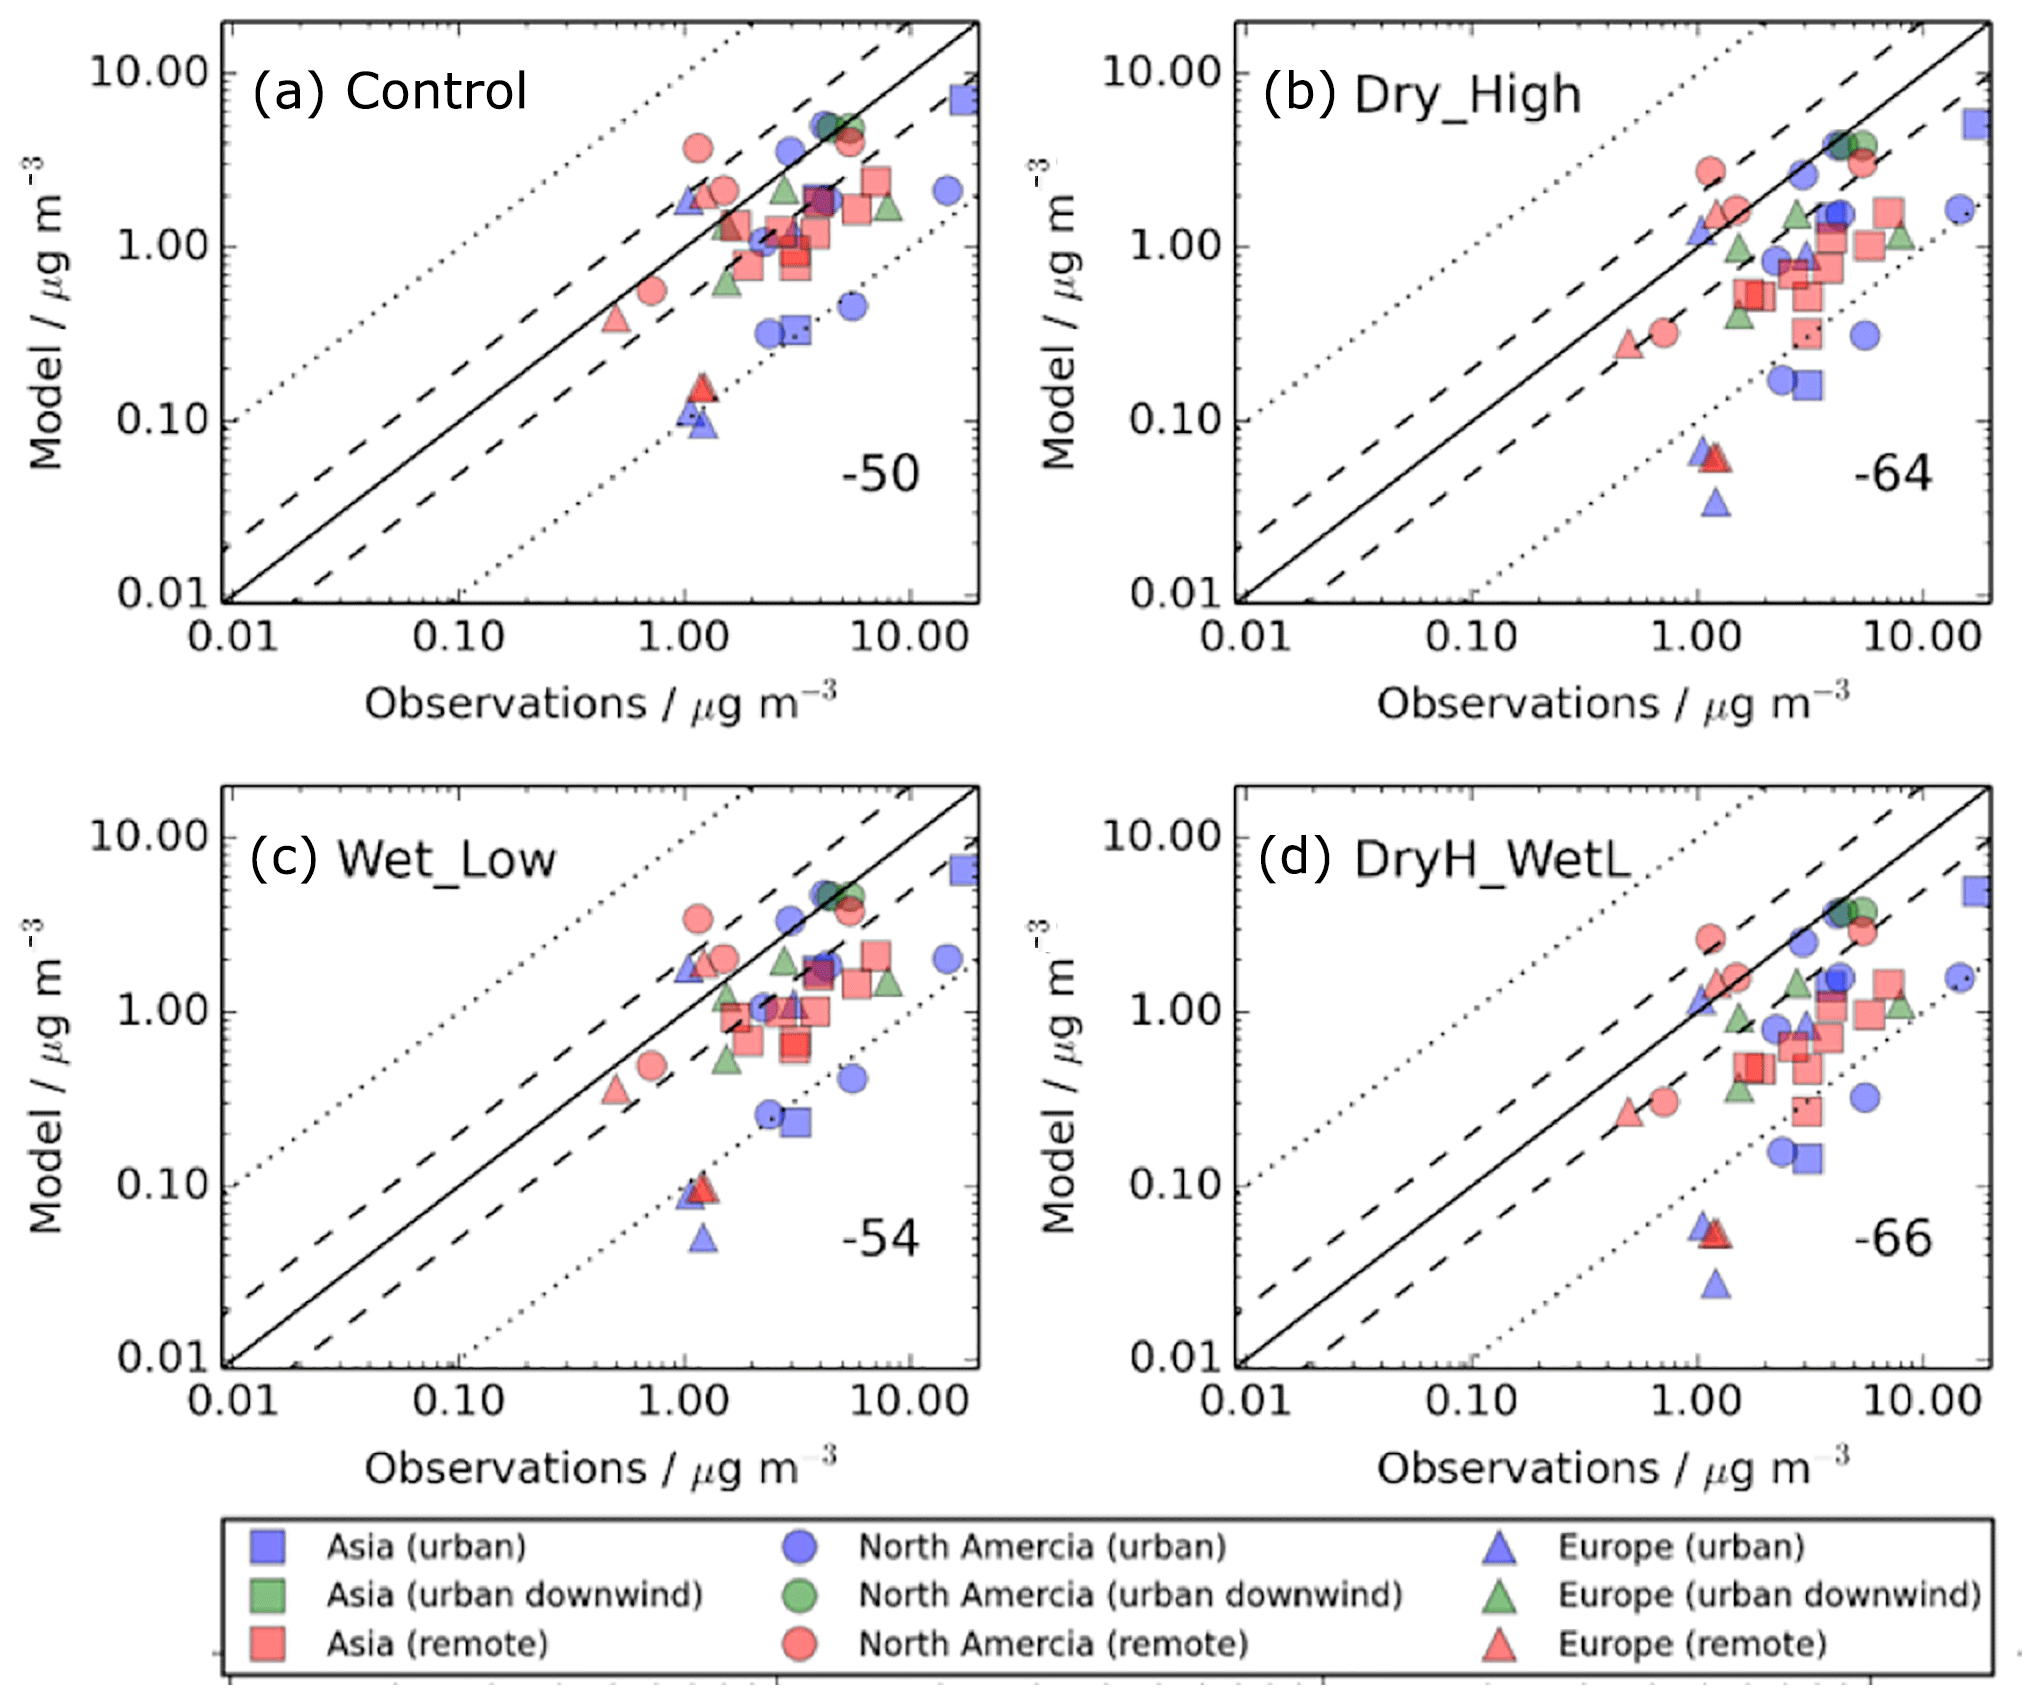
Figure 4Simulated versus observed surface SOA concentrations (µg m−3) for (a) Control, (b) Dry_High, (c) Wet_Low, and (d) DryH_WetL simulations, described in Table 3. Observations, originally compiled by Zhang et al. (2007), for the time period 2000–2010, are classified by site type – urban (blue), urban downwind (green), or remote (red) – and continent – Asia (squares), North America (circles), and Europe (triangles). Observed oxygenated OA is assumed to be comparable to simulated SOA. The 1 : 1 (solid), 1 : 2 and 2 : 1 (dashed), and 1: 10 and 10 : 1 (dotted) lines are indicated. Numerical values in the bottom right of each panel indicate the normalised mean bias (%).
The model negative bias with respect to observed SOA concentrations is common among global models (Tsigaridis et al., 2014). For several modelling studies, the negative bias is primarily attributed to either underestimated reaction yields, underestimated emissions, and/or missing emission sources. Hodzic et al. (2016) partially attributes the model negative bias with respect to observations to laboratory-derived SOA yields which do not account for wall losses. Other studies highlight VOC emission uncertainties such as underestimates in inventories (Li et al., 2017a) or the absence of semi- and intermediate-volatility organic compounds (S/IVOCs) which can contribute to SOA (Pye and Seinfeld, 2010), both of which are not included in this study.
Inclusion of precursor deposition further reduces model agreement with observations. As discussed in Sect. 4.1, including VOC dry deposition reduces the global annual-total SOA production rate by 32 % (24 Tg (SOA) a−1), whereas including VOC wet deposition reduces SOA production by 15 % (12 Tg (SOA) a−1) (Table 3). Therefore, the model negative bias is larger when including dry deposition (NMB %; Fig. 4b) compared to that when including wet deposition (NMB %; Fig. 11c). However, as the effects of VOC precursor dry and wet removal on simulated SOA are not additive, model performance is not substantially worse when both wet and dry deposition are considered (NMB %; Fig. 4d). When the measurement sites are categorised by region, with both dry and wet removal included, the NMBs across Europe, North America, and Asia are −66 %, −53 %, and −77 %, respectively.
Observed and simulated OA are shown in Fig. 5 for two sites in the tropics and SH, over Manaus (Brazil) and Welgegund (South Africa). Without precursor deposition, simulated SOA is overestimated compared to observed OA over Manaus (Brazil) (Fig. 5a), but underestimated over Welgegund (South Africa) (Fig. 5b). Therefore, inclusion of precursor deposition improves model performance over Manaus (Brazil) (Fig. 5a) but not over Welgegund (South Africa) (Fig. 5b). However, the scarcity of observations in the tropics and the SH result in difficulty in drawing robust conclusions on the influence of precursor deposition on model agreement with observations in this region.
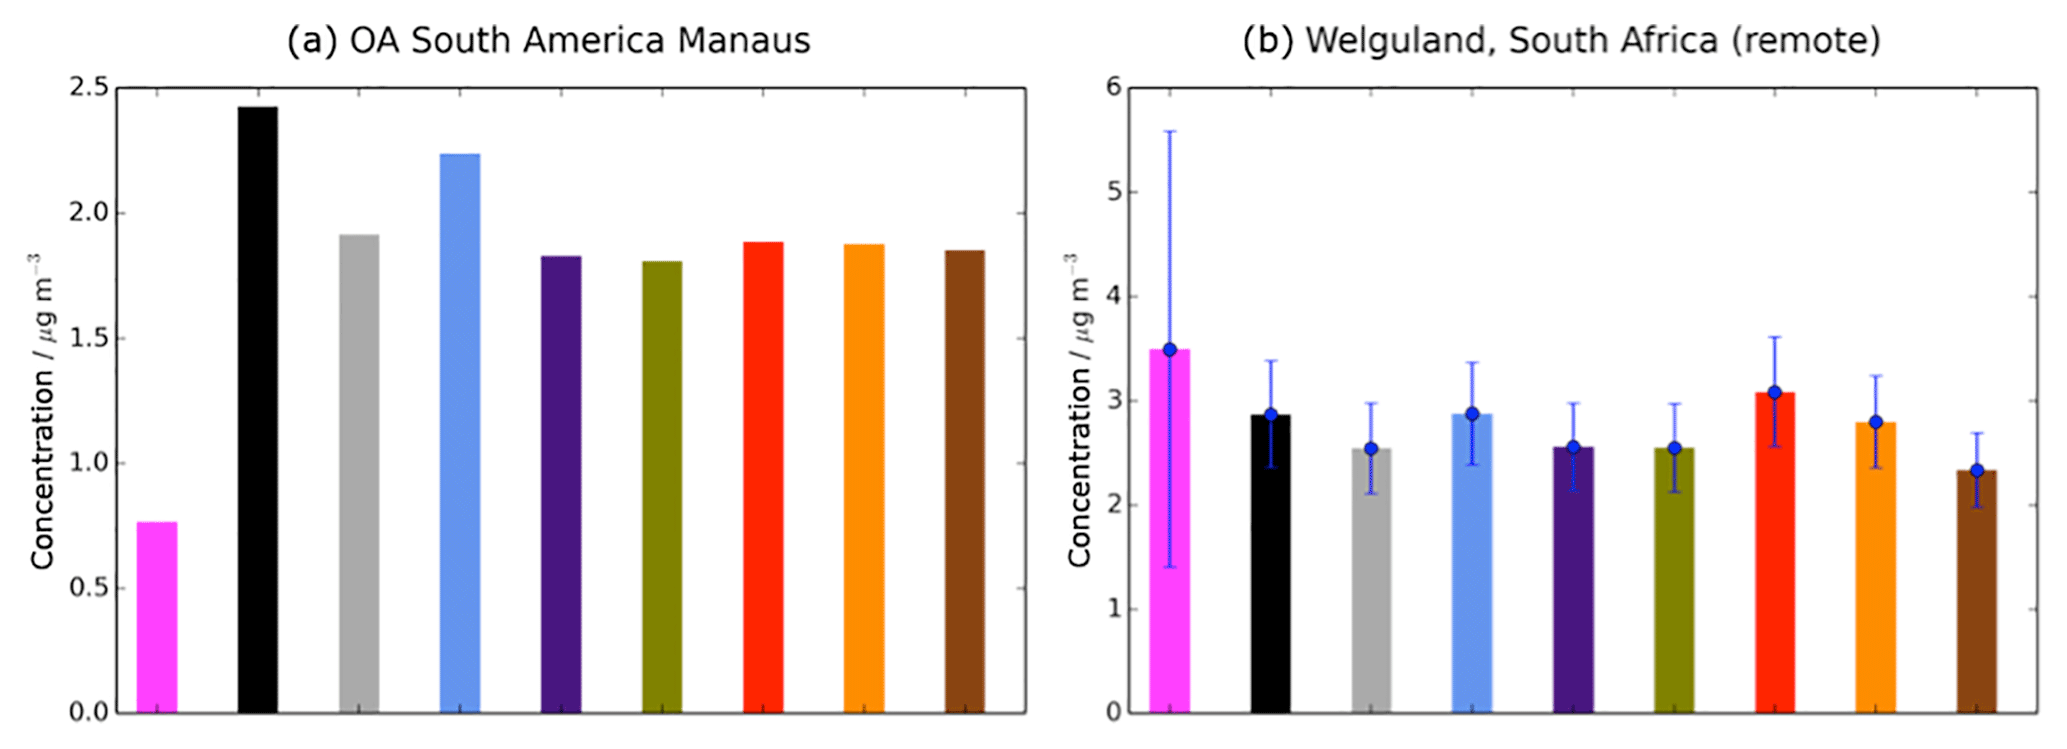
Figure 5Simulated and observed OA surface concentrations (µg m−3) over remote sites in the SH, (a) Manaus (Brazil), and (b) Welgegund (South Africa). Bars indicate OA concentrations from observed (pink) and simulated from the Control (black), Dry_High (grey), Wet_Low (blue), DryH_WetL (purple), Multi_nap (green), Multi_nap_yield (red), Multi_tol_yield (yellow), and Multi_benz_yield (brown) simulations, described in Table 3. For Welgegund, both observed and simulated monthly mean OA concentrations span an entire year. The standard deviations across this year, based on the monthly-mean data, are indicated in blue. For Manaus, however, the measurements of OA only span 1 month, hence no standard deviation is shown for this site.
Figure 6 shows the simulated OA vertical profiles against the AMS aircraft measurements. Without precursor deposition, model negative biases are again evident and are largest in polluted and biomass-burning-influenced regions in the NH. For example, over Europe (ADIENT, ADRIEX, and EUCAARI) and North America (ARCTAS-A, ARCTAS-B and ARCTAS-CARB), OA concentrations are underestimated by 71 % (ARCTAS-CARB; Fig. 6j) to 97 % (ARCTAS-B; Fig. 6h) when considering all altitudes. When VOC precursors of SOA do not undergo deposition, over western Africa, simulated OA concentrations are in good agreement between 0 and 3 km (Fig. 6k). However, above 3 km, model and simulated OA concentrations begin to deviate, with observed OA increasing with altitude, but modelled OA decreasing with altitude (Fig. 6k). When considering all altitudes of the AMMA campaign, modelled and measured OA concentrations are in fairly good agreement with a NMB of −53 % (Fig. 6k).
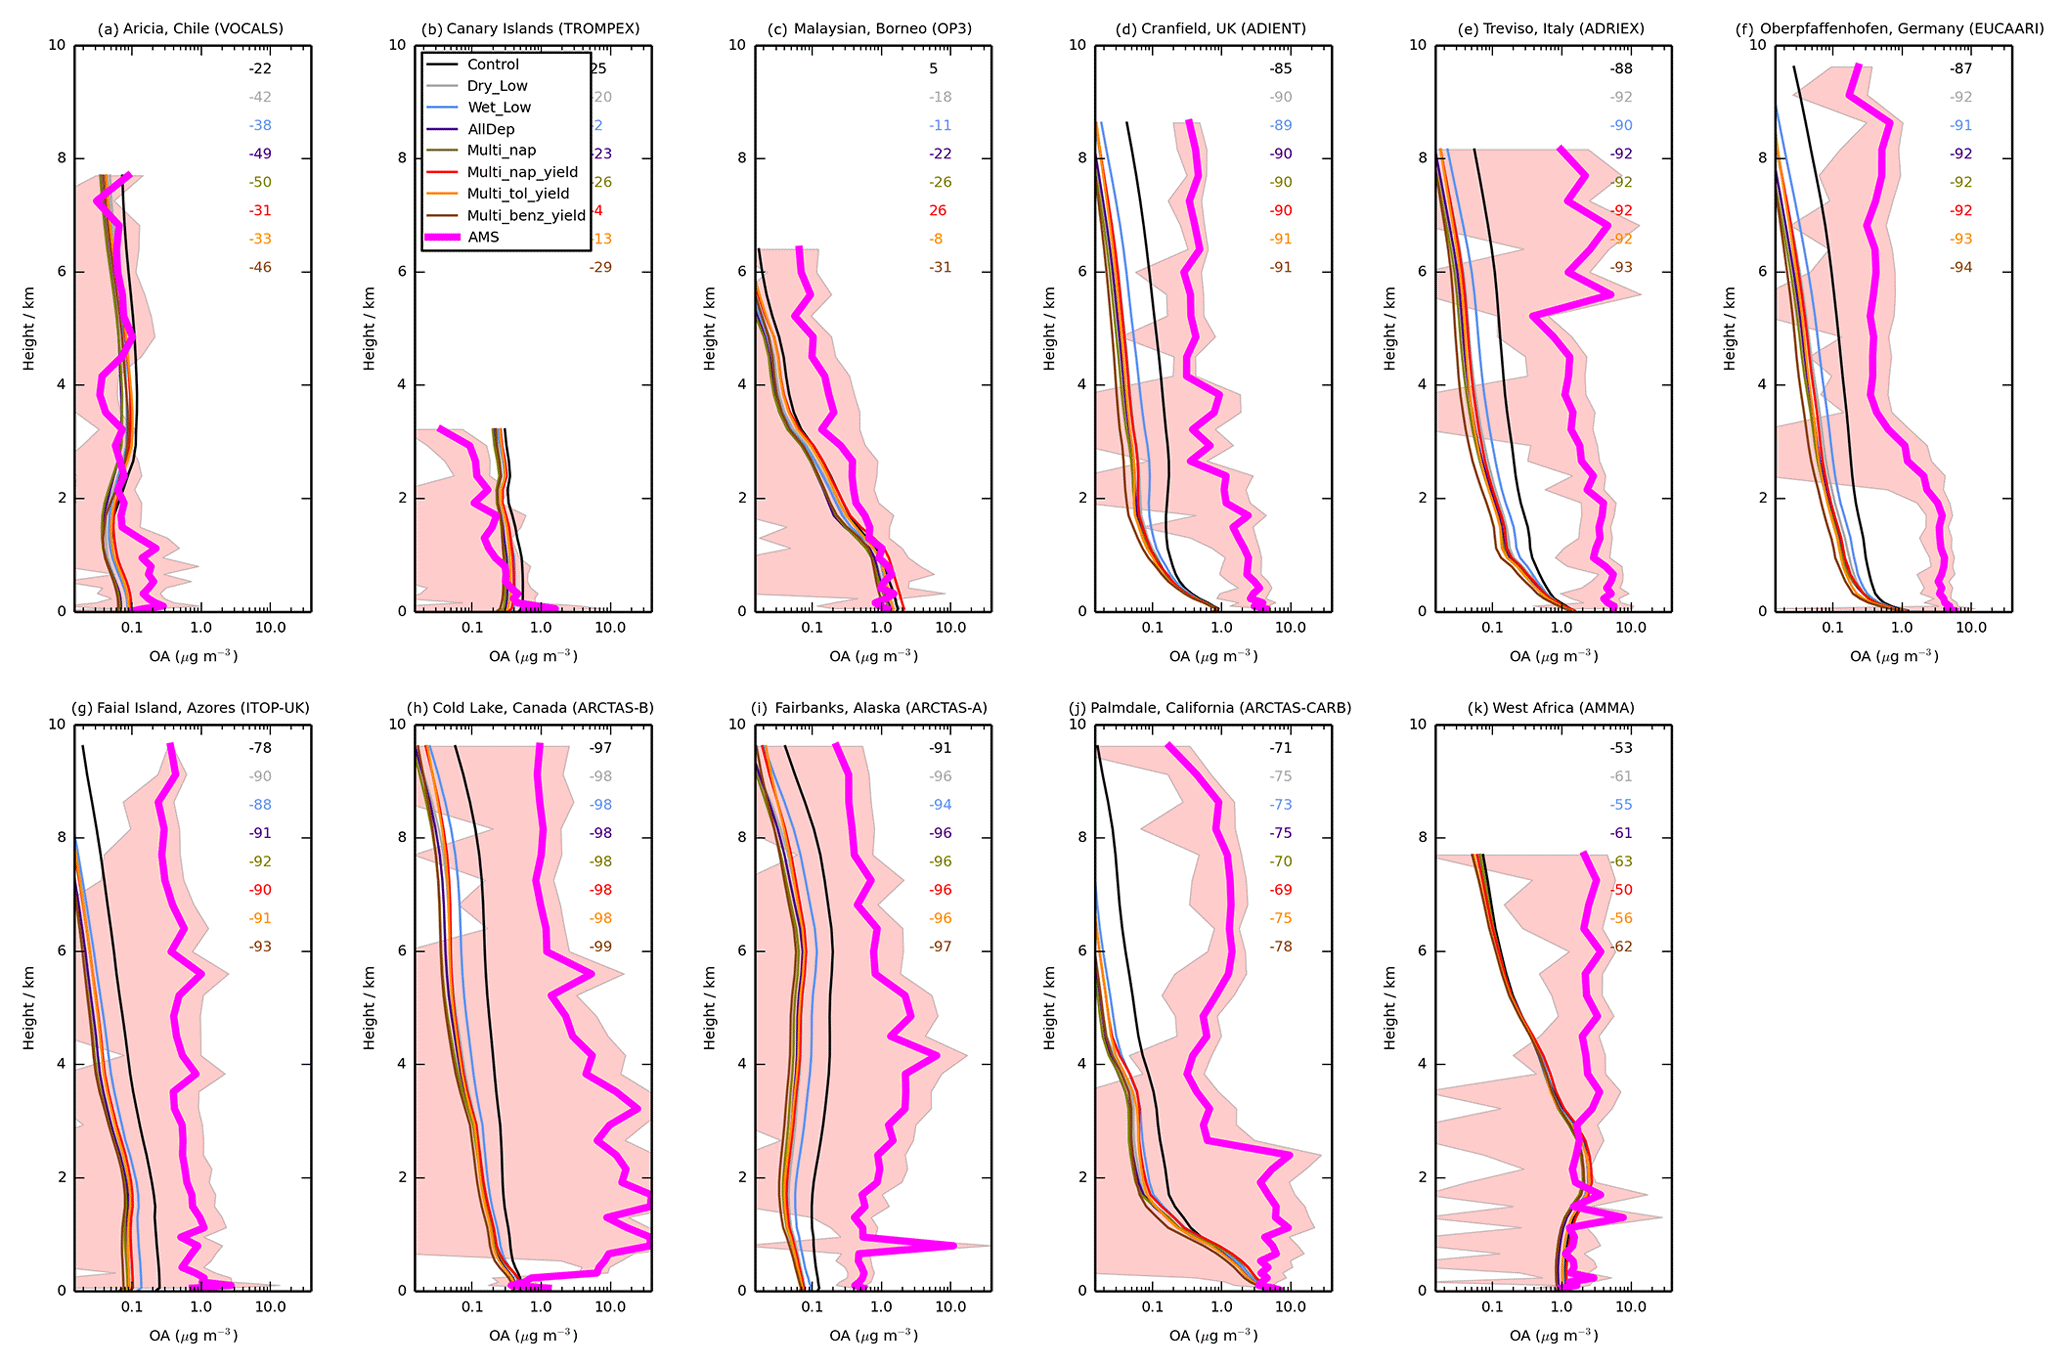
Figure 6Mean vertical profile of OA (µg m−3) from 11 field campaigns (pink) with monthly mean modelled OA from UKCA for the simulations described in Table 3. The standard deviation of the binned observations at each model layer is shown (peach envelope). For each campaign, the normalised mean bias (%) for each simulation is also included in the top right of each panel.
Over North America and Europe, including precursor deposition slightly worsens the model negative bias. When both precursor dry and wet deposition are included, the model underestimates observed OA concentrations by 75 % (ARCTAS-CARB; Fig. 6j) to 98 % (ARCTAS-B; Fig. 6h). Over West Africa, when VOC precursors of SOA undergo deposition, the model underestimates observed OA concentrations by 61 % (Fig. 6k).
Compared to other environments, in remote regions, model agreement with observations is relatively good, and the inclusion of precursor deposition results in both improvements and degradations in model biases in simulated OA compared to observations. Without SOA precursor deposition, simulated OA levels in VOCALS and ITOP-UK, similar to the pollution and biomass burning influenced regions, are much lower compared to observed OA (NMB % and −78 %; Fig. 6a and g, respectively). Therefore, inclusion of precursor deposition further reduces model agreement with observations (NMB % and −91 %; Fig. 6a and g, respectively). In contrast, for the TROMPEX and OP3 campaigns, when precursor deposition is neglected, simulated OA is higher than observed (NMB =25 % and 5 %; Fig. 6b and c, respectively). Inclusion of precursor deposition at these locations changes the model positive bias into a negative bias (NMB % and −22 %; Fig. 6b and c, respectively). For all aircraft campaigns conducted in remote environments, generally, simulated OA lies within one standard deviation of the observed concentration, irrespective of whether deposition of precursors is considered or not.
Overall, the inclusion of precursor deposition influences model agreement with observations somewhat. In particular, inclusion of precursor deposition worsens model negative biases with respect to observations in the NH mid-latitudes. However, differences between simulated OA concentrations from these simulations is substantially less than the difference between simulated and observed OA. These results highlight that variations in VOC deposition contribute to considerable uncertainty in both the global SOA budget and have some impact on model agreement with observations.
In this section, the sensitivity of SOA to hydrocarbon oxidation mechanisms is quantified. Here, oxidation mechanisms for anthropogenic and biomass burning VOCs are modified as described in Sect. 2.4.2. To begin with, the influence of anthropogenic and biomass burning VOC oxidation mechanisms on simulated SOA is explored. Next, the impact on model agreement with observations is evaluated. In all simulations, deposition of SOA precursors is included (Table 3), emissions of all SOA precursors are held constant, and the mechanistic description describing the oxidation of biogenic SOA precursors (monoterpene and isoprene) is held fixed, following Eq. (8).
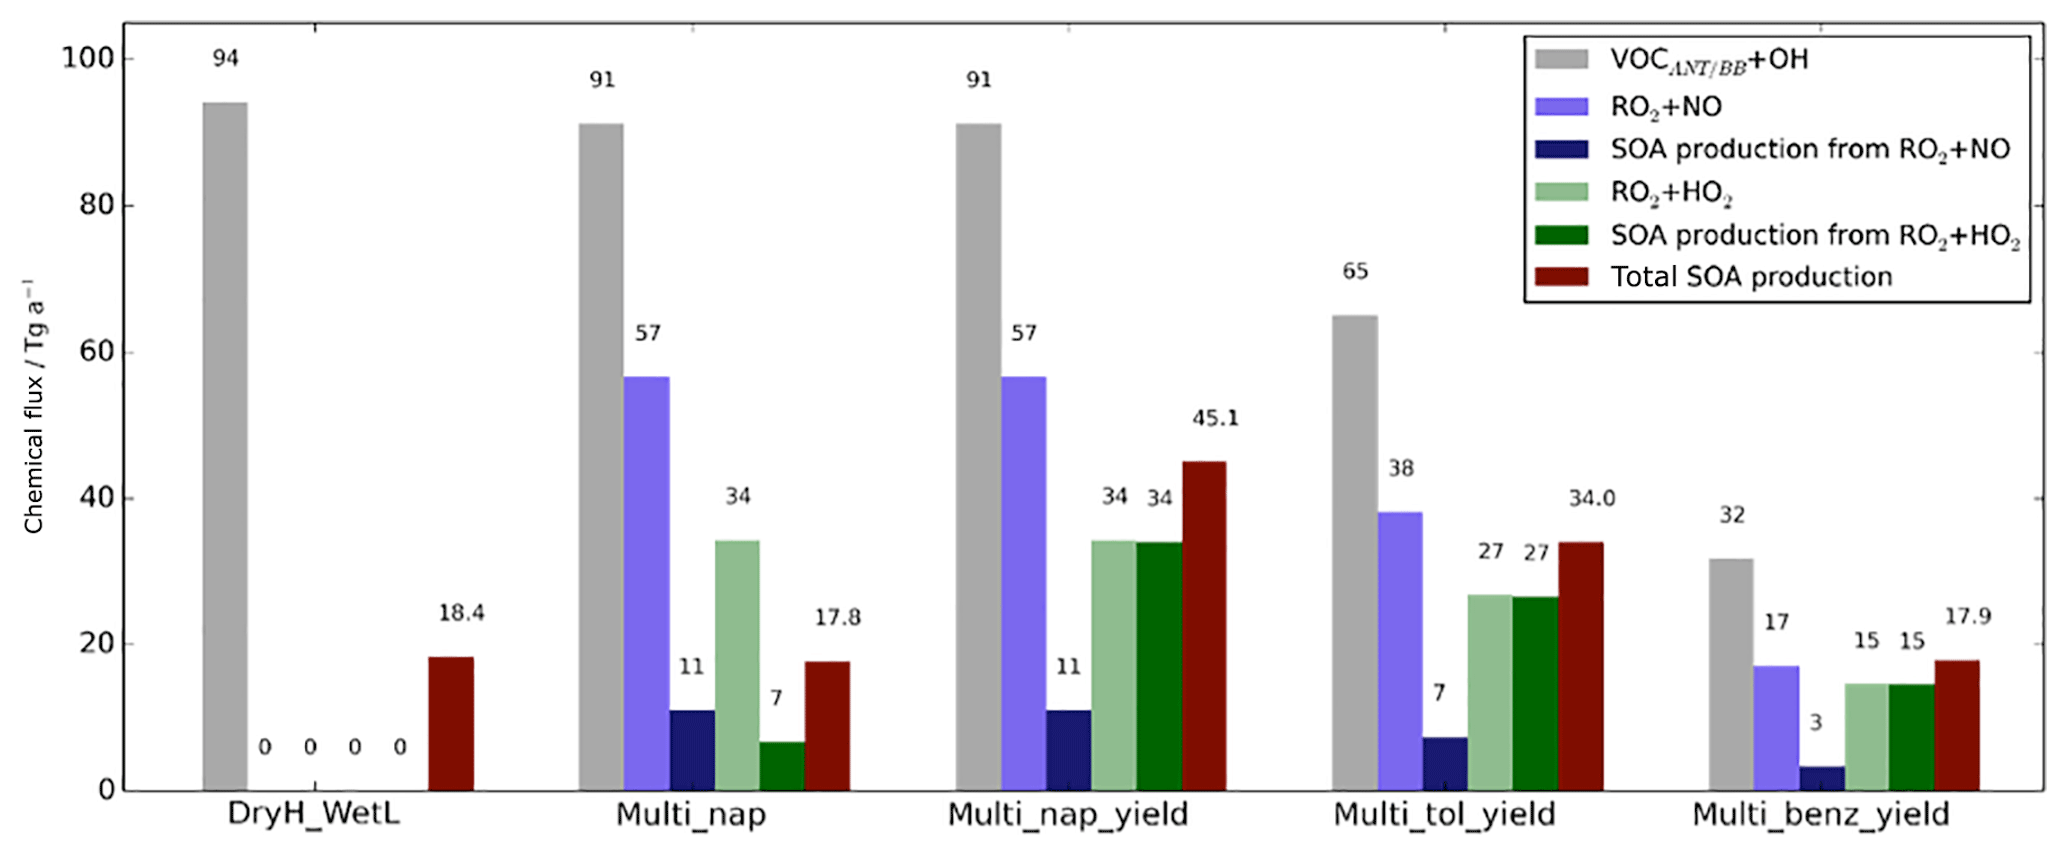
Figure 7Global annual-total reaction fluxes and total SOA production rate from anthropogenic and biomass burning hydrocarbons for the simulations described in Table 3. The global annual-total VOCANT∕BB emission rate, of 176 (VOCANT∕BB) a−1, is identical across all simulations.
5.1 Simulated SOA budget and concentrations
Firstly, the single-step oxidation mechanism of VOCANT∕BB with reactivity based on α-pinene and a fixed reaction yield of 13 % is described (DryH_WetL). The global annual-total reaction fluxes and SOA production rates from anthropogenic and biomass burning hydrocarbons are shown in Fig. 7. As described in Sect. 2.3, the global annual-total VOCANT∕BB emission rate is 176 (VOCANT∕BB) a−1, which is held fixed across all simulations. In this case, the global annual-total VOCANT∕BB oxidation rate by OH is 94 Tg (VOC) a−1 (DryH_WetL; Fig. 7). The remaining 82 Tg (VOC) a−1 undergoes deposition (not shown). For this single-step mechanism, oxidation of the emitted parent hydrocarbon directly forms the non-volatile product, SOG, which condenses almost immediately. A fixed reaction yield of 13 % is assumed, resulting in a global annual-total SOA production rate of 18.4 Tg (SOA) a−1 (Fig. 7). Note, due to differences in relative molecular masses for VOCANT∕BB and SOG, the stoichiometric yield is not equivalent to the mass yield. Expressed as a fraction of emitted parent VOC (176 Tg (VOC) a−1), the overall yield of SOA production from anthropogenic and biomass burning VOCs (18.4 Tg (SOA) a−1) is around 10 %.
The combination of a single-step oxidation mechanism and the assumption of a relatively reactive parent hydrocarbon results in rapid production of SOA. Figure 8 shows the spatial distributions of annual-total surface VOCANT∕BB emissions, annual-average surface OH concentrations, annual-total vertically integrated oxidation rates, and the resulting SOA production rates. As expected, the spatial distributions of VOCANT∕BB emissions mainly reflects anthropogenic activity. Over high emissions regions, OH concentrations are also relatively high. Over India, China, Europe, and North America, annual-average OH concentrations are in the range of 32– ppt(v) (Fig. 8b). Therefore, for most major VOCANT∕BB emissions source regions, OH availability is high, resulting in rapid oxidation; reaction fluxes of peak very close to emissions sources (cf. Fig. 8a, c). However, uncertainty in simulated OH concentrations will be translated into uncertainty in SOA production. OH is the principal oxidising agent of the atmosphere. Therefore, in order to successfully model OH, many other species (e.g. methane) also need to be modelled correctly (Lelieveld et al., 2016). Due to its very short lifetime (∼ seconds) and low concentrations, OH is difficult to measure (Stone et al., 2012). Alternatively, the OH concentration can be constrained indirectly from the CH4 lifetime. Overall, the OH concentration is a difficulty quantity to capture in a global model.
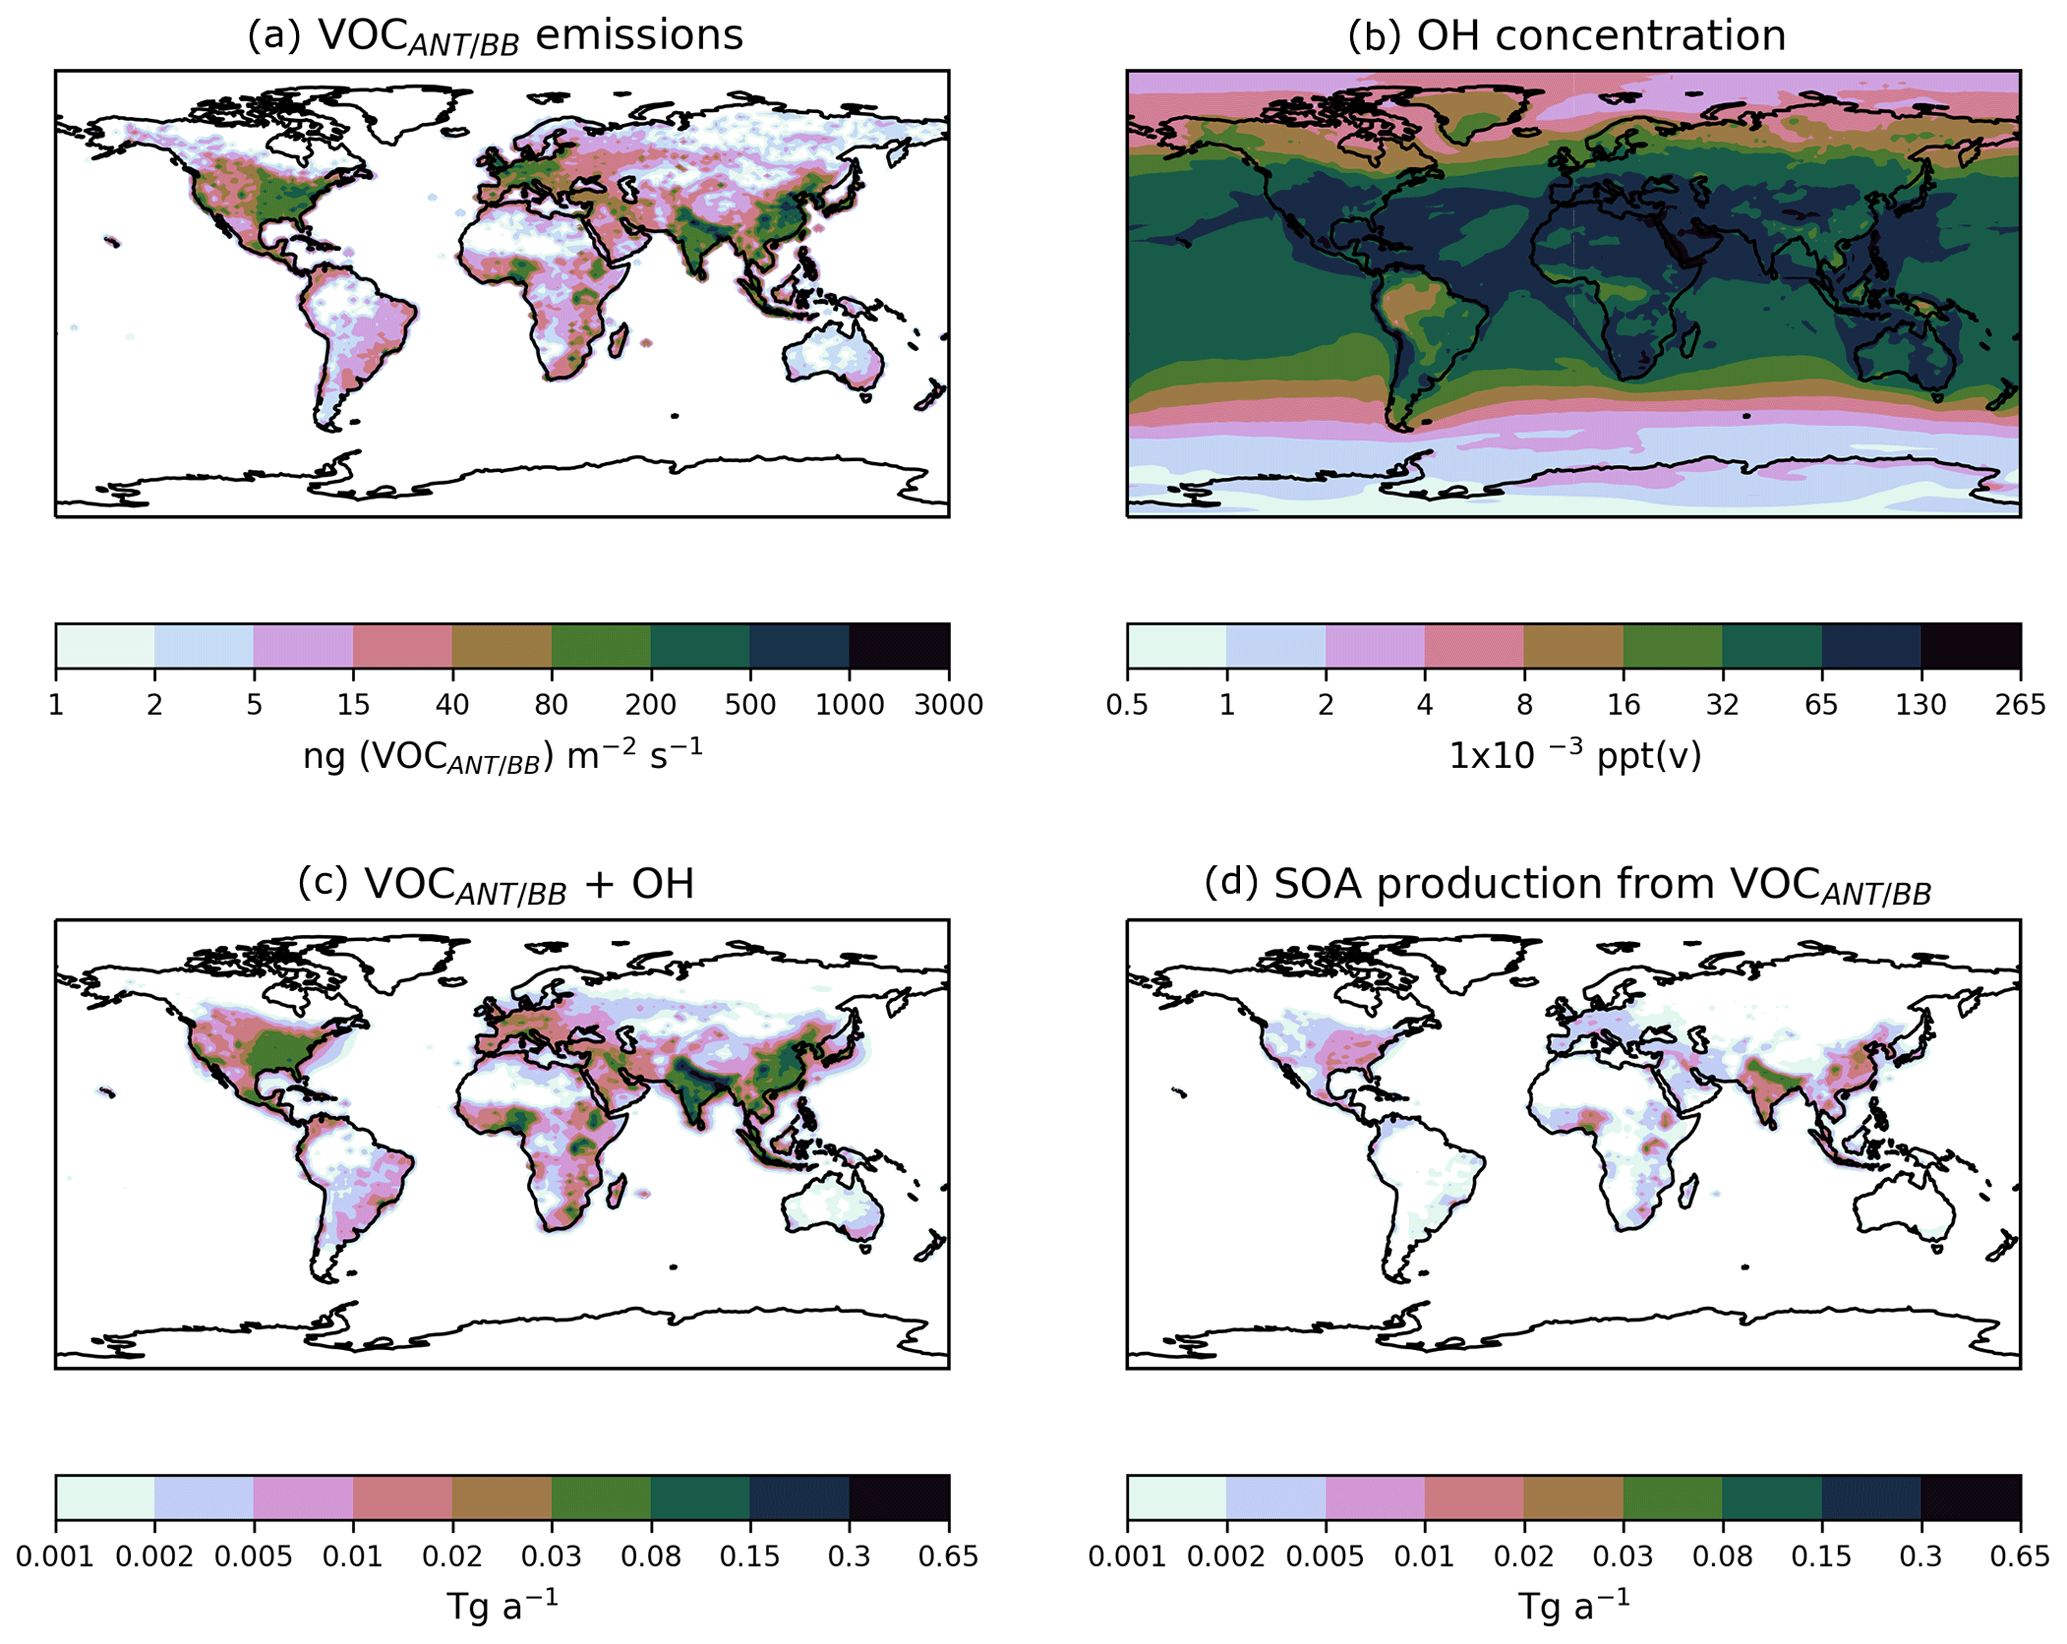
Figure 8Global distributions of (a) the annual-total VOCANT∕BB emission rate (ng (VOCANT∕BB) m−2 s−2), (b) the annual mean surface OH concentrations (ppt(v)), (c) the annual-total vertically integrated VOCANT∕BB oxidation rate by OH (Tg a−1), and (d) the corresponding annual-total SOA production rate (Tg a−1), when SOA precursor deposition and a single oxidation step with a yield of 13 % is applied (DryH_WetL; Table 3).
Also, as shown in Eq. (8), oxidation of the parent VOC results in immediate production of the condensing species, SOG. Hence, not only do parent VOCs undergo rapid oxidation, but the product of this reaction is in the form of condensable organic vapours. Therefore, this combination of high parent VOC reactivity with few reaction steps results in extremely localised SOA production from anthropogenic and biomass burning emissions. This is in contrast to other global modelling studies, which predict more regionally distributed SOA production (Pye and Seinfeld, 2010; Tsimpidi et al., 2016). Differences in the geographical extent to which SOA production occurs may be attributed to precursor reactivity and the number of reaction intermediates. For example, here, the parent hydrocarbon is a VOC, with a rate constant of cm3 molecule−1 s−1 at 298 K (Table 1), forming SOA in a single-step reaction mechanism. Hence, local SOA production is simulated (Fig. 8d). Conversely, SOA production is more regionally distributed when treated from S/IVOC multi-generational chemistry, where the parent hydrocarbon and oxidation products all react relatively slowly (Tsimpidi et al., 2016). High observed OA concentrations over remote regions (Boreddy et al., 2015, 2016) provide evidence for the slow and sustained mechanistic description of SOA production from S/IVOCs (Tsimpidi et al., 2016). High observed OA concentrations within industrialised emissions source regions (Zhang et al., 2007) support the fast mechanistic description of SOA production from VOCs simulated here.
To summarise, the combination of fast reactivity and a single-step oxidation mechanism favours extremely localised SOA production, with parent VOCs undergoing rapid oxidation and subsequent condensation close to source.
In the following subsections, SOA formation mechanisms are altered, including introducing a reaction intermediate, accounting for the influence of oxidants on SOA yields, and reducing the chemical reactivity of the parent VOC (Eq. 9; Sect. 2.4.2). This begins with an evaluation of the mechanism with the reaction intermediate and with reactivity based on naphthalene (Multi_nap) and how this mechanism compares to the single-step oxidation mechanism with reactivity based on α-pinene (DryH_WetL). For this comparison, the individual effects of reduced parent VOC reactivity, introduction of the reaction intermediate, and SOA production from the reaction intermediate, are evaluated separately in Sect. 5.1.1 to 5.1.3. Next, the effects of accounting for the difference in volatility between RO2 oxidation products is evaluated (Multi_nap_yield) in Sect. 5.1.4. Finally, less reactive parent hydrocarbons are explored in Sect. 5.1.5 (Multi_tol_yield and Multi_benz_yield).
5.1.1 Initial OH oxidation of parent hydrocarbon
Production of SOA from anthropogenic and biomass burning hydrocarbons is modified in the following subsections to follow the mechanism of Eq. (9) which include the reaction intermediate. Naphthalene, the most reactive aromatic VOC considered in this study, is first selected (Sect. 2.4.2), with identical reaction yields applied to both RO2 pathways (Multi_nap simulation; Table 3).
The initial reaction of VOCANT∕BB with OH is compared to that of a single oxidation reaction step (DryH_WetL; Table 3). At 298 K, the rate constants for α-pinene and naphthalene oxidation by OH are 52.9 and cm3 molecule−1 s−1, respectively (Tables 1 and 3). The global annual-total VOCANT∕BB oxidation rate reduces by 3 Tg (VOC) a−1 (or 3 %), from 94 Tg (VOC) a−1 using the reactivity of α-pinene to 91 Tg (VOC) a−1 using the reactivity of naphthalene (Fig. 7). Therefore, the global VOCANT∕BB oxidation rate is relatively insensitive to a ∼50 % reduction in reactivity. When applying a 13 % stoichiometric yield to this reaction sequence (Table 3), this reduction in parent VOC oxidation rate contributes to a marginal change in the global annual-total SOA production rate (0.6 Tg (SOA) a−1).
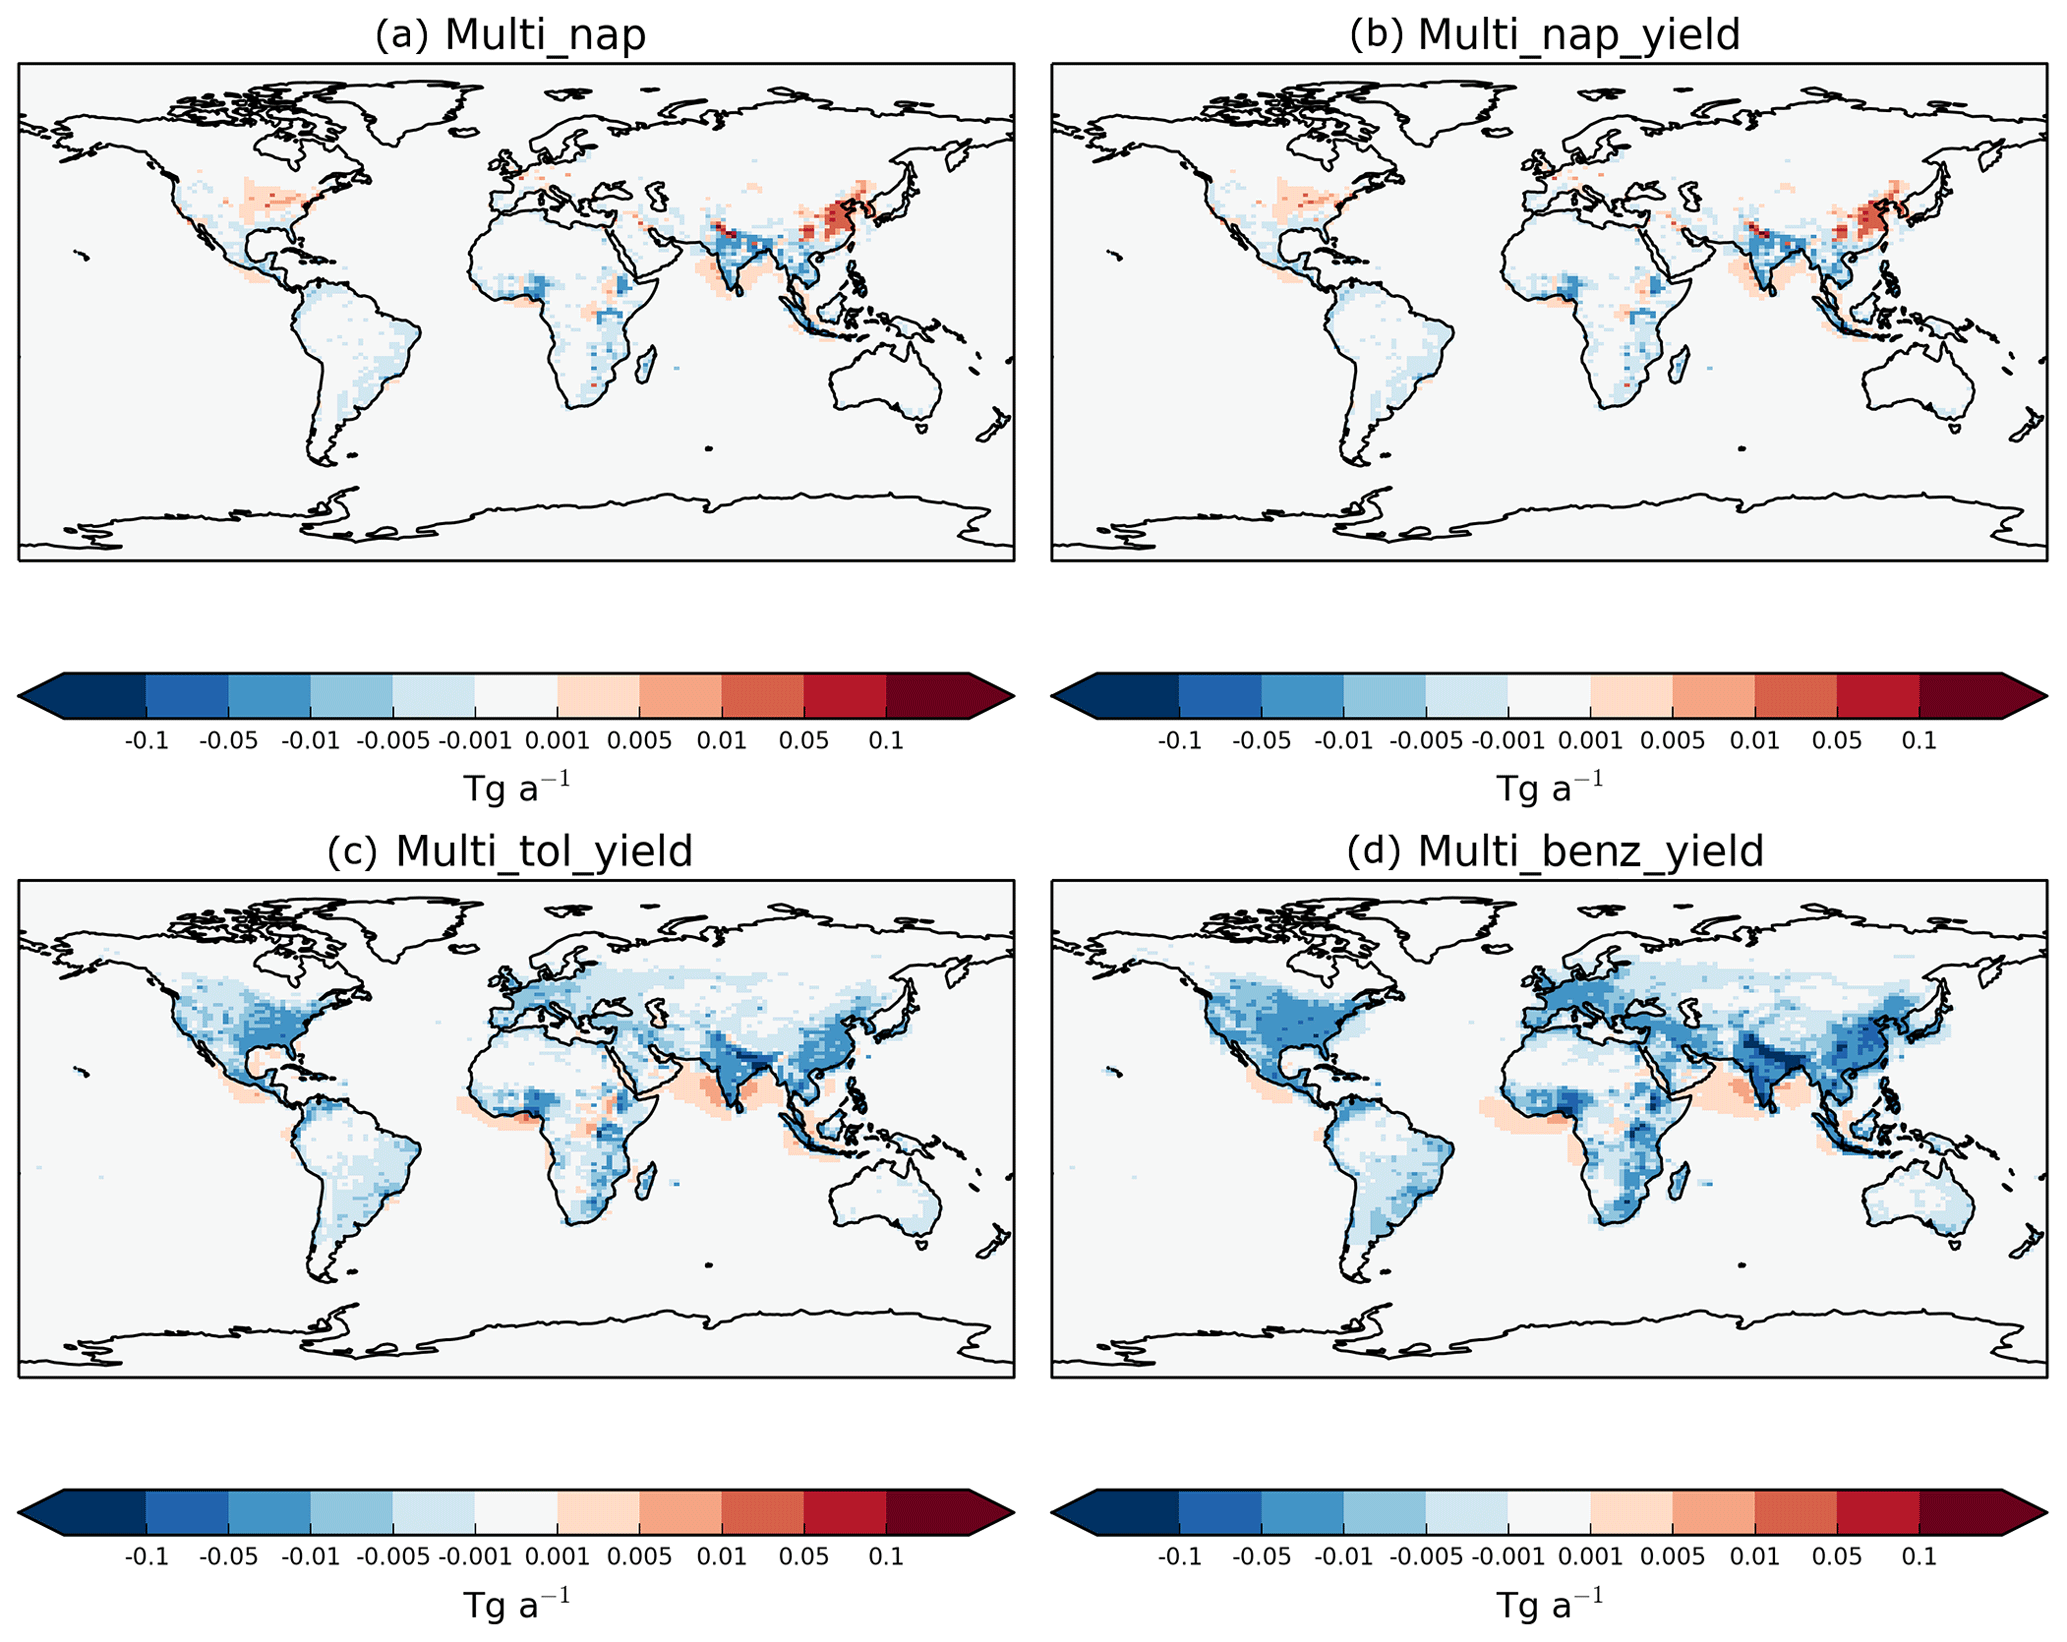
Figure 9Global distribution of the absolute differences in annual-total vertically integrated VOCANT∕BB oxidation rates (Tg (VOC) a−1) in (a) the Multi_nap, (b) the Multi_nap_yield, (c) the Multi_tol_yield, and (d) the Multi_benz_yield simulations relative to the DryH_WetL simulation.
The response of regional VOC oxidation rates to a ∼50 % reduction in the reactivity vary in both magnitude and sign. Figure 9 shows the difference in annual-total vertically integrated VOCANT∕BB oxidation rates for the mechanism which include the reaction intermediate (Table 3), relative to the mechanism which does not include the reaction intermediate with reactivity based on α-pinene (DryH_WetL; Table 3). Reduced chemical reactivity lowers oxidation rates within emission source regions. For example, over India and parts of Africa, annual-total VOCANT∕BB oxidation rates reduce by up to 0.05 Tg (VOCANT∕BB) a−1 (Fig. 9a); these changes in annual-total VOCANT∕BB oxidation rates within emissions source regions correspond to reductions between 10 % and 30 % (not shown). By contrast, downwind of many emissions source regions, the lower reactivity acts to enhance VOCANT∕BB oxidation rates. For example, over the Arabian Sea, over southeast China, off the coast of Nigeria, and over the southeast USA, annual-total VOCANT∕BB oxidation rates increase by 0.001–0.05 Tg (VOCANT∕BB) a−1 in response to a ∼50 % reduction in parent VOC reactivity (Fig. 9a). These changes in annual-total VOCANT∕BB oxidation rates downwind of emissions source regions correspond to reductions which exceed 60 % (not shown). As discussed in Sect. 5.1, adoption of the reactivity of α-pinene for the reaction results in peak VOC oxidation rates at emission source, with VOCs undergoing very little transport (Fig. 8c). Therefore, by reducing the reactivity by ∼50 %, fewer VOCANT∕BB are oxidised at source but transport of VOCANT∕BB away from source is promoted.
5.1.2 Chemical fate of the new reaction intermediate, RO2
Oxidation of the parent VOC forms a new reaction intermediate, the peroxy radical RO2. In this case, VOCANT∕BB oxidation results in a global annual-total peroxy radical production rate of 91 Tg (RO2) a−1 (Multi_nap simulation; Fig. 7). Introduction of this new reaction intermediate has the potential to either reduce and/or delay SOA production, depending on assumptions regarding the strength of deposition and chemical reactivity of this intermediate. For example, SOA production would be reduced if the peroxy radical undergoes significant deposition, which is dependent on deposition parameters such as surface resistances and solubility (Sect. 2.4.1). Additionally, SOA production could be reduced or delayed if the chemical removal of RO2 is slow. The influence of introducing the peroxy radical as a reaction intermediate is therefore predetermined by assumptions in deposition parameters and reaction kinetics. In all simulations, RO2 is assumed to have identical solubility and surface resistances to all other SOA precursors, Heff=105 M atm−1 and “Low” surface resistances (Table 2). At 298 K, the rate constants for RO2 oxidation by HO2 and NO, taken from Atkinson and Arey (2003), are 14.8 and cm3 molecule−1 s−1, respectively (Table 1). Consequently, of the 91 Tg of RO2 generated annually, oxidation by NO and HO2 removes 57 and 34 Tg (RO2) a−1, respectively (Multi_nap_yield; Fig. 7). Deposition of RO2 is inconsequential at 0.1 Tg (RO2) a−1 (not shown). This extremely low deposition rate is because the chemical removal of the peroxy radical is extremely fast. The global annual-average lifetime of RO2 with respect to oxidation is ∼1 d, which is relatively short in comparison to atmospheric transport timescales. Note, a review of laboratory studies suggests the lifetime of RO2 could be of the order of minutes (Orlando et al., 2012). Therefore, due to marginal deposition and fast oxidation, introduction of the peroxy radical reaction intermediate will probably have no effect on either the SOA production rate or the geographical distribution of SOA production, which are both quantified in the following Sect. 5.1.3.
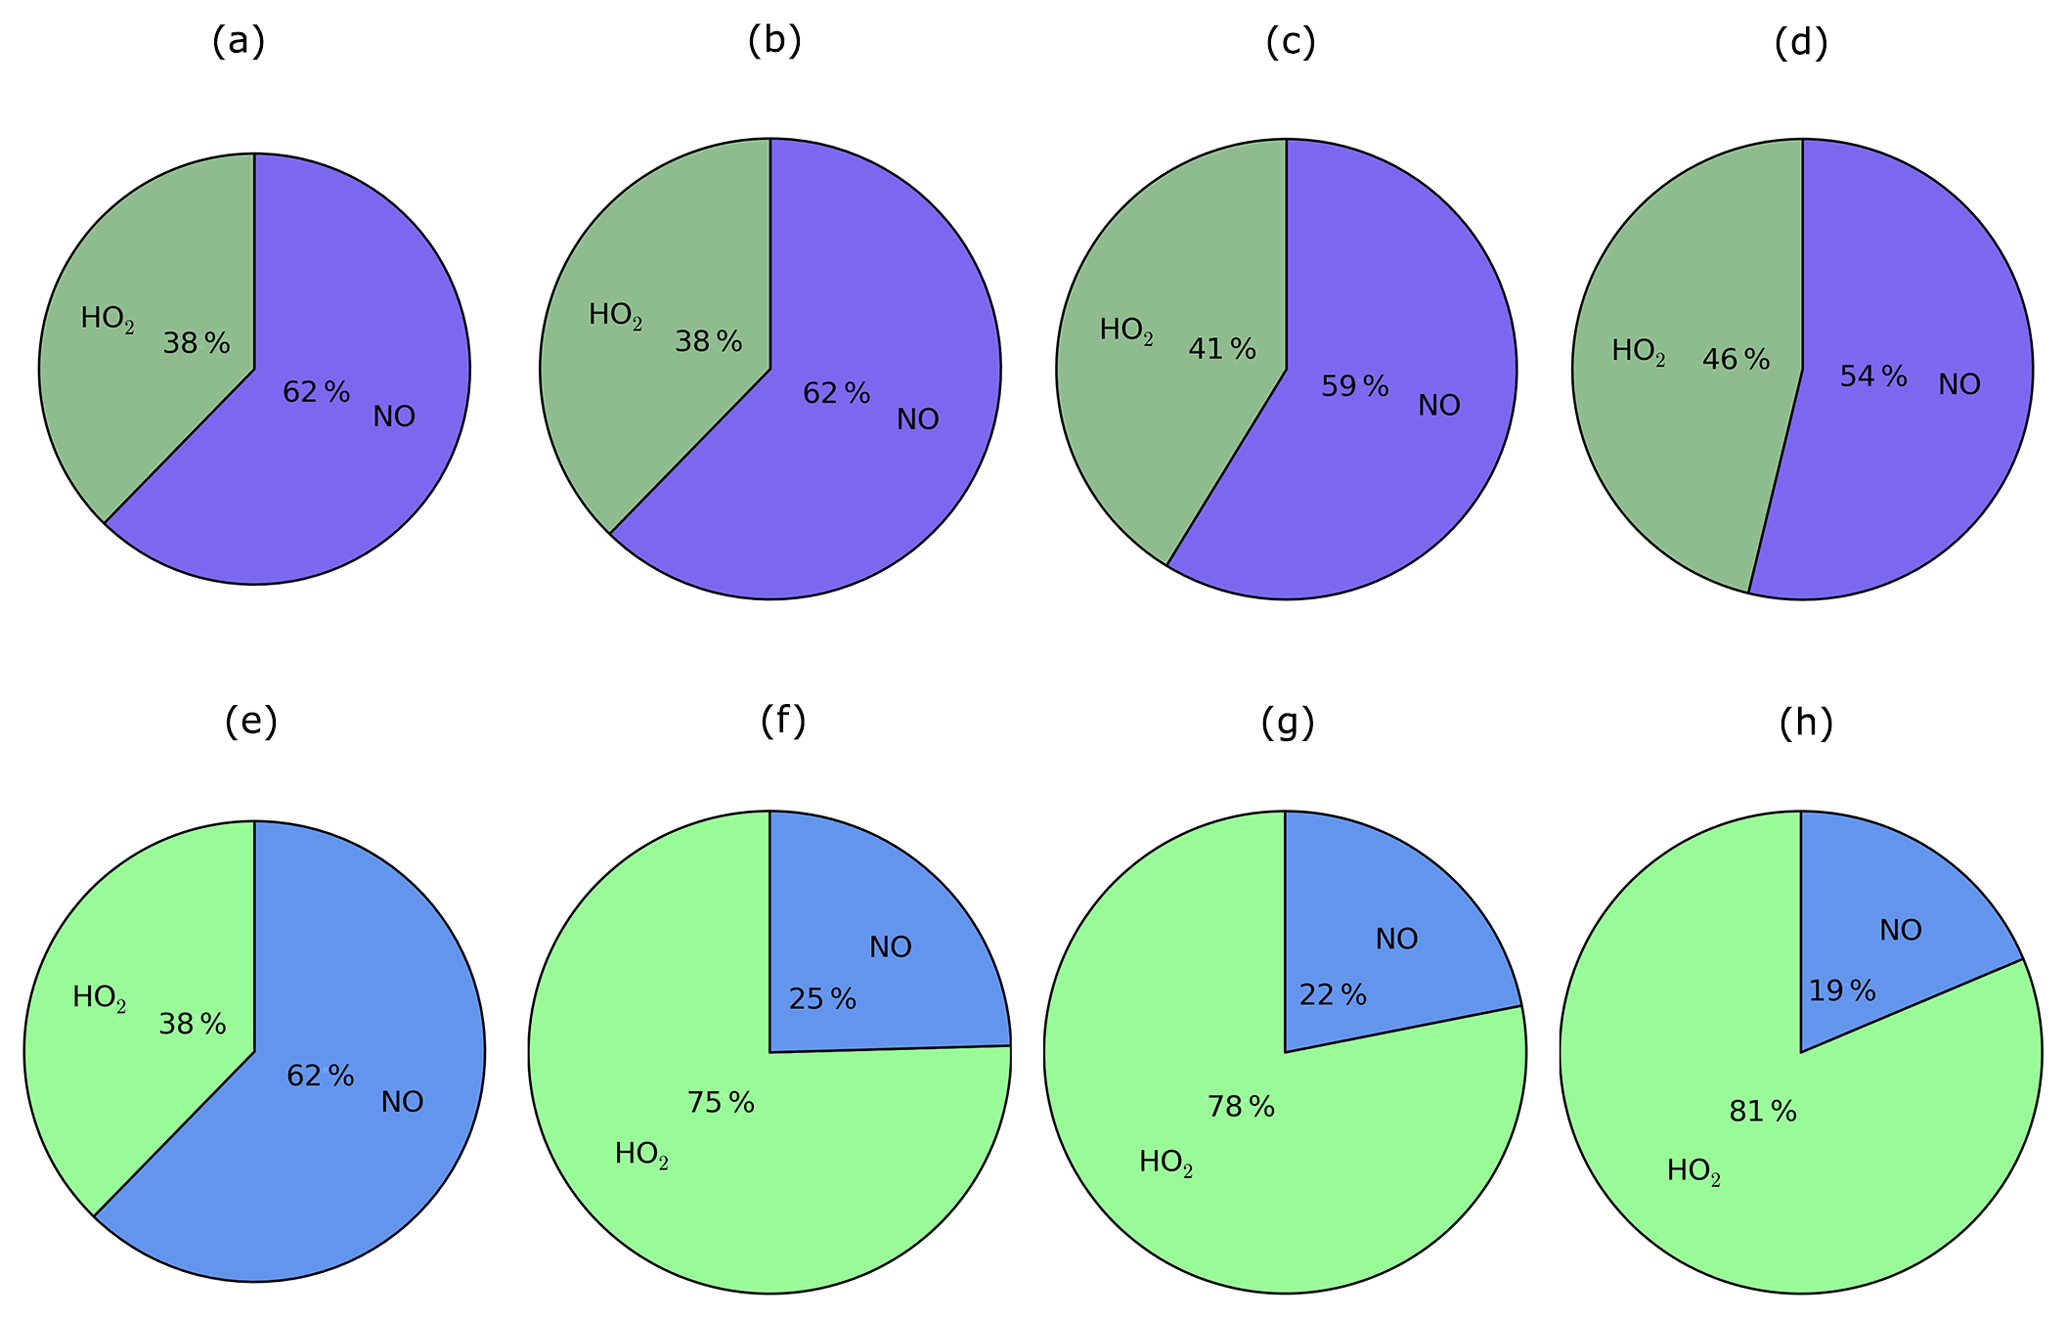
Figure 10For the peroxy radical, chemical removal (top row; a–d) and SOA production (bottom row; e–h) for the Multi_nap (first column; a, e), Multi_nap_yield (second column; b, f), Multi_tol_yield (third column; c, g), and Multi_benz_yield (fourth column; d, h) simulations, which are described in Table 3.
Chemical removal of the peroxy radical via the two oxidative pathways is an important factor in governing the strength of SOA production, as discussed later in Sect. 5.1.3 to 5.1.5. RO2 is chiefly removed by NO, as opposed to HO2 radicals. This is demonstrated in Fig. 10, which shows the relative contributions of the HO2 and NO peroxy radical oxidative pathways to the total chemical removal of RO2 (top row) and to SOA production (bottom row). On a global and annual mean basis, removal by NO accounts for 62 % of RO2 chemical loss (Fig. 10a). Other global modelling studies, which consider the peroxy radical as a reaction intermediate from aromatic compounds or IVOCs, also predict RO2 removal to be dominated by NO. Henze et al. (2008) estimate that 61 % react via the NO pathway for peroxy radicals generated from benzene, xylene, and toluene. For peroxy radicals generated from IVOCs with parent hydrocarbon reactivity based on naphthalene, 66 % are consumed by NO (Pye and Seinfeld, 2010). These results suggest that the chemical fate of the peroxy radical is robust despite the likelihood of variations in precursor emissions and oxidant concentrations between this and the aforementioned studies.
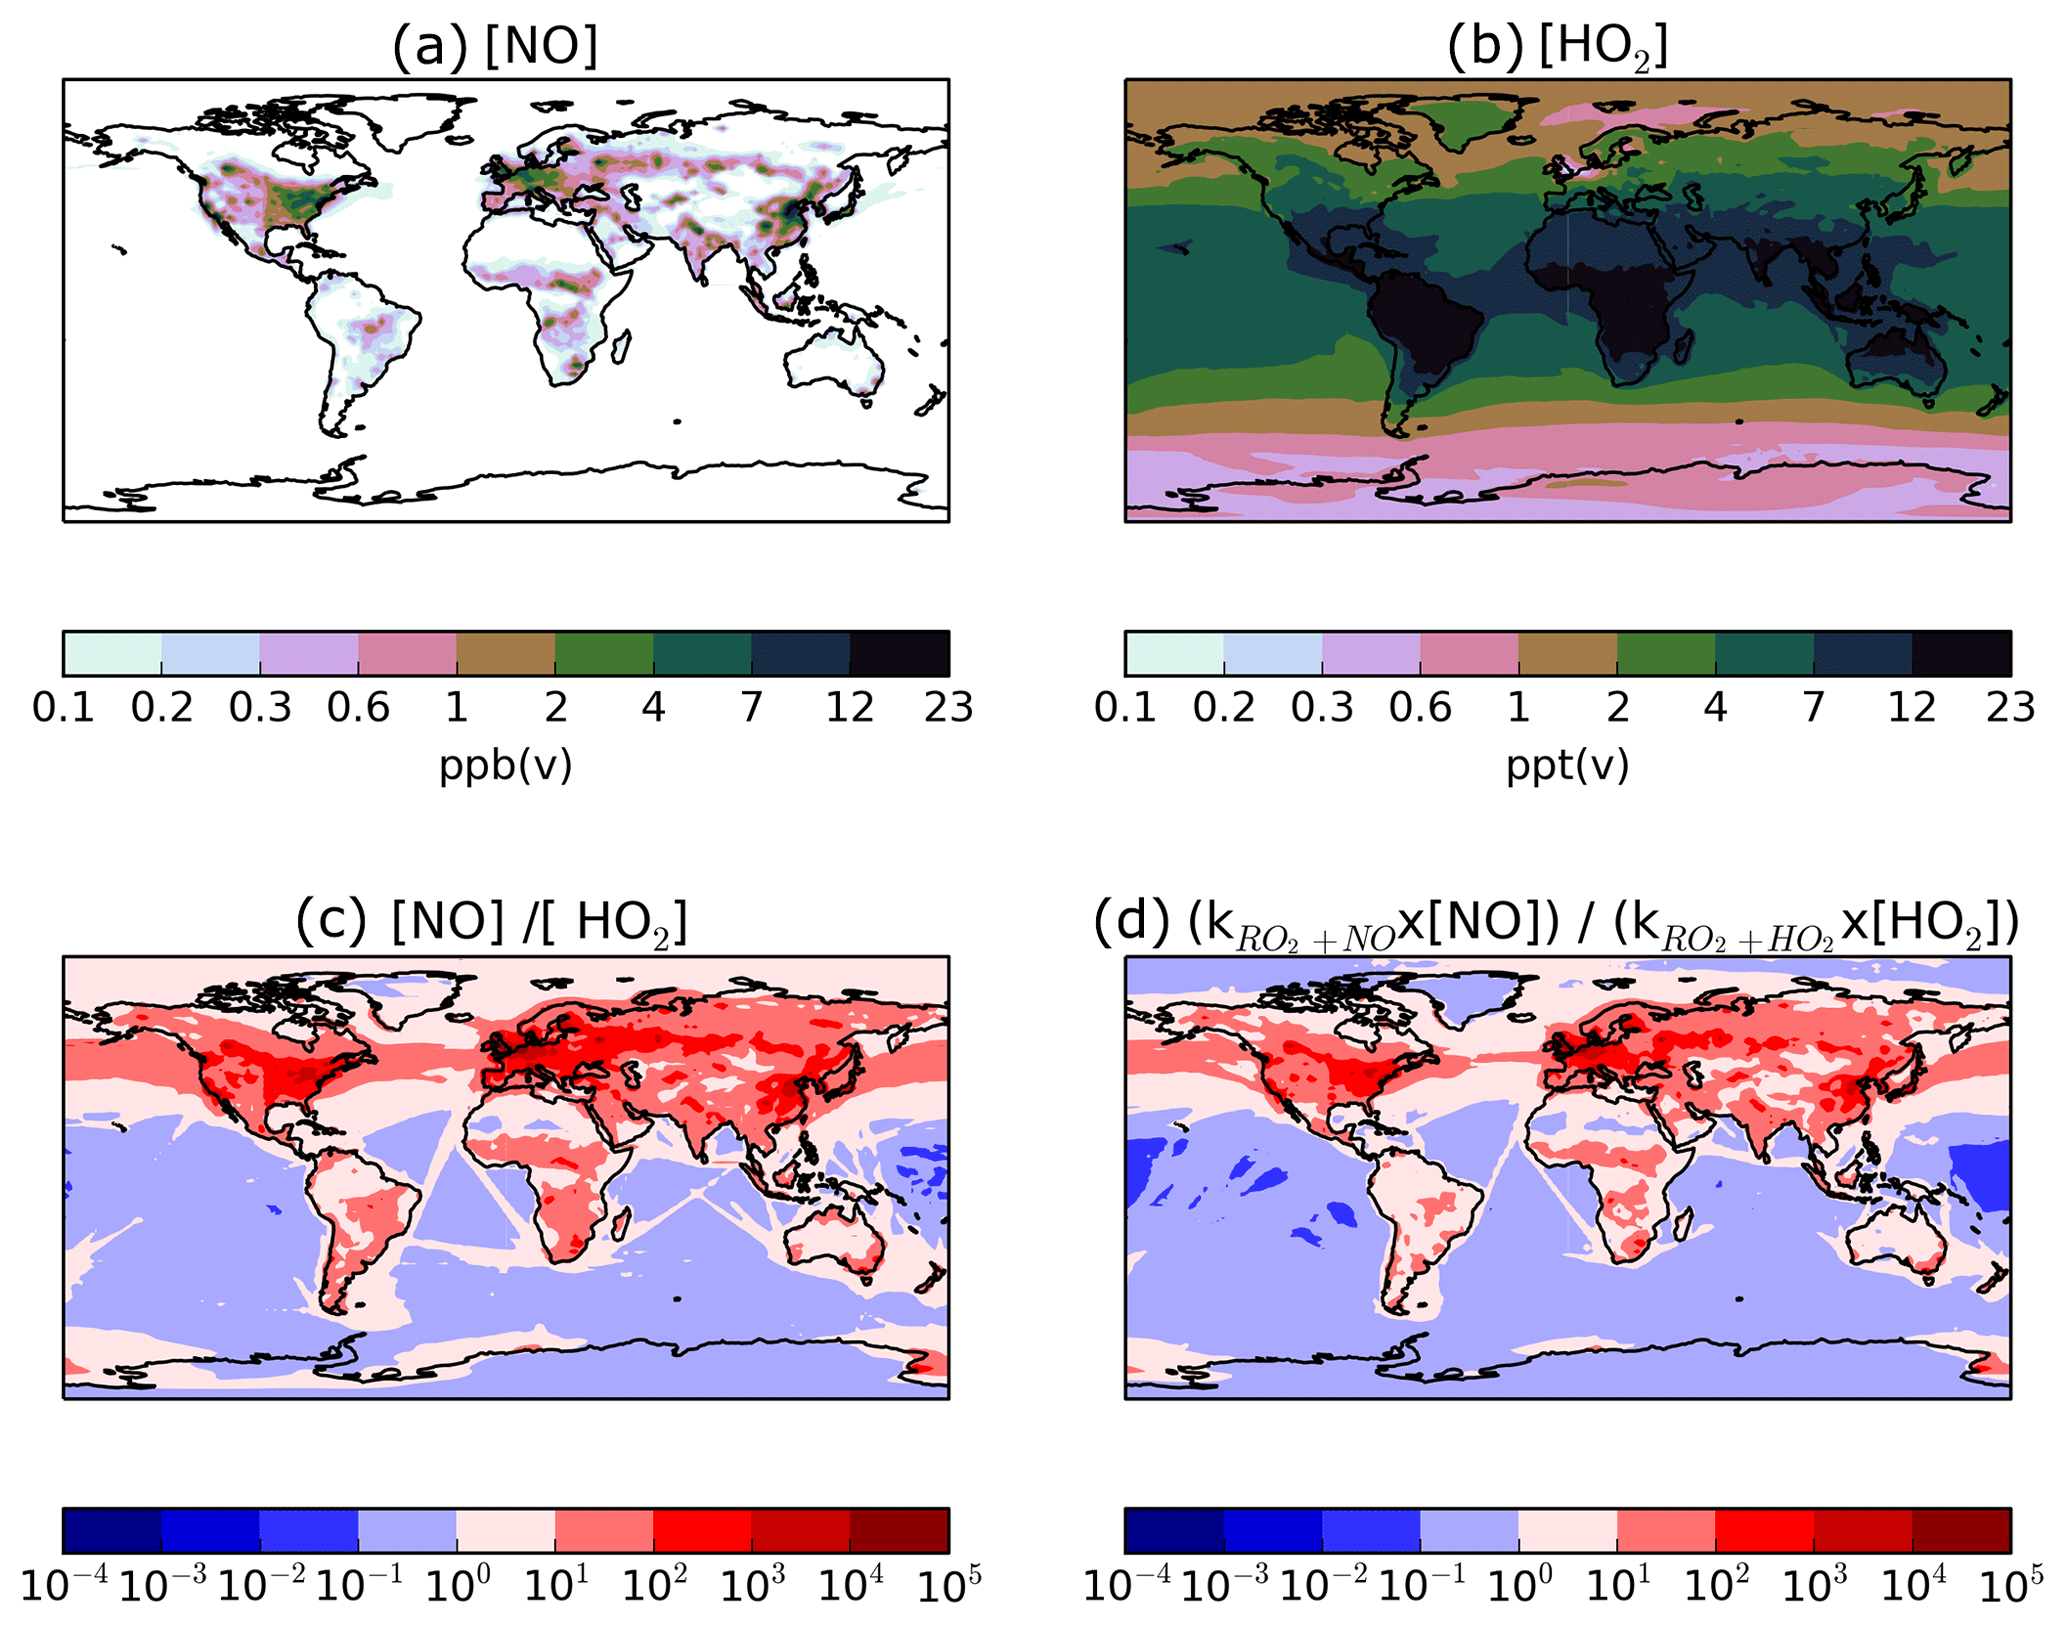
Figure 11Global distributions of annual-average (a) surface NO concentrations (ppb(v)), (b) surface HO2 concentrations (ppt(v)), (c) the ratio of surface NO∕HO2, and (d) the ratio of surface , where k represents the rate coefficient at 298 K. Note that the concentrations of the HO2 radical are in units of parts per trillion by volume, whereas NO is in units of parts per billion by volume.
The substantial preference for RO2 radicals to react via the NO pathway instead of the HO2 pathway can be attributed to differences in oxidant availability (i.e. concentrations) and in reaction rates. Note, in the UKCA model, HO2 is assumed to undergo wet removal. Firstly, consider the difference in oxidant levels. Figure 11 shows the spatial distribution of annual-average surface concentrations of NO and HO2, as well as the ratios NO∕HO2 and . NO is extremely spatially heterogeneous (Fig. 11). Within the model, sources of NOx include the prescribed anthropogenic, biomass burning, and soil emissions, as well as lightning NOx which is calculated interactively. At the surface, the highest annual-average surface NO concentrations (1–23 ppb(v)) are simulated over industrialised and urban regions of North America, China, and Europe (Fig. 11a). Over remote marine environments, away from anthropogenic and biomass burning sources, concentrations of NO are low (Fig. 11a). In contrast, concentrations of HO2 are much lower and more evenly distributed across the surface (Fig. 11). Over the majority of both continental and marine regions, annual-average surface HO2 concentrations range between 2 and 23 ppt(v) (Fig. 11b). Therefore, over most environments, NO concentrations are far greater, with annual-average surface NO concentrations ranging from 10 (NO∕HO2 =101) to 10 000 times more than HO2 (Fig. 11c). Only in the remote marine environments are HO2 levels higher in absolute magnitude compared to NO, with simulated annual-average surface HO2 concentrations reaching 10 times that of NO (NO∕HO2 ; Fig. 11c). At higher levels, NO∕HO2 reduces, suggesting an increasing importance of the HO2 pathway at higher altitudes. However, due to the fast chemical reactivity, the majority of SOA production occurs at the surface. High-altitude emissions of VOCs from biomass burning plumes may be more susceptible to forming RO2 which react with HO2. However, in this study, all VOCANT∕BB are emitted at the surface. For the majority of the atmosphere, the difference in the magnitudes of the oxidant concentrations favours the RO2+NO pathway over the RO2+HO2 pathway.
Differences in reactivity of RO2 with respect to the oxidants also affects the fate of this radical. At 298 K, the rate constant for RO2+NO is cm3 molecule−1 s−1, almost half that of RO2+HO2 cm3 molecule−1 s−1; Table 1). Therefore, the higher rate constant for oxidation by HO2 in comparison to NO favours the RO2+HO2 pathway.
The ratio, , combines the difference in rate constants together with differences in the ratio of oxidant concentrations, and ranges from 100 to 104 over most continental regions, but is as low as 10−2 over remote marine environments, such as the Pacific Ocean and South Atlantic Ocean (Fig. 11d). Hence, the net effect of differences in oxidant concentrations and rate constants is to favour peroxy radical removal via the NO oxidative pathway (Figs. 10a; 11d). This preference for the NO radical pathway is enhanced even further by considering the likelihood of RO2 being co-located with NO. RO2 is a second-generation oxidation product of VOCANT∕BB, which is released by anthropogenic and biomass burning sources. NO emissions are predominantly emitted from anthropogenic and biomass burning sources. Therefore, peroxy radicals are very likely to be formed in NO-rich environments, further favouring the probability of entering the RO2+NO pathway. Furthermore, adoption of naphthalene reactivity for VOCANT∕BB, which is still relatively high, prevents transport away from high-NO regions. Overall, peroxy radicals preferentially react via the NO pathway due to relatively higher NO concentrations than HO2, despite the HO2 pathway having a higher rate constant.
5.1.3 Production of SOA from new reaction intermediate, RO2
For this mechanism with parent VOC reactivity based on naphthalene (Multi_nap), the initial oxidation and subsequent reaction of the intermediate were discussed in Sect. 5.1.1 and 5.1.2, respectively. In this section, the production of SOA from this mechanism is examined. In this oxidation scheme, identical reaction yields of 13 % are applied for both the HO2 and NO pathways. For the RO2+NO reaction, a global annual-total reaction flux of 57 Tg (RO2) a−1 results in an SOA production rate of 11 Tg (SOA) a−1 (Multi_nap; Fig. 7). Similarly, for the RO2+HO2 pathway, a global annual-total reaction flux of 34 Tg (RO2) a−1 results in an SOA production rate of 7 Tg (SOA) a−1 (Fig. 7). Hence, the relative contribution of the RO2 oxidative pathways to SOA production is simply a reflection of the relative contribution of each pathway to RO2 consumption. Therefore, the RO2+NO pathway accounts for 62 % of the global annual-total RO2 oxidation rate (Fig. 10a), and also accounts for 62 % of the annual-total SOA production rate from anthropogenic and biomass burning hydrocarbons (Fig. 10e). The sum of global annual-total SOA production from anthropogenic and biomass burning sources, from both oxidative pathways, is 17.8 Tg (SOA) a−1 (Fig. 7). This is just 0.6 Tg (SOA) a−1 (or 3 %) less than the global annual-total SOA production rate when using a single-step oxidation mechanism with reactivity based on α-pinene (DryH_WetL; Fig. 7). Note, this 0.6 Tg (SOA) a−1 reduction in SOA production is solely due to the 3 % reduction in the VOCANT∕BB oxidation rate (Sect. 5.1.1.). This therefore confirms that, due to the marginal deposition rate of RO2, the introduction of the reaction intermediate has no effect on global SOA production.
The difference in annual-average surface SOA concentrations for the mechanisms with the reaction intermediate relative to the mechanisms without the reaction intermediate with reactivity based on α-pinene are shown in Fig. 12. The effects of a ∼50 % reduction in parent VOC reactivity in combination with the introduction of the reaction intermediate on regional annual-average surface SOA concentrations vary in both magnitude and sign but, generally, are small. These differences in SOA concentrations (Fig. 12a and b) closely resemble differences in parent VOC oxidation rates in response to the change in chemical reactivity (Fig. 9a). Over regions where reduced reactivity has lowered VOCANT∕BB oxidation rates, such as India and industrialised parts of Africa (Fig. 9a), annual-average surface SOA concentrations have reduced by around 0.1 to 0.5 µg (SOA) m−3 (Fig. 12a), corresponding to reductions of 5 %–20 % (Fig. 12b). On the other hand, for some downwind regions such as northern India, southeast China, and southeast USA, annual-average surface SOA concentrations increase by 0.1–4 µg (SOA) m−3 (Fig. 12a), corresponding to increases of 5 %–30 % (Fig. 12b). Overall, annual-average surface SOA concentrations change by less than 3 % (not shown) and the global annual-average SOA burden changes by less than 1 % (not shown). The strong similarity between the difference in SOA concentrations (Fig. 12a) and VOC oxidation rates (Fig. 9a) also confirms how introduction of the reaction intermediate did not affect the geographical distribution of SOA production.
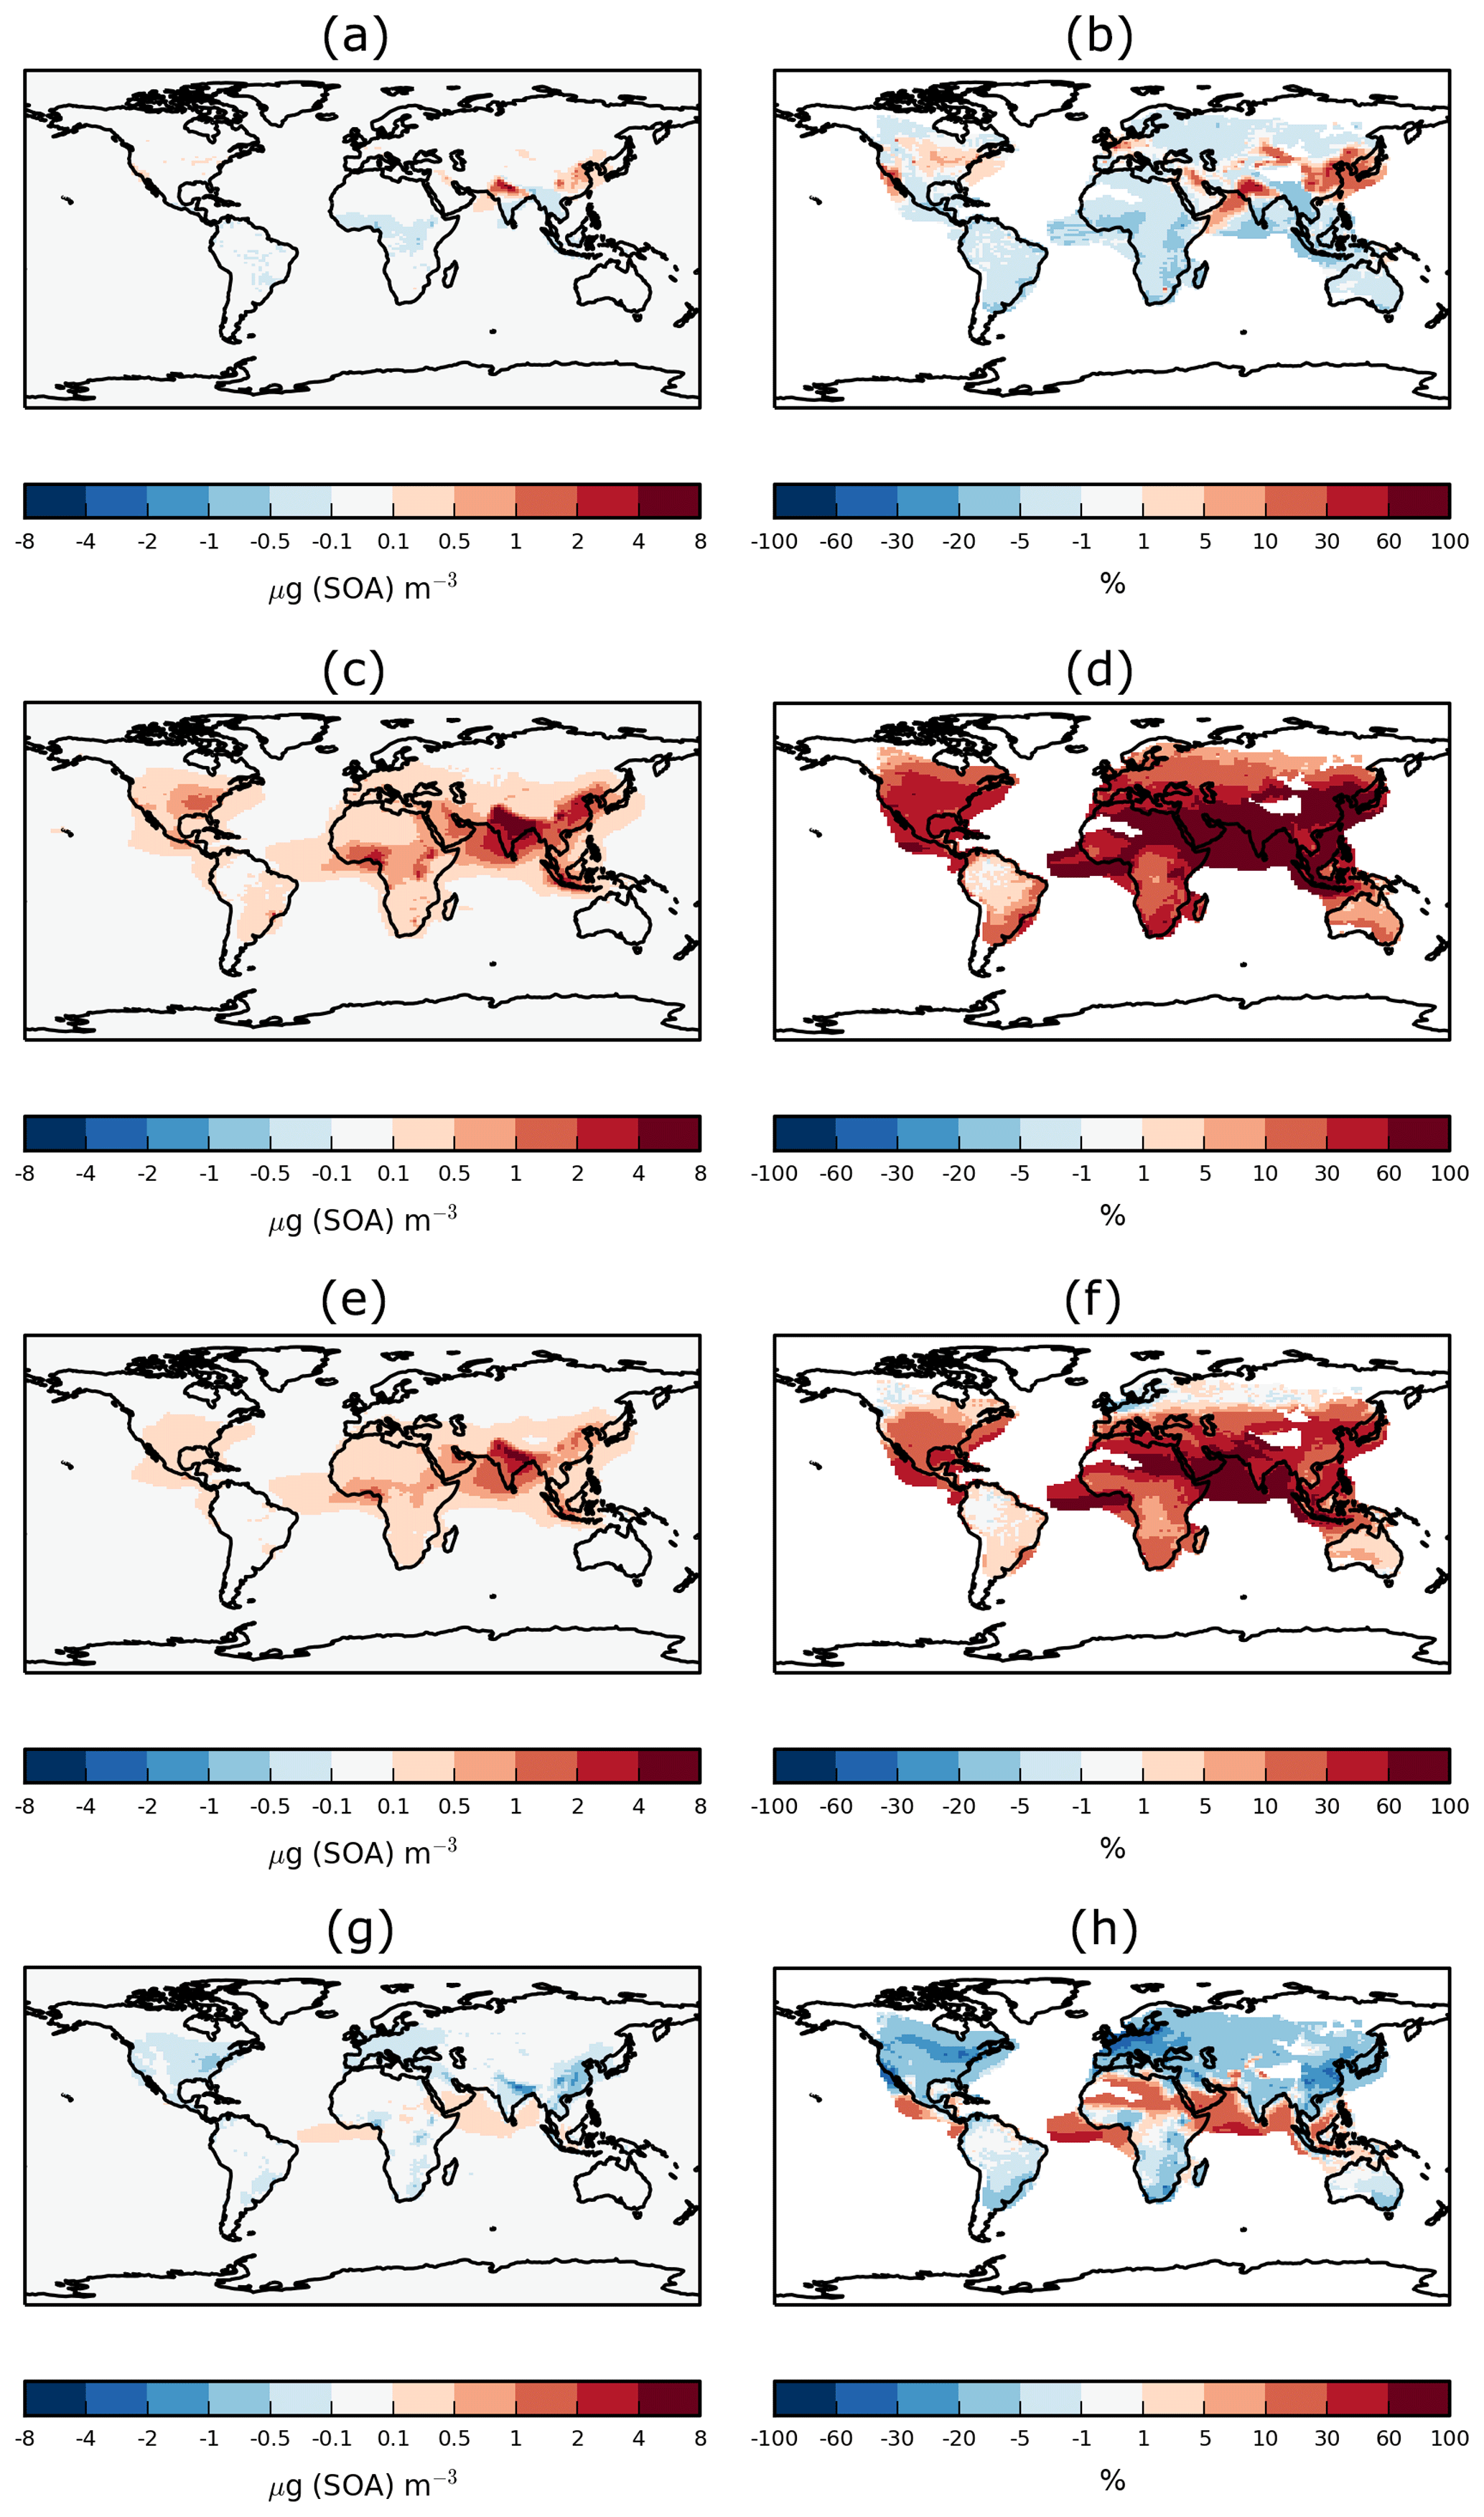
Figure 12Difference in annual-average surface SOA concentrations, expressed as absolute concentrations (µg m−3) (a, c, e, g) and as a percentage (b, d, f, h) between Multi_nap (top row; a, b), Multi_nap_yield (second row; c, d), Multi_tol_yield (third row; e, f), and Multi_benz_yield (fourth row; g, h) and the DryH_WetL simulation, which are all described in Table 3.
To summarise, moving from a mechanism with no reaction intermediate and with the reactivity of α-pinene and with a single SOA yield to a mechanism with a reaction intermediate, based on naphthalene, and a single SOA yield has very little effect on SOA production and surface concentrations. The slower reactivity of naphthalene reduces the global VOCANT∕BB oxidation by 3 %, contributing to a reduction in the global annual-total SOA production rate of 0.6 Tg (SOA) a−1 (3 %). Introduction of the reaction intermediate, but with no change to reaction yields, has no effect on global SOA.
5.1.4 Accounting for the difference in volatility between HO2 and NO oxidation products
In this section, the effects of accounting for the difference in volatility between RO2 oxidation products is examined. This is done by altering the reaction yields for RO2 reactions, whilst maintaining the same chemical mechanism (Eq. 9) and precursor emission rate. As discussed in Sect. 1, for aromatic compounds, the volatility, and therefore the amount of SOA produced, depends on the concentrations of NOx (Hurley et al., 2001; Song et al., 2005; Ng et al., 2007; Chan et al., 2009). One explanation for this relationship is that the HO2 pathway forms functionalised products, whereas the NO pathway forms fragmented products. Functionalisation leads to reductions in volatility, whereas fragmentation leads to increases in volatility. Hence, the SOA yield under low-NOx conditions is higher than under high-NOx conditions. Hence in a further simulation, the difference in fragmentation/functionalization between products of different peroxy radical oxidation pathways are accounted for, whereby the yield for the RO2+HO2 reaction is increased from 13 % to 66 %, whilst the yield for the RO2+NO reaction is left at 13 % (Multi_nap_yield; Table 3). As discussed in Sect. 2.5, the assumption of a 66 % stoichiometric reaction yield was selected as it corresponds to a 100 % mass yield and therefore allowing the theoretical upper limit of SOA production via the HO2 pathway to be quantified whilst conserving mass. With a higher molar yield of 66 %, global SOA production from the RO2+HO2 reaction increases to 34 Tg (SOA) a−1 as compared to 7 Tg (SOA) a−1 using a 13 % yield for this reaction (Fig. 7). As a consequence of this increase to the hydroperoxyl reaction yield, the HO2 pathway now accounts for 75 % of SOA production from anthropogenic and biomass burning sources (Fig. 10f), despite only 38 % of the RO2 radicals reacting via this pathway (Fig. 10b). This is in remarkably good agreement with previous studies. Pye and Seinfeld (2010) also estimate that the HO2 pathway accounts for 75 % of SOA production from IVOCs. In addition, Henze et al. (2008) estimates that for SOA production from benzene, toluene, and xylene, 72 % is produced via the HO2 pathway.
Accounting for differences in volatility between RO2 oxidation products increases the global SOA production rate by 27.3 Tg (SOA) a−1 (or 153 %), from 17.8 Tg (SOA) a−1 when a molar yield of 13 % is applied to both pathways (Multi_nap) to 45.1 Tg (SOA) a−1 when a molar yield of 66 % is applied (Multi_nap_yield). Under these conditions, the overall aerosol yield from anthropogenic and biomass burning VOC emissions is 25 %, which lies within the range from other modelling studies, either based on explicit aromatic compounds or IVOCs, which range from 22 % to 30 % (Henze et al., 2008; Pye and Seinfeld, 2010).
The relative spatial homogeneity of HO2 radicals over land and ocean, as shown in Fig. 11b, suggests that increasing the yield for this pathway could lead to enhanced SOA production globally. However, as discussed in Sect. 5.1.1, the naphthalene + OH rate constant results in relatively fast oxidation rates. Therefore, RO2 radicals are still being generated close to the emissions source. For these reasons, increasing the reaction yield for the HO2 reaction pathway increases SOA concentrations mainly over major anthropogenic emission source regions (Fig. 12c, d). In response to this increased yield, over India, China, Africa, and Europe, annual-average surface SOA concentrations have increased by 0.5–8 µg (SOA) m−3 (Fig. 12c), corresponding to increases of 10 %–100 % (Fig. 12d). Note, differences in SOA concentrations are positive everywhere, whereas both positive and negative changes were found when comparing differences in SOA concentrations between. In summary, both globally (Fig. 7) and regionally (Fig. 12d), when accounting for the different SOA yields for the RO2 oxidative pathways, despite a reduction in VOCANT∕BB global SOA production rates, surface SOA concentrations increase everywhere. Therefore, the lower reactivity in VOCANT∕BB is compensated for by lower volatility products from the HO2 oxidation pathway leading to net increases in modelled SOA.
5.1.5 Production of SOA from less reactive hydrocarbons
As discussed in Sect. 2.4, VOCANT∕BB is a lumped species, and hence represents a mixture of species with a range of physicochemical properties. In this section, the uncertainty related to its chemical reactivity and the effects on SOA production are explored. At 298 K, the rate constant for aromatic compounds with respect to OH oxidation ranges from 1.22 to cm3 molecule−1 s−1, respectively (Tables 1 and 3). Therefore, adoption of the naphthalene reactivity represents an upper limit for the VOCANT∕BB oxidation rate when considering SOA-relevant aromatic compounds. In this section, the VOC reactivity is varied across a series of different aromatic compounds: naphthalene, toluene, and benzene (Multi_nap_yield, Multi_tol_yield, and Multi_benz_yield; Table 3). However, the mechanistic description and stoichiometric yields describing SOA formation from VOCANT∕BB are identical and follow Eq. (9).
Firstly, consider how reactivity affects SOA production among the oxidation mechanisms which include the reaction intermediate (Multi_nap_yield, Multi_tol_yield, and Multi_benz_yield). Reducing the chemical reactivity of VOCANT∕BB reduces the global oxidation rate, whilst at the same time, favours the likelihood of RO2 radicals entering the HO2 pathway (which has a higher SOA yield than the NO pathway). The global annual-total VOCANT∕BB oxidation rates are 91, 65, and 32 Tg (VOCANT∕BB) a−1 using the reactivity of naphthalene, toluene, and benzene, respectively (Fig. 7). Hence, as reactivity is reduced, oxidation is lowered at the expense of deposition. In response to this reduced oxidation rate, fewer RO2 radicals are being generated, which therefore drives reductions in SOA production. The global annual-total SOA production rates are 45.1, 34.0, and 17.9 Tg (SOA) a−1 using the reactivity of naphthalene, toluene, and benzene, respectively (Fig. 7). However, as the reactivity is reduced, the chances of RO2 radicals entering the high-yield HO2 pathway is increased, therefore slightly offsetting the effects of the reduced RO2 production rate. The fraction of peroxy radicals entering the HO2 pathway is 38 %, 41 %, and 46 % using the reactivity of naphthalene, toluene, and benzene, respectively (Fig. 10d, e, and h, respectively). As shown in Fig. 11d, the HO2 pathway dominates only in remote marine environments. Hence, as the reactivity of the parent hydrocarbon is reduced, VOCANT∕BB oxidation rates close to emissions sources reduce, but increase further downwind (Fig. 9c and d). Therefore, lower reactivity enhances the likelihood of peroxy radicals being generated downwind of emissions sources, where the HO2 pathway is favoured. These findings are consistent with Henze et al. (2008), who predicted increased fluxes through the HO2 pathway for peroxy radicals derived from less reactive parent aromatic hydrocarbons. Overall, reduced parent hydrocarbon reactivity reduces the sources of peroxy radicals but favours lower volatility RO2+HO2 oxidation products.
Secondly, consider the net effects of using aromatic oxidation to describe SOA production from VOCANT∕BB (Multi_nap_yield, Multi_tol_yield, and Multi_benz_yield), versus using the single-step mechanism with reactivity based on α-pinene (DryH_WetL). Compared to α-pinene, the aromatic compounds, naphthalene, toluene, and benzene are 50 %, 75 %, and 95 % less reactive, respectively (Table 2). As discussed in Sect. 5.1.3, using the chemical reactivity of naphthalene compared to monoterpene leads to a 3 % reduction in VOCANT∕BB oxidation, which drives a 0.6 Tg (SOA) a−1 (1 %) reduction in global annual-total SOA production (cf. DryH_WetL and Multi_nap; Fig. 7). However, as shown in Sect. 5.1.4, this reduction in VOC oxidation is entirely offset by accounting for the high-yield pathway of the RO2+HO2 reaction, leading to a 27.3 Tg (SOA) a−1 (153 %) increase in global annual-total SOA production (cf. DryH_WetL and Multi_nap_yield; Fig. 7). Using the chemical reactivity of toluene compared to α-pinene also reduces the VOCANT∕BB oxidation, but this time by 31 % (cf. DryH_WetL and Multi_tol_yield; Fig. 7). However, similar to the case of naphthalene, this reduction in VOCANT∕BB oxidation is still outweighed by accounting for the high-yield HO2 pathway, such that global annual-total SOA production increases by 15.6 Tg (SOA) a−1 (or 85 %) from 18.4 Tg (SOA) a−1 in the single-step oxidation mechanism based on α-pinene to 34.0 Tg (SOA) a−1 in the multi-step oxidation mechanisms based on toluene (cf. DryH_WetL and Multi_tol_yield; Fig. 7). On the other hand, benzene is considerably less reactive than α-pinene, leading to 66 % reduction in the global annual-total VOCANT∕BB oxidation rate (cf. DryH_WetL and Multi_benz_yield; Fig. 7). In this case, the reduction in VOCANT∕BB oxidation is so large that it is not compensated for by accounting for the difference in volatility between RO2 oxidation products. Hence, using the reactivity of benzene, the global annual-total SOA production rate reduces by 0.5 Tg (SOA) a−1 (or 3 %) from 18.4 Tg (SOA) a−1 in the single-step oxidation mechanism based on α-pinene to 17.9 Tg (SOA) a−1 in the multi-step oxidation mechanisms based on benzene (cf. DryH_WetL and Multi_benz_yield; Fig. 7). These results demonstrate how, from a global perspective, the combined effects of introduction of the peroxy radical intermediate which also accounts for the difference in SOA yields between HO2 and NO pathways can either lead to an increase (Multi_nap_yield and Multi_tol_yield) or reduction (Multi_benz_yield) in SOA production that, critically, depends on the assumed chemical reactivity of the parent VOC.
The spatial distribution of SOA is also influenced by these changes in VOCANT∕BB oxidation mechanisms. For cases where reactivity is based on either naphthalene (Fig. 12c and d) or toluene (Fig. 12e and f), accounting for the high yield HO2 pathway compensates for reduced reactivity, such that annual-average surface SOA concentrations increase globally in comparison to the single-step oxidation mechanism with reactivity based on α-pinene (DryH_WetL). The spatial pattern for the oxidation mechanism based on benzene (Multi_benz_yield) and the oxidation mechanism based on α-pinene (DryH_WetL) are also very different (Fig. 12g and h), despite only a small difference in the global annual-total SOA production rate (Fig. 7); under the reactivity of benzene, VOCANT∕BB is slowed, and newly introduced RO2 radicals are being formed in downwind environments, leading to reduced SOA concentrations in emissions sources regions, but increased SOA concentrations downwind. Over emissions source regions, such as China, India, and North America, annual-average surface SOA concentrations are lower by up to 4 µg (SOA) m−3 (Fig. 12g). Over continental outflow regions, such as the Arabian Sea and the Bay of Bengal, annual-average surface SOA concentrations have increased by 0.1–0.5 µg (SOA) m−3 (Fig. 12h). Although the global annual-total SOA production rates are identical, the global annual-average SOA burden is 10 % greater when using benzene as the parent VOC, highlighting the strong spatial gradients in SOA lifetime. Across these simulations where the VOCANT∕BB oxidation scheme is varied, the global-average annual-average SOA lifetime varies from 4.4 to 5.0 d (not shown).
The spatial pattern simulated in the oxidation mechanism with the reaction intermediate and with reactivity based on benzene is in greater agreement with the more regionally distributed SOA concentrations simulated in models based on S/IVOC sources (Pye and Seinfeld, 2010; Tsimpidi et al., 2016).
5.2 Comparison of simulated and observed OA concentrations
In this section, the influence of anthropogenic and biomass burning hydrocarbon oxidation mechanisms on model agreement with observations is quantified. Reduced parent hydrocarbon reactivity combined with accounting for the different SOA yield pathways of the peroxy radical affects model agreement with observations. Figure 13 shows simulated versus observed surface SOA concentrations for the NH from the simulations described in Table 3. In the oxidation mechanisms which include the reaction intermediate, using naphthalene and toluene, the annual-total SOA production rate increased relative to the single-step fast oxidation pathway. This increase was due to the difference in volatility between products of the peroxy radical oxidation pathways, despite the reduction in parent hydrocarbon reactivity. Therefore, simulated SOA concentrations are in closer agreement to observations (Multi_nap_yield; NMB %; Fig. 13b and Multi_tol_yield; NMB %; Fig. 13c) compared to the values using the oxidation mechanisms with no reaction intermediate (NMB %; Fig. 4d). However, simulated SOA concentrations have the largest negative bias for the oxidation mechanism which includes the reaction intermediate and reactivity based on benzene (NMB %; Fig. 13d). Global annual-total emissions of benzene and toluene are 5.6 and 6.9 Tg (C) a−1, respectively (Henze et al., 2008), whereas emissions of naphthalene are 0.22 Tg (C) a−1 (Pye and Seinfeld, 2010). This suggests benzene and toluene could be more realistic surrogate compounds to represent VOCANT∕BB chemistry, as opposed to naphthalene. This is due to the slow reactivity of benzene resulting in a small VOCANT∕BB oxidation rate, which is higher downwind of emissions compared to the point of emissions (Fig. 12h). Figure 13 demonstrates that mechanisms of oxidation have a strong influence on model agreement with observations. However, the model negative bias is persistent in all simulations, despite the oxidation pathways spanning a wide range of both chemical reactivity and reaction yields.
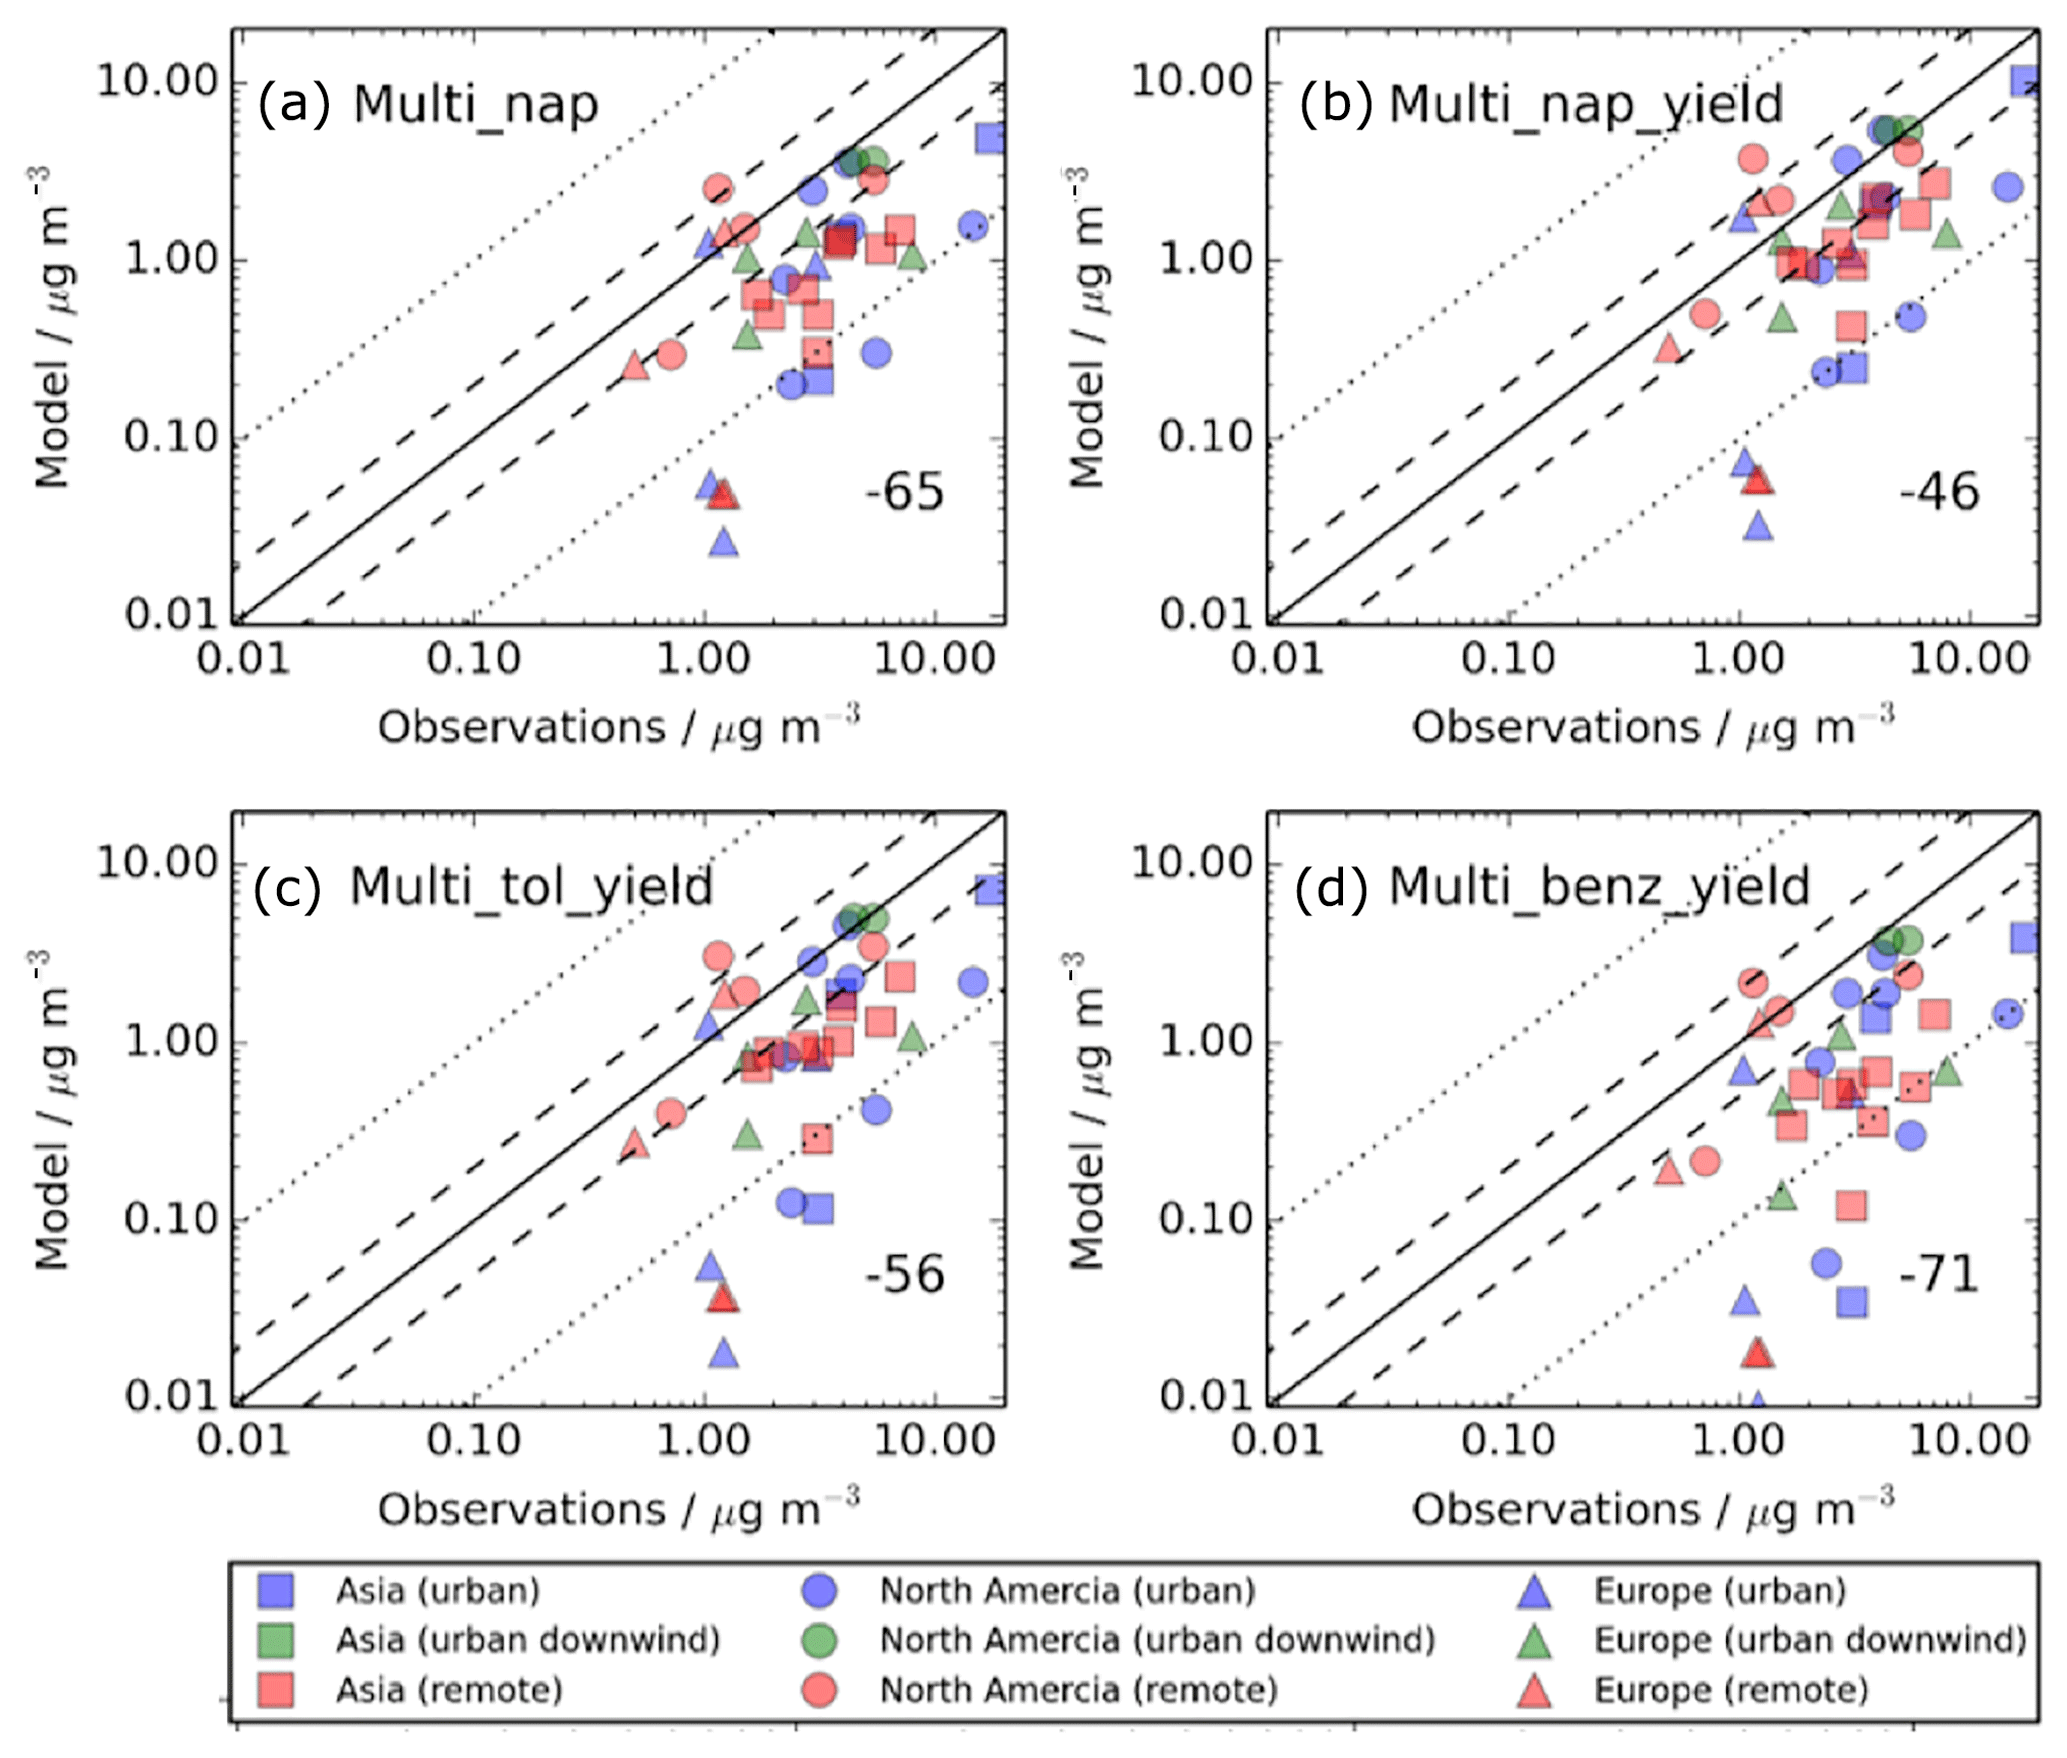
Figure 13Simulated versus observed SOA concentrations (µg m−3) for (a) Multi_nap, (b) Multi_nap_yield, (c) Multi_tol_yield, and (d) Multi_benz_yield simulations, described in Table 3. Observations for the time period 2000–2010 are classified by site type – urban (blue), urban downwind (green), or remote (red) – and continent – Asia (squares), North America (circles) and Europe (triangles). Observed oxygenated OA is assumed to be comparable to simulated SOA. The 1 : 1 (solid), 1 : 2 and 2 : 1 (dashed), and 1 : 10 and 10 : 1 (dotted) lines are indicated. Numerical values in the bottom right of each panel indicate the normalised mean bias (%).
For the aircraft campaigns, mechanisms of anthropogenic and biomass burning oxidation have a limited influence on model agreement with observations. For the campaigns in remote regions, VOCALS (Fig. 6a), TROMPEX (Fig. 6b), and OP3 (Fig. 6c), and over western Africa (AMMA; Fig. 6k), introduction of the reaction intermediate combined with a reduction in reactivity (cf. DryH_WetL and Multi_nap) has no effect on the NMB. However, when accounting for the high-yield RO2+HO2 pathway, with reactivity based on naphthalene or toluene, the NMB reduces (Multi_nap_yield and Multi_tol_yield), but with reactivity based on benzene, the NMB increases (Multi_benz_yield). Contrastingly, model performance in Europe and North America (Fig. 6h–j) remains similar as VOCANT∕BB oxidation is modified. This warrants further discussion. As explained in previous sections, the global SOA production rate is extremely sensitive to the mechanisms of VOCANT∕BB oxidation. However, model performance over the pollution and biomass-burning-influenced regions is relatively insensitive to VOC oxidation mechanisms. This is likely to be a reflection of the location of aircraft campaigns and how they are categorised. For example, the aircraft campaigns categorised as influenced by biomass burning are in North America but peak biomass burning emissions are located over tropical forest regions of South America and Africa. Furthermore, the aircraft campaigns categorised as influenced by pollution are all in Europe. Again, this does not correspond to the location of peak anthropogenic emissions over Asia. Therefore, mechanisms of anthropogenic and biomass burning oxidation have substantial impacts on simulated SOA production rates, but almost no effect on model agreement with aircraft observations in “pollution and biomass-burning-influenced” regions, due to a lack of aircraft coverage.
In this study, the description of both deposition and oxidation for SOA precursors was developed in a global chemistry–climate model. Several model integrations were conducted and the treatments of deposition and oxidation mechanisms of SOA precursors were varied. Subsequent effects on the global SOA budget were quantified and simulated OA was evaluated against a suite of surface and aircraft campaigns spanning both the Southern Hemisphere and Northern Hemisphere.
Within UKCA, SOA formation is considered from VOCs – monoterpene, isoprene, a lumped anthropogenic VOC (VOCANT), and a lumped biomass burning VOC (VOCBB). Under the assumption that no precursors undergo deposition, the global annual-total SOA production rate is 75 Tg (SOA) a−1 and simulated OA concentrations are generally lower than observed (NMB %). Extending deposition to include SOA precursors has substantial impacts on both the global SOA budget and model agreement with observations. Including SOA precursor dry deposition reduces the global annual-total SOA production rate by 2–24 Tg (SOA) a−1 (2 %–32 %), with the range reflecting uncertainties in surface resistances. Including SOA precursor wet deposition reduces the global annual-total SOA production rate by 12 Tg (SOA) a−1 (15 %) and is relatively insensitive to changes in effective Henry's law coefficient. The effects of dry and wet deposition on the global SOA budget are not additive; the inclusion of both these processes reduces the global annual-total SOA production rate by 28 Tg (SOA) a−1 (37 %). Inclusion of VOC deposition generally increases model negative biases with respect to observations. For SOA, across Northern Hemisphere mid-latitude sites, inclusion of both dry and wet deposition of VOCs increases the NMB from −50 % to −66 %. However, for OA, over Manaus (Brazil) when precursor deposition is neglected from the model, simulated OA concentrations exceed observed OA concentrations.
Production of SOA from aromatic compounds, which are typically emitted from anthropogenic and biomass burning activities, has been partially elucidated by environmental chamber studies. Briefly, parent aromatic hydrocarbons are oxidised by the hydroxyl radical (OH) to form a reaction intermediate, the peroxy radical (RO2). RO2 undergoes competitive reactions; with HO2 the products are non-volatile, whereas with NO the products are semi-volatile. Hence, higher HO2 concentrations favour higher yields of SOA.
The influence of VOC oxidation mechanisms on the global SOA budget was also examined. For the anthropogenic and biomass burning sources of SOA (VOCANT∕BB), a series of simulations were performed by (a) varying parent hydrocarbon reactivity, (b) varying the number of reaction intermediates, and (c) accounting for differences in volatility between oxidation products from various pathways. The global annual-total SOA production rate from anthropogenic and biomass burning sources is 18.4 Tg (SOA) a−1 when the parent hydrocarbon, VOCANT∕BB, undergoes a single-step oxidation, with a fixed reaction yield of 13 % and a reactivity based on α-pinene. Using the reactivity of naphthalene, toluene, or benzene, the global annual-total VOCANT∕BB oxidation rate changes by −3 %, −31 %, or −66 %, respectively, when compared to using the reactivity of α-pinene. Increasing the number of reaction intermediates, by including RO2 as a product of VOCANT∕BB oxidation, slightly delays SOA production but has no effect on the global SOA production rate. Hence, when the reactivity of VOCANT∕BB is reduced from α-pinene to naphthalene, in combination with the introduction of the reaction intermediate, the global annual-total SOA production rates changes by just −0.6 Tg (SOA) a−1 (or −3 %), from 18.4 to 17.8 Tg (SOA) a−1. However, the subsequent competitive chemical reactions of RO2 control the volatility distribution of products. To account for this, the reaction yield for the RO2+HO2 pathway was increased from 13 % to 66 %. The reaction yield for the RO2+NO pathway was left unchanged at 13 %. Accounting for the difference in volatility between RO2 products increases the global annual-total SOA production rate from anthropogenic and biomass burning by 153 %, from 17.8 Tg (SOA) a−1 in the simulation with yields of 13 % for both RO2 reactions to 45.1 Tg (SOA) a−1 when the yield for the RO2+HO2 is increased 66 %.
Overall, the effects of using aromatic oxidation to describe SOA formation from anthropogenic and biomass burning compounds versus using a single-step mechanism with reactivity based on α-pinene can be explained in terms of reductions in parent VOC reactivity and accounting for the high-yield HO2 pathway, as opposed to the introduction of the reaction intermediate. For both naphthalene and toluene, reduced reactivity in comparison to α-pinene is small and is entirely offset by accounting for the difference in volatility between RO2 oxidation products. By contrast, benzene is significantly less reactive than α-pinene; and accounting for the difference in volatility between RO2 oxidation products cannot outweigh this. For example, for naphthalene, changes in oxidation rate (−3 %) are outweighed by accounting for the difference in volatility between RO2 reactions, such that the global annual-total SOA production rate changes by 27.3 Tg (SOA) a−1 (or 145 %), from 18.4 Tg (SOA) a−1 in the oxidation mechanism with no reaction intermediate and reactivity based on α-pinene to 45.1 Tg (SOA) a−1 in the oxidation mechanisms including the reaction intermediate and with reactivity based on naphthalene. Similarly, for toluene, changes in the oxidation rate (-33 %) are still outweighed by accounting for the high-yield HO2 pathway, such that the global annual-total SOA production rate changes by 15.5 Tg (SOA) a−1 (or 85 %), from 18.4 Tg (SOA) a−1 in the oxidation mechanism with no reaction intermediate and reactivity based on α-pinene to 34.0 Tg (SOA) a−1 in the oxidation mechanisms including the reaction intermediate and with reactivity based on toluene. However, for the case of benzene, the substantial change in oxidation rate (−66 %) is not outweighed by accounting for the difference in volatility between RO2 reactions, such that the global annual-total SOA production rate changes by −0.5 Tg (SOA) a−1 (or −3 %), from 18.4 Tg (SOA) a−1 in the oxidation mechanism with no reaction intermediate and reactivity on α-pinene to 17.9 Tg (SOA) a−1 in the oxidation mechanisms including the reaction intermediate and with reactivity of benzene. Therefore, from a global perspective, the net effects of increased reaction steps and accounting for the influence of NOx on reaction yields can either increase (85 %–150 %) or reduce (−3 %) SOA production depending on the assumed chemical reactivity of the parent VOC.
These variations in oxidation mechanisms can either improve or worsen model agreement with observations, depending on the chemical reactivity of the parent VOC. In the absence of the reaction intermediate, and with reactivity based on α-pinene, the model underestimates SOA across Northern Hemisphere mid-latitudes with an NMB of −66 %. However, the inclusion of the peroxy radical, combined with accounting for the difference in SOA yields for the peroxy radical reaction pathways and reactivity based on either naphthalene, toluene, or benzene, the NMB across Northern Hemisphere mid-latitudes is either −46 %, −56 %, or −71 %, respectively. These results highlight how increases to reaction intermediates and accounting for the influence of NOx has the ability to both improve and worsen model agreement with observations which, crucially, depends on the assumed chemical reactivity of the parent VOC. Global annual-total emissions of benzene and toluene are 5.6 and 6.9 Tg (C) a−1, respectively (Henze et al., 2008), whereas emissions of naphthalene are 0.22 Tg (C) a−1 (Pye and Seinfeld, 2010). This suggests benzene and toluene could be more realistic surrogate compounds to represent VOCANT∕BB chemistry, as opposed to naphthalene. Note, however, that aromatic compound emissions represent only a minor fraction of the global annual-total VOCANT∕BB emission rate, which is 176 Tg (VOCANT∕BB) a−1.
In this study, observed OA∕SOA concentrations generally exceed simulated OA∕SOA concentrations. This is true at the surface and throughout the boundary layer. This model negative bias is very likely due to missing SOA: (a) S/IVOC emissions and (b) aqueous-phase SOA production. As a result of these missing SOA sources, care should be taken when drawing conclusions on how variations in VOC deposition and oxidation mechanisms impact model agreement with observations. For instance, this study begins with a model negative bias, whereby inclusion of SOA precursor deposition worsens the model negative bias. However, if this study were to include S/IVOC emissions and aqueous-phase SOA production, it would be possible to begin these series with a positive model bias. If this was the case, the inclusion of SOA precursor deposition would reduce the model positive bias. This study conclusively demonstrates that variations in VOC deposition and oxidation mechanisms do indeed alter the agreement between model and observed OA∕SOA concentrations. However, as the sign of the model bias (i.e. positive or negative) could be sensitive to which SOA sources are included, this study does not conclusively demonstrate if these model updates lead to an improvement or worsening of model agreement with observations.
These results highlight that the global SOA budget is highly sensitive to hydrocarbon physicochemical processes. For example, the global annual-total SOA production rate has varied from 47 to 75 Tg (SOA) a−1 due to variations in VOC deposition. The global annual-total SOA production rate from anthropogenic and biomass burning emissions has varied from 17.9 to 45.1 Tg (SOA) a−1 due to variations in VOC oxidation mechanisms. Additional simulations could reach even wider bounds on the global SOA budget. For instance, neglecting SOA precursor deposition combined with VOCANT∕BB undergoing oxidation with NO∕HO2-dependent yields would results in even higher global SOA production rates. These results suggest that both oxidation and deposition remain significant contributors to uncertainty in the global SOA budget.
Despite the limitations of this study, such as the lack of chemical complexity and geographical coverage of observations, it is apparent that SOA precursor deposition and oxidation contribute considerably towards uncertainties in both the global SOA budget and model agreement with observations. These results highlight the need for greater insight into the physicochemical processes of gas-phase hydrocarbons related to SOA production together with a greater density of observations.
The model used in this study is the Global Atmosphere 4.0 (GA4.0) configuration of the HadGEM3 climate model with interactive chemistry and aerosols from UKCA, both of which are based on the UK Met Office's Unified Model (UM). Due to intellectual property right restrictions, we cannot provide either the source code or documentation papers for the UM. The Met Office Unified Model is available for use under licence. A number of research organisations and national meteorological services use the UM in collaboration with the Met Office to undertake basic atmospheric process research, produce forecasts, develop the UM code, and build and evaluate Earth system models. For further information on how to apply for a licence, see http://www.metoffice.gov.uk/research/modelling-systems/unified-model (last access: 3 June 2019). Observations from the AMS dataset can be assessed from https://sites.google.com/site/amsglobaldatabase/home (last access: 24 May 2018).
JMK developed, ran, and analysed the model simulations in this study, all under the supervision of RMD and FMO'C. JMK, RMD, and FMO'C wrote the paper. GWM provided guidance on model development. HC and DL provided observational data from an aircraft campaign.
The authors declare that they have no conflict of interest.
This work is supported by Natural Environment Research Council (NERC; NE/L008947/1) and the Met Office through a CASE award. The development of UKCA and Fiona M. O'Connor are supported by the Joint UK BEIS/Defra Met Office Hadley Centre Climate Programme (GA01101). Fiona M. O'Connor also acknowledges additional funding received from the Horizon 2020 European Union's Framework Programme for Research and Innovation “Coordinated Research in Earth Systems and Climate: Experiments, Knowledge, Dissemination and Outreach (CRESCENDO)” project under grant agreement no. 641816. Computer resources provided by the Met Office, the MONSooN supercomputer facility, were used for the UKCA simulations reported here. The MONSooN system is a collaborative facility supplied under the Joint Weather and Climate Research Programme (JWCRP), which is a strategic partnership between the Met Office and NERC. ERA-Interim data used in this study were provided by the European Centre for Medium Range Weather Forecasts (ECMWF).
This paper was edited by Jason Williams and reviewed by three anonymous referees.
Al-Naiema, I. M. and Stone, E. A.: Evaluation of anthropogenic secondary organic aerosol tracers from aromatic hydrocarbons, Atmos. Chem. Phys., 17, 2053–2065, https://doi.org/10.5194/acp-17-2053-2017, 2017.
Atkinson, R. and Arey, J.: Atmospheric degradation of volatile organic compounds, Chem. Rev., 103, 4605–4638, https://doi.org/10.1021/cr0206420, 2003.
Bahreini, R., Ervens, B., Middlebrook, A. M., Warneke, C., de Gouw, J. A., DeCarlo, P. F., Jimenez, J. L., Brock, C. A., Neuman, J. A., Ryerson, T. B., Stark, H., Atlas, E., Brioude, J., Fried, A., Holloway, J. S., Peischl, J., Richter, D., Walega, J., Weibring, P., Wollny, A. G., and Fehsenfeld, F. C.: Organic aerosol formation in urban and industrial plumes near Houston and Dallas, Texas, J. Geophys. Res., 114, D00F16, https://doi.org/10.1029/2008jd011493, 2009.
Bessagnet, B., Seigneur, C., and Menut, L.: Impact of dry deposition of semi-volatile organic compounds on secondary organic aerosols, Atmos. Environ., 44, 1781–1787, https://doi.org/10.1016/j.atmosenv.2010.01.027, 2010.
Birdsall, A. W., Andreoni, J. F., and Elrod, M. J.: Investigation of the Role of Bicyclic Peroxy Radicals in the Oxidation Mechanism of Toluene, J. Phys. Chem. A., 114, 10655–10663, https://doi.org/10.1021/jp105467e, 2010.
Boreddy, S. K. R., Kawamura, K., and Haque, M. M.: Long-term (2001–2012) observation of the modeled hygroscopic growth factor of remote marine TSP aerosols over the western North Pacific: impact of long-range transport of pollutants and their mixing states, Phys. Chem. Chem. Phys., 17, 29344–29353, https://doi.org/10.1039/c5cp05315c, 2015.
Boreddy, S. K. R., Kawamura, K., Bikkina, S., and Sarin, M. M.: Hygroscopic growth of particles nebulized from water-soluble extracts of PM2.5 aerosols over the Bay of Bengal: Influence of heterogeneity in air masses and formation pathways, Sci. Total Environ., 544, 661–669, https://doi.org/10.1016/j.scitotenv.2015.11.164, 2016.
Bruns, E. A., El Haddad, I., Slowik, J. G., Kilic, D., Klein, F., Baltensperger, U., and Prévôt, A. S. H.: Identification of significant precursor gases of secondary organic aerosols from residential wood combustion, Scientific Reports, 6, 27881, https://doi.org/10.1038/srep27881, 2016.
Canagaratna, M. R., Jayne, J. T., Jimenez, J. L., Allan, J. D., Alfarra, M. R., Zhang, Q., Onasch, T. B., Drewnick, F., Coe, H., Middlebrook, A., Delia, A., Williams, L. R., Trimborn, A. M., Northway, M. J., DeCarlo, P. F., Kolb, C. E., Davidovits, P., and Worsnop, D. R.: Chemical and microphysical characterization of ambient aerosols with the aerodyne aerosol mass spectrometer, Mass Spectrom. Rev., 26, 185–222, https://doi.org/10.1002/mas.20115, 2007.
Capes, G., Johnson, B., McFiggans, G., Williams, P. I., Haywood, J., and Coe, H.: Aging of biomass burning aerosols over West Africa: Aircraft measurements of chemical composition, microphysical properties, and emission ratios, J. Geophys. Res., 113, D00C15, https://doi.org/10.1029/2008jd009845, 2008.
Cappa, C. D. and Jimenez, J. L.: Quantitative estimates of the volatility of ambient organic aerosol, Atmos. Chem. Phys., 10, 5409–5424, https://doi.org/10.5194/acp-10-5409-2010, 2010.
Calvert, J. G., Atkinson, R., Becker, K. H., Kamens, R. M., Seinfeld, J. H., Wallington, T. J., and Yarwood, G.: The Mechanisms of Atmospheric Oxidation of Aromatic Hydrocarbons, Oxford University Press, Oxford, 2002.
Chan, A. W. H., Kautzman, K. E., Chhabra, P. S., Surratt, J. D., Chan, M. N., Crounse, J. D., Kürten, A., Wennberg, P. O., Flagan, R. C., and Seinfeld, J. H.: Secondary organic aerosol formation from photooxidation of naphthalene and alkylnaphthalenes: implications for oxidation of intermediate volatility organic compounds (IVOCs), Atmos. Chem. Phys., 9, 3049–3060, https://doi.org/10.5194/acp-9-3049-2009, 2009.
Chung, S. H. and Seinfeld, J. H.: Global distribution and climate forcing of carbonaceous aerosols, J. Geophys. Res., 107, 4407, https://doi.org/10.1029/2001jd001397, 2002.
Cocker, D. R., Mader, B. T., Kalberer, M., Flagan, R. C., and Seinfeld, J. H.: The effect of water on gas-particle partitioning of secondary organic aerosol: II. m-xylene and 1,3,5-trimethylbenzene photooxidation systems, Atmos. Environ., 35, 6073–6085, https://doi.org/10.1016/s1352-2310(01)00405-8, 2001.
Cubison, M. J., Ortega, A. M., Hayes, P. L., Farmer, D. K., Day, D., Lechner, M. J., Brune, W. H., Apel, E., Diskin, G. S., Fisher, J. A., Fuelberg, H. E., Hecobian, A., Knapp, D. J., Mikoviny, T., Riemer, D., Sachse, G. W., Sessions, W., Weber, R. J., Weinheimer, A. J., Wisthaler, A., and Jimenez, J. L.: Effects of aging on organic aerosol from open biomass burning smoke in aircraft and laboratory studies, Atmos. Chem. Phys., 11, 12049–12064, https://doi.org/10.5194/acp-11-12049-2011, 2011.
Dee, D. P., Uppala, S. M., Simmons, A. J., Berrisford, P., Poli, P., Kobayashi, S., Andrae, U., Balmaseda, M. A., Balsamo, G., Bauer, P., Bechtold, P., Beljaars, A. C. M., van de Berg, L., Bidlot, J., Bormann, N., Delsol, C., Dragani, R., Fuentes, M., Geer, A. J., Haimberger, L., Healy, S. B., Hersbach, H., Holm, E. V., Isaksen, L., Kallberg, P., Kohler, M., Matricardi, M., McNally, A. P., Monge-Sanz, B. M., Morcrette, J. J., Park, B. K., Peubey, C., de Rosnay, P., Tavolato, C., Thepaut, J. N., and Vitart, F.: The ERA-Interim reanalysis: configuration and performance of the data assimilation system, Q. J. Roy. Meteor. Soc., 137, 553–597, https://doi.org/10.1002/qj.828, 2011.
Ding, X., Wang, X. M., Gao, B., Fu, X. X., He, Q. F., Zhao, X. Y., Yu, J. Z., and Zheng, M.: Tracer-based estimation of secondary organic carbon in the Pearl River Delta, south China, J. Geophys. Res., 117, D05313, https://doi.org/10.1029/2011jd016596, 2012.
Donahue, N. M., Robinson, A. L., Stanier, C. O., and Pandis, S. N.: Coupled partitioning, dilution, and chemical aging of semivolatile organics, Environ. Sci. Technol., 40, 2635–2643, https://doi.org/10.1021/es052297c, 2006.
Donahue, N. M., Epstein, S. A., Pandis, S. N., and Robinson, A. L.: A two-dimensional volatility basis set: 1. organic-aerosol mixing thermodynamics, Atmos. Chem. Phys., 11, 3303–3318, https://doi.org/10.5194/acp-11-3303-2011, 2011.
Donahue, N. M., Kroll, J. H., Pandis, S. N., and Robinson, A. L.: A two-dimensional volatility basis set – Part 2: Diagnostics of organic-aerosol evolution, Atmos. Chem. Phys., 12, 615–634, https://doi.org/10.5194/acp-12-615-2012, 2012.
Ervens, B.: Modeling the Processing of Aerosol and Trace Gases in Clouds and Fogs, Chem. Rev., 115, 4157–4198, https://doi.org/10.1021/cr5005887, 2015.
Farina, S. C., Adams, P. J., and Pandis, S. N.: Modeling global secondary organic aerosol formation and processing with the volatility basis set: Implications for anthropogenic secondary organic aerosol, J. Geophys. Res., 115, D09202, https://doi.org/10.1029/2009jd013046, 2010.
Feng, J. L., Li, M., Zhang, P., Gong, S. Y., Zhong, M. A., Wu, M. H., Zheng, M., Chen, C. H., Wang, H. L., and Lou, S. R.: Investigation of the sources and seasonal variations of secondary organic aerosols in PM2.5 in Shanghai with organic tracers, Atmos. Environ., 79, 614–622, https://doi.org/10.1016/j.atmosenv.2013.07.022, 2013.
Forster, P. and Ramaswamy, V.: Changes in Atmospheric Con- stituents and in Radiative Forcing, in: Climate Change 2007: The Physical Science Basis, edited by: Solomon, S., Qin, D., Manning, M., Marquis, M., Averyt, K., Tignor, M. M. B., Miller, H. L., and Chen, Z. L., Cambridge Univ Press, New York, 129–234, 2007.
Fuchs, N. A. and Sutugin, A. G.: Highly dispersed aerosols, Chapter: Topics in current aerosol research, Pergamon, New York, 1971.
iannakopoulos, C.: Three dimensional modelling of the concentration and deposition of tropospheric trace gases, PhD thesis, University of Cambridge, UK, 1998.
Goldstein, A. H. and Galbally, I. E.: Known and unexplored organic constituents in the earth's atmosphere, Environ. Sci. Technol., 41, 1514–1521, https://doi.org/10.1021/es072476p, 2007.
Guenther, A., Hewitt, C. N., Erickson, D., Fall, R., Geron, C., Graedel, T., Harley, P., Klinger, L., Lerdau, M., McKay, W. A., Pierce, T., Scholes, B., Steinbrecher, R., Tallamraju, R., Taylor, J., and Zimmerman, P.: A global model of natural volatile organic compound emissions, J. Geophys. Res., 100, 8873–8892, https://doi.org/10.1029/94JD02950, 1995.
Guenther, A., Karl, T., Harley, P., Wiedinmyer, C., Palmer, P. I., and Geron, C.: Estimates of global terrestrial isoprene emissions using MEGAN (Model of Emissions of Gases and Aerosols from Nature), Atmos. Chem. Phys., 6, 3181–3210, https://doi.org/10.5194/acp-6-3181-2006, 2006.
Guenther, A. B., Jiang, X., Heald, C. L., Sakulyanontvittaya, T., Duhl, T., Emmons, L. K., and Wang, X.: The Model of Emissions of Gases and Aerosols from Nature version 2.1 (MEGAN2.1): an extended and updated framework for modeling biogenic emissions, Geosci. Model Dev., 5, 1471–1492, https://doi.org/10.5194/gmd-5-1471-2012, 2012.
Guo, S., Hu, M., Guo, Q. F., Zhang, X., Zheng, M., Zheng, J., Chang, C. C., Schauer, J. J., and Zhang, R. Y.: Primary Sources and Secondary Formation of Organic Aerosols in Beijing, China, Environ. Sci. Technol., 46, 9846–9853, https://doi.org/10.1021/es2042564, 2012.
Hall, B., Claiborn, C., and Baldocchi, D.: Measurement and modeling of the dry deposition of peroxides, Atmos. Environ., 33, 577–589, https://doi.org/10.1016/s1352-2310(98)00271-4, 1999.
Heald, C. L., Coe, H., Jimenez, J. L., Weber, R. J., Bahreini, R., Middlebrook, A. M., Russell, L. M., Jolleys, M., Fu, T.-M., Allan, J. D., Bower, K. N., Capes, G., Crosier, J., Morgan, W. T., Robinson, N. H., Williams, P. I., Cubison, M. J., DeCarlo, P. F., and Dunlea, E. J.: Exploring the vertical profile of atmospheric organic aerosol: comparing 17 aircraft field campaigns with a global model, Atmos. Chem. Phys., 11, 12673–12696, https://doi.org/10.5194/acp-11-12673-2011, 2011.
Henze, D. K. and Seinfeld, J. H.: Global secondary organic aerosol from isoprene oxidation, Geophys. Res. Lett., 33, L09812, https://doi.org/10.1029/2006gl025976, 2006.
Henze, D. K., Seinfeld, J. H., Ng, N. L., Kroll, J. H., Fu, T.-M., Jacob, D. J., and Heald, C. L.: Global modeling of secondary organic aerosol formation from aromatic hydrocarbons: high- vs. low-yield pathways, Atmos. Chem. Phys., 8, 2405–2420, https://doi.org/10.5194/acp-8-2405-2008, 2008.
Hewitt, H. T., Copsey, D., Culverwell, I. D., Harris, C. M., Hill, R. S. R., Keen, A. B., McLaren, A. J., and Hunke, E. C.: Design and implementation of the infrastructure of HadGEM3: the next-generation Met Office climate modelling system, Geosci. Model Dev., 4, 223–253, https://doi.org/10.5194/gmd-4-223-2011, 2011.
Hinks, M. L., Montoya-Aguilera, J., Ellison, L., Lin, P., Laskin, A., Laskin, J., Shiraiwa, M., Dabdub, D., and Nizkorodov, S. A.: Effect of relative humidity on the composition of secondary organic aerosol from the oxidation of toluene, Atmos. Chem. Phys., 18, 1643–1652, https://doi.org/10.5194/acp-18-1643-2018, 2018.
Hodzic, A., Aumont, B., Knote, C., Lee-Taylor, J., Madronich, S., and Tyndall, G.: Volatility dependence of Henry's law constants of condensable organics: Application to estimate depositional loss of secondary organic aerosols, Geophys. Res. Lett., 41, 4795–4804, https://doi.org/10.1002/2014gl060649, 2014.
Hodzic, A., Kasibhatla, P. S., Jo, D. S., Cappa, C. D., Jimenez, J. L., Madronich, S., and Park, R. J.: Rethinking the global secondary organic aerosol (SOA) budget: stronger production, faster removal, shorter lifetime, Atmos. Chem. Phys., 16, 7917–7941, https://doi.org/10.5194/acp-16-7917-2016, 2016.
Hoyle, C. R., Berntsen, T., Myhre, G., and Isaksen, I. S. A.: Secondary organic aerosol in the global aerosol – chemical transport model Oslo CTM2, Atmos. Chem. Phys., 7, 5675–5694, https://doi.org/10.5194/acp-7-5675-2007, 2007.
Hurley, M. D., Sokolov, O., Wallington, T. J., Takekawa, H., Karasawa, M., Klotz, B., Barnes, I., and Becker, K. H.: Organic aerosol formation during the atmospheric degradation of toluene, Environ. Sci. Technol., 35, 1358–1366, https://doi.org/10.1021/es0013733, 2001.
Jayne, J. T., Leard, D. C., Zhang, X. F., Davidovits, P., Smith, K. A., Kolb, C. E., and Worsnop, D. R.: Development of an aerosol mass spectrometer for size and composition analysis of submicron particles, Aerosol Sci. Tech., 33, 49–70, https://doi.org/10.1080/027868200410840, 2000.
Jimenez, J. L., Canagaratna, M. R., Donahue, N. M., Prevot, A. S. H., Zhang, Q., Kroll, J. H., DeCarlo, P. F., Allan, J. D., Coe, H., Ng, N. L., Aiken, A. C., Docherty, K. S., Ulbrich, I. M., Grieshop, A. P., Robinson, A. L., Duplissy, J., Smith, J. D., Wilson, K. R., Lanz, V. A., Hueglin, C., Sun, Y. L., Tian, J., Laaksonen, A., Raatikainen, T., Rautiainen, J., Vaattovaara, P., Ehn, M., Kulmala, M., Tomlinson, J. M., Collins, D. R., Cubison, M. J., Dunlea, E. J., Huffman, J. A., Onasch, T. B., Alfarra, M. R., Williams, P. I., Bower, K., Kondo, Y., Schneider, J., Drewnick, F., Borrmann, S., Weimer, S., Demerjian, K., Salcedo, D., Cottrell, L., Griffin, R., Takami, A., Miyoshi, T., Hatakeyama, S., Shimono, A., Sun, J. Y., Zhang, Y. M., Dzepina, K., Kimmel, J. R., Sueper, D., Jayne, J. T., Herndon, S. C., Trimborn, A. M., Williams, L. R., Wood, E. C., Middlebrook, A. M., Kolb, C. E., Baltensperger, U., and Worsnop, D. R.: Evolution of Organic Aerosols in the Atmosphere, Science, 326, 1525–1529, https://doi.org/10.1126/science.1180353, 2009.
Kautzman, K. E., Surratt, J. D., Chan, M. N., Chan, A. W. H., Hersey, S. P., Chhabra, P. S., Dalleska, N. F., Wennberg, P. O., Flagan, R. C., and Seinfeld, J. H.: Chemical Composition of Gas- and Aerosol-Phase Products from the Photooxidation of Naphthalene, J. Phys. Chem. A, 114, 913–934, https://doi.org/10.1021/jp908530s, 2010.
Kelly, J. M., Doherty, R. M., O'Connor, F. M., and Mann, G. W.: The impact of biogenic, anthropogenic, and biomass burning volatile organic compound emissions on regional and seasonal variations in secondary organic aerosol, Atmos. Chem. Phys., 18, 7393–7422, https://doi.org/10.5194/acp-18-7393-2018, 2018.
Khan, M. A. H., Jenkin, M. E., Foulds, A., Derwent, R. G., Percival, C. J., and Shallcross, D. E.: A modeling study of secondary organic aerosol formation from sesquiterpenes using the STOCHEM global chemistry and transport model, J. Geophys. Res.-Atmos., 122, 4426–4439, https://doi.org/10.1002/2016jd026415, 2017.
Kipling, Z., Stier, P., Schwarz, J. P., Perring, A. E., Spackman, J. R., Mann, G. W., Johnson, C. E., and Telford, P. J.: Constraints on aerosol processes in climate models from vertically-resolved aircraft observations of black carbon, Atmos. Chem. Phys., 13, 5969–5986, https://doi.org/10.5194/acp-13-5969-2013, 2013.
Knote, C., Hodzic, A., and Jimenez, J. L.: The effect of dry and wet deposition of condensable vapors on secondary organic aerosols concentrations over the continental US, Atmos. Chem. Phys., 15, 1–18, https://doi.org/10.5194/acp-15-1-2015, 2015.
Koch, R., Knispel, R., Elend, M., Siese, M., and Zetzsch, C.: Consecutive reactions of aromatic-OH adducts with NO, NO2 and O2: benzene, naphthalene, toluene, m- and p-xylene, hexamethylbenzene, phenol, m-cresol and aniline, Atmos. Chem. Phys., 7, 2057–2071, https://doi.org/10.5194/acp-7-2057-2007, 2007. 2007.
Kulmala, M., Lehtinen, K. E. J., and Laaksonen, A.: Cluster activation theory as an explanation of the linear dependence between formation rate of 3 nm particles and sulphuric acid concentration, Atmos. Chem. Phys., 6, 787–793, https://doi.org/10.5194/acp-6-787-2006, 2006.
Lamarque, J.-F., Bond, T. C., Eyring, V., Granier, C., Heil, A., Klimont, Z., Lee, D., Liousse, C., Mieville, A., Owen, B., Schultz, M. G., Shindell, D., Smith, S. J., Stehfest, E., Van Aardenne, J., Cooper, O. R., Kainuma, M., Mahowald, N., McConnell, J. R., Naik, V., Riahi, K., and van Vuuren, D. P.: Historical (1850–2000) gridded anthropogenic and biomass burning emissions of reactive gases and aerosols: methodology and application, Atmos. Chem. Phys., 10, 7017–7039, https://doi.org/10.5194/acp-10-7017-2010, 2010.
Li, L., Tang, P., Nakao, S., and Cocker III, D. R.: Impact of molecular structure on secondary organic aerosol formation from aromatic hydrocarbon photooxidation under low-NOx conditions, Atmos. Chem. Phys., 16, 10793–10808, https://doi.org/10.5194/acp-16-10793-2016, 2016.
Li, J. L., Zhang, M. G., Wu, F. K., Sun, Y. L., and Tang, G. G.: Assessment of the impacts of aromatic VOC emissions and yields of SOA on SOA concentrations with the air quality model RAMS-CMAQ, Atmos. Environ., 158, 105–115, https://doi.org/10.1016/j.atmosenv.2017.03.035, 2017a.
Li, L. J., Qi, L., and Cocker, D. R.: Contribution of methyl group to secondary organic aerosol formation from aromatic hydrocarbon photooxidation, Atmos. Environ., 151, 133–139, https://doi.org/10.1016/j.atmosenv.2016.11.064, 2017b.
Lin, G., Penner, J. E., Sillman, S., Taraborrelli, D., and Lelieveld, J.: Global modeling of SOA formation from dicarbonyls, epoxides, organic nitrates and peroxides, Atmos. Chem. Phys., 12, 4743–4774, https://doi.org/10.5194/acp-12-4743-2012, 2012.
Lin, G., Sillman, S., Penner, J. E., and Ito, A.: Global modeling of SOA: the use of different mechanisms for aqueous-phase formation, Atmos. Chem. Phys., 14, 5451–5475, https://doi.org/10.5194/acp-14-5451-2014, 2014.
Loveland, T. R., Reed, B. C., Brown, J. F., Ohlen, D. O., Zhu, Z., Yang, L., and Merchant, J. W.: Development of a global land cover characteristics database and IGBP DISCover from 1 km AVHRR data, Int. J. Remote Sens., 21, 1303–1330, https://doi.org/10.1080/014311600210191, 2000.
Mann, G. W., Carslaw, K. S., Spracklen, D. V., Ridley, D. A., Manktelow, P. T., Chipperfield, M. P., Pickering, S. J., and Johnson, C. E.: Description and evaluation of GLOMAP-mode: a modal global aerosol microphysics model for the UKCA composition-climate model, Geosci. Model Dev., 3, 519–551, https://doi.org/10.5194/gmd-3-519-2010, 2010.
Martin, S. T., Andreae, M. O., Althausen, D., Artaxo, P., Baars, H., Borrmann, S., Chen, Q., Farmer, D. K., Guenther, A., Gunthe, S. S., Jimenez, J. L., Karl, T., Longo, K., Manzi, A., Müller, T., Pauliquevis, T., Petters, M. D., Prenni, A. J., Pöschl, U., Rizzo, L. V., Schneider, J., Smith, J. N., Swietlicki, E., Tota, J., Wang, J., Wiedensohler, A., and Zorn, S. R.: An overview of the Amazonian Aerosol Characterization Experiment 2008 (AMAZE-08), Atmos. Chem. Phys., 10, 11415–11438, https://doi.org/10.5194/acp-10-11415-2010, 2010.
McNeill, V. F.: Aqueous Organic Chemistry in the Atmosphere: Sources and Chemical Processing of Organic Aerosols, Environ. Sci. Technol., 49, 1237-1244, https://doi.org/10.1021/es5043707, 2015.
Morgenstern, O., Braesicke, P., O'Connor, F. M., Bushell, A. C., Johnson, C. E., Osprey, S. M., and Pyle, J. A.: Evaluation of the new UKCA climate-composition model – Part 1: The stratosphere, Geosci. Model Dev., 2, 43–57, https://doi.org/10.5194/gmd-2-43-2009, 2009.
Ng, N. L., Kroll, J. H., Chan, A. W. H., Chhabra, P. S., Flagan, R. C., and Seinfeld, J. H.: Secondary organic aerosol formation from m-xylene, toluene, and benzene, Atmos. Chem. Phys., 7, 3909–3922, https://doi.org/10.5194/acp-7-3909-2007, 2007.
Nguyen, T. B., Crounse, J. D., Teng, A. P., Clair, J. M. S., Paulot, F., Wolfe, G. M., and Wennberg, P. O.: Rapid deposition of oxidized biogenic compounds to a temperate forest, P. Natl. Acad. Sci. USA, 112, E392–E401, https://doi.org/10.1073/pnas.1418702112, 2015.
O'Connor, F. M., Johnson, C. E., Morgenstern, O., Abraham, N. L., Braesicke, P., Dalvi, M., Folberth, G. A., Sanderson, M. G., Telford, P. J., Voulgarakis, A., Young, P. J., Zeng, G., Collins, W. J., and Pyle, J. A.: Evaluation of the new UKCA climate-composition model – Part 2: The Troposphere, Geosci. Model Dev., 7, 41–91, https://doi.org/10.5194/gmd-7-41-2014, 2014.
Odum, J. R., Hoffmann, T., Bowman, F., Collins, D., Flagan, R. C., and Seinfeld, J. H.: Gas/particle partitioning and secondary organic aerosol yields, Environ. Sci. Technol., 30, 2580–2585, https://doi.org/10.1021/es950943+, 1996.
Odum, J. R., Jungkamp, T. P. W., Griffin, R. J., Flagan, R. C., and Seinfeld, J. H.: The atmospheric aerosol-forming potential of whole gasoline vapor, Science, 276, 96–99, https://doi.org/10.1126/science.276.5309.96, 1997.
Orlando, J. J. and Tyndall, G. S.: Laboratory studies of organic peroxy radical chemistry: an overview with emphasis on recent issues of atmospheric significance, Chem. Soc. Rev., 41, 6294–6317, https://doi.org/10.1039/C2CS35166H, 2012.
Penner, J. E., Atherton, C. S., Dignon, J., Ghan, S. J., Walton, J. J., and Hameed, S.: Tropospheric nitrogen: A three-dimensional study of sources, distributions, and deposition, J. Geophys. Res., 96, 959–990, https://doi.org/10.1029/90jd02228, 1991.
Pöschl, U., von Kuhlmann, R., Poisson, N., and Crutzen, P. J.: Development and intercomparison of condensed isoprene oxidation mechanisms for global atmospheric modeling, J. Atmos. Chem., 37, 29–52, https://doi.org/10.1023/a:1006391009798, 2000.
Pye, H. O. T. and Seinfeld, J. H.: A global perspective on aerosol from low-volatility organic compounds, Atmos. Chem. Phys., 10, 4377–4401, https://doi.org/10.5194/acp-10-4377-2010, 2010.
Reynolds, R. W., Smith, T. M., Liu, C., Chelton, D. B., Casey, K. S., and Schlax, M. G.: Daily high-resolution-blended analyses for sea surface temperature, Journal of Climate, 20, 5473-5496, https://doi.org/10.1175/2007jcli1824.1, 2007.
Robinson, A. L., Donahue, N. M., Shrivastava, M. K., Weitkamp, E. A., Sage, A. M., Grieshop, A. P., Lane, T. E., Pierce, J. R., and Pandis, S. N.: Rethinking organic aerosols: Semivolatile emissions and photochemical aging, Science, 315, 1259–1262, https://doi.org/10.1126/science.1133061, 2007.
Schwantes, R. H., Schilling, K. A., McVay, R. C., Lignell, H., Coggon, M. M., Zhang, X., Wennberg, P. O., and Seinfeld, J. H.: Formation of highly oxygenated low-volatility products from cresol oxidation, Atmos. Chem. Phys., 17, 3453–3474, https://doi.org/10.5194/acp-17-3453-2017, 2017.
Scott, C. E., Rap, A., Spracklen, D. V., Forster, P. M., Carslaw, K. S., Mann, G. W., Pringle, K. J., Kivekäs, N., Kulmala, M., Lihavainen, H., and Tunved, P.: The direct and indirect radiative effects of biogenic secondary organic aerosol, Atmos. Chem. Phys., 14, 447–470, https://doi.org/10.5194/acp-14-447-2014, 2014.
Scott, C. E., Spracklen, D. V., Pierce, J. R., Riipinen, I., D'Andrea, S. D., Rap, A., Carslaw, K. S., Forster, P. M., Artaxo, P., Kulmala, M., Rizzo, L. V., Swietlicki, E., Mann, G. W., and Pringle, K. J.: Impact of gas-to-particle partitioning approaches on the simulated radiative effects of biogenic secondary organic aerosol, Atmos. Chem. Phys., 15, 12989–13001, https://doi.org/10.5194/acp-15-12989-2015, 2015.
Shrivastava, M., Easter, R. C., Liu, X. H., Zelenyuk, A., Singh, B., Zhang, K., Ma, P. L., Chand, D., Ghan, S., Jimenez, J. L., Zhang, Q., Fast, J., Rasch, P. J., and Tiitta, P.: Global transformation and fate of SOA: Implications of low-volatility SOA and gas-phase fragmentation reactions, J. Geophys. Res.-Atmos., 120, 4169–4195, https://doi.org/10.1002/2014jd022563, 2015.
Slinn, W. G. N.: Predictions for particle deposition to vegetative canpies, Atmos. Environ., 16, 1785–1794, https://doi.org/10.1016/0004-6981(82)90271-2, 1982.
Song, C., Na, K. S., and Cocker, D. R.: Impact of the hydrocarbon to NOx ratio on secondary organic aerosol formation, Environ. Sci. Technol., 39, 3143–3149, https://doi.org/10.1021/es0493244, 2005.
Spracklen, D. V., Jimenez, J. L., Carslaw, K. S., Worsnop, D. R., Evans, M. J., Mann, G. W., Zhang, Q., Canagaratna, M. R., Allan, J., Coe, H., McFiggans, G., Rap, A., and Forster, P.: Aerosol mass spectrometer constraint on the global secondary organic aerosol budget, Atmos. Chem. Phys., 11, 12109–12136, https://doi.org/10.5194/acp-11-12109-2011, 2011.
Stone, D., Whalley, L. K., and Heard, D. E.: Tropospheric OH and HO2 radicals: field measurements and model comparisons, Chem. Soc. Rev., 41, 6348–6404, https://doi.org/10.1039/c2cs35140d, 2012.
Telford, P. J., Braesicke, P., Morgenstern, O., and Pyle, J. A.: Technical Note: Description and assessment of a nudged version of the new dynamics Unified Model, Atmos. Chem. Phys., 8, 1701–1712, https://doi.org/10.5194/acp-8-1701-2008, 2008.
Tiitta, P., Vakkari, V., Croteau, P., Beukes, J. P., van Zyl, P. G., Josipovic, M., Venter, A. D., Jaars, K., Pienaar, J. J., Ng, N. L., Canagaratna, M. R., Jayne, J. T., Kerminen, V.-M., Kokkola, H., Kulmala, M., Laaksonen, A., Worsnop, D. R., and Laakso, L.: Chemical composition, main sources and temporal variability of PM1 aerosols in southern African grassland, Atmos. Chem. Phys., 14, 1909–1927, https://doi.org/10.5194/acp-14-1909-2014, 2014.
Tsigaridis, K. and Kanakidou, M.: Global modelling of secondary organic aerosol in the troposphere: a sensitivity analysis, Atmos. Chem. Phys., 3, 1849–1869, https://doi.org/10.5194/acp-3-1849-2003, 2003.
Tsigaridis, K., Daskalakis, N., Kanakidou, M., Adams, P. J., Artaxo, P., Bahadur, R., Balkanski, Y., Bauer, S. E., Bellouin, N., Benedetti, A., Bergman, T., Berntsen, T. K., Beukes, J. P., Bian, H., Carslaw, K. S., Chin, M., Curci, G., Diehl, T., Easter, R. C., Ghan, S. J., Gong, S. L., Hodzic, A., Hoyle, C. R., Iversen, T., Jathar, S., Jimenez, J. L., Kaiser, J. W., Kirkevåg, A., Koch, D., Kokkola, H., Lee, Y. H., Lin, G., Liu, X., Luo, G., Ma, X., Mann, G. W., Mihalopoulos, N., Morcrette, J.-J., Müller, J.-F., Myhre, G., Myriokefalitakis, S., Ng, N. L., O'Donnell, D., Penner, J. E., Pozzoli, L., Pringle, K. J., Russell, L. M., Schulz, M., Sciare, J., Seland, Ø., Shindell, D. T., Sillman, S., Skeie, R. B., Spracklen, D., Stavrakou, T., Steenrod, S. D., Takemura, T., Tiitta, P., Tilmes, S., Tost, H., van Noije, T., van Zyl, P. G., von Salzen, K., Yu, F., Wang, Z., Wang, Z., Zaveri, R. A., Zhang, H., Zhang, K., Zhang, Q., and Zhang, X.: The AeroCom evaluation and intercomparison of organic aerosol in global models, Atmos. Chem. Phys., 14, 10845–10895, https://doi.org/10.5194/acp-14-10845-2014, 2014.
Tsimpidi, A. P., Karydis, V. A., Pandis, S. N., and Lelieveld, J.: Global combustion sources of organic aerosols: model comparison with 84 AMS factor-analysis data sets, Atmos. Chem. Phys., 16, 8939–8962, https://doi.org/10.5194/acp-16-8939-2016, 2016.
Valverde-Canossa, J., Ganzeveld, L., Rappengluck, B., Steinbrecher, R., Klemm, O., Schuster, G., and Moortgat, G. K.: First measurements of H2O2 and organic peroxides surface fluxes by the relaxed eddy-accumulation technique, Atmos. Environ., 40, 55–67, https://doi.org/10.1016/j.atmosenv.2006.03.038, 2006.
van der Werf, G. R., Randerson, J. T., Giglio, L., Collatz, G. J., Mu, M., Kasibhatla, P. S., Morton, D. C., DeFries, R. S., Jin, Y., and van Leeuwen, T. T.: Global fire emissions and the contribution of deforestation, savanna, forest, agricultural, and peat fires (1997–2009), Atmos. Chem. Phys., 10, 11707–11735, https://doi.org/10.5194/acp-10-11707-2010, 2010.
Von Schneidemesser, E., Zhou, J. B., Stone, E. A., Schauer, J. J., Shpund, J., Brenner, S., Qasrawi, R., Abdeen, Z., and Sarnat, J. A.: Spatial Variability of Carbonaceous Aerosol Concentrations in East and West Jerusalem, Environ. Sci. Technol., 44, 1911–1917, https://doi.org/10.1021/es9014025, 2010.
Walters, D. N., Williams, K. D., Boutle, I. A., Bushell, A. C., Edwards, J. M., Field, P. R., Lock, A. P., Morcrette, C. J., Stratton, R. A., Wilkinson, J. M., Willett, M. R., Bellouin, N., Bodas-Salcedo, A., Brooks, M. E., Copsey, D., Earnshaw, P. D., Hardiman, S. C., Harris, C. M., Levine, R. C., MacLachlan, C., Manners, J. C., Martin, G. M., Milton, S. F., Palmer, M. D., Roberts, M. J., Rodríguez, J. M., Tennant, W. J., and Vidale, P. L.: The Met Office Unified Model Global Atmosphere 4.0 and JULES Global Land 4.0 configurations, Geosci. Model Dev., 7, 361–386, https://doi.org/10.5194/gmd-7-361-2014, 2014.
Walton, J. J., Maccracken, M. C., and Ghan, S. J.: A global-scale lagrangian trace species model of transport, transformation, and removal processes, J. Geophys. Res., 93, 8339–8354, https://doi.org/10.1029/JD093iD07p08339, 1988.
Wesely, M. L.: Parameterization of surface resistances to gaseous dry deposition in regional-scale numerical models, Atmos. Environ., 23, 1293–1304, https://doi.org/10.1016/0004-6981(89)90153-4, 1989.
White, S. J., Jamie, I. M., and Angove, D. E.: Chemical characterisation of semi-volatile and aerosol compounds from the photooxidation of toluene and NOx, Atmos. Environ., 83, 237–244, https://doi.org/10.1016/j.atmosenv.2013.11.023, 2014.
WHO: Health risks of air pollution in Europe – HRAPIE project: recommendations for concentration-response functions for cost-benefit analysis of particulate matter, ozone and nitrogen dioxide, available at: http://www.euro.who.int/en/health-topics/environment-and-health/air-quality/publications/2013/health-risks-of-air-pollution-in-europe-hrapie-project.-recommendations-for-concentrationresponse-functions-for-costbenefit-analysis-of-particulate-matter,-ozone-and-nitrogen-dioxide (last access: 6 June 2019), 2013.
Woodward, S.: Modeling the atmospheric life cycle and radiative impact of mineral dust in the Hadley Centre climate model, J. Geophys. Res., 106, 18155–18166, https://doi.org/10.1029/2000jd900795, 2001.
Zhang, K., O'Donnell, D., Kazil, J., Stier, P., Kinne, S., Lohmann, U., Ferrachat, S., Croft, B., Quaas, J., Wan, H., Rast, S., and Feichter, J.: The global aerosol-climate model ECHAM-HAM, version 2: sensitivity to improvements in process representations, Atmos. Chem. Phys., 12, 8911–8949, https://doi.org/10.5194/acp-12-8911-2012, 2012.
Zhang, Q., Jimenez, J. L., Canagaratna, M. R., Allan, J. D., Coe, H., Ulbrich, I., Alfarra, M. R., Takami, A., Middlebrook, A. M., Sun, Y. L., Dzepina, K., Dunlea, E., Docherty, K., DeCarlo, P. F., Salcedo, D., Onasch, T., Jayne, J. T., Miyoshi, T., Shimono, A., Hatakeyama, S., Takegawa, N., Kondo, Y., Schneider, J., Drewnick, F., Borrmann, S., Weimer, S., Demerjian, K., Williams, P., Bower, K., Bahreini, R., Cottrell, L., Griffin, R. J., Rautiainen, J., Sun, J. Y., Zhang, Y. M., and Worsnop, D. R.: Ubiquity and dominance of oxygenated species in organic aerosols in anthropogenically-influenced Northern Hemisphere midlatitudes, Geophys. Res. Lett., 34, L13801, https://doi.org/10.1029/2007gl029979, 2007.
Zhang, X., Cappa, C. D., Jathar, S. H., McVay, R. C., Ensberg, J. J., Kleeman, M. J., and Seinfeld, J. H.: Influence of vapor wall loss in laboratory chambers on yields of secondary organic aerosol, P. Natl. Acad. Sci. USA, 111, 5802–-5807, https://doi.org/10.1073/pnas.1404727111, 2014.
- Abstract
- Introduction
- Chemistry–climate model description
- Observations used to evaluate modelled OA
- Influence of precursor deposition on SOA
- Influence of aromatic oxidation mechanisms on SOA
- Conclusions
- Code and data availability
- Author contributions
- Competing interests
- Acknowledgements
- Review statement
- References