the Creative Commons Attribution 4.0 License.
the Creative Commons Attribution 4.0 License.
 | 06 Jan 2026
Seasonal cycles of the carbon export flux in the ocean: insights from the SISSOMA mechanistic model
Athanasios Kandylas
Andre William Visser
This study aims to investigate the seasonal cycle of carbon export flux in the ocean using the SISSOMA modeling framework. SISSOMA uses a 2-dimensional state space (size and excess density) to follow the fate of aggregates in the mixed layer which are transformed through three main processes, e.g., aggregation, fragmentation, and remineralization, until they eventually sink out of the surface ocean. The model tracks aggregate size, mass, and porosity which allows for a direct estimate of aggregate sinking speed through a Reynolds number modified Stokes' law. First, a simple seasonal cycle with a single peak of POM production is presented, which provides a solid basis to understand the model's framework and enables us to perform sensitivity analyses on important parameters. The effect of increased stratification on a reconstructed ecosystem in the north Atlantic is then presented and discussed. Overall, our results showcase the nonlinear relationship between the production of primary particles and the export of aggregates out of the mixed layer and unveil key mechanics of the three transformative processes. Moreover, it has been shown that remineralization rates, stickiness, and the size/ excess density characteristics of the primary particles all affect in various ways the intensity, seasonal cycle, and the resulting size spectrum of the aggregate community. Finally, our results indicate the crucial role that turbulence plays in both the timing and the magnitude of the carbon export flux which might affect not only the potential of the system to remove carbon out of the mixed layer but also have a direct impact on the organisms inhabiting the mesopelagic layer which rely on the sinking particles to cover their energetic needs.
- Article
(4387 KB) - Full-text XML
- BibTeX
- EndNote


The production and export of particulate organic matter (POM) from the surface ocean to depth constitutes an important pathway in the biogeochemical cycle of the ocean, maintaining in part the carbon stored in the deep ocean by the biological carbon pump (BCP) (Boyd et al., 2019; DeVries, 2022), as well as supplying benthic and mesopelagic ecosystems with organic carbon and energy (Billett et al., 1983; Hernández-León et al., 2020). It is qualitatively well understood that export is ultimately governed by primary productivity in the sunlit surface ocean. Although a mechanistic description of how these are related remains elusive (Boyd and Newton, 1995; Buesseler, 1998; Henson et al., 2012), a simple heuristic measure, the e-ratio (the ratio of export production F to net primary production PNPP, sometimes referred to as export efficiency) is often invoked in models and analyses (Siegel et al., 2014; Henson et al., 2019; Buesseler et al., 2020; Laurenceau-Cornec et al., 2023). Factors that contribute to the variation in e-ratio are myriad and include the structure of the plankton community (Boyd and Newton, 1995; Guidi et al., 2016; Henson et al., 2019), nutrient cycling (Kemp et al., 2000; Raven and Waite, 2004), turbulence and cell exudates (Passow et al., 2001; Engel, 2004).
A somewhat simplifying perspective can be achieved by dividing the e-ratio into two components (Laufkötter et al., 2016); the first being the relationship between PNPP and PPOM which is the production rate of primary particulate organic material . This component (PPOM PNPP), termed the p-ratio (Laufkötter et al., 2016), is largely controlled by the plankton community and is generally the most easily accessible component of the export flux simulated in ecosystem models. The second component is the relationship between PPOM and export, F. This component is largely controlled by aggregation processes, transforming primary detrital material into fast sinking aggregates, and it is here that perhaps the greatest uncertainty lies in estimating export flux. The overall estimation of the e-ratio can thus be broken down as:
(Laufkötter et al., 2016). It is the second factor in this relationship (termed the s-ratio; Laufkötter et al., 2016) that is the focus of this study. Notably, recent models seeking to resolve the e-ratio (Siegel et al., 2014; Nowicki et al., 2022; Laurenceau-Cornec et al., 2023) from satellite products do not consider aggregation per se, but rely on empirically derived sinking speeds for different classes of material i.e. focusing almost exclusively on the p-ratio. While doubtless there are important ecological drivers contained in the p-ratio, the aggregation processes in the s-ratio could exert an equally strong control from time to time.
Here we explore the seasonal cycle of POM production and export using the SISSOMA modeling framework. Given the production rate and characteristics (e.g. size, ballasting, mass) of primary POM particles, we simulate the formation and transformation of POM into aggregates while estimating sinking speed directly via Stokes' law corrected for a finite Reynolds number. We simulate not only aggregation, but also remineralization and fragmentation, two important but often poorly resolved aspects of aggregate dynamics. In particular, the sinking velocity of the resulting aggregates is crucial for their fate, as fast-sinking aggregates are subjected to lower remineralization losses by bacterial in the surface and eventually reach greater depths in the oceans' interior. The aggregate's sinking velocity depends on its size, excess density, composition (e.g. ratio of organic matter to ballast minerals) and porosity, while remineralization rates are mainly defined by the aggregate's lability (food quality), the structure of the microbial community and temperature (Baumas and Bizic, 2024). Finally, it is well understood that the relationship between PPOM and F exhibits a strong nonlinearity (Kiørboe et al., 1994). This is qualitatively described as a critical concentration (Jackson, 1990; Burd and Jackson, 2009) where aggregation to larger fast sinking aggregates accelerates rapidly and can lead to episodic intense export events (Siegel et al., 2025) precipitated by intensifying turbulence. It is far from clear that any simple relationship exists between PPOM and F, and by extension F and PNPP. This is reflected in the high variability in the observed e-ratio (Henson et al., 2012, 2019; Siegel et al., 2023) both spatially and temporally, suggesting that a more mechanistic analysis is required.
2.1 Model description
SISSOMA is a mechanistic model (developed in MATLAB) that tracks the fate of aggregates through three main processes; aggregation, fragmentation, and remineralization, and their subsequent sinking. These processes are simulated in a 2-dimensional state space specifying size and excess density of the aggregates. The model accounts for variations of aggregate porosity, mass, and size, allowing for an estimate of the aggregate sinking speed while they are constantly being redistributed in the 2-dimensional state-space through transformative processes. As input, the aggregation model can use estimates of the production/input of primary particles, representing for instance dead and dying plankton cells, fecal pellet production, and/or aolean dust deposits, each characterized by their size and excess density.
Many of the key characteristics of primary particles can be linked to their origin, for instance diatoms have a higher excess density than other phytoplankton taxa (Hansen and Visser, 2019), and the size of the fecal pellets are governed by the size of zooplankton grazers (Stamieszkin et al., 2015). For the purposes of this study, we construct primary particle production rates that can be inferred from typical seasonal cycles of the plankton community. All the descriptions and values of the variables used for the current analysis can be found in Table E1 in Appendix E.
A key feature of SISSOMA is that it treats aggregation as a self-similar process and introduces a novel convolution algorithm for application in a multidimensional state space. This is in contrast to other aggregate models that either use a Monte Carlo approach (Jokulsdottir and Archer, 2016) and/or rely on simplifying aggregate descriptors such as uniform fractal dimension or particle size spectrum slope. Importantly, fractal dimension cannot be considered a conservative property under remineralization and fragmentation, a shortcoming in existing models that SISSOMA seeks to address.
The physical space representation of SISSOMA is kept as simple as possible: a uniform surface mixed layer throughout the annual cycle, although this can be expanded to multiple layers stacked to each other. The state space represents the size (radius) r and excess density ρ′, (ρ−ρw), of the emerging aggregate community. SISSOMA provides flexibility to choose the range and the number of classes of this space.
It is convenient to introduce two transformed variables (x,y) that map to as:
where a is the self-similarity parameter, x is a logarithmic scaling factor of aggregate size, y a stretched logarithmic scaling factor of excess density, is the logarithmic radius interval, and is the excess density logarithmic interval. The factor δ(a−3)x takes advantage of the reduction of density by aggregation and expands the density resolution for large aggregates. ro, ρo and rmax, ρmax are the minimum and maximum values of the aggregate's size and density, respectively.
For this project, the size of possible aggregates in the system, r, ranges between 1 and 106 µm and consists of 30 logarithmically spaced bins, while their excess density, ρ′, extends between 1 and 100 kg m−3, Fig. 1a. Throughout this domain, sinking speed w, Fig. 1b, is estimated via a modified version of Stokes' law:
where ρw is the density of the surrounding water, C is the drag coefficient (see Table E1), and g is the gravitational acceleration.
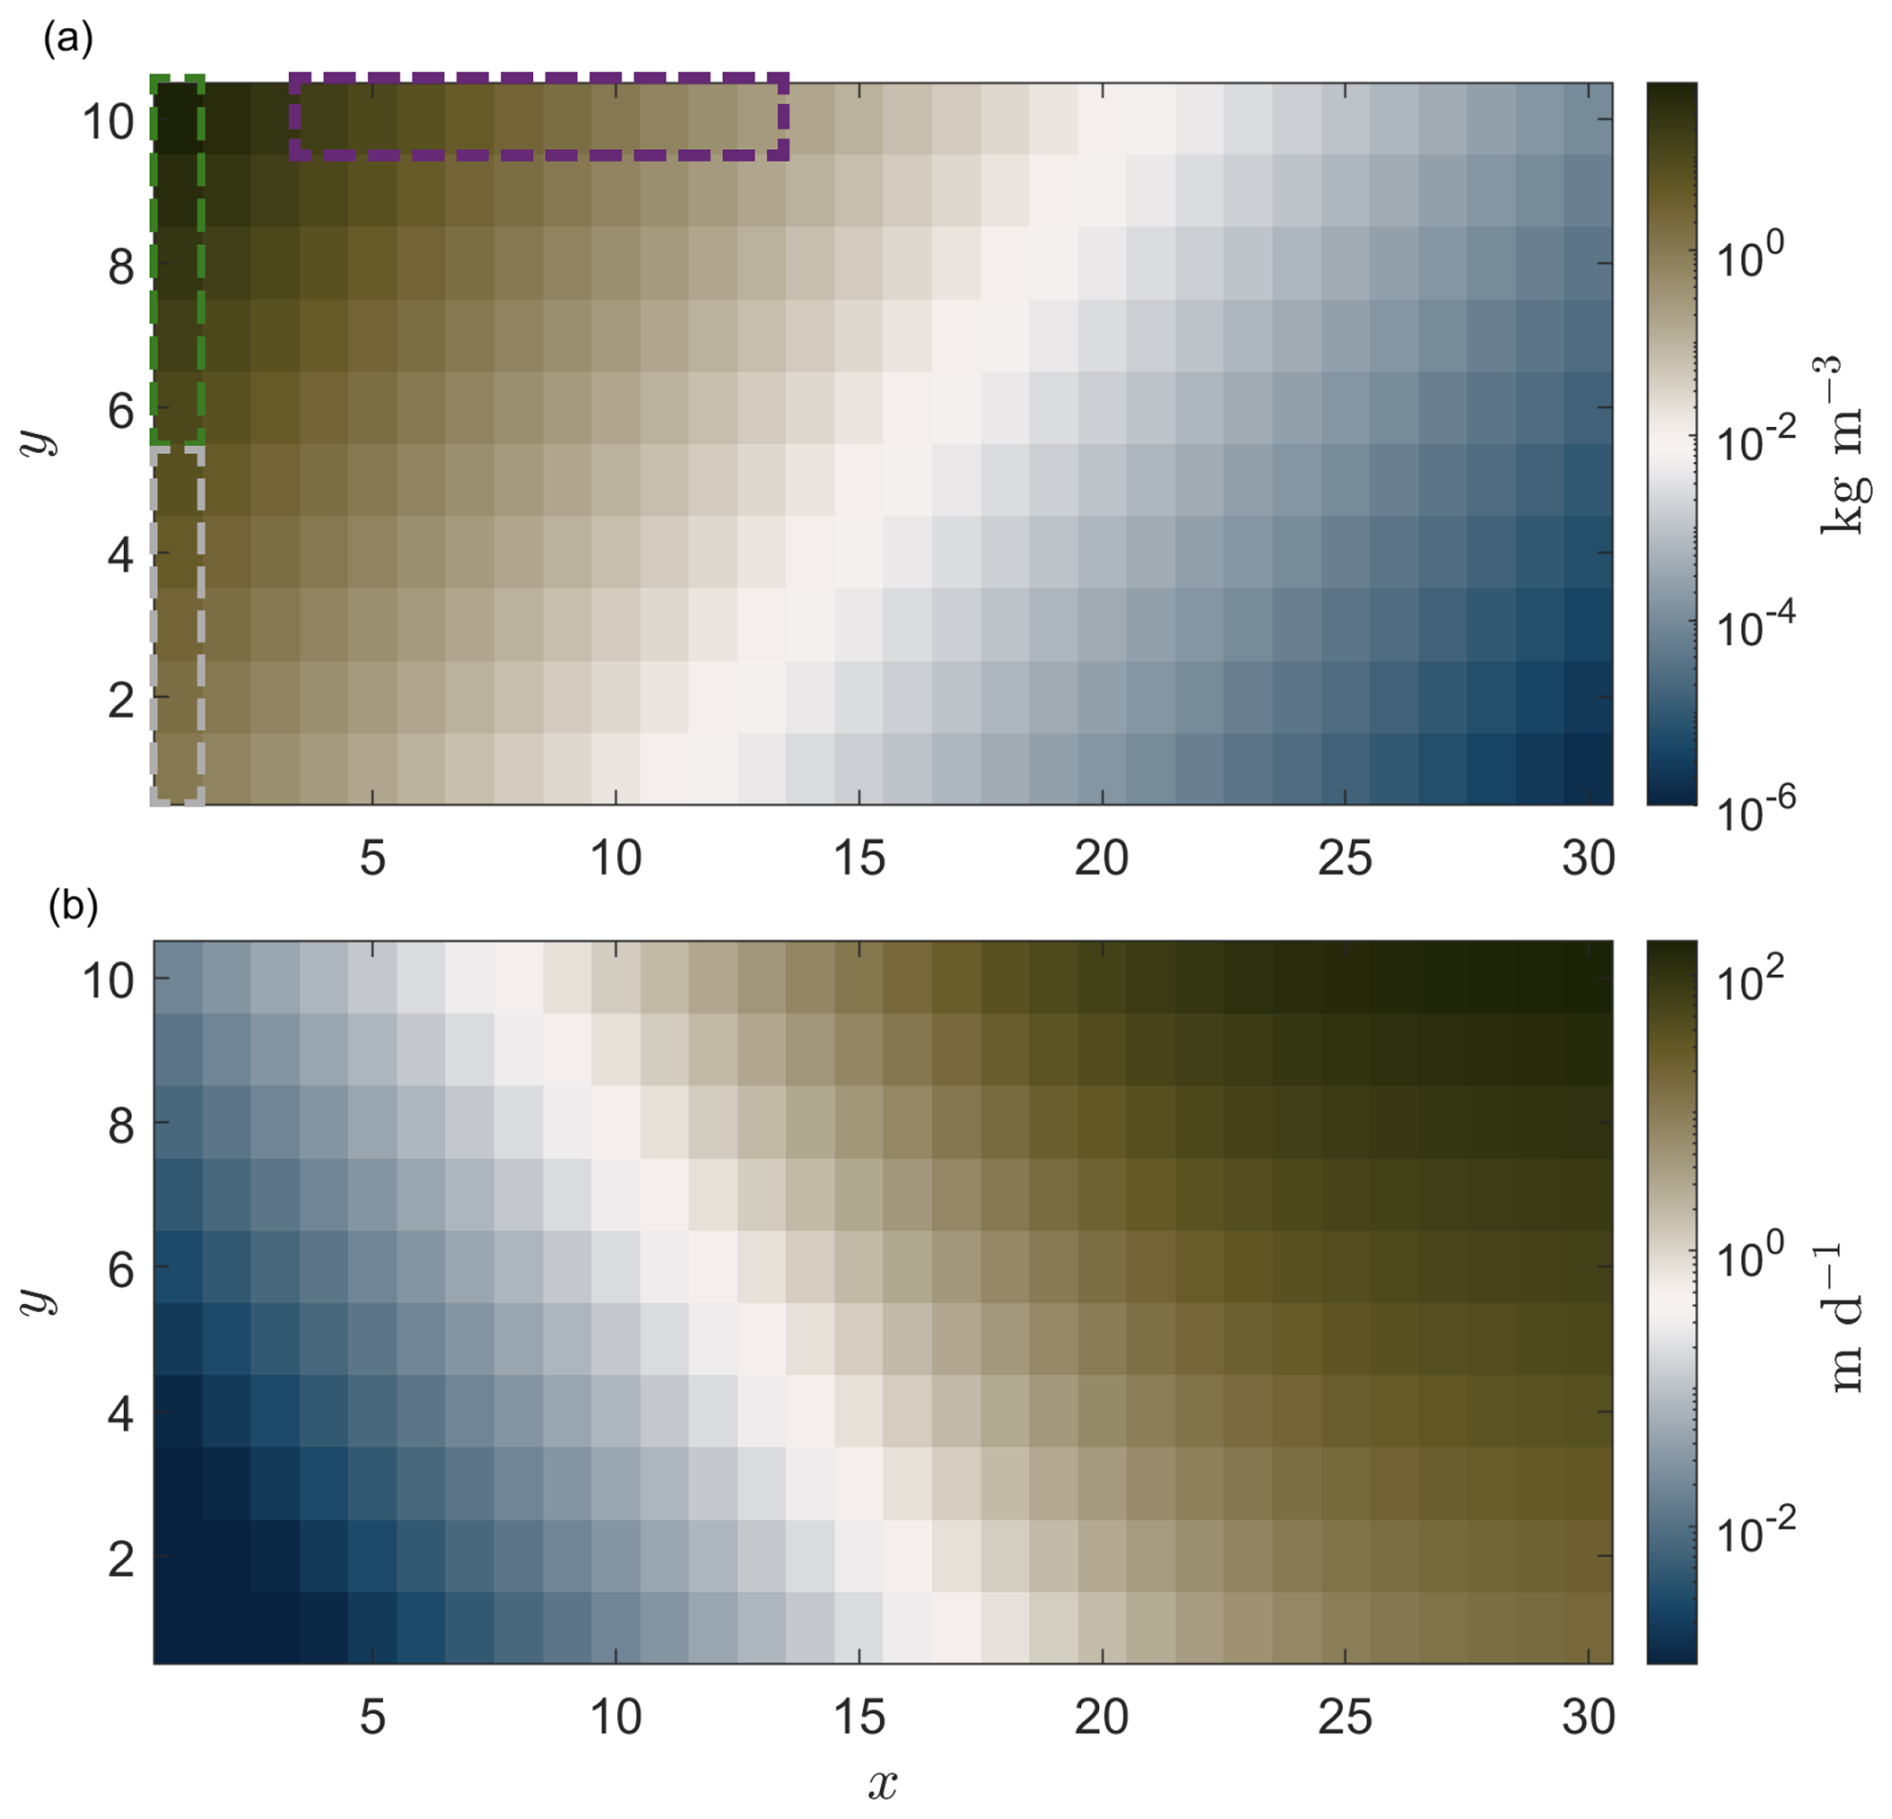
Figure 1Representation of the (a) aggregate excess density, ρ′, and (b) sinking speed, w, in the 2-dimensional state space where x is a logarithmic scaling factor of aggregate size, y a stretched logarithmic scaling factor of excess density (see Eq. 2). (a) Larger aggregates lead to lower excess densities, as surrounding water is trapped in their interior during the formation period. The colors of the dashed boxes in (a) point out the three scenarios in the sensitivity analysis in Sect. 3.2, where different size/excess density primary particles are introduced in the system: (i) small and light (S + L) in grey, small and dense (S + D) in green, and big and dense (B + D) in purple. (b) The sinking speed of aggregates as derived from Eq. (3).
A rigorous mathematical description of particle aggregation dates back more than a century (Smoluchowski, 1918). Following more recent formulations (Burd and Jackson, 2009; Jokulsdottir and Archer, 2016) and including specific representations of fragmentation and degradation, aggregate dynamics can be summarized as follows.
where N(s) is the number of aggregates in a given state-space bin, is a state variable which includes relevant aggregate attributes and the function c⋆ defines the state of a parent aggregate based on the state of both the other parent and the produced-daughter aggregate. Primary particles are produced in the mixed layer at a rate of , where qm : c represents the dry mass to carbon ratio, and the second term is the time and state-resolved production rate of POM. That is, is the production rate of POM dry mass in the same interval of state space . Note that , i.e. the integral over all state space.
The aggregation process is captured by the following two terms and relies both on the encounter kernel of two particles, , and their stickiness, α, which defines the probability of two particles to form an aggregate once they have collided, see Appendix B. The larger an aggregate, the more prone it is to break down at a rate of ψ(s), and to be redistributed to smaller aggregates with variable excess density according to the partitioning function , see Appendix D. The next term describes loses from remineralization, which we assume occurs at a constant rate throughout the state space and removes only dry mass leading to aggregates of the same size-class but reduced excess density, see Appendix C. Finally, whether aggregates are exported out of the mixed layer, h, depends on their sinking speed, w(s).
Key variables in the model are the matrices N and M representing the number of aggregates and their total dry mass respectively within bins in discretized (x,z) state space. Suitable range choices for and , scaling factors ro [µm] and ρo [kg m−3], and logarithmic intervals δ and λ allow for a relatively complete representation of the aggregate community within computationally convenient dimensions of N and M. Total aggregate dry mass M and number density N are related by where ∘ represents piece-wise matrix product and m′ is the mean dry mass of an aggregate within each bin.
2.2 Analyses description
In the first part of the analysis, a highly seasonal environment is reproduced with a cycle of primary particle production peaking in the middle of April at 1000 mgC m−2 d−1 , Fig. 2a. To better understand the model output, given a set of parameters (see Table E1), we distribute the primary particles along the smallest size class of 1 µm and distribute them equally throughout the excess density field, Sect. 3.1. Next, we investigate the effect of remineralization, stickiness and primary particles' size/excess density characteristics on the export flux, Sect. 3.2. For this purpose, we assign the primary particles along a size range between 1 to 50 µm and distribute them equally throughout the excess density field, Fig. 2b. Regarding the latter, we simulate three scenarios based on the relative characteristics of the primary particles: (a) small and light, S + L (in grey), (b) small and dense, S + D (in green), and (c) big and dense, B + D (in purple) primary particles, as shown in Fig. 1a. Further, we investigate the effect of episodic storm events on export flux with regards to their intensity (i.e. the level of turbulent dissipation rate), their duration, and their occurrence in different times of the seasonal cycle, see Sect. 3.2.
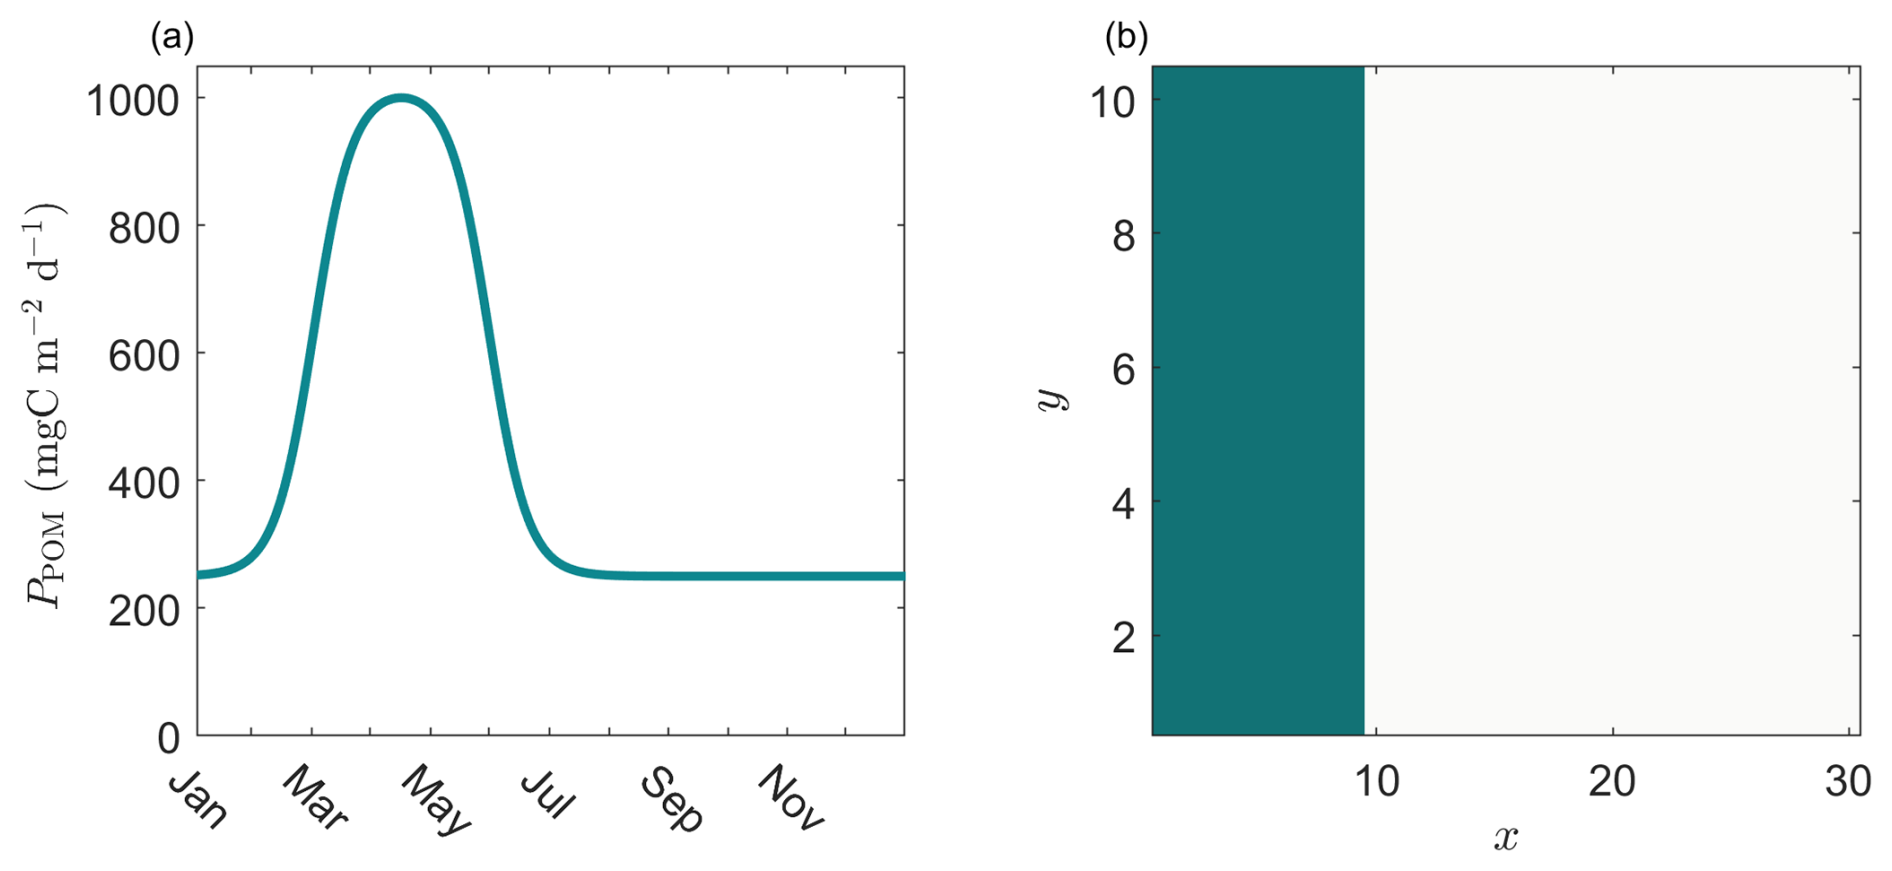
Figure 2Reconstruction of (a) a simple annual production cycle of primary particles peaking in middle April, (b) which are assigned to a size range between 1–50 µm and are equally distributed throughout the excess density space. x is the logarithmic scaling factor of aggregate size, y is the stretched logarithmic scaling factor of excess density (see Eq. 2). This scenario is the base for the results in Sect. 3.2, 3.3 and 3.1 with the exception that in the latter analysis only primary particles of size 1 µm are produced in this case study.
In the second part of the analysis, a unicellular plankton community in the north Atlantic is replicated where a strong “spring bloom” and a weaker “autumn bloom” are observed. In this case, we distinguish between primary particles that originate from diatoms and the rest of the unicellular organisms (i.e. bacteria, phytoplankton, heterotrophic microzooplankton and mixotrophs). For simplicity, we term the latter as generalists (Cadier et al., 2020; Serra-Pompei et al., 2020), Fig. 3a. In the beginning of the “spring bloom”, the optimal light, temperature and stratification conditions, as well as the high availability of nutrients, give a competitive advantage to diatoms. They grow faster until a point where nutrients (especially silicate) become limited and the rest of the unicellular organisms take over as their smaller sizes enables them to take up nutrients more efficiently at low concentrations. The same pattern but in lesser magnitude is reproduced in the case of the “autumn bloom”. It is important to mention that, in the context of this project, in the seasonally stratified scenario only the turbulent dissipation rates varies with time, while the mixed layer depth remains constant at 100 m throughout the annual cycle in all simulations. Regarding the distribution of the primary particles in the 2-dimensional space, we assume that when an organism dies it produces POM of the same size. Diatoms' radius ranges between 3.2 and 50.6 µm, whereas the rest of the unicellular organisms' radius varies between 1 and 32 µm. Moreover, based on the fact that diatoms posses a silica shell and their excess density is higher than the rest of the unicellular community, we distribute the primary particles originating from diatoms in the upper half of the excess density space while primary particles introduced by the rest of the unicellular organisms are equally allocated throughout the full length of the excess density space, Fig. 3b. Finally, we investigate how the mixing conditions in the upper 100 m of this environment affect the transformative processes of POM (namely aggregation and fragmentation) and the resulting carbon export. This is accomplished by focusing on the turbulent dissipation rate through two scenarios: one with high seasonal variability and a second scenario with a relatively constant rate, Fig. 3c. In both scenarios, the mixed layer depth is not affected by these changes and stays constant at 100 m in time.
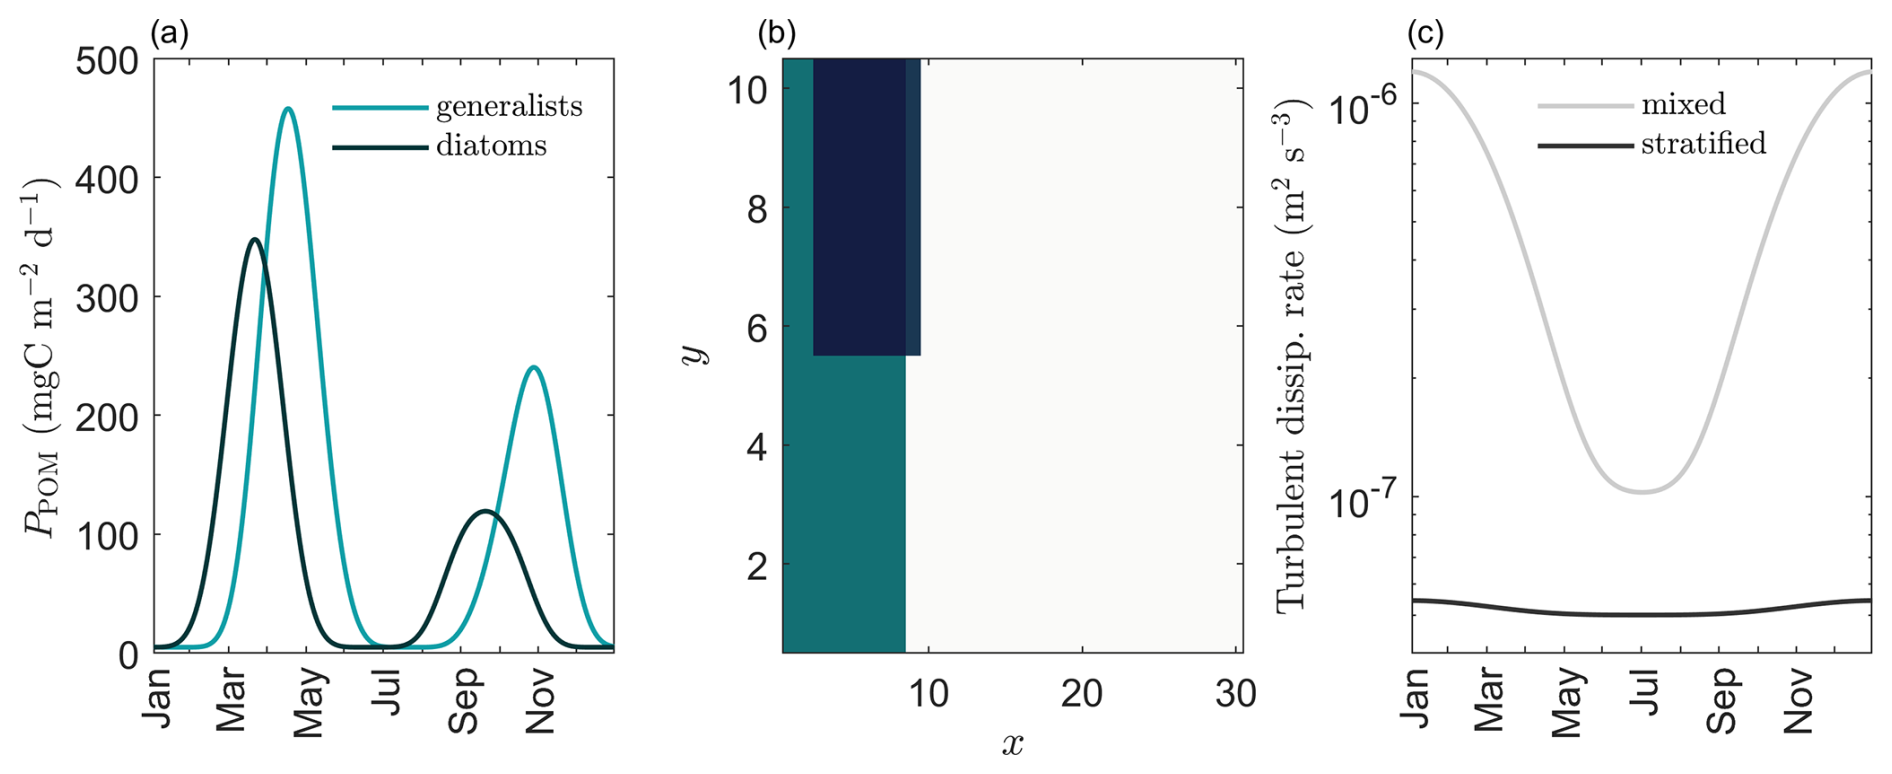
Figure 3Reconstruction of an idealized ecosystem in the north Atlantic with primary materials originating from two functional groups, i.e., diatoms and generalists, used for the analysis in Sect. 3.3. (a) The annual cycle is characterized by two distinct “bloom” periods where new material enter the system, (b) primary particles originating from diatoms are assigned to larger size bins and are equally distributed to higher excess density ranges compared to generalists (x is the logarithmic scaling factor of aggregate size, y is the stretched logarithmic scaling factor of excess density, see Eq. 2), (c) two scenarios were used to represent the stratification conditions of the system: a highly seasonally-mixed and a stratified throughout the year. Both scenarios are based on a well-mixed, vertically uniform water column layer with a constant depth of 100 m, where the turbulent dissipation rate is constant in depth but variable in time.
Throughout this analysis, three different annotations are used to describe the export flux (mgC m−2 d−1): f100 refers to the density integrated export flux (Eq. 5), F100 is the size and excess density integrated export flux in each point in time (Eq. 6) and Ftot is the total, annually integrated export flux.
where mdry is the total dry mass concentration (mgC m−3) and w is the sinking velocity (m d−1). Finally, following (Laufkötter et al., 2016) we define instantaneous s-ratio as the fraction of the size and excess density integrated export of material in each time (F100) to the production of new, primary particles (PPOM) in that time:
3.1 Model analysis
In the first part of the results, the analysis on a simple seasonal cycle with primary particles of radius 1 µm produced in the upper mixed layer (see Sect. 2.2) is presented. Figure 4a shows how both the production of new material (PPOM) and the export flux (F100) evolve in time, as well as illustrates the relationship between them expressed as the instantaneous s-ratio. A time-lag of 68 d between the peaks of PPOM and F100 is observed, while the s-ratio fluctuates between 0.001 and 0.65.
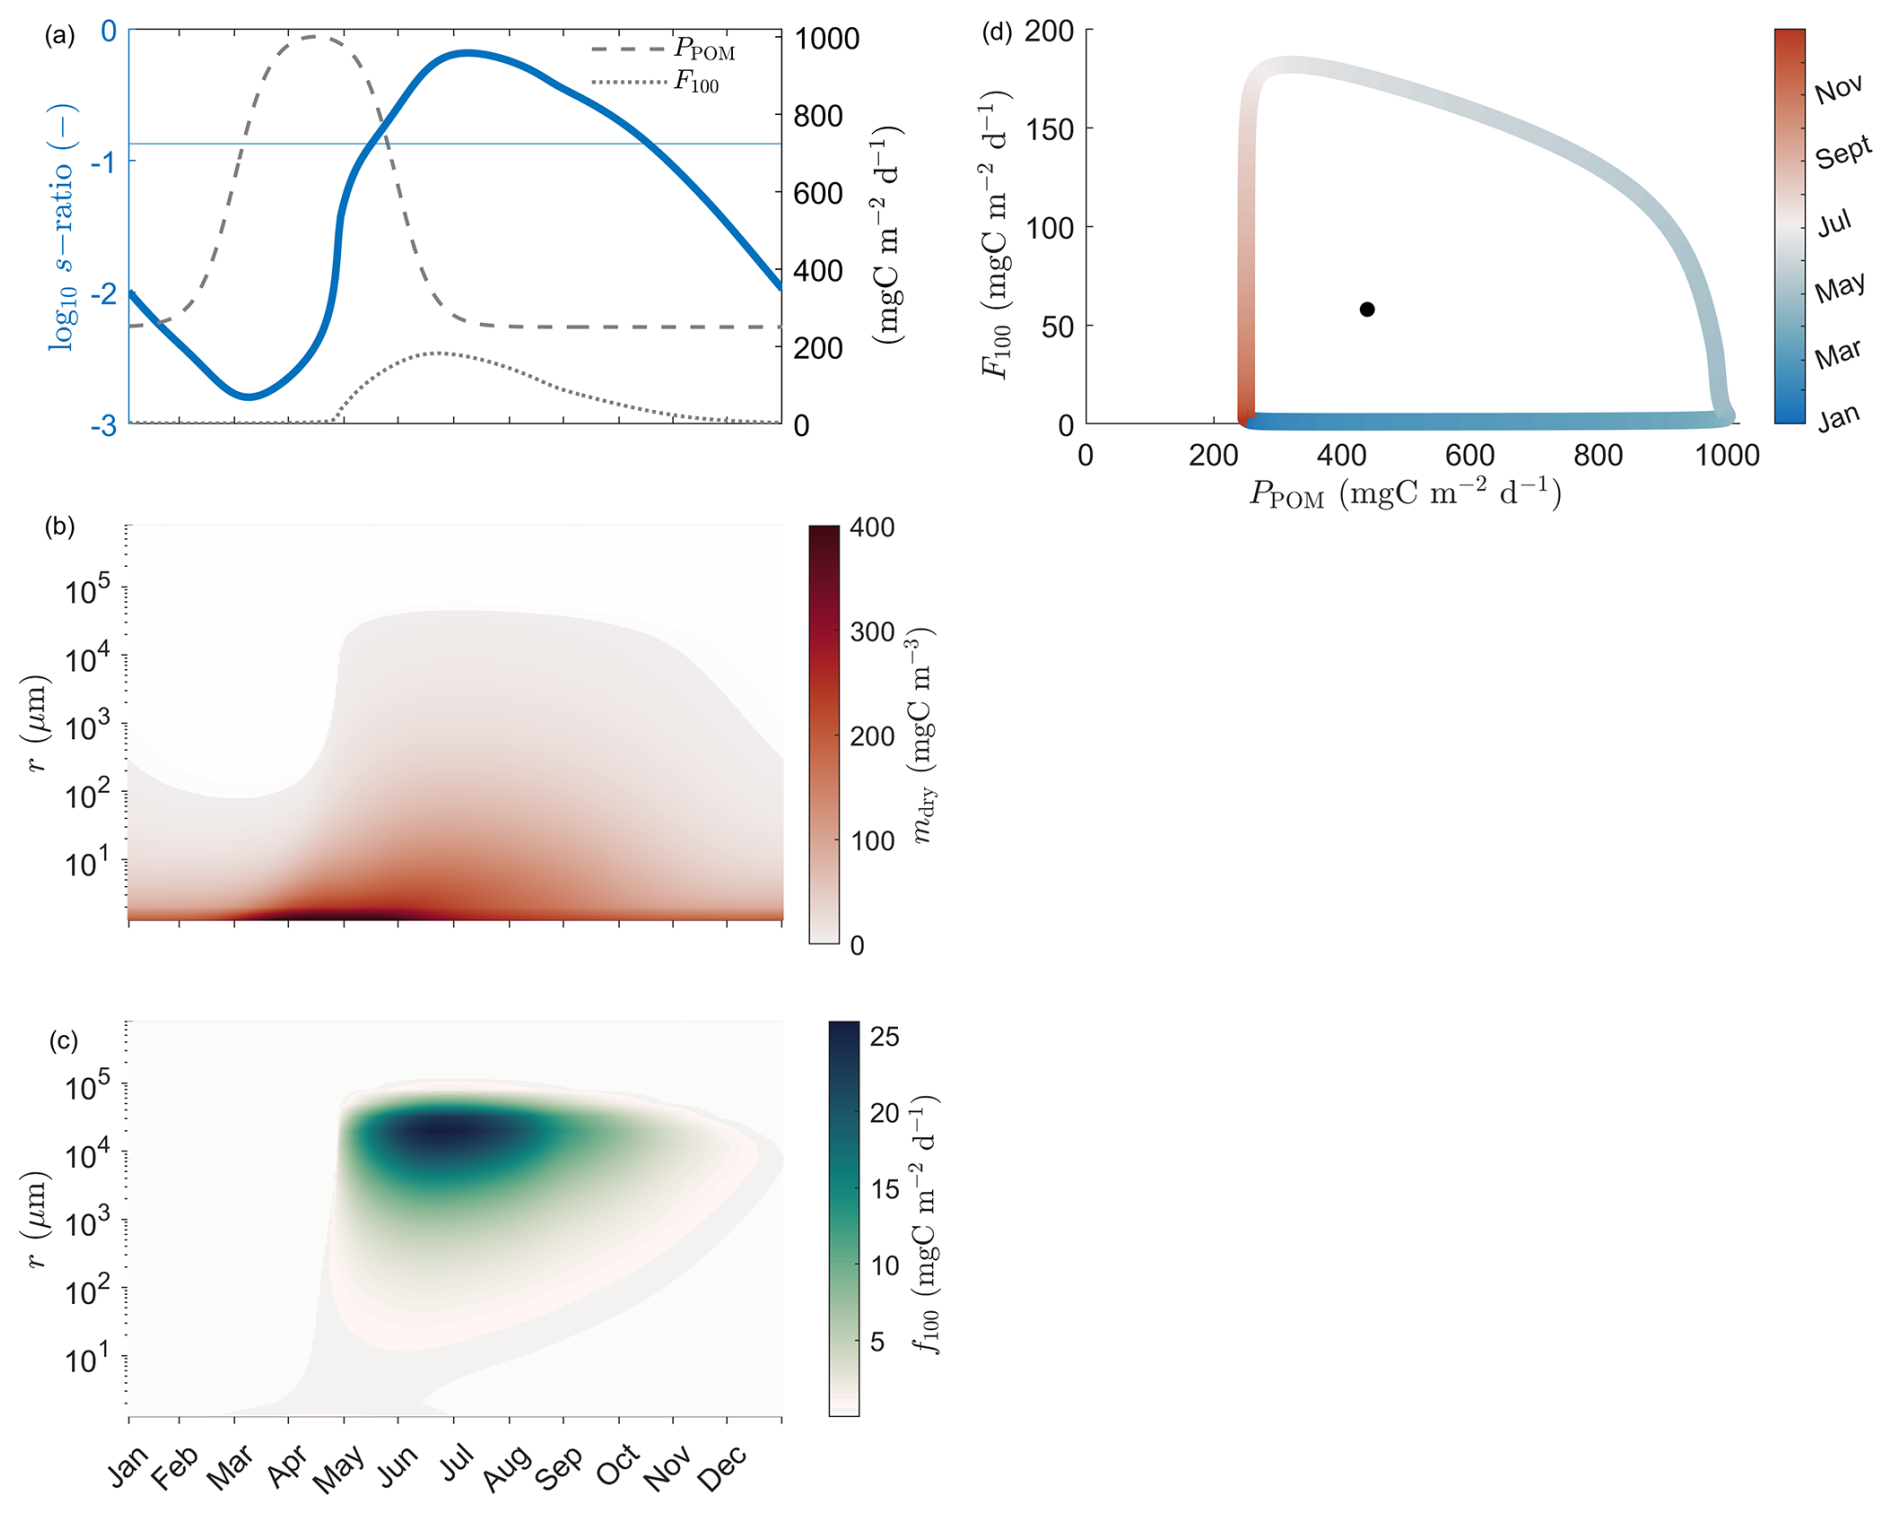
Figure 4A simple annual cycle where the smallest size-class (1 µm) primary particles with variable excess densities are produced in the mixed layer. (a) The progression of the production (PPOM), total export flux (F100) and instantaneous s-ratio in time (blue solid line), (b) the distribution of dry mass in the size-spectrum in each time-step, (c) the annual evolution of the density-integrated export flux, (f100), and (d) the system-characteristic phase diagram where the total export flux (F100) in time is plotted against the POM production (PPOM). The black dot in (d) highlights the annual mean export flux and production resulting in an annual mean s-ratio of 0.13.
During the first four months of the annual cycle, there is an accumulation of primary particles and production of small proto-aggregates in the system, Fig. 4b. This does not yet lead to a strong export event which can be explained by the fact that these first aggregates are small, in the range of 1 to 200 µm, and sink very slowly. However, there is a distinct shift in the size-spectrum of the dry mass in the system where aggregates with almost five orders of magnitude of difference in their size range are created, Fig. 4b. This implies that there is a critical concentration of mass at which the aggregation process becomes the main transformative force, producing aggregates of variable, bigger sizes and excess density which in turn are able to support the following strong export event, Fig. 4c, peaking at a total of 182 mgC m−2 d−1.
Finally, the phase diagram in Fig. 4d highlights the strong non-linear relationship between the production of new material and the resulting export flux. The black dot indicates the annual mean fluxes of production and export which results in an annual mean s-ratio of 0.13.
3.2 Sensitivity analysis
In the second part of the analysis of this system, a set of sensitivity analysis on three parameters; remineralization, stickiness and size/excess density characteristics of primary particles, is presented, Fig. 5. Figure 5a, b show the effect of remineralization on the export flux and its emergent size-spectrum, respectively. The higher the remineralization rate, the less material stays in the system over time to later being transformed through aggregation, fragmentation, remineralization. This is directly reflected on the magnitude of the resulting export flux. Higher remineralization rates result in weaker export flux as reflected in the phase-diagram, the annual mean s-ratios in Table 1 and the annually integrated export fluxes in the enclosed graph in Fig. 5b.
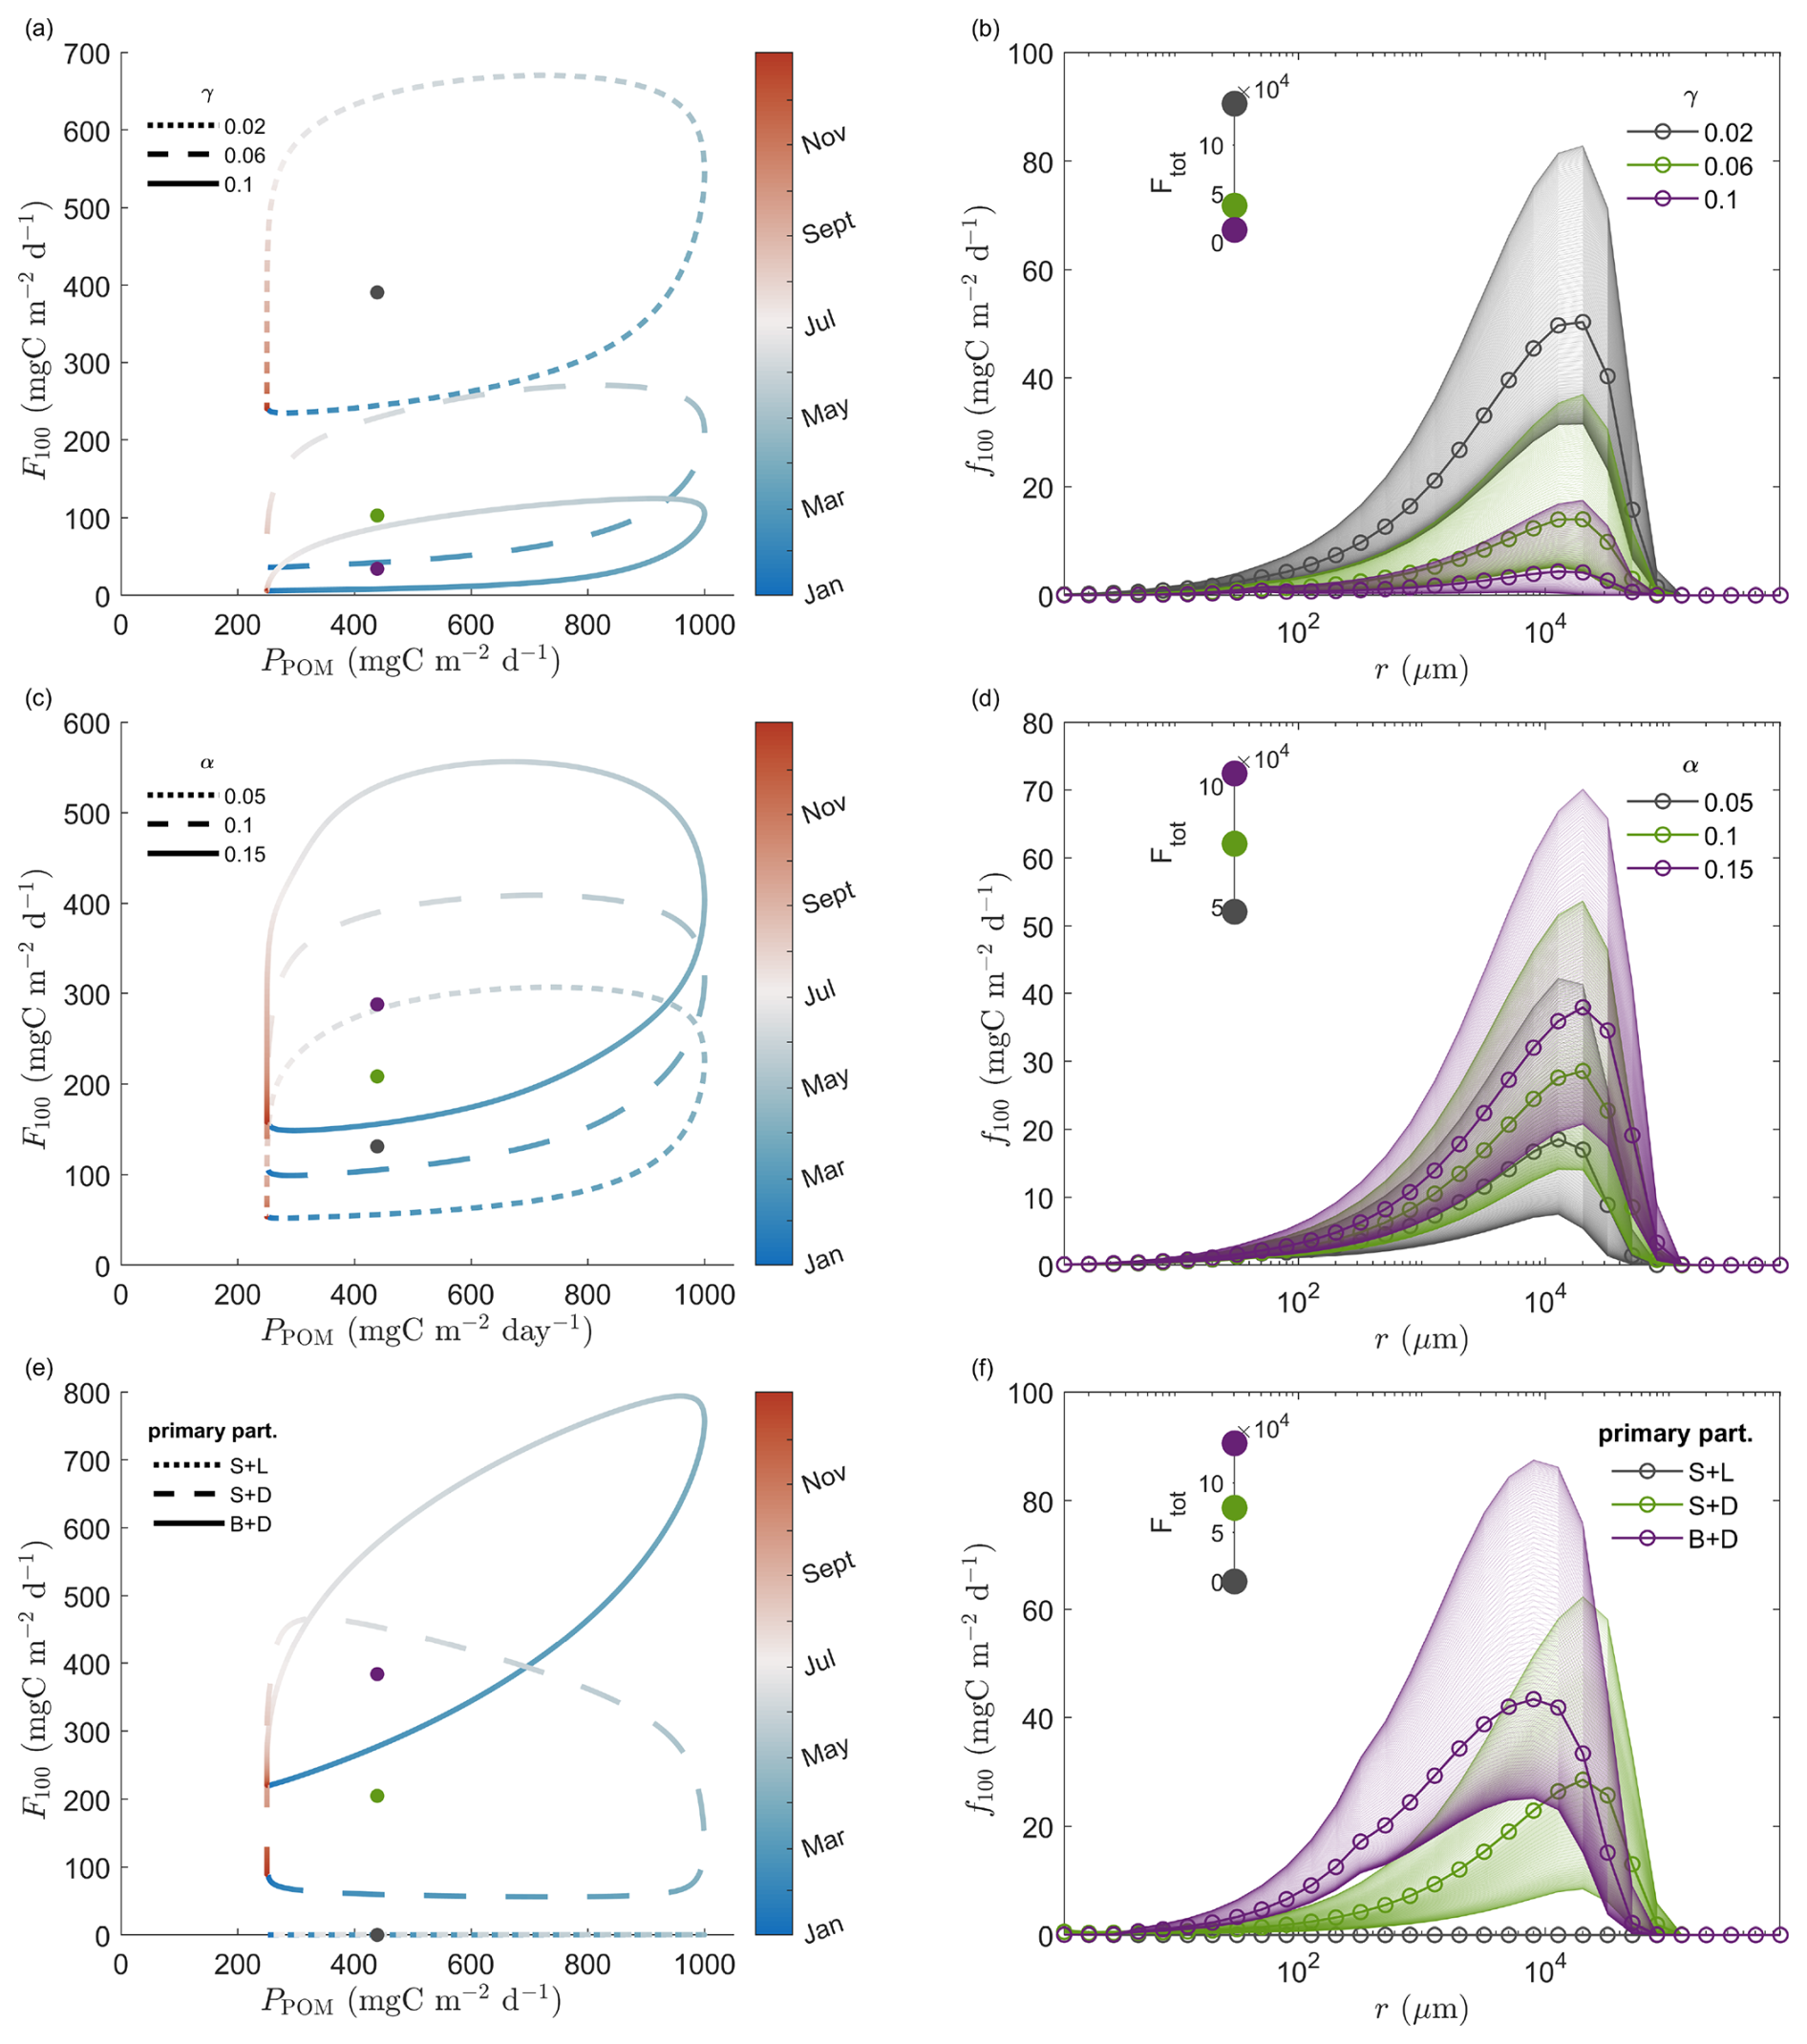
Figure 5Phase diagram (a, c, e) and density-integrated export flux (f100) (b, d, f) for a range of different (a, b) remineralization rates γ (day−1), (c, d) stickiness α (–) and (e, f) size excess density characteristics of the primary particles (S + L refers to small and light, S + D to small and dense and B + D to big and dense). The dots denote the annual mean export flux and production for each scenario. Regarding the density integrated export flux figures, the shadings represent the annual variability, whereas the lines with the circle marks are the annual mean values. The enclosed figures in (b), (d), (g) show the annually integrated export flux (mgC m−2 yr−1) for each scenario.
Table 1Annual mean s-ratios for different remineralization and stickiness values and primary particles characterstics
The stickiness of aggregates affects export flux in a reversed way compared to remineralization, Fig. 5c, d. The annual mean s-ratio increases with increasing stickiness, Table 1, which can be related to the effectiveness of the system to export carbon out of the mixed layer. In all cases, the dominant size classes of the resulting size spectrum are around 104 µm with the difference that higher stickiness results in higher variability in export during the annual cycle, Fig. 5d.
The size/excess density characteristics of the primary particles also play a crucial role in the development of the export flux over time, Fig. 5e, f. Our analysis shows that big and dense primary particles (B + D) lead to the highest total export flux annually, resulting in an annual mean s-ratio of 0.87, Table 1. Moreover, the phase-diagram indicates that once these B + D primary are produced, they are either exported immediately or very quickly form bigger (fast-sinking) aggregates. However, in the case of small and dense (S + D) primary particles, there is a time-lag of approximately 60 d between the start of the production cycle and the increase in export flux. Comparing these two scenarios, a system with B + D primary reaches its peak export flux earlier in the year (day 125 compared to day 171 for the S + D scenario), and its size-spectrum is dominated by smaller aggregates, Fig. 5f. Finally, small and light (S + L) primary particles cannot support significant export flux, as the majority of the production is lost due to remineralization before reaching the critical mass concentration and form faster-sinking aggregates.
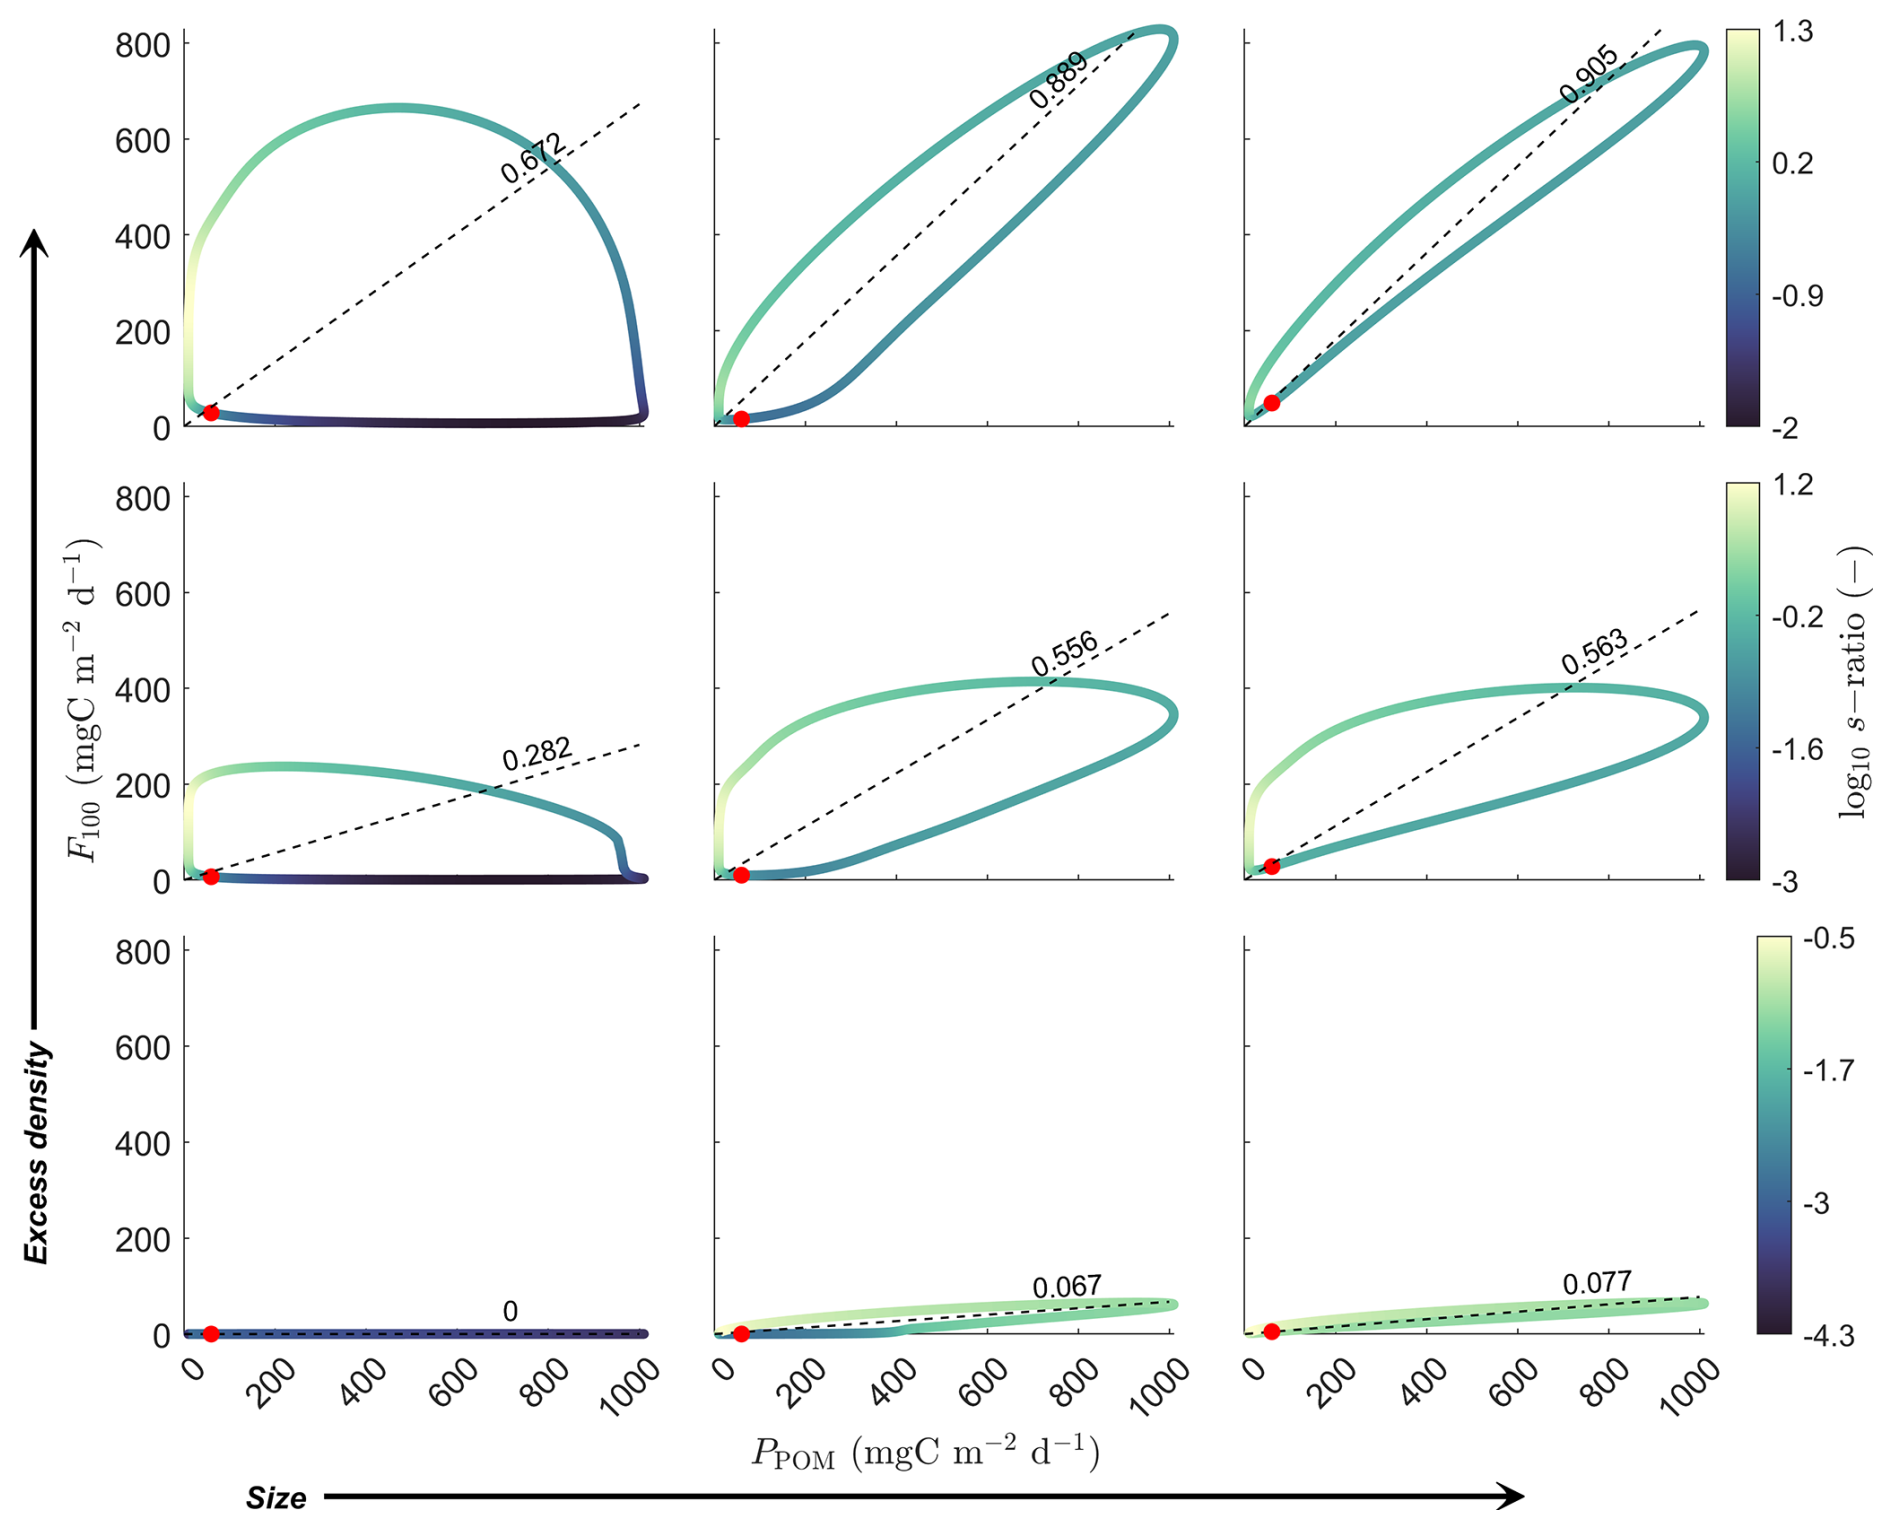
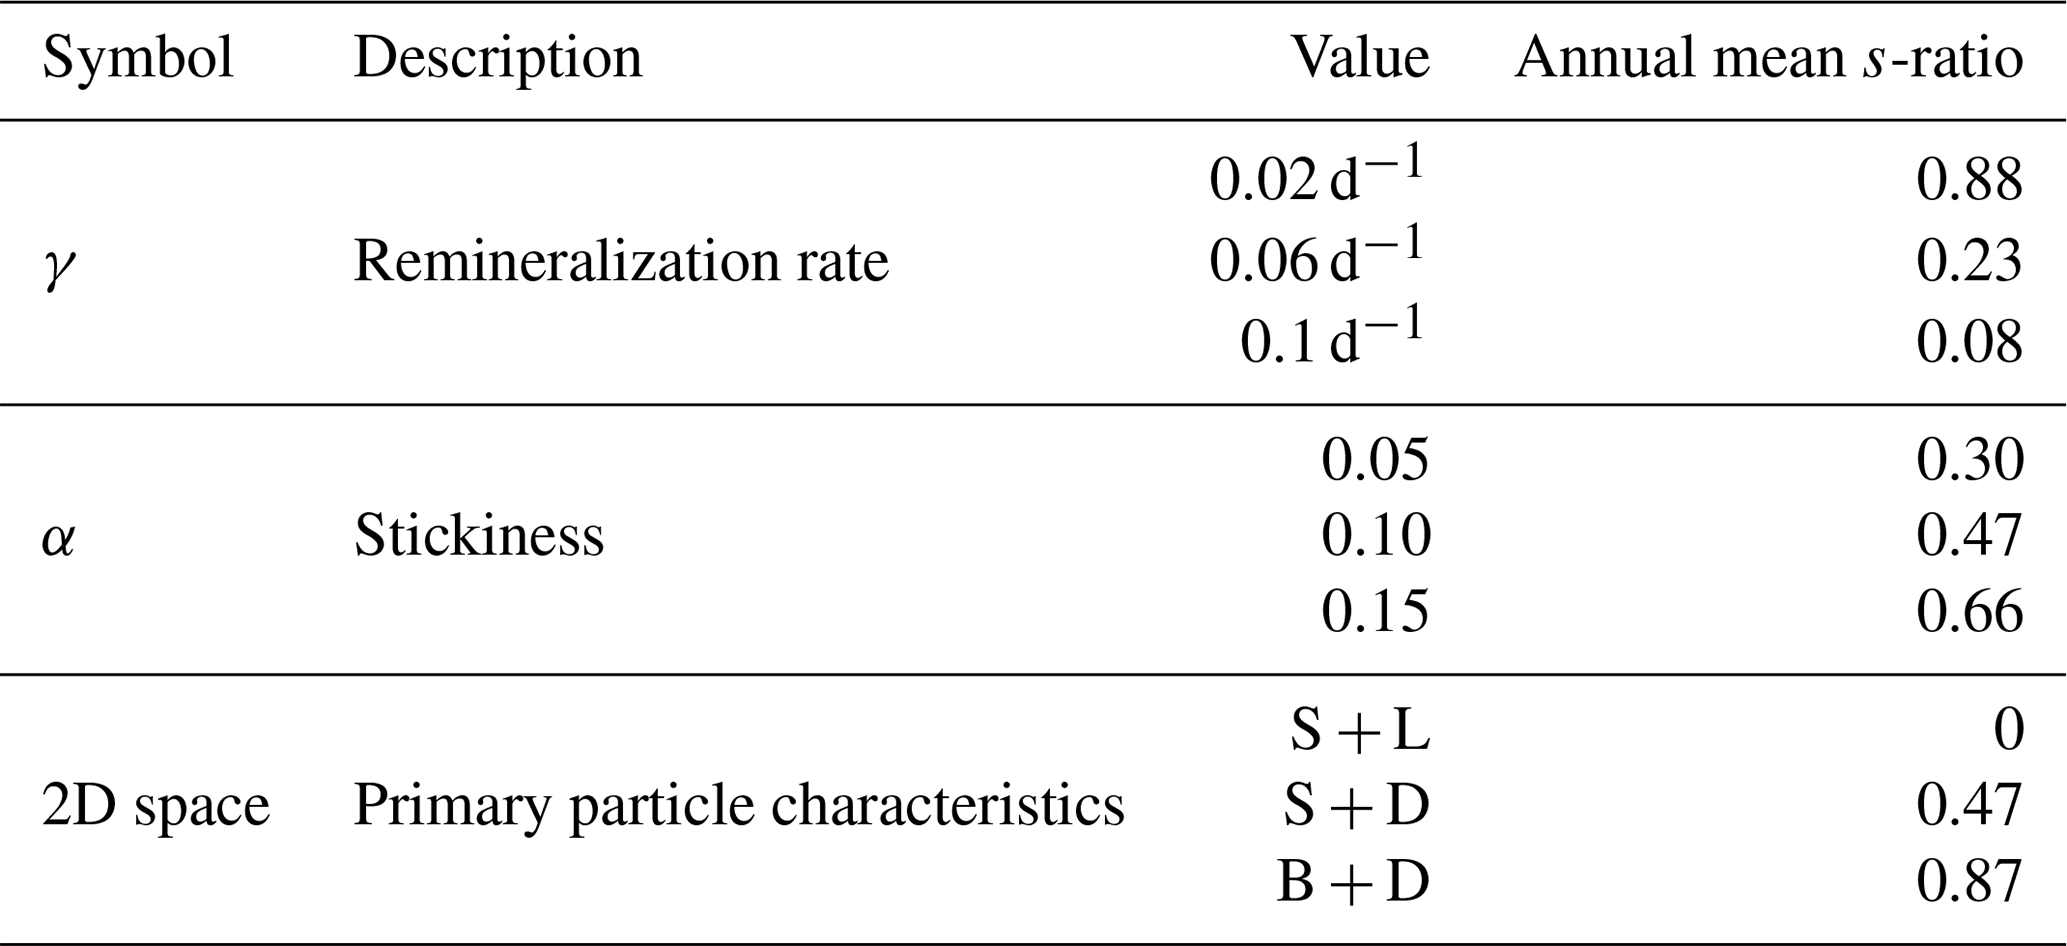
Figure 6Representation of the effect of the size and excess density of the primary particles on the export efficiency of the system. F100 is the total export flux and PPOM is the production of new (primary) particles in the system. The loop (phase diagram) shows the annual cycle of the system. The red dot denotes the start of cycle (1 January) and the loop progresses anti-clockwise. The three simulated sizes (radius) are 1.27, 31.9 and 801.4 µm. Given these sizes, the respective examined excess densities are [1.6 10.2 64], [0.06 0.4 2.6] and [0.002 0.02 0.1] kg m−3. The slope of the dotted lines (see values) indicate the annual mean ratio of F100 to PPOM (s-ratio).
Figure 6 presents the effect of the characteristics of the primary particles, e.g. size and excess density, in a systematic way. As one would expect, a combination of larger and heavier primary particles leads to the highest export efficiency among all scenarios. In this case, primary particles can either sink fast in their one or form even faster-sinking aggregates in a short time period, which in both cases minimizes the losses due to remineralization. In the other extreme, small and light primary particles need a lot of time to form larger, fast-sinking aggregates. During this period, remineralization is the dominant transformative process, removing material from the system in a fast rate and hence minimizing its export efficiency. An interesting insight of this analysis is that, given a specific size of primary particles, increasing their excess density level has a significant and positive impact on the system's export efficiency. However, given a specific excess density level of primary particles, the effect of increasing size is suggested to plateau faster. This figure also showcases how responsive the export flux is to the primary particle production, which is reflected both in the shape of the phase diagram and the range of the instantaneous ratio of export flux to the production of primary particles (see the colorbar). For example, focusing on the case of the highest excess density of 63 kg m−3 but the smallest primary particles, there is a great mismatch between production and export with the highest s-ratio values recorded at the end of the production cycle.
3.3 The effect of turbulence
Turbulence is another important variable as it is involved in both the aggregation and fragmentation processes. Higher turbulence, on the one hand, increases the encounter rate of two particles and, on the other hand, it makes large aggregates more vulnerable to break down into smaller aggregates of variable excess density. Sudden and strong storm events have the potential to mix the water column and increase its turbulence levels. Figure 7 attempts to simulate such storms varying both their duration and intensity. Figure 7a shows that the longer the duration of the storm (at the peak of the primary particle production), the stronger the export flux, with the effect being more pronounced for higher turbulent dissipation rates in each scenario. When comparing these scenarios, we can also identify a distinct shift around August. Before that point, the longer storm events produce the stronger export flux whereas the opposite pattern is observed (even though it is less pronounced) after this point. This might be an indication that these strong episodic events, by removing large amounts of material out of the mixed layer, inhibit the system maintaining the critical mass concentration needed for aggregation in the following months. On the other hand, a system with a more conservative and steady behavior keeps its material in the system for longer time, where even though a part of it is lost through remineralization, the remaining material keeps being repackaged into bigger aggregates. This can be better visualized in Fig. 7b where during a 14 d storm event in early September, the scenario of 1 d storm event in spring responses more strongly to increased turbulence. An interesting behavior of the system is observed during the second storm event in Fig. 7b, where at the beginning of the storm the export flux decreases before rising in a steep slope to reach its peak. This implies that fragmentation is at first the dominant process, filling the system with smaller-slow sinking aggregates, but providing the necessary “fuel” for the aggregation processes later on.
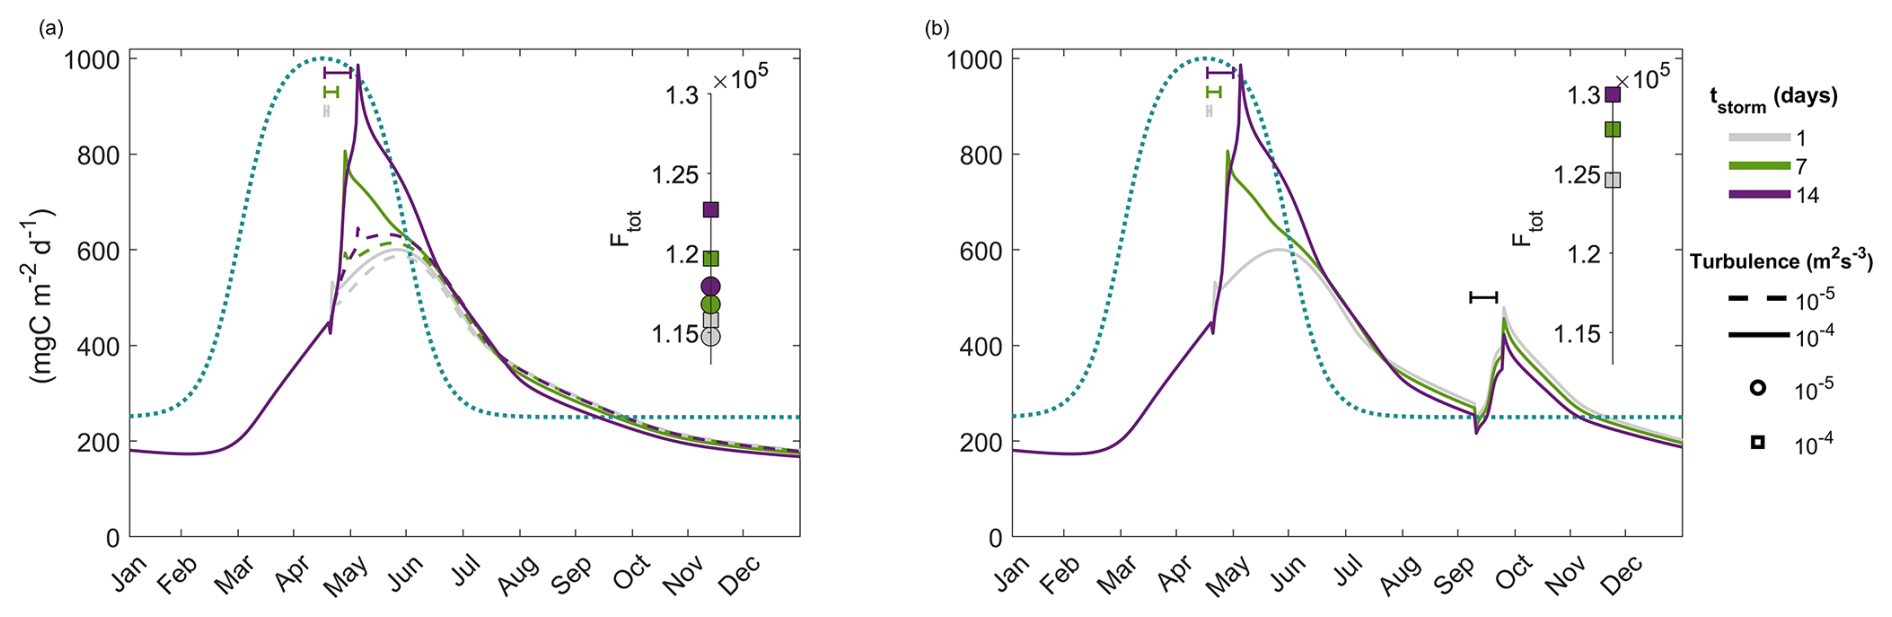
Figure 7(a) Simulation of sudden storm events of variable duration (tstorm) and intensity (reflected by the turbulent dissipation rate, ϵ). The blue-dotted line shows the POM production cycle (PPOM) whereas the colored lines demonstrate the export flux (F100) in each scenario. The enclosed graphs show the annually integrated export flux (mgC m−2 yr−1) for each scenario. The background turbulent dissipation rate is m2 s−3 and the turbulent dissipation rate of the “fall” storm event in (b) is m2 s−3 and lasts for 14 d in all scenarios.
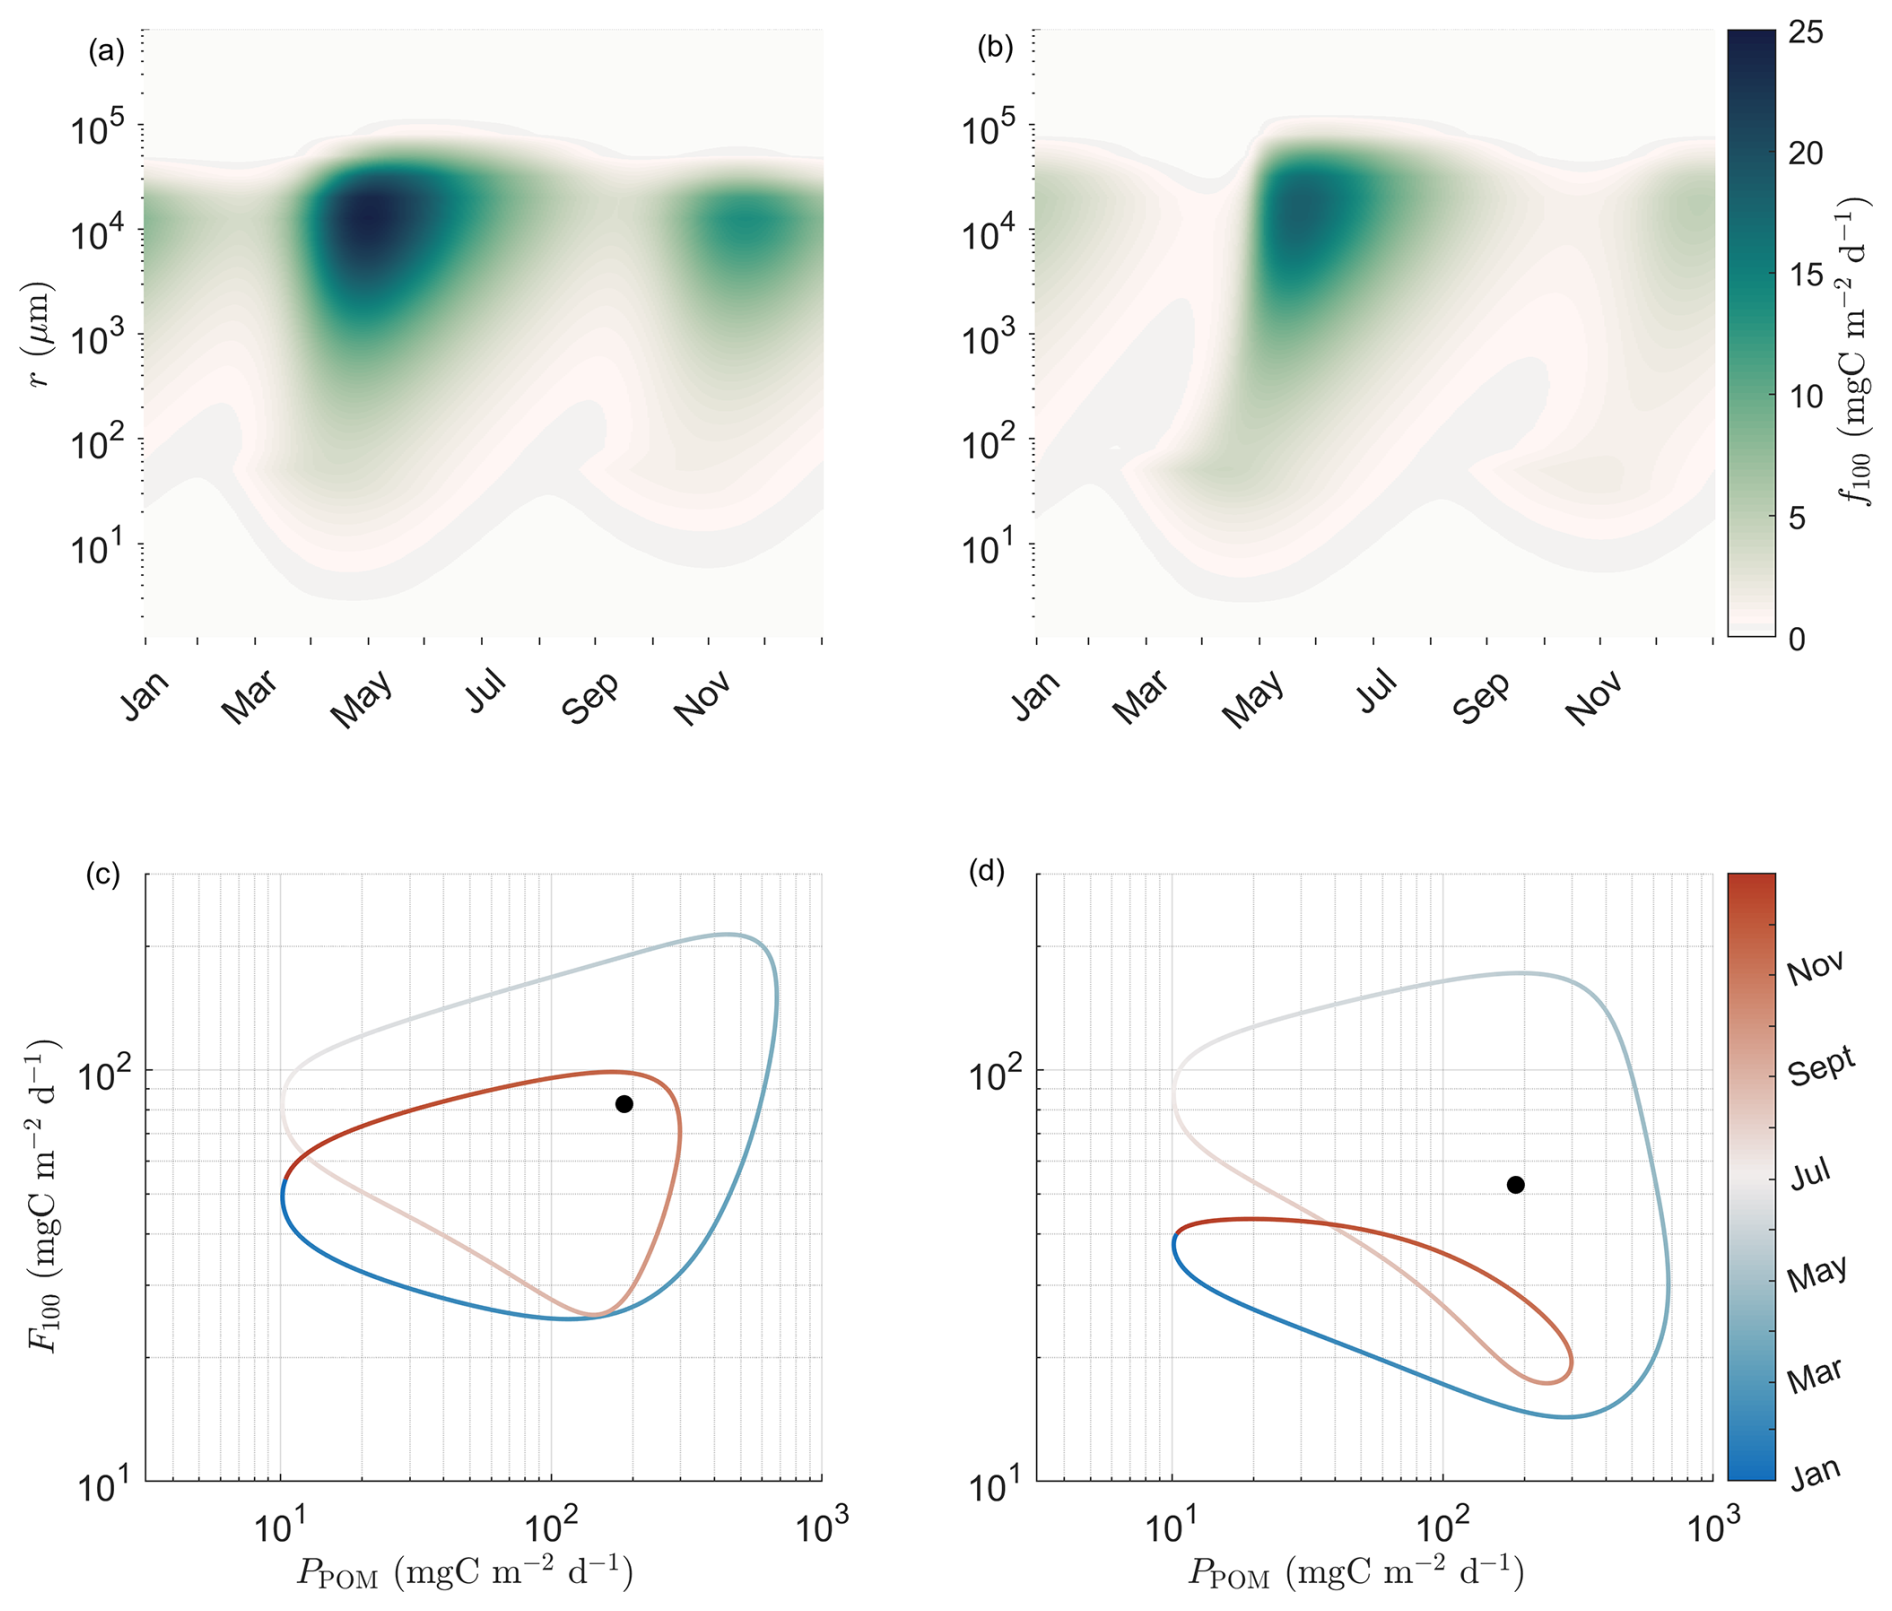
Figure 8The effect of turbulence on the export flux, as analyzed in a highly seasonal (a, c) and a rather constant turbulent environment (b, d). The idealized ecosystem reconstruction of this analysis includes two types of unicellular organisms producing primary particles of different size/excess density characteristics. The mixed layer depth is constant at 100 m in both cases and only the turbulent dissipation rate varies in time as indicated in Sect. 2.2 and Fig. 3a, b present the size-spectrum of export flux (density integrated flux) and (c, d) show the phase diagram with the annual mean export flux and production being denoted in the black dot for each scenario respectively.
In the final part of the analysis, the effect of turbulence in a highly seasonal environment with primary particles originating from an imitated unicellular plankton community is investigated, see Sect. 3.3. SISSOMA's output suggests that higher magnitude and variability of turbulence throughout the year leads to higher total export fluxes, i.e., 3.02×10⁴ mgC m−2 yr−1 compared to 1.92×10⁴ mgC m−2 yr−1 in the scenario of a rather steady and low turbulent dissipation rates, Fig. 8. Hence, the efficiency of the system to export the produced particles out of the mixed layer varies with an annual mean s-ratio of 0.44 in the former case and 0.28 in the latter. Higher turbulence might imply that the system possesses a lower critical mass concentration point (where aggregation boosts the creation of bigger, fast-sinking aggregates) which in turn can be reached faster. This can be observed by comparing the evolution of the export flux in time, Fig. 8a, b, where the highly seasonal system supports a stronger flux earlier in the year and hence in lower concentrations of material in the system. On the other hand, the delay observed in the low turbulence scenario leaves primary particles and slow-sinking speed aggregates suspended in the water column and exposed to remineralization which decreases the potential of the system to export that material out of the mixed layer. This can be better visualized in the phase diagram, Fig. 8c, d, where during the autumn bloom the export flux in the low turbulence scenario collapses, even though the input of new material in the system is the same for both scenarios.
SISSOMA provides a modeling framework to mechanistically describe the formation and export of aggregates out of the mixed layer. It approaches this by incorporating information about both aggregate size and excess density which are constantly transformed in this 2-dimensional state space, through three main processes, e.g., aggregation, fragmentation, remineralization, leading to their eventual sinking. The current work focused on how these processes play out over a seasonal cycle and investigated how a variety of parameters, such as remineralization rate, stickiness, size/excess density characteristics of the primary particles and turbulence, all affect the intensity and the size structure of the resulting export flux over time. The results of sensitivity analyses underscore the need for more observational and experimental studies on how microbial degradation acts on marine particles and finding a systematic way to represent how the stickiness of different sourced marine particles varies during the seasonal cycle. In addition, the importance of gaining information about the size/density characteristics of the primary particles entering the mixed layer has been uncovered. Regarding the computational cost of SISSOMA, in its current form, it is more suitable to be applied for understanding the export flux on a regional scale or testing its results against experimental setups. Future work with the help of machine learning techniques may help us to generalize SISSOMA's architecture, which could enable its use in global biogeochemical models. This requires the deployment of SISSOMA simulations under a wide range of primary particle characteristics (size/ excess density) and parameters (such as stickiness), the relation of these results to different ecosystem types in the global ocean, and finally the acquisition of enough in situ data for training and testing the performance of the machine learning algorithm. In this direction, a generalized and computationally-light POM specialized model will enable us to more accurately describe the fate of POM in the upper mixed layer, nutrient availability dynamics and thus plankton community structure when integrated in more complex global biogeochemical models.
First, our results highlight the strong nonlinear relationship between the production and the export of material out of the mixed layer, and how these can be described and quantified via the mechanisms involved in the transformative processes. Aggregation is sensitive to the concentration of mass in the system, as our analysis has shown there is a clear transition where the formation rate of bigger aggregates accelerates rapidy, a behavior that supports the concept of “critical cell concentration” (Jackson, 1990). These larger, fast-sinking aggregates not only are exported rapidly but also avoid the high remineralization losses experienced by slower sinking aggregates. This threshold of accelerated aggregation, in turn, is dependent on the size/excess density characteristics of the primary particles, their stickiness and the prevailing turbulence in the system. In the first part of the analysis, the observed increase in export flux is very sharp and sudden which might appear strange, but it can be explained by the fact that the new-primary particles produced in the mixed layer are assigned to the smallest size-class (1 µm). In general, the rate of aggregation depends on three encounter kernels, each governed by relative aggregate motion induced by Brownian motion, turbulence and the differential settling, respectively. By assuming a constant background turbulence, the aggregation potential of small particles depends on the Brownian motion which means that the aggregation process is very slow, as the smaller the particles the lower the chances encountering each other (Burd and Jackson, 2009). During this time, material accumulates in the mixed layer at a rate determined by production and remineralization until a point where the concentration is high enough for aggregation to dominate, a process that is very sudden and accelerates rapidly. The story is different when primary particles of variable (and higher) size-classes enter the system, Sect. 3.2. In this case, both differential settling and turbulent shear contribute to a faster and more efficient encounter of primary particles or proto-aggregates which leads to a more direct response of the export flux to the introduction of new material in the mixed layer. This is also reflected on the instantaneous and annual mean s-ratios, which are tracking the different export efficiencies between the two systems. The large range of fluctuations of the instantaneous s-ratio throughout the year suggests that care should be taken when generalizing the results of short-term field expeditions. The measured efficiency of carbon export strongly depends on the sampling time and delay effects between production and export of material. In this direction, we could even use SISSOMA's modeled annual s-ratio cycle to apply corrections on the measurements and draw more representative conclusions. Overall, the size/excess density characteristics of the primary particles directly affect the mass-concentration threshold for the aggregation to become the dominant transformative process which in turn defines the observed time-lag between production and export flux. As POM is an important energy source for a wide array of organisms, especially in the mesopelagic zone, even small changes in timing might lead to a mismatch between their phenology and the availability of their food with unpredictable cascading effects (Robinson et al., 2010).
Moreover, the smaller the primary particles, the further they are from the size/ excess density ranges which can lead to a fast sinking out of the mixed layer and every time a new aggregate is formed their relative excessive density decreases (due to the inclusion of surrounding water). In a system like this, this implies that a portion of aggregates might end up becoming big but not dense enough to sink. Once these aggregates reach the size-threshold where fragmentation is dominant, the 2-dimensional state-space fills with aggregates of various sizes and excess densities. In the other extreme scenario of big and dense primary particles entering the system, this effect of fragmentation in time is not so strong. These primary particles can form aggregates which are either rapidly exported or their relatively high density fragments are repackaged and get exported in short time. Understanding these mechanisms is very important when we want to predict how shifts in the structure of the plankton community (and hence shifts in the characteristics of primary particles) will affect the export fluxes in the future, with direct consequences on the global carbon cycle and the availability of energy sources in the deeper ocean.
Our results indicate that the level of this “critical mass concentration” is also dependent on turbulence and stickiness in a way that higher values of these variables lead to a lower critical mass concentration point. This implies that even in the smallest mass concentrations, particles have higher encounter rates and stick to each other more efficiently moving mass into bigger, fast-sinking size classes. The first part of the analysis in Sect. 3.3 shows how short, episodic events of high turbulence, such as during wind storms, affect the evolution of the export flux in time and its magnitude. A strong storm event might at that specific moment enhance the export of material out of the system, however, this leads to a reduced capability of the system to export material in the following period, as their concentration in the mixed layer stays low and aggregation processes weaken. Moreover, our results indicate that the duration of these events defines the magnitude of their impact on the export flux. When comparing a highly seasonally mixed system to a stratified system (even though this was a comparison of two extreme situations with the turbulent dissipation rate varying, but the export depth being kept constant), our results motivate us to look closer into the consequences that increased stratification in deep convection regions, such as the north Atlantic, could have in their potential to export and sequester carbon. Overall, the seasonally mixed system supports a stronger export flux which comes earlier in the year, whereas the stratified scenario failed to sustain an “autumn” export event. Apart from all the above-mentioned processes, fragmentation plays its role in a way that depending on which point of the annual mixing cycle the aggregate fragments are released in the system, they can either rapidly be repackaged and exported out of the mixed layer (in the case of high turbulence) or remineralized in case the turbulence stays low for long period.
Finally, seeing holistically the export system with all three transformative processes in play, we could identify three characteristic stages, Fig. 9. First, there is a “preparation phase” where new primary particles are produced in the mixed layer, a portion of which might sink fast out of it (based on their size/excess density properties), but the rest of the material accumulates in the system. By remineralization being the dominant process, a portion of them is lost to nutrients and progressively moves into lower excess density bins. This ends when a critical mass concentration level is reached where aggregation becomes the dominant process, moving mass to larger size bins and in intermediate excess density bins compared to the “parent” particles or proto-aggregates. The stickiness, turbulence and the relative proportion of size/density primary particle characteristics all affect the behavior of the system and the critical level in which each phase takes place. It is more difficult to draw certain conclusions about the transition between the export and de-escalation phases. However, according to our understanding higher stickiness, turbulence and proportion of big/dense primary particles might lead to a shorter (but more intense) export phase draining the system out of necessary mass for aggregation to keep being a dominant transformative process. Fragmentation constantly redistributes mass to smaller size classes of various excess densities. The third and last phase starts when the mass concentration falls below the critical level. Now, aggregation and fragmentation continue to operate, but remineralization's influence increases steadily. In this way, all three transformative processes are in play, but the system is progressively occupied by lower size and importantly lower excess density material. These slower-sinking aggregates stay now suspended in the water column and most of them are lost due to remineralization, until new production comes and the cycle starts again. The timing of these events and how fast they occur in this cycle depends on both the size/excess density characteristics of the primary and the environmental conditions, as discussed above.
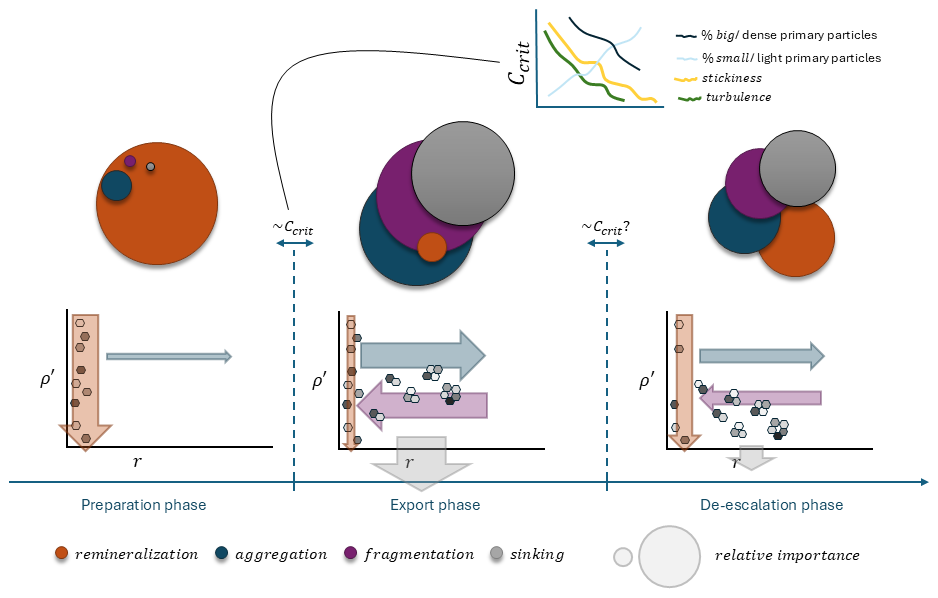
Figure 9Summary of an annual cycle of the export system as explored in SISSOMA. The width of the arrows and the radius of the circles represent the relative importance of the three transformative processes. The arrows point towards the direction where mass is forced to move by each process. Three distinct period can be identified: (1) a preparation phase where remineralization is the dominant transformative process acting on the primary particles and the small proto-aggregates, (2) the main “export phase” is established whenever the critical mass concentration, Ccrit, is reached. This depends on turbulence, stickiness and the size/ excess density characteristics of the primary particles. The inset plot shows their effect on the Ccrit in an abstract way, where the x-axis refers to a spectrum of possible values of each parameter of interest. During this period, aggregation, fragmentation and sinking out of the mixed layer are the dominant processes redistributing mass in the 2-dimensional state space and eventual exporting a big part of it, (3) when the system has exported a big portion of the material in the mixed layer (the critical mass concentration falls below a threshold) the “de-escalation” phase starts where all processes are in play until the cycle starts again.
Even though SISSOMA captures many important factors and processes related to an ecosystem's potential to export material out of the mixed layer, there are certain assumptions that need to be taken into account and improved. In its current form, remineralization removes dry mass from an aggregate in a constant rate throughout the year and moves it to lower excess density bins. SISSOMA can provide a platform for testing a variety of hypotheses on how biological, physical and chemical factors, as well as the aggregates' properties all affect the degradation rates of the latter. Anderson et al. (2023) suggest that microbial remineralization roughens the surface area of the sinking aggregates which in turn increases the attachment area for the microbes to colonize and eventually degrade it faster than expected. In our case, the incorporation of porosity as a third state variable for the aggregate's characteristics could allow us to incorporate this information when more experimental data are set to draw a mathematical formulation of this process. Moreover, modeling the effect of ballast minerals on sinking velocities and degradation rates is crucial. Dense mineral particles, such as calcium carbonate or opal, usually become an important part of an aggregate increasing its sinking velocity. This, on the one hand, shortens the period that this newly-formed aggregate stays in the upper ocean layers where remineralization is higher. On the other hand, there is contradicting evidence that ballast minerals can create a protective layer around an aggregate, further decreasing the microbial degradation rates (Cram et al., 2018). It has also been suggested that disproportionally high ballast mineral concentrations might have totally opposite overall effect by producing more but smaller aggregates, due to the low proportion of the necessary organic matter – “glue” for keeping them together in the long run (De La Rocha et al., 2008). Finally, the way particles are moved around the 2-dimensional state space during their degradation time can be challenged, too. Contrary to the current direction of mass, one might argue that by removing the organic-light part of an aggregate, the proportion of ballast-heavy minerals inside the aggregate increases which in this case might result in heavier, fast-sinking aggregates instead.
Regarding the prevailing environmental conditions of the system, we assumed a uniformly mixed layer of constant depth throughout the year. However, the situation in nature is more variable (especially in high latitudes) with wide fluctuations in the strength of stratification and the depth of the evolved mixed layer, which might have an immediate effect on the export flux (de Boyer Montégut et al., 2004). A shallower mixed layer depth after a phytoplankton bloom, for example, might restrict the produced material into a confined area which could increase their collision rate and hence transform them into big, fast-sinking aggregates. However, rapid changes in stratification might move material out of the mixed layer, a process known as the mixed layer pump (Dall'Olmo et al., 2016), reducing the amount of material available in the mixed layer which then affects the relative strength between transformative processes.
Another relevant property to test in the model is the variable lability of the primary particles. It has been proposed that new production initiated by the input of excess nutrients, mainly in upwelling regions and deep convection areas, is labile and an easy target for the microbes which turn a big proportion of the sinking material into nutrients. In contrast, highly recycled material in the tropics and oligotrophic regions is usually refractory (Francois et al., 2002). This might imply that small, suspended material or bigger but not heavy enough aggregates remain in the system for longer periods, form aggregates of higher sinking speed and support considerable export fluxes in time. In the current SISSOMA version, the stickiness of the primary particles remains constant throughout the annual cycle. Grønning and Kiørboe (2022) showed that when certain diatom species sense the presence of copepods in their close proximity, they can quickly increase their stickiness to form big, fast sinking colonies to escape predation. Moreover, it has been suggested that during a phytoplankton bloom particles of varying stickiness are produced depending on a wide array of biological, physical and chemical conditions of the ecosystem (Baumas and Bizic, 2024). Even though we acknowledge the importance of stickiness which is also supported by our results, there is a need of further research in the topic to be able to confidently draw the appropriate mathematical framework and incorporate it in models. The above-described research areas could be approached by programming separate classes for primary particles coming from different sources, which then the model follows throughout the simulation. In this way, we could be able to know the proportions of different material in an aggregate, e.g., ballast minerals, fecal pellets, phytoplankton cells, in any time and decide more efficiently the direction of mass movement.
Last but not least, it has been suggested that the structure and phenology of the plankton community are the main factors that determine the characteristics of the export flux (Henson et al., 2019). In this direction, the next step is to couple SISSOMA with the Nutrient-Unicellular-Multicellular (NUM) model, a trait-based framework which uses first principles to model the global biogeography of the plankton community (Andersen and Visser, 2023).
In conclusion, SISSOMA provides a useful tool for mechanistically describing the seasonal cycle of carbon export flux. This framework helps us to better understand how aggregation, fragmentation and remineralization shape the emergent aggregate community in time, until their eventual export out of the mixed layer. Our results highlight the nonlinear relationship between the production of primary particles in the upper mixed layer and their export as aggregates out of it, which can be reflected on the wide fluctuations of instantaneous s-ratio throughout the annual cycle. Moreover, it has been shown how remineralization rates, stickiness, size/excess density characteristics of the primary particles and turbulence all affect both the intensity and the size-structure of the export flux. Although the theory and implementation of the aggregation processes are well established, more work needs to be done to improve the function of the fragmentation and remineralization processes in the model. This stresses the need for more, both in situ and experimental, research to be conducted, which will help us develop the appropriate mathematical framework and incorporate them into more sophisticated biogeochemical models.
SISSOMA assumes that aggregation is a geometrically self-similar process, such that the linear dimension ri∘j of an aggregate formed by the combination of two parent aggregates of linear dimension ri and rj respectively is given by:
That is, for the binary process of aggregation, ra is an additive conservative property. This is not a new idea (Jackson, 1998; Wiesner, 1992) and arises from the general observation that aggregates display fractal characteristics (Alldredge and Gotschalk, 1988; Meakin, 1987; Logan and Wilkinson, 1990). We term a the self-similarity parameter, and note a<3 in compliance with the observed increase in porosity under aggregation. In a departure from other aggregation descriptions, we do not interpret a as the fractal dimension of aggregates. Neither is it an inherent property of aggregates and we will not attempt to use a to produce scaling laws as is usual in these considerations (e.g. DeVries et al., 2014; Kriest and Evans, 1999; Cael et al., 2021). Specifcially while the self-similarity of aggregation is conserved, under the action of remineralization and fragmentation, the fractal dimension of aggregates is not a conservative property.
Under geometric self-similarity, the mass of an aggregate produced by the combination of 2 aggregates of mass mi and mj can be deduced to be the sum of these two masses, plus a bit extra due to the inclusion of some fluid (density ρw) that occupies the expanded aggregate volume (increased porosity). Specifically,
Here m is the total mass, not just the dry mass of the aggregate. It is convenient to recast this in terms of density of the aggregates, ρi, ρj, ρi∘j, and their respective volumes, vi, vj and vi∘j. It follows that excess density
That is, aggregation produces a daughter aggregate whose excess density is the volume weighted mean of the excess density of the two parent aggregates. Equations (A1) and (A3) provide an iterative computational framework that can follow the size and excess density and hence sinking speed, of aggregates as they are formed and transformed from primary particles.
Aggregation is computationally the most complex aspect of the model as it involves an off-set binary convolution of N in state space. Performing binary convolution calculations is greatly facilitated by self-similarity. Specifically, the ordinates of an aggregate produced from the combination of (xi,yi) and (xj,yj) is given by:
It follows that the combination of aggregates from any two domains of identical shape in (x,y) state space will be confined to a third identically shaped domain. The model utilizes this feature on a regular (x,y) grid in optimizing the algorithm architecture. Without loss of generality, aggregate state space can be defined in terms of transformed coordinates as
from which it follows that the binary combination of aggregates can be written as
From Eq. (B1), it can be easily shown that
where s′ is an offset in state space. This means that any bounded region in state space convolved with another bounded region of the same shape will map to a third bounded region again of the same shape. Notably, within discretized state space, aggregation from two 1×1 bins maps to a third 1×1 bin (Fig. B1).
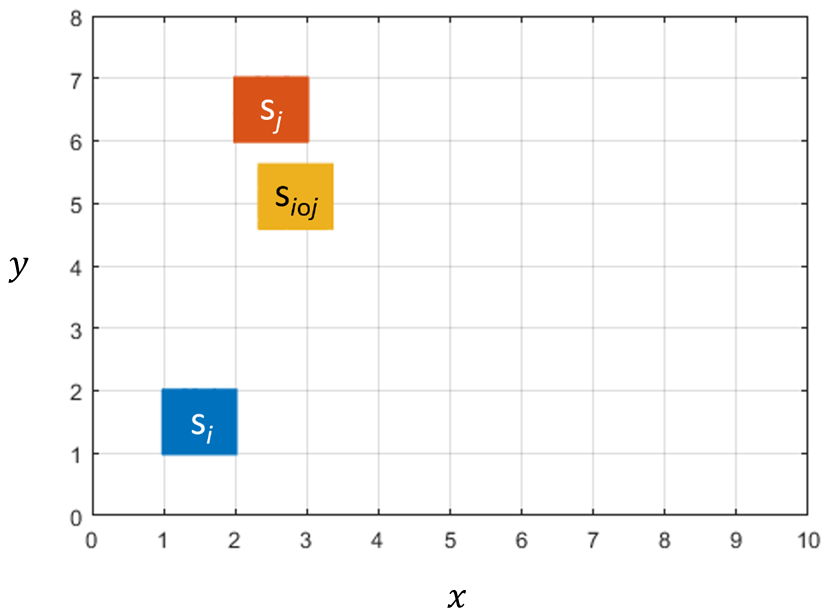
Figure B1State-space aggregation. Aggregates formed by interactions between bins si and sj will be found in the region si∘j which will span, at most 4 bins in discretized state space.
For the binary aggregation , the time rate of change of particle numbers in appropriate state space bins are given by
where
and
The total number of states s in discretized state space is L=XY, from which it follows that the number of unique binary combinations is . For a moderate 10×8 state space resolution, K=3240. Defining as an ordinate counting combinations, as an ordinate counting discrete states s, and
it follows that
Further, each ℓ can be decomposed into x,y ordinates as:
That is, each k is associated with a unique combination from which the offset ordinates for binary aggregation can be defined as in Eq. (B6). These provide a means of mapping indices for binary combinations, to state space and back. A consequence of the model architecture is that once a state space is defined, all coefficients determining the convolution process (encounter kernels β, offset indices , and partitioning functions ) are fixed. That is, these need only be calculated once, stored in vectors of length K, and referenced via a lookup map.
For any aggregate we can express its density ρ as
where p is the porosity, ρd is the density of the solid phase of the aggregate and ρw is the density of water. This leads to the expression for excess density ρ′
where we have used . The simplifying assumption we make in this work is that within a short time step, reminealization removes dry mass from the aggregate, while the overall volume of the aggregate remains invariant. The volume of dry mass that is lost, is replaced by water thus increasing aggregate porosity p. The fundamental degradation process can be written as
Writing md=vϕρd and assuming that the density of the dry mass phase remains invariant it follows that
or more succinctly
Thus, from the expression for ρ′ in terms of ordinates x,y (Eq. 2)
That is
Fragmentation is simulated simply as a rate at which aggregate mass is transported to smaller sizes classes. We implement this as an increasing function of aggregate size. Further, it is intuitively understood that fragmentation increases as turbulent stresses increase. Of the processes considered, fragmentation remains the least well constrained; aggregates appear resistant to mechanical shear (Alldredge et al., 1990), and fragmentation appears to be chiefly mediated by metazooans through handling and feeding appears to be important (Dilling and Alldredge, 2000) and by microbial “mining” and dissolution of adhesive material. We set the fragmentation rate at ψ0=0.5 d−1 for large porous aggregates, a value consistent with observations (Briggs et al., 2020). Specifically, we set
where ψ0 is the fragmentation rate, r is the radius, (1−ϕ) is an estimation of the aggregate's porosity, is the radius logarithmic interval, a is the self-similarity parameter and εc is the reference turbulence. Given the uncertainty in fragmentation processes, we choose a simple redistribution rule ( in Eq. 4) where the mass from fragmented aggregates is simply equally distributed across all smaller size classes. Specifically, the mass of fragments from is distributed equally across all bins for .
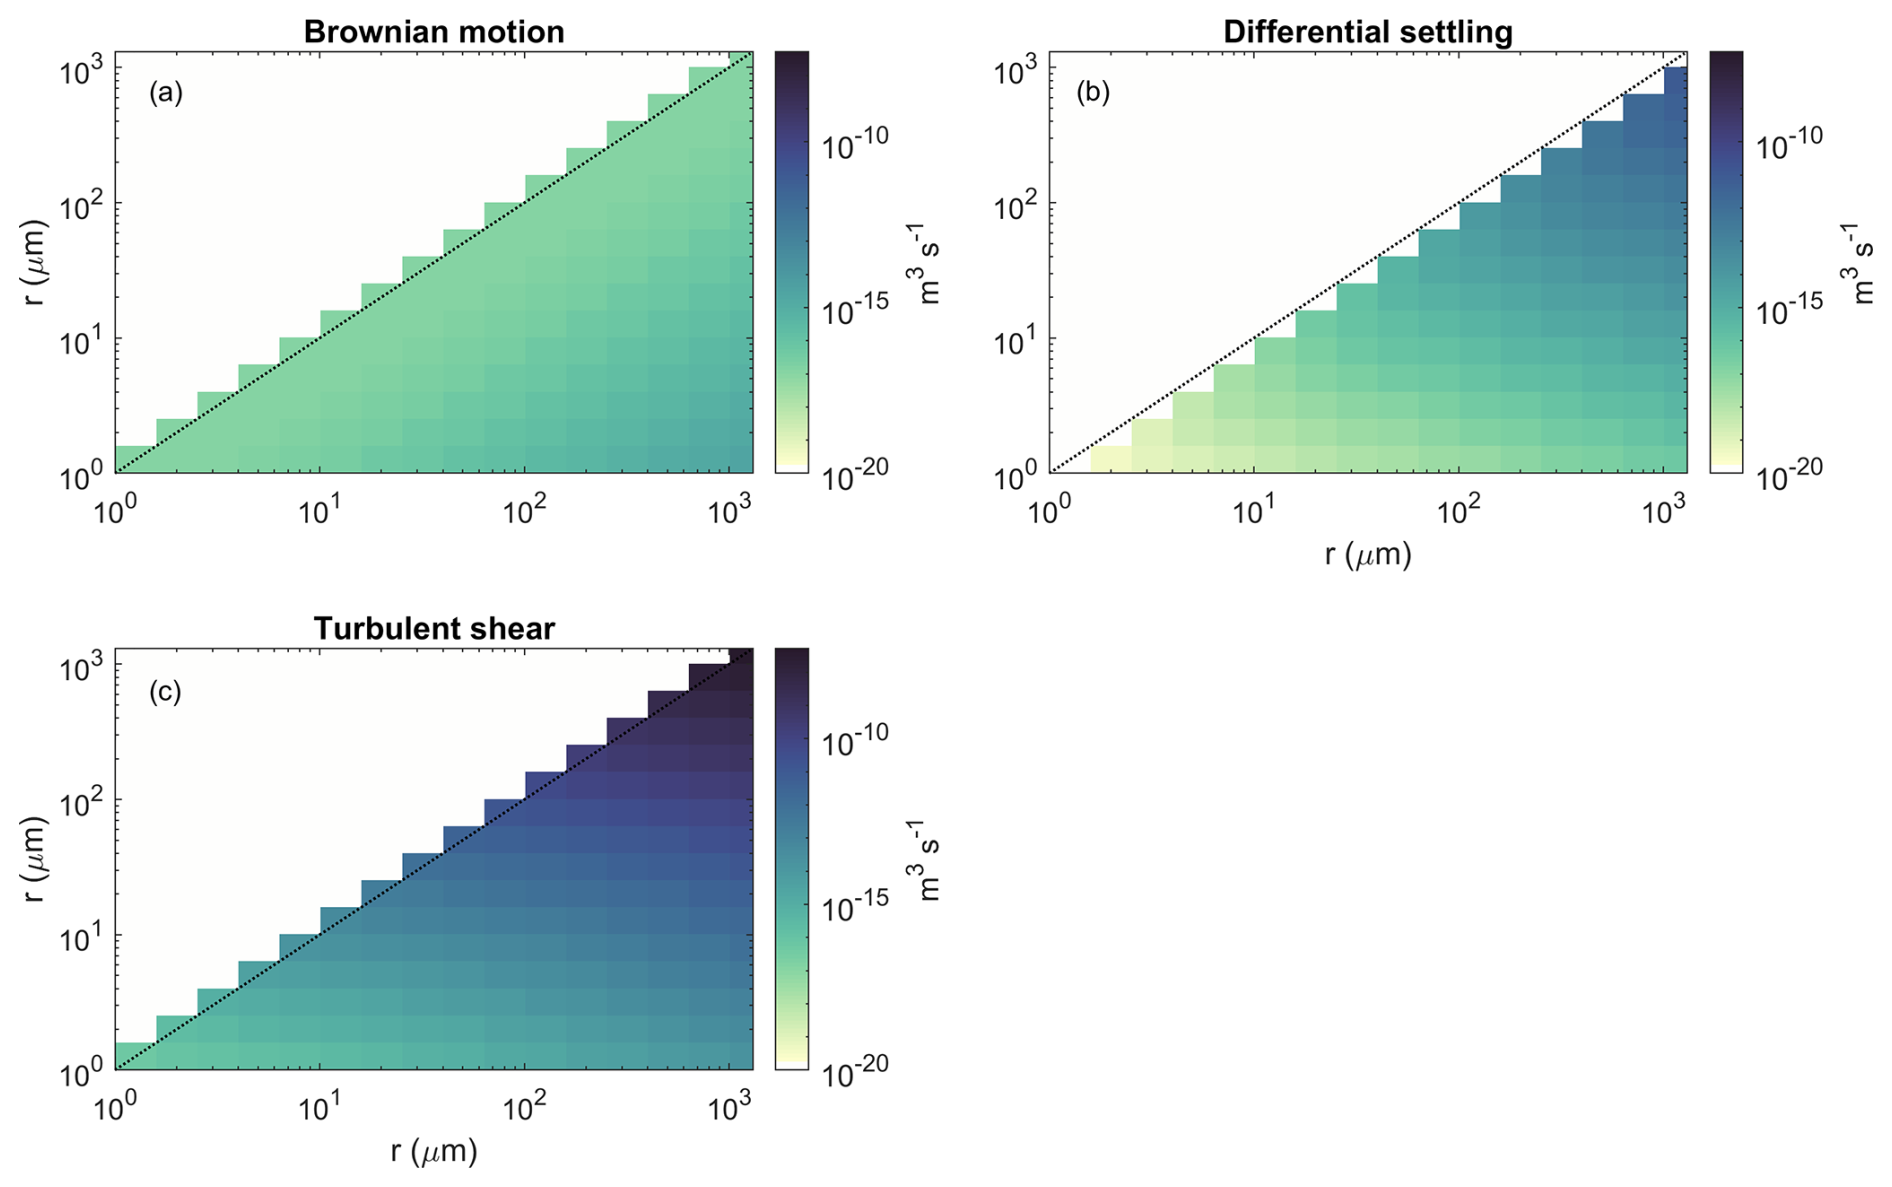
Figure E1The three components of the coagulation kernels: (a) brownian motion, (b) differential settling, and (c) turbulent shear.
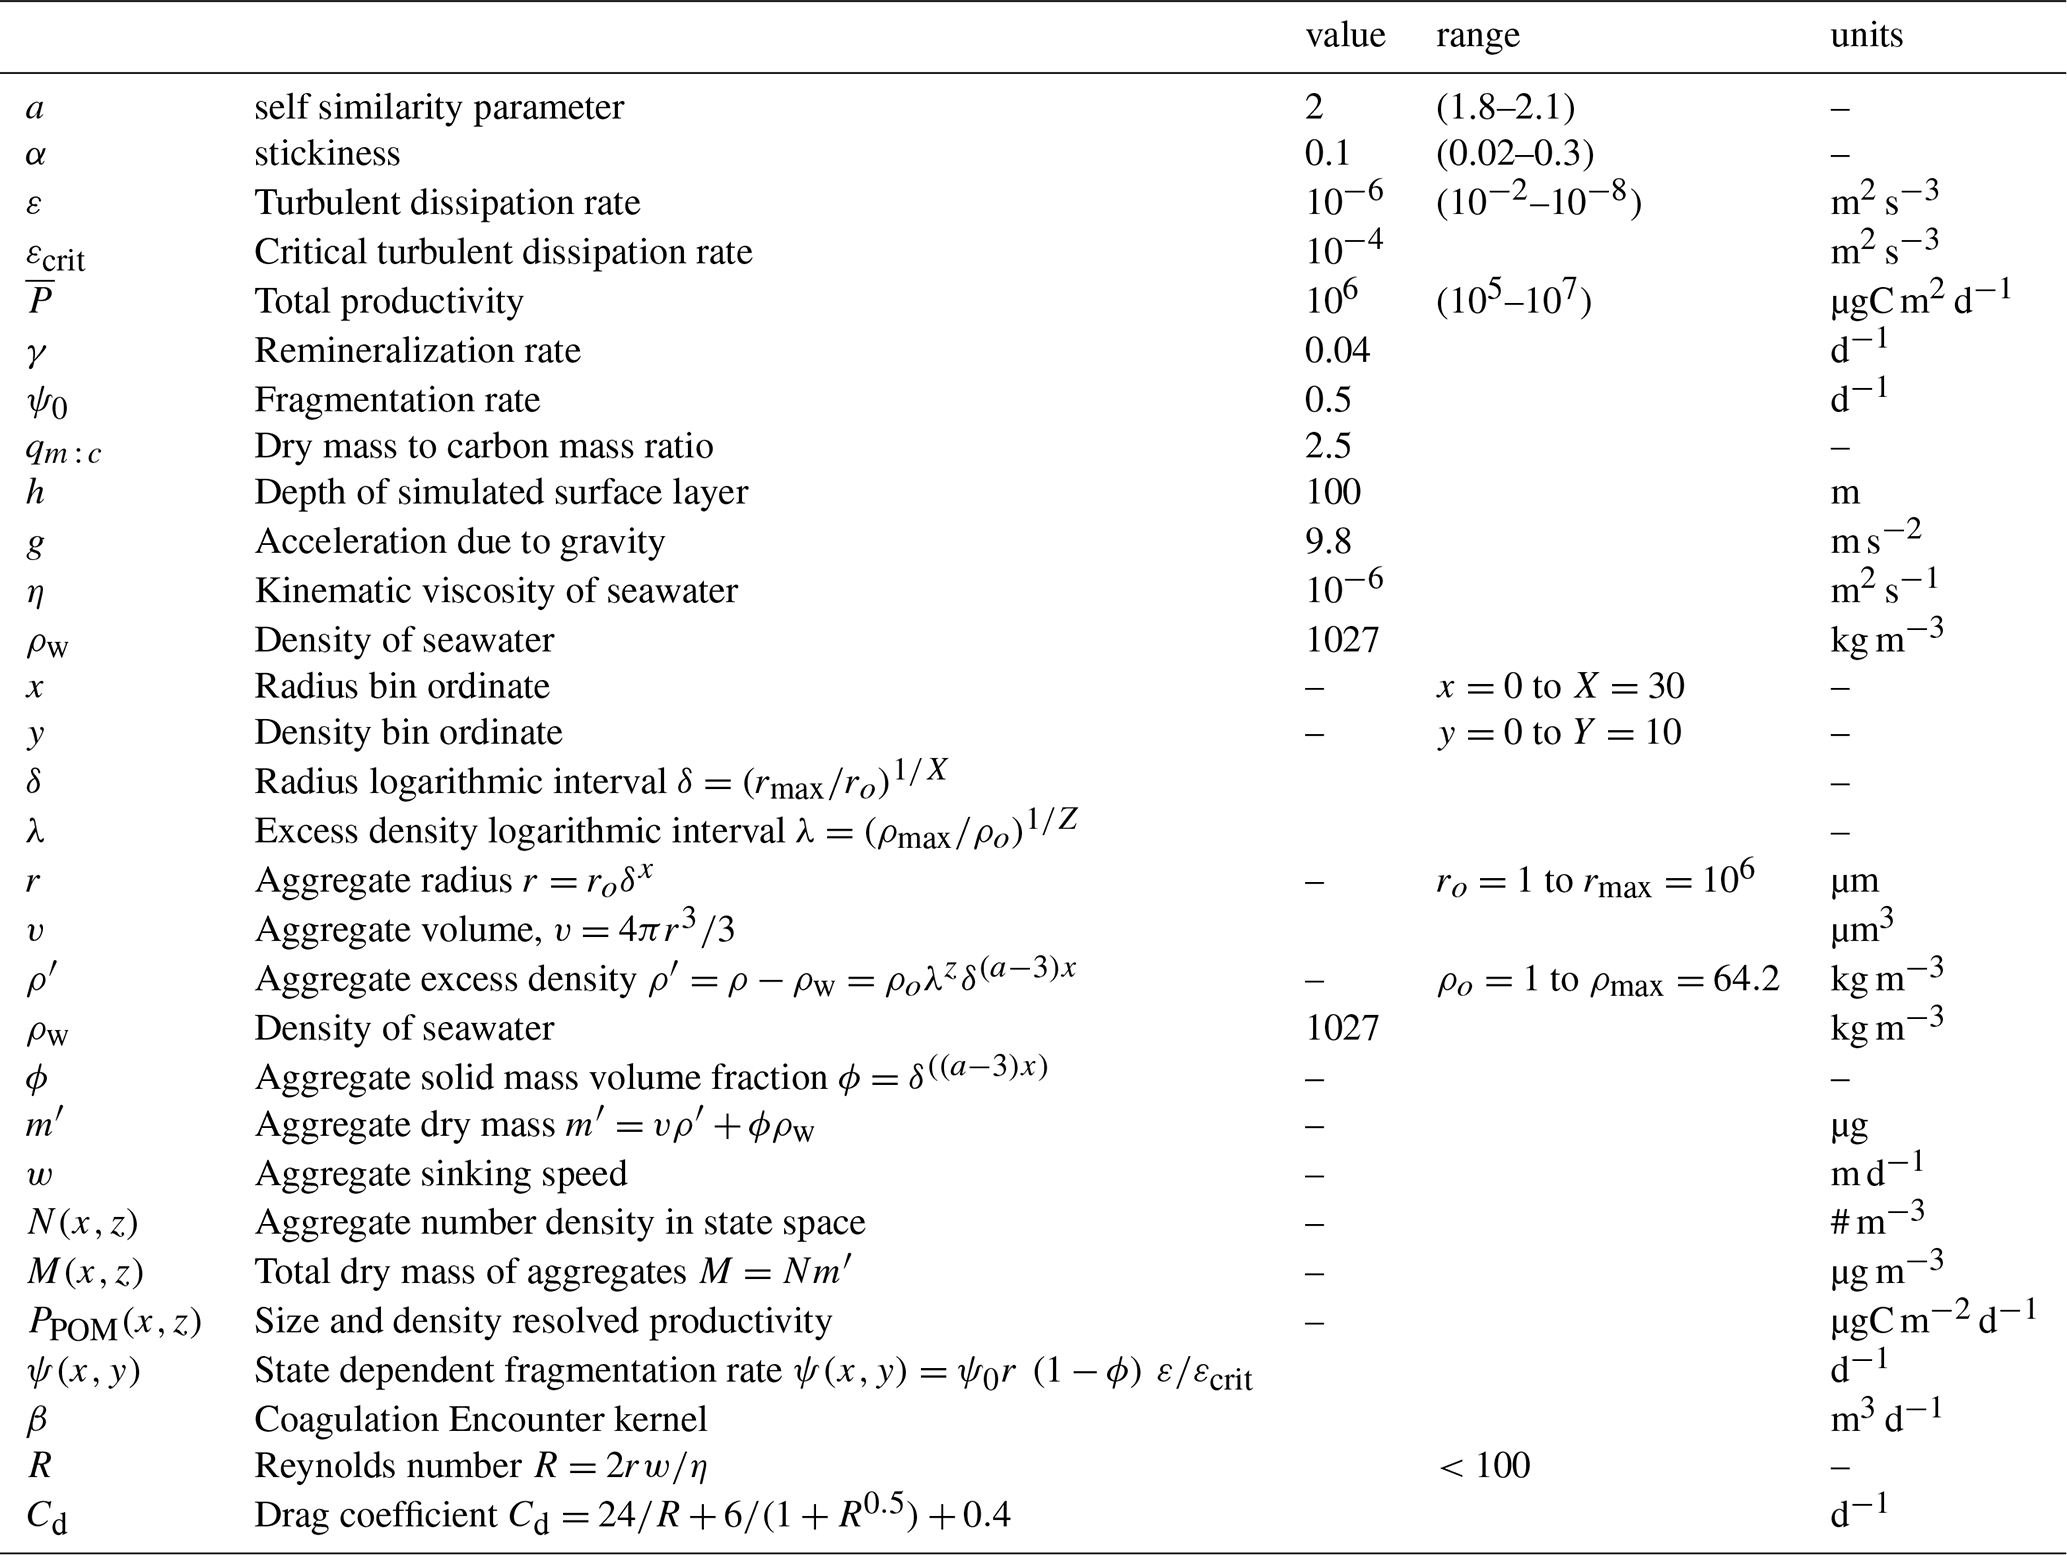
Table E1Glossary of variables, parameter settings for simulations and units.
The MATLAB code of this model analysis is open source and available on Kandylas and Visser (2025) (https://doi.org/10.5281/zenodo.17884179).
AWV devised the concept and developed the code. AK implemented and validated the code, and curated the data and code. AWV and AK drafted the manuscript.
The contact author has declared that neither of the authors has any competing interests.
Views and opinions expressed are however those of the author(s) only and do not necessarily reflect those of the European Union or European Research Executive Agency. Neither the European Union nor the granting authority can be held responsible for them.
Publisher's note: Copernicus Publications remains neutral with regard to jurisdictional claims made in the text, published maps, institutional affiliations, or any other geographical representation in this paper. The authors bear the ultimate responsibility for providing appropriate place names. Views expressed in the text are those of the authors and do not necessarily reflect the views of the publisher.
This work received funding from the European Union under grant agreement no. 101136480 (SEA-Quester) and 101136748 (BioEcoOcean) and 101083922 (OceanICU).
This research has been supported by the Simons Foundation (grant no. 931976) and the HORIZON EUROPE European Research Council (grant nos. 101083922, 101136480, and 101136748).
This paper was edited by Cynthia Whaley and reviewed by two anonymous referees.
Alldredge, A. L. and Gotschalk, C.: In situ settling behavior of marine snow, Limnology and Oceanography, 33, 339–351, https://doi.org/10.4319/lo.1988.33.3.0339, 1988. a
Alldredge, A. L., Granata, T. C., Gotschalk, C. C., and Dickey, T. D.: The physical strength of marine snow and its implications for particle disaggregation in the ocean, Limnology and Oceanography, 35, 1415–1428, 1990. a
Andersen, K. H. and Visser, A. W.: From cell size and first principles to structure and function of unicellular plankton communities, Progress in Oceanography, 213, 102995, https://doi.org/10.1016/j.pocean.2023.102995, 2023. a
Anderson, T. R., Gentleman, W. C., Cael, B., Hirschi, J. J.-M., Eastwood, R. L., and Mayor, D. J.: Proliferating particle surface area via microbial decay has profound consequences for remineralisation rate: a new approach to modelling the degradation of sinking detritus in the ocean, Biogeochemistry, 164, 335–347, 2023. a
Baumas, C. and Bizic, M.: A focus on different types of organic particles and their significance in the open ocean carbon cycle, Progress in Oceanography, 103233, https://doi.org/10.1016/j.pocean.2024.103233, 2024. a, b
Billett, D., Lampitt, R., Rice, A., and Mantoura, R.: Seasonal sedimentation of phytoplankton to the deep-sea benthos, Nature, 302, 520–522, 1983. a
Boyd, P. and Newton, P.: Evidence of the potential influence of planktonic community structure on the interannual variability of particulate organic carbon flux, Deep Sea Research Part I: Oceanographic Research Papers, 42, 619–639, 1995. a, b
Boyd, P. W., Claustre, H., Levy, M., Siegel, D. A., and Weber, T.: Multi-faceted particle pumps drive carbon sequestration in the ocean, Nature, 568, 327, https://doi.org/10.1038/s41586-019-1098-2, 2019. a
Briggs, N., Dall'Olmo, G., and Claustre, H.: Major role of particle fragmentation in regulating biological sequestration of CO2 by the oceans, Science, 367, 791–793, 2020. a
Buesseler, K. O.: The decoupling of production and particulate export in the surface ocean, Global Biogeochemical Cycles, 12, 297–310, 1998. a
Buesseler, K. O., Boyd, P. W., Black, E. E., and Siegel, D. A.: Metrics that matter for assessing the ocean biological carbon pump, Proceedings of the National Academy of Sciences, 117, 9679–9687, 2020. a
Burd, A. B. and Jackson, G. A.: Particle aggregation, Annual review of marine science, 1, 65–90, 2009. a, b, c
Cadier, M., Hansen, A. N., Andersen, K. H., and Visser, A. W.: Competition between vacuolated and mixotrophic unicellular plankton, Journal of Plankton Research, 42, 425–439, 2020. a
Cael, B. B., Cavan, E. L., and Britten, G. L.: Reconciling the size‐dependence of marine particle sinking speed, Geophysical Research Letters, 48, e2020GL091771, https://doi.org/10.1029/2020gl091771, 2021. a
Cram, J. A., Weber, T., Leung, S. W., McDonnell, A. M., Liang, J.-H., and Deutsch, C.: The role of particle size, ballast, temperature, and oxygen in the sinking flux to the deep sea, Global Biogeochemical Cycles, 32, 858–876, 2018. a
Dall'Olmo, G., Dingle, J., Polimene, L., Brewin, R. J., and Claustre, H.: Substantial energy input to the mesopelagic ecosystem from the seasonal mixed-layer pump, Nature Geoscience, 9, 820–823, 2016. a
de Boyer Montégut, C., Madec, G., Fischer, A. S., Lazar, A., and Iudicone, D.: Mixed layer depth over the global ocean: An examination of profile data and a profile-based climatology, Journal of Geophysical Research: Oceans, 109, https://doi.org/10.1029/2004JC002378, 2004. a
De La Rocha, C. L., Nowald, N., and Passow, U.: Interactions between diatom aggregates, minerals, particulate organic carbon, and dissolved organic matter: Further implications for the ballast hypothesis, Global Biogeochemical Cycles, 22, https://doi.org/10.1029/2007GB003156, 2008. a
DeVries, T.: The ocean carbon cycle, Annual Review of Environment and Resources, 47, 317–341, https://doi.org/10.1146/annurev-environ-120920-111307, 2022. a
DeVries, T., Liang, J.-H., and Deutsch, C.: A mechanistic particle flux model applied to the oceanic phosphorus cycle, Biogeosciences, 11, 5381–5398, https://doi.org/10.5194/bg-11-5381-2014, 2014. a
Dilling, L. and Alldredge, A. L.: Fragmentation of marine snow by swimming macrozooplankton: A new process impacting carbon cycling in the sea, Deep Sea Research Part I: Oceanographic Research Papers, 47, 1227–1245, 2000. a
Engel, A.: Distribution of transparent exopolymer particles (TEP) in the northeast Atlantic Ocean and their potential significance for aggregation processes, Deep Sea Research Part I: Oceanographic Research Papers, 51, 83–92, 2004. a
Francois, R., Honjo, S., Krishfield, R., and Manganini, S.: Factors controlling the flux of organic carbon to the bathypelagic zone of the ocean, Global Biogeochemical Cycles, 16, 34–1, 2002. a
Grønning, J. and Kiørboe, T.: Grazer-induced aggregation in diatoms, Limnology and Oceanography Letters, 7, 492–500, 2022. a
Guidi, L., Chaffron, S., Bittner, L., Eveillard, D., Larhlimi, A., Roux, S., Darzi, Y., Audic, S., Berline, L., and Brum, J. R.: Plankton networks driving carbon export in the oligotrophic ocean, Nature, 532, 465–470, 2016. a
Hansen, A. N. and Visser, A. W.: The seasonal succession of optimal diatom traits, Limnology and Oceanography, 64, 1442–1457, 2019. a
Henson, S., Le Moigne, F., and Giering, S.: Drivers of carbon export efficiency in the global ocean, Global biogeochemical cycles, 33, 891–903, 2019. a, b, c, d
Henson, S. A., Sanders, R., and Madsen, E.: Global patterns in efficiency of particulate organic carbon export and transfer to the deep ocean, Global Biogeochemical Cycles, 26, https://doi.org/10.1029/2011GB004099, 2012. a, b
Hernández-León, S., Koppelmann, R., Fraile-Nuez, E., Bode, A., Mompeán, C., Irigoien, X., Olivar, M. P., Echevarría, F., Fernández de Puelles, M. L., González-Gordillo, J. I., Cózar, A., Acuña, J. L., Agusti, S., and Duarte, C. M.: Large deep-sea zooplankton biomass mirrors primary production in the global ocean, Nature communications, 11, 6048, https://doi.org/10.1038/s41467-020-19875-7, 2020. a
Jackson, G. A.: A model of the formation of marine algal flocs by physical coagulation processes, Deep Sea Research Part A. Oceanographic Research Papers, 37, 1197–1211, https://doi.org/10.1016/0198-0149(90)90038-w, 1990. a, b
Jackson, G. A.: Using fractal scaling and two-dimensional particle size spectra to calculate coagulation rates for heterogeneous systems, Journal of Colloid and Interface Science, 202, 20–29, https://doi.org/10.1006/jcis.1998.5435, 1998. a
Jokulsdottir, T. and Archer, D.: A stochastic, Lagrangian model of sinking biogenic aggregates in the ocean (SLAMS 1.0): model formulation, validation and sensitivity, Geosci. Model Dev., 9, 1455–1476, https://doi.org/10.5194/gmd-9-1455-2016, 2016. a, b
Kandylas, A. and Visser, A. W.: Seasonal cycles of the carbon export flux in the ocean: Insights from the SISSOMA mechanistic model, Zenodo [code], https://doi.org/10.5281/zenodo.17884179, 2025. a
Kemp, A. E., Pike, J., Pearce, R. B., and Lange, C. B.: The “Fall dump” – a new perspective on the role of a “shade flora” in the annual cycle of diatom production and export flux, Deep Sea Research Part II: Topical Studies in Oceanography, 47, 2129–2154, 2000. a
Kiørboe, T., Lundsgaard, C., Olesen, M., and Hansen, J. L.: Aggregation and sedimentation processes during a spring phytoplankton bloom: A field experiment to test coagulation theory, Jouranl of Marine Research, https://doi.org/10.1357/0022240943077145, 1994. a
Kriest, I. and Evans, G. T.: Representing phytoplankton aggregates in biogeochemical models, Deep Sea Research Part I: Oceanographic Research Papers, 46, 1841–1859, https://doi.org/10.1016/s0967-0637(99)00032-1, 1999. a
Laufkötter, C., Vogt, M., Gruber, N., Aumont, O., Bopp, L., Doney, S. C., Dunne, J. P., Hauck, J., John, J. G., Lima, I. D., Seferian, R., and Völker, C.: Projected decreases in future marine export production: the role of the carbon flux through the upper ocean ecosystem, Biogeosciences, 13, 4023–4047, https://doi.org/10.5194/bg-13-4023-2016, 2016. a, b, c, d, e
Laurenceau-Cornec, E. C., Mongin, M., Trull, T. W., Bressac, M., Cavan, E. L., Bach, L. T., Le Moigne, F. A., Planchon, F., and Boyd, P. W.: Concepts toward a global mechanistic mapping of ocean carbon export, Global Biogeochemical Cycles, 37, e2023GB007742, https://doi.org/10.1029/2023GB007742, 2023. a, b
Logan, B. E. and Wilkinson, D. B.: Fractal geometry of marine snow and other biological aggregates, Limnology and Oceanography, 35, 130–136, https://doi.org/10.4319/lo.1990.35.1.0130, 1990. a
Meakin, P.: Fractal aggregates, Advances in Colloid and Interface Science, 28, 249–331, https://doi.org/10.1016/0001-8686(87)80016-7, 1987. a
Nowicki, M., DeVries, T., and Siegel, D. A.: Quantifying the carbon export and sequestration pathways of the ocean's biological carbon pump, Global Biogeochemical Cycles, 36, e2021GB007083, https://doi.org/10.1029/2021GB007083, 2022. a
Passow, U., Shipe, R., Murray, A., Pak, D., Brzezinski, M., and Alldredge, A.: The origin of transparent exopolymer particles (TEP) and their role in the sedimentation of particulate matter, Continental Shelf Research, 21, 327–346, 2001. a
Raven, J. and Waite, A.: The evolution of silicification in diatoms: inescapable sinking and sinking as escape?, New phytologist, 162, 45–61, 2004. a
Robinson, C., Steinberg, D. K., Anderson, T. R., Arístegui, J., Carlson, C. A., Frost, J. R., Ghiglione, J.-F., Hernández-León, S., Jackson, G. A., Koppelmann, R., Quéguiner, B., Ragueneau, O., Rassoulzadegan, F., Robison, B. H., Tamburini, C., Tanaka, T., Wishner, K. F., and Zhang, J.: Mesopelagic zone ecology and biogeochemistry – a synthesis, Deep Sea Research Part II: Topical Studies in Oceanography, 57, 1504–1518, 2010. a
Serra-Pompei, C., Soudijn, F., Visser, A. W., Kiørboe, T., and Andersen, K. H.: A general size-and trait-based model of plankton communities, Progress in Oceanography, 189, 102473, https://doi.org/10.1016/j.pocean.2020.102473, 2020. a
Siegel, D., Buesseler, K., Doney, S. C., Sailley, S., Behrenfeld, M. J., and Boyd, P.: Global assessment of ocean carbon export by combining satellite observations and food-web models, Global Biogeochemical Cycles, 28, 181–196, 2014. a, b
Siegel, D., Burd, A., Estapa, M., Fields, E., Johnson, L., Passow, U., Romanelli, E., Brzezinski, M., Buesseler, K., Clevenger, S., Cetinić, I., Drago, L., Durkin, C., Kiko, R., Kramer, S. J., Maas, A. E., Omand, M., and Steinberg, D. K.: Assessing marine snow dynamics during the demise of the North Atlantic spring bloom using in situ particle imagery, Global Biogeochemical Cycles, 39, e2025GB008676, https://doi.org/10.1029/2025GB008676, 2025. a
Siegel, D. A., DeVries, T., Cetinić, I., and Bisson, K. M.: Quantifying the ocean's biological pump and its carbon cycle impacts on global scales, Annual review of marine science, 15, 329–356, 2023. a
Smoluchowski, M. v.: Versuch einer mathematischen Theorie der Koagulationskinetik kolloider Lösungen, Zeitschrift für physikalische Chemie, 92, 129–168, 1918. a
Stamieszkin, K., Pershing, A. J., Record, N. R., Pilskaln, C. H., Dam, H. G., and Feinberg, L. R.: Size as the master trait in modeled copepod fecal pellet carbon flux, Limnology and Oceanography, 60, 2090–2107, 2015. a
Wiesner, M. R.: Kinetics of aggregate formation in rapid mix, Water Research, 26, 379–387, https://doi.org/10.1016/0043-1354(92)90035-3, 1992. a
- Abstract
- Introduction
- Methodology
- Results
- Discussion
- Conclusion
- Appendix A: Self-similarity
- Appendix B: Aggregation algorithm
- Appendix C: Remineralization
- Appendix D: Fragmentation
- Appendix E
- Code and data availability
- Author contributions
- Competing interests
- Disclaimer
- Acknowledgements
- Financial support
- Review statement
- References