the Creative Commons Attribution 4.0 License.
the Creative Commons Attribution 4.0 License.
 | 26 Jan 2026
Implementing riverine biogeochemical inputs in ECCO-Darwin: a sensitivity analysis of terrestrial fluxes in a data-assimilative global ocean biogeochemistry model
Raphaël Savelli
Dustin Carroll
Dimitris Menemenlis
Jonathan M. Lauderdale
Clément Bertin
Stephanie Dutkiewicz
Manfredi Manizza
A. Anthony Bloom
Karel Castro-Morales
Charles E. Miller
Marc Simard
Kevin W. Bowman
Hong Zhang
Terrestrial sources of carbon and nutrients drive biogeochemical cycles in coastal regions and in the global ocean. Quantifying their impact on the spatiotemporal variability of the ocean carbon cycle is pivotal to understanding the distinctive characteristics of ocean basins dominated by riverine inflow. ECCO-Darwin is a data-constrained, global-ocean biogeochemistry model that has heretofore lacked lateral inputs of carbon and nutrients. The objective of this study is to add this new capability to ECCO-Darwin and to carry out a suite of sensitivity experiments in order to quantify the impact of these lateral fluxes on coastal- and open-ocean biogeochemistry. In this work, we use an optimized version of the data-assimilative global-ocean biogeochemistry ECCO-Darwin model to perform a sensitivity analysis of the ocean to lateral inputs of carbon and nutrients. We generate riverine inputs by combining daily point-source freshwater discharge from JRA55-do with the Global NEWS 2 watershed model, accounting for lateral inputs from 5171 watersheds worldwide. The addition of riverine inputs drives a small CO2 outgassing (+0.02 Pg C yr−1) due to compensating processes at regional scales. In basins dominated by carbon runoff, such as the Tropical Atlantic and Arctic Oceans, the addition of riverine inputs increases CO2 outgassing (+13 % and +9 %, respectively). In contrast, runoff in nutrient-dominated Southeast Asia leads to increased CO2 uptake (+9 %). This new riverine biogeochemical input capability will enable future ECCO-Darwin solutions to better capture key processes that occur along coastal margins in global oceans.
- Article
(7506 KB) - Full-text XML
-
Supplement
(13256 KB) - BibTeX
- EndNote


Rivers transport carbon from land to the ocean as Dissolved Organic Carbon (DOC), Dissolved Inorganic Carbon (DIC), Particulate Organic Carbon (POC), and Particulate Inorganic Carbon (PIC), along with nutrients such as phosphorus, nitrogen, and silica, which are essential for phytoplankton growth. Terrestrial inorganic carbon and nutrients in streams originate from weathering of the lithosphere and the associated uptake of atmospheric CO2, along with the remineralization of organic matter in streams and/or on land (Suchet and Probst, 1995; Battin et al., 2023).
Riverine carbon (0.7–1 Pg C yr−1; Lacroix et al., 2021b; Resplandy et al., 2018; Gao et al., 2024; Liu et al., 2024) can be buried in coastal sediments, transported into the open ocean, and outgassed back to the atmosphere in the form of CO2 (Liu et al., 2024; Regnier et al., 2022; Battin et al., 2023; Gao et al., 2024). This carbon is transferred to the atmosphere due to the saturation of surface-ocean waters by terrestrial DIC and the remineralization of terrestrial organic matter (Hartmann et al., 2009; Lacroix et al., 2020; Bertin et al., 2023) in shallow, well-mixed water columns. On continental shelves, the outgassing of CO2 driven by the saturation of surface waters with terrestrial DIC or remineralized terrestrial organic carbon can also be compensated by the excess of alkalinity relative to DIC concentration (Cai, 2011; Louchard et al., 2021). In the absence of transformation in the coastal ocean, refractory riverine organic carbon can be transported offshore due to its slow turnover time (Hansell et al., 2004; Holmes et al., 2008; Kaiser et al., 2017). Concerning nutrients, their injection into the surface ocean can fertilize the growth of photosynthetic organisms in nutrient-limited regions. The subsequent primary production by photosynthetic organisms enhances CO2 uptake by carbon fixation. Globally, lateral inputs increase ocean primary productivity and may contribute to an estimated coastal-ocean carbon sink from 0.2 to 0.7 Pg C yr−1, which is roughly 10 % to 35 % of the global-ocean sink (Dai et al., 2022; Resplandy et al., 2024).
While monitoring global riverine inputs to the ocean is challenging due to the substantial financial/human effort, often in remote environments, land surface and watershed models can provide spatiotemporally-resolved lateral inputs at global scales (Mayorga et al., 2010; Krinner et al., 2005; Hagemann and Dümenil, 1997; Hagemann and Gates, 2003; Li et al., 2017; Bloom et al., 2020; Gao et al., 2023). Coupled with Global-ocean Biogeochemical Models (GOBMs), it is thus possible to quantify the response of the coastal- and open-ocean carbon cycle to lateral inputs (Aumont et al., 2001; Lacroix et al., 2021b; Mathis et al., 2022; Louchard et al., 2021; da Cunha and Buitenhuis, 2013; Le Fouest et al., 2013; Terhaar et al., 2019; Gao et al., 2023; Bertin et al., 2023; Manizza et al., 2019; Séférian et al., 2020). Here, we add the capability to represent lateral fluxes of carbon and nutrients in the ECCO-Darwin global-ocean biogeochemistry model and we examine the impact of these fluxes on the model’s sea-air CO2 flux and Net Primary Production (NPP) state estimate to perform perturbation experiments attributed to lateral inputs of carbon and nutrients. ECCO-Darwin combines (i) property-conserving physics and circulation from the Estimating the Circulation and Climate of the Ocean (ECCO) project, (ii) the MIT Darwin Project’s marine ecology model, (iii) ocean carbon chemistry, and (iv) data assimilation tools developed by ECCO. The system provides global, data-constrained estimates of circulation, sea ice, ecology, and biogeochemistry, with demonstrated skill in reproducing variability in the carbon cycle (Carroll et al., 2020, 2022; Bertin et al., 2023).
In this study, we (1) add point-source lateral inputs of carbon and nutrients to ECCO-Darwin globally and (2) evaluate the model response of sea-air CO2 flux and primary production to riverine inputs during 2000–2019. The sensitivity analysis described herein will allow for further understanding of the contribution of riverine inputs in future ECCO-Darwin solutions and ocean modeling studies that aim to represent processes occurring along coastal margins.
2.1 The ECCO-Darwin Ocean Biogeochemistry State Estimate
The ECCO-Darwin ocean biogeochemistry state estimate is extensively described in Brix et al. (2015), Manizza et al. (2019), and Carroll et al. (2020, 2022, 2024). For the ECCO-Darwin model presented in this study, ocean physics (circulation, temperature, salinity, and sea ice) are provided by a prerelease of the ECCO Version 4 release 5 (V4r5) global-ocean and sea-ice data synthesis. A detailed overview of ECCO V4 is available in Forget et al. (2015) while specific details pertaining to V4r5 are being made available in ECCO et al. (2024).
Horizontal discretization is based on a Lat-Lon-Cap-90 (LLC90) configuration of the MIT general circulation model (MITgcm; Marshall et al., 1997a, b). Nominal horizontal grid spacing is 1° but telescopes to ∼ 33 km meridionally near the Equator and to ∼ 55 km in the Arctic Ocean. The vertical discretization consists of 50 z-levels, ranging from 10 m thickness in the top 7 levels to 450 m at maximum depth of 6 km. ECCO V4 uses a third-order, direct-space-time tracer advection scheme in the horizontal and an implicit third-order upwind scheme in the vertical; a time step of 3600 s is used. Vertical mixing is parameterized using the Gaspar–Grégoris–Lefevre (GGL) mixing-layer turbulence closure and convective adjustment scheme (Gaspar et al., 1990). ECCO V4 assimilates physical observations via the adjoint method (Wunsch et al., 2009; Wunsch and Heimbach, 2013). Importantly, ECCO V4 is a property-conserving ocean reanalysis, that is, contrary to reanalyses that are based on sequential estimation methods, ECCO V4 satisfies model equations exactly for the complete period of optimization (1992–2020 for V4r5). This characteristic makes ECCO V4 uniquely well-suited for ocean ecology and biogeochemistry applications.
Daily river discharge in the present configuration is based on the Japanese 55-year atmospheric Reanalysis (JRA55) for driving ocean–sea-ice models (JRA55-do). JRA55-do river discharge is computed based on the Catchment-based Macro-scale Floodplain (CaMa-Flood) global river routing model and on adjusted runoff from the land component of JRA55 (Suzuki et al., 2018; Tsujino et al., 2018; Feng et al., 2021). JRA55-do point source freshwater runoff was added to ECCO V4r5 as a freshwater flux in the surface ocean (first vertical level) at the closest corresponding ECCO V4r5 grid cell along the coastal periphery. The freshwater flux was adjusted according to the difference in grid cell area between JRA55-do (0.25°×0.25°) and ECCO V4r5. A complete evaluation of ocean physics from ECCO V4r5 compared to observations can be found in the Supplement and in Feng et al. (2021).
ECCO V4r5 ocean physics were coupled online with the MIT Darwin Project ecosystem model described in Brix et al. (2015). The ecosystem model solves 39 prognostic variables, including carbon, nitrogen, phosphorus, iron, silica, oxygen, and alkalinity. The model simulates their respective cycle from inorganic pools to living/dead matter of plankton organisms and the subsequent remineralization, all driven by the ocean physics. The carbonate chemistry is solved with the method of Follows et al. (2006). Plankton species consist of five large-to-small functional phytoplankton types (diatoms, other large eukaryotes, Synechococcus, and low- and high-light adapted Prochlorococcus) and two zooplankton types. In the absence of lateral fluxes, carbon in ECCO-Darwin is removed from the ocean through a combination of biological, chemical, physical, and air–sea exchange processes. Phytoplankton uptake of DIC during photosynthesis reduces upper-ocean carbon and forms organic matter, some of which sinks out of the mixed layer as export production. Additional CO2 drawdown occurs when surface waters are undersaturated relative to the atmosphere, leading to net air–sea CO2 uptake. Carbonate chemistry processes, such as precipitation and dissolution, modify alkalinity and buffer the partitioning of carbon species, thereby influencing surface-ocean DIC concentrations. Finally, physical transport through upwelling, mixing, subduction, and advection transports both DIC and organic carbon through the water column. Nutrients are supplied by upwelling and vertical mixing, consumed by phytoplankton growth, regenerated during remineralization, and exported with sinking organic matter – collectively regulating the efficiency of carbon uptake and storage. In the water column, particulate matter (detritus, inorganic carbon, and living phytoplankton and zooplankton) sinks at prescribed velocities and is removed at the ocean bottom to limit the accumulation of particulates on the seafloor.
Atmospheric CO2 partial pressure at sea level (ApCO2) from the National Oceanic and Atmospheric Administration Marine Boundary Layer Reference product (Andrews et al., 2014) was used to drive sea-air CO2 fluxes computed by the model according to Wanninkhof (2014). Atmospheric iron dust is deposited at the ocean surface based on the monthly climatology of Mahowald et al. (2009). ECCO-Darwin assimilates biogeochemical observations using a Green's Functions optimization approach (Menemenlis et al., 2005); the optimization methodology and associated data constraints are extensively described in Carroll et al. (2020). The ECCO-Darwin solution was previously published using an LLC270 (°) ECCO solution (Zhang et al., 2018) and monthly climatological freshwater runoff forcing from Fekete et al. (2002). Here, we introduce a new 1°-version of ECCO-Darwin with daily point-source freshwater runoff from January 1992 to December 2019 (hereinafter our “Baseline” simulation) and also conduct a suite of perturbation experiments (Table 1) where we add various riverine biogeochemical input components to assess the primary productivity and carbon cycle response. Except for these changes, our simulations use the same initial conditions, parameter settings, and forcings as in Carroll et al. (2020). To account for biogeochemical spin-up in the perturbation runs, the following analysis was performed for the last 20 years of simulation, from January 2000 to December 2019 (Figs. S2–S9 in the Supplement).
Table 1Sensitivity experiments and associated solutes: terrestrial dissolved organic carbon (tDOC), dissolved inorganic carbon (tDIC), dissolved inorganic nitrogen (tDIN), dissolved organic nitrogen (tDON), dissolved silica (tDSi), dissolved inorganic phosphorus (tDIP), dissolved organic phosphorus (tDOP), dissolved inorganic iron (tDFe), and dissolved organic iron (tDOFe).

2.2 Baseline Evaluation
We compared simulated surface-ocean partial pressure in CO2 (pCO2) and sea-air CO2 fluxes in Baseline with state-of-the-art products based on the Surface Ocean CO2 Atlas (SOCAT; Bakker et al., 2016; Sabine et al., 2013). We used the monthly pCO2 and sea-air CO2 fluxes MPI-SOM-FFN v2023 (Landschützer et al., 2016; Jersild et al., 2023) and Copernicus Marine Environment Monitoring Service (CMEMS; Chau et al., 2022) climatologies computed from neural network-based clustering algorithms. In addition, we used the monthly atmospheric CO2 inversion Jena Carboscope v2023 (Rödenbeck et al., 2013) based on high-precision measurements from the Gridded Fossil Emissions Dataset (GridFED; Jones et al., 2021) and SOCAT (Bakker et al., 2016; Sabine et al., 2013). These products were interpolated on the LLC90 grid from January 2000 to December 2019. Grid cells covered by sea-ice (concentration >0 %) were discarded from the model-data evaluation, based on the percentage of sea-ice cover simulated by ECCO-Darwin.
2.3 Biogeochemical River Discharge Product
In addition to the Baseline simulation, we conducted three sensitivity experiments (Table 1) where we added terrestrial DOC (tDOC), DIC (tDIC), total alkalinity (tALK), dissolved inorganic nitrogen (tDIN), dissolved organic nitrogen (tDON), and dissolved silica (tDSi), dissolved inorganic phosphorus (tDIP), dissolved organic phosphorus (tDOP), dissolved inorganic iron (tDFe), and dissolved organic iron (tDOFe) henceforth referred to as riverine inputs in this study. Except for tDIC, tALK, tDFe and tDOFe, riverine inputs are provided by the Global Nutrient Export from WaterSheds 2 (NEWS 2; Mayorga et al., 2010) model. The method for computing our daily point-source inputs, which is then used as forcing in ECCO-Darwin along the coastal periphery of the global ocean, is detailed below. Global NEWS 2 uses statistical and mechanistic relations at the watershed scale to compute annual-mean freshwater discharge and riverine inputs based on natural and anthropogenic sources, with 6292 individual watersheds delineated according to the global river systems dataset from Vörösmarty et al. (2000). Global NEWS 2 tDIN was partitioned into nitrite (NO), nitrate (NO), and ammonium (NH), according to the mean fraction of each species concentration relative to the total DIN concentration from the GLObal RIver CHemistry Database (GLORICH; Hartmann et al., 2014). The NO : DIN, NO : DIN, and NH : DIN ratios were estimated to be 0.02, 0.65, and 0.33, respectively. Inorganic phosphorus was partitioned into dissolved inorganic phosphorus (DIP) and iron-bound (Fe-P) pools using a fixed 1:3 DIP : Fe-P ratio based on pre-industrial export estimates (Compton et al., 2000). Fe was coupled to P at a molar ratio, but the iron associated with the Fe-P oxide fraction was treated as non-bioavailable (Lacroix et al., 2020).
tDIC inputs were computed using an empirical relation between freshwater discharge and gross CO2 consumption from rock weathering, as described in Li et al. (2017, equation 9). CO2 consumption by rock weathering over each Global NEWS 2 watershed was estimated based on the freshwater discharge and the basin-dominant lithology (Amiotte Suchet et al., 2003). tALK inputs were computed using an ALK : DIC ratio (0.98) based on the mean total ALK compared to DIC from GLORICH. The remineralization rate for terrestrial and marine DOC equals 1 over 100 d. We used Global NEWS 2 outputs for the year 2000 as representative of present-day carbon and nutrient inputs (Mayorga et al., 2010). Riverine inputs were compared against observations from literature and the Arctic Great Rivers Observatory (ArcticGRO) water-quality monitoring network in the Arctic region (Holmes et al., 2012; Tank et al., 2023) (Table S1 in the Supplement).
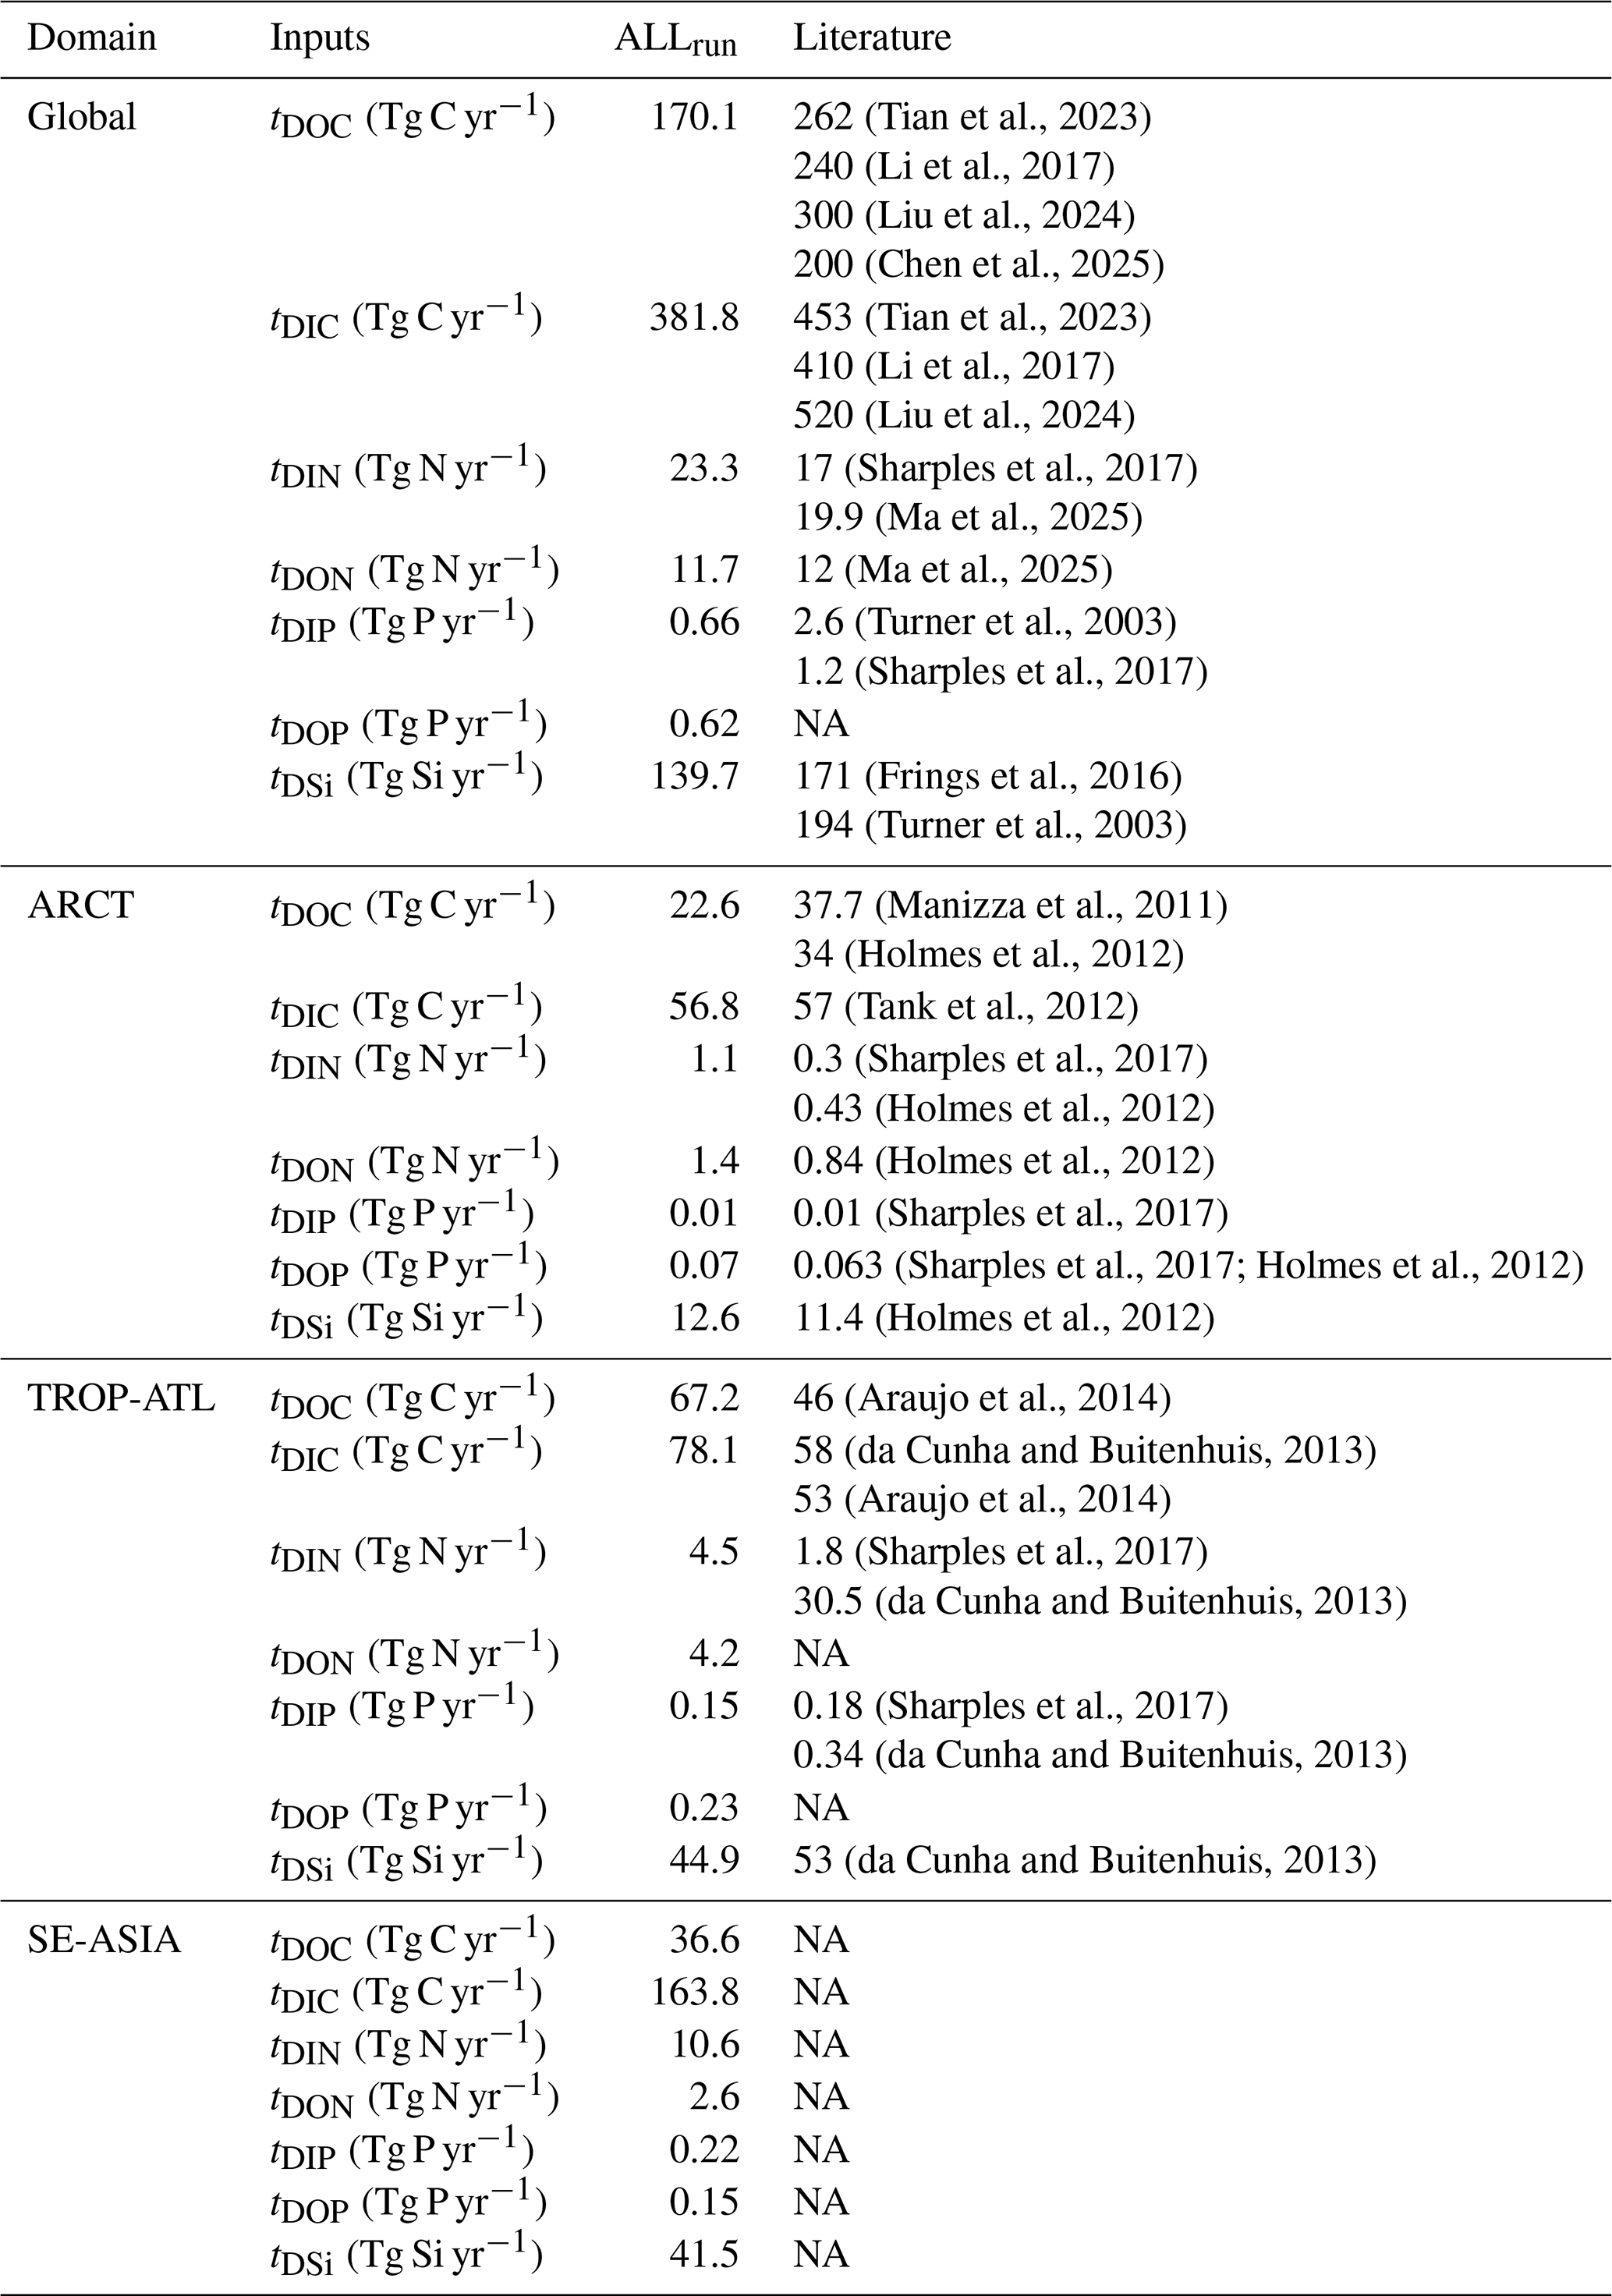
Global NEWS 2 river mouth locations were associated with JRA55-do grid points exhibiting the closest annual-mean freshwater discharge in 2000 within an euclidean distance of 5°. The top 100 largest rivers (by watershed extent) from Global NEWS 2 were imposed on JRA55-do grid points as a function of distance only. In total, 5171 river mouths were associated with JRA55-do grid points. For each discharge point, riverine input concentrations (g m−3) from the associated river were estimated by dividing the load by the annual volume of freshwater from Global NEWS 2; the concentration was then multiplied by the corresponding daily-mean freshwater flux from JRA55-do (m s−1) to obtain a daily flux (g m−2 s−1). Riverine inputs were adjusted according to the grid-cell-area difference between JRA55-do and ECCO V4r5. Then, these biogeochemical inputs were added as point-source discharge along with riverine freshwater flux (Table 2 and Fig. S1). Due to overestimated tDIC inputs in our Global NEWS 2-derived computation for the Amazon River, tDIC inputs for this system were set to a more realistic, literature-mean of 2.54 Tmol C yr−1 (da Cunha and Buitenhuis, 2013; Probst et al., 1994; Li et al., 2017) (for more details, see Appendix A). The outstandingly large Amazon watershed area (used for estimating rock weathering) and freshwater discharge compared to other basins drive a very high load when using equation 9 from Li et al. (2017). Riverine tDOC, tDIN, tDON, tDIP, tDOP, and tDSi inputs agree well with non-Global NEWS-based estimates in Table 2. tDIC lateral inputs from rivers were estimated according to Amiotte Suchet et al. (2003), Mayorga et al. (2010), Li et al. (2017), resulting in tDIC inputs of 381.81 Tg C yr−1 to the ocean, which is in general agreement with recent studies in Table 2.
(Tian et al., 2023)(Li et al., 2017)(Liu et al., 2024)(Chen et al., 2025)(Tian et al., 2023)(Li et al., 2017)(Liu et al., 2024)(Sharples et al., 2017)(Ma et al., 2025)(Ma et al., 2025)(Turner et al., 2003)(Sharples et al., 2017)(Frings et al., 2016)(Turner et al., 2003)(Manizza et al., 2011)(Holmes et al., 2012)(Tank et al., 2012)(Sharples et al., 2017)(Holmes et al., 2012)(Holmes et al., 2012)(Sharples et al., 2017)(Sharples et al., 2017; Holmes et al., 2012)(Holmes et al., 2012)(Araujo et al., 2014)(da Cunha and Buitenhuis, 2013)(Araujo et al., 2014)(Sharples et al., 2017)(da Cunha and Buitenhuis, 2013)(Sharples et al., 2017)(da Cunha and Buitenhuis, 2013)(da Cunha and Buitenhuis, 2013)Table 2Riverine inputs and literature estimates from non-Global NEWS methods. NA – not available
2.4 Sensitivity Experiments and Analysis
Sensitivity experiments consisted of adding riverine inputs separately or together, along with freshwater runoff (Table 1). tALK was always added along with tDIC in relevant experiments. Given that the previously optimized ECCO-Darwin solution did not include biogeochemical river discharge, the sensitivity experiments may contain some double-counting that will lead to deterioration of the model results relative to observed pCO2 and sea-air CO2 flux data products. Therefore, the analysis herein is restricted to examining the perturbation response rather than quantifying possible improvement or degradation of the simulation vs. observations. We analyzed monthly-mean model fields both in the coastal ocean (limits set by the furthest point from the coastline, either the 1000 m isobath or a distance of 300 km; 58×106 km2) and open ocean (300×106 km2) from 2000–2019. We also evaluated the sensitivity of ocean carbon cycling in three specific regions that receive large volumes of freshwater and biogeochemical inputs from major river systems (Lacroix et al., 2020): the Arctic Ocean (ARCT, 22×106 km2), Tropical Atlantic (TROP-ATL, 77×106 km2), and Southeast Asia (SE-ASIA, 62×106 km2). Coastal and open-ocean boundaries are delineated by the black line shown in Fig. 1a.
3.1 Baseline Evaluation
Overall, Baseline surface-ocean pCO2 compares reasonably well with the Jena Carboscope, MPI-SOM-FFN, and Copernicus CMEMS data-based products (Fig. 1). The largest differences are concentrated along the coastal periphery and near large river mouths (i.e., Amazon, Paraná, Congo, Ganges, Yangtze, Amur), where Baseline underestimates surface-ocean pCO2 (Fig. 1i). Additionally, the data-based products exhibited lower surface-ocean pCO2 compared to Baseline (Fig. 1i) in the Arctic Ocean and near the periphery of Antarctica; regions where observations are highly limited in space and time.
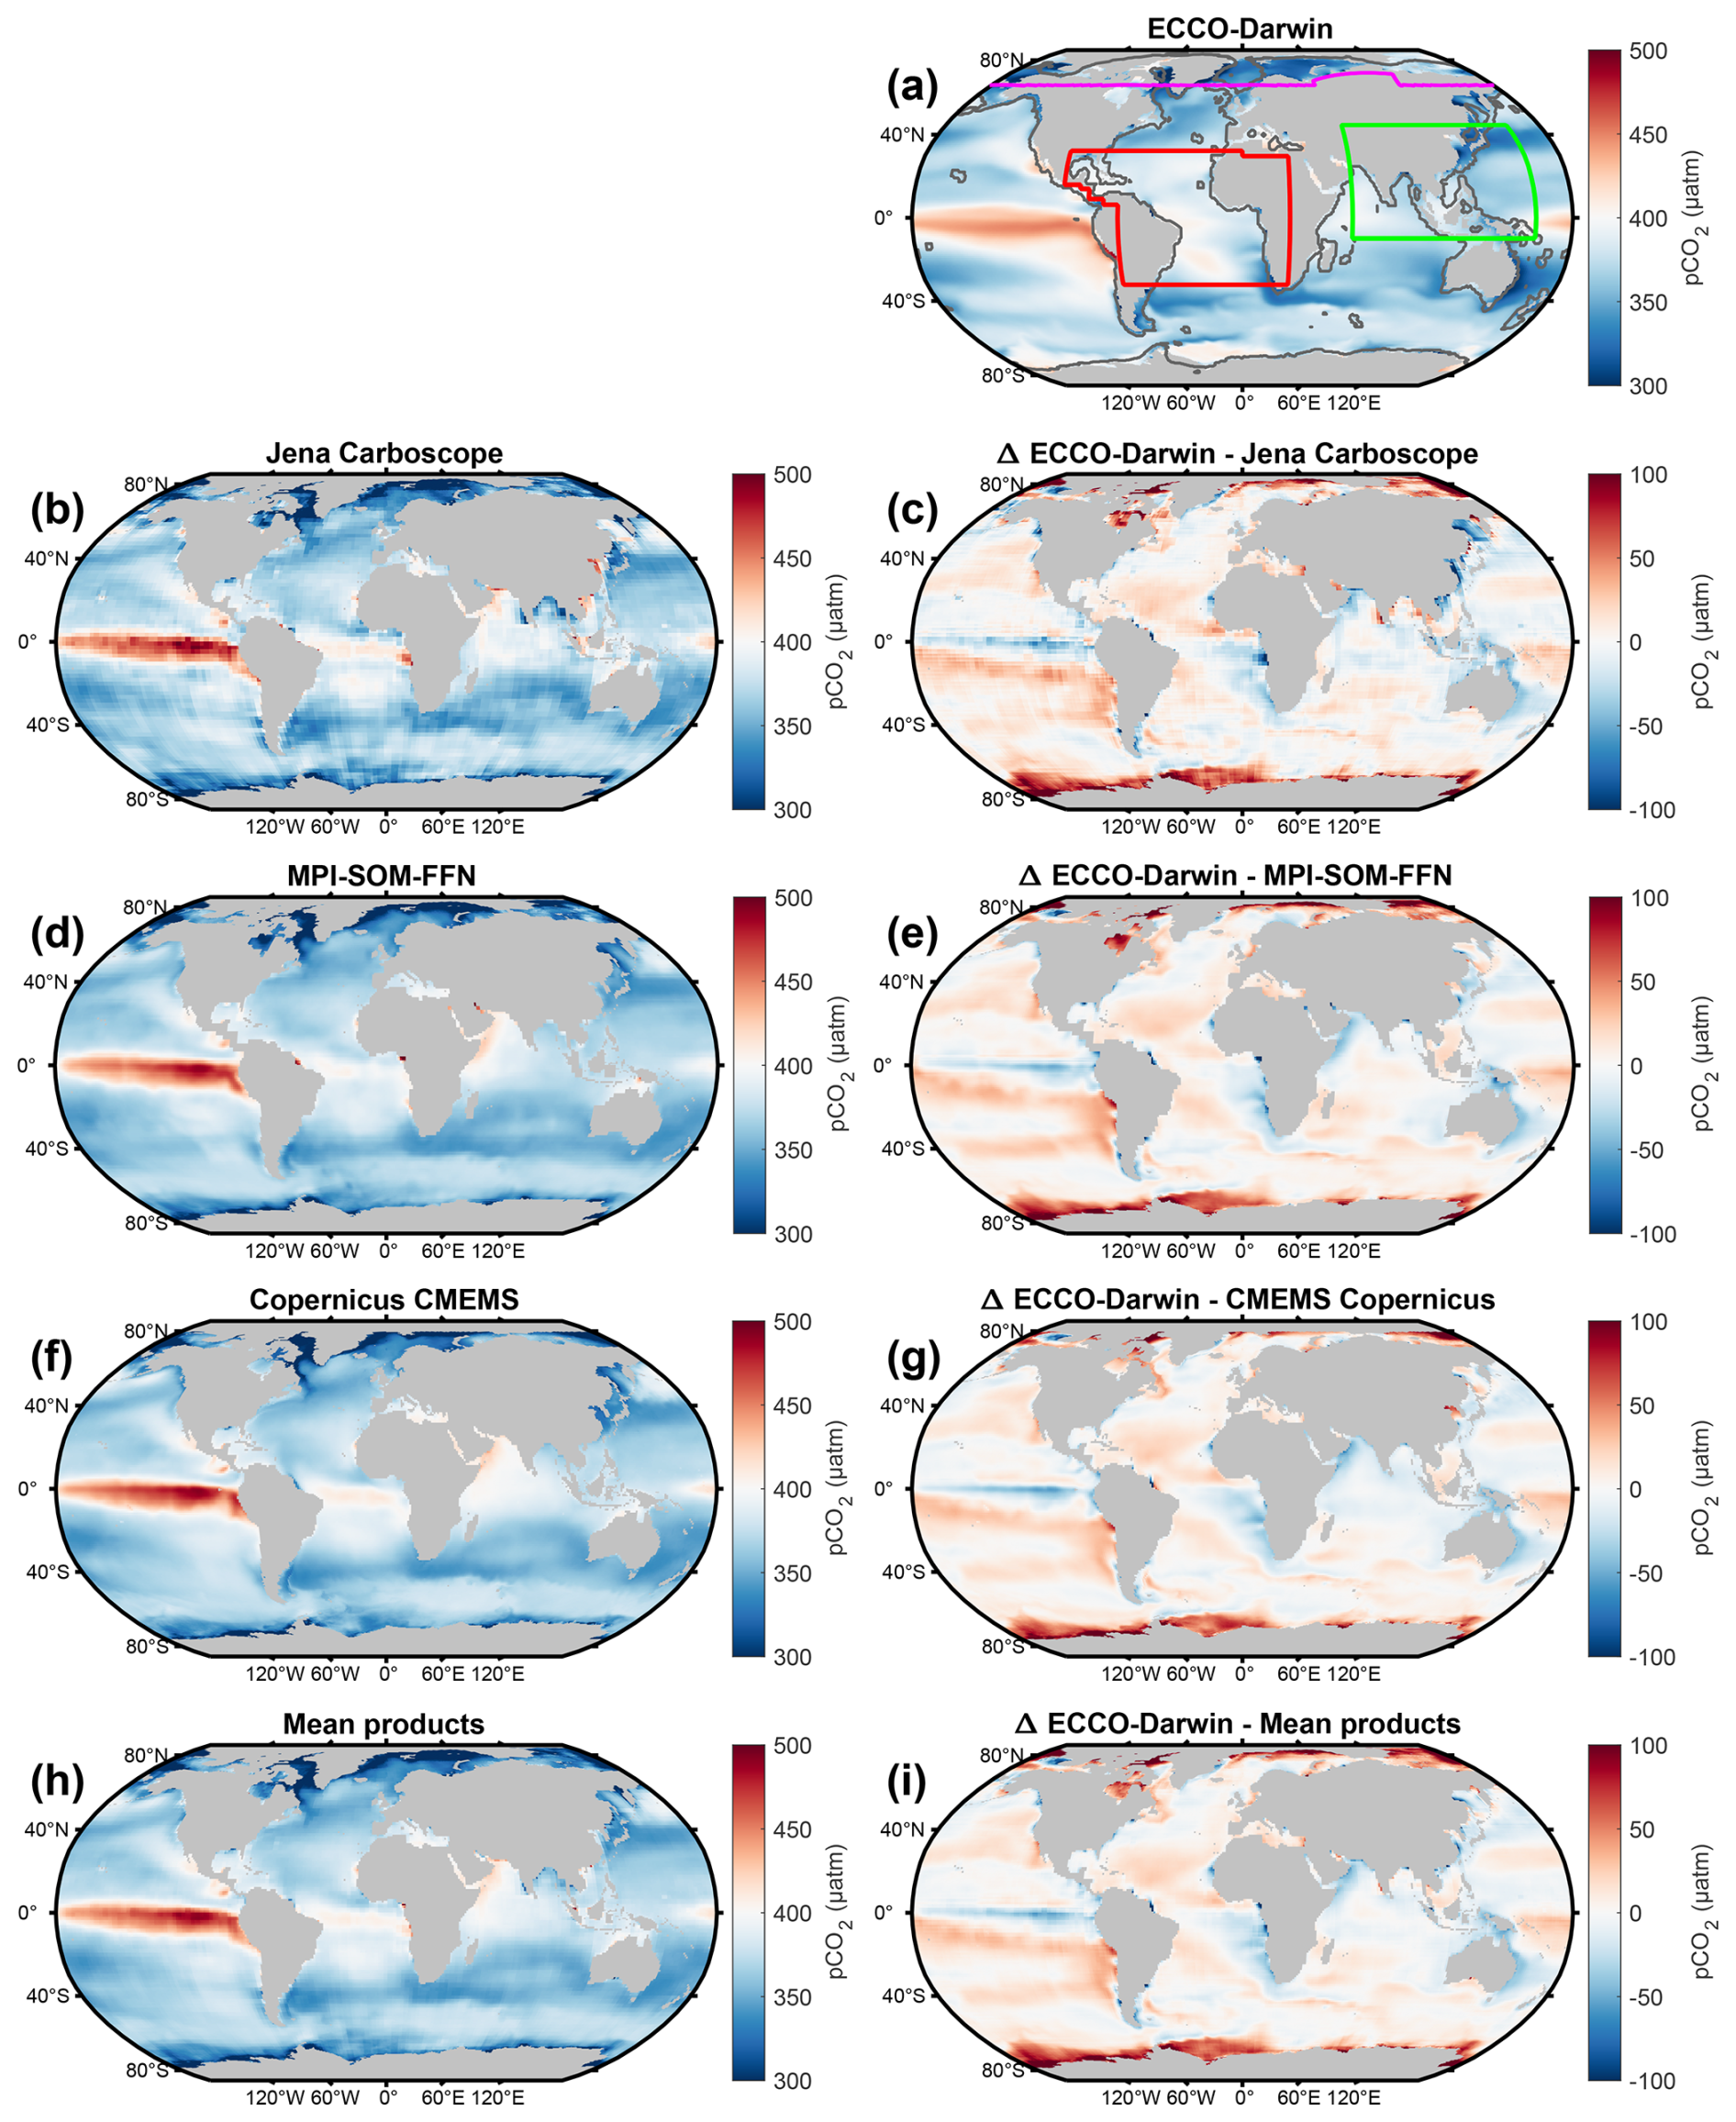
Figure 1Climatological global-ocean surface-ocean pCO2 for (a) ECCO-Darwin Baseline, (b) Jena Carboscope, (d) MPI-SOM-FFN, (f) Copernicus CMEMS, and (h) mean of all data products. Panels (c), (e), (g), and (i) correspond to the difference between ECCO-Darwin Baseline and each data product. All fields shown are time means from January 2000 to December 2019. In (a), colored boundaries correspond to domains used for regional analysis of the Arctic Ocean (ARCT, violet line), Tropical Atlantic (TROP-ATL, red line), and Southeast Asia (SE-ASIA, green line). The black line delineates the coastal ocean from the open ocean, which is set by the furthest point from the coastline of either a 300 km distance or the 1000 m isobath. MPI-SOM-FFN, Jena Carboscope, and CMEMS Copernicus products were interpolated on the LLC90 grid.

Figure 2Climatological global-ocean sea-air CO2 flux for (a) ECCO-Darwin Baseline, (b) Jena Carboscope, (d) MPI-SOM-FFN, (f) Copernicus CMEMS, and (h) the mean of all data-based products. Panels (c), (e), (g), and (i) correspond to the difference between ECCO-Darwin Baseline and each product. Positive values represent CO2 outgassing (red colors); negative values represent uptake (blue colors). All fields shown are time means from January 2000 to December 2019. In (a), colored boundary lines correspond to domains used for regional analysis of the Arctic Ocean (ARCT, violet line), Tropical Atlantic (TROP-ATL, red line), and Southeast Asia (SE-ASIA, green line). The black line delineates the coastal ocean from the open ocean, which is set by the furthest point from the coastline of either a 300 km distance or the 1000 m isobath. MPI-SOM-FFN, Jena Carboscope, and CMEMS Copernicus products were interpolated on the LLC90 grid.
Figure 2 shows a comparison of time-mean Baseline sea-air CO2 flux (−2.58 Pg C yr−1), Jena Carboscope v2023 (−2.11 Pg C yr−1), MPI-SOM-FFN v2023 (−2.04 Pg C yr−1), and Copernicus CMEMS (−1.97 Pg C yr−1) products during 2000–2019. Compared to the product mean, Baseline sea-air CO2 flux yields a stronger ocean CO2 uptake (+0.5 Pg C yr−1, Fig. 2i). Overall, the spatial distribution of source/sink patterns in the global ocean was well captured by Baseline. However, the products displayed stronger CO2 outgassing in the North Pacific and Atlantic Oceans, the Arabian Sea, and the Southern Ocean (Fig. 2i).
3.2 Climatological Global Analysis
The addition of dissolved carbon and nutrients in ALLrun led to a small increase in CO2 outgassing of 0.02 Pg C yr−1 compared to Baseline, globally (Table 3 and Fig. 3a). The majority of CO2 outgassing driven by riverine inputs (0.02 Pg C yr−1) occurs in the coastal ocean (Table 3 and Figs. 3a and 4a). In ALLrun, the small net change in sea-air CO2 flux results from compensation between the effects of riverine carbon and nutrients, as DCrun and NUTrun experiments result in elevated CO2 outgassing and uptake, respectively (Table 3 and Fig. 4a). In DCrun, the increase in ocean carbon, and hence pCO2 due to riverine inputs, reduces the ocean's capacity to take up atmospheric CO2, resulting in a net CO2 outgassing of 0.22 Pg C yr−1 (Table 3 and Fig. 4a). In NUTrun, the increase of nutrients in the euphotic zone elevates phytoplankton productivity. The additional uptake of carbon by phytoplankton decreased surface-ocean DIC, resulting in an additional global-ocean CO2 uptake of 0.20 Pg C yr−1 (Table 3 and Fig. 4a).
Table 3Sea-air CO2 flux and Net Primary Production (NPP) for each experiment in the coastal, open, and global ocean. Positive values represent CO2 outgassing; negative values are uptake.
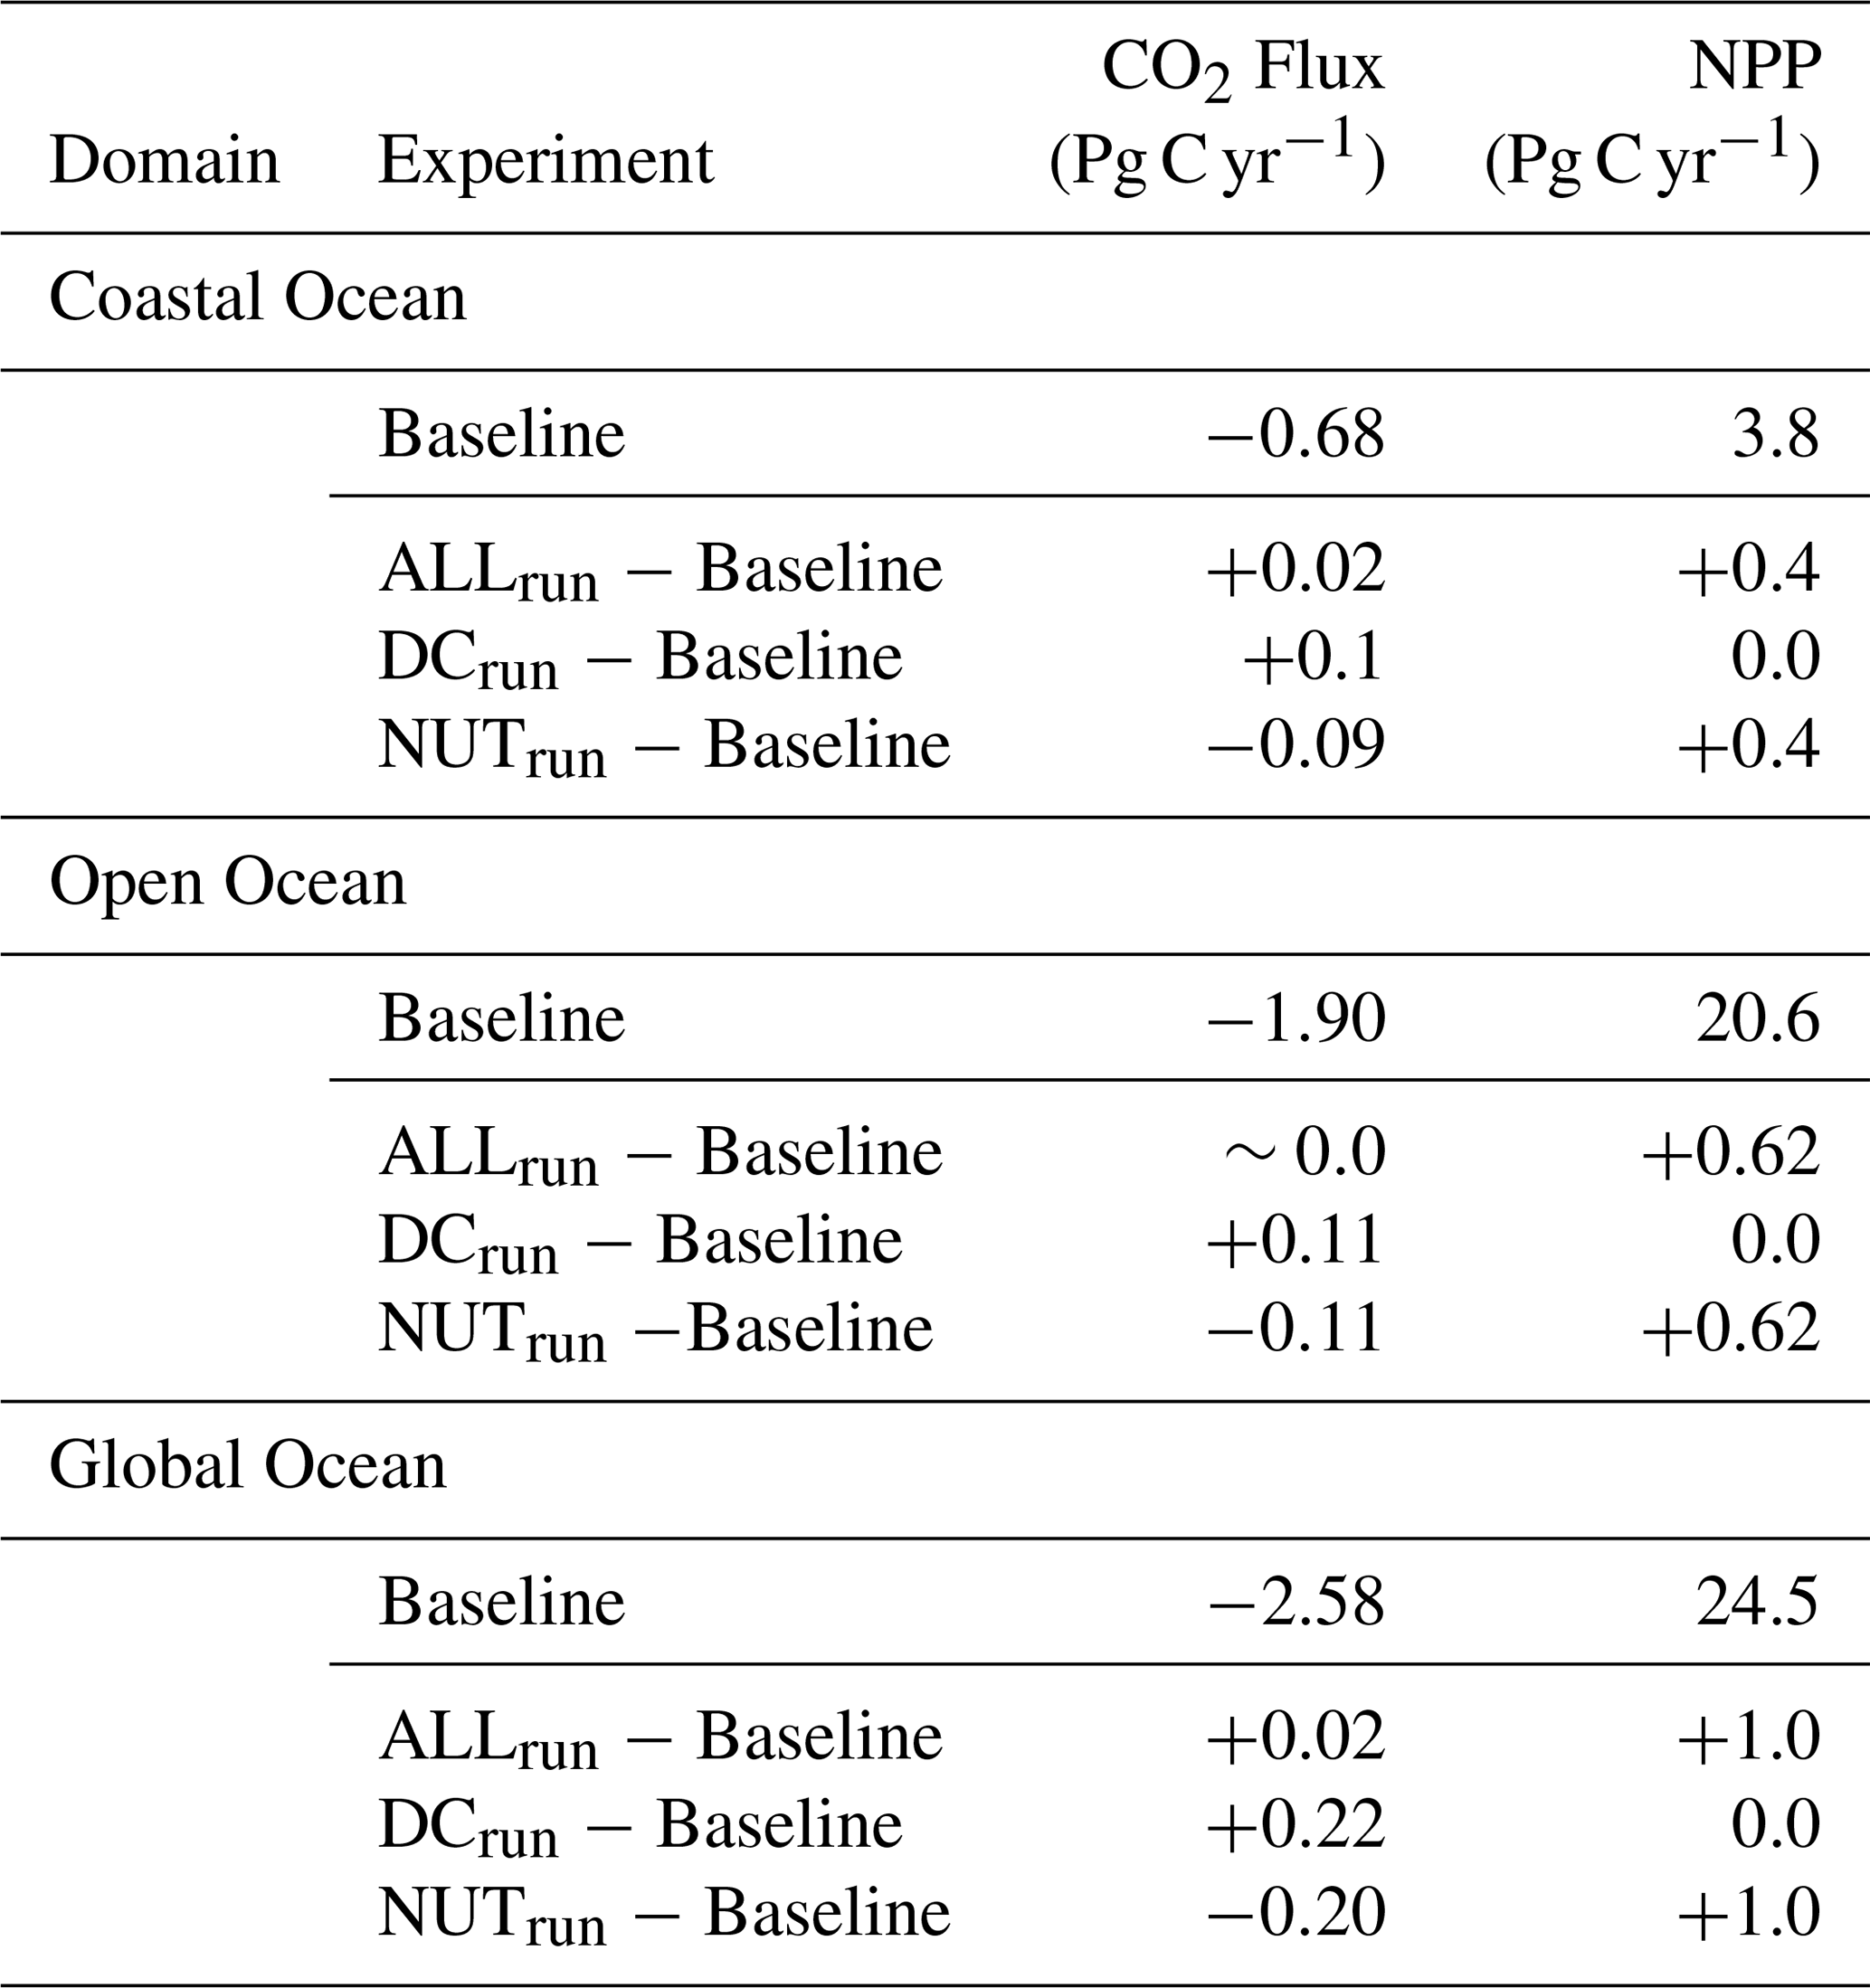
While outgassing driven by carbon inputs was compensated by uptake due to nutrients in the open ocean, CO2 uptake due to nutrients was 10 % lower than carbon-input-driven coastal outgassing, resulting in a global-ocean CO2 uptake that was reduced by 0.02 Pg C yr−1 (i.e., increased outgassing) in ALLrun compared to Baseline (Fig. 4a). Dissolved nutrient inputs in ALLrun resulted in a Net Primary Production (NPP) increase of 1 Pg C yr−1 (+4 %) compared to Baseline (Table 3 and Figure 3b). The total increase of NPP in ALLrun from riverine inputs was stronger in the open ocean (0.62 Pg C yr−1) compared to the coastal ocean (0.4 Pg C yr−1) (Table 3 and Fig. 4b). However, the increase of NPP per surface area was larger in the coastal ocean (+7 g C m−2 yr−1, +7 %) compared to the open ocean (+2 g C m−2 yr−1, +1 %).
3.3 Climatological Regional Analysis
In Baseline, the CO2 uptake in ARCT was roughly 0.21 Pg C yr−1. When carbon and nutrient inputs are added in ALLrun, ARCT CO2 uptake reduces by 0.02 Pg C yr−1, with the majority of the response (75 %) in the coastal ocean (Table 4, Figs. 3a and 4a). In Baseline, ARCT NPP was 0.22 Pg C yr−1, with a similar magnitude in the coastal and open ocean. Adding nutrient inputs into ARCT increased coastal NPP by 4 % (Fig. 4b).
Carbon and nutrient inputs resulted in a TROP-ATL CO2 outgassing of 0.01 Pg C yr−1 compared to Baseline (0.10 Pg C yr−1). This imbalance results from CO2 outgassing driven by dissolved carbon, which was 20 % larger than the uptake due to increased phytoplankton productivity from dissolved nutrients (Fig. 4b). In Baseline, NPP in TROP-ATL was 3.18 Pg C yr−1. The increase in NPP driven by riverine nutrients occurs predominantly in the open ocean (∼ 65 %) compared to the coastal (∼ 35 %) zone (Figs. 3b and 4b).
SE-ASIA has a CO2 uptake of 0.30 Pg C yr−1 in Baseline, while CO2 uptake increases by 0.02 Pg C yr−1 in ALLrun (Table 4 and Fig. 3a). In the open ocean, the nutrient input-driven increase in NPP and associated CO2 uptake is two times higher than carbon input-driven outgassing – leading to an overall imbalance and resulting in net CO2 uptake in SE-ASIA (Fig. 4a). NPP in SE-ASIA without riverine inputs is 3.3 Pg C yr−1. In ALLrun, NPP increases by 0.33 Pg C yr−1 due to elevated nutrients in both the open and coastal ocean (Fig. 4b).
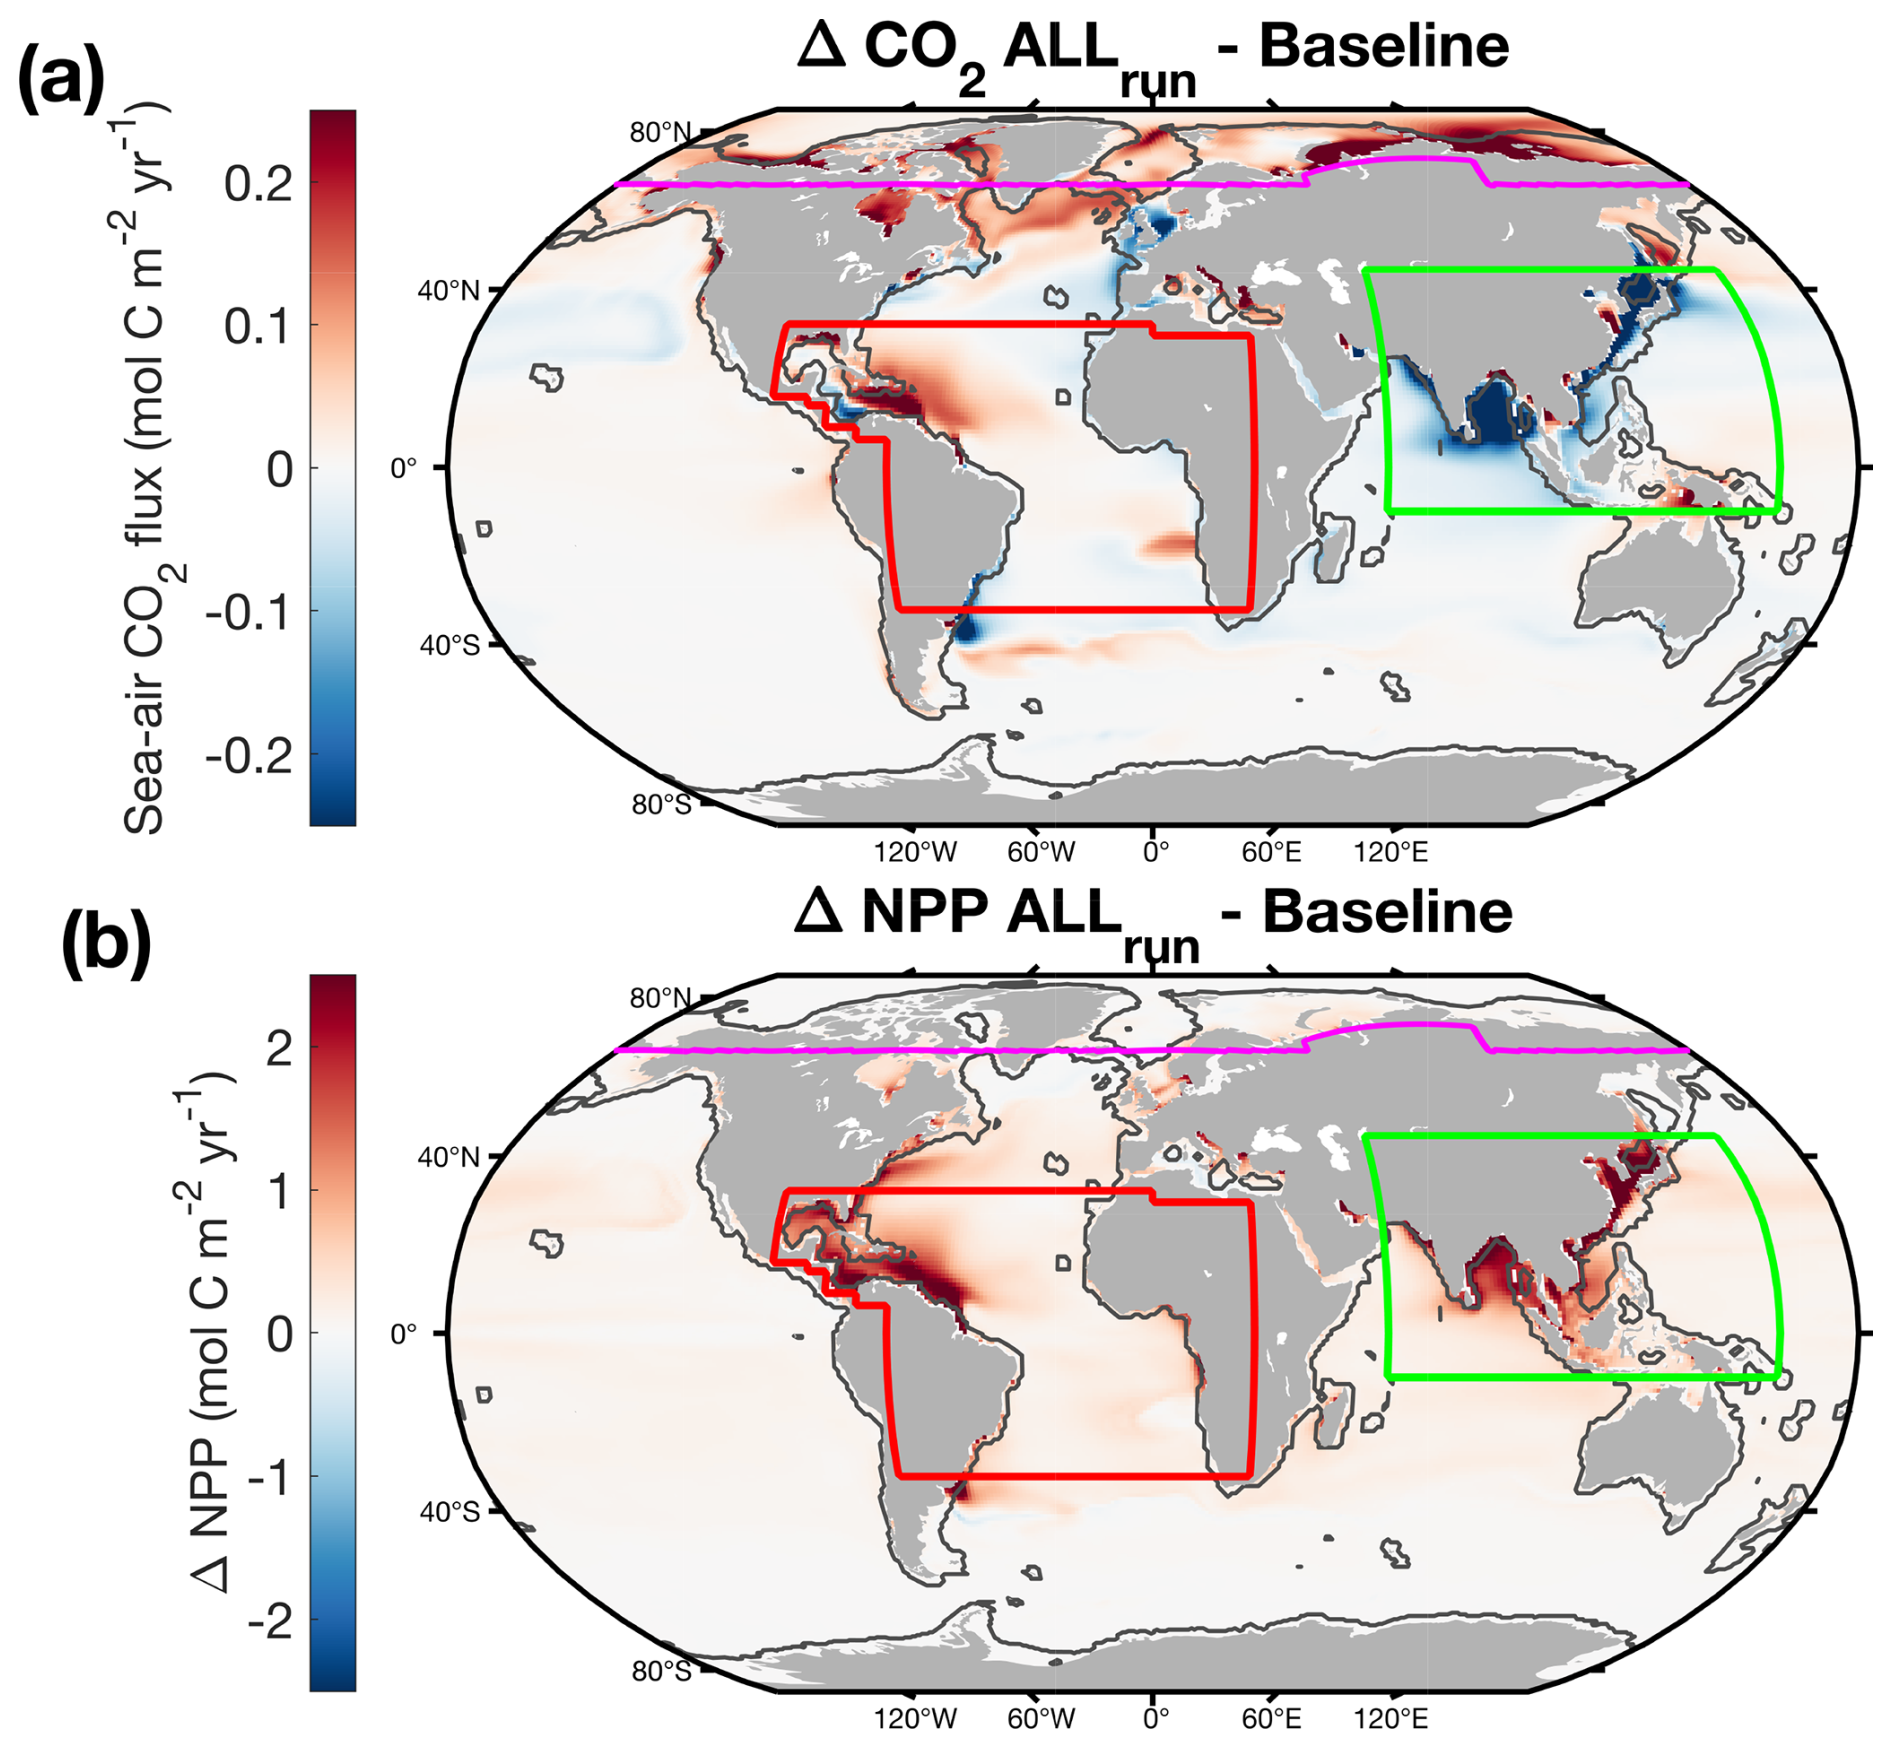
Figure 3Global-ocean (a) sea-air CO2 flux and (b) NPP driven by riverine inputs in ALLrun. In panel (a), positive values represent more CO2 outgassing (red colors), and negative values represent more uptake (blue colors) compared to Baseline. Fields represent time-mean values from January 2000 to December 2019. Colored lines on maps show domains used for regional analysis. The black line delineates the coastal ocean from the open ocean.
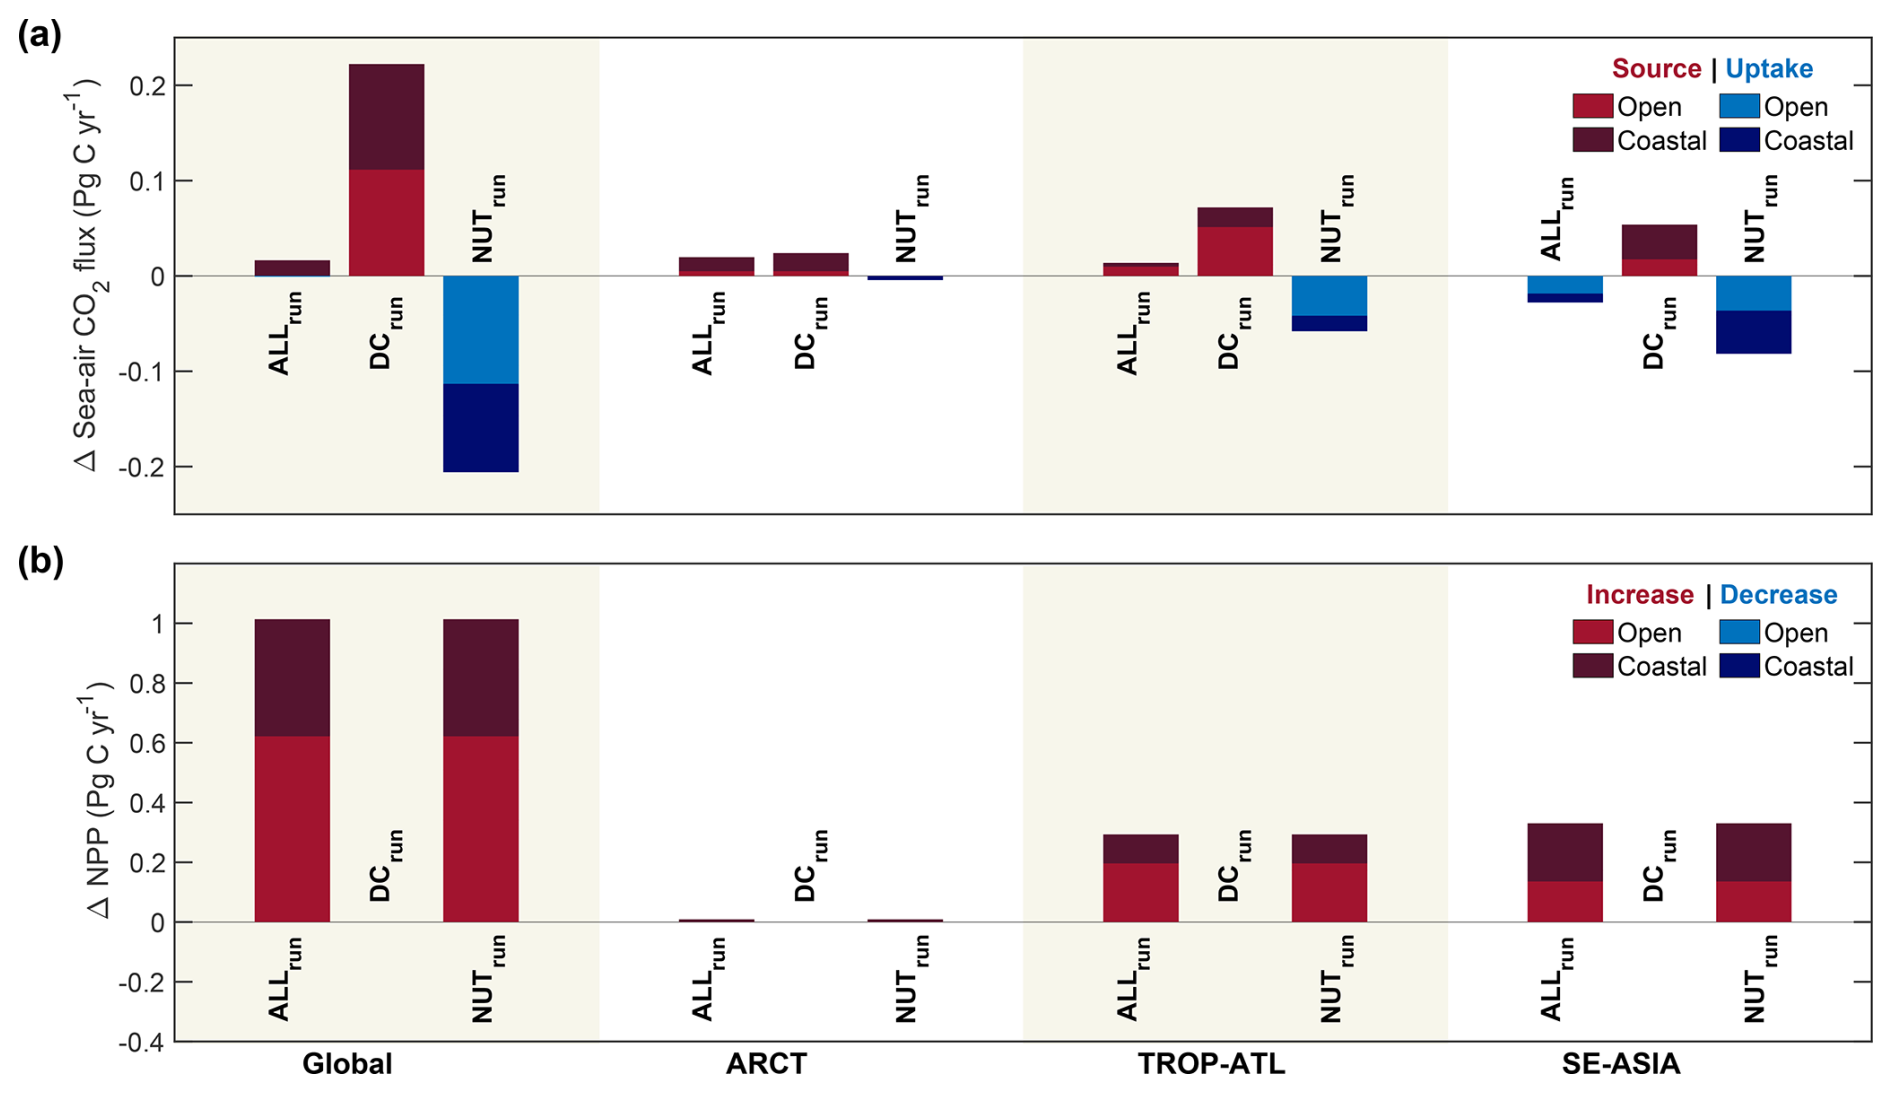
Figure 4Domain-integrated differences in (a) sea-air CO2 flux and (b) NPP driven by exports in each sensitivity experiment. Differences were computed from time-mean fields from January 2000 to December 2019.
4.1 ECCO-Darwin Baseline
Compared to state-of-the-art observation-based products, Baseline exhibits similar results to the version described in Carroll et al. (2020, 2022). Baseline depicts a time-mean global-ocean CO2 uptake of 2.58 Pg C yr−1 during 2000–2019. This is in relatively good agreement with MPI-SOM-FFN v2023 (−2.04 Pg C yr−1; Landschützer et al., 2016; Jersild et al., 2023), Jena Carboscope v2023 (−2.11 Pg C yr−1; Rödenbeck et al., 2013), and Copernicus CMEMS (−1.97 Pg C yr−1; Chau et al., 2022) products over the same period. Lower Baseline surface-ocean pCO2 and sea-air CO2 fluxes compared to data-based products in the coastal periphery, especially near large river mouths, are driven by freshwater inputs only. In the absence of associated biogeochemistry, freshwater discharge dilutes chemical species in the coastal ocean, decreasing the salinity, the concentration of DIC, and the alkalinity in surface waters. This highlights the need to include coupled freshwater and biogeochemical discharge in GOBMs, as associated carbon and nutrients can compensate for the freshwater-only dilution effect. In the marginal ice zone of high latitudes, the data-based products depict lower surface-ocean pCO2 and sea-air CO2 fluxes compared to Baseline. As the data-products are primarily computed from statistical/mechanistic models based on the SOCAT database, the sparse observational coverage can be a source of error and uncertainty in these regions. We note that in regions such as the Antarctic Continental Shelf and the Arctic Ocean, which have extensive seasonal sea-ice cover, the SOCAT database coverage is limited (Bakker et al., 2016; Sabine et al., 2013).
Baseline captures similar spatial patterns of NPP compared to the model ensemble of the REgional Carbon Cycle Assessment and Processes Phase-2 (RECCAP-2) project that aims at constraining present-day ocean carbon from observation-based estimates, inverse models, and GOBMs (Doney et al., 2024) (Fig. S11). Many uncertainties remain regarding global-ocean NPP estimates from remote sensing (due to uncertainty in algorithms) and models (due to different conceptual model architectures). Overall, NPP in Baseline (24.5 Pg C yr−1) lies in the lower bound of the wide range depicted by the RECCAP-2 model ensemble (25–57 Pg C yr−1; Doney et al., 2024) and remote-sensing algorithms (43–68 Pg C yr−1; Behrenfeld and Falkowski, 1997; Silsbe et al., 2016; Carr et al., 2006; Marra et al., 2003; Behrenfeld et al., 2005). This relatively low NPP results primarily from strong iron limitation in the High-Nutrient, Low-Chlorophyll (HNLC) regions in ECCO-Darwin (Carroll et al., 2020). The strong surface-ocean stratification and the weaker winter convection limit the replenishment of nutrients in the euphotic zone. Nevertheless, global-ocean NPP estimates will improve from enhanced space-time coverage of NPP measurements and associated key variables such as chlorophyll, light, nutrients, optical properties, and cell physiology (Bendtsen et al., 2023). An integration of environmental variables along with NPP measurements will greatly reduce models' spread and mismatch with synoptic in-situ observations. The implementation of a radiative transfer package (Dutkiewicz et al., 2019) in the next version of ECCO-Darwin, for which development is already underway, will permit the assimilation of direct ocean-color observations (remotely-sensed reflectance) and improve the model's estimate of global-ocean NPP.
4.2 Impact of Dissolved Carbon and Nutrient Inputs in ECCO-Darwin
We acknowledge that adding lateral inputs of freshwater, carbon, and nutrients in ECCO-Darwin Baseline can result in an additional source of spin-up and drift in the model simulations. As Baseline and sensitivity experiments are based on the same physical solution, the drift associated with the addition of freshwater is removed from our analysis; however, biogeochemical inputs may be an additional source of drift in the simulations presented in this study. The 28-year model period (1992–2019) does not allow the system to fully equilibrate with the addition of riverine inputs. However, time series of change in air–sea CO2 flux and NPP with the addition of river carbon and nutrients (Figs. S2–S9) indicate that most regions approach quasi-equilibrium by the year 2000, consistent with the global response. In contrast, the change in air–sea CO2 flux and NPP with the addition of river carbon and nutrients in the Arctic do not stabilize over the model period (Figs. S3 and S7). Regional variability in air–sea CO2 flux responses can be interpreted through differences in coastal residence times, as in the Arctic, long residence times promote remineralization and outgassing of terrestrial organic matter while limiting nutrient-driven uptake due to light limitation (Liu et al., 2019; Lacroix et al., 2021a). These extended residence times also explain why the Arctic response does not stabilize within the 28-year experiment timescale (Figs. S3 and S7), in contrast to other regions where shorter residence times facilitate more rapid equilibration. Conversely, regions such as the Amazon plume display substantial CO2 outgassing despite shorter residence times, but this is accompanied by elevated offshore transport, suggesting that riverine carbon inputs or remineralization rates may be overestimated in coastal systems where residence time is short. While the use of a Green's Functions-based optimization has been shown to reduce spin-up and drift in previous ECCO-Darwin solutions (Brix et al., 2015; Carroll et al., 2020), it will be necessary to optimize a new ECCO-Darwin solution that includes biogeochemical runoff to select the initial conditions and model parameters that will minimize model-data misfit (i.e., cost) and reduce spin-up drift – a focus of ongoing work. We note that the next version of ECCO-Darwin aims to include optimization controls of inputs ratio (DIC : ALK, NO : DIN, NO : DIN, and NH : DIN), allowing us to optimize riverine inputs based on remotely-sensed and in-situ ocean observations.
Table 4Change in sea-air CO2 flux and NPP driven by riverine inputs. Positive values represent an increase in CO2 outgassing or primary production; negative values represent an increase in CO2 uptake or a decrease in primary production. NA – not available
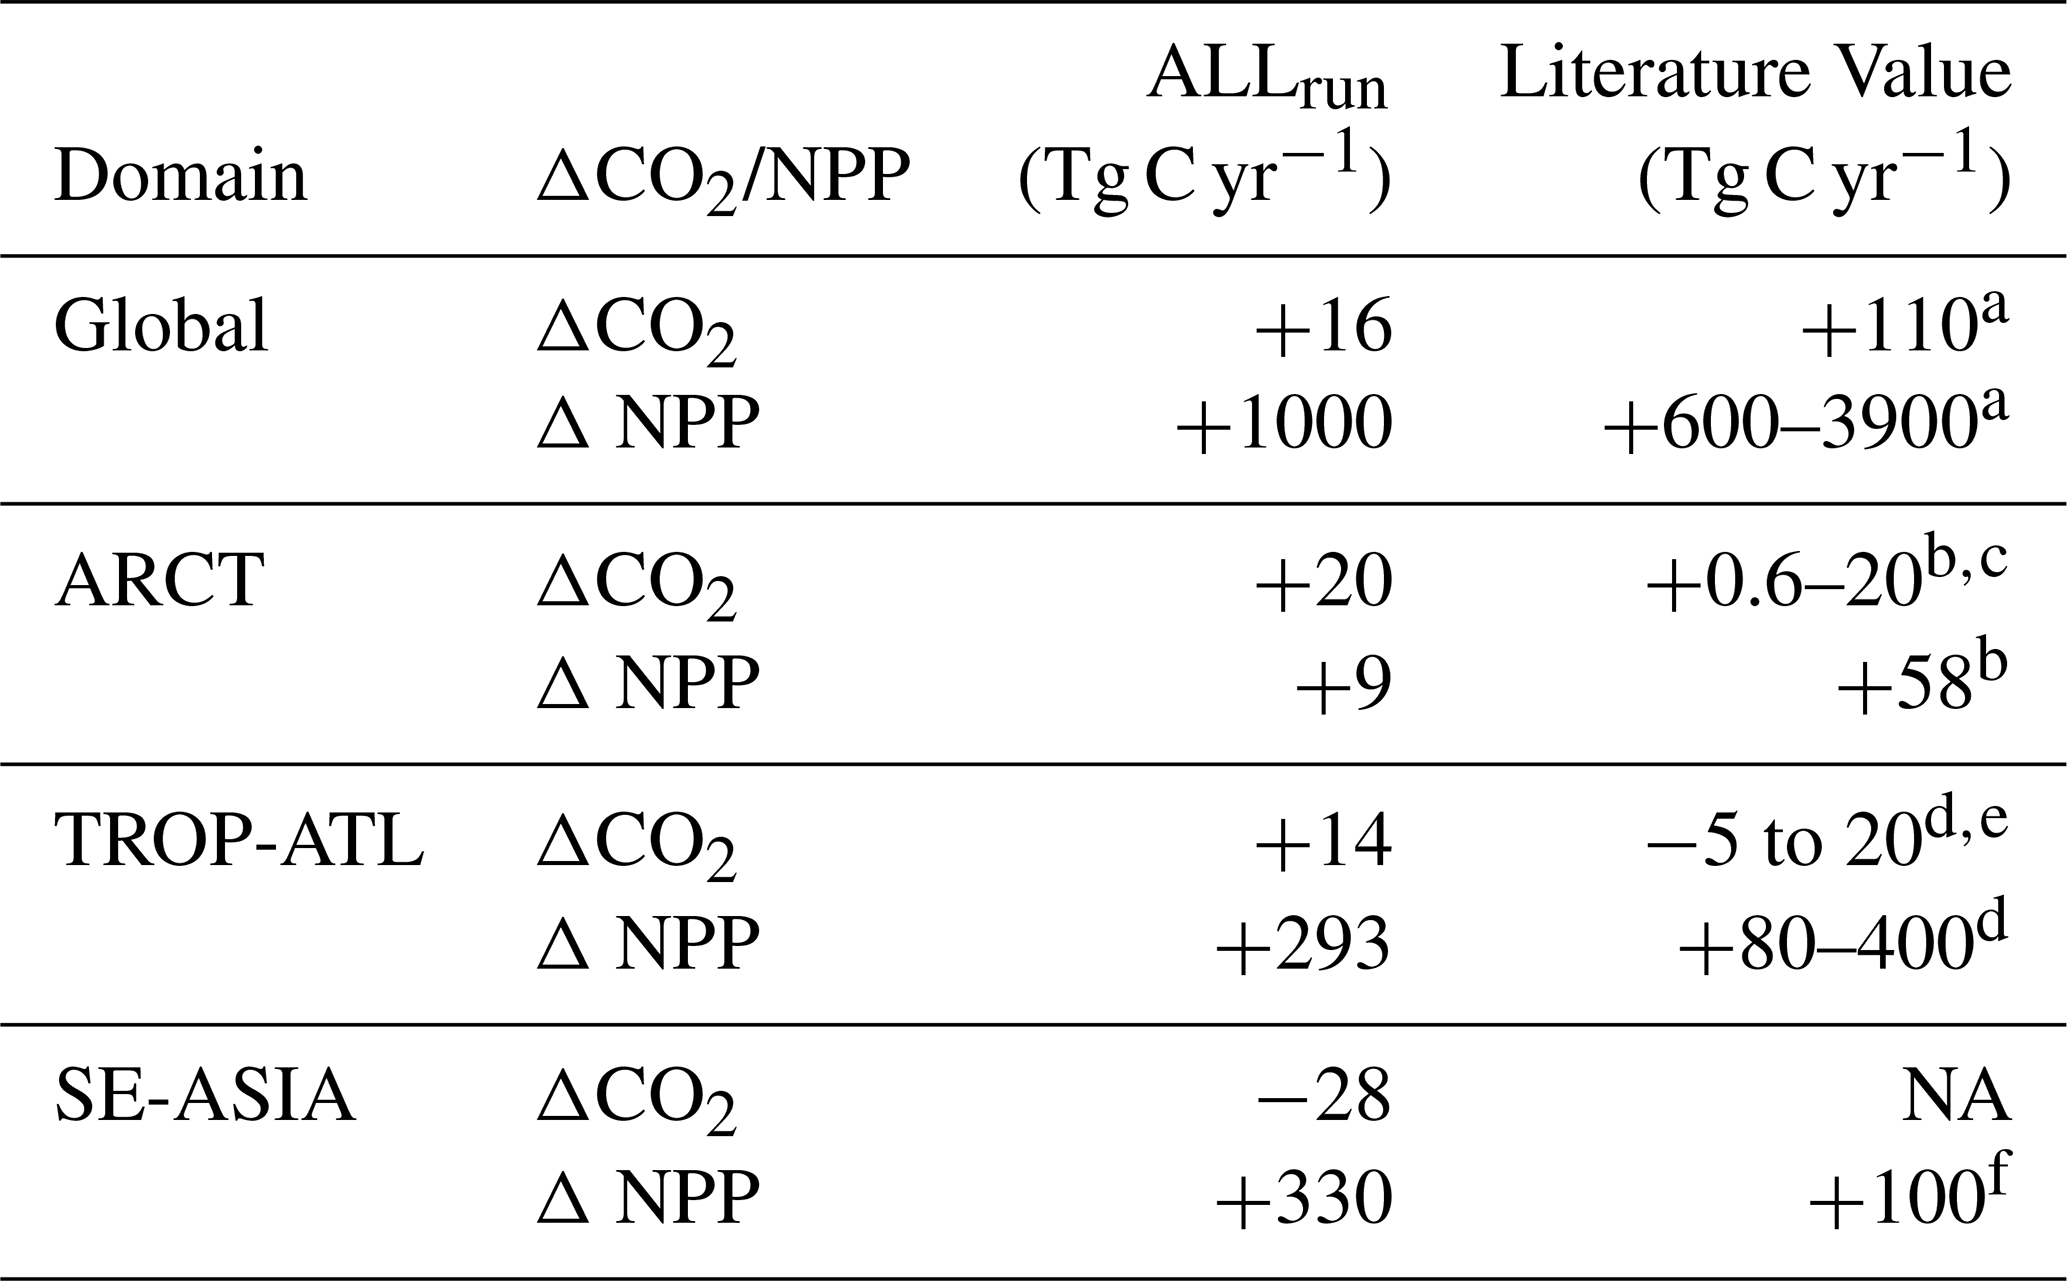
a Tivig et al. (2021); Cotrim da Cunha et al. (2007), b Manizza et al. (2011); Terhaar et al. (2021), c Effect of tDOC only, d da Cunha and Buitenhuis (2013); Louchard et al. (2021), e Lower bound is for smaller domain in western TROP-ATL, f Tivig et al. (2021).
In this study, carbon inputs drive a CO2 outgassing of 0.22 Pg C yr−1, while nutrient inputs drive a CO2 uptake of 0.20 Pg C yr−1 from enhanced primary productivity, which primarily occurs in the coastal ocean. Combined, carbon and nutrient inputs in ALLrun are limited to an outgassing of 0.02 Pg C yr−1 CO2; lower than literature estimates (Table 4). In the simulation with riverine carbon only (DCrun), our estimate of +0.22 Pg C yr−1 of air–sea CO2 flux is lower than previous preindustrial-based estimates of +0.59 Pg C yr−1 (Aumont et al., 2001) and +0.65 Pg C yr−1 (Regnier et al., 2022), but within the same order of magnitude. When including both riverine carbon and nutrients (ALLrun), our model simulates a smaller increase in air–sea CO2 flux (+0.02 Pg C yr−1), alongside a positive NPP response (+1 Pg C yr−1). This differs from the pre-industrial estimates of Lacroix et al. (2020), who found a comparable increase in air–sea CO2 flux (+0.23 Pg C yr−1) but a reduction in NPP (−1.78 Pg C yr−1) due to stabilizing ocean biogeochemical inventories. Adding nutrient inputs increases global-ocean marine NPP by 1 Pg C yr−1 compared to Baseline. The addition of tDIN and tDON also increased ocean NPP by 0.6 Pg C yr−1 in the model described by Tivig et al. (2021) (Table 4). In our study, the increase in NPP per surface area driven by riverine inputs was stronger in the coastal ocean compared to the open ocean, relative to their respective surface areas. This is consistent with the recent study of Mathis et al. (2024), which demonstrates the role of increased nutrient inputs in driving stronger biological carbon fixation and, thus, an enhanced CO2 sink in the coastal ocean during the last century. We note that our multi-decadal estimates do not reach equilibrium in the Arctic Ocean following the addition of riverine inputs (Figs. S2–S9) and do not have a realistic representation of blue carbon, bottom-sediment processes, and fine-resolution coastal ecosystems that drive the coastal-ocean sink and transformation of elements. Therefore, our results are not directly comparable to long-term and pre-industrial estimates of the ocean response to riverine inputs (Regnier et al., 2022; Resplandy et al., 2024).
Riverine inputs might be overlooked due to the lack of a more realistic representation of organic matter remineralization, allowing for the advection of excess dissolved carbon and nutrients into the open ocean. This may be due to our fixed DOC remineralization rate (100 d), which does not account for terrestrial-originating components with a faster degradation rate (labile to semi-labile), and the absence of a Land-to-Ocean Aquatic Continuum (LOAC) parameterization to account for estuarine and near-shore processes. For example, the strong CO2 outgassing following the addition of riverine inputs on the Siberian Shelf in ALLrun may be driven by an excess of carbon reaching the ocean. Across the Arctic LOAC, permafrost DOC may be degraded and outgassed back to the atmosphere further upstream (river, estuary, river plume) compared to ECCO-Darwin, while our riverine inputs are directly injected into the coastal ocean (Spencer et al., 2015; Bertin et al., 2025). In TROP-ATL, DOC from the Amazon river is expected to be more stable in the coastal ocean (up to hundreds of years; Louchard et al., 2021). In SE-ASIA, excess inputs of nutrients reaching the Bay of Bengal or Sea of Japan may drive excess model perturbation in this region, as the model lacks a LOAC parameterization and especially representation of estuaries where nutrients can be consumed upstream by biological activity (Cai, 2011).
Assuming that carbon and/or nutrient inputs from each watershed are routed completely and instantaneously to the ocean is a source of model error, as losses and gains occur through the LOAC, especially in estuaries. Sharples et al. (2017) estimated that 25 % of global DIN inputs were removed on continental shelves through biological uptake, denitrification, and anaerobic oxidation. The absence of denitrification within estuaries (3–10 Tg N yr−1) (Seitzinger et al., 2010) could alter N:P stoichiometry and downstream air–sea CO2 fluxes. However, our results do not include sea-air CO2 fluxes associated with these land-to-ocean components. Current GOBMs and Earth System Models (ESMs) used in IPCC Assessment Reports compute the amount of carbon introduced to coastal grid cells (i.e, lateral inputs) from reference watersheds or land-surface models that do not resolve the transport and transformation of carbon through the LOAC and, especially, estuaries and associated blue carbon pools (i.e., salt marshes and mangroves; Mayorga et al., 2010; Ciais et al., 2014; Lacroix et al., 2020; Ward et al., 2020). While coastal wetlands, estuaries, and continental shelves are a pivotal filter of carbon and biogeochemical elements, their action on reactive species has yet to be included in most GOBMs (Cai, 2011).
In Baseline, ARCT uptakes 213.9 Tg C yr−1 of atmospheric CO2; this may be an overestimate of the ARCT CO2 sink, as recent estimates from modeling, atmospheric inversions, and pCO2-based products range from 91–116 Tg C yr−1 (Yasunaka et al., 2023) (Fig. S10); although observations are highly limited in this region. In ARCT, riverine inputs dominated by carbon reduce this CO2 uptake by 20 Tg C yr−1. In Terhaar et al. (2019), CO2 outgassing increases by 90 % when riverine tDOC was doubled. However, Terhaar et al. (2019) used an instantaneous remineralization rate for DOC, resulting in rapid outgassing in the coastal region compared to our results. In addition, nutrient inputs also contribute to the Arctic Ocean's carbon sink as they fertilize coastal waters. NPP in the Arctic Ocean increased by 4 % (+9 Tg C yr−1) in ALLrun compared to Baseline. In Terhaar et al. (2019), the doubling of riverine nutrients (+2.3 Tg N yr−1) leads to an 11 %-increase of NPP. Recent estimates by Terhaar et al. (2021) suggest that riverine nutrients support up to 15 % (+58 Tg C yr−1) of marine NPP in the ARCT, in agreement with estimates by (Le Fouest et al., 2013, 2015) (Table 4). Therefore, biological CO2 uptake driven by riverine nitrogen and its capacity to compensate CO2 outgassing in ARCT might be underestimated in our study. We stress that the phytoplankton functional types in our global model are not representative of the specific Arctic Ocean ecology, and the lack of regionally-adjusted affinity for specific nutrients might hinder the model ecosystem response to riverine nutrients (Ardyna and Arrigo, 2020).
In Baseline, TROP-ATL is a source of CO2 to the atmosphere (0.10 Pg C yr−1), which agrees with both data-based products (Landschützer et al., 2016; Jersild et al., 2023; Rödenbeck, 2005) (0.04–0.08 Pg C yr−1) and GOBM results (da Cunha and Buitenhuis, 2013; Louchard et al., 2021) (0.03–0.04 Pg C yr−1). We note that previous studies show an input-driven increase in CO2 uptake of 0.005 and 0.02 Pg C yr−1 when adding biogeochemical runoff in TROP-ATL and western TROP-ATL, respectively (da Cunha and Buitenhuis, 2013; Louchard et al., 2021) (Table 4). However, in our simulations, the addition of riverine inputs in ALLrun enhanced the source of CO2 to the atmosphere (+0.02 Pg C yr−1) (Table 4). Contrary to the estimates of Louchard et al. (2021), which include physical effects associated with freshwater, such as enhanced upper-ocean stratification and gas solubility, our baseline simulation already includes these processes. Therefore, our set of experiments cannot isolate and quantify the impact of freshwater discharge on ocean biogeochemistry. Louchard et al. (2021) also included a regionally-adjusted plankton ecosystem, e.g., by including a nitrogen-fixing phytoplankton functional type, which increased the model's capability to resolve the biological pump and hence CO2 uptake.
SE-ASIA is a sink of atmospheric CO2 in Baseline (0.3 Pg C yr−1). Combining sea-air CO2 budgets for the different regions composed of SE-ASIA values from literature (East-Pacific, Indonesian seas, and North Indian Ocean (without including Oman and Somalian upwelling regions), we estimate an ocean carbon uptake of ∼ 0.2 Pg C yr−1 for the entire SE-ASIA domain (Kartadikaria et al., 2015; De Verneil et al., 2023; Zhong et al., 2022; Hood et al., 2023). The net sea-air CO2 exchange balance driven by riverine inputs in SE-ASIA results in a carbon uptake of 0.02 Pg C yr−1 in ALLrun. Compared to ARCT and TROP-ATL, carbon uptake in SE-ASIA is enhanced by a large increase in marine NPP (+0.33 Pg C yr−1, +9 %) driven by nutrient inputs. In Tivig et al. (2021), the simulated increase of NPP in response to riverine nitrogen was roughly 0.1 Pg C yr−1 in Asia, with the strongest increase in the Yellow Sea, similar to our results (Table 4). Locally, adding riverine biogeochemical runoff also drives a source of CO2 to the atmosphere, which is primarily limited to near river mouth locations in SE-ASIA. In the Yellow Sea and the Northern Bay of Bengal, close to the Yangtze and Ganges Rivers, the addition of riverine inputs at preindustrial levels in an ocean model also drove a CO2 outgassing in Lacroix et al. (2020). Noticeably, in our simulations, the addition of carbon inputs switches the northern Bay of Bengal from a carbon uptake to a source, as suggested by Hood et al. (2023). Similarly, the addition of tDOC in an ocean model of the Sunda Shelf Sea drives a CO2 outgassing by 3.1 Tg C yr−1 from 2013–2022 (Mayer et al., 2025). Most importantly, as nutrient inputs play a critical role in the SE-ASIA ocean carbon response, they need to be better constrained by a more extensive suite of observational data.
4.3 Recommendations for a More Realistic Representation of River-driven Carbon Cycling in ECCO-Darwin
This study presents a set of sensitivity experiments that quantify the contribution of riverine inputs in the ocean sea-air CO2 flux and NPP; this was made possible following necessary and consequential simplifications that we elaborate in the following section. We also describe ongoing and future developments of ECCO-Darwin that will address these limitations and move toward a fully-optimized ECCO-Darwin solution that accounts for key processes along coastal margins.
tALK inputs were based on a global-mean, constant ALK : DIC ratio (0.98). We note that the GLORICH database used to compute this ALK : DIC ratio has relatively good coverage over the American continent; however, Eurasia and Africa remain underrepresented (Hartmann et al., 2014). As such, the ALK : DIC ratio can vary substantially over regional and time scales. The lack of this spatially-granular information in our simulated riverine inputs may misrepresent tALK inputs and the ALK-driven buffering capacity of simulated river plumes (Dubois et al., 2010; Tank et al., 2012; Mol et al., 2018; Ghosh et al., 2021; Gomez et al., 2023; Terhaar et al., 2019). While in estuaries, the absence of ALK relative to DIC leads to higher pCO2 in upper-ocean waters and enhanced CO2 outgassing in the coastal zone, rivers also result in an excess of ALK relative to DIC on continental shelves, which can reduce ocean pCO2 through buffering and, thus, facilitate CO2 uptake (Cai et al., 2010; Louchard et al., 2021).
In the present study, riverine particulate matter (1) rapidly sinks to the seafloor near river mouths, and (2) once at the seafloor, sinking particulates in the model are removed (at a rate equivalent to the sinking rate) to limit the unrealistic accumulation of particulates at depth. Remineralization of sinking particulates associated with riverine inputs and enhanced marine biomass could be an additional source of dissolved nutrients and carbon to the upper ocean through vertical mixing or upwelling mechanisms; ultimately affecting the sea-air CO2 exchange depicted by the model in the coastal zone. In our current set-up, particulates from riverine-boosted production may be removed at the sediment-water interface too quickly, considering that most of the impact from riverine inputs occurs along the coast in shallow waters. Development to add a diagenetic sediment model in ECCO-Darwin is currently underway (RADI) to provide a more holistic representation of the global-ocean carbon sink (Sulpis et al., 2022).
Assuming that watershed-wide carbon and/or nutrient inputs are fully routed to the ocean is a misrepresentation, as losses and gains occur through the LOAC (Cai, 2011). Second, tDOC is degraded in coastal waters at different rates depending on its origin and subsequent labile fraction (Holmes et al., 2008; Wickland et al., 2012; Shen et al., 2012; Lønborg et al., 2020). In the present study, in addition to not accounting for refractory and labile fractions of tDOC, marine and terrestrial DOC are remineralized at the same rate (100 d). Overall, this could lead to unrealistic tDOC remineralization in some regions and thus excess of either ocean CO2 outgassing due to an excess of DIC or advection of organic matter to the open ocean; a limitation that also exists in other GOBMs due to undifferentiated remineralization rates. While recent modeling studies include separate pools of refractory and labile tDOC with different remineralization rates at regional scales (Louchard et al., 2021; Gibson et al., 2022; Bertin et al., 2023), the nature of tDOC needs to be better accounted for in GOBMs (such as in Aumont et al., 2001). For instance, the Amazon River – the largest global source of riverine tDOC to the ocean – contributes to almost 50 % (+0.014 Pg C yr−1) of the global-ocean CO2 outgassing in our study. However, tDOC from the Amazon River shows strong stability in the coastal ocean and is transported from the continental margin to the open ocean (Medeiros et al., 2015; Louchard et al., 2021). Increasing the refractory pool of Amazon tDOC could, therefore, decrease CO2 outgassing in our simulations. Nonetheless, the time scale of tDOC remineralization remains difficult to constrain as observation-based estimates contain large variability in reported values (Holmes et al., 2008; Wickland et al., 2012; Shen et al., 2012).
In this study, we added the capability to represent lateral fluxes of carbon and nutrients in the data-constrained ECCO-Darwin global-ocean biogeochemistry model and we carried out a suite of sensitivity experiments in order to quantify the impact of these lateral fluxes on coastal- and open-ocean biogeochemistry. Globally, the role of present-day riverine inputs in ECCO-Darwin results in substantial, compensating regional responses in ocean carbon uptake and outgassing. In carbon-dominated margins, such as the Arctic and Tropical Atlantic Oceans, rivers drive a large source of CO2 from the ocean to the atmosphere. In nutrient-dominated margins such as Southeast Asia, however, rivers drive a large ocean carbon uptake. While our experiments reveal clear regional responses, we identify limitations related to missing estuarine and benthic processing and incomplete equilibration over multi-decadal timescales in the Arctic Ocean. Our methodology combines Global NEWS 2 and JRA55-do to implement biogeochemical river discharge on top of point-source freshwater discharge globally, and at a daily frequency. These fields can be used (and are already being used) for many regional-to-global ocean model applications. Documenting such methodology is essential, given the lack of accurate representation of land-to-ocean and coastal processes in global ocean and Earth System Models (ESMs). This work is part of an open-science/open-source initiative available for everyone on the ECCO-Darwin GitHub repository (https://github.com/MITgcm-contrib/ecco_darwin/tree/master, last access: 20 January 2026). The quantification of the perturbation pertaining to the addition of terrestrial runoff in an ocean model over 20 years in the modern period is an interim, but significant step towards the development of new optimized ECCO-Darwin solutions that will integrate riverine inputs together with improved estuarine, sediment and benthic parameterizations.
As we computed riverine nutrient inputs from the combination of Global NEWS 2 loads with JRA55-DO runoff, Global NEWS 2 river concentrations must be co-located with JRA55-DO grid points exhibiting the closest annual discharge to avoid under- or overestimation of nutrient loads. In the case of the Amazon River, where freshwater and nutrient loads are extreme, we manually assigned the river mouth location from Global NEWS 2 to the corresponding JRA55-DO grid point. Additionally, when using equation in Li et al. (2017, equation 9), the DIC load from the Amazon river was overestimated and was therefore set to a mean literature value of 2.54 Tmol yr−1 (da Cunha and Buitenhuis, 2013; Probst et al., 1994; Li et al., 2017).
ECCO-Darwin model output is available at the ECCO Data Portal: http://data.nas.nasa.gov/ecco/ (last access: 20 January 2026). Model code and platform-independent instructions for running the ECCO-Darwin simulations used in this paper and generating runoff forcing are available from the ECCO-Darwin GitHub website: https://github.com/MITgcm-contrib/ecco_darwin/blob/master/v05/1deg_runoff and https://github.com/MITgcm-contrib/ecco_darwin/tree/master/code_util/LOAC/GlobalNews, respectively (https://doi.org/10.5281/zenodo.18319710, Carroll et al., 2026). Compiled outputs and model code (version on 17 October 2025) used in this study are available at: https://doi.org/10.5281/zenodo.17317011 (Savelli, 2025).
The supplement related to this article is available online at https://doi.org/10.5194/gmd-19-867-2026-supplement.
RS, DM, and DC. Data curation: RS. Funding acquisition: DM, MS, DC, and CEM. Software: RS, DM, DC, SD, and HZ. Evaluation: RS, DC, HZ, and CB. Formal analysis: RS, DM, DC, and JML. Investigation: RS, DM, DC, SD, JML, CB, CEM, MM, KCM, and AAB. Project administration: RS, DM, MS, DC, KWB, and CEM. Resources: DM, MS, DC, SD, and CEM. Supervision: DM, MS, and DC. Visualization: RS and DC. Writing–review and editing: RS, DM, DC, SD, JML, CB, CEM, KWB, MS, KCM, and AAB.
The contact author has declared that none of the authors has any competing interests.
Publisher's note: Copernicus Publications remains neutral with regard to jurisdictional claims made in the text, published maps, institutional affiliations, or any other geographical representation in this paper. The authors bear the ultimate responsibility for providing appropriate place names. Views expressed in the text are those of the authors and do not necessarily reflect the views of the publisher.
This research was conducted at Moss Landing Marine Laboratories (San José State University). A portion of this research was carried out at the Jet Propulsion Laboratory, California Institute of Technology, under a contract with the National Aeronautics and Space Administration (80NM0018D0004). © 2026. All rights reserved. RS acknowledges support from NASA Land Cover and Land Use Change and Interdisciplinary Research in Earth Science programs. Resources supporting this work were provided by the NASA High-End Computing (HEC) Program through the NASA Advanced Supercomputing (NAS) Division at Ames Research Center. We thank both reviewers for their thoughtful and constructive criticism of this work.
Support from NASA Carbon Monitoring System (grant nos. 80NSSC23K1232 and 80NM0018F0590) and NASA Modeling, Analysis, and Prediction (grant no. 80NM0018F0617) is acknowledged. JML was supported by NSF GEO-NERC program (grant no. 2347991).
This paper was edited by Vassilios Vervatis and reviewed by Fabrice Lacroix and one anonymous referee.
Amiotte Suchet, P., Probst, J.-L., and Ludwig, W.: Worldwide distribution of continental rock lithology: Implications for the atmospheric/soil CO2 uptake by continental weathering and alkalinity river transport to the oceans, Global Biogeochemical Cycles, 17, https://doi.org/10.1029/2002GB0018, 2003. a, b
Andrews, A. E., Kofler, J. D., Trudeau, M. E., Williams, J. C., Neff, D. H., Masarie, K. A., Chao, D. Y., Kitzis, D. R., Novelli, P. C., Zhao, C. L., Dlugokencky, E. J., Lang, P. M., Crotwell, M. J., Fischer, M. L., Parker, M. J., Lee, J. T., Baumann, D. D., Desai, A. R., Stanier, C. O., De Wekker, S. F. J., Wolfe, D. E., Munger, J. W., and Tans, P. P.: CO2, CO, and CH4 measurements from tall towers in the NOAA Earth System Research Laboratory's Global Greenhouse Gas Reference Network: instrumentation, uncertainty analysis, and recommendations for future high-accuracy greenhouse gas monitoring efforts, Atmospheric Measurement Techniques, 7, 647–687, https://doi.org/10.5194/amt-7-647-2014, 2014. a
Araujo, M., Noriega, C., and Lefèvre, N.: Nutrients and carbon fluxes in the estuaries of major rivers flowing into the tropical Atlantic, Frontiers in Marine Science, 1, https://doi.org/10.3389/fmars.2014.00010, 2014. a, b
Ardyna, M. and Arrigo, K. R.: Phytoplankton dynamics in a changing Arctic Ocean, Nature Climate Change, 10, 892–903, 2020. a
Aumont, O., Orr, J. C., Monfray, P., Ludwig, W., Amiotte-Suchet, P., and Probst, J.-L.: Riverine-driven interhemispheric transport of carbon, Global Biogeochemical Cycles, 15, 393–405, 2001. a, b, c
Bakker, D. C. E., Pfeil, B., Landa, C. S., Metzl, N., O'Brien, K. M., Olsen, A., Smith, K., Cosca, C., Harasawa, S., Jones, S. D., Nakaoka, S., Nojiri, Y., Schuster, U., Steinhoff, T., Sweeney, C., Takahashi, T., Tilbrook, B., Wada, C., Wanninkhof, R., Alin, S. R., Balestrini, C. F., Barbero, L., Bates, N. R., Bianchi, A. A., Bonou, F., Boutin, J., Bozec, Y., Burger, E. F., Cai, W.-J., Castle, R. D., Chen, L., Chierici, M., Currie, K., Evans, W., Featherstone, C., Feely, R. A., Fransson, A., Goyet, C., Greenwood, N., Gregor, L., Hankin, S., Hardman-Mountford, N. J., Harlay, J., Hauck, J., Hoppema, M., Humphreys, M. P., Hunt, C. W., Huss, B., Ibánhez, J. S. P., Johannessen, T., Keeling, R., Kitidis, V., Körtzinger, A., Kozyr, A., Krasakopoulou, E., Kuwata, A., Landschützer, P., Lauvset, S. K., Lefèvre, N., Lo Monaco, C., Manke, A., Mathis, J. T., Merlivat, L., Millero, F. J., Monteiro, P. M. S., Munro, D. R., Murata, A., Newberger, T., Omar, A. M., Ono, T., Paterson, K., Pearce, D., Pierrot, D., Robbins, L. L., Saito, S., Salisbury, J., Schlitzer, R., Schneider, B., Schweitzer, R., Sieger, R., Skjelvan, I., Sullivan, K. F., Sutherland, S. C., Sutton, A. J., Tadokoro, K., Telszewski, M., Tuma, M., van Heuven, S. M. A. C., Vandemark, D., Ward, B., Watson, A. J., and Xu, S.: A multi-decade record of high-quality fCO2 data in version 3 of the Surface Ocean CO2 Atlas (SOCAT), Earth Syst. Sci. Data, 8, 383–413, https://doi.org/10.5194/essd-8-383-2016, 2016. a, b, c
Battin, T. J., Lauerwald, R., Bernhardt, E. S., Bertuzzo, E., Gener, L. G., Hall, R. O., Jr, Hotchkiss, E. R., Maavara, T., Pavelsky, T. M., Ran, L., Raymond, P., Rosentreter, J. A., and Regnier, P.: River ecosystem metabolism and carbon biogeochemistry in a changing world. Nature, 613, 449–459, https://doi.org/10.1038/s41586-022-05500-8, 2023. a, b
Behrenfeld, M. J. and Falkowski, P. G.: Photosynthetic rates derived from satellite-based chlorophyll concentration, Limnology and Oceanography, 42, 1–20, https://doi.org/10.4319/lo.1997.42.1.0001, 1997. a
Behrenfeld, M. J., Boss, E., Siegel, D. A., and Shea, D. M.: Carbon-based ocean productivity and phytoplankton physiology from space, Global Biogeochemical Cycles, 19, https://doi.org/10.1029/2004GB002299, 2005. a
Bendtsen, J., Vives, C. R., and Richardson, K.: Primary production in the North Atlantic estimated from in situ water column data observed by Argo floats and remote sensing, Frontiers in Marine Science, 10, 1062413, https://doi.org/10.3389/fmars.2023.1062413, 2023. a
Bertin, C., Carroll, D., Menemenlis, D., Dutkiewicz, S., Zhang, H., Matsuoka, A., Tank, S., Manizza, M., Miller, C. E., Babin, M., Mangin, A., and Le Fouest, V.: Biogeochemical river runoff drives intense coastal Arctic Ocean CO2 outgassing, Geophysical Research Letters, 50, e2022GL102377, https://doi.org/10.1029/2022GL102377, 2023. a, b, c, d
Bertin, C., Carroll, D., Menemenlis, D., Dutkiewicz, S., Zhang, H., Matsuoka, A., Schwab, M., Savelli, R., Matsuoka, A., Manizza, M., Miller, C. E., Bowring, S., Guenet, B., and Le Fouest, V.: Paving the way for improved representation of coupled Physical and biogeochemical processes in Arctic River Plumes – A case study of the Mackenzie shelf, Permafrost and Periglacial Processes, https://doi.org/10.1002/ppp.2271, 2025. a
Bloom, A. A., Bowman, K. W., Liu, J., Konings, A. G., Worden, J. R., Parazoo, N. C., Meyer, V., Reager, J. T., Worden, H. M., Jiang, Z., Quetin, G. R., Smallman, T. L., Exbrayat, J.-F., Yin, Y., Saatchi, S. S., Williams, M., and Schimel, D. S.: Lagged effects regulate the inter-annual variability of the tropical carbon balance, Biogeosciences, 17, 6393–6422, https://doi.org/10.5194/bg-17-6393-2020, 2020. a
Brix, H., Menemenlis, D., Hill, C., Dutkiewicz, S., Jahn, O., Wang, D., Bowman, K., and Zhang, H.: Using Green’s Functions to initialize and adjust a global, eddying ocean biogeochemistry general circulation model, Ocean Modelling, 95, 1–14, 2015. a, b, c
Cai, W.-J.: Estuarine and coastal ocean carbon paradox: CO2 sinks or sites of terrestrial carbon incineration?, Annual Review of Marine Science, 3, 123–145, 2011. a, b, c, d
Cai, W.-J., Hu, X., Huang, W.-J., Jiang, L.-Q., Wang, Y., Peng, T.-H., and Zhang, X.: Alkalinity distribution in the western North Atlantic Ocean margins, Journal of Geophysical Research: Oceans, 115, https://doi.org/10.1029/2009JC005482, 2010. a
Carr, M.-E., Friedrichs, M. A., Schmeltz, M., Noguchi Aita, M., Antoine, D., Arrigo, K. R., Asanuma, I., Aumont, O., Barber, R., Behrenfeld, M., Bidigare, R., Buitenhuis, E. T., Campbell, J., Ciotti, A., Dierssen, H., Dowell, M., Dunne, J., Esaias, W., Gentili, B., Gregg, W., Groom, S., Hoepffner, N., Ishizaka, J., Kameda, T., Le Quéré, C., Lohrenz, S., Marra, J., Mélin, F., Moore, K., Morel, A., Reddy, T. E., Ryan, J., Scardi, M., Smyth, T., Turpie, K., Tilstone, G., Waters, K., and Yamanaka, Y.: A comparison of global estimates of marine primary production from ocean color, Deep Sea Research Part II: Topical Studies in Oceanography, 53, 741–770, https://doi.org/10.1016/j.dsr2.2006.01.028, 2006. a
Carroll, D., Menemenlis, D., Adkins, J., Bowman, K., Brix, H., Dutkiewicz, S., Fenty, I., Gierach, M., Hill, C., Jahn, O., Landschützer, P., Lauderdale, J. M., Liu, J., Manizza, M., Naviaux, J. D., Rödenbeck, C., Schimel, D. S., Van der Stocken, T., and Zhang, H.: The ECCO-Darwin data-assimilative global ocean biogeochemistry model: Estimates of seasonal to multidecadal surface ocean pCO2 and air-sea CO2 flux, Journal of Advances in Modeling Earth Systems, 12, e2019MS001888, https://doi.org/10.1029/2019MS001888, 2020. a, b, c, d, e, f, g
Carroll, D., Menemenlis, D., Dutkiewicz, S., Lauderdale, J. M., Adkins, J. F., Bowman, K. W., Brix, H., Fenty, I., Gierach, M. M., Hill, C., Jahn, O., Landschützer, P., Manizza, M., Mazloff, M. R., Miller, C. E., Schimel, D. S., Verdy, A., Whitt, D. B., and Zhang, H.: Attribution of space-time variability in global-ocean dissolved inorganic carbon, Global Biogeochemical Cycles, 36, e2021GB007162, https://doi.org/10.1029/2021GB007162, 2022. a, b, c
Carroll, D., Menemenlis, D., Zhang, H., Mazloff, M., McKinley, G., Fay, A., Dutkiewicz, S., Lauderdale, J., and Fenty, I.: Evaluation of the ECCO-DarwinOcean Biogeochemistry State Estimates. In-situ Observations, Zenodo, https://doi.org/10.5281/zenodo.10627664, 2024. a
Carroll, D., Menemenlis, D., Bertin, C., Hong, Z., Jahn, O., and Savelli, R.: rsavelli1617/ecco_darwin: ECCO-Darwin BGC runoff Savelli et al., 2026 GMD (Savelli1.0), Zenodo, [code], https://doi.org/10.5281/zenodo.18319710, 2026. a
Chau, T. T. T., Gehlen, M., and Chevallier, F.: A seamless ensemble-based reconstruction of surface ocean pCO2 and air–sea CO2 fluxes over the global coastal and open oceans, Biogeosciences, 19, 1087–1109, https://doi.org/10.5194/bg-19-1087-2022, 2022. a, b
Chen, F., Bai, X., Luo, G., Zhang, G., Ran, C., and Luo, X.: Assessing the global flux of organic carbon transported from terrestrial surfaces to oceans by rivers, Carbon Balance and Management, 20, https://doi.org/10.1186/s13021-025-00318-z, 2025. a
Ciais, P., Sabine, C., Bala, G., Bopp, L., Brovkin, V., Al., E., and House, J. I.: Carbon and other biogeochemical cycles, in: Climate change 2013: the physical science basis. Contribution of Working Group I to the Fifth Assessment Report of the Intergovernmental Panel on Climate Change, Cambridge University Press, 465–570, 2014. a
Compton, J., Mallinson, D., Glenn, C. R., Filippelli, G., Föllmi, K., Shields, G., and Zanin, Y.: Variations in the global phosphorus cycle, SEPM (Society for Sedimentary Geology), 21–33, https://doi.org/10.2110/pec.00.66.0021, 2000. a
Cotrim da Cunha, L., Buitenhuis, E. T., Le Quéré, C., Giraud, X., and Ludwig, W.: Potential impact of changes in river nutrient supply on global ocean biogeochemistry, Global Biogeochemical Cycles, 21, https://doi.org/10.1029/2006GB002718, 2007. a
da Cunha, L. C. and Buitenhuis, E. T.: Riverine influence on the tropical Atlantic Ocean biogeochemistry, Biogeosciences, 10, 6357–6373, https://doi.org/10.5194/bg-10-6357-2013, 2013. a, b, c, d, e, f, g, h, i, j
Dai, M., Su, J., Zhao, Y., Hofmann, E. E., Cao, Z., Cai, W.-J., Gan, J., Lacroix, F., Laruelle, G. G., Meng, F., Müller, J. D., Regnier, P. A., Wang, G., and Wang, Z.: Carbon Fluxes in the Coastal Ocean: Synthesis, Boundary Processes, and Future Trends, Annual Review of Earth and Planetary Sciences, 50, 593–626, https://doi.org/10.1146/annurev-earth-032320-090746, 2022. a
de Verneil, A., Lachkar, Z., Smith, S., and Lévy, M.: Evaluating the Arabian Sea as a regional source of atmospheric CO2: seasonal variability and drivers, Biogeosciences, 19, 907–929, https://doi.org/10.5194/bg-19-907-2022, 2022. a
Doney, S. C., Mitchell, K. A., Henson, S. A., Cavan, E., DeVries, T., Gruber, N., Hauck, J., Mouw, C. B., Müller, J. D., and Primeau, F. W.: Observational and numerical modeling constraints on the global ocean biological carbon pump, Global Biogeochemical Cycles, 38, e2024GB008156, https://doi.org/10.1029/2024GB008156, 2024. a, b
Dubois, K. D., Lee, D., and Veizer, J.: Isotopic constraints on alkalinity, dissolved organic carbon, and atmospheric carbon dioxide fluxes in the Mississippi River, Journal of Geophysical Research: Biogeosciences, 115, https://doi.org/10.1029/2009JG001102, 2010. a
Dutkiewicz, S., Hickman, A. E., Jahn, O., Henson, S., Beaulieu, C., and Monier, E.: Ocean colour signature of climate change, Nature Communications, 10, 578, https://doi.org/10.1038/s41467-019-08457-x, 2019. a
ECCO, C., Fenty, I., Fukumori, I., and Wang, O.: Synopsis of the ECCO V4r5 Global Ocean and Sea-Ice State Estimate, Zenodo, https://doi.org/10.5281/zenodo.13926714, 2024. a
Fekete, B. M., Vörösmarty, C. J., and Grabs, W.: High-resolution fields of global runoff combining observed river discharge and simulated water balances, Global Biogeochemical Cycles, 16, 15–1–15–10, 2002. a
Feng, Y., Menemenlis, D., Xue, H., Zhang, H., Carroll, D., Du, Y., and Wu, H.: Improved representation of river runoff in Estimating the Circulation and Climate of the Ocean Version 4 (ECCOv4) simulations: implementation, evaluation, and impacts to coastal plume regions, Geosci. Model Dev., 14, 1801–1819, https://doi.org/10.5194/gmd-14-1801-2021, 2021. a, b
Follows, M. J., Ito, T., and Dutkiewicz, S.: On the solution of the carbonate chemistry system in ocean biogeochemistry models, Ocean Modelling, 12, 290–301, 2006. a
Forget, G., Campin, J.-M., Heimbach, P., Hill, C. N., Ponte, R. M., and Wunsch, C.: ECCO version 4: an integrated framework for non-linear inverse modeling and global ocean state estimation, Geosci. Model Dev., 8, 3071–3104, https://doi.org/10.5194/gmd-8-3071-2015, 2015. a
Frings, P. J., Clymans, W., Fontorbe, G., Christina, L., and Conley, D. J.: The continental Si cycle and its impact on the ocean Si isotope budget, Chemical Geology, 425, 12–36, 2016. a
Gao, S., Schwinger, J., Tjiputra, J., Bethke, I., Hartmann, J., Mayorga, E., and Heinze, C.: Riverine impact on future projections of marine primary production and carbon uptake, Biogeosciences, 20, 93–119, https://doi.org/10.5194/bg-20-93-2023, 2023. a, b
Gao, Y., Jia, J., Lu, Y., Sun, K., Wang, J., and Wang, S.: Carbon transportation, transformation, and sedimentation processes at the land-river-estuary continuum, Fundamental Research, 4, 1594–1602, https://doi.org/10.1016/j.fmre.2022.07.007, 2024. a, b
Gaspar, P., Grégoris, Y., and Lefevre, J.-M.: A simple eddy kinetic energy model for simulations of the oceanic vertical mixing: Tests at station Papa and long-term upper ocean study site, Journal of Geophysical Research: Oceans, 95, 16179–16193, 1990. a
Ghosh, J., Chakraborty, K., Chanda, A., Akhand, A., Bhattacharya, T., Das, S., Das, I., Hazra, S., Choudhury, S., and Wells, M.: Outwelling of total alkalinity and dissolved inorganic carbon from the Hooghly River to the adjacent coastal Bay of Bengal, Environmental Monitoring and Assessment, 193, 415, https://doi.org/10.1007/s10661-021-09191-y, 2021. a
Gibson, G. A., Elliot, S., Clement Kinney, J., Piliouras, A., and Jeffery, N.: Assessing the Potential Impact of River Chemistry on Arctic Coastal Production, Frontiers in Marine Science, 9, 738363, https://doi.org/10.3389/fmars.2022.738363, 2022. a
Gomez, F. A., Lee, S.-K., Stock, C. A., Ross, A. C., Resplandy, L., Siedlecki, S. A., Tagklis, F., and Salisbury, J. E.: RC4USCoast: a river chemistry dataset for regional ocean model applications in the US East Coast, Gulf of Mexico, and US West Coast, Earth Syst. Sci. Data, 15, 2223–2234, https://doi.org/10.5194/essd-15-2223-2023, 2023. a
Hagemann, S. and Dümenil, L.: A parametrization of the lateral waterflow for the global scale, Climate Dynamics, 14, 17–31, 1997. a
Hagemann, S. and Gates, L. D.: Improving a subgrid runoff parameterization scheme for climate models by the use of high resolution data derived from satellite observations, Climate Dynamics, 21, 349–359, 2003. a
Hansell, D. A., Kadko, D., and Bates, N. R.: Degradation of terrigenous dissolved organic carbon in the western Arctic Ocean, Science, 304, 858–861, 2004. a
Hartmann, J., Jansen, N., Dürr, H. H., Kempe, S., and Köhler, P.: Global CO2-consumption by chemical weathering: What is the contribution of highly active weathering regions?, Global and Planetary Change, 69, 185–194, 2009. a
Hartmann, J., Lauerwald, R., and Moosdorf, N.: A brief overview of the GLObal RIver CHemistry Database, GLORICH, Procedia Earth and Planetary Science, 10, 23–27, 2014. a, b
Holmes, R. M., McClelland, J. W., Raymond, P. A., Frazer, B. B., Peterson, B. J., and Stieglitz, M.: Lability of DOC transported by Alaskan rivers to the Arctic Ocean, Geophysical Research Letters, 35, https://doi.org/10.1029/2007GL032837, 2008. a, b, c
Holmes, R. M., McClelland, J. W., Peterson, B. J., Tank, S. E., Bulygina, E., Eglinton, T.I., Gordeev, V. V., Gurtovaya, T. Y., Raymond, P. A., Repeta, D. J., Staples, R., Striegl, R. G., Zhulidov, A. V., and Zimov, S. A.: Seasonal and annual fluxes of nutrients and organic matter from large rivers to the Arctic Ocean and surrounding seas, Estuaries and Coasts, 35, 369–382, 2012. a, b, c, d, e, f
Hood, R. R., Rixen, T., Levy, M., Hansell, D. A., Coles, V. J., and Lachkar, Z.: Oxygen, carbon, and pH variability in the Indian Ocean, in: The Indian Ocean and its role in the global climate system, Elsevier, 265–291, 2024. a, b
Jersild, A., Landschützer, P., Gruber, N., Bakker, D. C. E.: An observation-based global monthly gridded sea surface pCO2 and air-sea CO2 flux product from 1982 onward and its monthly climatology (NCEI Accession 0160558). NOAA National Centers for Environmental Information [Data set], https://doi.org/10.7289/v5z899n6, 2023. a, b, c
Jones, M. W., Andrew, R. M., Peters, G. P., Janssens-Maenhout, G., De-Gol, A. J., Ciais, P., Patra, P. K., Chevallier, F., and Le Quéré, C.: Gridded fossil CO2 emissions and related O2 combustion consistent with national inventories 1959–2018, Scientific Data, 8, https://doi.org/10.1038/s41597-020-00779-6, 2021. a
Kaiser, K., Benner, R., and Amon, R.: The fate of terrigenous dissolved organic carbon on the E urasian shelves and export to the North Atlantic, Journal of Geophysical Research: Oceans, 122, 4–22, 2017. a
Kartadikaria, A. R., Watanabe, A., Nadaoka, K., Adi, N. S., Prayitno, H. B., Soemorumekso, S., Muchtar, M., Triyulianti, I., Setiawan, A., Suratno, S., and Khasanah, E. N.: CO2 sink/source characteristics in the tropical Indonesian seas, Journal of Geophysical Research: Oceans, 120, 7842–7856, 2015. a
Krinner, G., Viovy, N., de Noblet-Ducoudré, N., Ogée, J., Polcher, J., Friedlingstein, P., Ciais, P., Sitch, S., and Prentice, I. C.: A dynamic global vegetation model for studies of the coupled atmosphere-biosphere system, Global Biogeochemical Cycles, 19, https://doi.org/10.1029/2003GB002199, 2005. a
Lacroix, F., Ilyina, T., and Hartmann, J.: Oceanic CO2 outgassing and biological production hotspots induced by pre-industrial river loads of nutrients and carbon in a global modeling approach, Biogeosciences, 17, 55–88, https://doi.org/10.5194/bg-17-55-2020, 2020. a, b, c, d, e, f
Lacroix, F., Ilyina, T., Laruelle, G. G., and Regnier, P.: Reconstructing the Preindustrial Coastal Carbon Cycle Through a Global Ocean Circulation Model: Was the Global Continental Shelf Already Both Autotrophic and a CO2 Sink?, Global Biogeochemical Cycles, 35, e2020GB006603, https://doi.org/10.1029/2020GB006603, 2021a. a
Lacroix, F., Ilyina, T., Mathis, M., Laruelle, G. G., and Regnier, P.: Historical increases in land-derived nutrient inputs may alleviate effects of a changing physical climate on the oceanic carbon cycle, Global Change Biology, 27, 5491–5513, 2021b. a, b
Landschützer, P., Gruber, N., and Bakker, D. C.: Decadal variations and trends of the global ocean carbon sink, Global Biogeochemical Cycles, 30, 1396–1417, 2016. a, b, c
Le Fouest, V., Babin, M., and Tremblay, J.-É.: The fate of riverine nutrients on Arctic shelves, Biogeosciences, 10, 3661–3677, https://doi.org/10.5194/bg-10-3661-2013, 2013. a, b
Le Fouest, V., Manizza, M., Tremblay, B., and Babin, M.: Modelling the impact of riverine DON removal by marine bacterioplankton on primary production in the Arctic Ocean, Biogeosciences, 12, 3385–3402, https://doi.org/10.5194/bg-12-3385-2015, 2015. a
Li, M., Peng, C., Wang, M., Xue, W., Zhang, K., Wang, K., Shi, G., and Zhu, Q.: The carbon flux of global rivers: A re-evaluation of amount and spatial patterns, Ecological Indicators, 80, 40–51, 2017. a, b, c, d, e, f, g, h, i
Liu, M., Raymond, P. A., Lauerwald, R., Zhang, Q., Trapp-Müller, G., Davis, K. L., Moosdorf, N., Xiao, C., Middelburg, J. J., Bouwman, A. F., Beusen, A. H. W., Peng, C., Lacroix, F., Tian, H., Wang, J., Li, M., Zhu, Q., Cohen, S., van Hoek, W. J., Li, Y., Li, Y., Yao, Y., and Regnier, P.: Global riverine land-to-ocean carbon export constrained by observations and multi-model assessment, Nature Geoscience, https://doi.org/10.1038/s41561-024-01524-z, 2024. a, b, c, d
Liu, X., Dunne, J. P., Stock, C. A., Harrison, M. J., Adcroft, A., and Resplandy, L.: Simulating Water Residence Time in the Coastal Ocean: A Global Perspective, Geophysical Research Letters, 46, 13910–13919, https://doi.org/10.1029/2019GL085097, 2019. a
Lønborg, C., Carreira, C., Jickells, T., and Álvarez-Salgado, X. A.: Impacts of Global Change on Ocean Dissolved Organic Carbon (DOC) Cycling, Frontiers in Marine Science, 7, https://doi.org/10.3389/fmars.2020.00466, 2020. a
Louchard, D., Gruber, N., and Münnich, M.: The impact of the Amazon on the biological pump and the air-sea CO2 balance of the Western Tropical Atlantic, Global Biogeochemical Cycles, 35, e2020GB006818, https://doi.org/10.1029/2020GB006818, 2021. a, b, c, d, e, f, g, h, i, j, k
Ma, M., Zhang, H., Lauerwald, R., Ciais, P., and Regnier, P.: Estimating lateral nitrogen transfers over the last century through the global river network using a land surface model, Earth Syst. Dynam., 16, 841–867, https://doi.org/10.5194/esd-16-841-2025, 2025. a, b
Mahowald, N. M., Engelstaedter, S., Luo, C., Sealy, A., Artaxo, P., Benitez-Nelson, C., Bonnet, S., Chen, Y., Chuang, P. Y., Cohen, D. D., Dulac, F., Herut, B., Johansen, A. M., Kubilay, N., Losno, R., Maenhaut, W., Paytan, A., Prospero, J. M., Shank, L. M., and Siefert, R. L.: Atmospheric iron deposition: global distribution, variability, and human perturbations, Annual Review of Marine Science, 1, 245–278, 2009. a
Manizza, M., Follows, M. J., Dutkiewicz, S., Menemenlis, D., McClelland, J. W., Hill, C. N., Peterson, B. J., and Key, R. M.: A model of the Arctic Ocean carbon cycle, Journal of Geophysical Research: Oceans, 116, https://doi.org/10.1029/2011JC006998, 2011. a, b
Manizza, M., Menemenlis, D., Zhang, H., and Miller, C. E.: Modeling the recent changes in the Arctic Ocean CO2 sink (2006–2013), Global Biogeochemical Cycles, 33, 420–438, 2019. a, b
Marra, J., Ho, C., and Trees, C.: An alternative algorithm for the calculation of primary productivity from remote sensing data, Lamont Doherty Earth Observatory Technical Report (LDEO-2003-1), https://doi.org/10.7916/d8-cbv5-jh05, 2003. a
Marshall, J., Adcroft, A., Hill, C. N., Perelman, L., and Heisey, C.: A finite‐volume, incompressible Navier Stokes model for studies of the ocean on parallel computers, Journal of Geophysical Research: Oceans, 102, 5753–5766, https://doi.org/10.1029/96JC02775, 1997a. a
Marshall, J., Hill, C., Perelman, L., and Adcroft, A.: Hydrostatic, quasi‐hydrostatic, and nonhydrostatic ocean modeling, Journal of Geophysical Research: Oceans, 102, 5733–5752, https://doi.org/10.1029/96JC02776, 1997b. a
Mathis, M., Logemann, K., Maerz, J., Lacroix, F., Hagemann, S., Chegini, F., Ramme, L., Ilyina, T., Korn, P., and Schrum, C.: Seamless integration of the coastal ocean in global marine carbon cycle modeling, Journal of Advances in Modeling Earth Systems, 14, e2021MS002789, https://doi.org/10.1029/2021MS002789, 2022. a
Mathis, M., Lacroix, F., Hagemann, S., Nielsen, D. M., Ilyina, T., and Schrum, C.: Enhanced CO2 uptake of the coastal ocean is dominated by biological carbon fixation, Nature Climate Change, https://doi.org/10.1038/s41558-024-01956-w, 2024. a
Mayer, B., Hagemann, S., Zhou, Y., Chen, Y., Ang, S. B. H., Pätsch, J., and Martin, P.: Modeling Terrestrial Dissolved Organic Carbon and Its Effect on the Carbonate System in the Sunda Shelf Seas, Southeast Asia, Global Biogeochemical Cycles, 39, e2024GB008433, https://doi.org/10.1029/2024GB008433, 2025. a
Mayorga, E., Seitzinger, S. P., Harrison, J. A., Dumont, E., Beusen, A. H., Bouwman, A., Fekete, B. M., Kroeze, C., and Van Drecht, G.: Global nutrient export from WaterSheds 2 (NEWS 2): model development and implementation, Environmental Modelling & Software, 25, 837–853, 2010. a, b, c, d, e
Medeiros, P. M., Seidel, M., Ward, N. D., Carpenter, E. J., Gomes, H. R., Niggemann, J., Krusche, A. V., Richey, J. E., Yager, P. L., and Dittmar, T.: Fate of the Amazon River dissolved organic matter in the tropical Atlantic Ocean, Global Biogeochemical Cycles, 29, 677–690, 2015. a
Menemenlis, D., Fukumori, I., and Lee, T.: Using Green's functions to calibrate an ocean general circulation model, Monthly Weather Review, 133, 1224–1240, 2005. a
Mol, J., Thomas, H., Myers, P. G., Hu, X., and Mucci, A.: Inorganic carbon fluxes on the Mackenzie Shelf of the Beaufort Sea, Biogeosciences, 15, 1011–1027, https://doi.org/10.5194/bg-15-1011-2018, 2018. a
Probst, J.-L., Mortatti, J., and Tardy, Y.: Carbon river fluxes and weathering CO2 consumption in the Congo and Amazon river basins, Applied Geochemistry, 9, 1–13, 1994. a, b
Regnier, P., Resplandy, L., Najjar, R. G., and Ciais, P.: The land-to-ocean loops of the global carbon cycle, Nature, 603, 401–410, 2022. a, b, c
Resplandy, L., Keeling, R., Rödenbeck, C., Stephens, B., Khatiwala, S., Rodgers, K., Long, M., Bopp, L., and Tans, P.: Revision of global carbon fluxes based on a reassessment of oceanic and riverine carbon transport, Nature Geoscience, 11, 504–509, 2018. a
Resplandy, L., Hogikyan, A., Müller, J. D., Najjar, R. G., Bange, H. W., Bianchi, D., Weber, T., Cai, W.-J., Doney, S. C., Fennel, K., Gehlen, M., Hauck, J., Lacroix, F., Landschützer, P., Le Quéré, C., Roobaert, A., Schwinger, J., Berthet, S., Bopp, L., Chau, T. T. T., Dai, M., Gruber, N., Ilyina, T., Kock, A., Manizza, M., Lachkar, Z., Laruelle, G. G., Liao, E., Lima, I. D., Nissen, C., Rödenbeck, C., Séférian, R., Toyama, K., Tsujino, H., and Regnier, P.: A Synthesis of Global Coastal Ocean Greenhouse Gas Fluxes, Global Biogeochemical Cycles, 38, e2023GB007803, https://doi.org/10.1029/2023GB007803, 2024. a, b
Rödenbeck, C.: Estimating CO2 sources and sinks from atmospheric mixing ratio measurements using a global inversion of atmospheric transport, Technical reports, ISSN 1615-7400, 2005. a
Rödenbeck, C., Keeling, R. F., Bakker, D. C. E., Metzl, N., Olsen, A., Sabine, C., and Heimann, M.: Global surface-ocean pCO2 and sea–air CO2 flux variability from an observation-driven ocean mixed-layer scheme, Ocean Sci., 9, 193–216, https://doi.org/10.5194/os-9-193-2013, 2013. a, b
Sabine, C. L., Hankin, S., Koyuk, H., Bakker, D. C. E., Pfeil, B., Olsen, A., Metzl, N., Kozyr, A., Fassbender, A., Manke, A., Malczyk, J., Akl, J., Alin, S. R., Bellerby, R. G. J., Borges, A., Boutin, J., Brown, P. J., Cai, W.-J., Chavez, F. P., Chen, A., Cosca, C., Feely, R. A., González-Dávila, M., Goyet, C., Hardman-Mountford, N., Heinze, C., Hoppema, M., Hunt, C. W., Hydes, D., Ishii, M., Johannessen, T., Key, R. M., Körtzinger, A., Landschützer, P., Lauvset, S. K., Lefèvre, N., Lenton, A., Lourantou, A., Merlivat, L., Midorikawa, T., Mintrop, L., Miyazaki, C., Murata, A., Nakadate, A., Nakano, Y., Nakaoka, S., Nojiri, Y., Omar, A. M., Padin, X. A., Park, G.-H., Paterson, K., Perez, F. F., Pierrot, D., Poisson, A., Ríos, A. F., Salisbury, J., Santana-Casiano, J. M., Sarma, V. V. S. S., Schlitzer, R., Schneider, B., Schuster, U., Sieger, R., Skjelvan, I., Steinhoff, T., Suzuki, T., Takahashi, T., Tedesco, K., Telszewski, M., Thomas, H., Tilbrook, B., Vandemark, D., Veness, T., Watson, A. J., Weiss, R., Wong, C. S., and Yoshikawa-Inoue, H.: Surface Ocean CO2 Atlas (SOCAT) gridded data products, Earth Syst. Sci. Data, 5, 145–153, https://doi.org/10.5194/essd-5-145-2013, 2013. a, b, c
Savelli, R.: Implementing Riverine Biogeochemical Inputs in ECCO-Darwin: A Sensitivity Analysis of Terrestrial Fluxes in a Data-Assimilative Global Ocean Biogeochemistry Model, Zenodo [data set], https://doi.org/10.5281/zenodo.17317011, 2025. a
Séférian, R., Berthet, S., Yool, A., Palmiéri, J., Bopp, L., Tagliabue, A., Kwiatkowski, L., Aumont, O., Christian, J., Dunne, J., Gehlen, M., Ilyina, T., John, J. G., Li, H., Long, M. C., Luo, J. Y., Nakano, H., Romanou, A., Schwinger, J., Stock, C., Santana-Falcón, Y., Takano, Y., Tjiputra, J., Tsujino, H., Watanabe, M., Wu, T., Wu, F., and Yamamoto, A.: Tracking improvement in simulated marine biogeochemistry between CMIP5 and CMIP6, Current Climate Change Reports, 6, 95–119, 2020. a
Seitzinger, S. P., Mayorga, E., Bouwman, A. F., Kroeze, C., Beusen, A. H., Billen, G., Van Drecht, G., Dumont, E., Fekete, B., Garnier, J., and Harrison, J. A.: Global river nutrient export: A scenario analysis of past and future trends, Global Biogeochemical Cycles, 24, https://doi.org/10.1029/2009GB003587, 2010. a
Sharples, J., Middelburg, J. J., Fennel, K., and Jickells, T. D.: What proportion of riverine nutrients reaches the open ocean?, Global Biogeochemical Cycles, 31, 39–58, 2017. a, b, c, d, e, f, g, h
Shen, Y., Fichot, C. G., and Benner, R.: Dissolved organic matter composition and bioavailability reflect ecosystem productivity in the Western Arctic Ocean, Biogeosciences, 9, 4993–5005, https://doi.org/10.5194/bg-9-4993-2012, 2012. a, b
Silsbe, G. M., Behrenfeld, M. J., Halsey, K. H., Milligan, A. J., and Westberry, T. K.: The CAFE model: A net production model for global ocean phytoplankton, Global Biogeochemical Cycles, 30, 1756–1777, https://doi.org/10.1002/2016GB005521, 2016. a
Spencer, R. G. M., Mann, P. J., Dittmar, T., Eglinton, T. I., McIntyre, C., Holmes, R. M., Zimov, N., and Stubbins, A.: Detecting the signature of permafrost thaw in Arctic rivers, Geophysical Research Letters, 42, 2830–2835, https://doi.org/10.1002/2015GL063498, 2015. a
Suchet, P. A. and Probst, J.-L.: A global model for present-day atmospheric/soil CO2 consumption by chemical erosion of continental rocks (GEM-CO2), Tellus B, 47, 273–280, 1995. a
Sulpis, O., Humphreys, M. P., Wilhelmus, M. M., Carroll, D., Berelson, W. M., Menemenlis, D., Middelburg, J. J., and Adkins, J. F.: RADIv1: a non-steady-state early diagenetic model for ocean sediments in Julia and MATLAB/GNU Octave, Geosci. Model Dev., 15, 2105–2131, https://doi.org/10.5194/gmd-15-2105-2022, 2022. a
Suzuki, T., Yamazaki, D., Tsujino, H., Komuro, Y., Nakano, H., and Urakawa, S.: A dataset of continental river discharge based on JRA-55 for use in a global ocean circulation model, Journal of Oceanography, 74, 421–429, 2018. a
Tank, S. E., Raymond, P. A., Striegl, R. G., McClelland, J. W., Holmes, R. M., Fiske, G. J., and Peterson, B. J.: A land-to-ocean perspective on the magnitude, source and implication of DIC flux from major Arctic rivers to the Arctic Ocean, Global Biogeochemical Cycles, 26, https://doi.org/10.1029/2011GB004192, 2012. a, b
Tank, S. E., McClelland, J. W., Spencer, R. G., Shiklomanov, A. I., Suslova, A., Moatar, F., Amon, R. M., Cooper, L. W., Elias, G., Gordeev, V. V., Guay, C., Gurtovaya, T. Y., Kosmenko, L. S., Mutter, E. A., Peterson, B. J., Peucker-Ehrenbrink, B., Raymond, P. A., Schuster, P. F., Scott, L., Staples, R., Striegl, R. G., Tretiakov, M., Zhulidov, A. V., Zimov, N., Zimov, S., and Holmes, R. M.: Recent trends in the chemistry of major northern rivers signal widespread Arctic change, Nature Geoscience, 16, 789–796, 2023. a
Terhaar, J., Orr, J., Ethé, C., Regnier, P., and Bopp, L.: Simulated Arctic Ocean response to doubling of riverine carbon and nutrient delivery, Global Biogeochemical Cycles, 33, 1048–1070, 2019. a, b, c, d, e
Terhaar, J., Lauerwald, R., Regnier, P., Gruber, N., and Bopp, L.: Around one third of current Arctic Ocean primary production sustained by rivers and coastal erosion, Nature Communications, 12, https://doi.org/10.1038/s41467-020-20470-z, 2021. a, b
Tian, H., Yao, Y., Li, Y., Shi, H., Pan, S., Najjar, R. G., Pan, N., Bian, Z., Ciais, P., Cai, W.-J., Dai, M., Friedrichs, M. A. M., Li, H.-Y., Lohrenz, S., and Leung, L. R.: Increased Terrestrial Carbon Export and CO2 Evasion From Global Inland Waters Since the Preindustrial Era, Global Biogeochemical Cycles, 37, e2023GB007776, https://doi.org/10.1029/2023GB007776, 2023. a, b
Tivig, M., Keller, D. P., and Oschlies, A.: Riverine nitrogen supply to the global ocean and its limited impact on global marine primary production: a feedback study using an Earth system model, Biogeosciences, 18, 5327–5350, https://doi.org/10.5194/bg-18-5327-2021, 2021. a, b, c, d
Tsujino, H., Urakawa, S., Nakano, H., Small, R. J., Kim, W. M., Yeager, S. G., Danabasoglu, G., Suzuki, T., Bamber, J. L., Bentsen, M., Böning, C. W., Bozec, A., Chassignet, E. P., Curchitser, E., Boeira Dias, F., Durack, P. J., Griffies, S. M., Harada, Y., Ilicak, M., Josey, S. A., Kobayashi, C., Kobayashi, S., Komuro, Y., Large, W. G., Le Sommer, J., Marsland, S. J., Masina, S., Scheinert, M., Tomita, H., Valdivieso, M., and Yamazaki, D.: JRA-55 based surface dataset for driving ocean–sea-ice models (JRA55-do), Ocean Modelling, 130, 79–139, 2018. a
Turner, R. E., Rabalais, N. N., Justic', D., and Dortch, Q.: Global patterns of dissolved N, P and Si in large rivers, Biogeochemistry, 64, 297–317, 2003. a, b
Vörösmarty, C., Fekete, B. M., Meybeck, M., and Lammers, R. B.: Global system of rivers: Its role in organizing continental land mass and defining land-to-ocean linkages, Global Biogeochemical Cycles, 14, 599–621, 2000. a
Wanninkhof, R.: Relationship between wind speed and gas exchange over the ocean revisited, Limnology and Oceanography: Methods, 12, 351–362, 2014. a
Ward, N. D., Megonigal, J. P., Bond-Lamberty, B., Bailey, V. L., Butman, D., Canuel, E. A., Diefenderfer, H., Ganju, N. K., Goñi, M. A., Graham, E. B., Hopkinson, C. S., Khangaonkar, T., Adam Langley, J., McDowell, N. G., Myers-Pigg, A. N., Neumann, R. B., Osburn, C. L., Price, R. M., Rowland, J., Sengupta, A., Simard, M., Thornton, P. E., Tzortziou, M., Vargas, R., Weisenhorn, P. B., and Windham-Myers, L.: Representing the function and sensitivity of coastal interfaces in Earth system models, Nature communications, 11, 2458, https://doi.org/10.1038/s41467-020-16236-2, 2020. a
Wickland, K. P., Aiken, G. R., Butler, K., Dornblaser, M. M., Spencer, R., and Striegl, R. G.: Biodegradability of dissolved organic carbon in the Yukon River and its tributaries: Seasonality and importance of inorganic nitrogen, Global Biogeochemical Cycles, 26, https://doi.org/10.1029/2012GB004342, 2012. a, b
Wunsch, C. and Heimbach, P.: Dynamically and kinematically consistent global ocean circulation and ice state estimates, in: International geophysics, Elsevier, 103, 553–579, https://doi.org/10.1016/B978-0-12-391851-2.00021-0, 2013. a
Wunsch, C., Heimbach, P., Ponte, R. M., Fukumori, I., and the ECCO-GODAE consortium members: The global general circulation of the ocean estimated by the ECCO-Consortium, Oceanography, 22, 88–103, 2009. a
Yasunaka, S., Manizza, M., Terhaar, J., Olsen, A., Yamaguchi, R., Landschützer, P., Watanabe, E., Carroll, D., Adiwira, H., Müller, J. D., and Hauck, J.: An Assessment of CO2 Uptake in the Arctic Ocean From 1985 to 2018, Global Biogeochemical Cycles, 37, e2023GB007806, https://doi.org/10.1029/2023GB007806, 2023. a
Zhang, H., Menemenlis, D., and Fenty, I.: ECCO LLC270 Ocean-Ice State Estimate, Tech. rep., Jet Propulsion Laboratory, California Institute of Technology, http://hdl.handle.net/1721.1/119821 (last access: 20 January 2026), 2018. a
Zhong, G., Li, X., Song, J., Qu, B., Wang, F., Wang, Y., Zhang, B., Tian, D., Ma, J., Yuan, H., Duan, L., Li, N., Wang, Q., and Xing, J.: The increasing big gap of carbon sink between the western and eastern Pacific in the last three decades, Frontiers in Marine Science, 9, https://doi.org/10.3389/fmars.2022.1088181, 2022. a