the Creative Commons Attribution 4.0 License.
the Creative Commons Attribution 4.0 License.
 | 07 Feb 2025
Evaluation of CORDEX ERA5-forced NARCliM2.0 regional climate models over Australia using the Weather Research and Forecasting (WRF) model version 4.1.2
Giovanni Di Virgilio
Fei Ji
Eugene Tam
Jason P. Evans
Jatin Kala
Julia Andrys
Christopher Thomas
Dipayan Choudhury
Carlos Rocha
Yue Li
Matthew L. Riley
Understanding regional climate model (RCM) capabilities to simulate current climate informs model development and climate change assessments. This is the first evaluation of the NARCliM2.0 ensemble of seven Weather Forecasting and Research RCMs driven by ECMWF Reanalysis v5 (ERA5) over Australia at 20 km resolution contributing to CORDEX-CMIP6 Australasia and southeastern Australia at convection-permitting resolution (4 km). The performances of these seven ERA5 RCMs (R1–R7) in simulating mean and extreme maximum and minimum temperatures and precipitation are evaluated against observations at annual, seasonal, and daily timescales and compared to corresponding performances of previous-generation CORDEX-CMIP5 Australasia ERA-Interim-driven RCMs. ERA5 RCMs substantially reduce cold biases for mean and extreme maximum temperature versus ERA-Interim RCMs, with the best-performing ERA5 RCMs showing small mean absolute biases (ERA5-R5: 0.54 K; ERA5-R1: 0.81 K, respectively) but produce no improvements for minimum temperature. At 20 km resolution, improvements in mean and extreme precipitation for ERA5 RCMs versus ERA-Interim RCMs are principally evident over southeastern Australia, whereas strong biases remain over northern Australia. At convection-permitting scale over southeastern Australia, mean absolute biases for mean precipitation for the ERA5 RCM ensemble are around 79 % smaller versus the ERA-Interim RCMs that simulate for this region. Although ERA5 reanalysis data confer improvements over ERA-Interim, only improvements in precipitation simulation by ERA5 RCMs are attributable to the ERA5 driving data, with RCM improvements for maximum temperature being more attributable to model design choices, suggesting improved driving data do not guarantee all RCM performance improvements, with potential implications for CMIP6-forced dynamical downscaling. This evaluation shows that NARCliM2.0 ERA5 RCMs provide valuable reference simulations for upcoming CMIP6-forced downscaling over CORDEX-Australasia and are informative datasets for climate impact studies. Using a subset of these RCMs for simulating CMIP6-forced climate projections over CORDEX-Australasia and/or at convection-permitting scales could yield tangible benefits in simulating regional climate.
- Article
(19375 KB) - Full-text XML
- Companion paper
-
Supplement
(13243 KB) - BibTeX
- EndNote


Global climate models (GCMs) are optimum tools for simulating future climate at global and continental scales, informing policy and planning at these scales on climate change under different greenhouse gas (GHG) concentration scenarios (IPCC, 2021). Successive generations of GCMs have seen several improvements, including incremental increases in spatial resolution and some improvements in the simulation of the current climate (Eyring et al., 2016; Stouffer et al., 2017; Grose et al., 2020). However, the coarse spatial resolution of GCMs (100 to 250 km) limits their ability to resolve the fine-scale drivers of regional climate, such as complex topography, land use, and mesoscale atmospheric processes such as convection. This in turn limits their efficacy in climate mitigation and adaptation planning at regional scales (Hsiang et al., 2017).
Dynamical downscaling of GCM outputs using regional climate models (RCMs) is one approach for generating high-resolution climate projections at regional scales (Giorgi, 2006; Laprise, 2008). RCMs use GCM outputs as initial and lateral boundary conditions to generate fine-scale climate simulations that better resolve the fine-scale drivers of regional climate (Giorgi and Bates, 1989; Torma et al., 2015; Di Luca et al., 2012). This can create fine-scale climate information that is spatially and temporally more realistic than the driving GCM information, providing climate simulations more suitable for regional climate impact studies (Giorgi, 2019). However, such improvements are not guaranteed and typically vary with time and location (Di Virgilio et al., 2019, 2020b; Panitz et al., 2014; Bucchignani et al., 2016). There is also potential that RCMs simulate climate projections that are not more physically plausible than those of driving GCMs (Ekström et al., 2015). Design considerations such as the selection of driving models and RCM parameterisation also underlie the nature of potential improvements in regional climate simulations.
The Coordinated Regional Climate Downscaling Experiment (CORDEX) is an initiative of the World Climate Research Programme (WCRP) that provides experimental guidelines facilitating both the production of regional climate projections and inter-model comparisons across modelling groups (Giorgi et al., 2009). Under CORDEX, regional climate projections based on CMIP5 (Coupled Model Intercomparison Project Phase 5) GCM projections were produced for 14 regions globally. CORDEX is building on these previous downscaling intercomparison projects to provide a common framework for downscaling activities based on CMIP6 GCMs (Gutowski et al., 2016).
A key component of CORDEX is using RCMs to dynamically downscale reanalyses such as ERA-Interim (Dee et al., 2011) under CORDEX-CMIP5 and, recently, ERA5 (Hersbach et al., 2020) under CORDEX-CMIP6 and evaluating the RCMs' capabilities to simulate present-day climate. If a given RCM performs poorly in simulating the present-day climate, this lowers the confidence in future climate changes projected by this model. Assessing the relative strengths and weaknesses of ERA5-forced RCMs can inform the decision to exclude poorer-performing RCM configurations when selecting a subset of RCMs for downscaling of CMIP6 GCMs. It also helps benchmark the subsequent performance profiles of CMIP6-forced RCM projections and hindcasts.
Previous work to dynamically downscale ERA5 over CORDEX-Australasia includes the BARPA-R (Bureau of Meteorology Atmospheric Regional Projections for Australia) regional climate model, which simulates over CORDEX-Australasia at ∼ 17 km resolution (Howard et al., 2024). Evaluation of BARPA-R's skill in simulating the Australian climate observed good performance overall, including a 1 °C cold bias in daily maximum temperatures and wet biases of up to 25 mm per month over inland Australia. Other previous studies of dynamical downscaling of ERA5 by RCMs have focused on short-term (e.g. ∼ 1 year) regional climate simulations (e.g. Varga and Breuer, 2020; Zhou et al., 2021) rather than multidecadal simulations. Several have focused on specific regions that are not CORDEX domains, some of which have a smaller spatial extent in comparison. For instance, Reder et al. (2022) conducted dynamical downscaling of ERA5 using COSMO-CLM (CCLM; Rockel et al., 2008) on nine separate domains over 20 European cities at a convection-permitting scale (∼ 2.2 km). They demonstrated an overall pattern of added value in the simulation of heavy precipitation at the city scale relative to the driving reanalysis. Focusing on precipitation simulation over the Lake Victoria basin in Africa, Van de Walle et al. (2020) conducted ERA5-forced CCLM simulations at a convection-permitting scale. They found that CCLM outperformed the ERA5 dataset as well as RCM simulations using parameterised convection, though a domain-averaged wet bias was still evident. These authors attributed the overall improvements in the simulation of subdaily precipitation to the convection-permitting resolution and improved cloud microphysics. Additionally, two Weather Research and Forecasting (WRF; Skamarock et al., 2008) model experiments over the Tibetan Plateau conducted at the grey zone (∼ 9 km) and convection-permitting (∼ 3 km) resolutions for 2009–2018 both showed successful simulation of the spatial pattern and daily variation of surface temperature and precipitation (Ma et al., 2022). Notably, the ability of the convection-permitting WRF RCM in improving precipitation simulation was limited relative to the grey-zone experiment.
The sole prior evaluation of reanalysis-driven CORDEX-CMIP5 Australasia regional climate models was conducted by Di Virgilio et al. (2019). This evaluation of CORDEX ERA-Interim-forced RCMs focused on four configurations of WRF and single configurations of CCLM and the Conformal Cubic Atmospheric Model (CCAM; McGregor and Dix, 2008) to simulate the historical Australian climate (1981–2010) at 50 km resolution. These RCMs showed statistically significant, strong cold biases in the maximum temperature, which, in some cases, exceeded −5 K, contrasting with more accurate simulations of minimum temperature, with biases of ±1.5 K for most WRF configurations and CCAM. The RCMs generally overestimated precipitation, especially over Australia's highly populated eastern seaboard. Notably, Di Virgilio et al. (2019) observed strong negative correlations between simulated mean monthly biases in precipitation and maximum temperature, suggesting that the maximum temperature cold bias was linked to precipitation overestimation.
This study aims to build on that of Di Virgilio et al. (2019) to present the first evaluation of CORDEX-CMIP6 ERA5-forced WRF RCMs over Australia. It has three main aims: (1) to evaluate the capabilities of seven ERA5-forced WRF RCM configurations to simulate the historical Australian climate, assessing the relative strengths and weaknesses of individual RCMs; (2) compare the performance of current-generation CORDEX-CMIP6 ERA5 RCMs, with the previous generation of CORDEX-CMIP5 ERA-Interim-forced RCMs following the evaluation approach of Di Virgilio et al. (2019); and (3) investigate whether any performance differences observed for the ERA5-forced relative to the ERA-Interim forced RCMs can be attributed to the change in the driving reanalysis datasets or to other factors, such as the use of different RCM physics configurations and model design specifications. Following Di Virgilio et al. (2019), we evaluate the ability of RCMs to simulate near-surface maximum and minimum air temperature and precipitation at annual, seasonal, and daily timescales. Here, our focus is on evaluating the performances of the different RCM generations, with an investigation of the mechanisms underlying the varying model performances expected to be the subject of future work.
2.1 Models
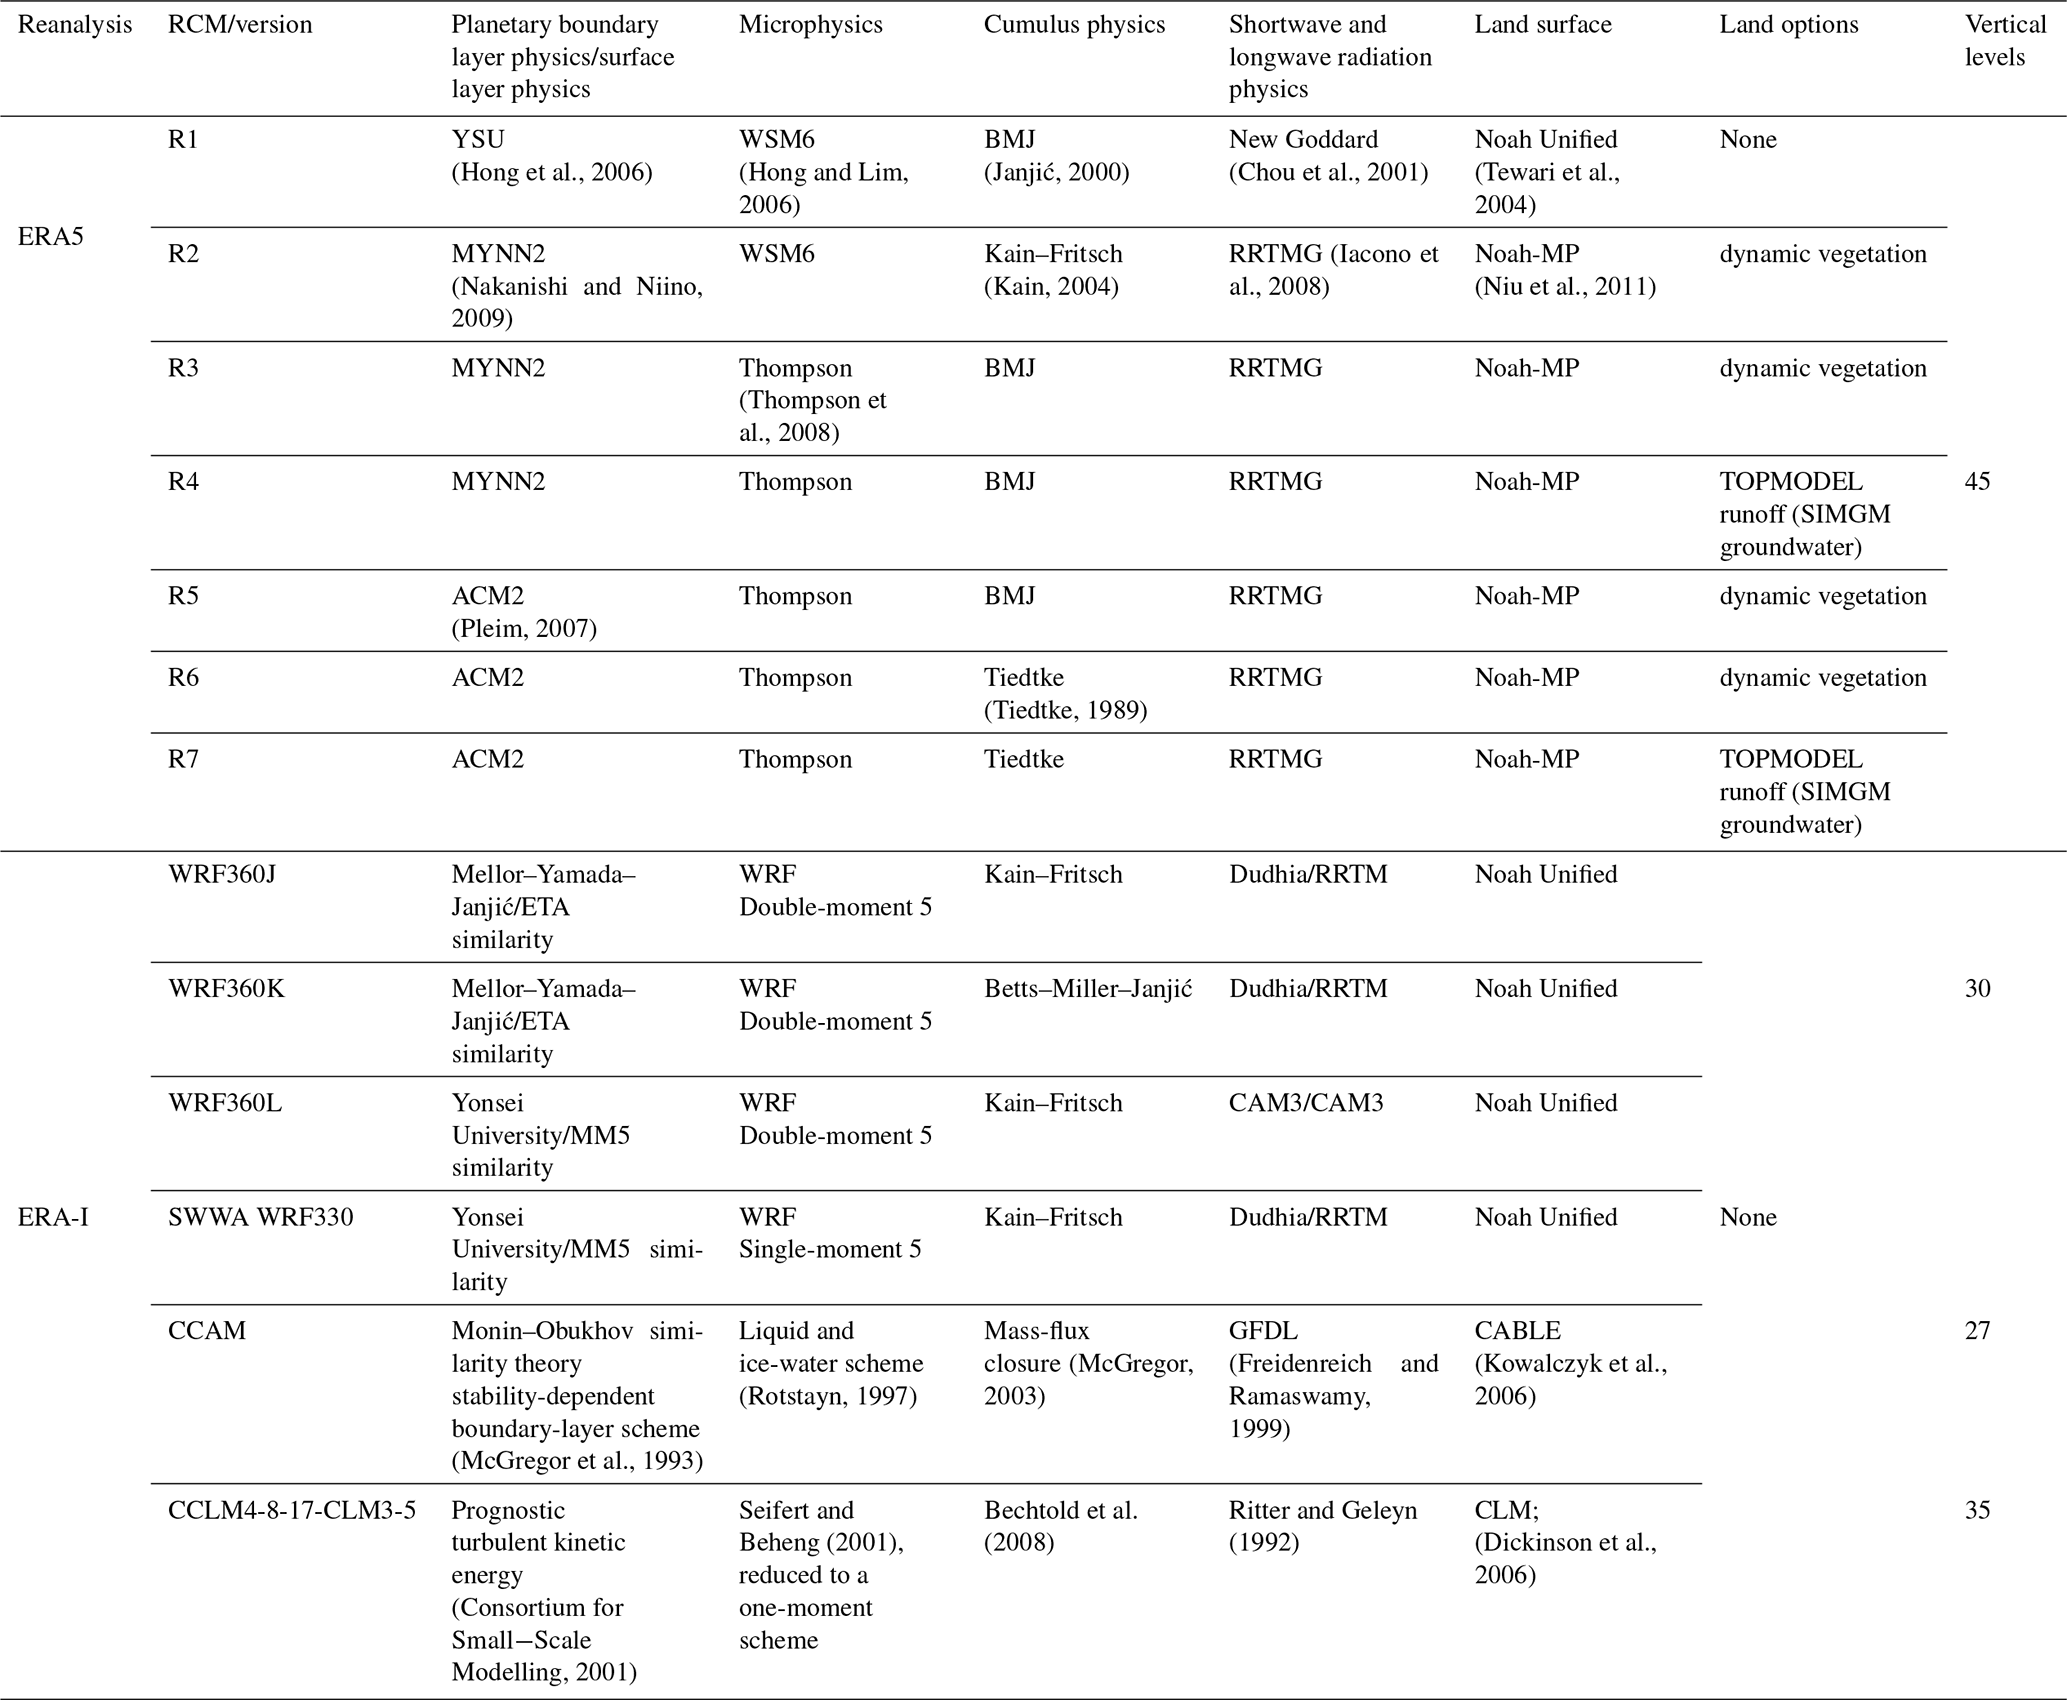
The CORDEX-CMIP5 ERA-Interim forced RCMs (WRF360J, WRF360K, WRF360L, MU-WRFSWWA, CCAM, and CCLM) used a domain with quasi-regular grid spacing of approximately 50 km (0.44° × 0.44° on a rotated coordinate system) over the CORDEX-Australasia region. The ERA-Interim WRF RCMs used different versions of WRF: WRF360J-K-L used WRF version 3.6.0, whereas MU-WRFSWWA used version 3.3. ERA-Interim RCM parameterisations for planetary boundary-layer physics, surface physics, cumulus physics, land surface model, and radiation and vertical level settings are shown in Table 1. Three configurations of CORDEX-CMIP5 ERA-Interim WRF RCMs (WRF360J-K-L) were run using two nested domains with one-way nesting. The inner domain located over southeastern Australia obtained its initial and lateral boundary conditions from an outer-domain simulation located over the CORDEX-Australasia region (Fig. 1). The inner domain used a resolution of approximately 10 km. Further details on the ERA-Interim-forced RCMs are provided in Di Virgilio et al. (2019), including overviews of the WRF, CCAM, and CCLM RCMs.
Seven ERA5-forced RCMs comprise the CORDEX-CMIP6 evaluation experiment for NARCliM2.0 (NSW and Australian Regional Climate Modelling), which is the latest generation of NARCliM simulations (Evans et al., 2014; Nishant et al., 2021) and is one of several RCM ensembles generating dynamically downscaled climate projections for CORDEX-Australasia (Grose et al., 2023). These RCMs were driven by ERA5 boundary conditions for a 42-year period from January 1979 to December 2020. All ERA5 RCMs used WRF version 4.1.2. These CORDEX-CMIP6 ERA5 RCMs were also run using two nested domains with one-way nesting. The outer domain over CORDEX-Australasia used a quasi-regular grid spacing of approximately 20 km (0.2° × 0.2° on a rotated coordinate system), and the inner domain over southeastern Australia used a resolution of approximately 4 km. Both domains used 45 vertical levels. The seven WRF RCM configurations (R1–R7) used different parameterisations for planetary boundary-layer physics, surface physics, cumulus physics, land surface model (LSM), and radiation, with the note that several parameters differed relative to those of the ERA-Interim WRF RCMs (Table 1). Four of the ERA5 RCMs used the Noah-MP LSM with its dynamic vegetation cover option activated (referred to as dynamic vegetation in the WRF users' guide) (Niu et al., 2011). When deactivated (the default), the monthly leaf area index (LAI) is prescribed for various vegetation types, and the greenness vegetation fraction (GVF) comes from monthly GVF climatological values. Conversely, when dynamic vegetation cover is activated, LAI and GVF are calculated using a dynamic leaf model. We clarify here that dominant plant functional types do not change when using this option but only the LAI and GVF, i.e. only the number of green-cover changes. Additionally, while the indicated cumulus parameterisation was used in the 20 km resolution outer domain, all ERA5-forced simulations were made convection-permitting in the 4 km inner domain; i.e. no cumulus parameterisation was used. Urban physics was switched on for these simulations. These two design changes are unique to these ERA5 WRF RCMs.
The seven ERA5 WRF configurations were selected from an ensemble of 78 structurally different WRF RCMs. Each of these 78 RCMs used different parameterisations for planetary boundary layer, microphysics, cumulus, radiation, and LSM, where parameterisation options were selected via a literature review and recommendations from WRF model developers. These 78 test RCMs were run for an entire annual cycle (2016 with a 2-month spin-up period commencing on 1 November 2015). The seven ERA5 WRF configurations were selected from this larger ensemble based on their skill in simulating the southeastern Australian climate whilst retaining as much independent information as possible (Evans et al., 2014; Di Virgilio et al., 2025). Evaluations of model performances are only presented for the Australia landmass and follow the evaluation method of Di Virgilio et al. (2019) for the same period, i.e. for a 29-year period from January 1981 to January 2010. Additionally, select assessments of model performance are presented for the inner domain over southeastern Australia.
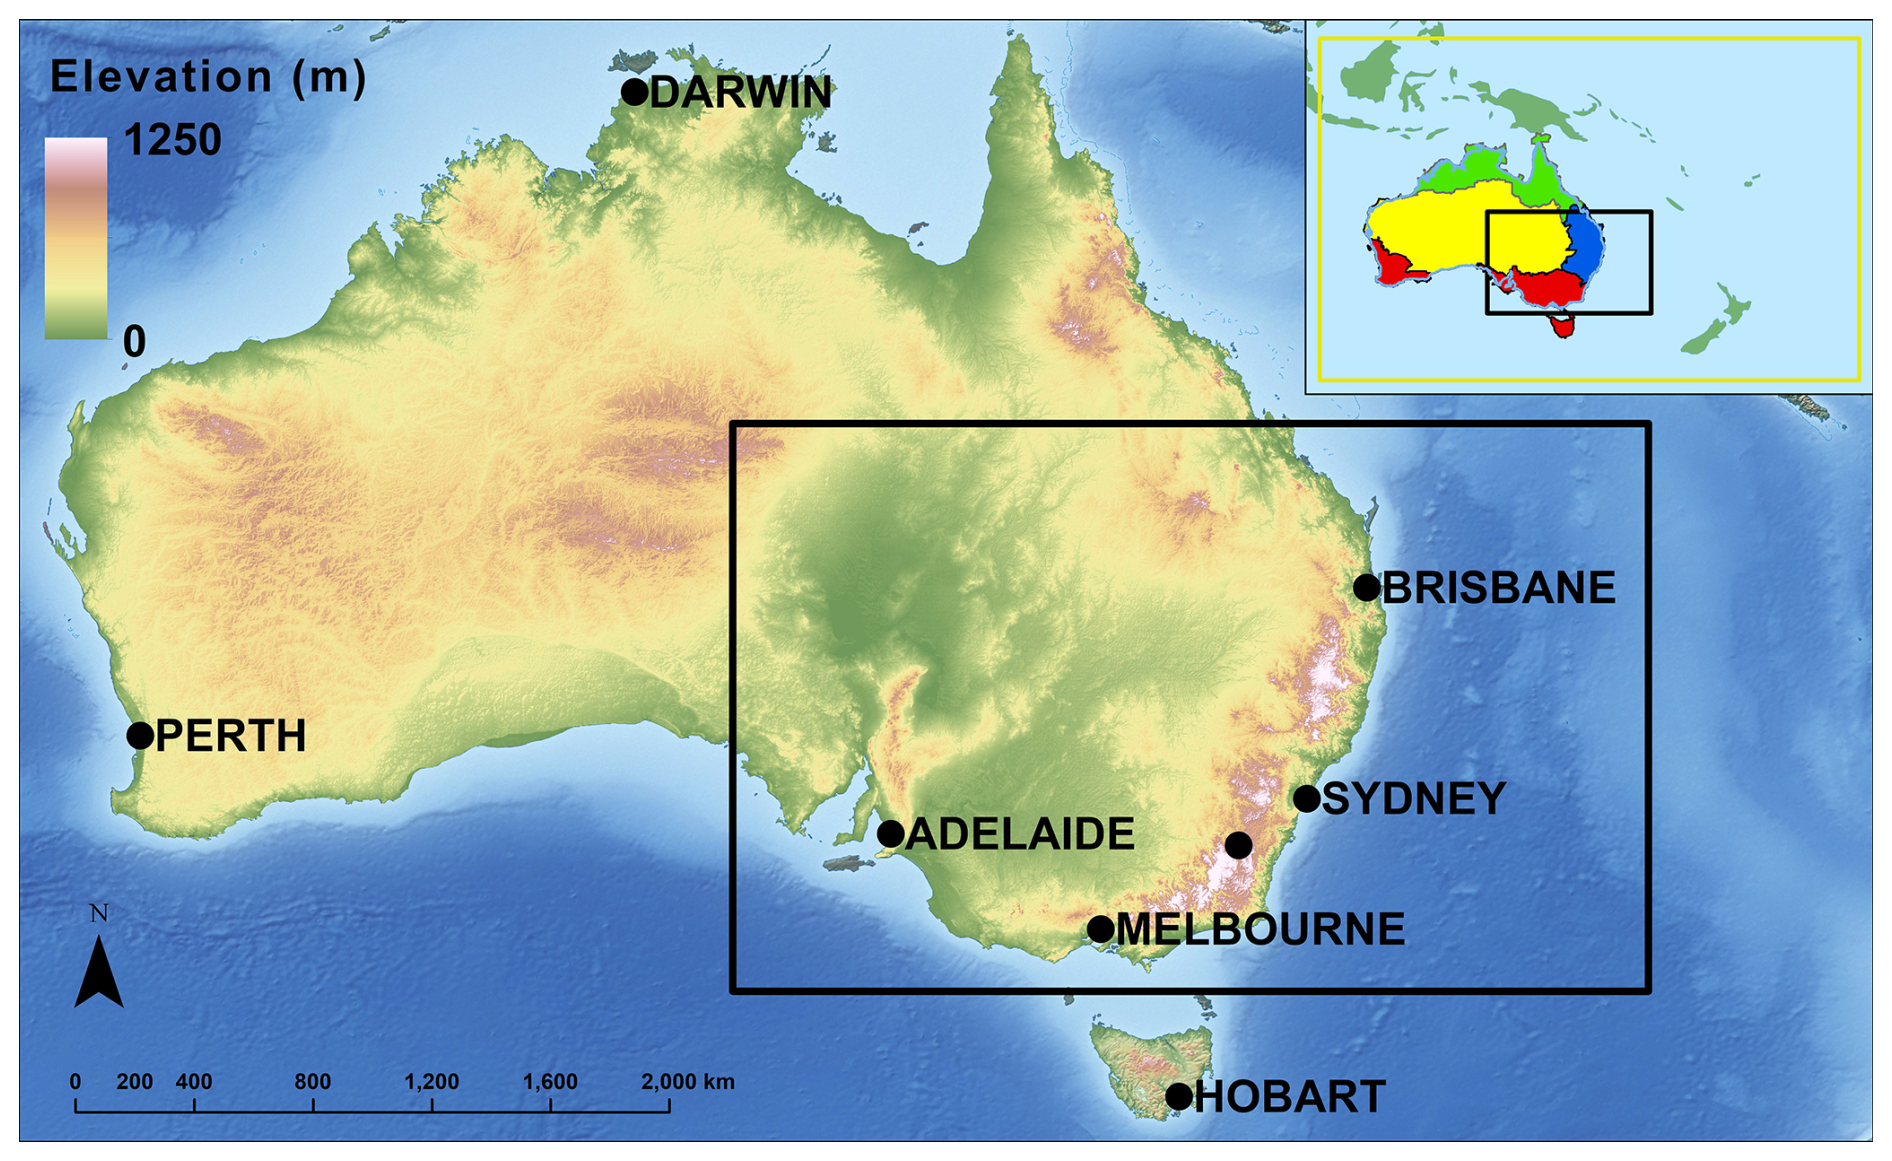
Figure 1Topographic variation across Australia and major cities. The inset shows the CORDEX-Australasia domain and four natural resource management (NRM) regions/climate zones (blue: eastern Australia; red: southern Australia; yellow: rangelands; and green: northern Australia). Seven configurations of CORDEX-CMIP6 ERA5 weather research and forecasting (WRF) RCMs (R1–R7) and three configurations of CORDEX-CMIP5 ERA-Interim WRF RCMs (WRF360J-K-L) were run using two nested domains via one-way nesting with an outer domain over CORDEX-Australasia and an inner domain over southeastern Australia (black rectangle in both main panel and inset).
Table 1List of CORDEX-CMIP6 ERA5 and CORDEX-CMIP5 ERA-Interim forced RCMs assessed by this evaluation study.
2.2 Observations
Australian Gridded Climate Data (AGCD version 1.0; Evans et al., 2020) were used to evaluate RCM performance. This daily gridded maximum and minimum temperature and precipitation dataset has a grid-averaged resolution of 0.05° and is obtained from an interpolation of station observations across the Australian continent. Observations only include temperature minima and maxima; hence, the ability of RCMs to reproduce the mean temperature was not assessed. Following Di Virgilio et al. (2019), the AGCD data were re-gridded to correspond with the RCM data on their native grids using a conservative area-weighted re-gridding scheme. Most stations used for AGCD are in coastal areas, contrasting with a sparser representation inland and especially in Australia's northwest. There are more precipitation stations than temperature stations. Only land points over Australia were evaluated because AGCD observations are terrestrial data.
2.3 Evaluation methods
2.3.1 Evaluations of CORDEX-CMIP6 ERA5 RCMs versus CORDEX-CMIP5 ERA-Interim RCMs
Annual and seasonal means were calculated for maximum and minimum temperature and precipitation using monthly averages for each temperature variable and the monthly sum for precipitation. Percentiles (i.e. the extremes are the 99th percentiles for maximum temperature and precipitation and the 1st percentile for minimum temperature) were calculated using daily values. RCM performances in reproducing observations over these timescales were assessed by calculating the model bias, i.e. model outputs without observations, and the RMSE of modelled versus observed fields. The statistical significance of mean annual and seasonal biases compared to the AGCD observations was calculated for each grid cell using t tests (α=0.05) for maximum and minimum temperatures, assuming equal variance. The Mann–Whitney U test was used for precipitation given its non-normality. Results on the statistical significance of each ensemble mean were separated into three categories following Tebaldi et al. (2011): (1) statistically insignificant areas are shown in colour, denoting that less than 50 % of RCMs are significantly biased, which is the most desired outcome; (2) in areas of significant agreement (stippled), at least 50 % of RCMs are significantly biased and at least 66 % of significant models agree on the sign of the bias. In such areas, many ensemble members have the same bias sign, which is an undesirable outcome; and (3) areas of significant disagreement are shown in white, where at least 50 % of RCMs are significantly biased and less than 66 % of significant models agree on the bias sign.
The ability of the RCMs to simulate observed variables at daily timescales was also assessed by comparing the probability density functions (PDFs) for daily mean observations with those of the RCMs. PDFs were separately calculated for Australia and for each of four natural resource management (NRM) climate regions shown in Fig. 1 for maximum and minimum temperatures and precipitation. Here, daily precipitation values below 0.1 mm were omitted from the RCM output because rates below this amount fall below the detection limit of the stations used to produce the observed dataset. Additionally, the daily rainfall observational network used to produce the AGCD has large gaps in several areas of central Australia; hence, RCM output was masked over these areas. RCM and observed PDFs were compared using Perkins' skill score (PSS; Perkins et al., 2007), which measures the degree of overlap between two PDFs, with PSS = 1 indicating that the distributions overlap perfectly.
2.3.2 Comparing ERA5 versus ERA-Interim RCM performances after switching driving reanalyses
Any performance differences of the ERA5-forced and ERA-Interim-forced RCMs could be partially due to the change in the driving reanalysis as well as factors such as different RCM physics configurations and model version and other design specifications. To assess whether the change in ERA5 versus ERA-Interim driving reanalyses may underlie differences in performance profiles of the WRF RCMs from the two generations of CORDEX experiment, we conduct two investigations: (1) the ERA5 and ERA-Interim reanalysis data are compared against AGCD observations to assess their degree of bias for annual and seasonal timescales, and (2) 14-month simulations are performed where otherwise identically parameterised and configured CORDEX-CMIP6 NARCliM2.0 R1–R7 RCMs are forced by ERA-Interim as opposed to ERA5, and, similarly, the WRFJ, WRFK, and WRFL RCMs from the CORDEX-CMIP5 era are forced with ERA5 instead of ERA-Interim. For instance, the ERA5 RCMs CORDEX-CMIP6 (NARCliM2.0) RCMs are run for the same 4 km convection-permitting domain using the same physics options and model setups, with the only changes being swapping out ERA5 for ERA-Interim and running for 14 months. These simulations start on 1 November 2015, with evaluation performed for the 12 months of 2016, i.e. using the first 2 months as a spin-up period. Australia experienced a range of weather extremes during 2016 driven by a range of climatic influences, making 2016 a suitable target year (Bureau of Meteorology, 2017). Owing to finite computing resources, it was not possible to simulate for a longer period for these experiments.
RCM evaluation results are first presented for the 29-year CORDEX-CMIP6 ERA5-forced and CORDEX-CMIP5 ERA-Interim-forced simulations. Evaluation results from switching the driving reanalyses of the CORDEX-CMIP6 and CORDEX-CMIP5 RCMs are then considered.
3.1 Evaluation of CORDEX-CMIP6 ERA5 RCM and CORDEX-CMIP5 ERA-Interim performances
3.1.1 Maximum temperature
Both ERA5 and ERA-Interim-forced RCMs overestimate the frequency of lower-than-average maximum temperatures and underestimate the observed peaks (Fig. 2). However, most ERA5 RCMs simulate occurrences of warmer-than-average temperatures more accurately than the ERA-Interim RCMs, especially ERA5-R3 (Fig. 2c). The ERA5 RCMs with highest PSS scores (i.e. >0.95; R1 and R4) show closer correspondences to the observed peaks than the other ERA5 RCMs, but they underestimate the right tail of distribution. In some respects, RCM performances in PDFs stratified by NRM region can show different patterns of results versus the nationally aggregated data (Figs. S1–S4 in the Supplement). For instance, most ERA5 RCMs show larger overestimations of warmer than average daily maximum temperatures over the northern Australia region (Fig. S4) than for Australia-wide data (Fig. 2).
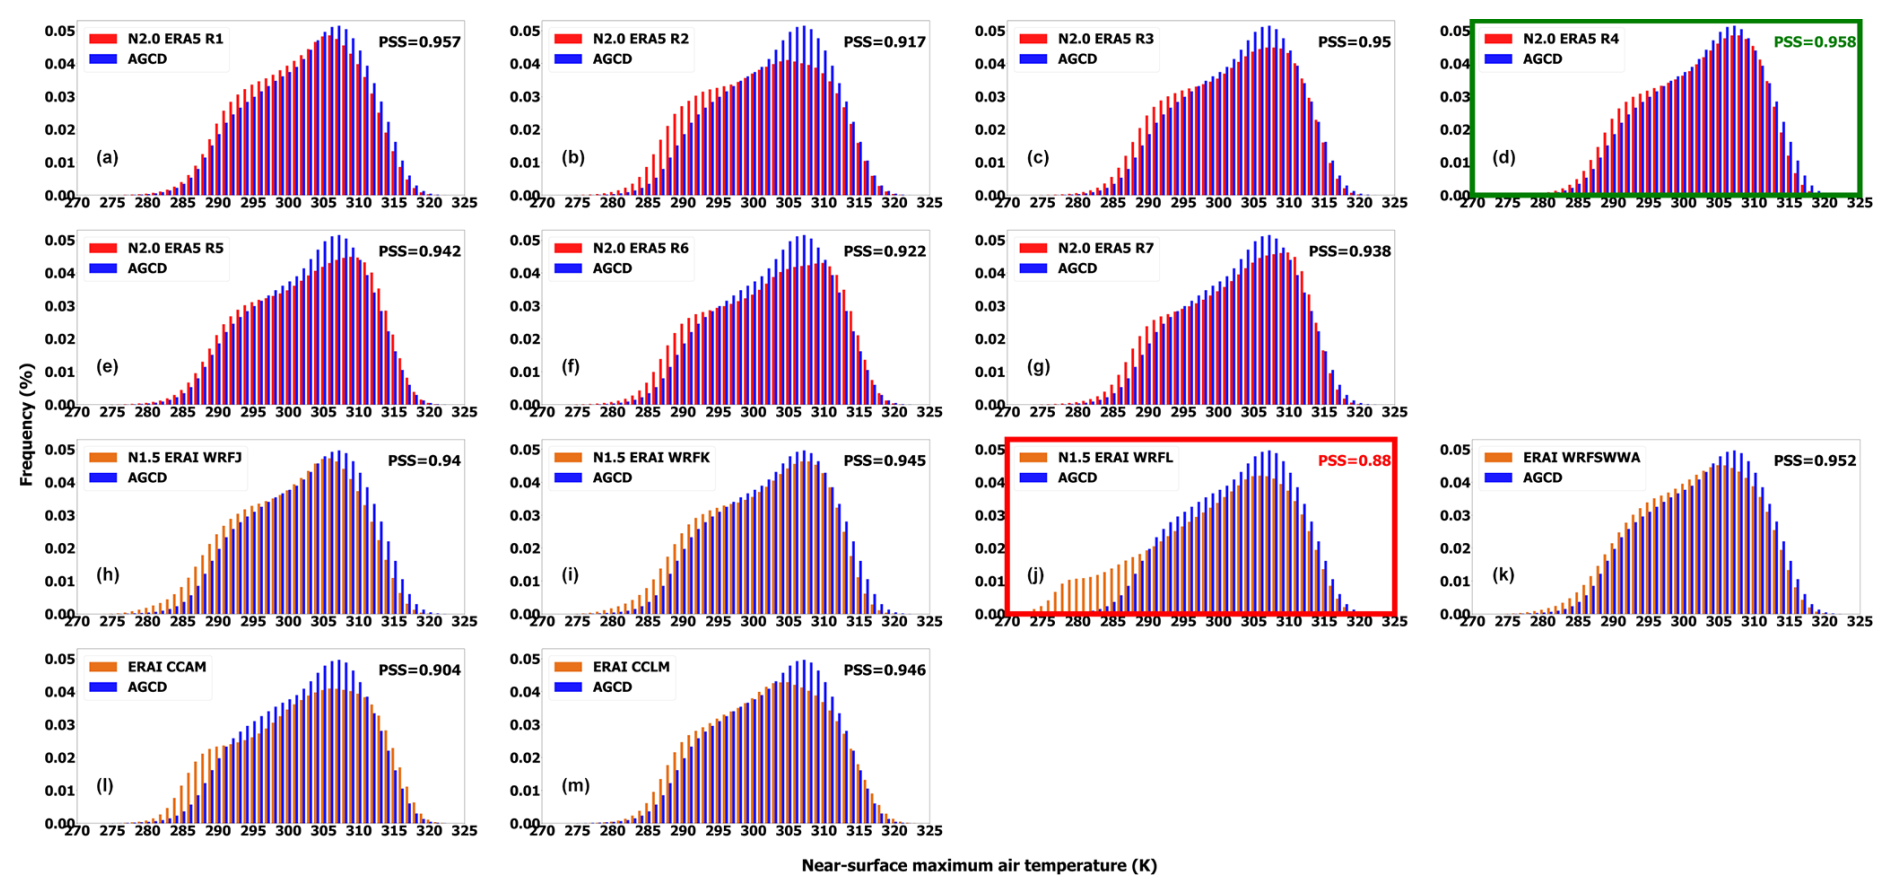
Figure 2Probability density functions (PDFs) of mean daily maximum near-surface air temperatures (K) across Australia for 1981–2010. Panels (a)–(m) show the PDF of a specific RCM configuration relative to that of Australian Gridded Climate Data (AGCD) observations; (a)–(g) are NARCliM2.0 ERA5-forced RCM configurations; and (h)–(m) are ERA-Interim-forced RCM configurations. Panel boundaries in green (red) indicate the RCMs with the highest (lowest) PSS. PDF bin width is 1 K.
Most ERA5 RCMs show small cold biases of ∼ 0.5 to 1 K for the annual mean maximum temperature over most of Australia, except for warm biases of ∼ 0.5 to 1.5 K over the coastal north, depending on the location/RCM configuration (Fig. 3b–i). ERA5-R5–R7 show the lowest area-averaged absolute annual biases, with R5 showing very small biases of <0.5 K over much of eastern Australia (Fig. 3g). ERA5-R2 shows markedly poorer performance than every other ERA5 RCM, with cold biases exceeding 2 K in some areas (Fig. 3d). The positive biases of the maximum temperature over the tropics for several of the ERA5 RCMs generally correspond well to negative precipitation biases over this region (see Fig. 7b, e–i). Except for ERA5-R2, the ERA5-forced RCMs show considerable reductions in the magnitude of cold bias relative to the ERA-Interim-forced RCMs (Fig. 3j–p). The best-performing ERA5 RCM (R5) has an area-averaged absolute mean bias of 0.54 K as compared to 0.92 K for the best-performing ERA-Interim RCM (CCLM), which is a 52 % percentage difference. ERA5-R5 has a 66 % percentage difference in absolute bias compared to the best-performing ERA-Interim WRF RCM (i.e. WRFSWWA: 1.07 K).
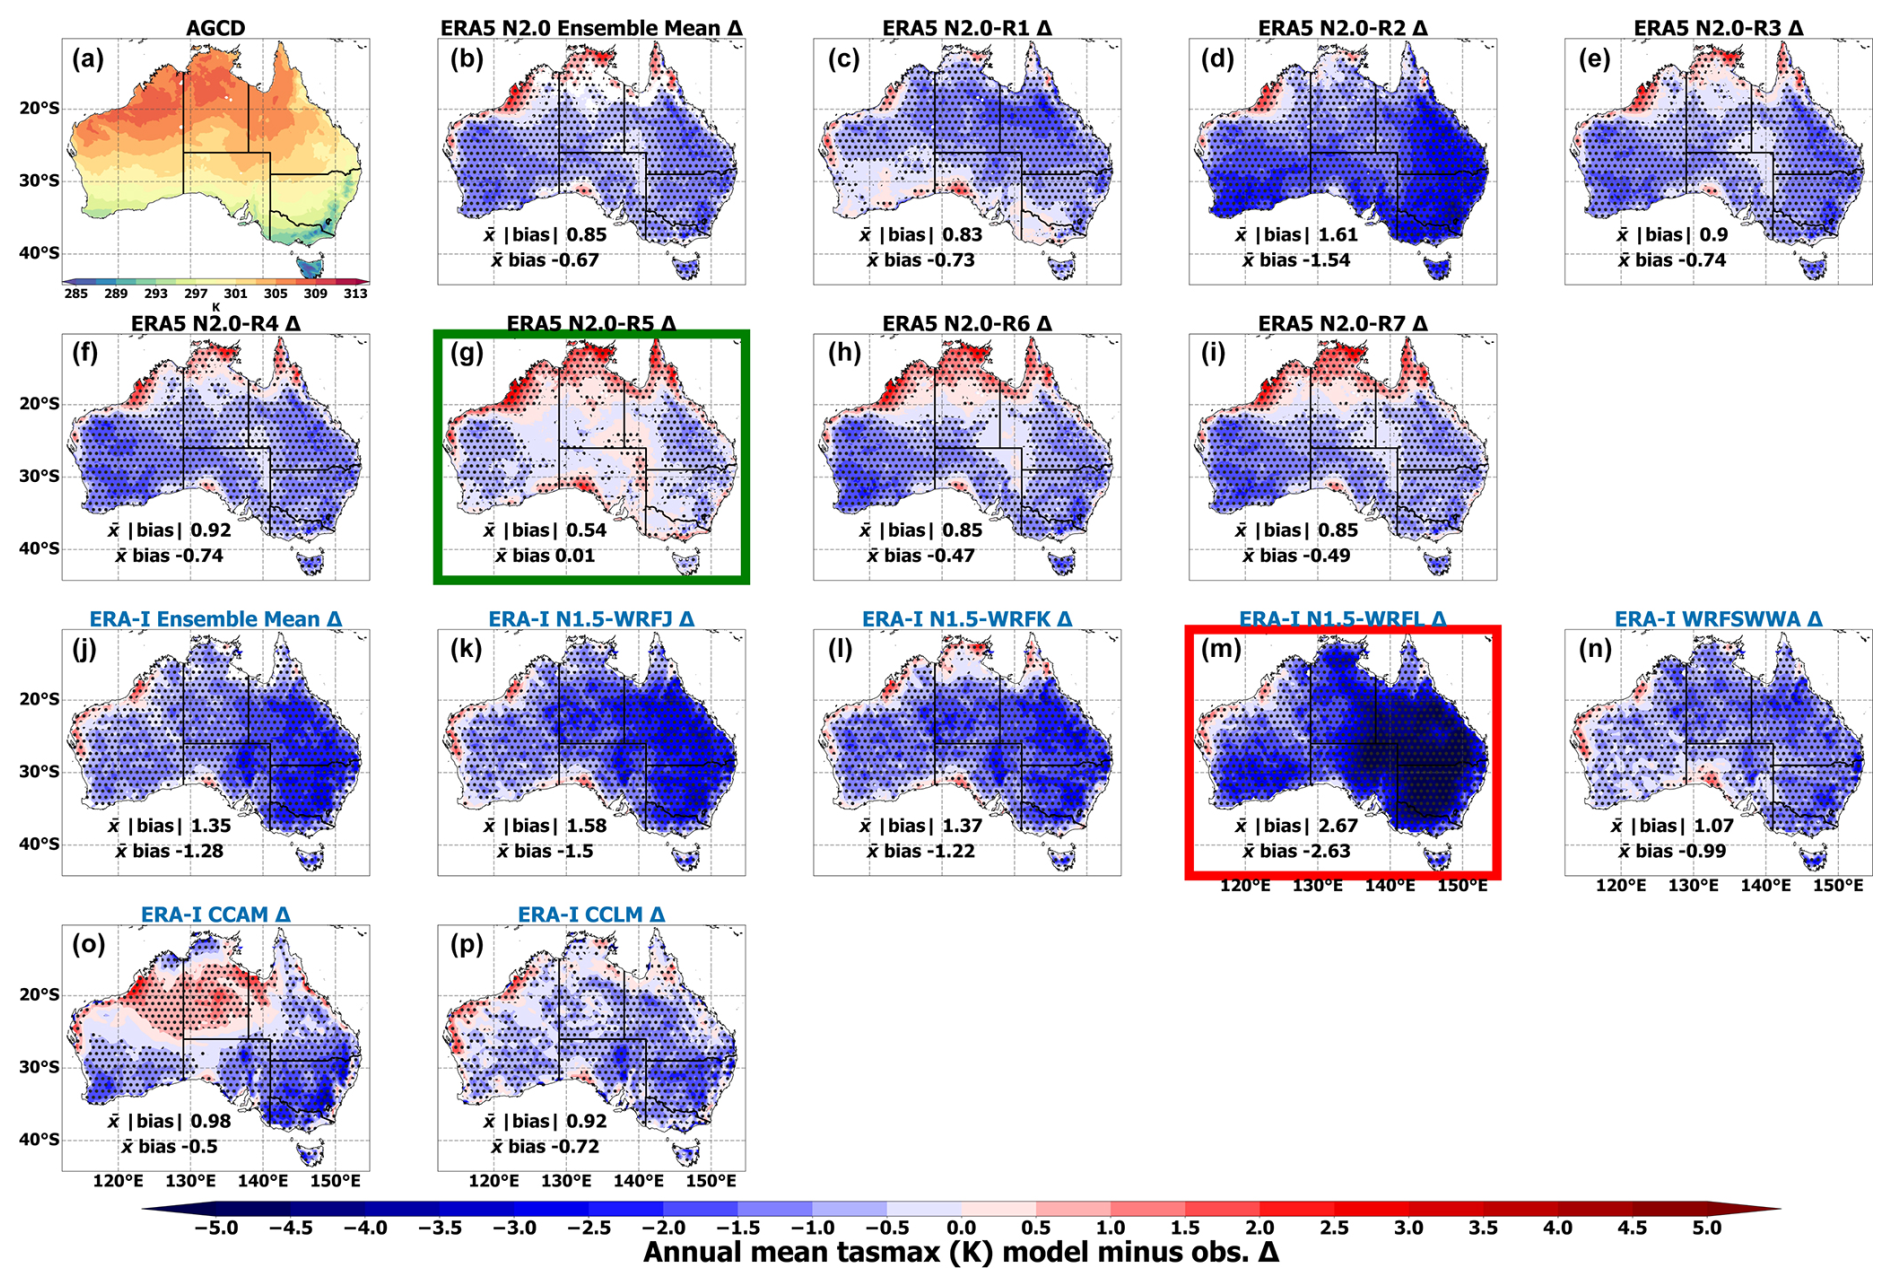
Figure 3Annual mean near-surface atmospheric maximum temperature bias with respect to Australian Gridded Climate Data (AGCD) observations for 1981–2010. Stippled areas indicate locations where an RCM shows statistically significant bias (P<0.05). b Significance stippling for the ensemble mean bias follows Tebaldi et al. (2011) and is applied separately to each of the two RCM ensembles. Statistically insignificant areas are shown in colour, denoting that less than half of the models are significantly biased. In significant agreeing areas (stippled), at least half of RCMs are significantly biased, and at least 66 % of significant RCMs in each ensemble agree on the direction of the bias. Significant disagreeing areas are shown in white, which are where at least half of the models are significantly biased and less than 66 % of significant models in each ensemble agree on the bias direction; see main text for additional details on the stippling regime. Panel boundaries in green (red) indicate the RCMs with the lowest (highest) area-averaged mean absolute biases.
During summer, the magnitude and spatial extent of maximum temperature warm biases increase for all RCMs relative to the annual mean biases (Fig. S5). During winter, several ERA5 RCMs (R1, R3, R4, and R5) retain much smaller cold biases than most ERA-Interim-forced models (Fig. S6). RMSE magnitudes peak for most ERA5 and ERA-Interim models in February (at the end of austral summer), except for several ERA-Interim RCMs which show larger RMSEs in winter, especially ERA-Interim-WRFL (Fig. S7).
For extreme (99th-percentile) maximum temperatures, whilst ERA5 RCMs show lower overall biases relative to the ERA-Interim RCMs, the former show strong warm biases along coastlines that are typically stronger than biases further inland (Fig. S8). These biases are particularly pronounced along northern and eastern coastlines. ERA5-R1 and ERA5-R5 show the lowest overall mean absolute biases for extreme maximum temperature, especially over southeastern Australia. The various mean absolute bias and PSS statistics for maximum temperature for the 20 km domain are summarised in Table S1 in the Supplement.
3.1.2 Minimum temperature
PDFs of daily minimum temperature for the ERA-Interim-forced WRFJ and WRFK RCMs match observations most closely relative to the ERA5- and other ERA-Interim-forced RCMs (Fig. 4). Observed PDFs at the continental scale show a slight bimodality that is captured by ERA5-R1, ERA5-R4, ERA-Interim-WRFJ, ERA-Interim-SWWA, and ERA-Interim-CCLM. However, this bimodality is generally not present in PDFs stratified for specific NRM regions (Figs. S9–S12). Several RCMs struggle to simulate minimum temperature occurrences in the middle of the distribution (i.e. ∼ 285–290 K), except for ERA5-R5 and ERA-Interim WRFJ, WRFK, and CCLM, which closely match minimum temperatures in this range.
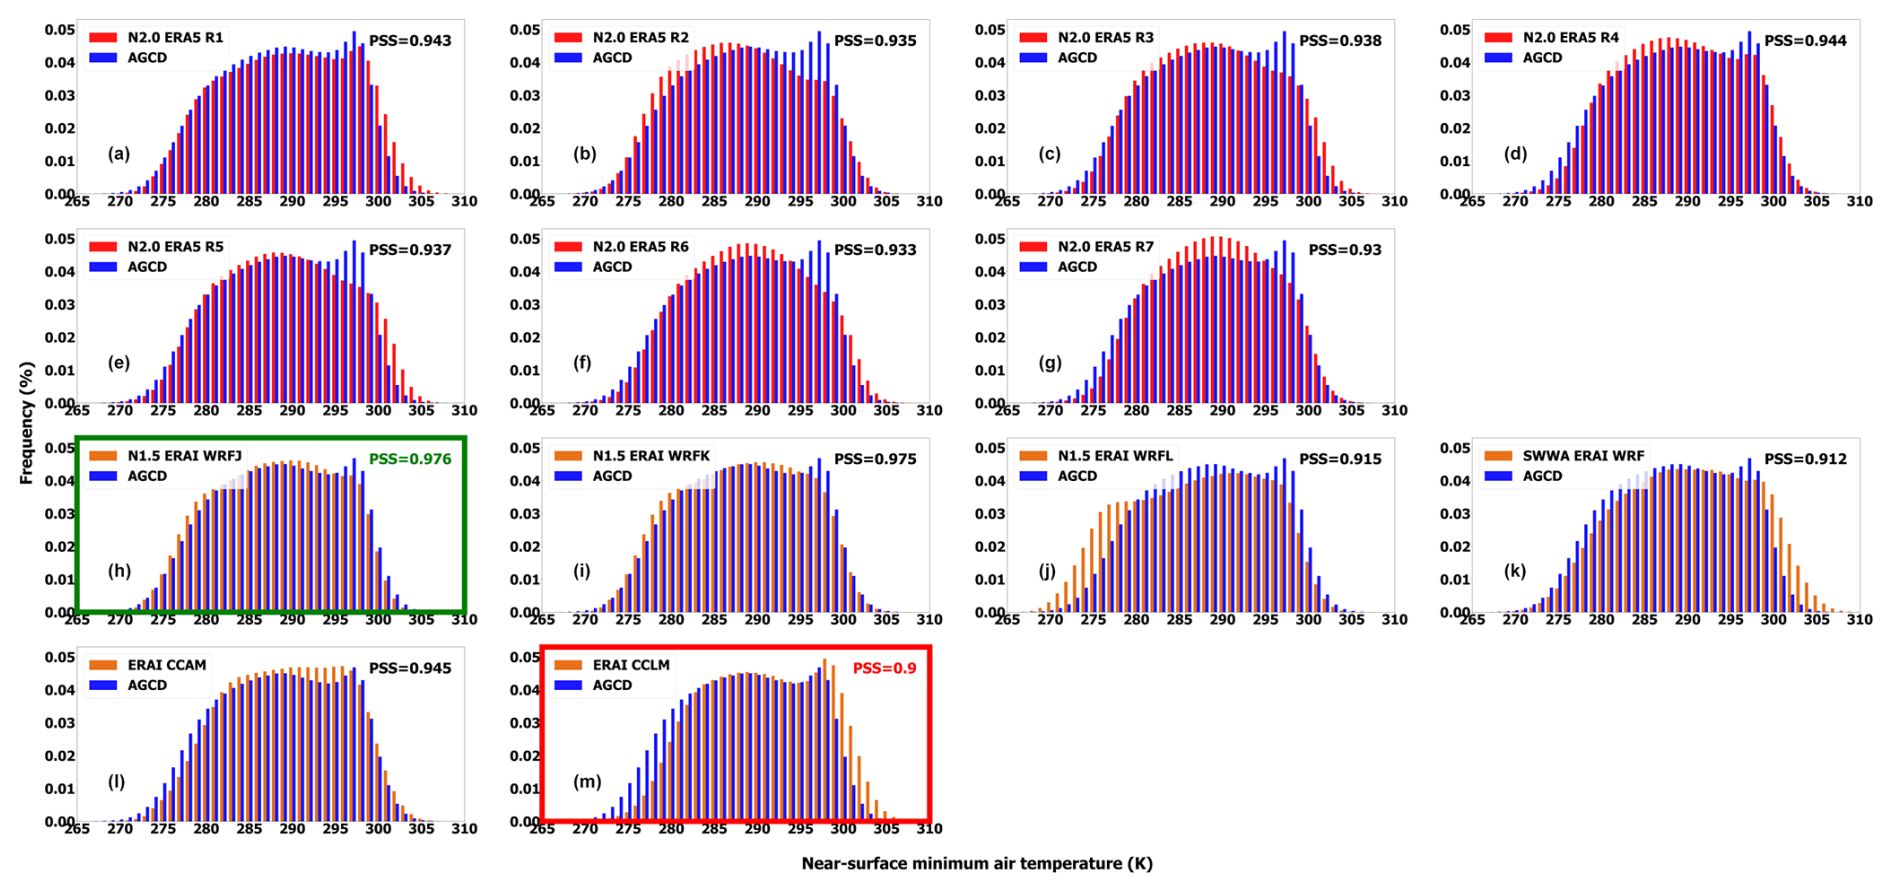
Figure 4Probability density functions (PDFs) of mean daily minimum near-surface air temperatures (K) across Australia for 1981–2010. Panels (a)–(m) show the PDF of a specific RCM configuration relative to that of Australian Gridded Climate Data (AGCD) observations, (a)–(g) are NARCliM2.0 ERA5-forced RCM configurations, and (h)–(m) are ERA-Interim-forced RCM configurations. Panel boundary colouring is as in Fig. 2. PDF bin width is 1 K.
ERA5 RCMs generally overestimate mean minimum temperature annually (Fig. 5) and seasonally (Fig. S13 showing summer and Fig. S14 winter), except for ERA5-R2, which is cold biased. In contrast, ERA-Interim RCMs show a mixed signal for WRFJ and WRFK, cold bias for WRFL, and warm biases for the remaining RCMs. Warm biases are strongest during JJA for most ERA5 RCMs and especially for ERA-Interim CCAM and CCLM (Fig. S14). Although ERA5-R2 performs generally poorly for maximum temperature relative to the other ERA5 RCMs (e.g. annual mean absolute bias = 1.61 K), its bias is substantially reduced for minimum temperature (annual mean absolute bias = 0.77 K). ERA5-R2 and ERA5-R3 show better performance for minimum temperature relative to the other ERA5 RCMs. Their area-averaged annual mean absolute biases (0.77 K in both cases) are more comparable to the ERA-Interim-forced WRFJ–WRFK RCMs which simulate annual mean minimum temperature most accurately (annual mean absolute biases = 0.66 and 0.7 K, respectively).
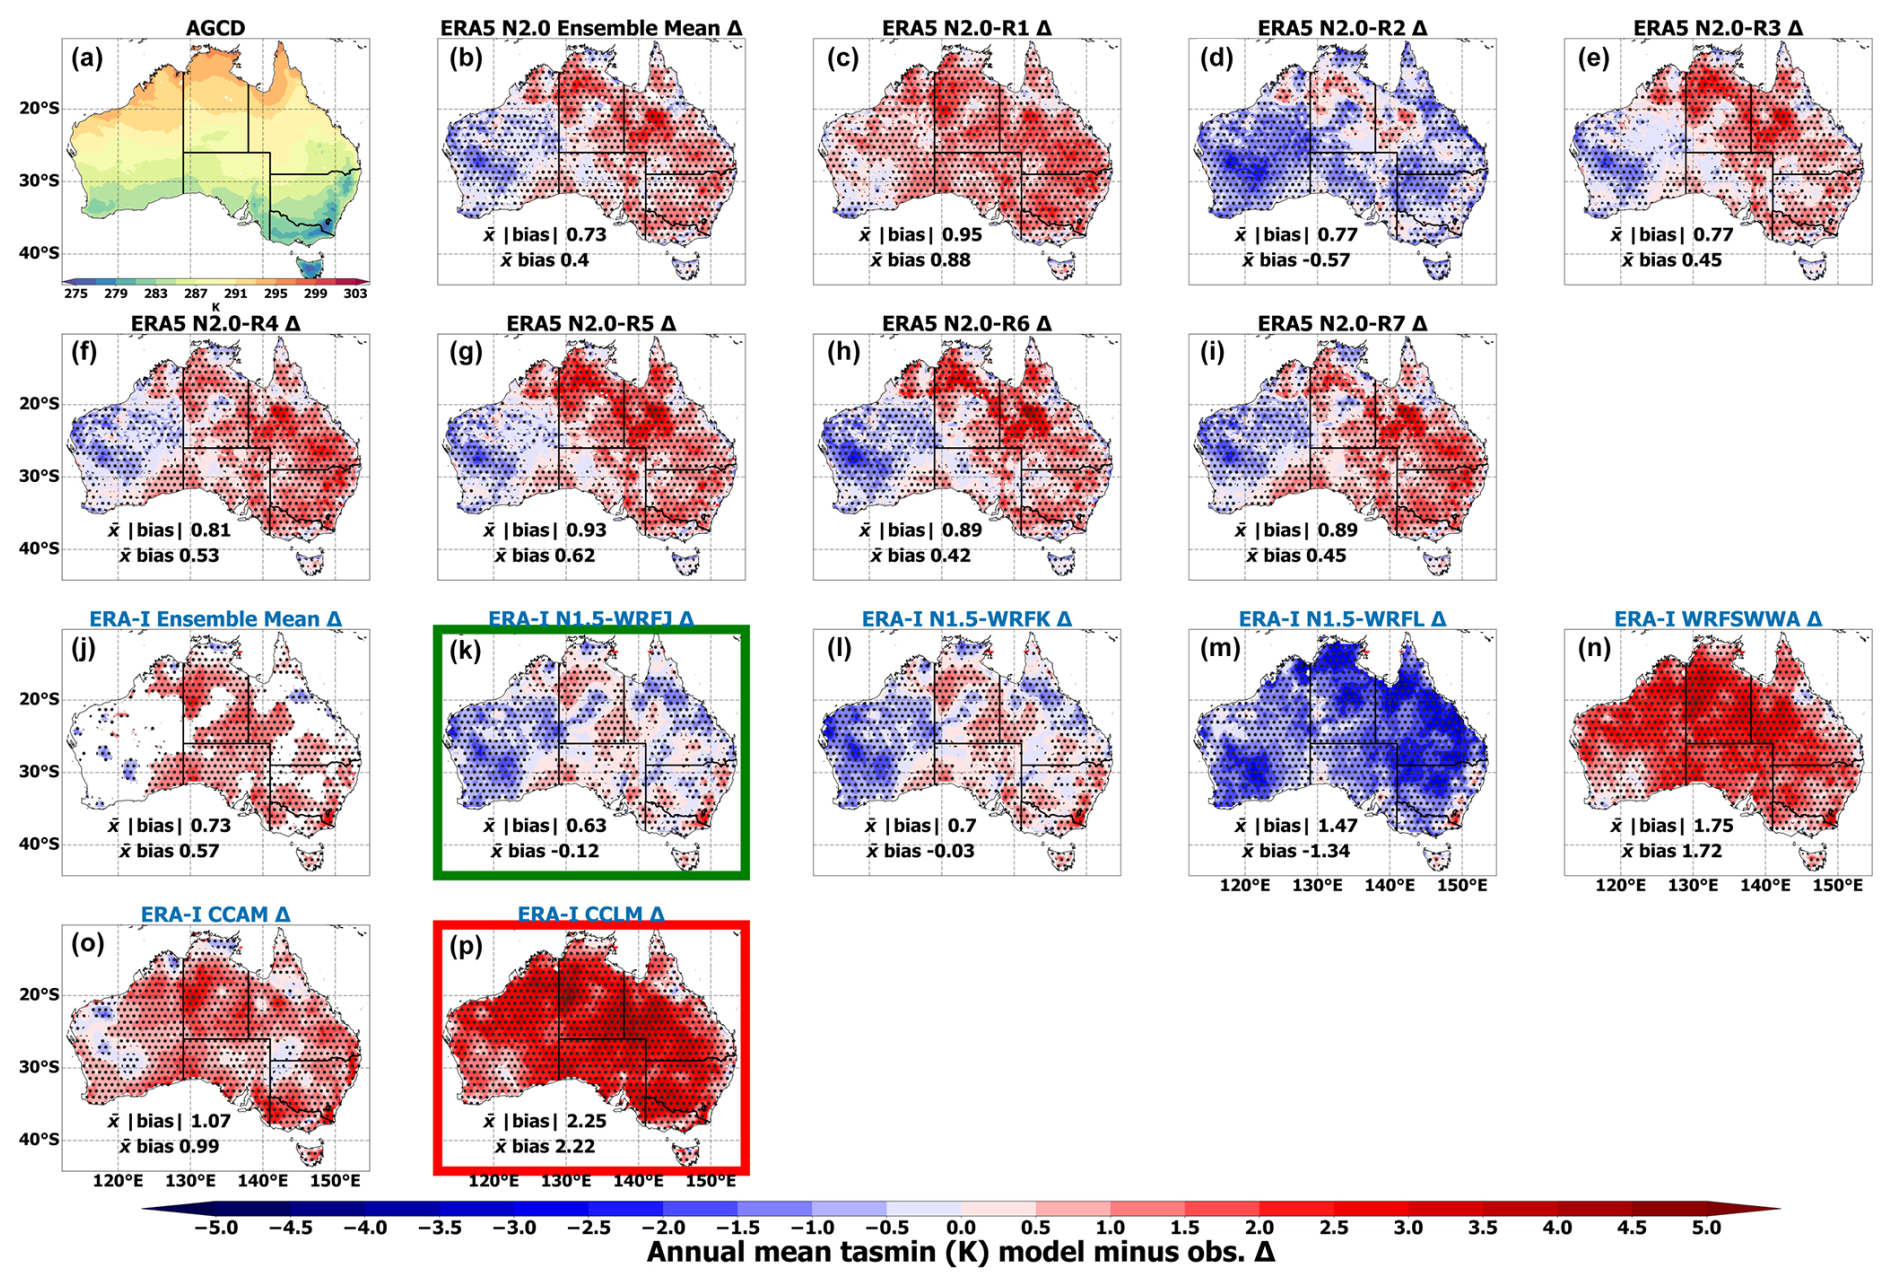
Figure 5Annual mean near-surface atmospheric minimum temperature bias with respect to gridded observations for 1981–2010. Stippling and panel boundary colouring is as in Fig. 3.
RMSE annual cycles for mean minimum temperature broadly reflect the above pattern of results (Fig. S15). For most months throughout the annual cycle, RMSEs are typically the lowest for ERA-Interim WRFJ–WRFK. However, ERA5-R1 and R2 also show small RMSEs from May to August, with RMSEs also being low for ERA5-R3 during spring (September to November).
The majority of ERA5 and ERA-Interim RCMs are generally warm-biased for extreme minimum temperature over most of Australia, with only small areas of cold bias over the northwest (Fig. S16). The exceptions are ERA5-R2 and ERA-Interim WRFJ–WRFK, which show biases of mixed sign across larger areas of Australia, and ERA-Interim WRFL, which is strongly cold-biased (Fig. S16). ERA5-R2 and R3 show reasonably good performances for extreme minimum temperature as compared to the other ERA5 models; however, ERA-Interim WRFJ–WRFK simulates extreme minimum temperature most accurately. Mean absolute bias and PSS statistics for minimum temperature for the 20 km domain are summarised in Table S1.
3.1.3 Precipitation
PDFs of mean daily precipitation show that ERA5-R2, ERA-Interim-forced CCAM and WRFSWWA simulate the occurrence of rainfall events up to 5 mm d−1 more accurately than the other RCMs (Fig. 6). Heavier rainfall events (approximately > 7 mm d−1) are underestimated by several RCMs. Overall, the ERA5 RCMs simulate daily precipitation occurrences consistently better than the ERA-Interim RCMs; i.e. four out of the seven ERA5 RCMs have PSS > 0.8 compared to two out of six ERA-Interim RCMs. Of the ERA5-forced RCMs, R2 produces the best simulation of daily rainfall occurrences. There are some interesting differences in RCM performance between the NRM regions (Figs. S17–S20). For instance, most RCMs generally show more skill in capturing daily precipitation distributions over southern Australia than other NRM regions, with the ERA5 RCMs performing particularly well over this region (Fig. S18). Conversely, performances of most RCMs are generally poorer over northern Australia than other regions, though ERA5-R5 and ERA-Interim-CCAM show better performances than their peers over this region, with a PSS of 0.743 and 0.746, respectively, versus a mean PSS of 0.697 (standard deviation = 0.058; Fig. S20).
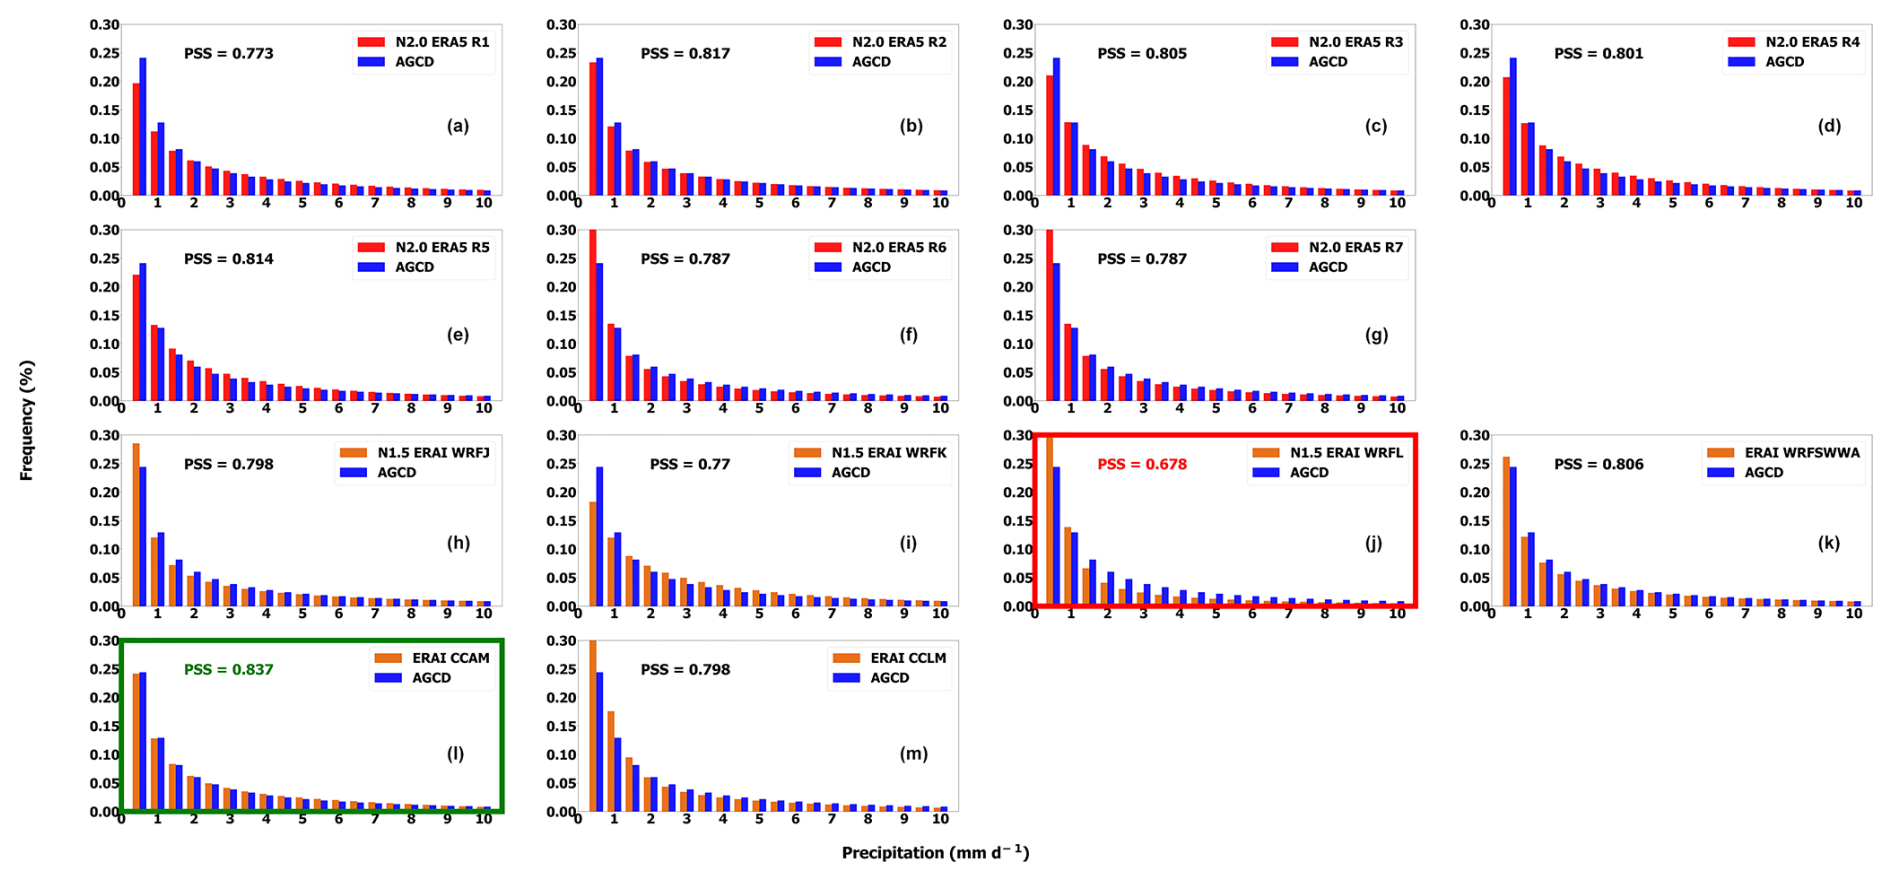
Figure 6Probability density functions (PDFs) of mean daily precipitation (mm d−1) across Australia for 1981–2010. Panels (a)–(m) show the PDF of a specific RCM configuration relative to that of Australian Gridded Climate Data (AGCD) observations, (a)–(g) are NARCliM2.0 ERA5-forced RCM configurations, and (h)–(m) are ERA-Interim-forced RCM configurations. Panel boundary colouring is as in Fig. 2. PDF bin width is 0.5 mm.
All ERA5 RCMs except for R1 and R2 are dry-biased for annual mean precipitation over the monsoonal north (Fig. 7), with R6–R7 producing the strongest dry biases exceeding −40 mm over this region (Fig. 7h–i). Of the ERA5 RCMs, R1 and R2 are exceptional in that they show widespread wet biases. ERA5-R1 and R2 both use WSM6 microphysics, whereas R3–R7 use Thompson microphysics (see Sect. 4.1 in the Discussion section). ERA5-R2 shows the strongest wet bias over eastern Australia of ∼ 20 mm, whereas ERA5-R3-4 show smaller wet biases (∼ 5–10 mm) over this region. All ERA5-forced models show dry biases (between −20 and −35 mm) along the southwestern coastline of western Australia. Overall, with the exceptions of R6 and R7, the ERA5-forced RCMs show reduced mean precipitation bias relative to the ERA-Interim-forced RCMs, especially over southeastern Australia. All RCMs show the strongest biases (of either sign) during DJF (Fig. S21). For instance, the area and magnitude of dry bias over northern Australia increase for ERA5-R3–R7 (Fig. S21). All RCMs show the smallest biases during JJA (Fig. S22).
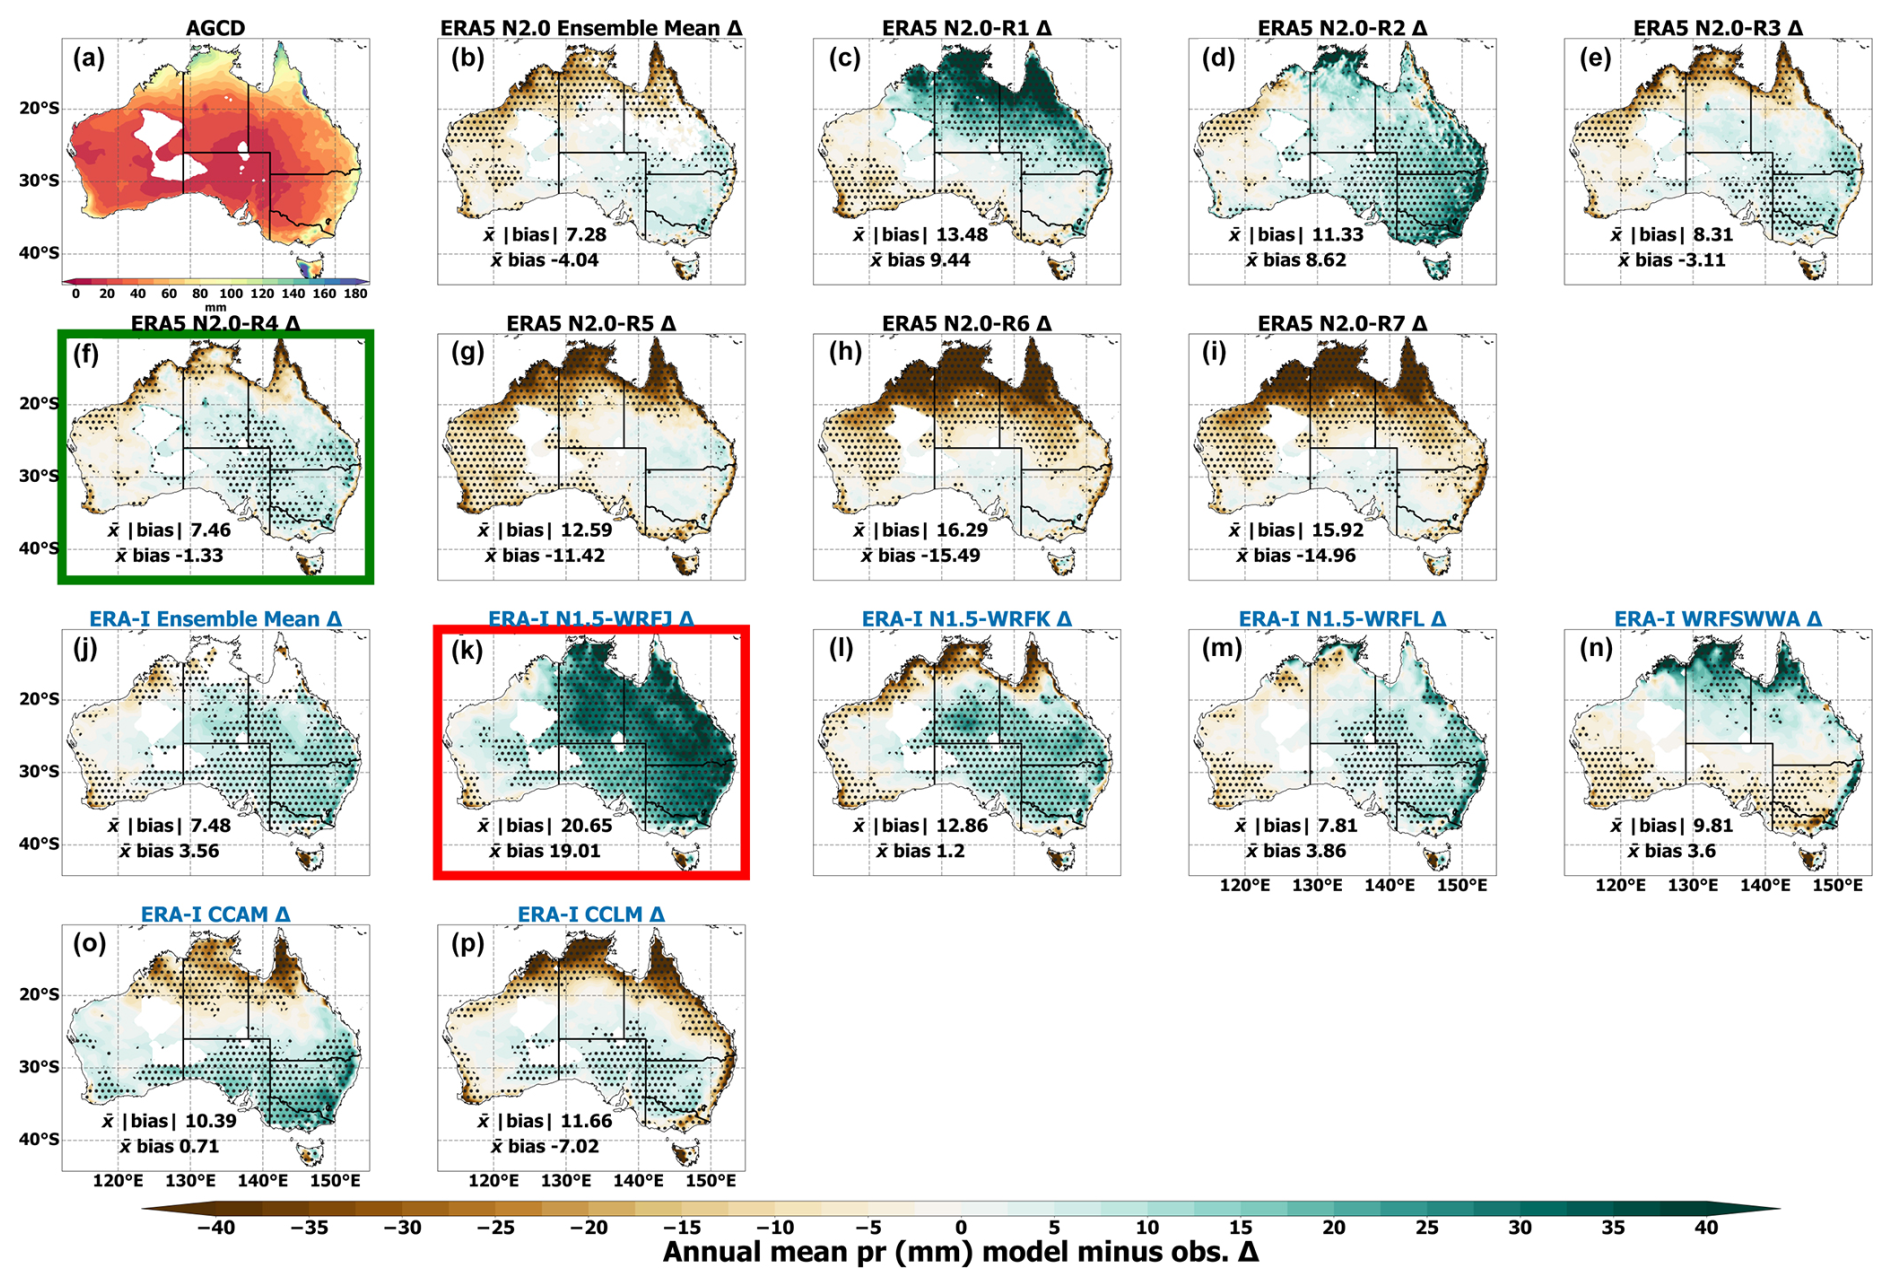
Figure 7Annual mean precipitation bias with respect to gridded observations for the RCMs for 1981–2010. Stippling and panel boundary colouring are as in Fig. 3.
Overall, RMSE annual cycles are similar for the different RCMs (Fig. S23). ERA-Interim CCAM has the lowest RMSEs throughout the year. Otherwise, all ERA5-forced RCMs have lower RMSEs than the ERA-Interim-forced models (except for CCAM) from April to October, which is an important growing season in southern Australia.
The ERA5 RCMs generally overestimate extreme precipitation over Australia and especially the southeast, though R3, R4, and R5 show widespread dry biases over northwestern regions (Fig. S24). The R1 and R2 RCMs show larger extreme precipitation wet biases relative to the other ERA5 RCMs (i.e. mean absolute biases of 20.02 and 14.83 mm versus 9.21 to 11.4 mm; Fig. S24). Several ERA-Interim-forced RCMs (i.e. WRFJ, WRFK, and WRFL) produce similar patterns of bias to the ERA5 RCMs, for instance, with wet biases over southeastern Australia and dry biases over northern and central regions. Overall, the magnitude of biases over the outer domains is similar between the different RCM generations, with several RCMs showing low mean absolute biases ranging from 8.75 to 10.25 mm. However, focusing specifically on the high-resolution inner domains of ERA5 RCMs and ERA-Interim WRFJ–WRFK–WRFL RCMs, noting this domain is uniquely convection-permitting (∼ 4 km) for ERA5 RCMs, most ERA5 RCMs show smaller biases than WRFJ–WRFK–WRFL (Fig. S25). For this inner domain, ERA5-R3, R5, R6, and R7 show small biases (i.e. <9 mm), particularly over southeastern coastal areas. Mean absolute bias and PSS statistics for precipitation for the 20 km domain are summarised in Table S1.
3.2 Assessing the effects of switching driving ERA5 versus ERA-Interim reanalyses on RCM performances
This section investigates whether performance differences of the ERA5-forced and ERA-Interim-forced RCMs may be attributable to the different generations of driving reanalyses as opposed to factors such as different RCM physics parameterisations and design specifications. First, biases in the two reanalysis datasets with respect to observations are assessed. The assessment then focuses on the capacities of the CORDEX-CMIP6 R1–R7 RCMs and the CORDEX-CMIP5 WRFJ–WRFK–WRFL RCMs to simulate the southeastern Australian climate when each RCM generation uses first ERA5 and then ERA-Interim driving data. This assessment also provides a further view of the how the WRF RCM performances vary over this high-resolution domain relative to the CORDEX-Australasia domain. These comparative simulations are only available for the higher-resolution inner domain over southeastern Australia.
3.2.1 ERA5 and ERA-Interim reanalysis biases relative to observations
Both ERA5 and ERA-Interim are generally cold-biased in their simulation of mean maximum temperature at annual, summer, and winter timescales during 1981–2010 (Fig. S26). However, biases are larger in magnitude for ERA-Interim relative to ERA5, especially during summer (i.e. ERA5 mean absolute bias = 1.22 K; ERA-Interim = 2.07 K). Biases in ERA5 and ERA-Interim during 2016 are largely consistent with these results (Fig. S27). ERA5 and ERA-Interim overestimate mean minimum temperature over most of Australia at all timescales for both 1981–2010 (Fig. S28) and 2016 (Fig. S29). Biases are again smaller for ERA5 than for ERA-Interim. For ERA-Interim, warm biases are especially large in magnitude along the eastern and southern coastlines and over the island of Tasmania.
ERA5 shows substantial improvements in simulating mean precipitation at all timescales relative to ERA-Interim (Fig. S30; i.e. ERA5 annal mean absolute bias = 4.18 mm; ERA-Interim = 8.14 mm). This applies to both periods assessed, i.e. including for 2016 (Fig. S31). Additional differences in the biases between the reanalysis datasets include ERA-Interim's stronger dry biases over the monsoonal north during summer (wet season) and marked dry biases along the eastern coastline and elevated terrain in southeastern Australia (Fig. S30).
3.2.2 Comparing RCM performances after switching the driving reanalyses
Prior to switching the driving reanalyses of the two generations of RCMs, the ERA5-NARCliM2.0 RCMs show large reductions in cold bias (Fig. 8b–i) relative to the ERA-Interim-forced RCMs (Fig. 8j–m), with ensemble mean bias magnitudes of 1.09 and 2.46 K, respectively.
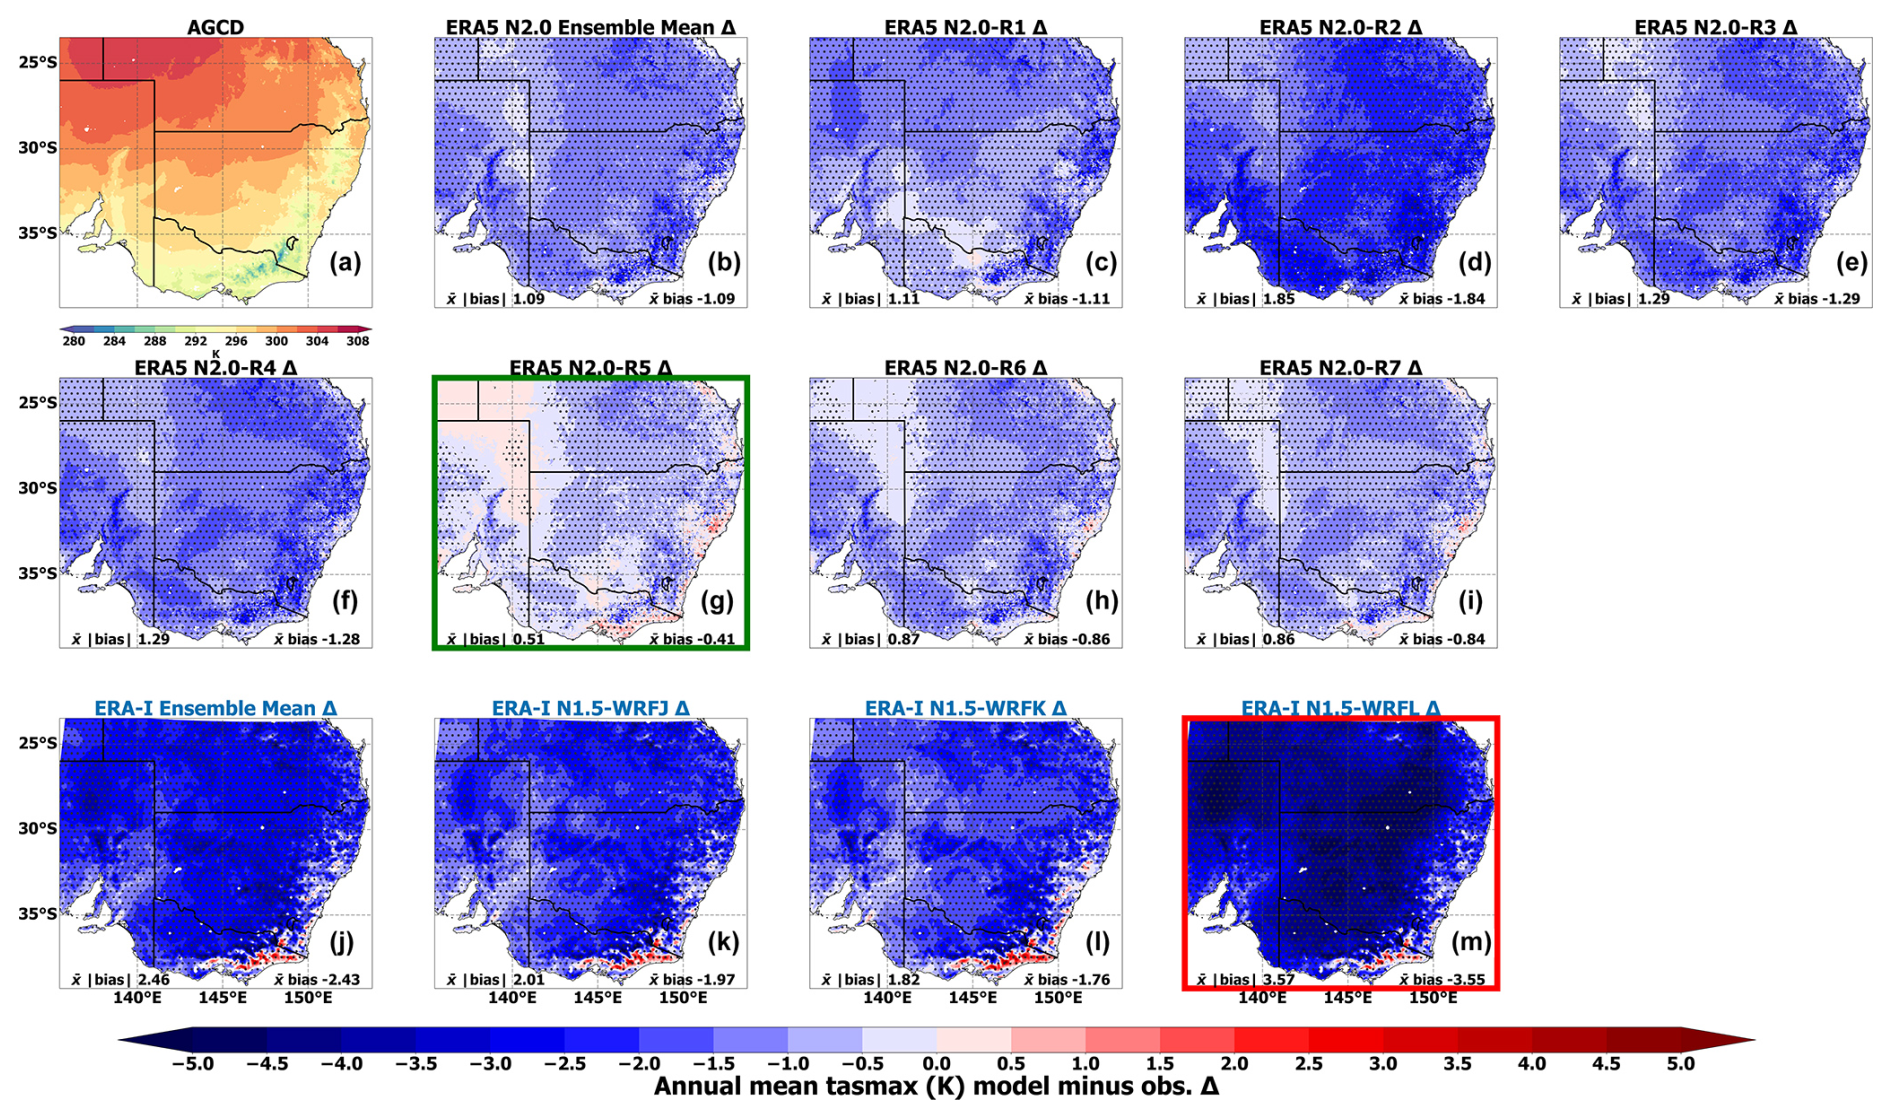
Figure 8Annual mean near-surface atmospheric maximum temperature bias simulated over southeastern Australia (WRF simulation inner domain) with respect to gridded observations for the period 1981–2010 for NARCliM2.0 RCMs (b–i) and NARCliM1.5 RCMs (j–m). Stippling and panel boundary colouring are as in Fig. 3.
Switching the driving reanalysis of the CORDEX-CMIP6 NARCliM2.0 RCMs shows small improvements in the simulation of maximum temperature for several ERA-Interim-forced NARCliM2.0 RCMs (i.e. for R1, R2, R3, and R7; Fig. 9c, d, e, i). In contrast, ERA-Interim-NARCliM2.0 R4, R5, and R6 show slight degradations in performance (Fig. 9f, g, h). However, the NARCliM2.0 ERA-Interim ensemble mean average absolute bias is 0.91 K versus 1.09 K for the NARCliM2.0 ERA5 ensemble. Therefore, overall, there is a small performance improvement in forcing the CORDEX-CMIP6 RCMs using ERA-Interim instead of ERA5. Similarly, the CORDEX-CMIP5 WRFJ and WRFK show poorer simulations of maximum temperature when forced using ERA5 (Fig. 9k–l) relative to their ERA-Interim-forced counterparts, with only ERA5 WRFL showing a marked improvement (Fig. 9m).
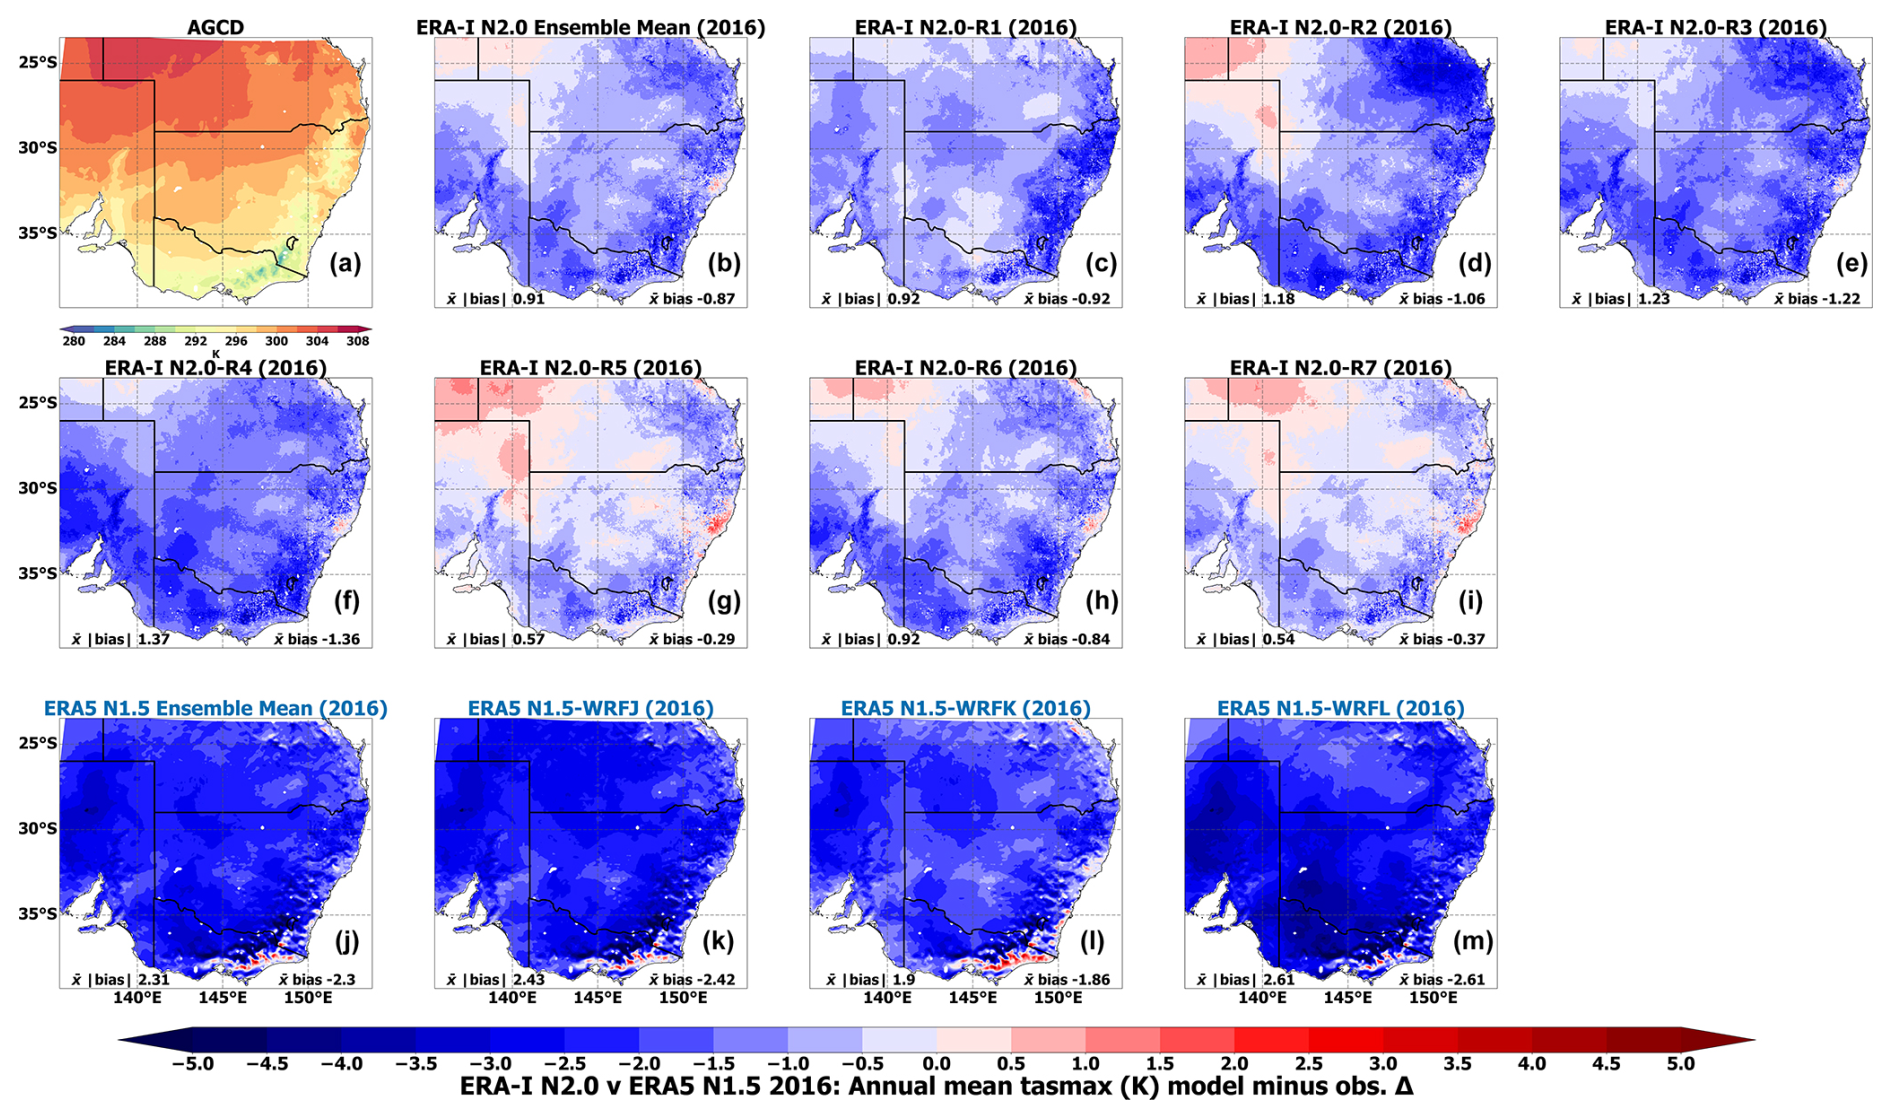
Figure 9Annual mean near-surface atmospheric maximum temperature bias simulated over southeastern Australia (WRF simulation inner domain) with respect to gridded observations for NARCliM2.0 RCMs forced by ERA-Interim for 2016 with 2-month spin-up starting in November 2015 (a–i), and corresponding NARCliM1.5 simulations for the same period forced by ERA5 (j–m).
In terms of RCM performances in simulating minimum temperature prior to switching the driving reanalyses, ERA-Interim-forced WRFJ–WRFK–WRFL RCMs of the CORDEX-CMIP5 era have lower overall biases for minimum temperature over the inner domain relative to the NARCliM2.0 ERA5-R1–R7 RCMs (i.e. ensemble mean absolute biases are 0.62 and 0.8 K, respectively; Fig. 10b, j). However, the biases of each RCM generation vary geographically such that the bias magnitudes for some ERA5 RCMs (e.g. R2–R3) are lower along coastal areas relative to ERA-Interim WRFJ–WRFK–WRFL over the same areas (Fig. 10d–e, k–m). Conversely, biases are lower over inland regions for ERA-Interim WRFJ–WRFK–WRFL relative to ERA5 RCMs.
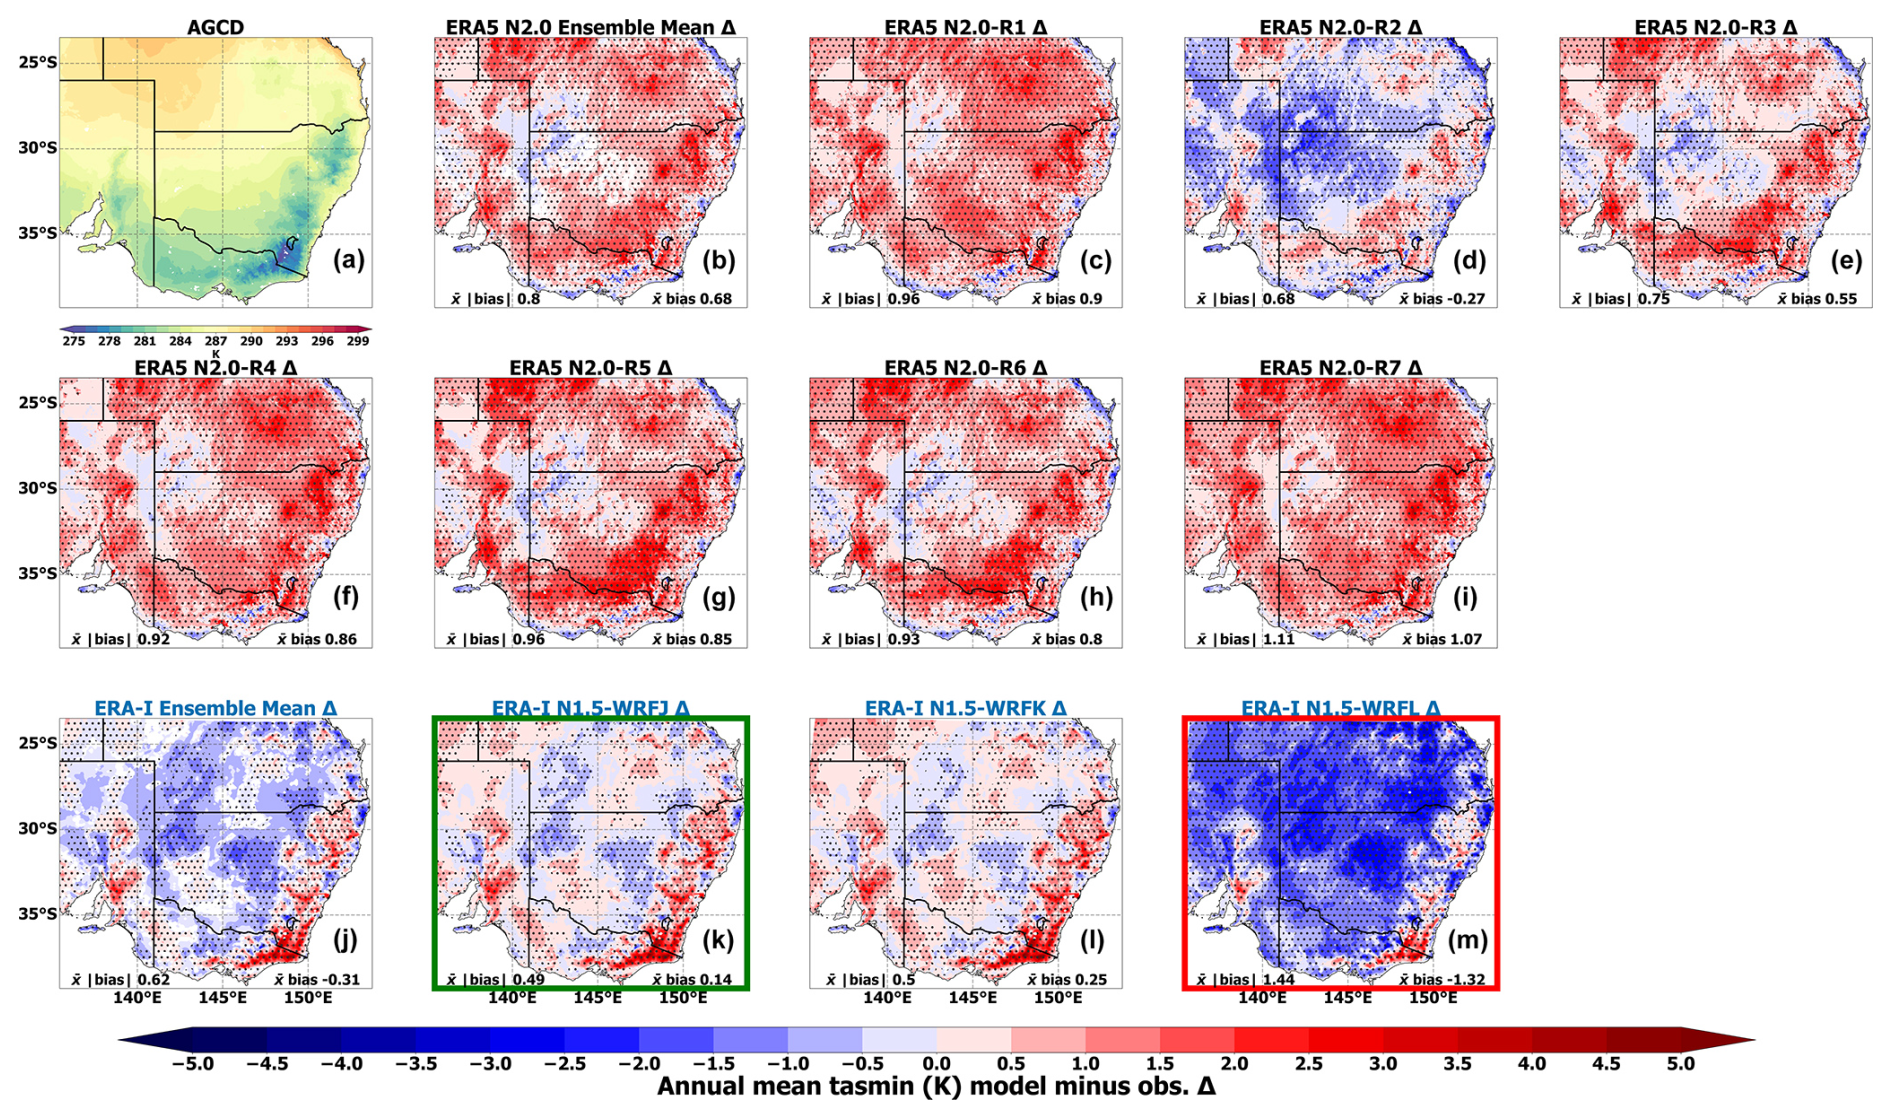
Figure 10Annual mean near-surface atmospheric minimum temperature bias simulated over southeastern Australia (WRF simulation inner domain) with respect to gridded observations for the period 1981–2010 for NARCliM2.0 RCMs (b–i) and NARCliM1.5 RCMs (j–m). Stippling and panel boundary colouring are as in Fig. 3.
Considering RCM simulations of mean minimum temperature with the driving reanalyses switched, performances are typically substantially poorer for the ERA5-forced WRFJ–WRFK–WRFL RCMs (Fig. 11) relative to their ERA-Interim-forced counterparts: the ensemble mean absolute biases are 0.88 K versus 0.62 K, respectively. In contrast, although all NARCliM2.0 RCMs except R2 show performance degradations when forced with ERA-Interim instead of ERA5 (e.g. ensemble mean biases are 0.98 and 0.8 K, respectively), these deteriorations are small (Fig. 11b–i).
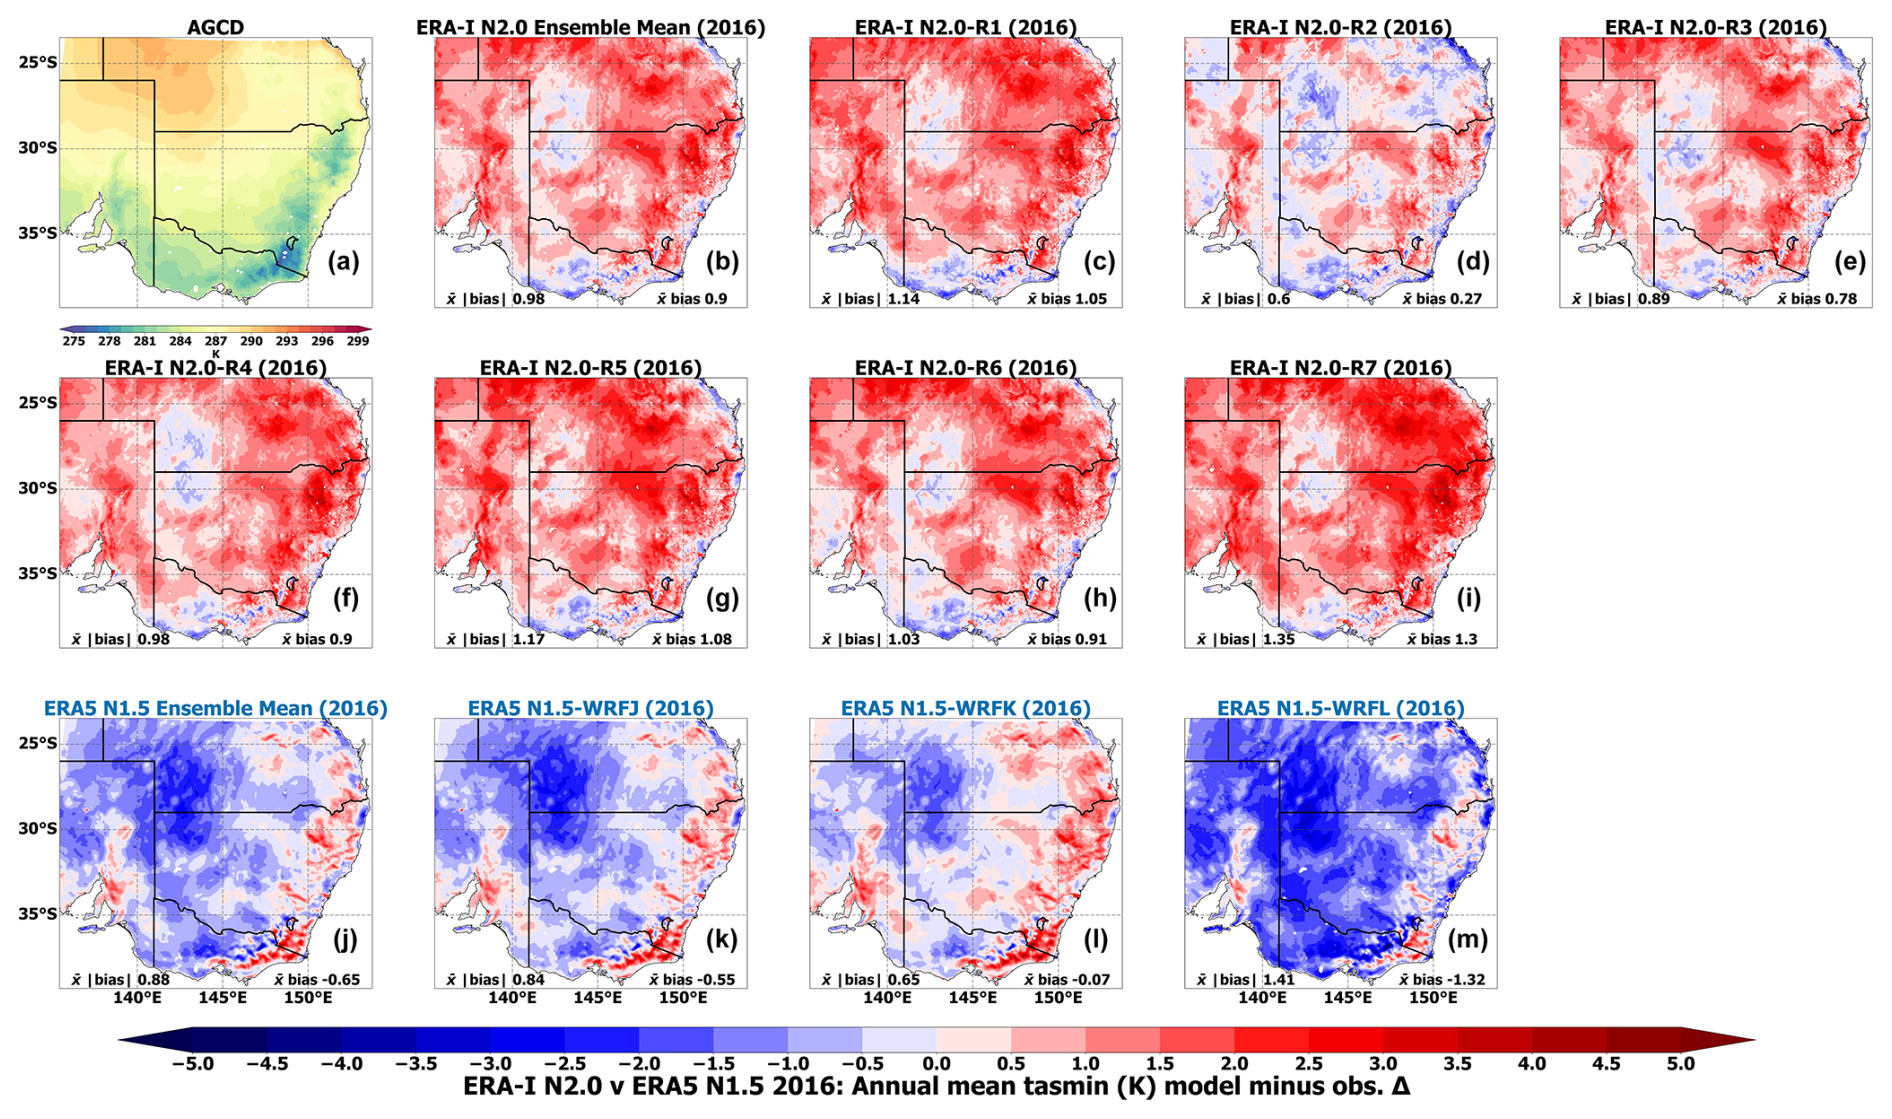
Figure 11Annual mean near-surface atmospheric minimum temperature bias with respect to gridded observations for NARCliM2.0 RCMs forced by ERA-Interim for 2016 with 2-month spin-up starting in November 2015 (a–i), and corresponding NARCliM1.5 simulations for the same period forced by ERA5 (j–m).
Improvements in the simulation of mean precipitation for ERA5-forced R1–R7 RCMs versus ERA-Interim WRFJ–WRFK–WRFL RCMs are especially evident over the high-resolution southeastern inner domain. At this scale, biases for several ERA5-forced R1–R7 RCMs are smaller than ∼5 mm compared to larger than ∼15 mm for the ERA-Interim WRFJ–WRFK–WRFL RCMs (Fig. 12). Moreover, several improvements in the ERA5 RCM simulation of annual mean precipitation are apparent at a convection-permitting scale relative to over the 20 km outer domain. For instance, dry biases for ERA5-R3 and ERA5-R5 along the eastern coastline are reduced at the convection-permitting scale.
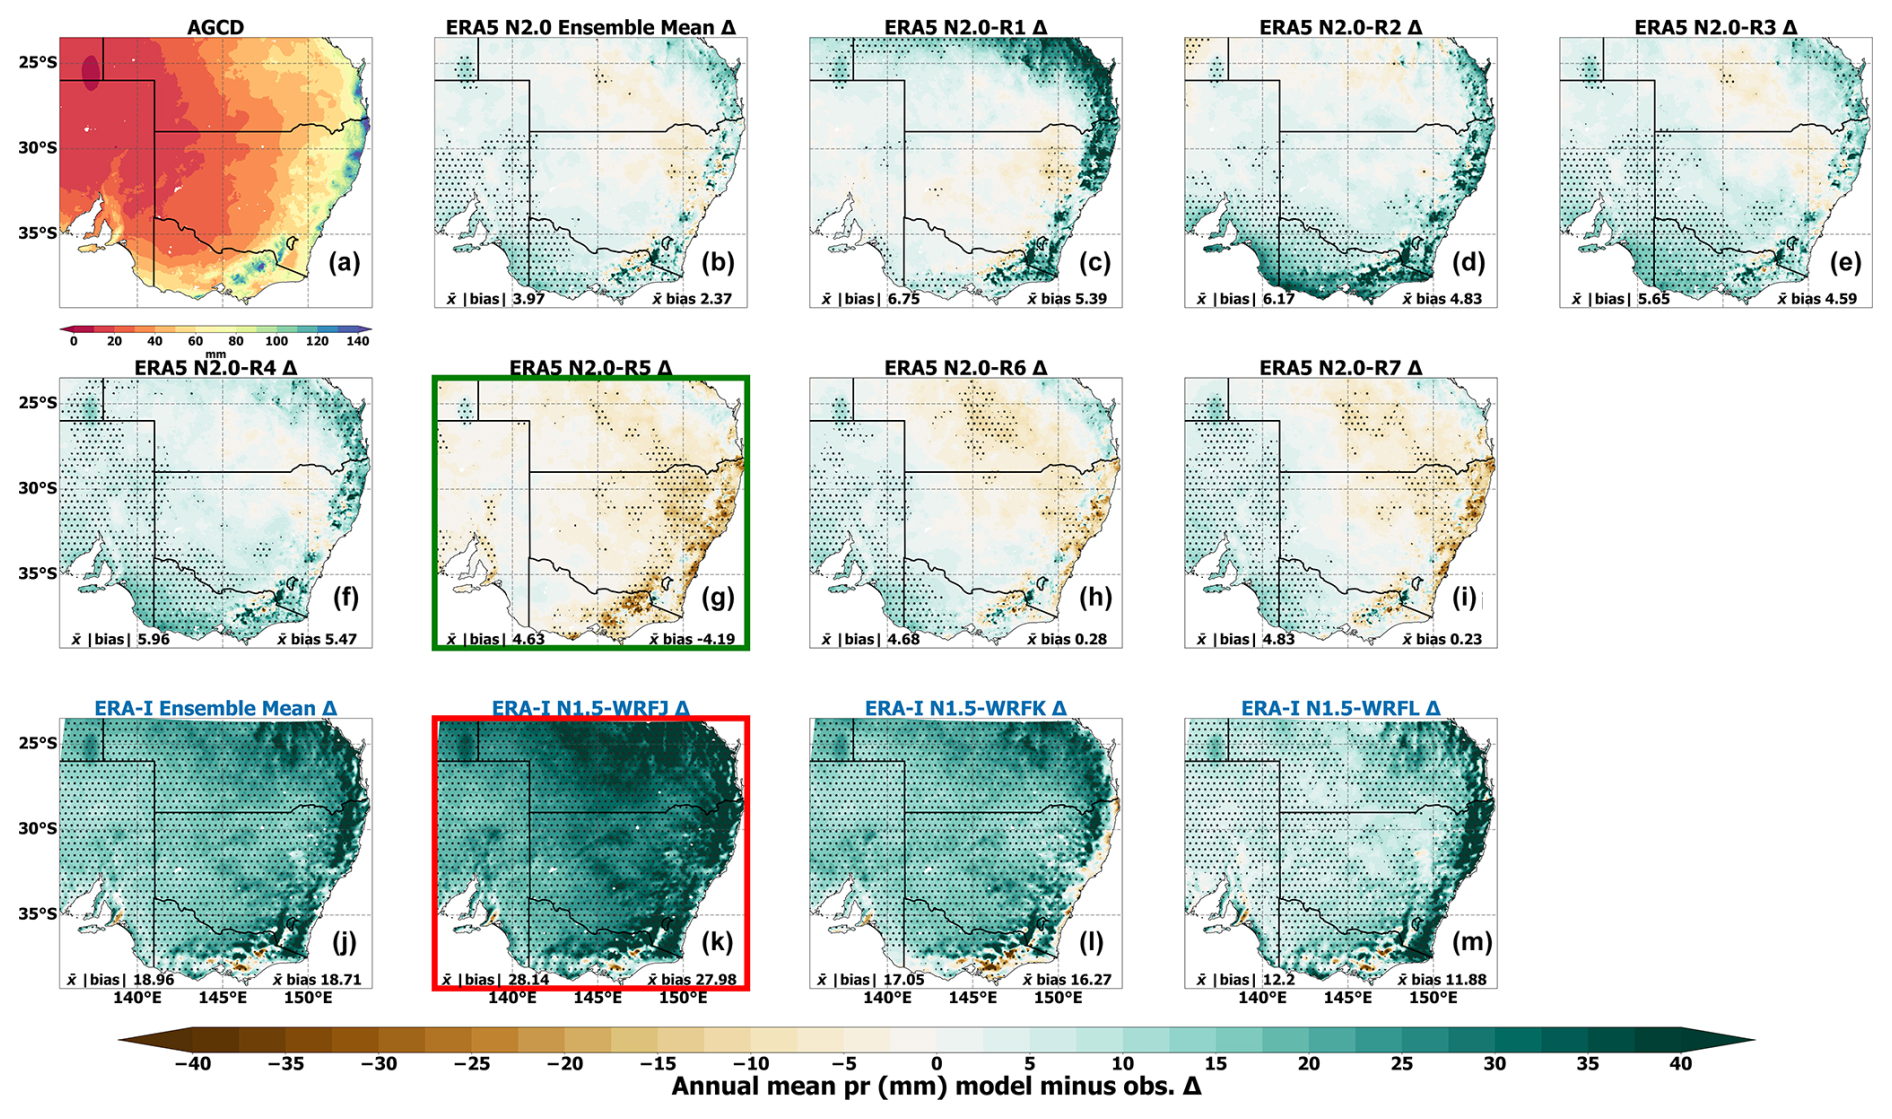
Figure 12Annual mean precipitation bias simulated over southeastern Australia (WRF simulation inner domain) with respect to gridded observations for the period 1981–2010 for NARCliM2.0 RCMs (b–i) and NARCliM1.5 RCMs (j–m). Stippling and panel boundary colouring are as in Fig. 3.
Switching driving reanalyses and simulating annual mean precipitation produces results that show consistent, large changes in RCM performances when using the newer ERA5 data, versus ERA-Interim. Forcing the NARCliM2.0 R1–R7 RCMs with ERA-Interim shows widespread marked increases in bias for annual mean precipitation for 2016 (Fig. 13b–i) relative to the preceding simulations using ERA5 such that the ensemble area-averaged mean absolute bias deteriorates to 8.02 mm versus 3.97 mm, roughly doubling the bias magnitude. Conversely, forcing WRFJ–WRFK–WRFL with ERA5 improves the simulation of annual mean precipitation, with all RCMs showing reductions in bias (Fig. 13j–m) such that the ensemble mean absolute bias decreases from 18.96 to 11.3 mm. These performance improvements are smaller in magnitude compared to the degradation in performance when switching the driving data for the NARCliM2.0 R1–R7 RCMs.
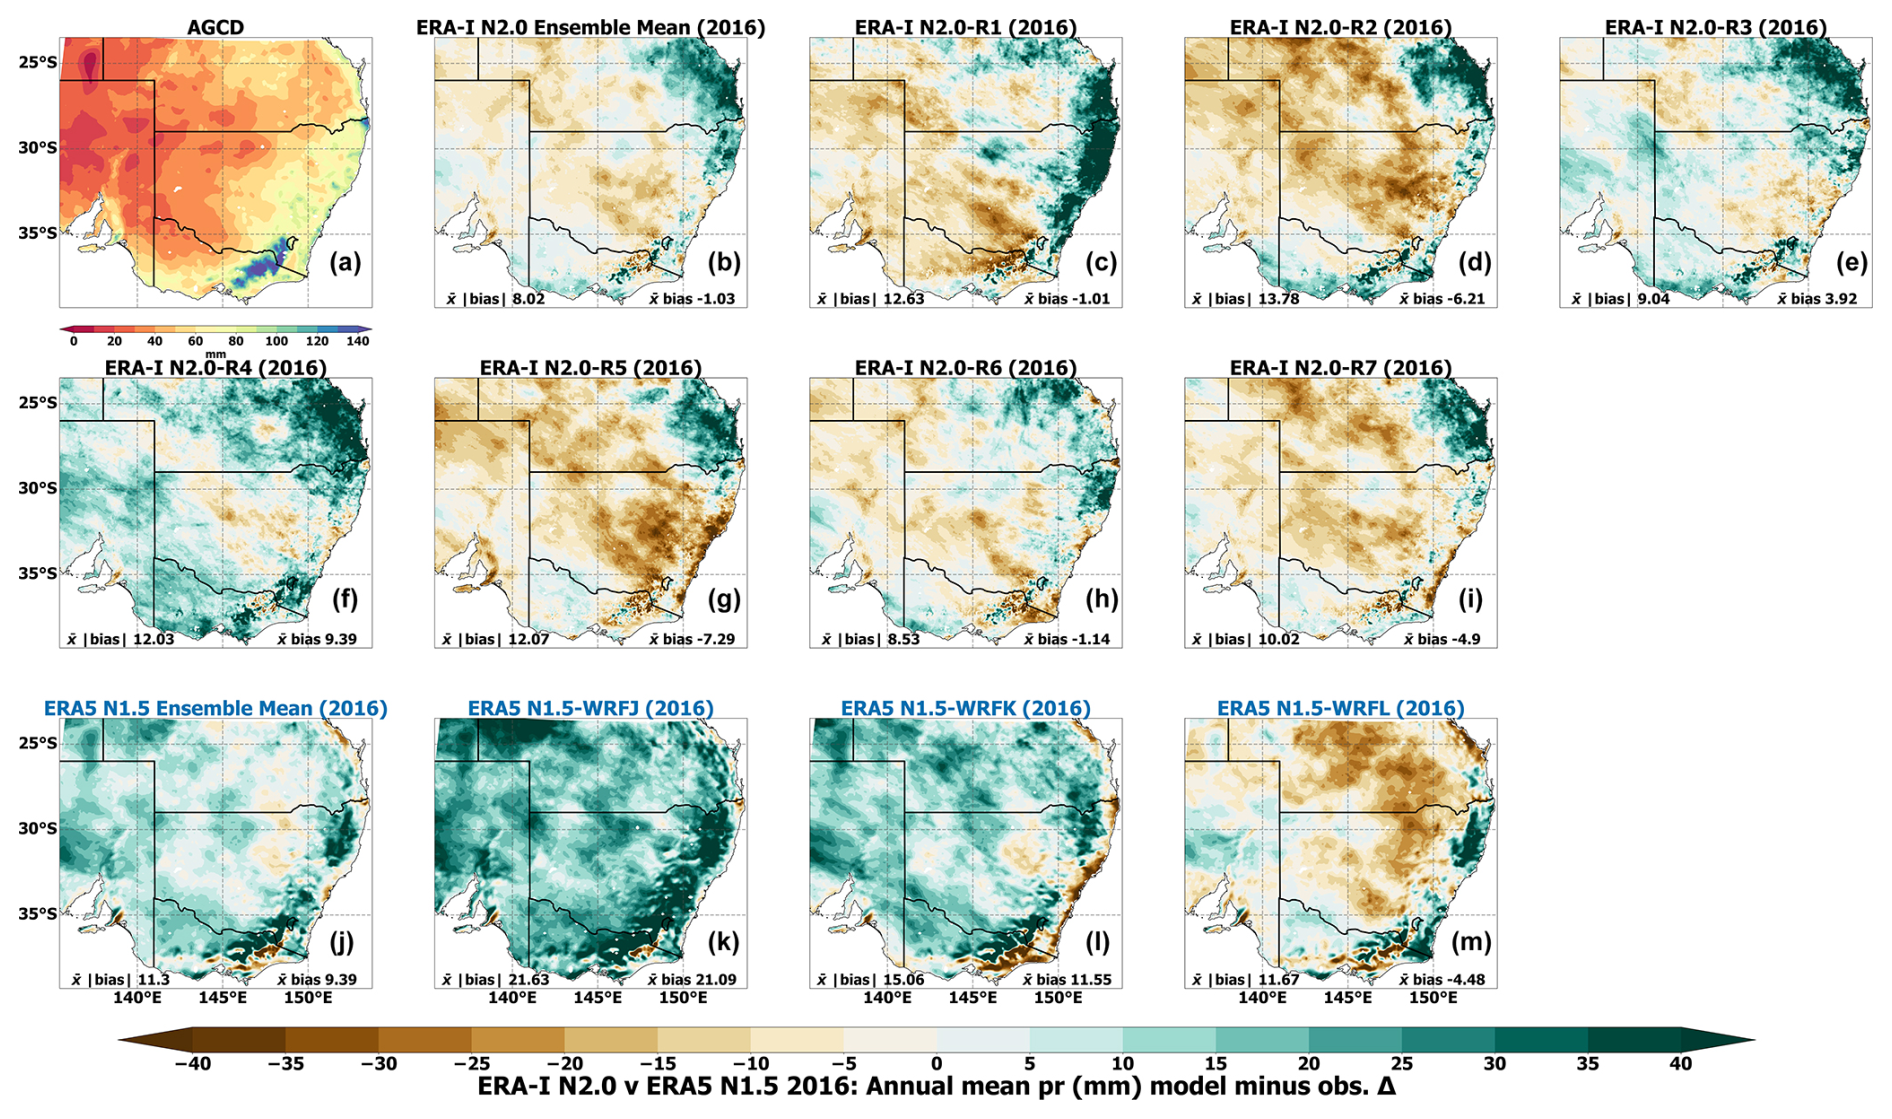
Figure 13Annual mean precipitation bias with respect to gridded observations for NARCliM2.0 RCMs forced by ERA-Interim for 2016 with 2-month spin-up starting in November 2015 (a–i), and corresponding NARCliM1.5 simulations for the same period forced by ERA5 (j–m).
We have evaluated the capabilities of CORDEX-CMIP6 ERA5-driven RCMs in simulating the Australian climate and compared their performances to the previous generation of ERA-Interim forced RCMs produced for CORDEX-CMIP5. The newer generation of RCMs generally shows improved simulations of maximum temperature and precipitation but no improvements for minimum temperature. Several changes have been made to the design of the newer generation of RCMs, including different RCM physics parameterisations and model specifications, and the driving reanalysis is newer (ERA5). We found no evidence to suggest that the newer reanalysis contributes to the improvements in the simulation of maximum temperature by the ERA5 RCMs, whereas the opposite applies to the simulation of precipitation. This study primarily focuses on model evaluation with investigations of potential mechanisms underlying the varying performance profiles of the different RCM generations to be the subject of future research. This will be facilitated by the imminent publication of the NARCliM2.0 ERA5 RCM data.
4.1 RCM performance evaluation
As per the ERA-Interim-driven RCMs, the NARCliM2.0 CORDEX-CMIP6 ERA5 RCMs are generally cold-biased for mean maximum temperature; however, their bias magnitudes are substantially lower relative to the CORDEX-CMIP5 ERA-Interim ensemble. The reductions in bias magnitude for most CORDEX-CMIP6 ERA5 RCMs are especially marked for the convection-permitting 4 km inner domain over southeastern Australia. Similarly, these ERA5 RCMs show an overall improved simulation of extreme maximum temperature over most of Australia relative to the CORDEX-CMIP5 ERA-Interim-forced RCMs. Improved simulation of mean and extreme maximum temperature has important practical applications for climate impact assessment in Australia (e.g. van Oldenborgh et al., 2021; Di Virgilio et al., 2020a; Trancoso et al., 2020) as well as globally (e.g. Vargas Zeppetello et al., 2022; Schleussner et al., 2016; Auffhammer et al., 2017).
Overall, CORDEX-CMIP6 ERA5 RCMs confer improvements in the simulation of mean precipitation over southeastern Australia relative to the CORDEX-CMIP5 ERA-Interim RCMs, with two ERA5 RCMs in particular (R3 and R4) showing considerable improvements over this region. Improvements in the simulation of mean precipitation by CORDEX-CMIP6 ERA5 RCMs are even more marked at the convection-permitting scale over southeastern Australia; i.e. the ERA5 ensemble mean is 3.97 mm versus 18.96 mm for the ERA-Interim ensemble. Given the significant impacts of drought and floods in Australia (González Tánago et al., 2016; Gu et al., 2020), this improvement in mean precipitation simulation is an encouraging result. The performance in simulating extreme precipitation over the Australian continent is comparable between the CORDEX-CMIP6 ERA5 RCMs and most CORDEX-CMIP5 ERA-Interim RCMs, except WRFSWWA, CCAM, and CCLM, which show strong biases. However, at convection-permitting scale, some ERA5 RCMs show improvements of around 10 % in the simulation of extreme precipitation relative to the ERA-Interim RCMs, except ERA5-R1 and ERA5-R2, which are strongly wet-biased. For both mean and extreme precipitation, ERA5 R1 and ERA5-R2 are notable in that they are more wet-biased than the other ERA5 RCMs, especially over northern Australia, where all other ERA5 RCMs contain a systematic dry bias. The only physics parameterisation common between both ERA5-R1 and ERA5-R2 is their use of WSM6 microphysics, and no other RCMs assessed here use this physics scheme, with ERA5-R3–R7 using Thompson microphysics. A previous assessment of the performance of different WRF parameterisations for a one-way nested inner domain over central Europe observed that WSM6 increases annual wet bias relative to other microphysical schemes tested, including the Thompson scheme (Varga and Breuer, 2020). Notably, marked dry biases over the monsoonal north for several ERA5-forced RCMs correspond with warm maximum temperature biases over this region shown by several ERA5 RCMs.
Whilst the ERA5 RCMs confer improvements to the simulation of maximum temperature and precipitation relative to ERA-Interim models, the simulation of minimum temperature for all timescales and statistics shows no improvement over the Australian continent. Focusing specifically on the WRF RCM configurations in the ERA-Interim ensemble, WRFJ and WRFK simulate both mean and extreme minimum temperature more accurately than the ERA5-forced models, though, in some cases, the differences are minimal. The exception to the above result is that some ERA5 RCMs simulate mean minimum temperature more accurately along southeastern coastlines at the 4 km convection-permitting scale.
4.2 ERA5 versus ERA-Interim evaluations: potential implications for CMIP6-forced dynamical downscaling
It could be expected that differences in the reanalysis datasets used to force the two generations of the WRF RCM ensemble contribute to the observed varying RCM performance profiles. ERA5 is a more recent reanalysis, which comprises a range of improvements over ERA-Interim, for instance, increased resolutions spanning horizontal (∼ 31 km versus ∼ 79 km), vertical (137 levels to 0.01 hPa versus 60 to 0.1 hPa), and temporal dimensions (every 1 h versus 6 h) among other features such as improved parameterisations (Hersbach et al., 2020). ERA5 has been shown to confer improvements over ERA-Interim in the simulation of processes such as convective updrafts, tropical cyclones, and other meso- to synoptic-scale atmospheric features (Hoffmann et al., 2019), as well as in some cases simulation of rainfall (e.g. Nogueira, 2020). Our investigation into whether differences in the driving reanalyses contribute to the varying RCM performances observed between the two WRF RCM ensembles involved two assessments: (i) comparisons of the ERA5 and ERA-Interim reanalyses against AGCD observations to assess their degree of bias and (ii) 14-month simulations, where otherwise identically parameterised NARCliM2.0 R1–R7 RCMs were forced by ERA-Interim as opposed to ERA5 and, similarly, the WRFJ–WRFK–WRFL RCMs were forced with ERA5 instead of ERA-Interim.
Comparison of ERA5 and ERA-Interim reanalysis data versus observations for mean maximum and minimum temperature and precipitation shows the expected results, i.e. that ERA5 data are closer to observations relative to ERA-Interim for all variables, especially for mean precipitation. Percentage differences in the area-averaged mean absolute bias for annual means range from 25 % for minimum temperature to 65 % for precipitation, also noting that performances during summer were more divergent than at annual timescales. Therefore, in terms of the underlying reanalysis data used to force the different WRF RCMs evaluated, ERA5 shows improvements relative to ERA-Interim. Additionally, these improvements are of a larger magnitude for mean precipitation than they are for mean maximum and minimum temperature.
For the 1-year simulations where the driving reanalyses are switched, using ERA5 over ERA-Interim gives a large performance improvement in the simulation of annual mean precipitation for the CORDEX-CMIP5 WRFJ–WRFK–WRFL RCMs. In contrast, using ERA5 over ERA-Interim as the driving data generally produces RCM performance degradations for both maximum and minimum annual mean temperatures. That is, a superior simulation of mean maximum and minimum temperatures is generally obtained for both generations of WRF RCM using ERA-Interim instead of ERA5. These results suggest that, at least for the different generations of WRF RCM assessed here in these 1-year experiments using a more accurate driving reanalysis for dynamical downscaling over this region, does not guarantee an enhanced simulation for all climatic variables. This result is surprising and warrants further investigation. However, this finding suggests that the parameterisations and design features of the WRF RCMs assessed play important roles in determining how well these RCMs simulate mean maximum and minimum temperatures. Consequently, the improved simulations of maximum temperature by CORDEX-CMIP6 ERA5 RCMs relative to CORDEX-CMIP5 ERA-Interim RCMs are more attributable to model design choices, such as physics parameterisations and/or improved resolution, rather than the driving reanalyses per se. Additionally, the fact that the CORDEX-CMIP6 ERA5-forced R1–R7 RCMs do not improve the simulation of minimum temperature relative to CORDEX-CMIP5 ERA-Interim-forced RCMs is not attributable to the change from ERA-Interim to ERA5 as the driving reanalysis but rather to aspect(s) of model parameterisation/design. Conversely, substantial improvements in simulating mean precipitation by CORDEX-CMIP6 ERA5 RCMs relative to CORDEX-CMIP5 ERA-Interim-forced RCMs appear (at least in part) due to the improvements to the ERA5 driving reanalysis. There are limitations to these comparative analyses switching the driving data, such as simulating for 14 months and not a climatological period. Nevertheless, the present evaluations suggest that whether CORDEX-CMIP6 dynamical downscaling of CMIP6 GCMs produces improved regional climate simulations relative to CORDEX-CMIP5 downscaling may depend in large part, at least for some variables/statistics, on RCM parameterisations and other design choices. However, the generality of these findings compared to other RCM types, configurations, study domains, and downscaling experiments warrants further research as these results may be specific to the WRF RCMs and domains assessed here.
4.3 ERA5-R1–R7 and CMIP6-forced dynamical downscaling
Although a single all-round best-performing ERA5 RCM configuration cannot be selected, the RCM performances for the climate variables and statistics assessed here yield some insights if selecting a subset of ERA5 RCM configurations for subsequent CMIP6-forced downscaling. Overall, ERA5-R1 provides a good simulation of both mean and extreme maximum temperature and is broadly comparable to the other ERA5 RCMs with respect to minimum temperature. However, its simulation of mean and extreme precipitation is relatively poor as compared to most ERA5 RCMs. ERA5-R2 has an unusual performance profile relative to the other ERA5 RCMs. Although ERA5-R2 shows generally good performance for minimum temperature, extreme maximum temperature, and precipitation, it shows poor performance for mean maximum temperature in that it is considerably more cold-biased than the other ERA5 RCMs. ERA5-R2 is the only ERA5-forced RCM configuration in this ensemble to use Kain–Fritsch cumulus physics, and it shows mean maximum temperature biases of a roughly similar magnitude and spatial pattern as the ERA-Interim WRFJ and WRFK RCMs, which use the same scheme. However, ERA5-R2 also generates a strong mean maximum temperature cold bias over southeastern Australia at the 4 km convection-permitting scale, which does not use cumulus parameterisation. ERA5-R3 shows good performance for mean minimum temperature and mean precipitation and reasonable performance for mean maximum temperature. The performance of ERA5-R4 is broadly similar to ERA5-R3, but it has substantially inferior performance versus ERA5-R3 for maximum and minimum temperature extremes. ERA5-R5 shows consistently good performance for maximum temperature. The performance of ERA5-R5 in simulating precipitation over Australia at 20 km resolution is not impressive versus the other ERA5 RCMs, and it shows strong dry biases over northern Australia. However, ERA5-R5 is the best-performing model in this ensemble for mean precipitation at the 4 km convection-permitting scale over southeastern Australia. Both ERA5-R6 and ERA5-R7 frequently show the strongest biases, typically over large regions, such as eastern Australia, for both temperature variables and over northern Australia for precipitation. As such, they are the poorest performers overall in this ERA5 ensemble, with performance for extreme minimum temperature often being particularly poor.
From the specific perspective of the ERA5 RCM performances, and based on the present evaluations, overall ERA5-R3 and ERA5-R5 may be considered favourable RCM configurations for CMIP6-forced dynamical downscaling. However, as noted, some other ERA5 RCM configurations show good performance for specific variables and statistics and thus could warrant inclusion in a larger ensemble and/or one adopting a sparse matrix approach (Christensen and Kjellström, 2020).
This study forms the first part of a series of simulations for the CORDEX-Australasia domain, wherein we document model performances of ERA5 reanalysis-forced RCMs, and this is the first set of simulations required by the CORDEX-CMIP6 framework. We compared our results with ERA-Interim-driven simulations, which was part of the CORDEX-CMIP5 framework. While model versions and physics options were different between these two generations of reanalysis-forced RCM simulations, overall, our results show the NARCliM2.0 ERA5-forced RCMs confer improved simulations for maximum temperature and precipitation but not for minimum temperature.
The simulation of precipitation by the NARCliM2.0 RCMs show several improvements at the 4 km convection-permitting scale relative to the 20 km outer domain. For example, dry biases are reduced for the convection-permitting domain where convection is represented explicitly relative to the 20 km outer domain, which uses a convective parameterisation. Convection schemes can be a source of deficiencies in RCM simulations of precipitation (e.g. Jones and Randall, 2011). It may be expected that the improved representation of convection for the 4 km domain may positively influence the simulation of high-impact phenomena, such as short-duration precipitation extremes. Nevertheless, our results for the CORDEX-Australasia domain suggest that the choice of a microphysics scheme is important, especially for precipitation extremes.
Whilst ERA5 reanalysis data show better representations of the observed Australian climate than ERA-Interim, only improvements in the simulation of mean precipitation by the CORDEX-CMIP6 ERA5 RCMs appear at least partly attributable to the increased accuracy of ERA5 driving reanalyses. Conversely, the change in the driving reanalysis from ERA-Interim to ERA5 is not a major factor underlying improvements in the simulation of maximum temperature by the CORDEX-CMIP6 RCMs assessed, suggesting that their performance improvements are more attributable to changes in RCM parameterisation and design. The different land surface schemes (e.g. Noah Unified versus Noah-MP) likely play a role in RCM skill in simulating maximum temperature as well as changing the land surface feedback (via soil moisture) to the simulation of precipitation; these possibilities require more extensive analysis to investigate. Equally, differences in the underling driving reanalyses do not explain the absence of overall improvements in the simulation of minimum temperature by the newer CORDEX-CMIP6 RCMs. It is important to be cautious of generalising the present results to other regions globally as region-specific RCM optimisation is necessary.
Our present focus was to evaluate the performances of the different RCM generations assessed here. Future work will explore other topics, such as the potential influences of the different RCM physics configurations and their associated biases on the nature of the future change signals in subsequent CMIP6 GCM-forced simulations, e.g. when holding the driving GCM data constant. Additionally, future model intercomparison studies that compare biases between the different RCMs contributing to CORDEX-Australasia will be valuable.
Results presented here are relevant for other CORDEX-CMIP6/CORDEX2 modelling projects. Maximum temperature and precipitation are important inputs to climate impact assessments in Australia and globally. The improvements in simulating maximum temperature and precipitation conferred by CORDEX-CMIP6 ERA5-forced RCMs evaluated here indicate that using a subset of the RCMs in this ensemble for future CMIP6-forced downscaling over CORDEX-Australasia could yield benefits in simulating regional climate.
The Weather Research and Forecasting (WRF) version 4.1.2 and all model configuration files used in this study are available on Zenodo at https://doi.org/10.5281/zenodo.11189898 (Di Virgilio et al., 2024).
Data for the seven CORDEX-CMIP6 ERA5-forced R1-R7 RCMs are being made available via National Computing Infrastructure (NCI, https://my.nci.org.au/mancini/login?next=/mancini/, last access: 30 January 2025). WRF namelist settings for the CORDEX-CMIP6 ERA5-forced RCMs R1-R7 are shown in Fig. S32 in the Supplement. Data for the three ERA-Interim forced WRFJ–WRFK–WRFL RCMs are available via the New South Wales Climate Data Portal (https://climatedata-beta.environment.nsw.gov.au/, NSW Government, 2023) and CORDEX-DKRZ (https://esgf-metagrid.cloud.dkrz.de/search/cordex-dkrz/, ESGF, 2023), and data for ERA-Interim forced CCAM, CCLM and WRFSWWA are available via CORDEX-DKRZ (https://esgf-metagrid.cloud.dkrz.de/search/cordex-dkrz/, ESGF, 2023).
The supplement related to this article is available online at: https://doi.org/10.5194/gmd-18-703-2025-supplement.
GDV and JPE designed the models and the simulations. FJ, ET, JA, and CT setup the models and conducted the model simulations with contributions from JPE, JK, GDV, and YL. GDV prepared the paper with contributions from all co-authors.
At least one of the (co-)authors is a member of the editorial board of Geoscientific Model Development. The peer-review process was guided by an independent editor, and the authors also have no other competing interests to declare.
Publisher's note: Copernicus Publications remains neutral with regard to jurisdictional claims made in the text, published maps, institutional affiliations, or any other geographical representation in this paper. While Copernicus Publications makes every effort to include appropriate place names, the final responsibility lies with the authors.
All authors thank the reviewers for their thoughtful and insightful feedback on this paper and the editor at Geoscientific Model Development for handling the peer review process of this paper.
This research was supported by the New South Wales Department of Climate Change, Energy, the Environment and Water as part of the NARCliM2.0 dynamical downscaling project contributing to CORDEX-Australasia. Funding was provided by the NSW Climate Change Fund; the NSW Climate Change Adaptation Strategy programme; and the ACT, SA, WA, and VIC governments for the NSW and Australia Regional Climate Modelling (NARCliM) project. This research was undertaken with the assistance of resources and services from the National Computational Infrastructure (NCI), which is supported by the Australian government.
Jason P. Evans was supported by the Australian Research Council Centre of Excellence for Climate Extremes (grant no. CE170100023) and the Climate Systems Hub of the Australian government's National Environmental Science Program.
This paper was edited by Stefan Rahimi-Esfarjani and reviewed by Sugata Narsey and one anonymous referee.
Auffhammer, M., Baylis, P., and Hausman, C. H.: Climate change is projected to have severe impacts on the frequency and intensity of peak electricity demand across the United States, P. Natl. Acad. Sci. USA, 114, 1886–1891, https://doi.org/10.1073/pnas.1613193114, 2017.
Bechtold, P., Kohler, M., Jung, T., Doblas-Reyes, F., Leutbecher, M., Rodwell, M. J., Vitart, F., and Balsamo, G.: Advances in simulating atmospheric variability with the ECMWF model: From synoptic to decadal time-scales, Q. J. Roy. Meteor. Soc., 134, 1337–1351, https://doi.org/10.1002/qj.289, 2008.
Bucchignani, E., Mercogliano, P., Rianna, G., and Panitz, H. J.: Analysis of ERA-Interim-driven COSMO-CLM simulations over Middle East - North Africa domain at different spatial resolutions, Int. J. Climatol., 36, 3346–3369, https://doi.org/10.1002/joc.4559, 2016.
Bureau of Meteorology: Annual climate statement 2016, http://www.bom.gov.au/climate/current/annual/aus/2016/#:~:text=Globally,2016thewarmestyear,newrecordhasbeenset (last access: 12 February 2024), 2017.
Chou, M. D., Suarez, M. J., Liang, X. Z., and Yan, M. M. H.: A thermal infrared radiation parameterization for atmospheric studies, NASA Tech. Memo., NASA/TM-2001-104606, 19, 68 pp. https://ntrs.nasa.gov/citations/20010072848 (last access: 17 April 2023), 2001.
Christensen, O. B. and Kjellström, E.: Partitioning uncertainty components of mean climate and climate change in a large ensemble of European regional climate model projections, Clim. Dynam., 54, 4293–4308, https://doi.org/10.1007/s00382-020-05229-y, 2020.
Consortium for Small−Scale Modelling: Newsletter No. 1, https://www.cosmo-model.org/content/model/documentation/newsLetters/newsLetter01/newsLetter_01.pdf (last access: 30 January 2025), 2001.
Dee, D. P., Uppala, S. M., Simmons, A. J., Berrisford, P., Poli, P., Kobayashi, S., Andrae, U., Balmaseda, M. A., Balsamo, G., Bauer, P., Bechtold, P., Beljaars, A. C. M., van de Berg, L., Bidlot, J., Bormann, N., Delsol, C., Dragani, R., Fuentes, M., Geer, A. J., Haimberger, L., Healy, S. B., Hersbach, H., Hólm, E. V., Isaksen, L., Kållberg, P., Köhler, M., Matricardi, M., McNally, A. P., Monge-Sanz, B. M., Morcrette, J. J., Park, B. K., Peubey, C., de Rosnay, P., Tavolato, C., Thépaut, J. N., and Vitart, F.: The ERA-Interim reanalysis: configuration and performance of the data assimilation system, Q. J. Roy. Meteor. Soc., 137, 553–597, https://doi.org/10.1002/qj.828, 2011.
Dickinson, R. E., Oleson, K. W., Bonan, G., Hoffman, F., Thornton, P., Vertenstein, M., Yang, Z. L., and Zeng, X. B.: The Community Land Model and its climate statistics as a component of the Community Climate System Model, J. Climate, 19, 2302–2324, https://doi.org/10.1175/JCLI3742.1, 2006.
Di Luca, A., de Elia, R., and Laprise, R.: Potential for added value in precipitation simulated by high-resolution nested Regional Climate Models and observations, Clim. Dynam., 38, 1229–1247, https://doi.org/10.1007/s00382-011-1068-3, 2012.
Di Virgilio, G., Evans, J. P., Di Luca, A., Olson, R., Argüeso, D., Kala, J., Andrys, J., Hoffmann, P., Katzfey, J. J., and Rockel, B.: Evaluating reanalysis-driven CORDEX regional climate models over Australia: model performance and errors, Clim. Dynam., 53, 2985–3005, https://doi.org/10.1007/s00382-019-04672-w, 2019.
Di Virgilio, G., Evans, J. P., Clarke, H., Sharples, J., Hirsch, A. L., and Hart, M. A.: Climate Change Significantly Alters Future Wildfire Mitigation Opportunities in Southeastern Australia, Geophys. Res. Lett., 47, e2020GL088893, https://doi.org/10.1029/2020GL088893, 2020a.
Di Virgilio, G., Evans, J. P., Di Luca, A., Grose, M. R., Round, V., and Thatcher, M.: Realised added value in dynamical downscaling of Australian climate change, Clim. Dynam., 54, 4675–4692, https://doi.org/10.1007/s00382-020-05250-1, 2020b.
Di Virgilio, G., Ji, F., Tam, E., Evans, J. P., Kala, J., Andrys, J., Thomas, C., Choudhury, D., Rocha, C., Li, Y., and Riley, M. L.: Supporting information for “Evaluation of CORDEX ERA5-forced 'NARCliM2.0' regional climate models over Australia using the Weather Research and Forecasting (WRF) model version 4.1.2”, v1.0, Zenodo [code], https://doi.org/10.5281/zenodo.11189898, 2024.
Di Virgilio, G., Evans, J. P., Ji, F., Tam, E., Kala, J., Andrys, J., Thomas, C., Choudhury, D., Rocha, C., White, S., Li, Y., El Rafei, M., Goyal, R., Riley, M. L., and Lingala, J.: Design, evaluation, and future projections of the NARCliM2.0 CORDEX-CMIP6 Australasia regional climate ensemble, Geosci. Model Dev., 18, 671–702, https://doi.org/10.5194/gmd-18-671-2025, 2025.
Ekström, M., Grose, M. R., and Whetton, P. H.: An appraisal of downscaling methods used in climate change research, WIRES Clim. Change, 6, 301–319, https://doi.org/10.1002/wcc.339, 2015.
ESGF: CORDEX data, ESGF [data set], https://esgf-metagrid.cloud.dkrz.de/search/cordex-dkrz/, last access: 23 January 2025.
Evans, A., Jones, D., Lellyett, S., and Smalley, R.: An Enhanced Gridded Rainfall Analysis Scheme for Australia, Australian Bureau of Meteorology, http://www.bom.gov.au/research/publications/researchreports/BRR-041.pdf (last access: 22 January 2024), 2020.
Evans, J. P., Ji, F., Lee, C., Smith, P., Argüeso, D., and Fita, L.: Design of a regional climate modelling projection ensemble experiment – NARCliM, Geosci. Model Dev., 7, 621–629, https://doi.org/10.5194/gmd-7-621-2014, 2014.
Eyring, V., Bony, S., Meehl, G. A., Senior, C. A., Stevens, B., Stouffer, R. J., and Taylor, K. E.: Overview of the Coupled Model Intercomparison Project Phase 6 (CMIP6) experimental design and organization, Geosci. Model Dev., 9, 1937–1958, https://doi.org/10.5194/gmd-9-1937-2016, 2016.
Freidenreich, S. M. and Ramaswamy, V.: A new multiple-band solar radiative parameterization for general circulation models, J. Geophys. Res.-Atmos., 104, 31389–31409, https://doi.org/10.1029/1999JD900456, 1999.
Giorgi, F.: Regional climate modeling: Status and perspectives, J. Phys. IV, 139, 101–118, https://doi.org/10.1051/jp4:2006139008, 2006.
Giorgi, F.: Thirty Years of Regional Climate Modeling: Where Are We and Where Are We Going next?, J. Geophys. Res.-Atmos., 124, 5696–5723, https://doi.org/10.1029/2018jd030094, 2019.
Giorgi, F. and Bates, G. T.: The Climatological Skill of a Regional Model over Complex Terrain, Mon. Weather Rev., 117, 2325–2347, https://doi.org/10.1175/1520-0493(1989)117<2325:TCSOAR>2.0.CO;2, 1989.
Giorgi, F., Jones, C., and Asrar, G.: Addressing climate information needs at the regional level: The CORDEX framework, WMO Bulletin, 53, 175–183, 2009.
González Tánago, I., Urquijo, J., Blauhut, V., Villarroya, F., and De Stefano, L.: Learning from experience: a systematic review of assessments of vulnerability to drought, Nat. Hazards, 80, 951–973, https://doi.org/10.1007/s11069-015-2006-1, 2016.
Grose, M. R., Narsey, S., Delage, F. P., Dowdy, A. J., Bador, M., Boschat, G., Chung, C., Kajtar, J. B., Rauniyar, S., Freund, M. B., Lyu, K., Rashid, H., Zhang, X., Wales, S., Trenham, C., Holbrook, N. J., Cowan, T., Alexander, L., Arblaster, J. M., and Power, S.: Insights From CMIP6 for Australia's Future Climate, Earth's Future, 8, e2019EF001469, https://doi.org/10.1029/2019EF001469, 2020.
Grose, M., Narsey, S., Trancoso, R., Mackallah, C., Delage, F., Dowdy, A., Di Virgilio, G., Watterson, I., Dobrohotoff, P., Rashid, H. A., Rauniyar, S., Henley, B., Thatcher, M., Syktus, J., Abramowitz, G., Evans, J. P., Su, C.-H., and Takbash, A.: A CMIP6-based multi-model downscaling ensemble to underpin climate change services in Australia, Climate Services, 30, 100368, https://doi.org/10.1016/j.cliser.2023.100368, 2023.
Gu, X. H., Zhang, Q., Li, J. F., Liu, J. Y., Xu, C. Y., and Sun, P.: The changing nature and projection of floods across Australia, J. Hydrol., 584, 124703, https://doi.org/10.1016/j.jhydrol.2020.124703, 2020.
Gutowski Jr., W. J., Giorgi, F., Timbal, B., Frigon, A., Jacob, D., Kang, H.-S., Raghavan, K., Lee, B., Lennard, C., Nikulin, G., O'Rourke, E., Rixen, M., Solman, S., Stephenson, T., and Tangang, F.: WCRP COordinated Regional Downscaling EXperiment (CORDEX): a diagnostic MIP for CMIP6, Geosci. Model Dev., 9, 4087–4095, https://doi.org/10.5194/gmd-9-4087-2016, 2016.
Hersbach, H., Bell, B., Berrisford, P., Hirahara, S., Horányi, A., Muñoz-Sabater, J., Nicolas, J., Peubey, C., Radu, R., Schepers, D., Simmons, A., Soci, C., Abdalla, S., Abellan, X., Balsamo, G., Bechtold, P., Biavati, G., Bidlot, J., Bonavita, M., De Chiara, G., Dahlgren, P., Dee, D., Diamantakis, M., Dragani, R., Flemming, J., Forbes, R., Fuentes, M., Geer, A., Haimberger, L., Healy, S., Hogan, R. J., Hólm, E., Janisková, M., Keeley, S., Laloyaux, P., Lopez, P., Lupu, C., Radnoti, G., de Rosnay, P., Rozum, I., Vamborg, F., Villaume, S., and Thépaut, J.-N.: The ERA5 global reanalysis, Q. J. Roy. Meteor. Soc., 146, 1999–2049, https://doi.org/10.1002/qj.3803, 2020.
Hoffmann, L., Günther, G., Li, D., Stein, O., Wu, X., Griessbach, S., Heng, Y., Konopka, P., Müller, R., Vogel, B., and Wright, J. S.: From ERA-Interim to ERA5: the considerable impact of ECMWF's next-generation reanalysis on Lagrangian transport simulations, Atmos. Chem. Phys., 19, 3097–3124, https://doi.org/10.5194/acp-19-3097-2019, 2019.
Hong, S. Y. and Lim, J.-O. J.: The WRF Single-Moment 6-Class Microphysics Scheme (WSM6), Asia-Pac. J. Atmos. Sci., 42, 129–151, 2006.
Hong, S.-Y., Noh, Y., and Dudhia, J.: A New Vertical Diffusion Package with an Explicit Treatment of Entrainment Processes, Mon. Weather Rev., 134, 2318–2341, https://doi.org/10.1175/MWR3199.1, 2006.
Howard, E., Su, C.-H., Stassen, C., Naha, R., Ye, H., Pepler, A., Bell, S. S., Dowdy, A. J., Tucker, S. O., and Franklin, C.: Performance and process-based evaluation of the BARPA-R Australasian regional climate model version 1, Geosci. Model Dev., 17, 731–757, https://doi.org/10.5194/gmd-17-731-2024, 2024.
Hsiang, S., Kopp, R., Jina, A., Rising, J., Delgado, M., Mohan, S., Rasmussen, D. J., Muir-Wood, R., Wilson, P., Oppenheimer, M., Larsen, K., and Houser, T.: Estimating economic damage from climate change in the United States, Science, 356, 1362–1368, https://doi.org/10.1126/science.aal4369, 2017.
Iacono, M. J., Delamere, J. S., Mlawer, E. J., Shephard, M. W., Clough, S. A., and Collins, W. D.: Radiative forcing by long-lived greenhouse gases: Calculations with the AER radiative transfer models, J. Geophys. Res.-Atmos., 113, D13103, https://doi.org/10.1029/2008JD009944, 2008.
IPCC: Climate Change 2021: The Physical Science Basis. Contribution of Working Group I to the Sixth Assessment Report of the Intergovernmental Panel on Climate Change, Cambridge University Press, https://doi.org/10.1017/9781009157896, 2021.
Janjić, Z. I.: Comments on “Development and Evaluation of a Convection Scheme for Use in Climate Models”, J. Atmos. Sci., 57, 3686–3686, https://doi.org/10.1175/1520-0469(2000)057<3686:CODAEO>2.0.CO;2, 2000.
Jones, T. R. and Randall, D. A.: Quantifying the limits of convective parameterizations, J. Geophys. Res.-Atmos., 116, D08210, https://doi.org/10.1029/2010JD014913, 2011.
Kain, J. S.: The Kain–Fritsch convective parameterization: An update, J. Appl. Meteorol., 43, 170–181, https://doi.org/10.1175/1520-0450(2004)043<0170:TKCPAU>2.0.CO;2, 2004.
Kowalczyk, E. A., Wang, Y. P., Law, R. M., Davies, H. L., McGregor, J. L., and Abramowitz, G. S.: The CSIRO Atmosphere Biosphere Land Exchange (CABLE) model for use in climate models and as an offline model, Aspendale, Vic.: CSIRO Marine and Atmospheric Research; https://doi.org/10.4225/08/58615c6a9a51d, 2006.
Laprise, R.: Regional climate modelling, J. Comput. Phys., 227, 3641–3666, https://doi.org/10.1016/j.jcp.2006.10.024, 2008.
Ma, M. N., Ou, T. H., Liu, D. Q., Wang, S. Y., Fang, J., and Tang, J. P.: Summer regional climate simulations over Tibetan Plateau: from gray zone to convection permitting scale, Clim. Dynam., 60, 301–322, https://doi.org/10.1007/s00382-022-06314-0, 2022.
McGregor, J. L.: A new convection scheme using a simple closure. BMRC research report 93. Melbourne, Australia, https://research.csiro.au/ccam/wp-content/uploads/sites/520/2024/01/1377337417.pdf (last access 29 January 2025), 2003.
McGregor, J. L., Gordon, H. B., Watterson, I. G., Dix, M. R., and Rotstayn, L. D.: The CSIRO 9-level atmospheric general circulation model, Melbourne, CSIRO Australia, https://doi.org/10.4225/08/586550bc3318b, 1993.
McGregor, J. L. and Dix, M. R.: An updated description of the Conformal-Cubic atmospheric model, High Resolution Numerical Modelling of the Atmosphere and Ocean, Springer, New York, 51–75 pp., https://doi.org/10.1007/978-0-387-49791-4_4, 2008.
Nakanishi, M. and Niino, H.: Development of an Improved Turbulence Closure Model for the Atmospheric Boundary Layer, J. Meteorol. Soc. Jpn. Ser. II, 87, 895–912, https://doi.org/10.2151/jmsj.87.895, 2009.
Nishant, N., Evans, J. P., Di Virgilio, G., Downes, S. M., Ji, F., Cheung, K. K. W., Tam, E., Miller, J., Beyer, K., and Riley, M. L.: Introducing NARCliM1.5: Evaluating the Performance of Regional Climate Projections for Southeast Australia for 1950–2100, Earth's Future, 9, e2020EF001833, https://doi.org/10.1029/2020EF001833, 2021.
Niu, G.-Y., Yang, Z.-L., Mitchell, K. E., Chen, F., Ek, M. B., Barlage, M., Kumar, A., Manning, K., Niyogi, D., Rosero, E., Tewari, M., and Xia, Y.: The community Noah land surface model with multiparameterization options (Noah-MP): 1. Model description and evaluation with local-scale measurements, J. Geophys. Res.-Atmos., 116, D12109, https://doi.org/10.1029/2010jd015139, 2011.
Nogueira, M.: Inter-comparison of ERA-5, ERA-interim and GPCP rainfall over the last 40 years: Process-based analysis of systematic and random differences, J. Hydrol., 583, 124632, https://doi.org/10.1016/j.jhydrol.2020.124632, 2020.
NSW Government: NSW Climate Data Portal (CDP), NSW Government [data set], https://climatedata-beta.environment.nsw.gov.au/, last access: 15 August 2023.
Panitz, H.-J., Dosio, A., Büchner, M., Lüthi, D., and Keuler, K.: COSMO-CLM (CCLM) climate simulations over CORDEX-Africa domain: analysis of the ERA-Interim driven simulations at 0.44° and 0.22° resolution, Clim. Dynam., 42, 3015–3038, https://doi.org/10.1007/s00382-013-1834-5, 2014.
Perkins, S. E., Pitman, A. J., Holbrook, N. J., and McAneney, J.: Evaluation of the AR4 climate models' simulated daily maximum temperature, minimum temperature, and precipitation over Australia using probability density functions, J. Climate, 20, 4356–4376, https://doi.org/10.1175/jcli4253.1, 2007.
Pleim, J. E.: A Combined Local and Nonlocal Closure Model for the Atmospheric Boundary Layer. Part I: Model Description and Testing, J. Appl. Meteorol. Climatol., 46, 1383–1395, https://doi.org/10.1175/JAM2539.1, 2007.
Reder, A., Raffa, M., Padulano, R., Rianna, G., and Mercogliano, P.: Characterizing extreme values of precipitation at very high resolution: An experiment over twenty European cities, Weather and Climate Extremes, 35, 100407, https://doi.org/10.1016/j.wace.2022.100407, 2022.
Ritter, B. and Geleyn, J.-F.: A Comprehensive Radiation Scheme for Numerical Weather Prediction Models with Potential Applications in Climate Simulations, Mon. Weather Rev., 120, 303–325, https://doi.org/10.1175/1520-0493(1992)120<0303:ACRSFN>2.0.CO;2, 1992.
Rockel, B., Will, A., and Hense, A.: The Regional Climate Model COSMO-CLM(CCLM), Meteorol. Z., 17, 347–348, https://doi.org/10.1127/0941-2948/2008/0309, 2008.
Rotstayn, L. D.: A physically based scheme for the treatment of stratiform clouds and precipitation in large-scale models. I: Description and evaluation of the microphysical processes, Q. J. Roy. Meteor. Soc., 123, 1227–1282, https://doi.org/10.1002/qj.49712354106, 1997.
Schleussner, C.-F., Lissner, T. K., Fischer, E. M., Wohland, J., Perrette, M., Golly, A., Rogelj, J., Childers, K., Schewe, J., Frieler, K., Mengel, M., Hare, W., and Schaeffer, M.: Differential climate impacts for policy-relevant limits to global warming: the case of 1.5 °C and 2 °C, Earth Syst. Dynam., 7, 327–351, https://doi.org/10.5194/esd-7-327-2016, 2016.
Seifert, A. and Beheng, K. D.: A double-moment parameterization for simulating auto conversion, accretion and self collection, Atmos. Res., 59, 265–281, https://doi.org/10.1016/S0169-8095(01)00126-0, 2001.
Skamarock, W. C., Klemp, J. B., Dudhia, J., Gill, D. O., Barker, D. M., Wang, W., and Powers, J. G.: A description of the Advanced Research WRF Version 3, NCAR Tech Note NCAR/TN-475+STR, NCAR, Boulder, CO, https://doi.org/10.5065/D68S4MVH, 2008.
Stouffer, R. J., Eyring, V., Meehl, G. A., Bony, S., Senior, C., Stevens, B., and Taylor, K. E.: CMIP5 Scientific Gaps and Recommendations for CMIP6, B. Am. Meteorol. Soc., 98, 95–105, https://doi.org/10.1175/bams-d-15-00013.1, 2017.
Tebaldi, C., Arblaster, J. M., and Knutti, R.: Mapping model agreement on future climate projections, Geophys. Res. Lett., 38, L23701, https://doi.org/10.1029/2011GL049863, 2011.
Tewari, M., Wang, W., Dudhia, J., LeMone, M. A., Mitchell, K., Ek, M., Gayno, G., Wegiel, J., and Cuenca, R.: Implementation and verification of the unified Noah land surface model in the WRF model, 2165–2170, https://ams.confex.com/ams/pdfpapers/69061.pdf (last access: 23 January 2025), 2004.
Thompson, G., Field, P. R., Rasmussen, R. M., and Hall, W. D.: Explicit Forecasts of Winter Precipitation Using an Improved Bulk Microphysics Scheme. Part II: Implementation of a New Snow Parameterization, Mon. Weather Rev., 136, 5095–5115, https://doi.org/10.1175/2008MWR2387.1, 2008.
Tiedtke, M.: A Comprehensive Mass Flux Scheme for Cumulus Parameterization in Large-Scale Models, Mon. Weather Rev., 117, 1779–1800, https://doi.org/10.1175/1520-0493(1989)117<1779:acmfsf>2.0.co;2, 1989.
Torma, C., Giorgi, F., and Coppola, E.: Added value of regional climate modeling over areas characterized by complex terrain – Precipitation over the Alps, J. Geophys. Res.-Atmos., 120, 3957–3972, https://doi.org/10.1002/2014JD022781, 2015.
Trancoso, R., Syktus, J., Toombs, N., Ahrens, D., Wong, K. K.-H., and Pozza, R. D.: Heatwaves intensification in Australia: A consistent trajectory across past, present and future, Sci. Total Environ., 742, 140521, https://doi.org/10.1016/j.scitotenv.2020.140521, 2020.
Van de Walle, J., Thiery, W., Brousse, O., Souverijns, N., Demuzere, M., and van Lipzig, N. P. M.: A convection-permitting model for the Lake Victoria Basin: evaluation and insight into the mesoscale versus synoptic atmospheric dynamics, Clim. Dynam., 54, 1779–1799, https://doi.org/10.1007/s00382-019-05088-2, 2020.
van Oldenborgh, G. J., Krikken, F., Lewis, S., Leach, N. J., Lehner, F., Saunders, K. R., van Weele, M., Haustein, K., Li, S., Wallom, D., Sparrow, S., Arrighi, J., Singh, R. K., van Aalst, M. K., Philip, S. Y., Vautard, R., and Otto, F. E. L.: Attribution of the Australian bushfire risk to anthropogenic climate change, Nat. Hazards Earth Syst. Sci., 21, 941–960, https://doi.org/10.5194/nhess-21-941-2021, 2021.
Varga, A. J. and Breuer, H.: Sensitivity of simulated temperature, precipitation, and global radiation to different WRF configurations over the Carpathian Basin for regional climate applications, Clim. Dynam., 55, 2849–2866, https://doi.org/10.1007/s00382-020-05416-x, 2020.
Vargas Zeppetello, L. R., Raftery, A. E., and Battisti, D. S.: Probabilistic projections of increased heat stress driven by climate change, Communications Earth & Environment, 3, 183, https://doi.org/10.1038/s43247-022-00524-4, 2022.
Zhou, X., Yang, K., Ouyang, L., Wang, Y., Jiang, Y. Z., Li, X., Chen, D. L., and Prein, A.: Added value of kilometer-scale modeling over the third pole region: a CORDEX-CPTP pilot study, Clim. Dynam., 57, 1673–1687, https://doi.org/10.1007/s00382-021-05653-8, 2021.