the Creative Commons Attribution 4.0 License.
the Creative Commons Attribution 4.0 License.
Amending the algorithm of aerosol–radiation interactions in WRF-Chem (v4.4)
Jiawang Feng
Chun Zhao
Qiuyan Du
Zining Yang
Chen Jin
WRF-Chem (Weather Research and Forecasting model coupled with Chemistry) is widely used to assess regional aerosol radiative feedback. However, in the current version, aerosol optical properties are only calculated in four shortwave bands, while only two of them are used to interpolate optical properties towards the 14 shortwave bands used in the Rapid Radiative Transfer Model for Global Climate Models (RRTMG) scheme. In this study, we use a “Resolved” algorithm to estimate aerosol radiative feedback in WRF-Chem, in which aerosol optical properties are calculated in all 14 shortwave bands. The impacts of changing this calculation algorithm are then evaluated. The simulation results of aerosol optical properties are quite different using the new Resolved algorithm, especially for dust aerosols. The alteration of aerosol optical properties results in considerably different aerosol radiative effects: the dust radiative forcing in the atmosphere simulated by the Resolved algorithm is about 2 times larger than the original “Interpolated” algorithm. The dust radiative forcing at the top of the atmosphere (TOA) simulated by the Interpolated algorithm is negative in the Sahara region, while the Resolved algorithm simulates positive forcing at TOA and can exceed 10 W m−2 in the Sahara, which is more consistent with previous studies. The modification also leads to changes in meteorological fields due to alterations in radiative feedback effects of aerosols. The near-surface temperature is changed due to the difference in the radiation budget at the bottom of the atmosphere (BOT) and the heating effects of aerosols at the surface. Furthermore, the amendment of the algorithm partially corrects the wind field and temperature simulation bias compared to the reanalysis data. The difference in planet boundary layer height can reach up to ∼100 m in China and ∼200 m in the Sahara, which also results in a greater surface haze. The results show that correcting the estimation algorithm of aerosol radiative effects is necessary in WRF-Chem.
- Article
(11233 KB) - Full-text XML
-
Supplement
(1317 KB) - BibTeX
- EndNote
Aerosol–radiation interactions and their impacts on meteorological processes and the aerosol cycle have been proven to be important (e.g., Ackerman, 1977; Dickerson et al., 1997; Jacobson, 1998; Zhao et al., 2010, 2011, 2012, 2013, 2014; Myhre et al., 2013; Bender, 2020; Bellouin et al., 2020; Huang and Ding, 2021). As the two-way interactions between aerosol and meteorological fields are complex, a fully coupled “online” meteorology–chemistry model is a necessary tool to account for these feedbacks in simulating aerosol concentrations and meteorological fields. WRF-Chem (the Weather Research and Forecasting model coupled with Chemistry) is one of the most widely used atmospheric models that considers aerosol–radiation interactions for investigating regional aerosol life cycles and radiative impacts (e.g., Zhao et al., 2010, 2011, 2013, 2014; Jiang et al., 2012; Ding et al., 2013; Wu et al., 2013; Gao et al., 2014; Chen et al., 2014; Zhong et al., 2016; Liu et al., 2016; Huang et al., 2016; Petäjä et al., 2016; Du et al., 2020, 2023; Zhang et al., 2020; Wang et al., 2022; Chen et al., 2022; Sharma et al., 2023; Wei et al., 2023). WRF-Chem is capable of performing regional-scale simulations at high spatial resolution. This allows for a detailed representation of aerosol and radiation processes at regional scales. By incorporating the interactions between aerosols and radiation, WRF-Chem can provide insights into the impacts of aerosols on regional weather patterns, climate, air quality, and the energy balance. Therefore, it is crucial for the modeling community to appropriately simulate aerosol optical properties and aerosol–radiation interactions in WRF-Chem.
In WRF-Chem, aerosol optical properties (i.e., aerosol optical depth (AOD), single-scattering albedo (SSA), and the asymmetry factor) for shortwave bands are first computed at four wavelengths of 300, 400, 600, and 999 nm following the method described in previous studies (Fast et al., 2006; Barnard et al., 2010; Zhao et al., 2013; see Sect. 2.2 for more details). Afterwards, these aerosol optical properties are used in radiative transfer schemes such as the Rapid Radiative Transfer Model for Global Climate Models (RRTMG; Mlawer et al., 1997; Iacono et al., 2000; Zhao et al., 2011). RRTMG calculates radiative fluxes and heating rates in 14 shortwave bands. However, due to the aerosol optical properties only being shortwave calculated for four spectral bands (as mentioned above), the RRTMG scheme interpolates the values at these 4 wavelengths to create the 14 wavelengths used here. For AOD, the scheme obtains the values for all 14 shortwave bands using the Ångström exponent (AE, Ångström, 1929) based on AOD at 400 and 600 nm. For SSA and the asymmetry factor, simple linear interpolation is applied (Barnard et al., 2010; Zhao et al., 2011). These interpolation methods for taking aerosol optical properties from 2 bands and creating 14 bands may lead to significant errors in estimating aerosol radiative forcing and subsequently simulating aerosol radiative feedback on meteorological fields.
Therefore, in this study we amend the aforementioned approach by directly calculating aerosol optical properties for all 14 RRTMG shortwave bands and examine the difference between the new algorithm and the original algorithm when simulating multi-band aerosol optical properties, radiative forcing, and aerosol impacts on meteorological fields. The paper is organized as follows. Section 2.1 briefly introduces WRF-Chem, while Sect. 2.2 describes the algorithms used for simulating aerosol–radiation interactions in WRF-Chem. The differences seen when simulating aerosol optical properties and radiative impacts with the two algorithms are investigated in Sect. 3. The conclusion and summary are in Sect. 4.
2.1 WRF-Chem
WRF-Chem is a version of the WRF (Skamarock et al., 2021) that simulates trace gases and particulates simultaneously with the meteorological fields (Grell et al., 2005). The Model for Simulating Aerosol Interactions and Chemistry (MOSAIC) aerosol model (Zaveri et al., 2008) and photochemical Carbon Bond Mechanism version Z (CBM-Z) (Zaveri and Peters, 1999) implemented by Fast et al. (2006) into WRF-Chem, which include complex treatments of aerosol radiative properties and photolysis rates, are used in this study. Since this study only focuses on the amendment of the current algorithm of aerosol optical properties and its radiative feedback in WRF-Chem, more details about the physics and chemistry schemes in WRF-Chem are not given here and can instead be found in previous studies (Zhao et al., 2011, 2013).
2.2 Amendment of the aerosol–radiation interaction algorithm in WRF-Chem
In current (v4.4) and previous versions of WRF-Chem, aerosol optical properties such as extinction, SSA, and the asymmetry factor for scattering are computed as a function of wavelength and three-dimensional position. Currently, the methodology described by Ghan et al. (2001) is applied to compute the extinction efficiency Qe and the scattering efficiency Qs in WRF-Chem. In the model, the full Mie calculation is performed only once to obtain a table of seven sets of Chebyshev expansion coefficients, and later the full Mie calculations are skipped, while Qe and Qs are calculated using bilinear interpolation over the Chebyshev coefficients stored in the table. The detailed method of the computation of aerosol optical properties in the model is similar to the description given in Fast et al. (2006), Barnard et al. (2010), and Zhao et al. (2013). The Optical Properties of Aerosols and Clouds (OPAC) dataset (Hess et al., 1998) is used for the shortwave (SW) and longwave (LW) refractive indices of dust aerosols. Radiative feedback of aerosols is coupled with RRTMG (Mlawer et al., 1997; Iacono et al., 2000) for both longwave (LW) and shortwave (SW) radiation as in Zhao et al. (2011). AOD and direct radiative forcing of aerosols are diagnosed following the methodology of Zhao et al. (2013). In this methodology, the calculation of aerosol optical properties and the radiative transfer scheme is performed multiple times with the mass of one or more aerosol species (i.e., the mass of an individual or a group of aerosol species), and its associated water aerosol mass is also removed from the calculation each time. After this diagnostic procedure, the optical properties (e.g., AOD) and direct radiative forcing for aerosols can be estimated by subtracting the optical properties and direct radiative forcing from the diagnostic iterations from those estimated following the standard procedure for all the aerosol species. It can be described as follows:
Currently, the aerosol optical properties for shortwave spectral bands (roughly 200–4000 nm) are only calculated for four shortwave bands centered at 300, 400, 600, and 999 nm following the method above. When coupled with the RRTMG shortwave radiative transfer scheme (RRTMG-SW) in WRF-Chem, the aerosol optical properties (i.e., AOD, SSA, and the asymmetry factor) need to be interpolated from the values at the 4 wave bands to those values at the 14 wave bands (from 232 to 3462 nm) used in the RRTMG shortwave scheme. The interpolation of AOD is based on the AE that is derived from the values at 400 and 600 nm:
where α is the Ångström exponent (AE), while τ400 and τ600 are the AOD over 400 and 600 nm bands, respectively.
Given the AE, AOD over the wave band centered at λi is calculated as follows:
The SSA and asymmetry factor values for other wave bands are linearly interpolated from the values at the four wave bands. This current algorithm of calculating optical properties and coupling with the shortwave radiation transfer scheme is referred to as the “Interpolated” algorithm for the rest of this paper.
In this study, we implement the “Resolved” algorithm, wherein the aerosol optical properties over the 14 shortwave bands are calculated and coupled with RRTMG-SW directly. While our study focused on the sectional representation of aerosols, our amendment of the algorithm is theoretically valid for bulk, sectional, and modal representations in WRF-Chem. However, we have not tested the differences between the Interpolated and Resolved methods for bulk and modal aerosol representations in this study. The difference between Interpolated algorithm and Resolved algorithm is defined as the bias due to the interpolation of aerosol optical properties for the radiation transfer scheme. The biases of the Interpolated algorithm and its impacts are investigated.
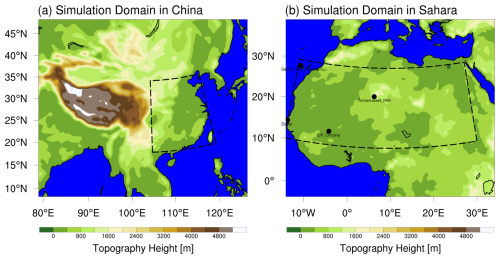
Figure 1Simulation domains in (a) China and (b) the Sahara. The dashed boxes in panels (a) and (b) represent regions dominated by anthropogenic aerosols and dust aerosols, respectively. Spatial distributions of topography height are also shown. Locations of selected AERONET stations over dust-dominant areas in the Sahara are also denoted in panel (b).
2.3 Numerical experiments
In this study, four sets of experiments are conducted over two domains, as shown in Fig. 1. One covers China (8–55° N, 59–146° E) and represents a region with complex aerosol sources including large anthropogenic aerosol mass loading and natural dust (in the northwestern part of the domain). The other covers the Sahara (3.5° S–42° N, 24° W–44° E) and represents the region with the largest natural dust aerosol mass loading in the world. In addition, Fig. 1a and b also delineate regions dominated by anthropogenic aerosols and dust aerosols, respectively, using dashed boxes (referred to as anthro-dominant and dust-dominant regions, respectively). Over both domains, two sets of experiments, one with the Interpolated algorithm and the other with the Resolved algorithm, are conducted. The simulations are performed at 50 km × 50 km horizontal resolution with 120×100 grid cells and 40 vertical layers up to 100 hPa. The model time step is set at 150 s, and the aerosol optical properties are updated every 30 min in the model. The experiments are conducted for January and July 2015, representing boreal winter and summer, which ran from 25 December 2014 to 31 January 2015 and from 25 June 2015 to 31 July 2015, respectively. Only the results during January and July are used in the analysis to minimize the impact from the initial chemical conditions. In this study, all analysis results represent monthly averages for January and July 2015 unless otherwise stated. The meteorological initial conditions are derived from the European Centre for Medium-Range Weather Forecasts (ERA5) reanalysis dataset at approximately 25 km horizontal resolution and a 6 h temporal interval (Dee et al., 2011). The chemical lateral boundary conditions are from a quasi-global simulation with 360×145 grid cells (67.5° S–77.5° N, 180° W–180° E) at a 1° × 1° horizontal resolution (Zhao et al., 2013; Hu et al., 2016). Aside from the aforementioned sets of experiments, four sets of sensitive experiments with aerosol radiative feedback disabled are also conducted to examine the aerosol radiative feedback effects on meteorological fields. We also conducted a detailed analysis of the computational costs associated with both the Resolved method and the Interpolated method. For the Resolved method, the calculation of aerosol optical properties takes 11 458.6 s, which accounts for 9.3 % of the total simulation runtime of 122 717 s. In contrast, the Interpolated method requires 5223.05 s for the same calculations, which accounts for 4.9 % of its total runtime of 107 615 s. Therefore, the Resolved method has an approximately 2.19 times higher computational cost for aerosol optical property calculations compared to the Interpolated method. This difference in calculation time translates to an additional 14 % in total simulation runtime when using the Resolved method. It is worth noting that this increase in computational cost is less than the 3.5 times one might expect from increasing the number of shortwave bands from 4 to 14. This is because the aerosol optical property calculation process includes both shortwave and longwave calculations. The original WRF-Chem has already used the Resolved method to calculate the longwave component; therefore, we only modified the shortwave calculations from 4 bands to 14 bands.
Table 1The lower and upper bound and volume fraction for the eight aerosol size bins used in the model.
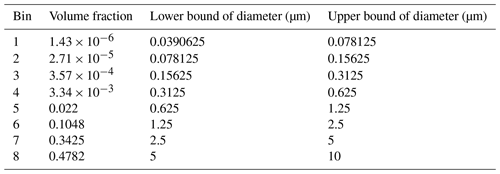
Anthropogenic emission for the domain covering China is from the Multi-resolution Emission Inventory for China (MEIC) at 0.1° × 0.1° horizontal resolution for 2015 (Li et al., 2017a, b), while the one for the domain covering Sahara is obtained from the Hemispheric Transport of Air Pollution version 2 (HTAPv2) at 0.1° × 0.1° horizontal resolution for 2010 (Janssens-Maenhout et al., 2015). The dust emission flux is calculated with the GOCART dust emission scheme (Ginoux et al., 2001), and the size distribution of emitted dust particles follows a theoretical expression based on the physics of scale-invariant fragmentation of brittle materials derived by Kok (2011). The details of the aerosol size distributions from approximately 0.04 to 10 µm are given in Table 1. More details about the dust emission scheme in WRF-Chem can be found in Zhao et al. (2010, 2013). Biomass burning emissions are obtained from the Fire Inventory from NCAR (FINN) with hourly temporal resolution and 1 km horizontal resolution (Wiedinmyer et al., 2011). Sea salt emissions follow Zhao et al. (2013) and include correction of particles with a radius less than 0.2 µm (Gong, 2003) and dependence on sea surface temperature (Jaeglé et al., 2011). The detailed parameterization schemes for physical and chemical processes in WRF-Chem that are used in the study are summarized in Table 2.
2.4 Dataset
To evaluate the modeling results, multi-spectral AOD measurements are required, which are critical for this study comparing the Interpolated and Resolved methods across wavelengths. Therefore, we retrieved total AOD from the AERONET network (Holben et al., 1998). Although satellite AOD products such as the Moderate Resolution Imaging Spectroradiometer (MODIS) have greater spatial coverage, the number of wavelengths is limited. Comparison at only one or very few wavelengths would not effectively demonstrate the distinctions between the two algorithms examined in this work. In this study, the monthly mean AOD from the AERONET Version 3 direct-sun algorithm Level 2.0 dataset is used. A subset of stations dominated by dust is used here. The selected stations need to meet the following conditions: (1) to reduce the impact of oceanic aerosols, only the sites that are located on land are used; (2) to allow for comparisons with the simulation results, the sites must contain data for January and July in 2015; and (3) the monthly average AE (500–870 nm) at each site should be less than 0.8 because the lower the AE is, the larger the dust fraction will be (Dubovik et al., 2002).
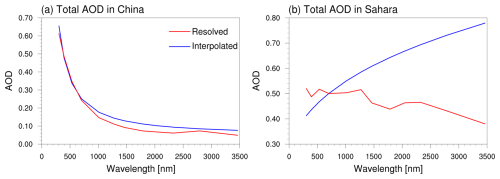
Figure 2Simulated AOD as a function of wavelength averaged for January and July 2015. (a) AOD averaged over the anthro-dominant region in eastern China (as shown in Fig. 1). (b) AOD averaged over the dust-dominant region in the Sahara (as shown in Fig. 1). The blue line and red line represent the Interpolated method and the Resolved method, respectively.
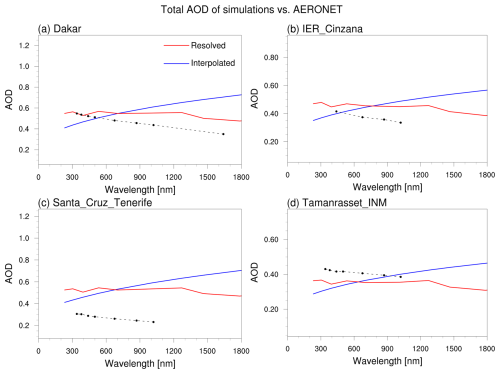
Figure 3Comparison of total AOD from simulations and AERONET observations in dust-dominant areas. The results are averaged for both January and July 2015. The blue line and red line represent the Interpolated method and the Resolved method, respectively. The AERONET AOD values are indicated by black dots in each panel. The simulation results are obtained from the grid box closest to the AERONET stations.
3.1 Impacts on aerosol optical properties
AOD is one of the key optical properties of aerosol. In Fig. 2 we show the simulated AOD values over the anthro-dominant region in China and over the dust-dominant region in the Sahara that are measured at different wavelengths using the two algorithms. The results presented are spatial averages over the regions delineated by the dashed boxes in Fig. 1, as well as temporal averages for the months of January and July 2015. The blue line represents the simulated AOD for 14 shortwave bands used by the RRTMG radiation scheme with the Interpolated algorithm based on the calculated values for 400 and 600 nm wavelengths. The red line represents the simulated AOD for 14 shortwave bands directly calculated with the Resolved algorithm. As seen in Fig. 2a, both the Resolved and Interpolated algorithms produce similar exponential decaying trends in AOD for regions dominated by anthropogenic aerosols. The AOD values calculated with the Resolved algorithm are slightly higher than those obtained with the Interpolated algorithm. These trends indicate that Ångström's theory is applicable to a certain extent in these areas. However, results in Fig. 2b illustrate a significant impact of algorithm modification on the simulation of AOD in regions dominated by dust aerosols. Both the Resolved and Interpolated algorithms calculated an upward trend at 400 and 600 nm wavelengths. However, since the Interpolated algorithm only includes information from these two wavelengths, it results in an exponential increase across all bands. Conversely, the Resolved algorithm reveals a fluctuating downward trend for dust aerosols across all wavelengths. This discrepancy leads to a substantial difference at longer wavelengths, with the maximum divergence exceeding 50 %. To assess whether the Resolved algorithm is more accurate, we compared our simulated AOD results with the AERONET observations in dust-dominant regions of the Sahara, as shown in Fig. 3. The selected AERONET stations follow the algorithm described in Sect. 2.4. The geographical locations of these stations are marked in Fig. 1b. AERONET observations demonstrate a gradual decline in dust AOD with increasing wavelength, with minimal variation between 400 and 600 nm. Although both the Resolved and Interpolated algorithms incorrectly predict an increasing trend in AOD between 400 and 600 nm, the Resolved method's more detailed spectral optical calculations offer the opportunity to correct this discrepancy at other wavelengths. Conversely, the Interpolated algorithm's erroneous trend at these wavelengths, when applied in the AE theory, propagates and amplifies discrepancies at longer wavelengths. These findings underscore the need for cautious application of the AE theory, particularly when dealing with aerosols such as dust, whose optical properties exhibit minimal variation at the selected wavelengths (400 and 600 nm in WRF-Chem). In such cases, small uncertainties can lead to a reversal in the AOD–wavelength relationship, potentially resulting in significant simulated errors in spectral extrapolation. Additionally, the simulated total AOD was also compared with the AERONET results in the anthro-dominant region in China (see Fig. S1 in the Supplement). The results demonstrate that both the Interpolated and Resolved algorithm simulations exhibit significant decreasing trends in total AOD compared to those seen in the AERONET data. Therefore, the discrepancies introduced by the application of the AE theory have a much smaller effect on simulated results, which further indicates that the amendments to the algorithm have less impact on simulated AOD resulting from anthropogenic aerosols compared to dust aerosols.
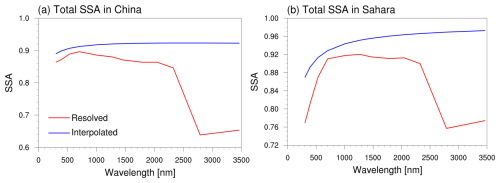
Figure 4Simulated SSA as a function of wavelength averaged for January and July 2015. (a) SSA averaged over the anthro-dominant region in eastern China (as shown in Fig. 1). (b) SSA averaged over the dust-dominant region in the Sahara (as shown in Fig. 1). The blue line and red line represent the Interpolated method and the Resolved method, respectively.
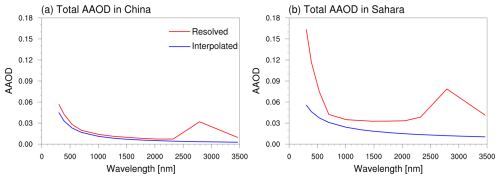
Figure 5Simulated AAOD as a function of wavelength averaged for January and July 2015. (a) AAOD averaged over the anthro-dominant region in eastern China (as shown in Fig. 1). (b) AAOD averaged over the dust-dominant region in the Sahara (as shown in Fig. 1). The blue line and red line represent the Interpolated method and the Resolved method, respectively.
Another crucial aerosol optical property is SSA, which is illustrated in Fig. 4. The amendment of the algorithm results in smaller anthropogenic and dust SSA over a considerable range of wavelengths, which could result in an overall larger absorption effect. At wavelengths smaller than the 600 nm waveband, the SSA simulated by the Resolved algorithm generally follows a linear function, as suggested by Interpolated algorithm in both regions. However, the value of SSA no longer increases with increasing wavelength when it reaches around 600 nm. Moreover, beyond 2000 nm in wavelength, the Resolved algorithm starts to decrease, whereas the Interpolated algorithm does not simulate this pattern. Figure 5 shows the aerosol absorption optical depth (AAOD) as a function of wavelength. The AAOD is calculated by subtracting the scattering radiation from the extinction radiation (AOD) by aerosols, which can be described as . AAOD can represent the absorption effects caused by aerosols in the atmosphere. Although the Resolved algorithm simulates smaller anthropogenic AOD in China and dust AOD in the Sahara, the Resolved algorithm simulates larger AAOD at all 14 bands due to its simulated smaller SSA. In WRF-Chem, the water content of aerosols is also considered while calculating optical properties. Water exhibits a peak in absorption at approximately 2900 nm, which significantly influences the overall aerosol optical properties at this wavelength. As illustrated in Fig. S2, there is a pronounced peak in the imaginary part of the refractive index of water at around 2900 nm in the Resolved method. The imaginary part of the refractive index is directly related to absorption, with higher values indicating stronger absorption. This peak in water absorption leads to the observed increase in AAOD (decrease in SSA) at this wavelength. In contrast, the Interpolated method, which relies solely on optical property information at 400 and 600 nm, fails to capture this crucial spectral feature. Consequently, the Interpolated method is unable to accurately represent the complex wavelength-dependent optical properties of aerosols. In addition, the lower SSA values and higher AAOD values obtained from the Resolved method compared to the Interpolated method in the Sahara region are primarily due to the spectral variation in dust optical properties, particularly at shorter wavelengths. In the OPAC dataset, dust has a larger imaginary part of the refractive index at wavelengths shorter than ∼600 nm, indicating stronger absorption in this spectral range (also as shown in Fig. S2). However, in the latest version of WRF-Chem (Interpolated method), the imaginary part of the refractive index for dust is set to a constant value of 0.003 at all four shortwave bands. The Resolved method simulates higher AAOD using the wavelength-dependent refractive indices, especially at shorter wavelengths. This results in significant differences in SSA and AAOD between the two methods, particularly in dust-dominated regions like the Sahara.
The differences in AAOD indicate that the algorithm modifications lead to a larger absorption effect from aerosols, which will be illustrated in more detail in the discussions below (see Sect. 3.2 and 3.3).
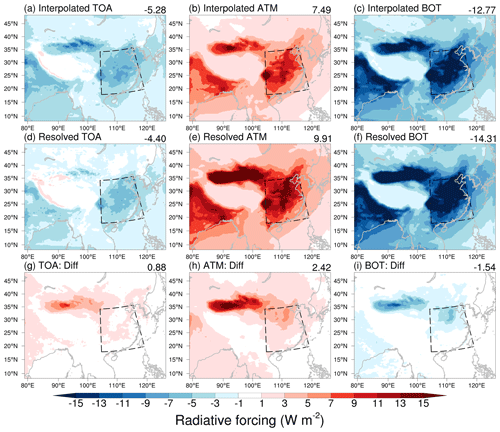
Figure 6Radiative forcing of all aerosols in China at TOA, BOT, and in the ATM averaged for January and July 2015. Panels (a)–(c) and (d)–(f) show the results using Interpolated method and Resolved method, respectively. Panels (g)–(i) show the differences between the Interpolated method and the Resolved method. The average results of anthro-dominant areas (dashed boxes) are shown in the top-right corner.
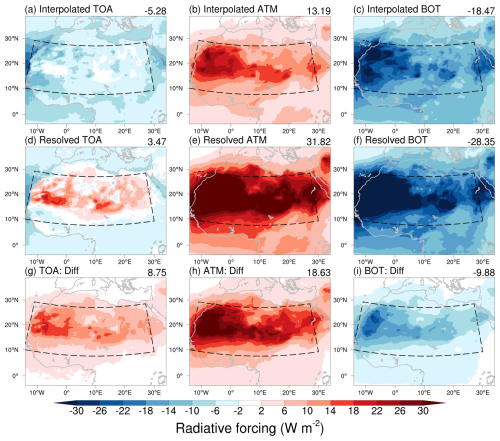
Figure 7Radiative forcing of aerosols in the Sahara at TOA, BOT, and in the ATM averaged for January and July 2015. Panels (a)–(c) and (d)–(f) show the results using Interpolated method and Resolved method, respectively. Panels (g)–(i) show the differences between the Interpolated method and the Resolved method. The average results of dust-dominant areas (dashed boxes) are shown in the top-right corner.
3.2 Impacts on radiative forcing of aerosols
As discussed above, there are significant differences in the aerosol optical properties computed based on these two algorithms, which may also lead to biases in simulating aerosol radiative forcings. Radiative forcing is defined as the perturbation of radiative fluxes at the top of the atmosphere (TOA) and the bottom of the atmosphere (BOT), as well as the perturbation of radiative heating and cooling in the atmosphere (ATM) if a specific aerosol species is removed. It should be noted that the aerosol radiative forcing calculated in this section refers to the change in radiative fluxes resulting from the removal of aerosols in a single experiment (see Sect. 2.2), excluding the perturbations to other meteorological variables caused by the removal of aerosol radiative effects as introduced by Zhao et al. (2013). In this study, the net downward radiative flux at TOA and BOT is considered positive, while upward flux is considered negative. In contrast, the heating effect of radiative flux within the ATM is considered positive, while the cooling effect is considered negative. Figure 6 illustrates the spatial distribution of aerosol radiative forcing computed using the Interpolated and Resolved algorithms and the differences between the two algorithms for TOA, BOT, and the ATM in China. Figure 7 shows the aerosol radiative forcing in the Sahara. In both China and the Sahara, the Resolved algorithm simulates more aerosol “warming” effects in the ATM, more negative radiative forcing at BOT, and smaller negative forcing at TOA compared to the Interpolated algorithm. These discrepancies can be explained by the stronger aerosol absorption effects computed from the Resolved algorithm, as discussed in Sect. 3.1.
As shown in Fig. 6, in regions predominantly influenced by anthropogenic aerosols, the algorithm amendment primarily affects the aerosol radiative forcing in the ATM. As discussed in Sect. 3.1, the Resolved algorithm is capable of simulating stronger aerosol absorption effects compared to the Interpolated algorithm, resulting in a stronger warming effect in the ATM (approximately 30 % enhancement). Additionally, the algorithm amendment introduces more pronounced “cooling” effects at BOT due to the aerosol radiative perturbations. The combined effects in the ATM and at BOT contribute to a relatively small impact of algorithm amendment on aerosol radiative forcing at TOA. In contrast, in the northwestern part of China, which includes the Gobi Desert and the Taklimakan Desert (two major dust source regions), aerosols are predominantly composed of dust. In these regions, the impacts of algorithm amendment on radiative forcing are more prominent compared to the impacts in anthro-dominant regions. In the Sahara region, the Resolved algorithm predicts a much greater dust warming effect in ATM compared to the Interpolated algorithm (approximately 140 % higher). Furthermore, the Interpolated algorithm only simulates negative dust radiative forcing at TOA in dust-dominant areas. In contrast, the Resolved algorithm can simulate positive forcing at TOA and can exceed 10 W m−2 in the Sahara due to the radiative absorption of dust when located over highly reflective surfaces. The positive aerosol radiative forcing at TOA in the Sahara region simulated by the Resolved algorithm is notably more consistent with previous studies (e.g., Albani et al., 2014; Feng et al., 2022, 2023) compared to the Interpolated algorithm. Furthermore, our previous study (Feng et al., 2023) initially employed the original optical calculation algorithm in WRF-Chem (referred to as the Interpolated algorithm), which yielded a dust direct radiative forcing at TOA of −0.75 W m−2. This value significantly deviated from the observationally constrained estimate of −0.20 W m−2 proposed by Kok et al. (2017). Subsequently, in final version of Feng et al. (2023) implemented the Resolved method, which resulted in a substantially improved estimate of −0.27 W m−2. This marked improvement in alignment with observational constraints strongly suggests that the Resolved method demonstrates better performance in simulating radiative forcing, particularly for dust aerosols. Apart from TOA and ATM, the algorithm amendment also results in a stronger negative radiative forcing (approximately 50 % higher) of dust aerosols at BOT, which may lead to cooling effects at the Earth's surface. In summary, the modified algorithm has an effect on anthropogenic aerosol radiative forcing, although this effect is relatively small. However, its impact on dust aerosols is significantly pronounced, to the extent of yielding divergent outcomes at TOA. Hence, to enhance the accuracy of aerosol radiative feedback simulation in the model, the amendment of this algorithm is imperative.
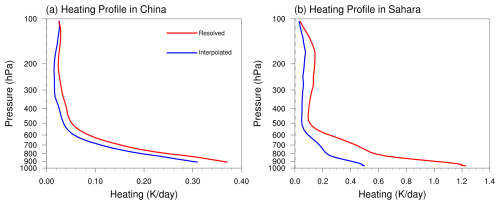
Figure 8Shortwave heating profile of aerosols averaged for January and July 2015 (a) over the anthro-dominant area in China and (b) over dust-dominant area in the Sahara.
Figure 8 displays the vertical profiles of the shortwave aerosol heating rates calculated by the two algorithms over anthro-dominant areas in China and dust-dominant areas in the Sahara, respectively. In both regions, the shortwave heating effect induced by aerosols is strongest at the surface and decreases rapidly as the altitude approaches approximately 500 hPa. Beyond this altitude, the aerosol-induced heating effect stabilizes at a relatively constant value, maintaining a positive heating effect throughout the atmospheric column. In the areas predominantly affected by anthropogenic aerosols, the Resolved algorithm simulates a more pronounced aerosol heating effect, displaying a vertical trend similar to that produced by the Interpolated algorithm. In the dust-dominant area, however, the impact of algorithmic amendment on the simulation of aerosol heating effects is significantly greater than that for anthropogenic aerosols, with the heating rate near the surface exceeding twice the result simulated by the Interpolated algorithm. This discrepancy diminishes near the altitude of 500 hPa but remains approximately 80 % stronger than that predicted by the Interpolated algorithm. This also explains the impact of algorithm amendment on the simulation of radiative forcing in ATM, as discussed previously. The results of the heating profile also illustrate that the effects of algorithm amendment vary significantly among different types of aerosols.
It should be noted that the refractive indices of dust can vary significantly depending on mineral composition and source region. Our study uses a set of refractive indices that represent a global average, which may not capture the full range of variability observed in different regions. Changing these values could affect the magnitude of the radiative forcing differences between the Interpolated and Resolved simulations. We have conducted additional sets of experiments with smaller radiative indices for dust aerosols in Resolved simulations. The results show that with less absorbing dust (smaller imaginary part of refractive indices), the differences in the radiative effects could become smaller (not shown here). Theoretically, one could identify a set of aerosol optical properties that would yield similar aerosol radiative forcing results for the Resolved and Interpolated algorithms. However, such a set might not accurately reflect the true physical properties of the aerosols. Despite these considerations, it is important to note that the spectral variation in optical properties would be better captured by the Resolved method compared to the Interpolated method, as discussed in Sect. 3.2. This provides a more robust foundation for accurately representing the complex interactions between aerosols and radiation across various wavelengths. The advantages of the Resolved method in capturing these spectral variations persist regardless of the specific refractive indices employed in the simulations.
3.3 Impacts on radiative effects of aerosols
The impacts of the algorithm amendment on radiative forcing of aerosols can further influence the radiative feedback of aerosols on meteorological fields, such as temperature, wind field, and planetary boundary layer (PBL) height, as discussed below. An additional set of experiments are conducted with the radiative feedback of aerosols disabled. The differences in the simulation results between the two sets of experiments (one with aerosol radiative feedbacks enabled and the other with them disabled) are used assess the radiative impacts of aerosols on meteorological fields.
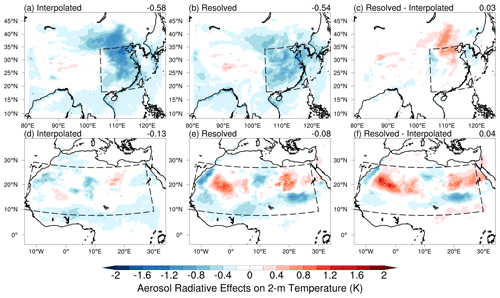
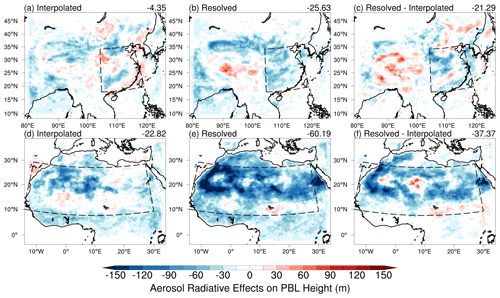
Figure 9(a, d) Spatial distribution of aerosol radiative effects on 2 m temperature from the Interpolated experiments in China and the Sahara, respectively. (b, e) Spatial distribution of aerosol radiative effects on 2 m temperature from the Resolved experiments in China and the Sahara, respectively. (c, f) The impacts of algorithm amendment on the simulated aerosol radiative effects (difference in aerosol radiative effects between Resolved and Interpolated experiments) on 2 m temperature in China and the Sahara, respectively. The average results of anthro-dominant (dashed boxes in a, b, and c) and dust-dominant areas (dashed boxes in d, e, and f) are shown in the top-right corner. The results are averaged for January and July 2015.
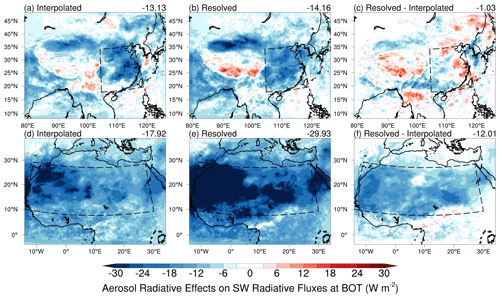
Figure 10The same as Fig. 9 but for the net shortwave radiative fluxes at the bottom of the atmosphere (positive denotes downward).
Figure 9 shows the aerosol radiative effects on 2 m temperature from the Interpolated and the Resolved experiments, as well as the differences between the two algorithms. From Fig. 9a and b, it can be observed that in regions dominated by anthropogenic aerosols in China, aerosol radiative effects lead to surface cooling in both algorithms. In the Tibetan Plateau region, it results in surface warming. According to the results in Fig. 6c and f, aerosols exhibit a cooling effect on the surface due to their direct radiative effect in all regions. This difference indicates that the radiative effects of aerosols on near-surface temperature are influenced not only by radiative forcing (direct radiative effect) but also by other factors such as aerosol–cloud interactions, aerosol heating effects, and radiative effects on the surface radiative fluxes, as discussed below. Figure 10 illustrates the impacts of aerosols on the shortwave radiative fluxes at BOT. Compared with Fig. 6, these effects include not only the direct radiative effect (DRE) of aerosols but also their indirect consequences. The alterations in radiative forcing induced by aerosols can lead to effects on the atmospheric energy balance, which in turn influence other meteorological processes such as cloud formation and thus further affect radiation. Figure 10a and b exhibit similar spatial distribution characteristics compared to Fig. 9a and b, indicating that the radiative effects of aerosols on 2 m temperature are primarily influenced by their effects on surface radiative fluxes. In addition, 2 m temperature is also affected by the aerosol heating near the surface. As shown in Fig. 8a, the new Resolved algorithm simulates a stronger heating near the surface compared to the Interpolated algorithm. This proves that the average effect of aerosol on 2 m temperature is slightly larger with the Resolved algorithm than with the Interpolated algorithm, despite the average surface radiative cooling being stronger in the Resolved algorithm.
In the Sahara region, the effects of aerosol on radiative fluxes at the surface are similar to the aerosol radiative forcing (Fig. 7c, f), showing a cooling effect at the surface throughout the domain (Fig. 9d, e). It is noteworthy that although the effects of aerosol on radiative fluxes at the surface are negative in the Sahara region, the effects on 2 m temperature with both algorithms could exhibit a warming effect. This is due to the aerosol heating effect in the atmosphere near the surface, which also leads to stronger warming effect of aerosols at the surface from the Resolved algorithm in some areas. In both regions, the aerosol effects simulated with the new Resolved algorithm reduce the simulation biases in 2 m temperature with the Interpolated algorithm to some extent compared to the ERA5 data, particularly over the Sahara region (Fig. S3).
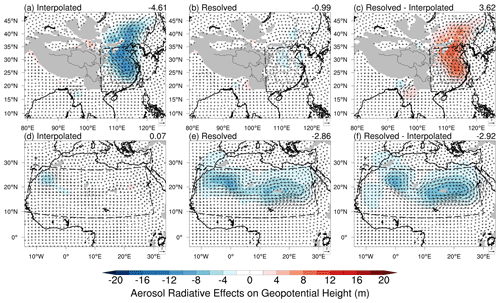
Figure 11The same as Fig. 9 but for wind fields (vectors) and geopotential height (shaded contour) at 850 hPa.
The effects of aerosol on wind and geopotential height at 850 hPa simulated by both algorithms are illustrated in Fig. 11. The results indicate that the aerosol radiative effects simulated with the Interpolated algorithm lead to a significant decrease in geopotential height in eastern China, whereas the effects are relatively small with the Resolved algorithm. Interestingly, region the effects of aerosol on geopotential heights and wind fields at 850 hPa simulated by the Interpolated algorithm are small over the Sahara, while the effects simulated by the Resolved algorithm are much larger. This may be due to the significantly larger reduction and warming effects from the Resolved algorithm over the Sahara region. Distinct mechanisms of the effects of aerosol on wind fields and geopotential heights from different types of aerosols over different climate regimes deserve further investigation in the future. In both regions, the algorithm amendment results in significant differences in the effects of aerosol on wind fields, which partially reduces the biases in simulated cyclonic wind circulation compared to the ERA5 reanalysis along the southeastern coastal region of China (Fig. S4).
Previous studies have also highlighted the important role of the effects of aerosol on the development of the PBL and hence on the air quality near the surface (e.g., Liu et al., 2016; Wilcox et al., 2016; Yang et al., 2017). Aerosols could reduce the near-surface temperature, heat the upper atmosphere (as discussed above), and therefore suppress PBL development (Huang et al., 2018). Figure 12 illustrates the aerosol radiative effects on PBL heights and their differences between the simulations with the Resolved and Interpolated algorithms. In the regions dominated by anthropogenic aerosols in China, the heating rates in the upper atmosphere or around the top of the PBL due to absorbing aerosols are relatively small (Fig. 8a). Therefore, the differences in the effects of aerosol on PBL height between the two algorithms are primarily associated with their differences in 2 m temperature (Fig. 9). However, in the Sahara region, the difference in the effects of aerosol on 2 m temperature and the heating rates at the upper atmosphere or around the top of the PBL are significant between the two algorithms (Figs. 8 and 9). Overall, the effects of aerosol suppress PBL development in most areas of Sahara, leading to a decrease in PBL height. Consequently, the algorithm amendment significantly affects the effects of aerosol on PBL development in both regions, with an average reduction of ∼20 m and up to ∼100 m in China, with an average reduction of ∼40 m and up to ∼200 m in the Sahara.
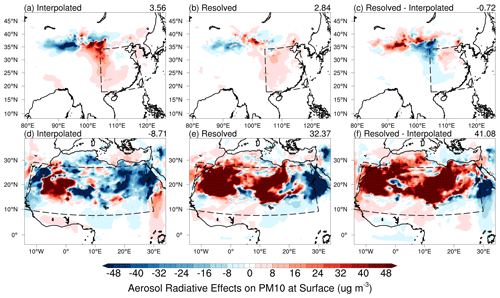
Figure 13The same as Fig. 9 but for particulate matter with diameters of 10 µm and smaller (PM10) at surface.
As previously mentioned, aerosol radiative effects on the height of the PBL could concurrently affect air pollutant concentrations within the PBL (Ding et al., 2016). Figure 13 illustrates the aerosol radiative effects on PM10 (particulate matter with diameters 10 µm and smaller) at the surface and the differences between the simulations with the two algorithms. In the China region, Fig. 13 shows similar spatial patterns to those in Fig. 12, confirming that lower PBL can raise the surface PM concentration. In the Sahara region, while aerosol radiative effects generally lead to an increase in surface PM10 concentrations, there are still areas with a reduction, particularly for the simulations with the Interpolated algorithm. The Resolved algorithm results in significant differences in the effects on surface PM10 in the Sahara. Please note that the impacts over the Sahara are more complex because aerosol radiative effects could affect both PBL heights and emissions (through near-surface wind) and hence the near-surface mass concentrations.
Aerosol–radiation interaction can have important impacts on meteorological processes and the aerosol cycle. WRF-Chem, a fully coupled online meteorology–chemistry model, has been widely used to investigate the impacts of aerosol–radiation interaction at regional scales. In this study, the original Interpolated algorithm for calculating aerosol optical properties and radiative effects in WRF-Chem is re-examined against the Resolved algorithm implemented in this study. Two domains are selected for investigating the difference between the two algorithms, with one covering China, which represents a region with complex aerosol sources including large anthropogenic aerosol mass loading and also natural dust over the northwest, and the other covering the Sahara, which represents the region with the largest natural dust aerosol mass loading in the world.
The discrepancies between the two algorithms show distinct regional characteristics. In China, where anthropogenic sources dominate the aerosol composition, the differences between the Resolved and Interpolated algorithms are relatively small, which could potentially be indicative of similar patterns in other regions dominated by anthropogenic aerosols. In contrast, the Sahara, which is dominated by dust aerosols, exhibits significant differences between the two algorithms. The Resolved algorithm results of dust AOD show a general downward trend with increasing wavelength rather than an upward trend calculated by the AE. The maximum difference between the two algorithms can reach about 50 %. Further comparison with AERONET observations reveals that the Resolved algorithm's AOD simulations are in better agreement with the measured values at dust-dominant stations. This suggests that the Resolved approach can more accurately capture the optical properties of dust aerosols. The Resolved algorithm also simulates smaller SSA than the Interpolated algorithm. As it is affected by these two factors (AOD and SSA), the Resolved algorithm simulates larger AAOD than the Interpolated algorithm, resulting in larger aerosol heating effects.
The impacts of algorithm amendment on aerosol radiative forcing are different depending on the aerosol type and region. For areas in China with high concentrations of anthropogenic aerosols, the Resolved algorithm enhances the aerosol radiative absorption in the atmosphere by about 30 % compared to the Interpolated algorithm. It also introduces a larger cooling effect at the surface. The impact on the radiative forcing at the top of the atmosphere is small. In the areas dominated by dust aerosol, the impacts of algorithm amendment are substantially larger. The Resolved algorithm predicts a ∼140 % higher warming effect in the atmosphere from dust aerosol compared to the Interpolated algorithm. Moreover, the Resolved algorithm can simulate positive radiative forcing at the top of atmosphere (exceed 10 W m−2) in dust-dominant areas, aligning better with previous studies constrained by observations, against the negative values with the Interpolated algorithm. The algorithm amendment also causes a roughly 50 % larger negative radiative forcing at the surface from dust, leading to stronger surface cooling.
In addition to the impacts on aerosol optical properties and radiative forcing, the impacts of aerosol radiative effects on meteorological fields are also investigated. Both algorithms simulate that aerosols reduce (increase) near-surface temperature in the anthro-dominant areas (Tibetan Plateau) of China. The Resolved algorithm leads to a slightly larger increase in near-surface temperature in China than the Interpolated algorithm. Over the Sahara region, both algorithms simulate a dominant cooling effect on near-surface temperature over most of the region but with a warming effect over some areas. The Resolved algorithm leads to stronger effects in both cooling or warming areas. The difference in the effects of aerosol on near-surface temperature between the two algorithms can be explained from their difference in simulating net radiative fluxes at the surface that can result from both direct (radiation) and indirect (cloud) aerosol effects. The experiment with the Resolved algorithm better simulates the 2 m temperature as compared to the ERA5 reanalysis data than the one using the Interpolated algorithm. In addition, the algorithm amendment also leads to different the effects of aerosol on the wind fields and geopotential height over both regions, with a larger impact present over the Sahara compared to over China. Both algorithms simulate the aerosol radiative effects to suppress PBL development and thus reduce PBL height. The algorithm amendment leads to a further reduction in PBL height of ∼20 m in China and ∼40 m in the Sahara on domain average. The enhancement of aerosol radiative effects in terms of reducing the PBL height in the Resolved algorithm leads to more accumulation of surface concentrations of PM10.
Please note that the impacts of aerosol–radiation interaction on meteorological fields and chemical species are not only through direct effects on radiation but also through indirect effects on cloud and then precipitation and winds. For example, some differences between the two algorithms in simulating surface PM10 concentration may not be fully explained by their difference in radiative fluxes but instead are contributed to by other factors such as their induced changes in surface wind-driven emissions and precipitation-driven wet removals (Feng et al., 2023). The mechanisms driving the differences between the impacts of the two algorithms deserves further investigation in the future. This study underscores the importance of refining the algorithm of aerosol–radiation interaction for simulating the effects of aerosol on weather and climate more accurately. It cautions against the usage of the original Interpolated algorithm in WRF-Chem for simulating aerosol optical properties and their impacts on meteorological fields, which has some biases, particularly for regions with a large contribution from dust. It is necessary to update the model to use the new Resolved algorithm proposed in this study in future.
It is important to note that the primary aim of our study is to demonstrate the importance of using a spectrally resolved method for calculating aerosol optical properties rather than to improve the overall model performance. Many factors can affect the simulation of meteorological fields and radiative processes beyond the optical properties methods we are investigating in this study. For example, while our study employs a 50 km grid resolution, which is suitable for investigating aerosol–radiation interactions, higher resolution could enhance the simulation of aerosol emission, deposition, and transport processes, potentially leading to a more accurate representation of aerosol distributions and their radiative effects (Feng et al., 2023; Tan et al., 2015; Tao et al., 2020). In addition to model resolution, the calibration factors for aerosol emission rates, the representation of aerosol size distributions, the quality and accuracy of input data, and the selection and implementation of parameterization schemes for various physical processes could all introduce uncertainties and potential impacts on the simulated results. Given this complexity, direct comparisons of the Resolved and Interpolated methods with observations may not provide a conclusive assessment of whether our modifications improve the model's overall simulation abilities. Therefore, we did not evaluate the model's simulation results of meteorological fields from two methods by comparing them with more observation results other than the ERA5 reanalysis dataset. Our results show that the Resolved method can capture complex relationships between aerosol optical properties and wavelengths that the Interpolated method may miss, particularly for dust-dominated regions and at specific wavelengths where water contents have a significantly larger absorption than other wavelengths. In addition, our results demonstrate that the amendment of algorithms can significantly affect the simulation results of meteorological fields. While these changes may not necessarily lead to better agreement with observations in all cases, they give the model more potential to improve simulation abilities by more accurately representing the underlying physical processes.
The current version of WRF-Chem is available from the project website: http://www2.mmm.ucar.edu/wrf/users/download/get_source.html (last access: 26 April 2022). The exact version of the model used to produce the results used in this paper is archived on Zenodo (https://doi.org/10.5281/zenodo.11244077; Feng, 2024), as are datasets and scripts to produce the plots for all the simulations presented in this paper. The model, datasets, and scripts are used under the MIT License.
The supplement related to this article is available online at: https://doi.org/10.5194/gmd-18-585-2025-supplement.
JF and CZ developed the code. JF, QD, and ZY conducted the experiments. JF and CZ analyzed the simulations. All authors contributed to the discussion and writing the final version of the paper.
The contact author has declared that none of the authors has any competing interests.
Publisher's note: Copernicus Publications remains neutral with regard to jurisdictional claims made in the text, published maps, institutional affiliations, or any other geographical representation in this paper. While Copernicus Publications makes every effort to include appropriate place names, the final responsibility lies with the authors.
This research was supported by the National Key Scientific and Technological Infrastructure project “Earth System Numerical Simulation Facility” (EarthLab). This study used the computing resources from the Supercomputing Center of the University of Science and Technology of China (USTC) and the Qingdao Supercomputing and Big Data Center.
This research has been supported by the National Key Research and Development Program of China (grant no. 2022YFC3700701), the Strategic Priority Research Program of Chinese Academy of Sciences (grant nos. XDB0500303 and XDB41000000), the National Natural Science Foundation of China (grant no. 41775146), the USTC Research Funds of the Double First-Class Initiative (grant nos. YD2080002007 and KY2080000114), and the Science and Technology Innovation Project of Laoshan Laboratory (grant no. LSKJ202300305).
This paper was edited by Nina Crnivec and reviewed by two anonymous referees.
Ackerman, T. P.: A Model of the Effect of Aerosols on Urban Climates with Particular Applications to the Los Angeles Basin, J. Atmos. Sci., 34, 531–547, https://doi.org/10.1175/1520-0469(1977)034<0531:AMOTEO>2.0.CO;2, 1977.
Albani, S., Mahowald, N. M., Perry, A. T., Scanza, R. A., Zender, C. S., Heavens, N. G., Maggi, V., Kok, J. F., and Otto-Bliesner, B. L.: Improved dust representation in the Community Atmosphere Model, J. Adv. Model. Earth Sy., 6, 541–570, https://doi.org/10.1002/2013MS000279, 2014.
Ångström, A.: On the Atmospheric Transmission of Sun Radiation and on Dust in the Air, Geografiska Annaler, 11, 156–166, https://doi.org/10.2307/519399, 1929.
Barnard, J. C., Fast, J. D., Paredes-Miranda, G., Arnott, W. P., and Laskin, A.: Technical Note: Evaluation of the WRF-Chem ”Aerosol Chemical to Aerosol Optical Properties” Module using data from the MILAGRO campaign, Atmos. Chem. Phys., 10, 7325–7340, https://doi.org/10.5194/acp-10-7325-2010, 2010.
Bellouin, N., Quaas, J., Gryspeerdt, E., Kinne, S., Stier, P., Watson-Parris, D., Boucher, O., Carslaw, K. S., Christensen, M., Daniau, A.-L., Dufresne, J.-L., Feingold, G., Fiedler, S., Forster, P., Gettelman, A., Haywood, J. M., Lohmann, U., Malavelle, F., Mauritsen, T., McCoy, D. T., Myhre, G., Mülmenstädt, J., Neubauer, D., Possner, A., Rugenstein, M., Sato, Y., Schulz, M., Schwartz, S. E., Sourdeval, O., Storelvmo, T., Toll, V., Winker, D., and Stevens, B.: Bounding Global Aerosol Radiative Forcing of Climate Change, Rev. Geophys., 58, e2019RG000660, https://doi.org/10.1029/2019RG000660, 2020.
Bender, F. A.-M.: Aerosol Forcing: Still Uncertain, Still Relevant, AGU Adv., 1, e2019AV000128, https://doi.org/10.1029/2019AV000128, 2020.
Chen, D., Liao, H., Yang, Y., Chen, L., Zhao, D., and Ding, D.: Simulated impacts of vertical distributions of black carbon aerosol on meteorology and PM2.5 concentrations in Beijing during severe haze events, Atmos. Chem. Phys., 22, 1825–1844, https://doi.org/10.5194/acp-22-1825-2022, 2022.
Chen, F. and Dudhia, J.: Coupling an Advanced Land Surface–Hydrology Model with the Penn State–NCAR MM5 Modeling System. Part I: Model Implementation and Sensitivity, Mon. Weather Rev., 129, 569–585, https://doi.org/10.1175/1520-0493(2001)129<0569:CAALSH>2.0.CO;2, 2001.
Chen, S., Zhao, C., Qian, Y., Leung, L. R., Huang, J., Huang, Z., Bi, J., Zhang, W., Shi, J., Yang, L., Li, D., and Li, J.: Regional modeling of dust mass balance and radiative forcing over East Asia using WRF-Chem, Aeolian Res., 15, 15–30, https://doi.org/10.1016/j.aeolia.2014.02.001, 2014.
Dee, D. P., Uppala, S. M., Simmons, A. J., Berrisford, P., Poli, P., Kobayashi, S., Andrae, U., Balmaseda, M. A., Balsamo, G., Bauer, P., Bechtold, P., Beljaars, A. C. M., van de Berg, L., Bidlot, J., Bormann, N., Delsol, C., Dragani, R., Fuentes, M., Geer, A. J., Haimberger, L., Healy, S. B., Hersbach, H., Hólm, E. V., Isaksen, L., Kållberg, P., Köhler, M., Matricardi, M., McNally, A. P., Monge-Sanz, B. M., Morcrette, J.-J., Park, B.-K., Peubey, C., de Rosnay, P., Tavolato, C., Thépaut, J.-N., and Vitart, F.: The ERA-Interim reanalysis: configuration and performance of the data assimilation system, Q. J. Roy. Meteor. Soc., 137, 553–597, https://doi.org/10.1002/qj.828, 2011.
Dickerson, R. R., Kondragunta, S., Stenchikov, G., Civerolo, K. L., Doddridge, B. G., and Holben, B. N.: The Impact of Aerosols on Solar Ultraviolet Radiation and Photochemical Smog, Science, 278, 827–830, https://doi.org/10.1126/science.278.5339.827, 1997.
Ding, A. J., Fu, C. B., Yang, X. Q., Sun, J. N., Petäjä, T., Kerminen, V.-M., Wang, T., Xie, Y., Herrmann, E., Zheng, L. F., Nie, W., Liu, Q., Wei, X. L., and Kulmala, M.: Intense atmospheric pollution modifies weather: a case of mixed biomass burning with fossil fuel combustion pollution in eastern China, Atmos. Chem. Phys., 13, 10545–10554, https://doi.org/10.5194/acp-13-10545-2013, 2013.
Ding, A. J., Huang, X., Nie, W., Sun, J. N., Kerminen, V.-M., Petäjä, T., Su, H., Cheng, Y. F., Yang, X.-Q., Wang, M. H., Chi, X. G., Wang, J. P., Virkkula, A., Guo, W. D., Yuan, J., Wang, S. Y., Zhang, R. J., Wu, Y. F., Song, Y., Zhu, T., Zilitinkevich, S., Kulmala, M., and Fu, C. B.: Enhanced haze pollution by black carbon in megacities in China, Geophys. Res. Lett., 43, 2873–2879, https://doi.org/10.1002/2016GL067745, 2016.
Du, Q., Zhao, C., Zhang, M., Dong, X., Chen, Y., Liu, Z., Hu, Z., Zhang, Q., Li, Y., Yuan, R., and Miao, S.: Modeling diurnal variation of surface PM2.5 concentrations over East China with WRF-Chem: impacts from boundary-layer mixing and anthropogenic emission, Atmos. Chem. Phys., 20, 2839–2863, https://doi.org/10.5194/acp-20-2839-2020, 2020.
Du, Q., Zhao, C., Feng, J., Yang, Z., Xu, J., Gu, J., Zhang, M., Xu, M., and Lin, S.: Seasonal characteristics of forecasting uncertainties in surface PM2.5 concentration associated with leading-time over the Beijing-Tianjin-Hebei region, Adv. Atmos. Sci., 41, 801–816, https://doi.org/10.1007/s00376-023-3060-3, 2023.
Dubovik, O., Holben, B., Eck, T. F., Smirnov, A., Kaufman, Y. J., King, M. D., Tanré, D., and Slutsker, I.: Variability of Absorption and Optical Properties of Key Aerosol Types Observed in Worldwide Locations, J. Atmos. Sci., 59, 590–608, https://doi.org/10.1175/1520-0469(2002)059<0590:VOAAOP>2.0.CO;2, 2002.
Fast, J. D., Gustafson Jr., W. I., Easter, R. C., Zaveri, R. A., Barnard, J. C., Chapman, E. G., Grell, G. A., and Peckham, S. E.: Evolution of ozone, particulates, and aerosol direct radiative forcing in the vicinity of Houston using a fully coupled meteorology-chemistry-aerosol model, J. Geophys. Res.-Atmos., 111, D21305, https://doi.org/10.1029/2005JD006721, 2006.
Feng, J.: The code of the modified model and scripts used in “Amending the algorithm of aerosol-radiation interaction in WRF-Chem (v4.4)”, Zenodo [code and data set], https://doi.org/10.5281/zenodo.11244077, 2024.
Feng, J., Zhao, C., Du, Q., Xu, M., Gu, J., Hu, Z., and Chen, Y.: Simulating Atmospheric Dust With a Global Variable-Resolution Model: Model Description and Impacts of Mesh Refinement, J. Adv. Model. Earth Sy., 15, e2023MS003636, https://doi.org/10.1029/2023MS003636, 2023.
Feng, Y., Wang, H., Rasch, P. J., Zhang, K., Lin, W., Tang, Q., Xie, S., Hamilton, D. S., Mahowald, N., and Yu, H.: Global Dust Cycle and Direct Radiative Effect in E3SM Version 1: Impact of Increasing Model Resolution, J. Adv. Model. Earth Sy., 14, e2021MS002909, https://doi.org/10.1029/2021MS002909, 2022.
Gao, Y., Zhao, C., Liu, X., Zhang, M., and Leung, L. R.: WRF-Chem simulations of aerosols and anthropogenic aerosol radiative forcing in East Asia, Atmos. Environ., 92, 250–266, https://doi.org/10.1016/j.atmosenv.2014.04.038, 2014.
Ghan, S., Laulainen, N., Easter, R., Wagener, R., Nemesure, S., Chapman, E., Zhang, Y., and Leung, R.: Evaluation of aerosol direct radiative forcing in MIRAGE, J. Geophys. Res.-Atmos., 106, 5295–5316, https://doi.org/10.1029/2000JD900502, 2001.
Ginoux, P., Chin, M., Tegen, I., Prospero, J. M., Holben, B., Dubovik, O., and Lin, S.-J.: Sources and distributions of dust aerosols simulated with the GOCART model, J. Geophys. Res.-Atmos., 106, 20255–20273, https://doi.org/10.1029/2000JD000053, 2001.
Gong, S. L.: A parameterization of sea-salt aerosol source function for sub- and super-micron particles, Global Biogeochem. Cycles, 17, 1097, https://doi.org/10.1029/2003GB002079, 2003.
Grell, G. A., Peckham, S. E., Schmitz, R., McKeen, S. A., Frost, G., Skamarock, W. C., and Eder, B.: Fully coupled “online” chemistry within the WRF model, Atmos. Environ., 39, 6957–6975, https://doi.org/10.1016/j.atmosenv.2005.04.027, 2005.
Hess, M., Koepke, P., and Schult, I.: Optical Properties of Aerosols and Clouds: The Software Package OPAC, B. Am. Meteorol. Soc., 79, 831–844, https://doi.org/10.1175/1520-0477(1998)079<0831:OPOAAC>2.0.CO;2, 1998.
Holben, B. N., Eck, T. F., Slutsker, I., Tanré, D., Buis, J. P., Setzer, A., Vermote, E., Reagan, J. A., Kaufman, Y. J., Nakajima, T., Lavenu, F., Jankowiak, I., and Smirnov, A.: AERONET – A Federated Instrument Network and Data Archive for Aerosol Characterization, Remote Sens. Environ., 66, 1–16, https://doi.org/10.1016/S0034-4257(98)00031-5, 1998.
Hong, S.-Y., Noh, Y., and Dudhia, J.: A New Vertical Diffusion Package with an Explicit Treatment of Entrainment Processes, Mon. Weather Rev., 134, 2318–2341, https://doi.org/10.1175/MWR3199.1, 2006.
Hu, Z., Zhao, C., Huang, J., Leung, L. R., Qian, Y., Yu, H., Huang, L., and Kalashnikova, O. V.: Trans-Pacific transport and evolution of aerosols: evaluation of quasi-global WRF-Chem simulation with multiple observations, Geosci. Model Dev., 9, 1725–1746, https://doi.org/10.5194/gmd-9-1725-2016, 2016.
Huang, X. and Ding, A.: Aerosol as a critical factor causing forecast biases of air temperature in global numerical weather prediction models, Sci. Bull., 66, 1917–1924, https://doi.org/10.1016/j.scib.2021.05.009, 2021.
Huang, X., Ding, A., Liu, L., Liu, Q., Ding, K., Niu, X., Nie, W., Xu, Z., Chi, X., Wang, M., Sun, J., Guo, W., and Fu, C.: Effects of aerosol–radiation interaction on precipitation during biomass-burning season in East China, Atmos. Chem. Phys., 16, 10063–10082, https://doi.org/10.5194/acp-16-10063-2016, 2016.
Huang, X., Wang, Z., and Ding, A.: Impact of Aerosol-PBL Interaction on Haze Pollution: Multiyear Observational Evidences in North China, Geophys. Res. Lett., 45, 8596–8603, https://doi.org/10.1029/2018GL079239, 2018.
Iacono, M. J., Mlawer, E. J., Clough, S. A., and Morcrette, J.-J.: Impact of an improved longwave radiation model, RRTM, on the energy budget and thermodynamic properties of the NCAR community climate model, CCM3, J. Geophys. Res.-Atmos., 105, 14873–14890, https://doi.org/10.1029/2000JD900091, 2000.
Jacobson, M. Z.: Studying the effects of aerosols on vertical photolysis rate coefficient and temperature profiles over an urban airshed, J. Geophys. Res.-Atmos., 103, 10593–10604, https://doi.org/10.1029/98JD00287, 1998.
Jaeglé, L., Quinn, P. K., Bates, T. S., Alexander, B., and Lin, J.-T.: Global distribution of sea salt aerosols: new constraints from in situ and remote sensing observations, Atmos. Chem. Phys., 11, 3137–3157, https://doi.org/10.5194/acp-11-3137-2011, 2011.
Janssens-Maenhout, G., Crippa, M., Guizzardi, D., Dentener, F., Muntean, M., Pouliot, G., Keating, T., Zhang, Q., Kurokawa, J., Wankmüller, R., Denier van der Gon, H., Kuenen, J. J. P., Klimont, Z., Frost, G., Darras, S., Koffi, B., and Li, M.: HTAP_v2.2: a mosaic of regional and global emission grid maps for 2008 and 2010 to study hemispheric transport of air pollution, Atmos. Chem. Phys., 15, 11411–11432, https://doi.org/10.5194/acp-15-11411-2015, 2015.
Jiang, F., Liu, Q., Huang, X., Wang, T., Zhuang, B., and Xie, M.: Regional modeling of secondary organic aerosol over China using WRF/Chem, J. Aerosol Sci., 43, 57–73, https://doi.org/10.1016/j.jaerosci.2011.09.003, 2012.
Kain, J. S.: The Kain–Fritsch Convective Parameterization: An Update, J. Appl. Meteor., 43, 170–181, https://doi.org/10.1175/1520-0450(2004)043<0170:TKCPAU>2.0.CO;2, 2004.
Kok, J. F.: A scaling theory for the size distribution of emitted dust aerosols suggests climate models underestimate the size of the global dust cycle, P. Natl. Acad. Sci. USA, 108, 1016–1021, https://doi.org/10.1073/pnas.1014798108, 2011.
Kok, J. F., Ridley, D. A., Zhou, Q., Miller, R. L., Zhao, C., Heald, C. L., Ward, D. S., Albani, S., and Haustein, K.: Smaller desert dust cooling effect estimated from analysis of dust size and abundance, Nat. Geosci, 10, 274–278, https://doi.org/10.1038/ngeo2912, 2017.
Li, M., Liu, H., Geng, G., Hong, C., Liu, F., Song, Y., Tong, D., Zheng, B., Cui, H., Man, H., Zhang, Q., and He, K.: Anthropogenic emission inventories in China: a review, Nat. Sci. Rev., 4, 834–866, https://doi.org/10.1093/nsr/nwx150, 2017a.
Li, M., Zhang, Q., Kurokawa, J.-I., Woo, J.-H., He, K., Lu, Z., Ohara, T., Song, Y., Streets, D. G., Carmichael, G. R., Cheng, Y., Hong, C., Huo, H., Jiang, X., Kang, S., Liu, F., Su, H., and Zheng, B.: MIX: a mosaic Asian anthropogenic emission inventory under the international collaboration framework of the MICS-Asia and HTAP, Atmos. Chem. Phys., 17, 935–963, https://doi.org/10.5194/acp-17-935-2017, 2017b.
Liu, L., Huang, X., Ding, A., and Fu, C.: Dust-induced radiative feedbacks in north China: A dust storm episode modeling study using WRF-Chem, Atmos. Environ., 129, 43–54, https://doi.org/10.1016/j.atmosenv.2016.01.019, 2016.
Mlawer, E. J., Taubman, S. J., Brown, P. D., Iacono, M. J., and Clough, S. A.: Radiative transfer for inhomogeneous atmospheres: RRTM, a validated correlated-k model for the longwave, J. Geophys. Res.-Atmos., 102, 16663–16682, https://doi.org/10.1029/97JD00237, 1997.
Morrison, H., Thompson, G., and Tatarskii, V.: Impact of Cloud Microphysics on the Development of Trailing Stratiform Precipitation in a Simulated Squall Line: Comparison of One- and Two-Moment Schemes, Mon. Weather Rev., 137, 991–1007, https://doi.org/10.1175/2008MWR2556.1, 2009.
Myhre, G., Samset, B. H., Schulz, M., Balkanski, Y., Bauer, S., Berntsen, T. K., Bian, H., Bellouin, N., Chin, M., Diehl, T., Easter, R. C., Feichter, J., Ghan, S. J., Hauglustaine, D., Iversen, T., Kinne, S., Kirkevåg, A., Lamarque, J.-F., Lin, G., Liu, X., Lund, M. T., Luo, G., Ma, X., van Noije, T., Penner, J. E., Rasch, P. J., Ruiz, A., Seland, Ø., Skeie, R. B., Stier, P., Takemura, T., Tsigaridis, K., Wang, P., Wang, Z., Xu, L., Yu, H., Yu, F., Yoon, J.-H., Zhang, K., Zhang, H., and Zhou, C.: Radiative forcing of the direct aerosol effect from AeroCom Phase II simulations, Atmos. Chem. Phys., 13, 1853–1877, https://doi.org/10.5194/acp-13-1853-2013, 2013.
Petäjä, T., Järvi, L., Kerminen, V.-M., Ding, A. J., Sun, J. N., Nie, W., Kujansuu, J., Virkkula, A., Yang, X., Fu, C. B., Zilitinkevich, S., and Kulmala, M.: Enhanced air pollution via aerosol-boundary layer feedback in China, Sci. Rep., 6, 18998, https://doi.org/10.1038/srep18998, 2016.
Sharma, A., Venkataraman, C., Muduchuru, K., Singh, V., Kesarkar, A., Ghosh, S., and Dey, S.: Aerosol radiative feedback enhances particulate pollution over India: A process understanding, Atmos. Environ., 298, 119609, https://doi.org/10.1016/j.atmosenv.2023.119609, 2023.
Skamarock, C., Klemp, B., Dudhia, J., Gill, O., Liu, Z., Berner, J., Wang, W., Powers, G., Duda, G., Barker, D., and Huang, X.: A Description of the Advanced Research WRF Model Version 4.3, OpenSky [data set], https://doi.org/10.5065/1dfh-6p97, 2021.
Tan, J., Zhang, Y., Ma, W., Yu, Q., Wang, J., and Chen, L.: Impact of spatial resolution on air quality simulation: A case study in a highly industrialized area in Shanghai, China, Atmos. Pollut. Res., 6, 322–333, https://doi.org/10.5094/APR.2015.036, 2015.
Tao, H., Xing, J., Zhou, H., Pleim, J., Ran, L., Chang, X., Wang, S., Chen, F., Zheng, H., and Li, J.: Impacts of improved modeling resolution on the simulation of meteorology, air quality, and human exposure to PM2.5, O3 in Beijing, China, J. Clean. Prod., 243, 118574, https://doi.org/10.1016/j.jclepro.2019.118574, 2020.
Wang, X., Zhao, C., Xu, M., Du, Q., Zheng, J., Bi, Y., Lin, S., and Luo, Y.: The sensitivity of simulated aerosol climatic impact to domain size using regional model (WRF-Chem v3.6), Geosci. Model Dev., 15, 199–218, https://doi.org/10.5194/gmd-15-199-2022, 2022.
Wei, J., Lu, B., Song, Y., Chen, H., and Weng, Z.: Anthropogenic Aerosols Weaken Land–Atmosphere Coupling Over North China, Geophys. Res. Lett., 50, e2023GL105685, https://doi.org/10.1029/2023GL105685, 2023.
Wiedinmyer, C., Akagi, S. K., Yokelson, R. J., Emmons, L. K., Al-Saadi, J. A., Orlando, J. J., and Soja, A. J.: The Fire INventory from NCAR (FINN): a high resolution global model to estimate the emissions from open burning, Geosci. Model Dev., 4, 625–641, https://doi.org/10.5194/gmd-4-625-2011, 2011.
Wilcox, E. M., Thomas, R. M., Praveen, P. S., Pistone, K., Bender, F. A.-M., and Ramanathan, V.: Black carbon solar absorption suppresses turbulence in the atmospheric boundary layer, P. Natl. Acad. Sci. USA, 113, 11794–11799, https://doi.org/10.1073/pnas.1525746113, 2016.
Wu, L., Su, H., and Jiang, J. H.: Regional simulation of aerosol impacts on precipitation during the East Asian summer monsoon, J. Geophys. Res.-Atmos., 118, 6454–6467, https://doi.org/10.1002/jgrd.50527, 2013.
Yang, Y., Russell, L. M., Lou, S., Liao, H., Guo, J., Liu, Y., Singh, B., and Ghan, S. J.: Dust-wind interactions can intensify aerosol pollution over eastern China, Nat. Commun., 8, 15333, https://doi.org/10.1038/ncomms15333, 2017.
Zaveri, R. A. and Peters, L. K.: A new lumped structure photochemical mechanism for large-scale applications, J. Geophys. Res.-Atmos., 104, 30387–30415, https://doi.org/10.1029/1999JD900876, 1999.
Zaveri, R. A., Easter, R. C., Fast, J. D., and Peters, L. K.: Model for Simulating Aerosol Interactions and Chemistry (MOSAIC), J. Geophys. Res.-Atmos., 113, D13204, https://doi.org/10.1029/2007JD008782, 2008.
Zhang, M., Zhao, C., Cong, Z., Du, Q., Xu, M., Chen, Y., Chen, M., Li, R., Fu, Y., Zhong, L., Kang, S., Zhao, D., and Yang, Y.: Impact of topography on black carbon transport to the southern Tibetan Plateau during the pre-monsoon season and its climatic implication, Atmos. Chem. Phys., 20, 5923–5943, https://doi.org/10.5194/acp-20-5923-2020, 2020.
Zhao, C., Liu, X., Leung, L. R., Johnson, B., McFarlane, S. A., Gustafson Jr., W. I., Fast, J. D., and Easter, R.: The spatial distribution of mineral dust and its shortwave radiative forcing over North Africa: modeling sensitivities to dust emissions and aerosol size treatments, Atmos. Chem. Phys., 10, 8821–8838, https://doi.org/10.5194/acp-10-8821-2010, 2010.
Zhao, C., Liu, X., Ruby Leung, L., and Hagos, S.: Radiative impact of mineral dust on monsoon precipitation variability over West Africa, Atmos. Chem. Phys., 11, 1879–1893, https://doi.org/10.5194/acp-11-1879-2011, 2011.
Zhao, C., Liu, X., and Leung, L. R.: Impact of the Desert dust on the summer monsoon system over Southwestern North America, Atmos. Chem. Phys., 12, 3717–3731, https://doi.org/10.5194/acp-12-3717-2012, 2012.
Zhao, C., Ruby Leung, L., Easter, R., Hand, J., and Avise, J.: Characterization of speciated aerosol direct radiative forcing over California, J. Geophys. Res.-Atmos., 118, 2372–2388, https://doi.org/10.1029/2012JD018364, 2013.
Zhao, C., Hu, Z., Qian, Y., Ruby Leung, L., Huang, J., Huang, M., Jin, J., Flanner, M. G., Zhang, R., Wang, H., Yan, H., Lu, Z., and Streets, D. G.: Simulating black carbon and dust and their radiative forcing in seasonal snow: a case study over North China with field campaign measurements, Atmos. Chem. Phys., 14, 11475–11491, https://doi.org/10.5194/acp-14-11475-2014, 2014.
Zhong, M., Saikawa, E., Liu, Y., Naik, V., Horowitz, L. W., Takigawa, M., Zhao, Y., Lin, N.-H., and Stone, E. A.: Air quality modeling with WRF-Chem v3.5 in East Asia: sensitivity to emissions and evaluation of simulated air quality, Geosci. Model Dev., 9, 1201–1218, https://doi.org/10.5194/gmd-9-1201-2016, 2016.


