the Creative Commons Attribution 4.0 License.
the Creative Commons Attribution 4.0 License.
 | 30 Jul 2025
Simulating the drought response of European tree species with the dynamic vegetation model LPJ-GUESS (v4.1, 97c552c5)
João P. Darela-Filho
Konstantin Gregor
Allan Buras
Qiao-Lin Gu
Andreas Krause
Daijun Liu
Phillip Papastefanou
Sijeh Asuk
Thorsten E. E. Grams
Christian S. Zang
Anja Rammig
Due to climate change, severe-drought events have become increasingly commonplace across Europe in recent decades, with future projections indicating that this trend will likely continue, posing questions about the continued viability of European forests. Observations from the most recent pan-European droughts suggest that these types of “hotter droughts” may acutely alter the carbon balance of European forest ecosystems. However, substantial uncertainty remains regarding the possible future impacts of severe drought on the European forest carbon sink. Dynamic vegetation models can help to shed light on such uncertainties; however, the inclusion of dedicated plant hydraulic architecture modules in these has only recently become more widespread. Such developments intended to improve model performance also tend to add substantial complexity, yet the sensitivity of the models to newly introduced processes is often left undetermined. Here, we describe and evaluate the recently developed mechanistic plant hydraulic architecture version of LPJ-GUESS and provide a parameterization for 12 common European forest tree species. We quantify the uncertainty introduced by the new processes using a variance-based global sensitivity analysis. Additionally, we evaluate the model against water and carbon fluxes from a network of eddy covariance flux sites across Europe. Our results indicate that the new model is able to capture drought-induced patterns of evapotranspiration along an isohydric gradient and manages to reproduce flux observations during drought better than standard LPJ-GUESS does. Further, the sensitivity analysis suggests that hydraulic process related to hydraulic failure and stomatal regulation play the largest roles in shaping the model response to drought.
- Article
(3152 KB) - Full-text XML
- BibTeX
- EndNote


For the past decades, the face of European forests has been increasingly marred by heat waves and droughts – effects of anthropogenic climate change (Ciais et al., 2005; European Environment Agency, 2019; Bigler and Vitasse, 2021; Fink et al., 2004). Severe pan-European droughts in 2003, 2018, and 2022 in combination with record-high temperatures (“hotter droughts”) caused record reductions in forest growth and productivity as a result of defoliation, higher susceptibility to biotic agents, and mortality (Buras et al., 2023; Ciais et al., 2005; Schuldt et al., 2020; van der Woude et al., 2023). Concerningly, the most recent carbon losses induced by the 2022 hotter drought have turned central European forests from a carbon sink to a carbon source (van der Woude et al., 2023). With more frequent and intense droughts looming on the horizon, the future of the European forest carbon sink remains uncertain (Brodribb et al., 2020; Cook et al., 2020; Pan et al., 2024, 2011). While dynamic vegetation models (DVMs) are popular tools commonly used to shed light on such uncertainties and estimate possible future impacts on the vegetation carbon sink, many of the established models display strongly diverging simulations with regard to the effects of drought and heat (Tschumi et al., 2023). In an attempt to ensure that future vegetation changes and the associated feedbacks on the water and carbon cycles can be simulated confidently, the latest generation of dynamic vegetation models features increasingly detailed representations of plant hydraulic architecture (Xu et al., 2016; Yao et al., 2022; Kennedy et al., 2019; Xu et al., 2023; Eller et al., 2018, 2020; Christoffersen et al., 2016).
In the simplest terms, these representations of hydraulic architecture tend to consider two distinct drivers of drought-induced stress: insufficient water availability in the soil and increased atmospheric demand for water (Papastefanou et al., 2020). The balance between supply and demand determines whether a tree will experience drought stress or not. The link between these two ends of the system is the hydraulic architecture of the tree, which utilizes the xylem to transport water from the roots through the stem and ultimately to the leaves, where it is transpired through the stomata into the atmosphere (Lambers and Oliveira, 2019). Disruptions in this pipeline due to cavitation or stomatal closure trigger symptoms commonly associated with drought stress. As the ability of trees to transport water declines, other processes such as photosynthetic assimilation and growth cease (Lambers and Oliveira, 2019; Choat et al., 2012). Ultimately, critical dehydration – either directly or by predisposing affected trees to pathogens or insect attack – leads to tree death (Anderegg et al., 2012; Mcdowell et al., 2008; Hajek et al., 2022; Bigler et al., 2006).
Earlier DVMs generally included simple mechanisms to simulate drought stress, frequently opting for empirical approaches to reduce photosynthetic assimilation during periods of low water availability (Powell et al., 2013; Smith et al., 2001; Zhou et al., 2013). This strategy does not account for the mechanistic links between species-specific hydraulic traits, such as xylem vulnerability to cavitation, stomatal response to atmospheric drying, and xylem conductivity, which have been shown to play a key role in modulating the impact of drought conditions on forests in terms of both productivity and mortality (Hajek et al., 2022; Anderegg et al., 2016, 2015). To account for this behavior, current DVMs are increasingly including mechanistic, process-based representations of plant hydraulic architecture, with functional diversity regarding stomatal control, water potential regulation, water flow through the soil–plant–atmosphere continuum, and hydraulic failure under drought conditions (Xu et al., 2016, 2023; Eller et al., 2018, 2020; Yao et al., 2022; Kennedy et al., 2019; Christoffersen et al., 2016; De Kauwe et al., 2020; Papastefanou et al., 2020, 2024).
While these improvements have proved valuable for predicting the response of forests to present and future drought, they add further complexity to already complex models by introducing new parameters and processes, potentially contributing to increased uncertainty between projections from various models (Oberpriller et al., 2022; Zaehle et al., 2005). Identifying the causes of uncertainty can help guide future model development, highlight the need for more observations of key traits, and determine the model processes that may be over- or underrepresented compared to reality (Zaehle et al., 2005; Dietze et al., 2018). In this context, global sensitivity analysis is commonly used to detect the sensitivity of model outputs to model parameters (Saltelli, 2008). Due to the complexity of DVMs and the associated computational demand of performing a comprehensive global sensitivity analysis, such analyses are rare and are not consistently applied each time new processes are implemented and new parameters are introduced (Oberpriller et al., 2022). Nevertheless, these analyses remain important for enhancing our understanding of the internal model processes and are invaluable in allowing solid interpretation of model results (Oberpriller et al., 2022; Zaehle et al., 2005; Pappas et al., 2013).
Here, we describe and examine the recently developed mechanistic hydraulic architecture in LPJ-GUESS, termed LPJ-GUESS-HYD, intended to more accurately capture tree drought responses based on the theoretical framework of isohydricity (Papastefanou et al., 2024). The concept of isohydricity has been used to classify the response patterns of trees to drought (Tardieu et al., 2015; Jones and Sutherland, 1991) based in part on the sensitivity of leaf water potential to changes in canopy conductance (Klein, 2014). LPJ-GUESS-HYD builds upon a previous version of LPJ-GUESS with mechanistic plant hydraulic architecture, which, although it did not implement the impact of xylem cavitation and stomatal regulation related to isohydricity, nevertheless was able to reproduce patterns of potential natural vegetation (Hickler et al., 2006). LPJ-GUESS-HYD expands upon this earlier version by including a dynamic representation of species-specific water potential regulation related to the concept of isohydricity (Papastefanou et al., 2020) and by explicitly coupling the model representation of evapotranspiration to the canopy conductance governed by plant hydraulic processes (Papastefanou et al., 2024), which is in contrast to the standard version of LPJ-GUESS that only does so during periods of limited water availability.
To thoroughly evaluate the processes implemented related to drought-induced stress and the sensitivity of the model to the model parameters governing these processes, we conduct a variance-based global sensitivity analysis (Saltelli, 2008; Saltelli et al., 2010). To forego the limitations associated with the complexity of DVMs and the computational demand of running a sensitivity analysis, we focus on the newly introduced parameters governing the plant drought response. Accordingly, we compiled parameter ranges for 12 major European forest tree species from observations and analyzed their sensitivities by simulating a network of 34 eddy covariance flux sites throughout Europe (Warm Winter 2020 Team and ICOS Ecosystem Thematic Centre, 2022). Furthermore, we establish viable parameterizations for our set of 12 species to compare simulated and observed evapotranspiration and gross primary productivity across the European forest sites.
We aim to answer the following questions:
-
Which of the seven newly introduced parameters related to hydraulic architecture introduces the most uncertainty into LPJ-GUESS-HYD?
-
Does the inclusion of hydraulic architecture reflect species-specific drought responses along an isohydricity gradient in the model; that is, under increasing drought, will anisohydric species continue to transpire more than isohydric species?
-
Does LPJ-GUESS-HYD represent an improvement over LPJ-GUESS in depicting the drought response represented by changes in gross primary production (GPP) and evapotranspiration in European forest ecosystems when compared to observational data from eddy covariance flux towers?
2.1 Description of the standard version of LPJ-GUESS
LPJ-GUESS is a dynamic vegetation model simulating terrestrial ecosystem dynamics on a regional to global scale driven by atmospheric CO2, gridded meteorological inputs, nitrogen deposition, and soil physical properties (Smith et al., 2001, 2014). The model has been successfully applied and evaluated on the global (e.g., Seiler et al., 2022) and regional scale (e.g., Hickler et al., 2012) for a wide range of applications in both managed (e.g., Lindeskog et al., 2021) and natural forest ecosystems (e.g., Ahlström et al., 2012). The following sections will provide an overview of LPJ-GUESS with a particular focus on the model processes critical to the representation of drought effects on individual trees.
2.1.1 Representation of vegetation in LPJ-GUESS
Within each simulated grid cell or site, replicate patches serve as random samples of the entire landscape to account for disturbance- and stand-development-related differences between vegetation stands. Vegetation dynamics in each patch emerge from the competition of different age cohorts of plant functional types (PFTs) or species for space, light, water, and nutrients. Individuals within a cohort are identical in age and size. Typically, PFTs represent classes of tree species with similar attributes related to characteristics such as phenology, shade-tolerance, or bioclimatic limits, which are described by a common set of parameters. Here, we use the parameterization developed by Hickler et al. (2012) and expanded upon by Lindeskog et al. (2021) to simulate a subset of the most pertinent European tree species. Except for the newly introduced hydraulic parameters (Table 2), all species parameters are identical to those in Lindeskog et al. (2021).
LPJ-GUESS simulates photosynthesis and stomatal conductance based on the BIOME3 model (Sykes and Prentice, 1996), along with respiration and phenology on a daily basis. At the end of each simulation year, accumulated net primary productivity (NPP) is allocated to leaves, roots, and sapwood following allometric constraints (Sitch et al., 2003). Population dynamics (establishment and mortality) and patch-destroying disturbances are simulated stochastically on a yearly time step. Soil carbon and nitrogen cycles are simulated based on the CENTURY model (Parton et al., 2010; Kirschbaum and Paul, 2002; Parton et al., 1993; Comins and McMurtrie, 1993).
2.1.2 Soil hydrology
Soil hydrology is represented as a “leaky bucket” model, with percolation between layers based on Gerten et al. (2004), albeit with 15 soil layers (each 10 cm thick) instead of the original 2 (Zhou et al., 2024). The first 5 soil layers are considered “surface” layers, and the remaining 10 are referred to as “deep” layers. For each soil layer, l (1 to 15), the available water holding capacity (awcl; mm) is determined by the volumetric water content at wilting point (wpl; mm mm−1), the (volumetric) field capacity (fcl; mm mm−1), and the soil layer thickness (Dzl; mm) as
The field capacity and wilting point are determined by the soil properties (e.g., clay, sand, and silt fraction; soil carbon content; and bulk density) provided as input to the model and are the same for all layers. The dimensionless ratio of awcl to the actual available liquid water in the soil (awl; mm) is defined as the water content (wcont ∈ [0, 1]):
which indicates the amount of water available to plants in any given soil layer. Water input to soil comes from rainfall and snowmelt, which are initially distributed among the five surface layers and subsequently percolate to the deeper layers. Water leaves the soil via evapotranspiration – where evaporation occurs from the fraction of soil not covered by vegetation, and transpiration is dependent on vegetation characteristics – and runoff.
2.1.3 Water availability dynamics
In the standard version of LPJ-GUESS, only a few processes are limited by water availability, but the plant hydraulic architecture is not explicitly modeled. Nevertheless, certain processes are affected by limited water availability, reflecting plant responses to drought. Initially, low water availability – drought – constrains the establishment of new plant individuals. Each species is assigned a drought tolerance level from 0 (extremely drought tolerant) to 1 (extremely drought intolerant) based on the water content as a fraction of the available water holding capacity required for that species to establish. This tolerance level is compared to the growing season average water content integrated over the upper-five soil layers:
Additionally, drought can limit photosynthetic assimilation by downregulating canopy conductance (gc; mm s−1) and restricting the ratio () of intercellular CO2 (ci; ppm) to ambient CO2 (ca; ppm) (Haxeltine and Prentice, 1996). Photosynthesis is modeled based on the Collatz simplification of the Farquhar model (Collatz et al., 1991) described in detail in Haxeltine and Prentice (1996) and Sitch et al. (2003). When water supply is ample, the optimal canopy conductance for photosynthesis is calculated as
where gmin is the species-specific minimum canopy conductance (a parameter), Adt is the daytime net assimilation, and λmax is a species-specific parameter. Conversely, when water supply is limited, photosynthesis is calculated using actual rather than maximum potential canopy conductance, gp, and , where the actual canopy conductance, gc, is calculated as
where Eq is the equilibrium transpiration (mm s−1), Esu is the water supply (mm s−1), and αm is an empirical parameter (Haxeltine and Prentice, 1996). This calculation is triggered under water-stressed conditions, i.e., when the supply of water from the soil (Esu; mm s−1) determined by the species-specific maximum transpiration rate (Emax, a species-specific parameter; mm s−1) and the soil moisture availability in the rooting zone (Wr, mm s−1); that is, the fraction of soil water content accessible to an individual based on the parameterized species-specific root distribution across all soil layers (Haxeltine and Prentice, 1996), are
which is not sufficient to satisfy the demand indicated by Ede:
Consequently, gc is reduced to ensure that plant transpiration (E, mm s−1) matches the supply (Esu) such that
2.2 Description of hydraulic architecture as implemented in LPJ-GUESS-HYD
LPJ-GUESS-HYD provides a more in-depth implementation of plant physiological processes related to water availability (Papastefanou et al., 2024). Strategies for water potential regulation along the isohydric spectrum determine how species react to changes in soil water availability (Papastefanou et al., 2020). The resulting water potential gradient governs the flow of water through the plant and, based on Darcy's law (Whitehead, 1998), determines the supply of water available for transpiration (Hickler et al., 2006). Atmospheric demand for water is driven by the vapor pressure deficit (VPD) and, together with the supply of water, ultimately governs canopy conductance for photosynthetic assimilation. Lastly, to model the impact of drought on tree mortality, LPJ-GUESS-HYD includes an empirical representation of hydraulic failure mortality based on xylem cavitation. These new processes seamlessly integrate into the existing structure of LPJ-GUESS and primarily replace empirical relationships between soil hydrology and photosynthetic assimilation (Fig. 1).
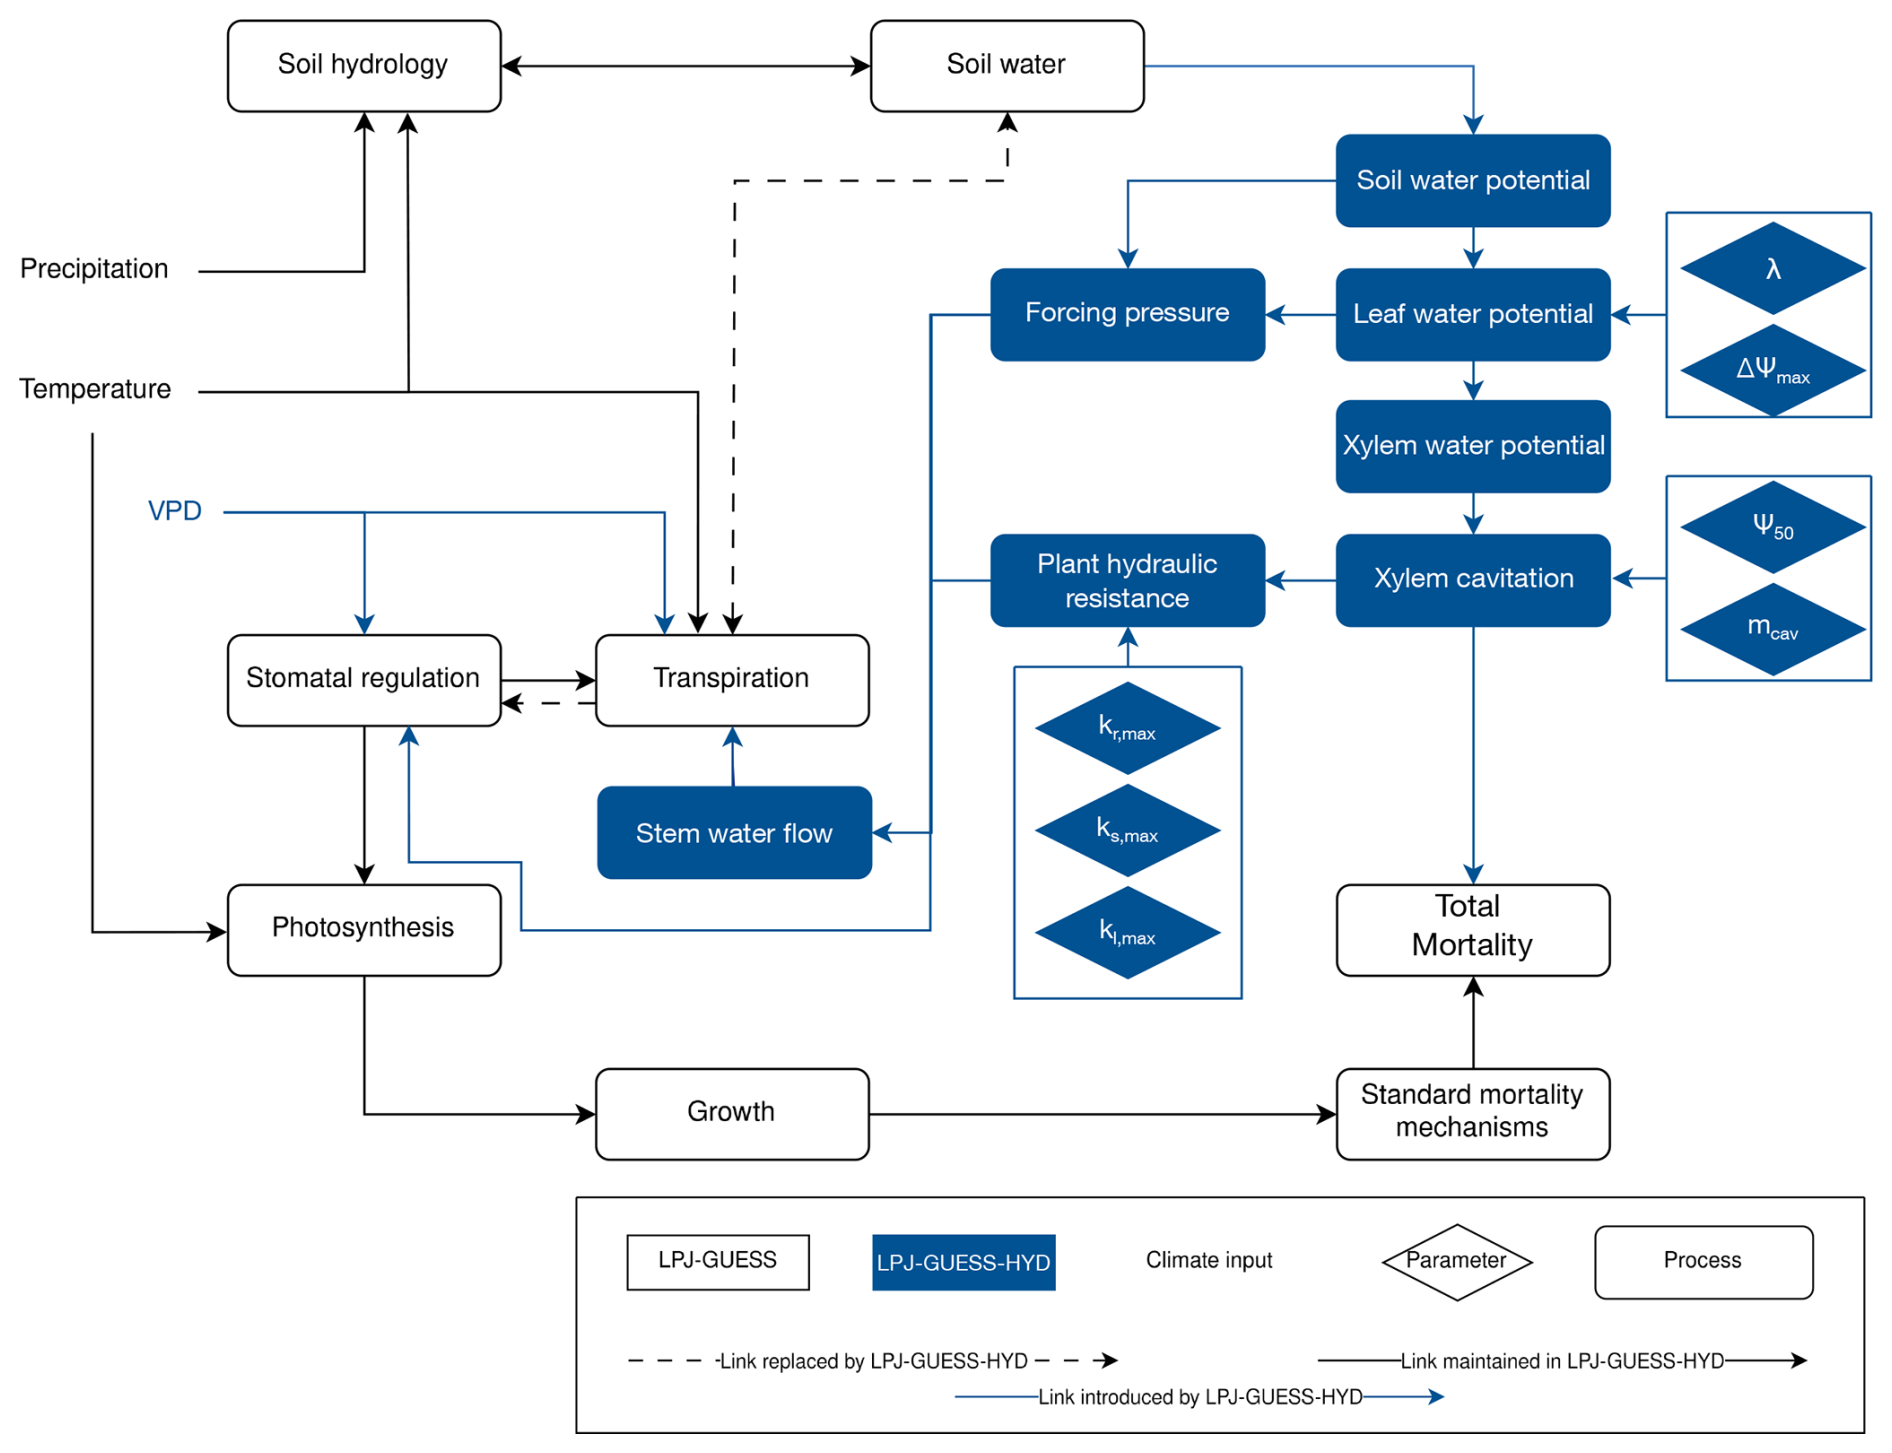
Figure 1Flow chart displaying the model structure of LPJ-GUESS-HYD including links to standard LPJ-GUESS processes. Objects in blue are introduced by LPJ-GUESS-HYD, while objects outlined in black are part of the standard LPJ-GUESS structure. Lines between boxes identify links between individual process, drivers, and parameters. Arrows indicate directionality. Dotted lines highlight links between processes in LPJ-GUESS that are replaced by an alternative structure in LPJ-GUESS-HYD. The light-blue diamonds indicate the hydraulic parameters introduced by LPJ-GUESS-HYD and defined in Table 1.
2.2.1 Water potential regulation
LPJ-GUESS-HYD incorporates the dynamic model for water potential regulation introduced by Papastefanou et al. (2020). This model operates on the principle that water transport from the roots through the stem to the leaves and into the atmosphere is dictated by a dynamically changing forcing pressure (Δψ(t); MPa):
where ψs(t) (MPa) and ψl(t) (MPa) are the respective soil and leaf water potential at time t. The gravitational pull is defined by , with ρ (kg m−3) referring to the density of liquid water, g (m s−2) the gravitational acceleration, and h (m) the canopy height. In situations with ample soil water supply, Δψ is denoted Δψmax, a parameter describing the average forcing potential under well-watered conditions.
Soil water potential is initially calculated as a function of soil water content according to Saxton et al. (1986) for each soil layer ly:
where A and B are functions of soil physical properties such as the clay and sand content (Eqs. A1 and A2; see Saxton et al., 1986) and wconttot (mm) is the sum of plant available soil water and the soil water content at the wilting point.
Subsequently, is weighted by the fraction of roots in that layer () to give the integrated soil water potential ψs:
where Nl is the number of soil layers.
The model assumes that the change in ψl over time depends on the difference between ψl and ψs such that
where (Table 1) is a component of the isohydricity of water potential regulation, with higher λ contributing to more isohydric behavior, and α (d−1) is a rate parameter controlling how quickly ψL adjusts to changes in ψs. As LPJ-GUESS-HYD runs on a daily time step, α is set to 1 (Papastefanou et al., 2024). To account for summergreen phenology, we expand upon Eq. (12) to include the daily phenological status:
where phen is the leaf phenological status as a fraction of full leaf cover from 0 (no leaves) to 1 (full leaf cover). Subsequently, equals ψs during winter dormancy. For evergreens, phen is always 1 and thus .
Next, we assume that the stem xylem water potential (ψx; MPa) is a function of following Fisher et al. (2006):
where b represents the ratio of resistance belowground (Rbg; m2 MPa s kg−1) to total plant resistance (Rp; m2 MPa s kg−1):
Table 1Definitions of the seven new hydraulic parameters introduced in LPJ-GUESS-HYD and the parameter ranges used in the sensitivity analysis. These ranges extend beyond the observed values for the 12 species used in this study in order to explore the model's reaction to as wide of a parameter range as possible. The data reference column indicates the source of the compiled ranges for each parameter.
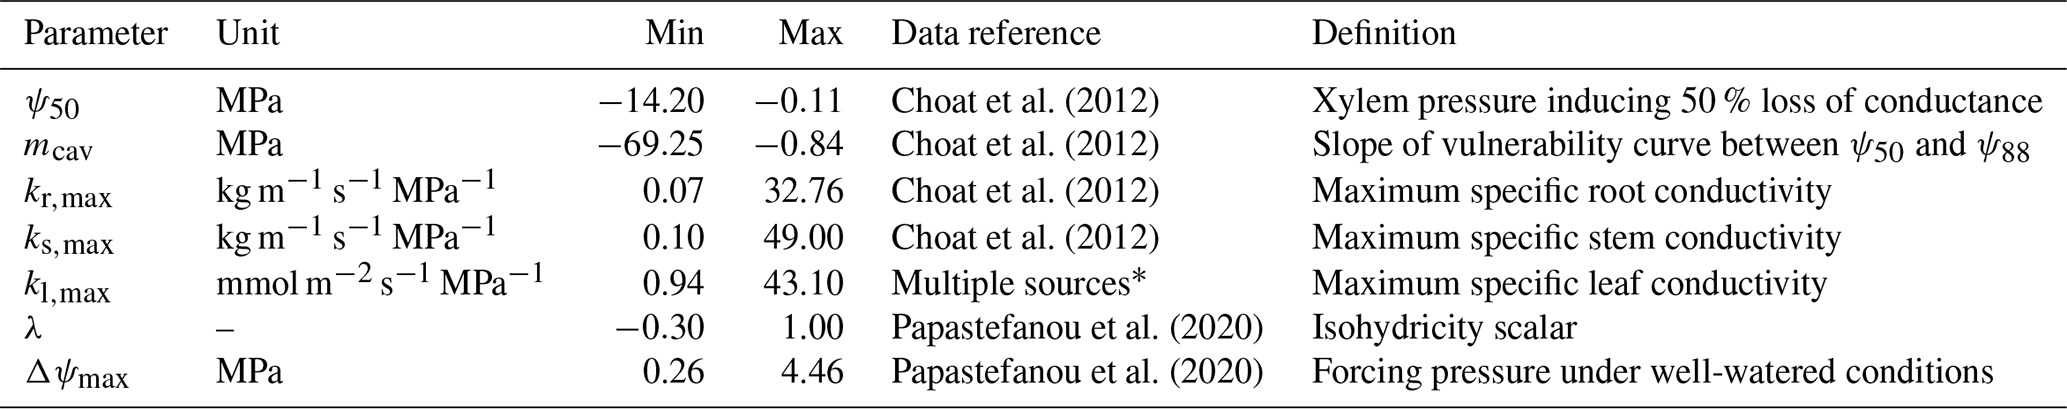
* Flexas et al. (2013), Méndez-Alonzo et al. (2019), Johnson et al. (2009, 2016), Scoffoni et al. (2011), Nolf et al. (2015), Blackman et al. (2010).
2.2.2 Water supply in LPJ-GUESS-HYD
LPJ-GUESS-HYD simulates the effect of hydraulic architecture on water transport through the plant using alternative formulations of Esu and Ede (from Eq.8).
The calculation of Esu is adopted from Hickler et al. (2006):
where Rr, Rs, and Rl are the hydraulic resistances of roots, stems, and leaves in m2 MPa s kg−1, respectively, and are defined as
and
where kr,max (kg m−1 s−1 MPa−1), ks,max (kg m−1 s−1 MPa−1), and kl,max (mmol m−2 s−1 MPa−1) are species-specific parameters describing the maximum potential conductance of each compartment (Table 1); plcr, plcs, and plcl are the fraction of cavitated vessels in each compartment; as, ar, and al are the cross-sectional area of sapwood, roots, and leaves in m2 m−2; ηa and ηn are the viscosity of water in the stem and soil; h (m) is the tree height; hsoil is the depth of the simulated soil column; and is the molar mass of water (mol kg−1).
The sum of resistances, denoted Rp, represents the total plant hydraulic resistance:
2.2.3 Water demand in LPJ-GUESS-HYD
The updated representation of Ede is based on the instructive form of the Penman–Monteith equation described by Köstner et al. (1992):
Eimp is the transpiration rate imposed by the effects of VPD, defined as
where Gv (m3 kPa kg−1 K−1) is the gas constant for water vapor and Tair (K) is the ambient air temperature. The term Ω is the degree of coupling between the canopy and the atmosphere (i.e., VPD) representing the leaf/canopy boundary layer, defined as
where ε is the change in latent heat relative to the change in sensible heat in air at 10 °C and ga (m s−1) is the aerodynamic conductance. Consistent with the new formulations of Ede and Esu, the calculation of gc is also updated. The assumption of the supply–demand principle underlying the original calculation of gc remains, but the new definition reflects the dependence of plant water transport on VPD and hydraulic architecture. This is obtained by equating Esu (Eq. 16) and Eimp (Eq. 22) and solving for gc, resulting in
where λlvh (kJ kg−1) is the latent heat of vaporization of water, γ (kPa K−1) is the psychrometric constant, cpair (kJ kg−1 K−1) is the specific heat of air, and ρair (kg m−3) is the density of air.
Subsequently, when the canopy conductance constrained by plant hydraulic processes (Eq. 24) is less than the nonstressed canopy conductance (Eq. 4), trees experience water limitation:
In this case, gc (Eq. 24) rather than gp (Eq. 4) is used in the photosynthesis calculation.
Through this representation of water supply and demand, the integrity of the plant's water transport system can directly affect the canopy conductance and, subsequently, carbon assimilation through photosynthesis.
2.2.4 Cavitation and mortality
The transport of water from the soil through the plant and into the atmosphere described by Eqs. (9–24) is susceptible to partial or total collapse when soil water availability (Eq. 2) is not sufficient to satisfy the transpiration demand (Eq. 21). During periods of water limitation when evapotranspiration outweighs water availability, soil water potential declines (Eq. 10). Modulated by the species-specific hydraulic strategy (λ, Δψmax), leaf and xylem water potential also react (Eq. 12). As ψs, ψx, and ψl decrease, conductance through the tree (Eqs. 17–19) is attenuated through higher resistance stemming from the onset of cavitation. Cavitation is represented as the percentage loss of conductance (plc) in dependence on ψx, modeled as a sigmoidal curve (see Tyree et al., 1994; Tyree and Sperry, 1989; Sperry et al., 1998; Pammenter and Van Der Willigen, 1998):
where ψ50 (MPa) and mcav (MPa) are species-specific parameters indicating the xylem water potential at which 50 % of conductance is lost and the slope of the vulnerability curve, respectively (Table 1). The slope parameter, mcav, is calculated as
where ψ88 (MPa) is the water potential at which 88 % of conductance is lost. To curb drought-induced cavitation during winter when processes related to hydraulic failure are assumed to play only a minor role, cavitation is only allowed to occur when gc is greater than gmin, the component of canopy conductance not associated with photosynthesis. With rising plc, the ability of plants to transport water is increasingly inhibited and eventually reaches a point of no return at which the inability to move water becomes lethal (Hammond et al., 2019; Wagner et al., 2023). The probability of fatal hydraulic failure (pmort) is modeled as a Weibull function following the results from Hammond et al. (2019):
where kw is a shape parameter and λw is a scale parameter. As plc approaches 100 %, i.e., total hydraulic failure, the probability of mortality tends toward 1.
2.3 Global sensitivity analysis
The new processes integral to LPJ-GUESS-HYD introduce seven new input parameters. To ascertain how these additions contribute to uncertainty in the model output, we perform a global sensitivity analysis on the new parameters. LPJ-GUESS simulates a large number of outputs suited for sensitivity analysis. Similarly to Oberpriller et al. (2022), we examine carbon- and water-related outputs (evapotranspiration, canopy conductance, NPP, and biomass) due to the importance of forests in the carbon cycle in governing fluxes and contributing to the carbon sink and their importance in the water cycle (Bonan, 2008; Pan et al., 2011; Pugh et al., 2019). We place a strong focus on water-related outputs due to the role of water use in modulating forest productivity, particularly under drought conditions (Lambers and Oliveira, 2019; Sulman et al., 2016). Sensitivities were calculated by sampling parameter sets from the multivariate parameter space using Latin hypercube sampling (LHS) (Helton and Davis, 2003; Mckay et al., 2000). LHS is a sampling technique that stratifies a parameter into equal, non-repeating intervals across its entire range. By randomly sampling each interval, LHS reduces bias and efficiently ensures full coverage of the parameter space. Compared to other sampling techniques (e.g., quasi-random numbers), LHS requires fewer samples to depict the “true” mean of the parameter range. Consequently, fewer simulations must be run, substantially reducing the computational effort required when working with complex models such as LPJ-GUESS-HYD (Saltelli, 2008). For each of the seven parameters, we estimated the potential parameter range based on previous studies using all values for species classified as trees in the corresponding data sources (Table 1).
Subsequently, we created 6000 parameter sets via LHS covering the entire multivariate parameter space. The parameter sets were recycled for each of the 12 species and 34 sites.
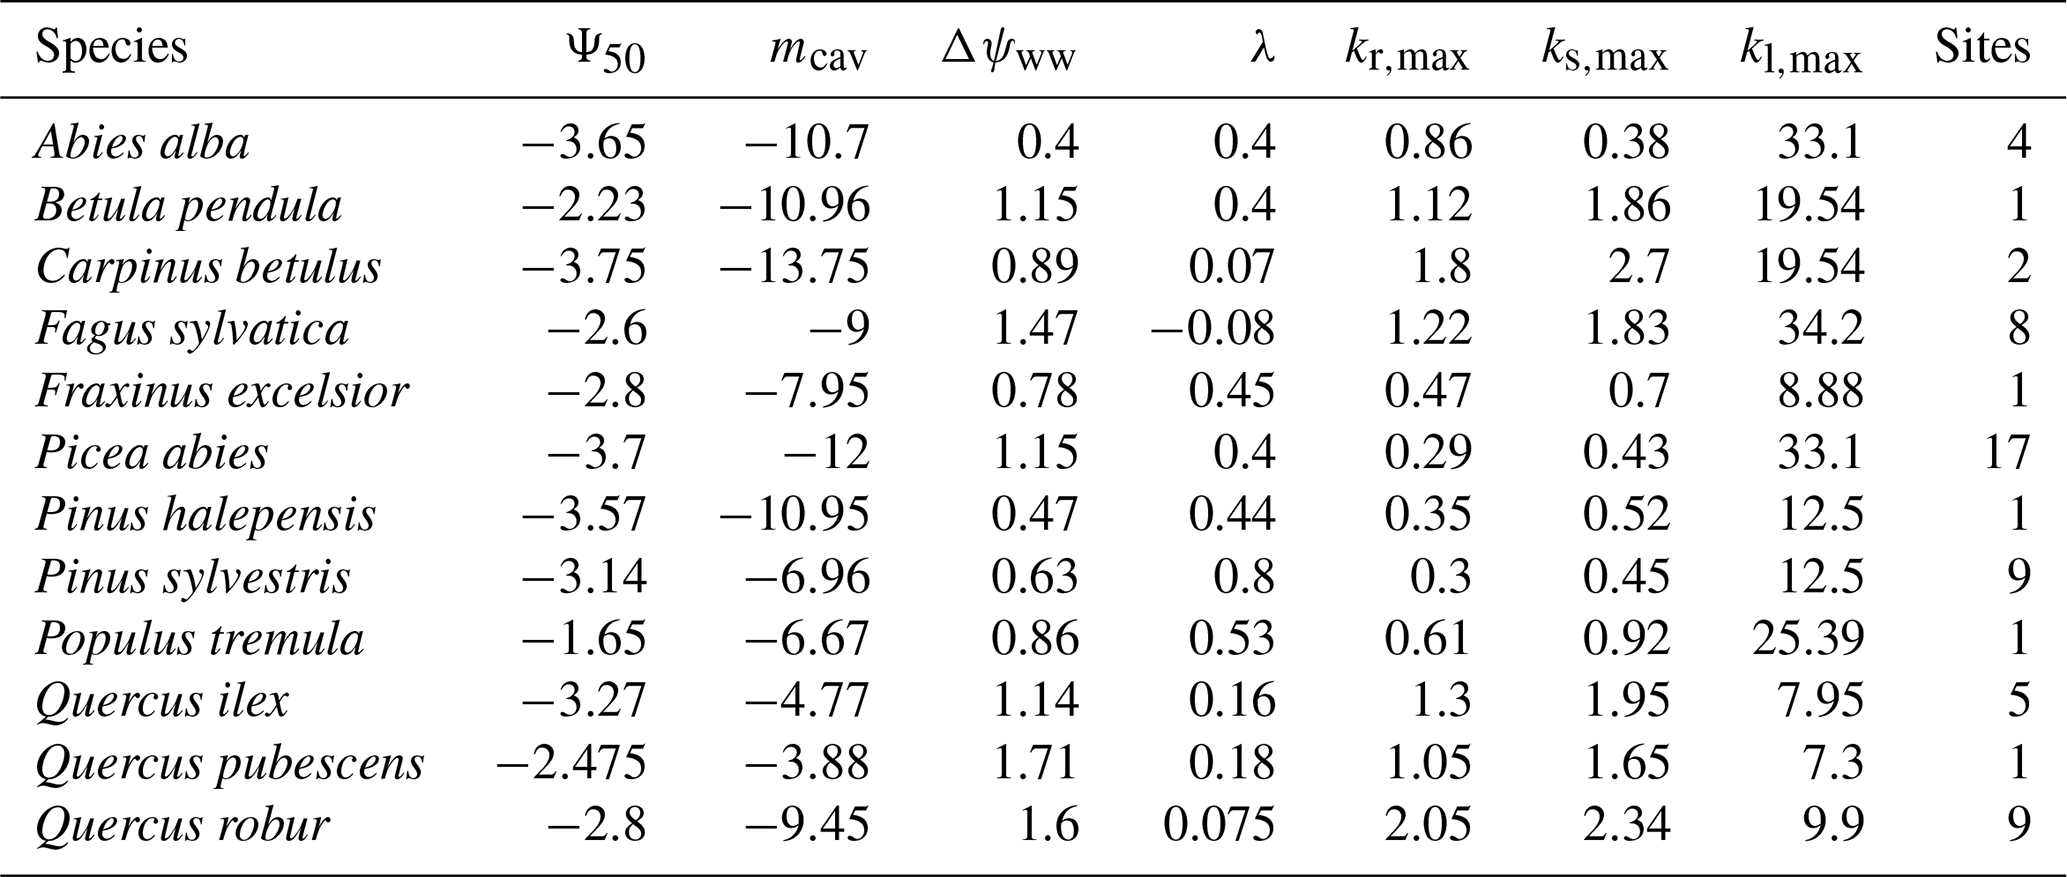
Table 2Best-estimate species values for the seven hydraulic parameters introduced in LPJ-GUESS-HYD and used in the comparison of LPJ-GUESS-HYD with the eddy covariance flux variables. For each species, the value used is the mean of all values present for that species extracted from the relevant database (see Table 1). Where no observation for a given species was available, the genus mean was used instead.
We chose the Sobol' indices to analyze the influence of parameter variations on the model output. This variance-based method can capture nonlinear processes and is particularly suitable for nonadditive models, i.e., models with interaction effects between the individual parameters such as the one (i.e., LPJ-GUESS-HYD) investigated here (Saltelli, 2008). To calculate the sensitivity indices, LPJ-GUESS outputs needed to be condensed into a singular value per simulation (i.e., per parameter set). Flux variables (gross primary productivity (GPP), evapotranspiration, and canopy conductance) were averaged over all years in the simulation period, while the last year of the simulation was used for biomass. We calculated three sensitivity indices for each combination of the output variable, species, and site. First- and second-order estimates were calculated using the estimator method introduced by Saltelli et al. (2010). Total-order indices were computed following the method by Jansen (1999). First-order indices measure the contribution of a single parameter to the variance in the model output, excluding any interactions with other parameters. Similarly, second-order indices measure the contribution of the interaction between two parameters to the variation in model output. Lastly, total-order indices measure the contribution of a single parameter, including all its interactions with other parameters, to variation in the model output (Saltelli, 2008). In practical terms, these interactions refer to instances where separate parameters jointly affect a given model process or a given model output. For example, leaf water potential regulation in LPJ-GUESS-HYD (Eq. 12) is driven in part by λ and Δψmax. In this case, the first-order index for each parameter quantifies that parameter's individual contribution to Eq. (12). The second-order index then quantifies the joint effect of the two parameters on Eq. (11). This concept also extends beyond single, self-contained processes. That is, since, for example, both the water potential gradient between leaf and soil (governed by λ and Δψmax; Eqs. 9, 11, and 12) and the total plant resistance (governed by kr,max, ks,max, and kl,max; Eqs. 17–19) affect canopy conductance, the joint effect of any combination of these five parameters on canopy conductance can be quantified using either the second-order or total-order indices. The sensitivity indices range between 0 (least influential) and 1 (most influential) and depict the proportion of variance in the model output attributed to variations in a given parameter or the interactions of parameters. By sampling the parameters independently of one another, i.e., by allowing each parameter to vary independently of any other parameter in the same parameter set, we avoid collinearity biasing the sensitivity indices. To establish significance, we calculated sensitivity indices for a dummy parameter (i.e., a parameter that has a relationship to the model). First- and second-order indices for the parameters analyzed were considered significant only if their value was higher than the indices for the dummy parameter. We used the sensobol R package to sample the 6000 parameter sets and compute the sensitivity indices (Puy et al., 2022).
2.4 Simulation protocol and model evaluation
To test the functionality of LPJ-GUESS-HYD across a wide range of species, we selected 12 common forest tree species from boreal, temperate, and Mediterranean ecosystems and extracted the relevant parameters from available plant trait databases (Table 2). Using data from plant trait databases to parameterize models can have potential pitfalls due to the variety of methods used in the original analyses contributing the data (Cochard et al., 2013). To account for this, we ran an additional simulation using the same parameters displayed in Table 2 but with the ψ50 values from Martin-StPaul et al. (2017) where such artifacts have been removed.
We chose sites to simulate from the ICOS Warm Winter 2020 ecosystem eddy covariance flux due to the availability of observational data for the evaluation of the model at those sites (Warm Winter 2020 Team and ICOS Ecosystem Thematic Centre, 2022). We selected sites at which at least 1 of the 12 target species was present. This yielded 34 individual sites, each of which included a varying number of species, yielding a total of 55 unique species–site combinations. To avoid the confounding effects brought on by competition between species, each species at each site was simulated separately. For the sensitivity analysis, we repeated the simulation of each species–site combination for all 6000 parameter sets. For evaluation of the model against the eddy covariance flux data, we used a set of best-estimate parameters compiled from the published literature for each species (Table 2). The forcing data and general simulation procedure were the same for both sets of simulations.
The simulation period was from 1989 to 2020. To ensure the near-equilibrium state of the simulated ecosystem at the start of the simulation period, we spun up the model for 1000 years by recycling the first 30 years of the climate inputs, following the standard procedure for LPJ-GUESS.
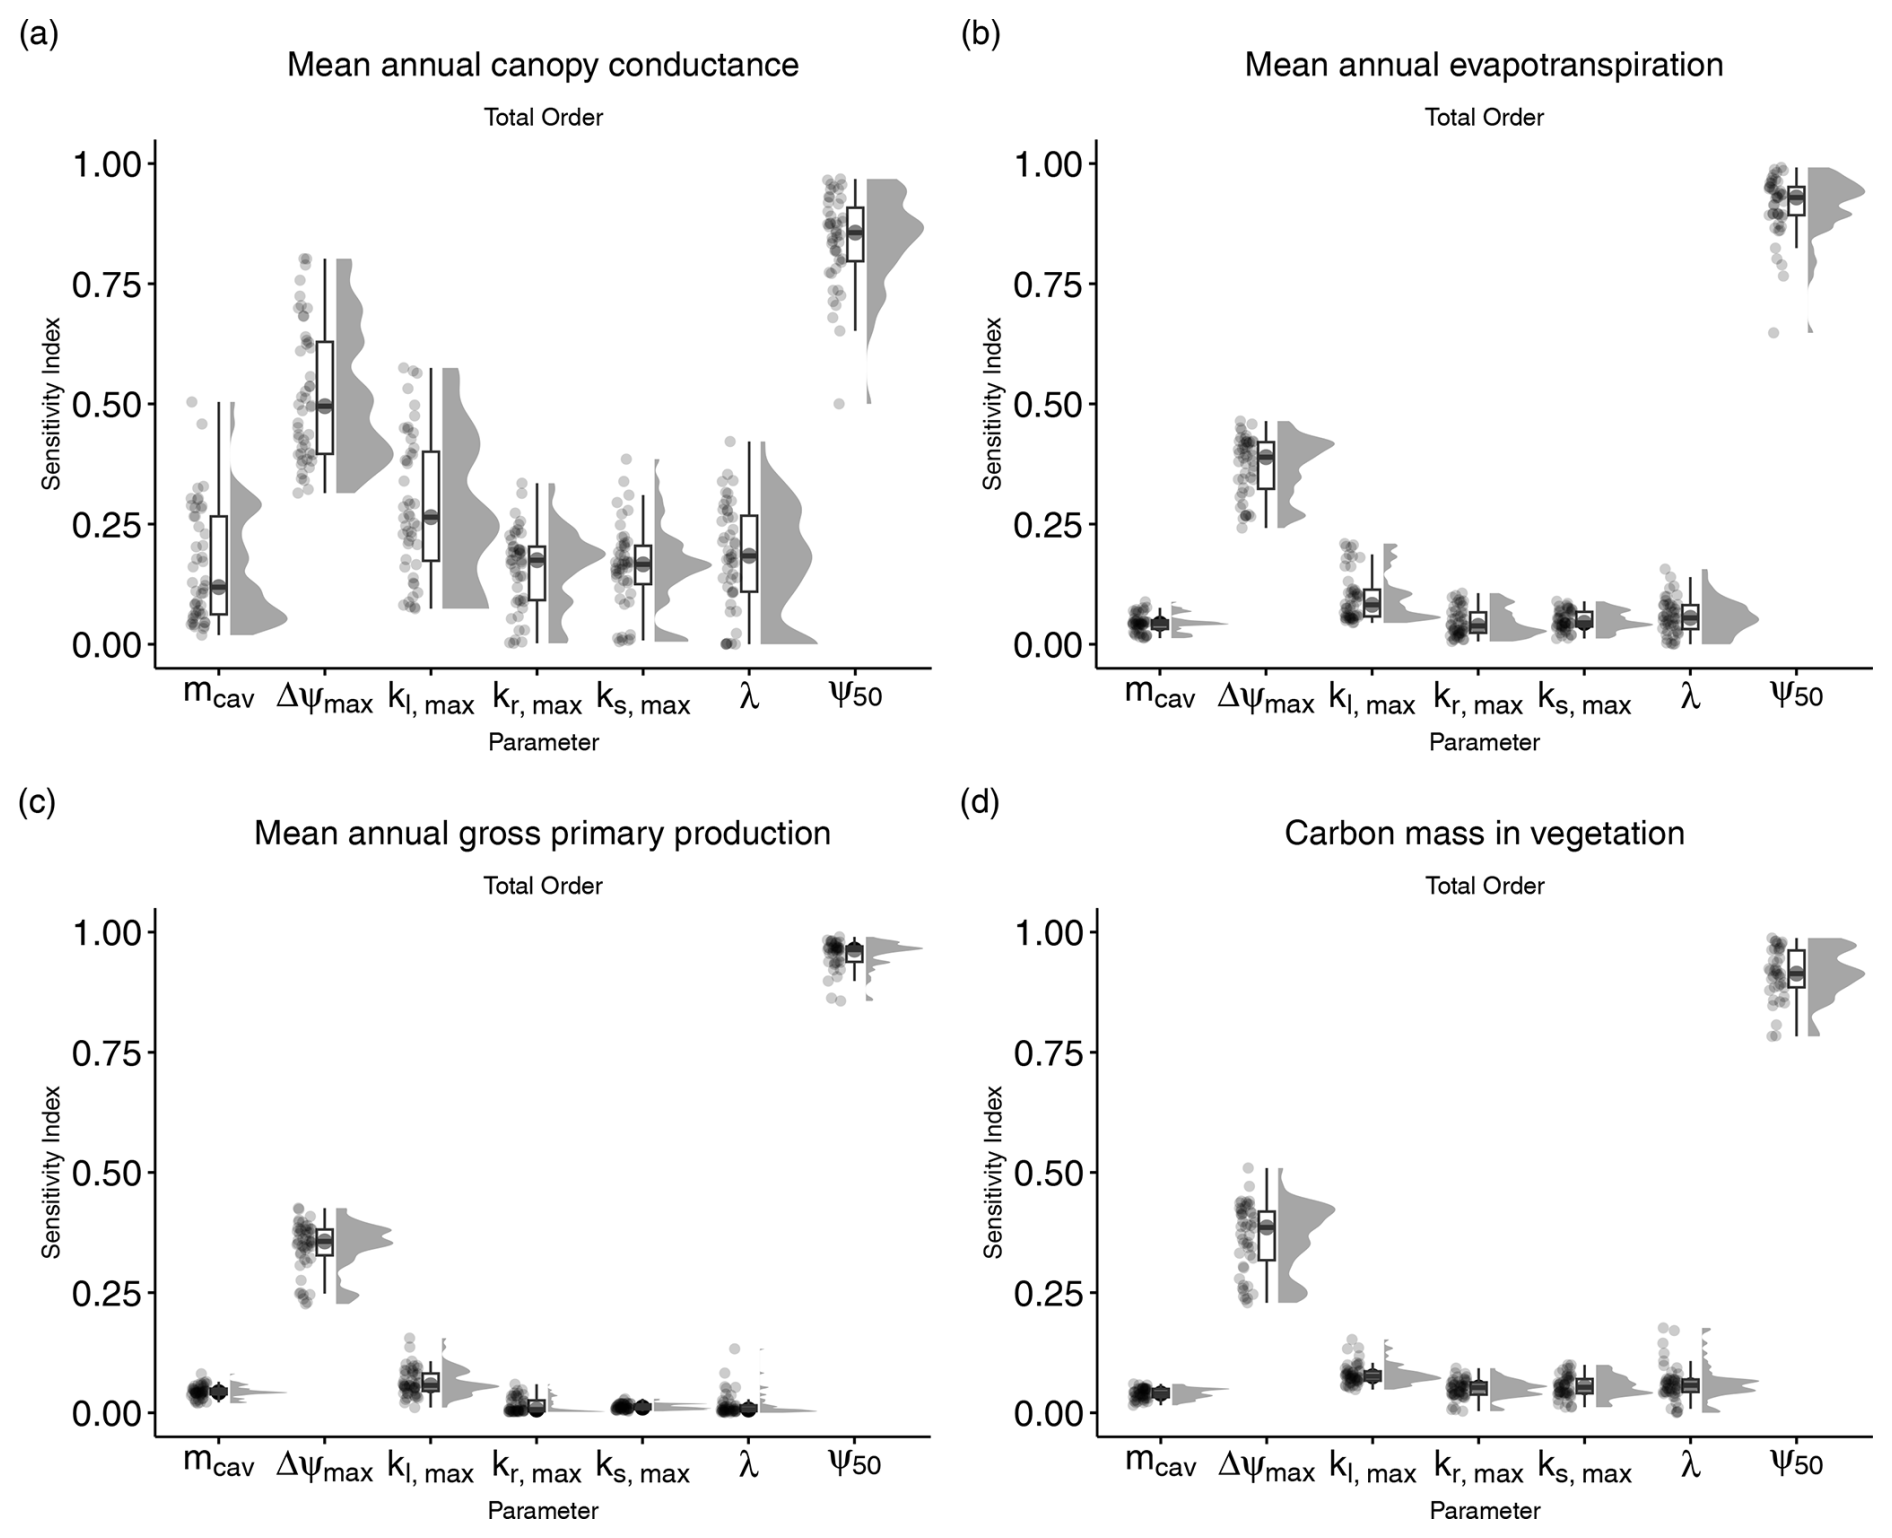
Figure 2Total-order sensitivity indices for the seven parameters introduced in LPJ-GUESS-HYD. Total-order indices indicate the sensitivity of model output to variation in a given parameter, including any and all interactions with other parameters. Each point represents the sensitivity index for a single species–site combination. The boxplots indicate the median and interquartile range of the sensitivity indices across species–site combinations. Each panel shows the sensitivity indices for a single model output: (a) mean annual canopy conductance, (b) mean annual evapotranspiration, (c) mean annual gross primary productivity, and (d) carbon mass in vegetation.
We forced both LPJ-GUESS and LPJ-GUESS-HYD with ERA-Interim daily mean surface temperature, precipitation sum, shortwave radiation, average wind speed, pressure, and specific humidity, which were downscaled to the specific site coordinates and provided with the eddy covariance flux data (Warm Winter 2020 Team and ICOS Ecosystem Thematic Centre, 2022; Pastorello et al., 2020). Atmospheric CO2 concentrations were taken from NOAA (Lan et al., 2023), and nitrogen deposition data were taken from Lamarque et al. (2011). Soil properties (e.g., clay, sand, and silt fraction; soil carbon content; and bulk density) were taken from the Harmonized World Soil Database v2.0 and aggregated by mode to match the 0.5° by 0.5° spatial resolution of the climate inputs (IIASA, 2023).
From the ICOS Warm Winter 2020 dataset, we extracted the daily GPP averaged from half-hourly data and partitioned via the nighttime partitioning method and daily evapotranspiration derived from the observed latent heat flux (Allen et al., 1998) against which to evaluate simulated GPP and evapotranspiration (Pastorello et al., 2020).
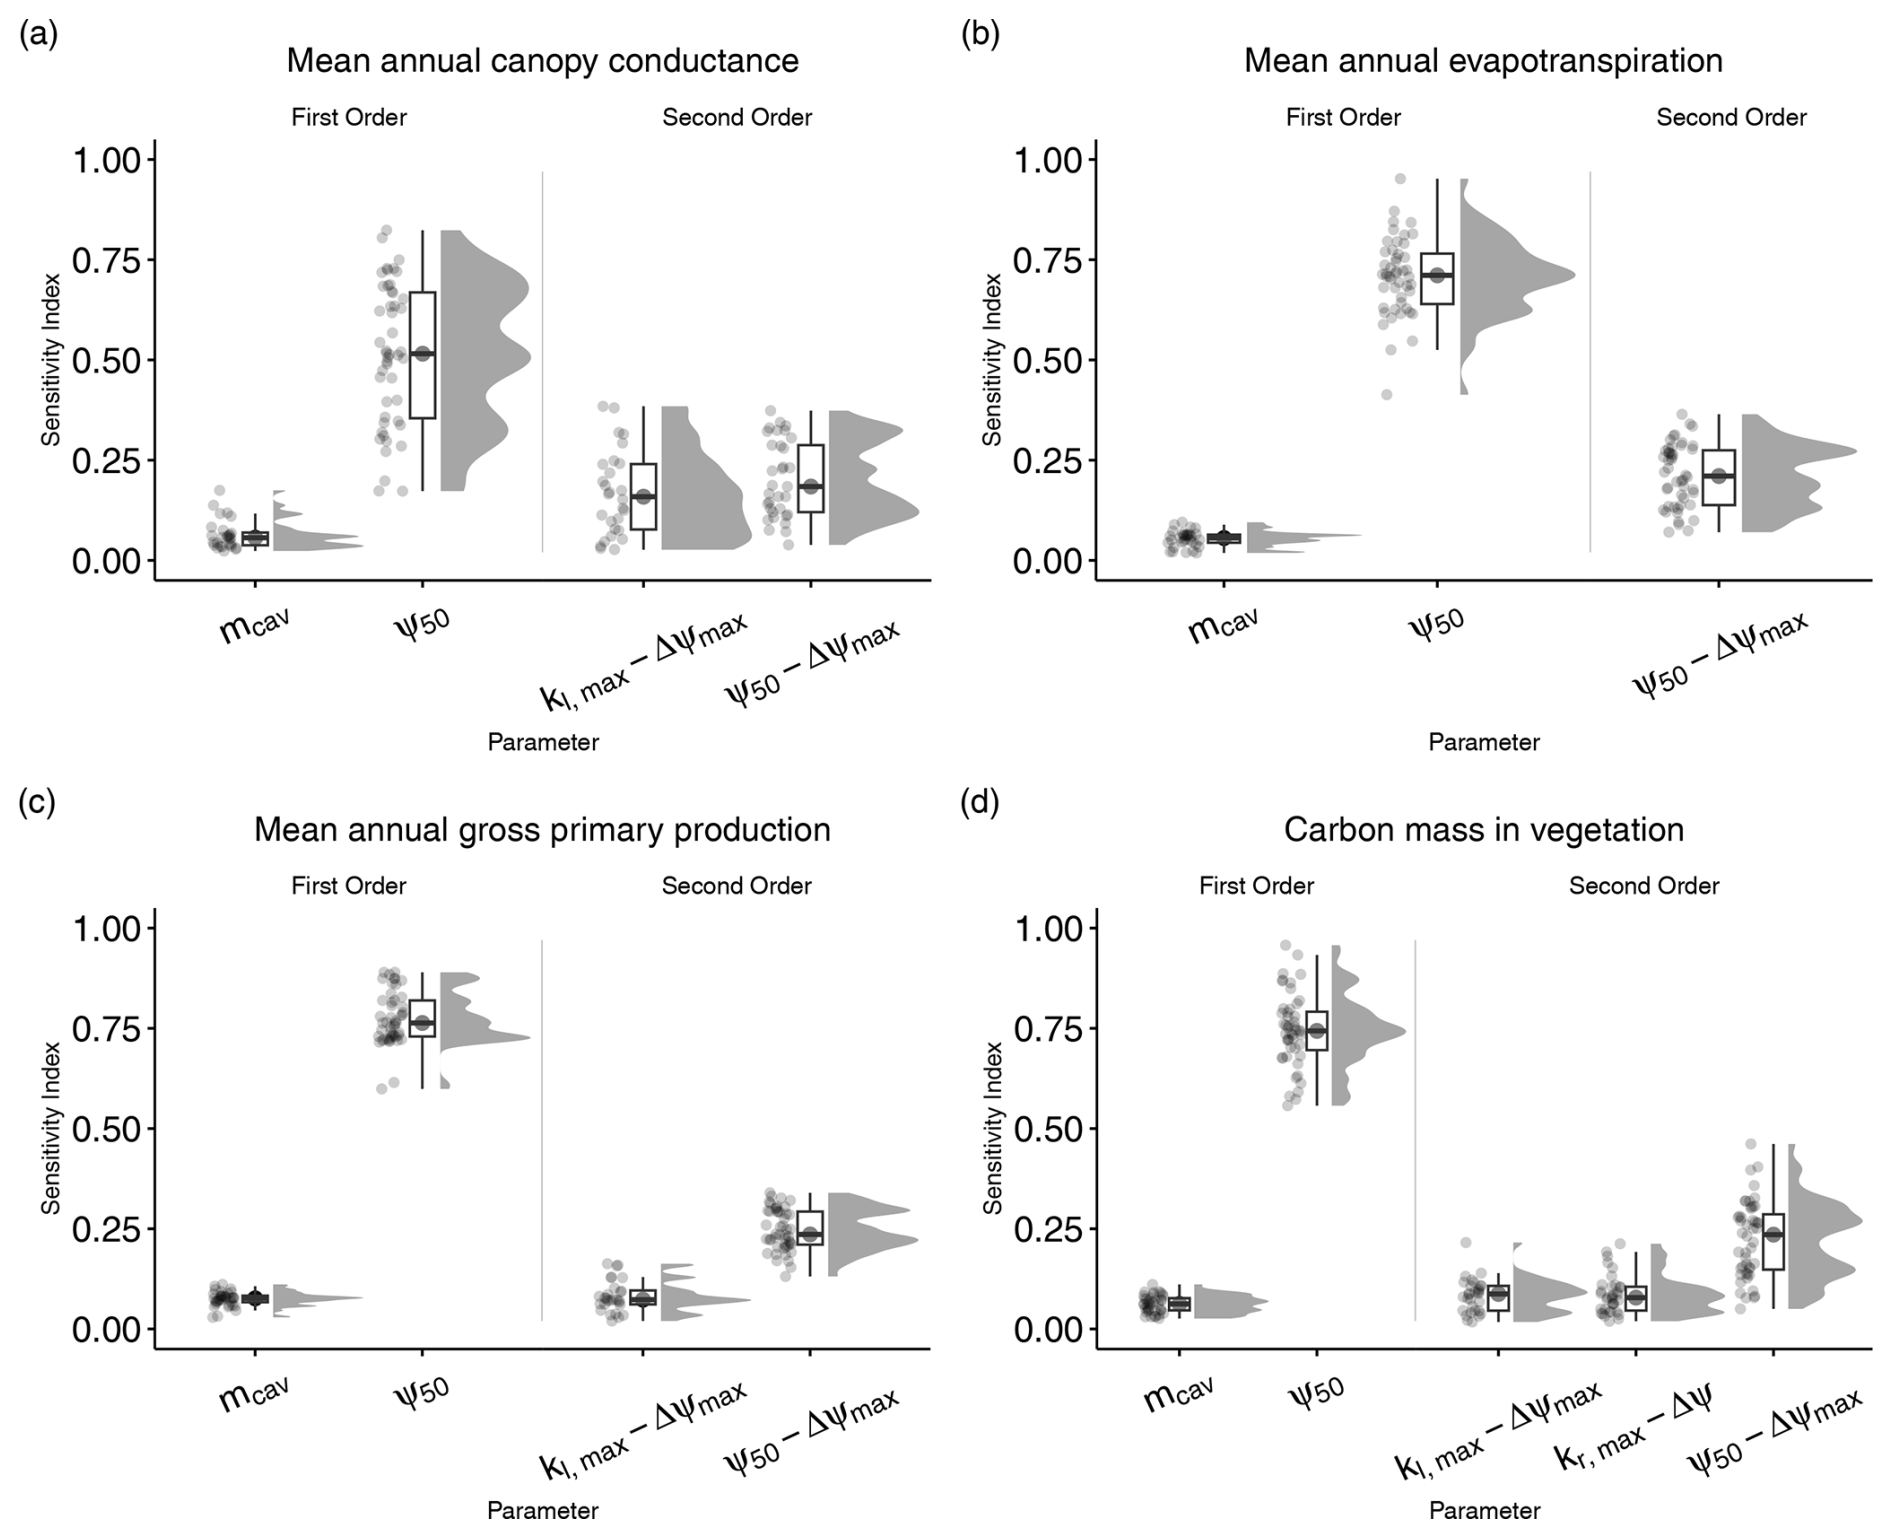
Figure 3First- and second-order sensitivity indices for the seven parameters introduced in LPJ-GUESS-HYD. First-order indices indicate the sensitivity of model output that is solely due to variations in a single parameter. Second-order indices only consider variation in the output that is attributable to interactions between two parameters. First- and second-order indices are only shown for parameters with a median sensitivity greater than the median sensitivity of a dummy parameter (see Methods for details). Each point represents the sensitivity index for a single species–site combination. The boxplots indicate the median and interquartile range of the sensitivity indices across species–site combinations. Each panel shows the sensitivity indices for a single model output: (a) mean annual canopy conductance, (b) mean annual evapotranspiration, (c) mean annual gross primary productivity, and (d) carbon mass in vegetation.
3.1 Sensitivity analysis
Of the seven parameters introduced in LPJ-GUESS-HYD, only two (ψ50 and Δψmax) consistently contributed to variance across various model outputs (Fig. 2). Carbon mass in vegetation was most sensitive to variations in ψ50. Across all sites and species, the median contribution of ψ50 to variation in carbon mass in vegetation, including all interactions with other parameters, was 93.2 % (Fig. 2a). Excluding any interactions with other parameters, 75 % of the variance in carbon mass in vegetation was attributable solely to ψ50 (Fig. 3a). Considering all possible interactions, Δψmax and kl,max were the second-most- (37.7 %) and third-most-influential (9 %) parameters for carbon mass in vegetation, respectively. However, no substantial first-order influence of either Δψmax or kl,max was found (Fig. 3a). Generally, the analysis revealed similar patterns of total-order sensitivity for GPP and evapotranspiration. In all cases, ψ50 contributed the most to the variability in the output. Larger differences only manifested themselves in the sensitivity of canopy conductance. While canopy conductance only showed significant first-order sensitivity to ψ50, it displayed a number of significant second-order sensitivities (Fig. 3c). Additionally, all sensitivity indices (total, first, and second) displayed a larger spread across species and sites for canopy conductance than for any of the other variables (Figs. 2d and 3d). Importantly, while the sensitivity indices for ψ50 by far outweighed those of the other parameters for GPP, evapotranspiration, and vegetation carbon, the relative sensitivity of canopy conductance to ψ50 compared to the other parameters was more balanced.
Although the total-order indices indicated that mcav contributed only marginally to output variance, the first-order indices revealed that mcav on its own did, in fact, lead to significant, albeit low, variance in all model outputs (Fig. 3). For all output variables considered, second-order interactions consistently included ψ50 and Δψmax (Fig. 3), while only two other parameters, kl,max and kr,max, occasionally featured in the second-order indices (Fig. 3).
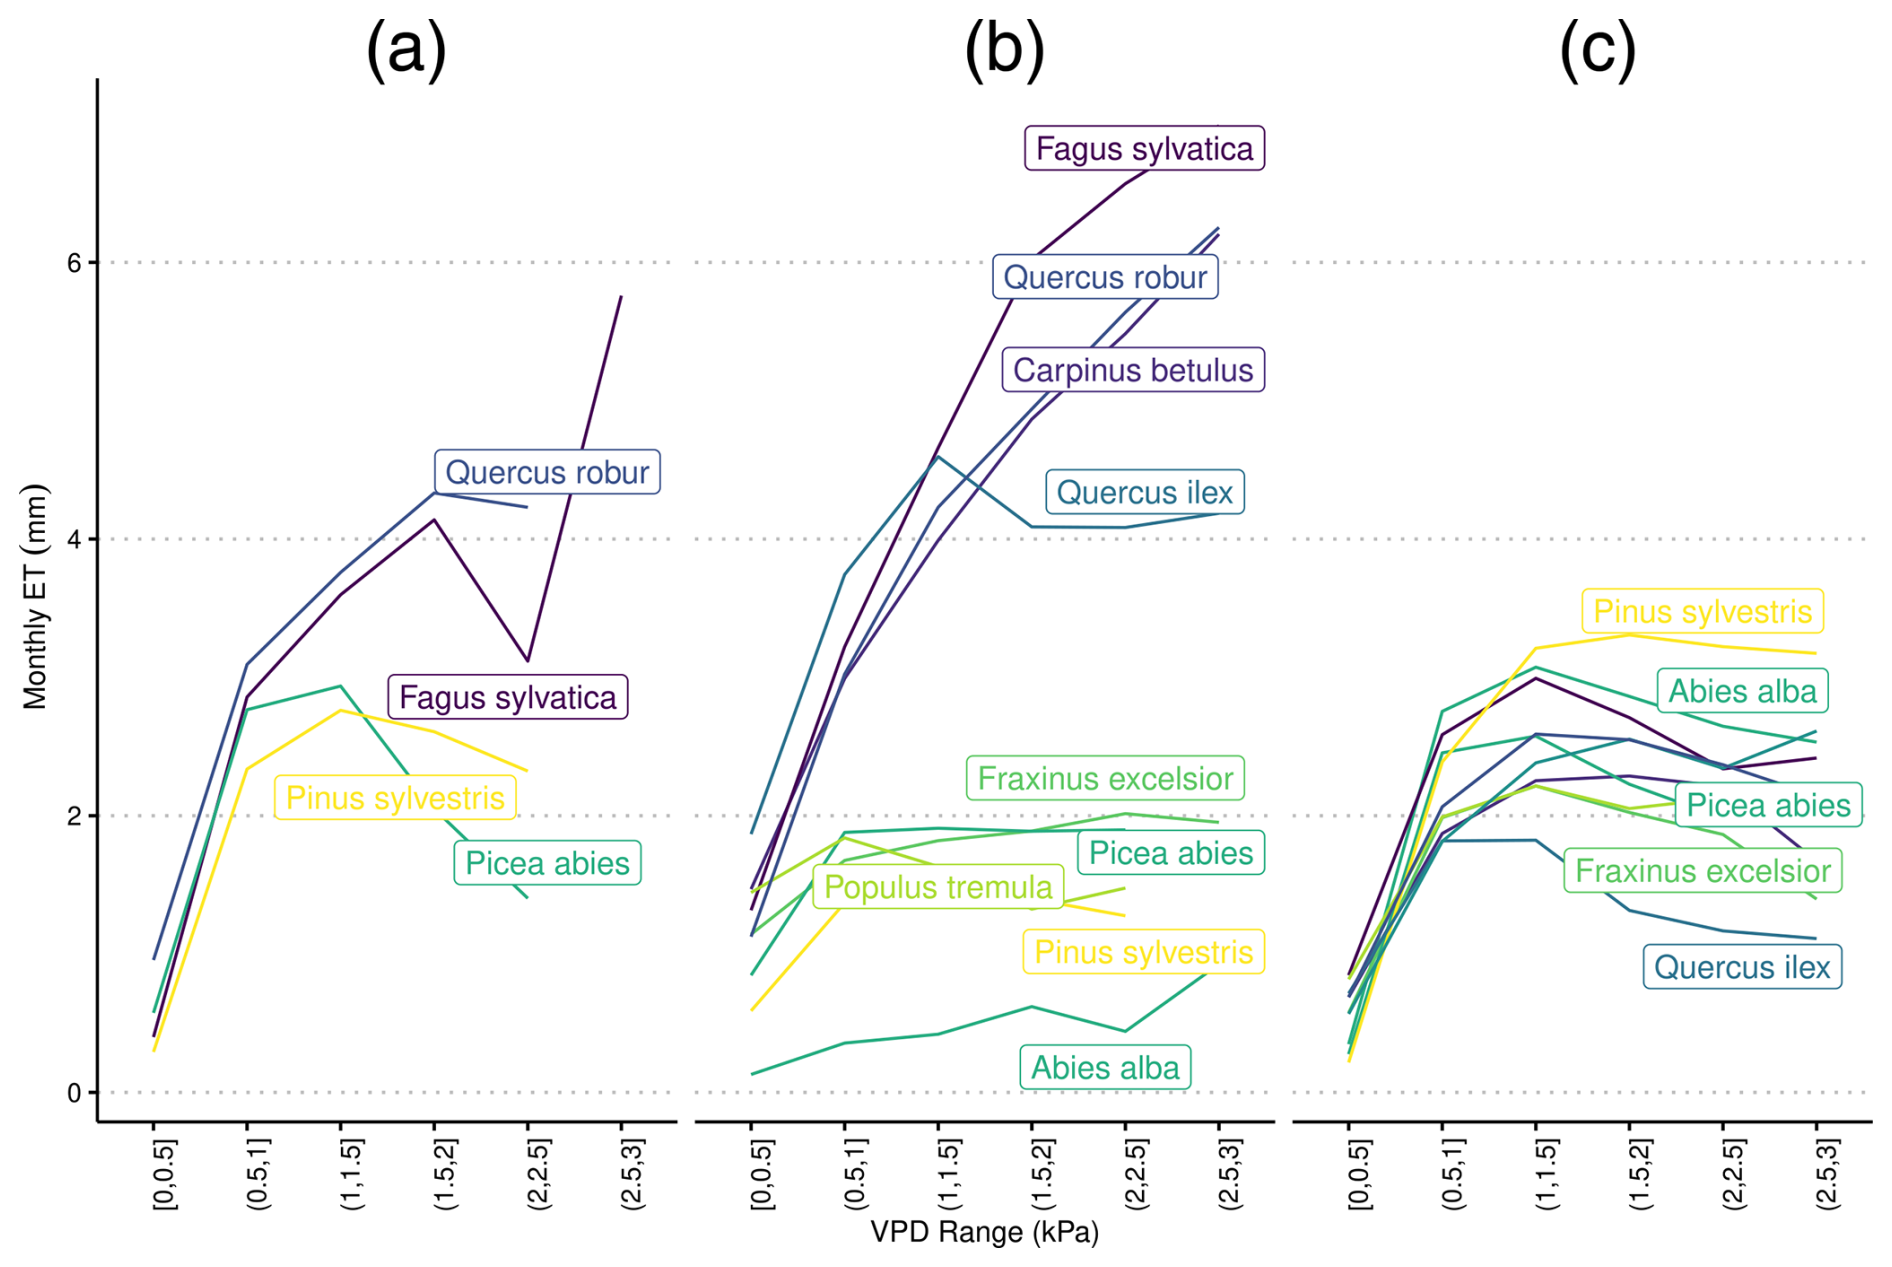
Figure 4Species-specific daily evapotranspiration rates under differing levels of vapor pressure deficit from (a) eddy covariance flux towers, (b) LPJ-GUESS-HYD, and (c) standard LPJ-GUESS. The colors are ranked according to the λ of each species (see Fig. 2) from high λ (light) to low λ (dark). Daily VPD was binned into six equally sized classes representing increasing levels of drought. Species-specific responses to drought remain constant in LPJ-GUESS, while clear differences between more anisohydric and more isohydric species are seen in LPJ-GUESS-HYD.
3.2 Evapotranspiration response to VPD
In LPJ-GUESS-HYD, evapotranspiration patterns of individual species were largely governed by the species-specific response to VPD (Fig. 4b). With increasing VPD classes, i.e., higher atmospheric demand for water, the spread of evapotranspiration patterns between species increased. While more isohydric species (e.g., Pinus sylvestris, Abies alba, and Populus tremuloides) only marginally increased their evapotranspiration rates under higher VPD, more anisohydric species (e.g., Fagus sylvatica, Quercus spec.) tended to increase their evapotranspiration rates under higher VPD. In contrast, in LPJ-GUESS (Fig. 4c), although some species-specific differences in evapotranspiration rate were simulated, the general VPD response pattern was the same across all species; evapotranspiration increased with increasing VPD up to ∼1.5 Pa and subsequently leveled off even as VPD continued to increase (Fig. 4c). Additionally, no clear pattern related to isohydricity was seen in LPJ-GUESS. Under high VPD, the highest evapotranspiration rate was seen in an ostensibly more isohydric species, Pinus sylvestris, while the second-highest rate was exhibited by Quercus pubescens, a relatively anishoydric species. Monospecific eddy covariance flux sites were only available for a limited number of species (Fig. 4a). Here, more anisohydric species tended to continue transpiring even as VPD increased, while more isohydric species reached maximum transpiration rates at relatively low levels of VPD and displayed decreasing evapotranspiration as VPD continued to increase. Under high VPD (∼3 kPa), the evapotranspiration simulated by LPJ-GUESS-HYD ranged from 0.9 to 7 mm d−1. The range in LPJ-GUESS was considerably smaller, ranging from 1.4 to 3.2 mm d−1. For the eddy covariance flux data, observations at a VPD of ∼3 kPa were only available for Fagus sylvatica, which transpired 5.8 mm d−1 at that VPD level.
3.3 Comparison of model results with observational data from eddy covariance towers
The comparison of evapotranspiration simulated by LPJ-GUESS(-HYD) with evapotranspiration from the eddy covariance flux product in 3 pan-European drought years revealed contrasting results (Fig. 5). Across all sites, species, and drought years, the observed daily growing season evapotranspiration ranged from ∼1.20 to ∼3.54 mm d−1. LPJ-GUESS-HYD simulated a similar range (∼1.14–∼4.45 mm d−1), while LPJ-GUESS simulated a narrower range (∼1.50–∼2.33 mm d−1). Compared to the eddy covariance product, both LPJ-GUESS and LPJ-GUESS-HYD displayed a similar level of mismatch, with root-mean-square errors (RMSEs) of 0.70 and 0.84 mm d−1, respectively. However, while LPJ-GUESS consistently underestimated the observed evapotranspiration (mean signed deviation (MSD): −0.44), LPJ-GUESS-HYD showed a less negative bias (MSD: −0.06). For GPP, both LPJ-GUESS and LPJ-GUESS-HYD show similar patterns broadly matching the observations. The RMSE for GPP was similarly low for both LPJ-GUESS and LPJ-GUESS-HYD, 0.0017 and 0.0021, respectively. For both model versions, the MSD indicated no substantial over- or underestimation of the observations (LPJ-GUESS: −0.0003; LPJ-GUESS-HYD: −0.0007).
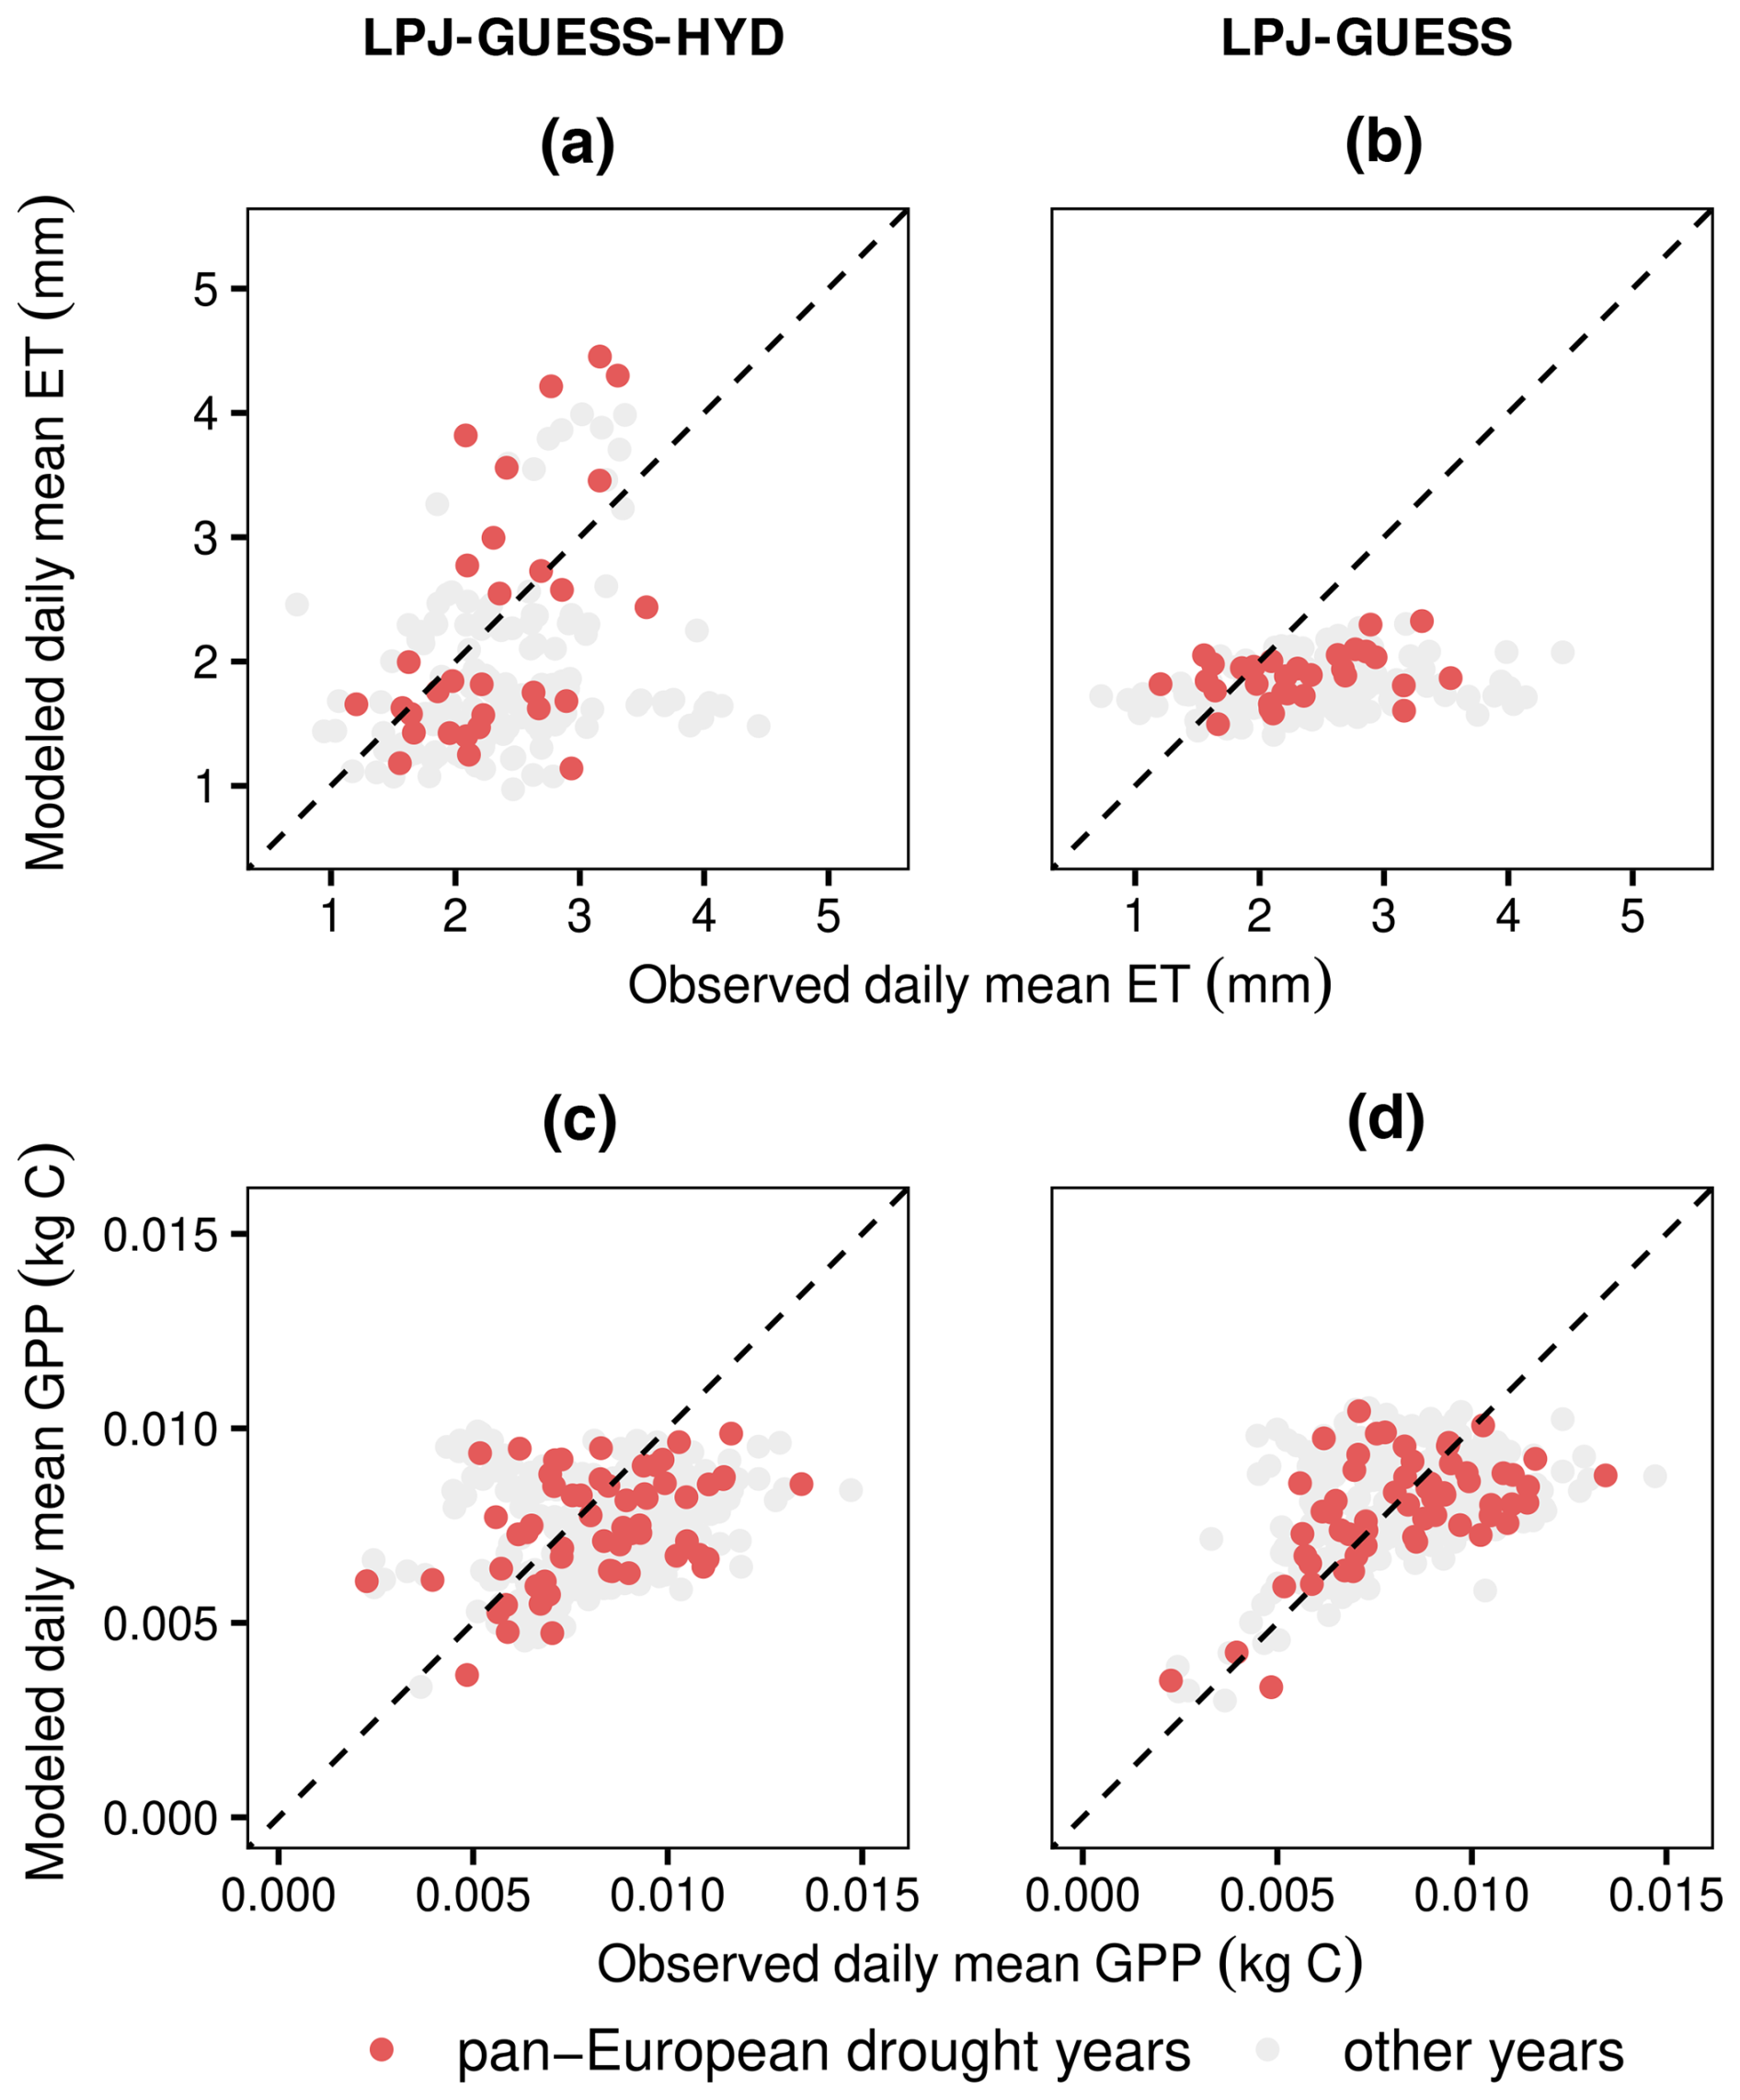
Figure 5Comparison of measured eddy covariance flux values of ET and GPP with modeled values from LPJ-GUESS-HYD (a, c) and LPJ-GUESS (b, d). LPJ-GUESS-HYD (a) matches observed ET patterns better than standard LPJ-GUESS (b) during the 3 pan-European drought years, while simulated GPP remains similar between both versions of the model (c, d). The dotted black line indicates perfect agreement between the model and observations. Values above the dotted line represent instances where the model overestimates ET (GPP) compared to the observations and vice versa. Each dot corresponds to a single year and site and represents the average daily value over the growing season.
We conducted an evaluation of the newly developed plant hydraulic architecture version of LPJ-GUESS, LPJ-GUESS-HYD, through a variance-based global sensitivity analysis and model evaluation for carbon and water fluxes at 34 eddy covariance flux sites across Europe.
4.1 Relevance of hydraulic parameters
The results of our sensitivity analysis showed that of the seven newly introduced parameters (Table 1), two (ψ50, Δψmax) consistently contributed substantially to the variance in model outputs either directly (Fig. 3) or indirectly (Fig. 2). Similarly, second-order interactions for all outputs included primarily those aforementioned parameters. Substantial differences in parameter importance were only seen for mean annual canopy conductance. Although the two previously mentioned parameters still contributed the most to the variance in simulated canopy conductance, nearly all other parameters played a substantial role as well (Fig. 2a). Additionally, across all sites and species, the sensitivity indices varied to a greater extent in the case of canopy conductance than in the other outputs (Figs. 2 and 3). This pattern suggests that the relative influence of the new parameters is most evenly spread in model processes closely related (e.g., canopy conductance; see Fig. 1) to the newly implemented plant hydraulic architecture. That is, while processes like carbon allocation to biomass, which are further downstream of the new implementations, are primarily affected by a single parameter (ψ50), processes like canopy conductance, which are directly affected by the new implementations, are more sensitive to a greater number of the newly implemented parameters because the influence of these parameters is less diluted by other contributing model processes (e.g., plant demography), as is the case with the carbon allocation.
Strikingly, the LPJ-GUESS-HYD output was by far most sensitive to variations in ψ50, with roughly 75 % of the variance in evapotranspiration (ET), GPP, and vegetation carbon being attributable to changes in ψ50 alone (Fig. 3). While not directly comparable, this aligns with both a previous meta-analysis suggesting that ψ50 was the single-most-effective predictor of tree drought mortality (Anderegg et al., 2016) and previous modeling efforts indicating that ψ50 substantially influenced modeled xylem embolism (Cochard et al., 2021). The meta-analysis additionally indicated that ks,max played only a small role in determining tree mortality due to drought (Anderegg et al., 2016), a result partially supported by our sensitivity analysis showing that ks,max has a negligible influence on drought mortality. Although our analysis focused on water and carbon fluxes rather than outright mortality, these findings complement each other, as they suggest that the traits that are responsible for impairing water transport and assimilation under drought stress are the same traits that ultimately determine whether a tree will experience drought damage or eventually die under prolonged drought.
The model's strong sensitivity to the maximum possible soil-to-leaf water potential difference, Δψmax, is less intuitive. Along with the conductivity of roots, the stem, and leaves, the soil-to-leaf water potential difference, also referred to as the forcing pressure, plays a role in regulating the supply of water through the tree (Joshi et al., 2022; Da Sois et al., 2024). Why, then, does the model sensitivity to Δψmax overshadow the sensitivity to the parameters that govern conductivity, namely, kr,max, ks,max, and kl,max? This divergent response can be explained by the relationship of Δψmax and ψ50 in LPJ-GUESS-HYD. Primarily, Δψmax determines how tightly (or loosely) simulated leaf water potential is coupled to simulated soil water potential (Eq. 12), affecting the degree of isohydricity. At a given soil water potential, species with a higher Δψmax (i.e., looser coupling) will have a lower leaf water potential than species with a lower Δψmax (i.e., stronger coupling). Due to the relationship between leaf water potential and xylem water potential in LPJ-GUESS-HYD (Eq. 14), this means that the value of Δψmax, which influences leaf water potential (Eq. 12), indirectly determines the xylem water potential and therefore affects the process of xylem cavitation. This is backed up by the significant second-order interactions between ψ50 and Δψmax (Fig. 3). As Mcdowell et al. (2008) point out, the soil-to-leaf water potential difference, Δψ, tends to increase with increasing transpiration until a critical xylem tension is reached, leading to cavitation and, consequently, the hydraulic conductance approaching zero. It follows that as the actual hydraulic conductance approaches zero, the maximum possible hydraulic conductance specified by kr,max, ks,max, and kl,max loses relevance. Indeed, this finding matches existing evidence from model sensitivity analyses indicating that parameters related to xylem safety and stomatal regulation explained a substantial fraction of the model variability, while whole-plant conductance (i.e., kr,max, ks,max, and kl,max in our study) played a lesser role (Ruffault et al., 2022).
To reiterate, the results of the sensitivity analysis indicate that two of the hydraulic parameters introduced in LPJ-GUESS-HYD, namely Δψmax and ψ50, substantially shape long-term model behavior. These results imply that accurate estimations or, in the best case, measurements of these two parameters are important to reliably modeling plant hydraulics with LPJ-GUESS-HYD. Indeed, although using the arguably better parameterizations for ψ50 from Martin-StPaul et al. (2017) (Fig. A2) did not alter the general pattern of modeled evapotranspiration from LPJ-GUESS-HYD reflecting the anisohydric–isohydric continuum, the evapotranspiration response to VPD of individual species was affected by this alternative parameterization (e.g., Quercus ilex; Fig. A2b). What our sensitivity analysis cannot provide answers to, however, is how model sensitivity may change under stressed vs. non-stressed conditions. That is, does the pattern of influential parameters remain the same during drought conditions compared to during non-drought conditions? To answer this, subsequent modeling endeavors specifically contrasting various climatic conditions are required.
4.2 The role of hydraulic architecture for carbon and water fluxes
The results of our sensitivity analysis show that simulated water and carbon fluxes from LPJ-GUESS-HYD are primarily influenced by hydraulic function – via ψ50 – and secondarily by stomatal regulation – via Δψmax. These results are largely in line with findings from experiments and observations that repeatedly and consistently identify hydraulic failure as the preeminent factor governing tree drought mortality (Anderegg et al., 2016, 2015; Choat et al., 2012; Hammond et al., 2019; Adams et al., 2017).
However, the importance of Δψmax in our model analysis also aligns with the ample evidence that stomatal regulation is critical to the mediation of drought responses of forests (Körner, 2019; Hajek et al., 2022; Mcdowell et al., 2008). The sensitivity of LPJ-GUESS-HYD to these widely supported mechanisms of tree drought response suggests that LPJ-GUESS-HYD should be able to correctly simulate drought and its associated impacts across a range of different species and hydraulic strategies.
To demonstrate the ability of LPJ-GUESS-HYD to model drought responses across hydraulic strategies, we analyzed the effect of increasing VPD on simulated evapotranspiration in both LPJ-GUESS-HYD and standard LPJ-GUESS (Fig. 4). This analysis effectively showed that while LPJ-GUESS displayed nearly identical VPD response trajectories across all species, LPJ-GUESS-HYD exhibits distinct trajectories. This can be explained, for one, by the absence of VPD as a direct driver of evapotranspiration in standard LPJ-GUESS. However, it also shows the importance of the inclusion of dynamic stomatal regulation strategies, as exhibited by the larger range in simulated evapotranspiration rates in LPJ-GUESS-HYD. More anisohydric species (i.e., lower λiso, higher Δψmax; see Table 2) tended to keep transpiring even under high VPD, while more isohydric species displayed plateauing evapotranspiration as VPD increased. Our simulations revealed no distinct clustering of evapotranspiration responses to VPD but instead showed a gradation of responses dependent on the relevant parameters. This simulated behavior is congruent with the established notion of the anisohydric–isohydric continuum (Klein, 2014; Martínez-Vilalta et al., 2014; Martínez-Vilalta and Garcia-Forner, 2017). Similarly, the species-specific responses of evapotranspiration to VPD simulated by LPJ-GUESS-HYD reflect results from experiments identifying VPD as the most potent driver of both canopy conductance and evapotranspiration (Schönbeck et al., 2022; Flo et al., 2022). In particular, the order of the evapotranspiration–VPD response simulated by LPJ-GUESS-HYD (Fig. 4) for Fagus sylvatica, Quercus pubescens, and Quercus ilex is comparable to the results from Schönbeck et al. (2022).
Lastly, to evaluate the efficacy of LPJ-GUESS-HYD at simulating the real-world response of water and carbon fluxes to drought, we compared simulated evapotranspiration and GPP with eddy covariance fluxes from 34 sites across Europe during 3 pan-European drought years – 2003, 2015, and 2018 (Fig. 5). Compared to LPJ-GUESS, LPJ-GUESS-HYD represents an improvement in terms of simulated evapotranspiration under drought. Since eddy covariance flux data integrate the response of all species at a given site, our ability to conduct species-specific comparisons of modeled and observed evapotranspiration was limited. Nevertheless, the limited available data suggest that LPJ-GUESS-HYD is better at capturing the observed evapotranspiration patterns of more anisohydric species compared to those of relatively isohydric species (Fig. A1). This may also partially explain the underestimation of evapotranspiration by LPJ-GUESS-HYD seen at some sites (Fig. 5a), yet the limited availability of species-specific comparisons does not allow for a conclusive explanation. In any case, this indication. together with the fact that Δψmax, which largely governs modeled stomatal regulation, was one of the most influential parameters, suggests that well-constrained estimates of Δψmax are crucial for model performance.
Contrastingly, no meaningful difference was seen between LPJ-GUESS and LPJ-GUESS-HYD for simulated GPP under drought. Considering the fact that the sensitivity analysis revealed that modeled GPP is sensitive to variations in ψ50, the lack of differences between LPJ-GUESS-HYD and standard LPJ-GUESS may seem surprising. However, these results must be interpreted carefully. The control of ψ50 on GPP in the sensitivity analysis stems from the fact that with high values of ψ50 (i.e., low resistance to embolism), few viable parameter combinations remain; that is, ψ50 represents a limiting factor that can override the effect of the other parameters. In the evaluation using the best-estimate parameter sets (Table 2), the values of ψ50 remain within a viable range. Additionally, despite lacking a mechanistic representation of photosynthetic response to drought, the empirical relationships of photosynthesis to low water availability implemented in LPJ-GUESS – and, in fact, in a host of other DVMs – are rooted in reality and have been shown to be sufficient in reproducing past droughts and their effect on carbon uptake (Ciais et al., 2005; van der Woude et al., 2023; Gampe et al., 2021). However, the improved representation of evapotranspiration (based explicitly on canopy conductance) in LPJ-GUESS-HYD paves the way for the implementation of further hydraulic processes, such as capacitance, and the improvement of existing ones, such as cavitation. Such advancements, coupled with sink-driven mechanisms (e.g., turgor-limited growth), are paramount to modeling carbon and water cycles in future climates where existing empirical relationships become less dependable (Körner, 2015; Torres-Ruiz et al., 2024).
4.3 Limitations of the modeling approach and ways forward
Despite the improvements offered by LPJ-GUESS-HYD in modeling plant–water relations, further improvements will be necessary in subsequent iterations of the model. Considering the hydraulic processes implemented in LPJ-GUESS-HYD (Fig. 1), it is obvious that, in the current state, they are directed towards the water cycle rather than the carbon cycle. As such, the path forward for LPJ-GUESS-HYD must focus on the physiological processes connecting plant water usage with plant carbon usage, in terms of both carbon assimilation and carbon losses. One major source of carbon loss due to drought is tree mortality (Allen et al., 2010). In the current version of LPJ-GUESS-HYD, drought mortality is implemented based on xylem cavitation but not based on the downstream ramifications of hydraulic failure (e.g., higher susceptibility to insects and other biotic agents), although these are generally considered to be significant secondary drivers of drought-induced mortality (Senf et al., 2020; Desprez-Loustau et al., 2006; Rouault et al., 2006; Bigler et al., 2006; Anderegg et al., 2015). Linking existing models dealing with biotic and non-biotic disturbance agents (Lagergren et al., 2012; Jönsson et al., 2012) to LPJ-GUESS-HYD could provide a pathway to better capture the observed mortality associated with droughts. In this context, emphasis must be placed on mechanisms governing how drought stress increases vulnerability to these secondary processes. However, carbon losses due to drought are not confined only to tree mortality. Across the globe, an increase in drought-induced tree canopy dieback has been observed (Allen et al., 2010, 2015; Lloret et al., 2004; Frei et al., 2022; Carnicer et al., 2011; Hartmann et al., 2022). Evidence suggests that such dieback is caused primarily by hydraulic failure (Arend et al., 2022; Kannenberg et al., 2021; Walthert et al., 2021; Nolan et al., 2021), although a disruption of the soil–root interface (Körner, 2019; Carminati and Javaux, 2020) and preceding growth trends (Neycken et al., 2022) have been identified as potential drivers as well. Regardless of the underlying cause, crown dieback reduces the leaf area, altering canopy water demand and growth even once the drought has subsided (Arend et al., 2022; Guada et al., 2016). While early leaf senescence in response to drought has been widely observed in beech and other temperate broad-leaved species (Schuldt et al., 2020, and references therein), evidence suggests that coniferous species, such as spruce, may die from hydraulic failure before such protective measures can occur (Arend et al., 2021). Additionally, the relationship between drought intensity, hydraulic failure, and early leaf senescence is difficult to quantify, and studies establishing concrete thresholds for leaf senescence are scarce and focused on single species (e.g., Walthert et al., 2021). Nevertheless, early leaf senescence plays an important role in governing tree drought response (Nadal-Sala et al., 2024). However, currently LPJ-GUESS(-HYD) does not include any mechanistic or empirical representation of this process. While the exact mechanisms may be too detailed for a model such as LPJ-GUESS-HYD, some relationship between hydraulic failure and reduced leaf area should be a part of future developments to ensure that the actual leaf area matches the area that is able to be supported by the sapwood area diminished due to xylem cavitation.
Additionally, a better representation of drought-associated carbon losses (e.g., mortality, dieback, and lost productivity) is only part of the puzzle. Most DVMs, including LPJ-GUESS-HYD, primarily model carbon allocation and tree growth as being source limited (Cabon and Anderegg, 2022; Eckes-Shephard et al., 2021). In LPJ-GUESS-HYD, reduced carbon uptake under drought follows this pattern. As stomata close and gas exchange is reduced, photosynthetic assimilation slows as well. However, emerging evidence emphasizes the importance of including sink limitations in models as a crucial factor in modulating tree growth, particularly during drought, as cambial cell formation is limited by turgor (Körner, 2015; Peters et al., 2021; Cabon et al., 2020). While mechanistic turgor-driven growth models exist (Steppe et al., 2006; Génard et al., 2001; Peters et al., 2021), they are too complex, both temporally and physiologically, for direct implementation into LPJ-GUESS-HYD (Potkay et al., 2022). To bridge this gap, including plant water storage and hydraulic capacitance could be a starting point for a simple approximation of the more complex process underlying turgor-driven growth limitations. Observations from dendrometers suggest that little to no growth occurs during periods of stem shrinkage, i.e., when plant water storage recedes (Zweifel et al., 2016). In contrast to dedicated turgor-driven growth models, the dynamics of plant water storage more easily lend themselves to implementation in DVMs and could nonetheless present a viable proxy for more complex sink limitations under drought.
Lastly, if and when further LPJ-GUESS-HYD developments are made, subsequent sensitivity analyses should be conducted. In this study, the sensitivity analysis focused on long-term model outputs such as annual water and carbon fluxes, which are also commonly used for benchmarking DVMs (e.g., Seiler et al., 2022; Collier et al., 2018). However, as the future developments discussed above (e.g., turgor-driven growth, drought-induced leaf shedding) will likely focus on specific aspects of tree drought response, sensitivity analyses on finer temporal scales may be more practical and more useful than the larger yet coarser sensitivity analysis used here. To this end, future analyses could also consider not only relying on direct model output variables but also creating specific indices or metrics related to individual model processes (e.g., Ruffault et al., 2022).
In this study, we evaluated LPJ-GUESS-HYD for use with European tree species along an isohydricity gradient. The model was shown to simulate species-specific responses of evapotranspiration to increasing VPD in accordance with both results from experiments and the current understanding of the anisohydric–isohydric continuum. A comparison of simulated ET and GPP with observations from eddy covariance flux sites in 3 pan-European drought years (2003, 2015, 2018) revealed that LPJ-GUESS-HYD improved evapotranspiration compared to the standard version of LPJ-GUESS, although both versions of the model displayed a similar fit of simulated-to-observed GPP. These results not only emphasize the importance of including mechanistic representations of plant hydraulic architecture in dynamic vegetation models but also highlight the fact that simulating both water and carbon fluxes based on canopy conductance provides improvements in model performance compared to only using canopy conductance for the calculation of carbon fluxes. In this context, future developments of LPJ-GUESS-HYD should continue to focus on the connection between plant water use and plant carbon use, potentially related to the aspect of sink-limited growth. Plant hydraulics are a crucial extension of current DVMs for modeling the effect of drought on altering ecosystem-scale water usage, and continued refinements may be essential to providing robust estimates of future drought responses under a changing climate.
A1 Species-specific comparison of modeled evapotranspiration and evapotranspiration from eddy covariance flux towers
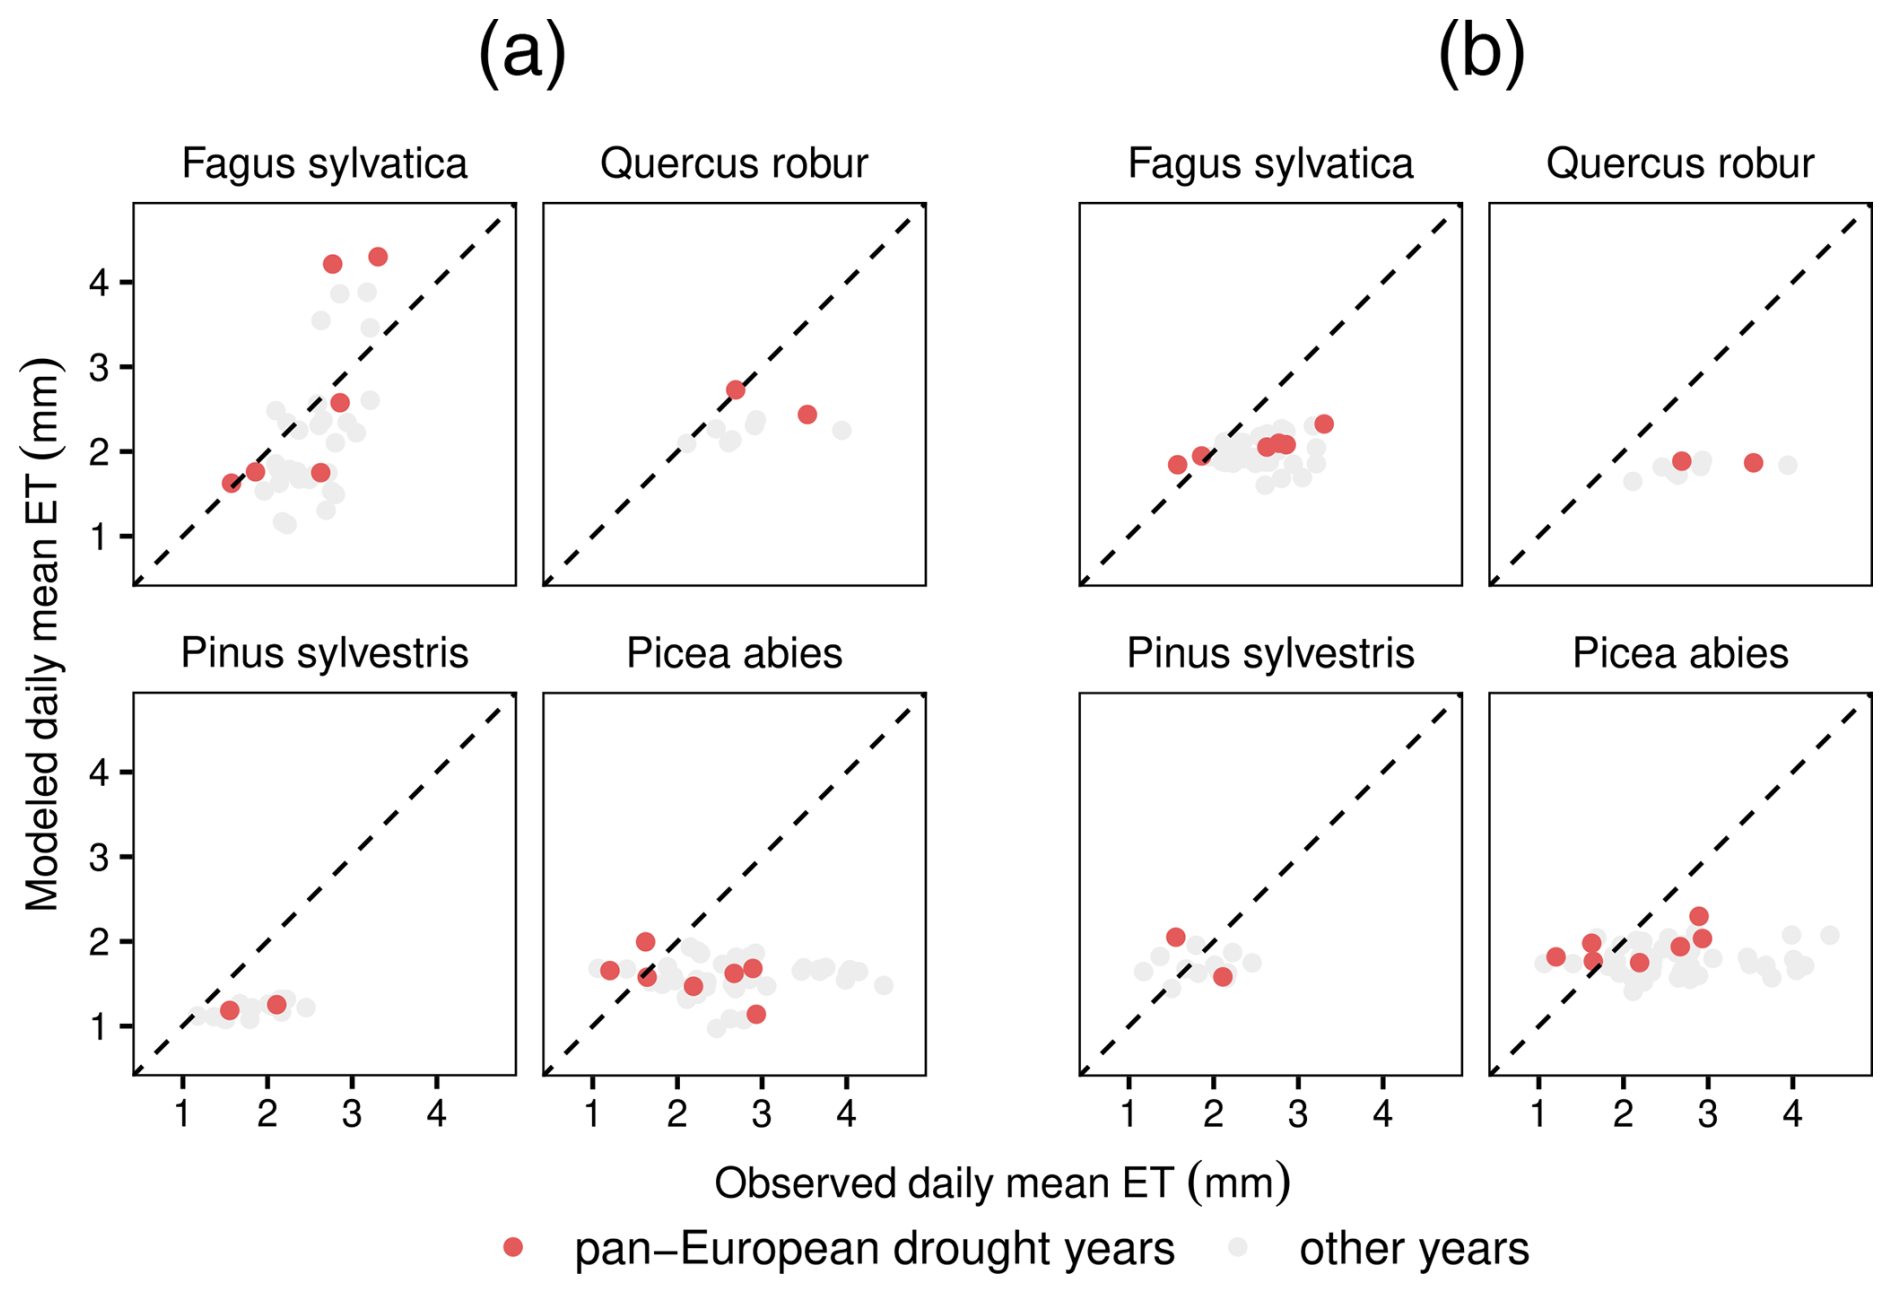
Figure A1Of the 12 species analyzed in this study, monospecific eddy covariance flux sites exist only for the 4 species shown here. In LPJ-GUESS-HYD (a), modeled ET better matches the observed ET patterns for the relatively anisohydric species Fagus sylvatica and Quercus robur compared to results from standard LPJ-GUESS (b) during the three pan-European droughts. On the contrary, for the more isohydric species Picea abies and Pinus sylvestris, both LPJ-GUESS-HYD (a) and LPJ-GUESS (b) underestimate observed ET. The dotted black line indicates perfect agreement between the model and observations.
A2 Species-specific evapotranspiration under differing levels of VPD using alternative ψ50 parameterization
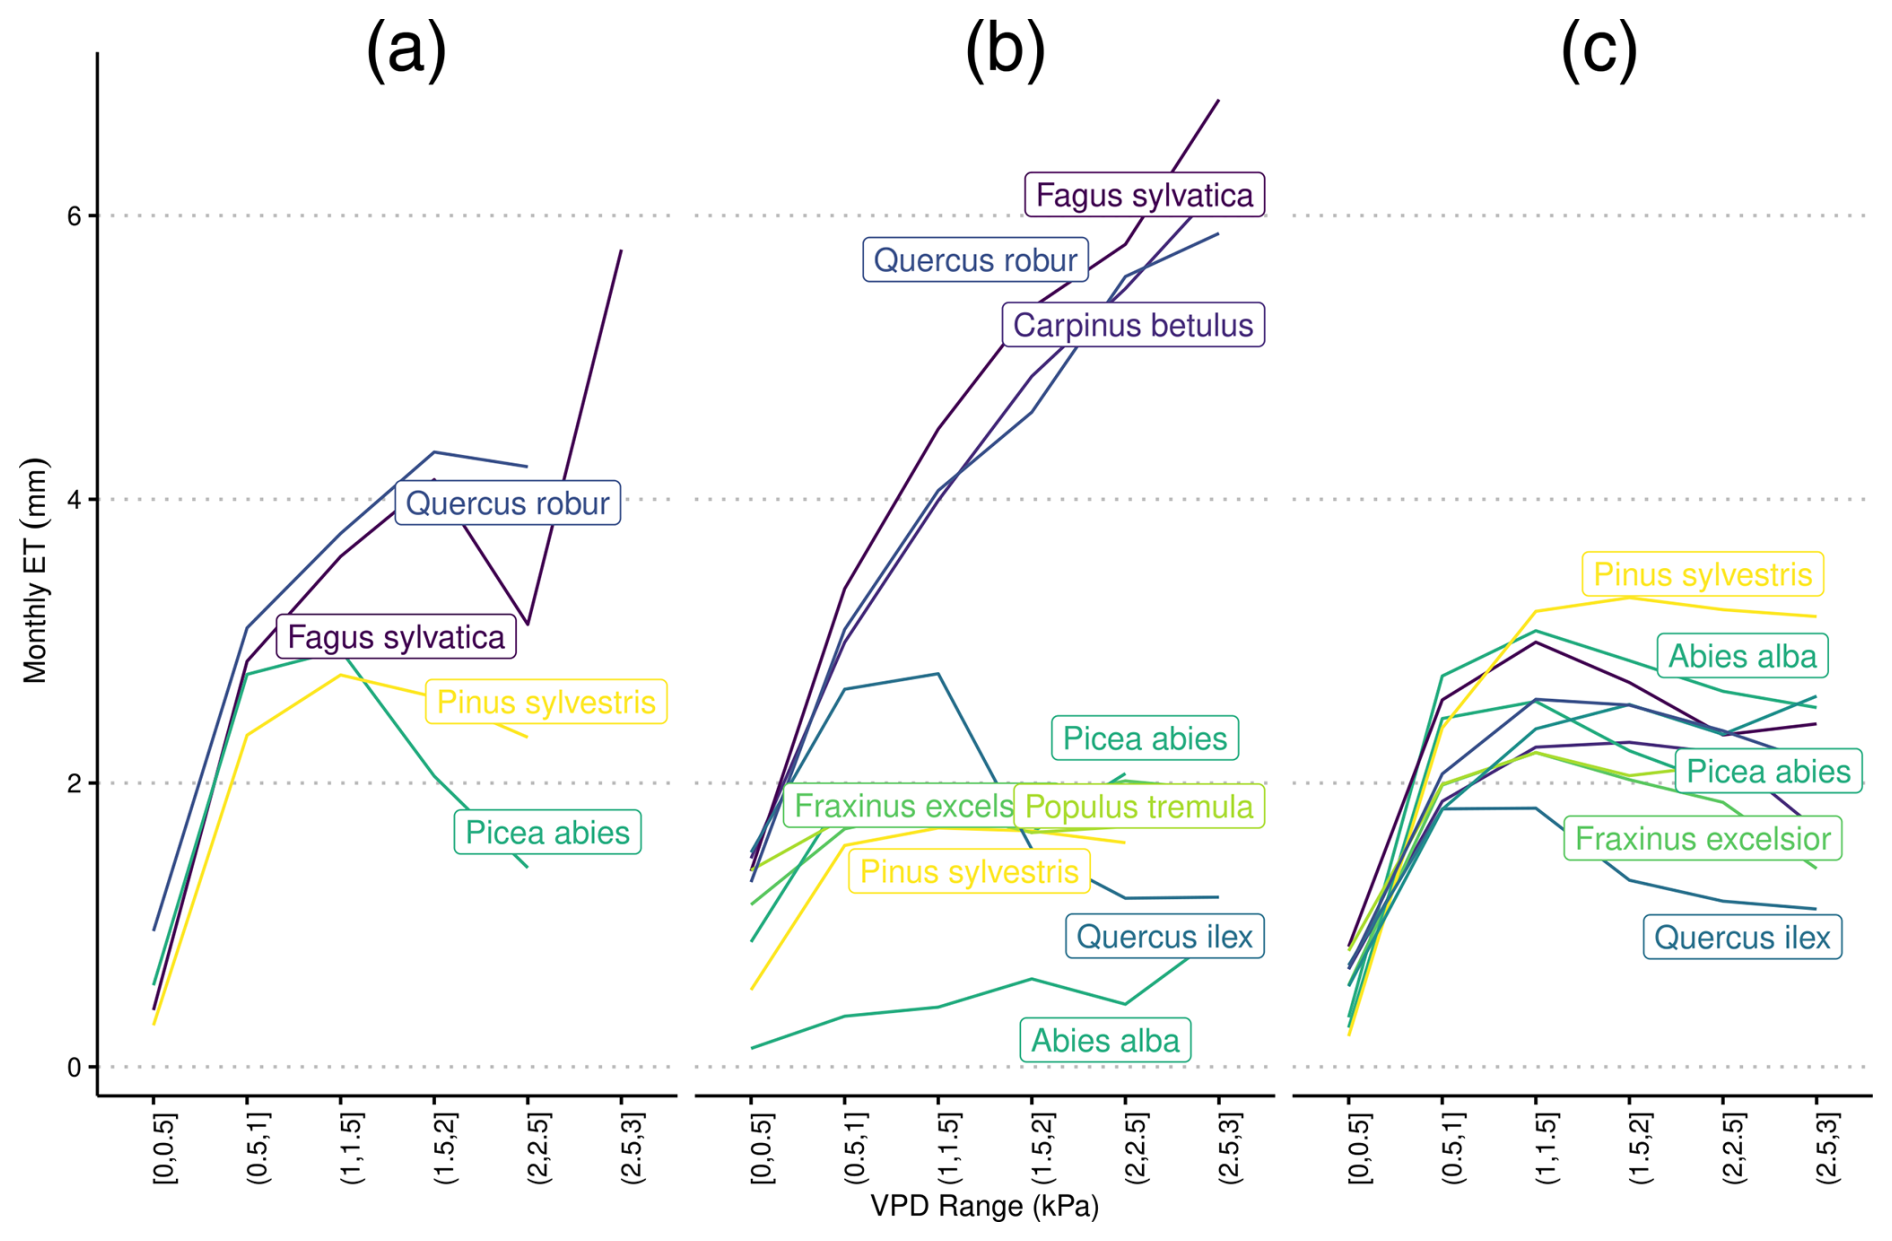
Figure A2Species-specific daily evapotranspiration rates under differing levels of vapor pressure deficit from (a) eddy covariance flux towers, (b) LPJ-GUESS-HYD, and (c) standard LPJ-GUESS using ψ50 values from Martin-StPaul et al. (2017). The colors are ranked according to the λ of each species (see Fig. 2) from high λ (light) to low λ (dark). Daily VPD was binned into six equally sized classes representing increasing levels of drought. Species-specific responses to drought remain constant in LPJ-GUESS, while clear differences between more anisohydric and more isohydric species are seen in LPJ-GUESS-HYD.
LPJ-GUESS is publicly available at https://doi.org/10.5281/zenodo.8065736 (Nord et al., 2021). The version of LPJ-GUESS used in this study is publicly available at https://doi.org/10.5281/zenodo.14000805 (Meyer et al., 2024). The model version presented here is identified by the commit hash 97c552c5. The analysis code used to produce the results and figures in this study is available at https://doi.org/10.5281/zenodo.14001089 (Meyer, 2024).
BM, AR, and CZ conceptualized the study. BM wrote the paper, conducted the model simulation runs, and conducted the data analysis. JD gathered and prepared input data for the model runs, contributed model code, and contributed to the draft writing. PP and KG contributed to model development. AB, QG, TG, and AK contributed to the interpretation of the results. DL and SA gathered and prepared parameter values for use in the sensitivity analysis. All authors edited the paper.
The contact author has declared that none of the authors has any competing interests.
Publisher's note: Copernicus Publications remains neutral with regard to jurisdictional claims made in the text, published maps, institutional affiliations, or any other geographical representation in this paper. While Copernicus Publications makes every effort to include appropriate place names, the final responsibility lies with the authors.
This research has been supported by the Bayerisches Staatsministerium für Wissenschaft und Kunst (grant nos. HyBBEx and BLIZ), the Bundesministerium für Bildung und Forschung (grant no. STEPSEC), and the Velux Stiftung (grant no. 3FOR).
This paper was edited by Sam Rabin and reviewed by Nicolas Martin-StPaul and two anonymous referees.
Adams, H. D., Zeppel, M. J. B., Anderegg, W. R. L., Hartmann, H., Landhäusser, S. M., Tissue, D. T., Huxman, T. E., Hudson, P. J., Franz, T. E., Allen, C. D., Anderegg, L. D. L., Barron-Gafford, G. A., Beerling, D. J., Breshears, D. D., Brodribb, T. J., Bugmann, H., Cobb, R. C., Collins, A. D., Dickman, L. T., Duan, H., Ewers, B. E., Galiano, L., Galvez, D. A., Garcia-Forner, N., Gaylord, M. L., Germino, M. J., Gessler, A., Hacke, U. G., Hakamada, R., Hector, A., Jenkins, M. W., Kane, J. M., Kolb, T. E., Law, D. J., Lewis, J. D., Limousin, J.-M., Love, D. M., Macalady, A. K., Martínez-Vilalta, J., Mencuccini, M., Mitchell, P. J., Muss, J. D., O'Brien, M. J., O'Grady, A. P., Pangle, R. E., Pinkard, E. A., Piper, F. I., Plaut, J. A., Pockman, W. T., Quirk, J., Reinhardt, K., Ripullone, F., Ryan, M. G., Sala, A., Sevanto, S., Sperry, J. S., Vargas, R., Vennetier, M., Way, D. A., Xu, C., Yepez, E. A., and Mcdowell, N. G.: A Multi-Species Synthesis of Physiological Mechanisms in Drought-Induced Tree Mortality, Nat. Ecol. Evol., 1, 1285–1291, https://doi.org/10.1038/s41559-017-0248-x, 2017. a
Ahlström, A., Schurgers, G., Arneth, A., and Smith, B.: Robustness and Uncertainty in Terrestrial Ecosystem Carbon Response to CMIP5 Climate Change Projections, Environ. Res. Lett., 7, 044008, https://doi.org/10.1088/1748-9326/7/4/044008, 2012. a
Allen, C. D., Macalady, A. K., Chenchouni, H., Bachelet, D., McDowell, N., Vennetier, M., Kitzberger, T., Rigling, A., Breshears, D. D., Hogg, E. H. T., Gonzalez, P., Fensham, R., Zhang, Z., Castro, J., Demidova, N., Lim, J.-H., Allard, G., Running, S. W., Semerci, A., and Cobb, N.: A Global Overview of Drought and Heat-Induced Tree Mortality Reveals Emerging Climate Change Risks for Forests, Forest Ecol. Manage., 259, 660–684, https://doi.org/10.1016/j.foreco.2009.09.001, 2010. a, b
Allen, C. D., Breshears, D. D., and McDowell, N. G.: On Underestimation of Global Vulnerability to Tree Mortality and Forest Die-off from Hotter Drought in the Anthropocene, Ecosphere, 6, art129, https://doi.org/10.1890/ES15-00203.1, 2015. a
Allen, R. G., Pereira, L. S., Raes, D., and Smith, M.: Crop evapotranspiration – guidelines for computing crop water requirements, Food and Agriculture Organization of the United Nations, https://www.fao.org/3/x0490e/x0490e00.htm (last access: 16 October 2024), 1998. a
Anderegg, W. R. L., Berry, J. A., Smith, D. D., Sperry, J. S., Anderegg, L. D. L., and Field, C. B.: The Roles of Hydraulic and Carbon Stress in a Widespread Climate-Induced Forest Die-Off, P. Natl. Acad. Sci. USA, 109, 233–237, https://doi.org/10.1073/pnas.1107891109, 2012. a
Anderegg, W. R. L., Hicke, J. A., Fisher, R. A., Allen, C. D., Aukema, J., Bentz, B., Hood, S., Lichstein, J. W., Macalady, A. K., McDowell, N., Pan, Y., Raffa, K., Sala, A., Shaw, J. D., Stephenson, N. L., Tague, C., and Zeppel, M.: Tree Mortality from Drought, Insects, and Their Interactions in a Changing Climate, New Phytol., 208, 674–683, https://doi.org/10.1111/nph.13477, 2015. a, b, c
Anderegg, W. R. L., Klein, T., Bartlett, M., Sack, L., Pellegrini, A. F. A., Choat, B., and Jansen, S.: Meta-Analysis Reveals That Hydraulic Traits Explain Cross-Species Patterns of Drought-Induced Tree Mortality across the Globe, P. Natl. Acad. Sci. USA, 113, 5024–5029, https://doi.org/10.1073/pnas.1525678113, 2016. a, b, c, d
Arend, M., Link, R. M., Patthey, R., Hoch, G., Schuldt, B., and Kahmen, A.: Rapid Hydraulic Collapse as Cause of Drought-Induced Mortality in Conifers, P. Natl. Acad. Sci. USA, 118, e2025251118, https://doi.org/10.1073/pnas.2025251118, 2021. a
Arend, M., Link, R. M., Zahnd, C., Hoch, G., Schuldt, B., and Kahmen, A.: Lack of Hydraulic Recovery as a Cause of Post-drought Foliage Reduction and Canopy Decline in European Beech, New Phytol., 234, 1195–1205, https://doi.org/10.1111/nph.18065, 2022. a, b
Bigler, C. and Vitasse, Y.: Premature Leaf Discoloration of European Deciduous Trees Is Caused by Drought and Heat in Late Spring and Cold Spells in Early Fall, Agr. Forest Meteorol., 307, 108492, https://doi.org/10.1016/j.agrformet.2021.108492, 2021. a
Bigler, C., Bräker, O. U., Bugmann, H., Dobbertin, M., and Rigling, A.: Drought as an Inciting Mortality Factor in Scots Pine Stands of the Valais, Switzerland, Ecosystems, 9, 330–343, https://doi.org/10.1007/s10021-005-0126-2, 2006. a, b
Blackman, C. J., Brodribb, T. J., and Jordan, G. J.: Leaf Hydraulic Vulnerability Is Related to Conduit Dimensions and Drought Resistance across a Diverse Range of Woody Angiosperms, New Phytol., 188, 1113–1123, https://doi.org/10.1111/j.1469-8137.2010.03439.x, 2010. a
Bonan, G. B.: Forests and Climate Change: Forcings, Feedbacks, and the Climate Benefits of Forests, Science, 320, 1444–1449, https://doi.org/10.1126/science.1155121, 2008. a
Brodribb, T. J., Powers, J., Cochard, H., and Choat, B.: Hanging by a Thread? Forests and Drought, Science, 368, 261–266, https://doi.org/10.1126/science.aat7631, 2020. a
Buras, A., Meyer, B., and Rammig, A.: Record reduction in European forest canopy greenness during the 2022 drought, EGU General Assembly 2023, Vienna, Austria, 24–28 April 2023, EGU23-8927, https://doi.org/10.5194/egusphere-egu23-8927, 2023. a
Cabon, A. and Anderegg, W. R. L.: Turgor-Driven Tree Growth: Scaling-up Sink Limitations from the Cell to the Forest, Tree Physiol., 42, 225–228, https://doi.org/10.1093/treephys/tpab146, 2022. a
Cabon, A., Peters, R. L., Fonti, P., Martínez-Vilalta, J., and De Cáceres, M.: Temperature and Water Potential Co-Limit Stem Cambial Activity along a Steep Elevational Gradient, New Phytol., 226, 1325–1340, https://doi.org/10.1111/nph.16456, 2020. a
Carminati, A. and Javaux, M.: Soil Rather Than Xylem Vulnerability Controls Stomatal Response to Drought, Trends Plant Sci., 25, 868–880, https://doi.org/10.1016/j.tplants.2020.04.003, 2020. a
Carnicer, J., Coll, M., Ninyerola, M., Pons, X., Sánchez, G., and Peñuelas, J.: Widespread Crown Condition Decline, Food Web Disruption, and Amplified Tree Mortality with Increased Climate Change-Type Drought, P. Natl. Acad. Sci. USA, 108, 1474–1478, https://doi.org/10.1073/pnas.1010070108, 2011. a
Choat, B., Jansen, S., Brodribb, T. J., Cochard, H., Delzon, S., Bhaskar, R., Bucci, S. J., Feild, T. S., Gleason, S. M., Hacke, U. G., Jacobsen, A. L., Lens, F., Maherali, H., Martínez-Vilalta, J., Mayr, S., Mencuccini, M., Mitchell, P. J., Nardini, A., Pittermann, J., Pratt, R. B., Sperry, J. S., Westoby, M., Wright, I. J., and Zanne, A. E.: Global Convergence in the Vulnerability of Forests to Drought, Nature, 491, 752–755, https://doi.org/10.1038/nature11688, 2012. a, b, c, d, e, f
Christoffersen, B. O., Gloor, M., Fauset, S., Fyllas, N. M., Galbraith, D. R., Baker, T. R., Kruijt, B., Rowland, L., Fisher, R. A., Binks, O. J., Sevanto, S., Xu, C., Jansen, S., Choat, B., Mencuccini, M., McDowell, N. G., and Meir, P.: Linking Hydraulic Traits to Tropical Forest Function in a Size-Structured and Trait-Driven Model (TFS v.1-Hydro), Geosci. Model Dev., 9, 4227–4255, https://doi.org/10.5194/gmd-9-4227-2016, 2016. a, b
Ciais, P., Reichstein, M., Viovy, N., Granier, A., Ogée, J., Allard, V., Aubinet, M., Buchmann, N., Bernhofer, C., Carrara, A., Chevallier, F., Noblet, N. D., Friend, A. D., Friedlingstein, P., Grünwald, T., Heinesch, B., Keronen, P., Knohl, A., Krinner, G., Loustau, D., Manca, G., Matteucci, G., Miglietta, F., Ourcival, J. M., Papale, D., Pilegaard, K., Rambal, S., Seufert, G., Soussana, J. F., Sanz, M. J., Schulze, E. D., Vesala, T., and Valentini, R.: Europe-Wide Reduction in Primary Productivity Caused by the Heat and Drought in 2003, Nature, 437, 529–533, https://doi.org/10.1038/nature03972, 2005. a, b, c
Cochard, H., Badel, E., Herbette, S., Delzon, S., Choat, B., and Jansen, S.: Methods for Measuring Plant Vulnerability to Cavitation: A Critical Review, J. Exp. Bot., 64, 4779–4791, https://doi.org/10.1093/jxb/ert193, 2013. a
Cochard, H., Pimont, F., Ruffault, J., and Martin-StPaul, N.: SurEau: A Mechanistic Model of Plant Water Relations under Extreme Drought, Ann. Forest Sci., 78, 55, https://doi.org/10.1007/s13595-021-01067-y, 2021. a
Collatz, G. J., Ball, J. T., Grivet, C., and Berry, J. A.: Physiological and environmental regulation of stomatal conductance, photosynthesis and transpiration: a model that includes a laminar boundary layer, Agr. Forest Meteorol., 54, 107–136, https://doi.org/10.1016/0168-1923(91)90002-8, 1991. a
Collier, N., Hoffman, F. M., Lawrence, D. M., Keppel-Aleks, G., Koven, C. D., Riley, W. J., Mu, M., and Randerson, J. T.: The International Land Model Benchmarking (ILAMB) System: Design, Theory, and Implementation, J. Adv. Model. Earth Syst., 10, 2731–2754, https://doi.org/10.1029/2018MS001354, 2018. a
Comins, H. N. and McMurtrie, R. E.: Long-Term Response of Nutrient-Limited Forests to CO2 Enrichment; Equilibrium Behavior of Plant-Soil Models, Ecol. Appl., 3, 666–681, https://doi.org/10.2307/1942099, 1993. a
Cook, B. I., Mankin, J. S., Marvel, K., Williams, A. P., Smerdon, J. E., and Anchukaitis, K. J.: Twenty-First Century Drought Projections in the CMIP6 Forcing Scenarios, Earth's Future, 8, e2019EF001461, https://doi.org/10.1029/2019EF001461, 2020. a
Da Sois, L., Mencuccini, M., Castells, E., Sanchez-Martinez, P., and Martínez-Vilalta, J.: How Are Physiological Responses to Drought Modulated by Water Relations and Leaf Economics' Traits in Woody Plants?, Agr. Water Manage., 291, 108613, https://doi.org/10.1016/j.agwat.2023.108613, 2024. a
De Kauwe, M. G., Medlyn, B. E., Ukkola, A. M., Mu, M., Sabot, M. E. B., Pitman, A. J., Meir, P., Cernusak, L. A., Rifai, S. W., Choat, B., Tissue, D. T., Blackman, C. J., Li, X., Roderick, M., and Briggs, P. R.: Identifying Areas at Risk of Drought-Induced Tree Mortality across South-Eastern Australia, Global Change Biol., 26, 5716–5733, https://doi.org/10.1111/gcb.15215, 2020. a
Desprez-Loustau, M.-L., Marçais, B., Nageleisen, L.-M., Piou, D., and Vannini, A.: Interactive Effects of Drought and Pathogens in Forest Trees, Ann. Forest Sci., 63, 597–612, https://doi.org/10.1051/forest:2006040, 2006. a
Dietze, M. C., Fox, A., Beck-Johnson, L. M., Betancourt, J. L., Hooten, M. B., Jarnevich, C. S., Keitt, T. H., Kenney, M. A., Laney, C. M., Larsen, L. G., Loescher, H. W., Lunch, C. K., Pijanowski, B. C., Randerson, J. T., Read, E. K., Tredennick, A. T., Vargas, R., Weathers, K. C., and White, E. P.: Iterative Near-Term Ecological Forecasting: Needs, Opportunities, and Challenges, P. Natl. Acad. Sci. USA, 115, 1424–1432, https://doi.org/10.1073/pnas.1710231115, 2018. a
Eckes-Shephard, A. H., Tiavlovsky, E., Chen, Y., Fonti, P., and Friend, A. D.: Direct Response of Tree Growth to Soil Water and Its Implications for Terrestrial Carbon Cycle Modelling, Global Change Biol., 27, 121–135, https://doi.org/10.1111/gcb.15397, 2021. a
Eller, C. B., Rowland, L., Oliveira, R. S., Bittencourt, P. R. L., Barros, F. V., da Costa, A. C. L., Meir, P., Friend, A. D., Mencuccini, M., Sitch, S., and Cox, P.: Modelling Tropical Forest Responses to Drought and El Niño with a Stomatal Optimization Model Based on Xylem Hydraulics, Philos. T. Roy. Soc. B, 373, 20170315, https://doi.org/10.1098/rstb.2017.0315, 2018. a, b
Eller, C. B., Rowland, L., Mencuccini, M., Rosas, T., Williams, K., Harper, A., Medlyn, B. E., Wagner, Y., Klein, T., Teodoro, G. S., Oliveira, R. S., Matos, I. S., Rosado, B. H. P., Fuchs, K., Wohlfahrt, G., Montagnani, L., Meir, P., Sitch, S., and Cox, P. M.: Stomatal Optimization Based on Xylem Hydraulics (SOx) Improves Land Surface Model Simulation of Vegetation Responses to Climate, New Phytol., 226, 1622–1637, https://doi.org/10.1111/nph.16419, 2020. a, b
European Environment Agency: Global and European Temperature, https://www.eea.europa.eu/data-and-maps/indicators/global-and-european-temperature-9/assessment (last access: 19 August 2024), 2019. a
Fink, A. H., Brücher, T., Krüger, A., Leckebusch, G. C., Pinto, J. G., and Ulbrich, U.: The 2003 European Summer Heatwaves and Drought – Synoptic Diagnosis and Impacts, Weather, 59, 209–216, https://doi.org/10.1256/wea.73.04, 2004. a
Fisher, R. A., Williams, M., Do Vale, R. L., Da Costa, A. L., and Meir, P.: Evidence from Amazonian Forests Is Consistent with Isohydric Control of Leaf Water Potential, Plant Cell Environ., 29, 151–165, https://doi.org/10.1111/j.1365-3040.2005.01407.x, 2006. a
Flexas, J., Scoffoni, C., Gago, J., and Sack, L.: Leaf Mesophyll Conductance and Leaf Hydraulic Conductance: An Introduction to Their Measurement and Coordination, J. Exp. Bot., 64, 3965–3981, https://doi.org/10.1093/jxb/ert319, 2013. a
Flo, V., Martínez-Vilalta, J., Granda, V., Mencuccini, M., and Poyatos, R.: Vapour Pressure Deficit Is the Main Driver of Tree Canopy Conductance across Biomes, Agr. Forest Meteorol., 322, 109029, https://doi.org/10.1016/j.agrformet.2022.109029, 2022. a
Frei, E. R., Gossner, M. M., Vitasse, Y., Queloz, V., Dubach, V., Gessler, A., Ginzler, C., Hagedorn, F., Meusburger, K., Moor, M., Samblás Vives, E., Rigling, A., Uitentuis, I., von Arx, G., and Wohlgemuth, T.: European Beech Dieback after Premature Leaf Senescence during the 2018 Drought in Northern Switzerland, Plant Biol., 24, 1132–1145, https://doi.org/10.1111/plb.13467, 2022. a
Gampe, D., Zscheischler, J., Reichstein, M., O'Sullivan, M., Smith, W. K., Sitch, S., and Buermann, W.: Increasing Impact of Warm Droughts on Northern Ecosystem Productivity over Recent Decades, Nat. Clim. Change, 11, 772–779, https://doi.org/10.1038/s41558-021-01112-8, 2021. a
Génard, M., Fishman, S., Vercambre, G., Huguet, J.-G., Bussi, C., Besset, J., and Habib, R.: A Biophysical Analysis of Stem and Root Diameter Variations in Woody Plants, Plant Physiol., 126, 188–202, 2001. a
Gerten, D., Schaphoff, S., Haberlandt, U., Lucht, W., and Sitch, S.: Terrestrial Vegetation and Water Balance – Hydrological Evaluation of a Dynamic Global Vegetation Model, J. Hydrol., 286, 249–270, https://doi.org/10.1016/j.jhydrol.2003.09.029, 2004. a
Guada, G., Camarero, J. J., Sánchez-Salguero, R., and Cerrillo, R. M. N.: Limited Growth Recovery after Drought-Induced Forest Dieback in Very Defoliated Trees of Two Pine Species, Front. Plant Sci., 7, 418, https://doi.org/10.3389/fpls.2016.00418, 2016. a
Hajek, P., Link, R. M., Nock, C. A., Bauhus, J., Gebauer, T., Gessler, A., Kovach, K., Messier, C., Paquette, A., Saurer, M., Scherer-Lorenzen, M., Rose, L., and Schuldt, B.: Mutually Inclusive Mechanisms of Drought-induced Tree Mortality, Global Change Biol., 28, 3365–3378, https://doi.org/10.1111/gcb.16146, 2022. a, b, c
Hammond, W. M., Yu, K., Wilson, L. A., Will, R. E., Anderegg, W. R. L., and Adams, H. D.: Dead or Dying? Quantifying the Point of No Return from Hydraulic Failure in Drought-induced Tree Mortality, New Phytol., 223, 1834–1843, https://doi.org/10.1111/nph.15922, 2019. a, b, c
Hartmann, H., Bastos, A., Das, A. J., Esquivel-Muelbert, A., Hammond, W. M., Martínez-Vilalta, J., McDowell, N. G., Powers, J. S., Pugh, T. A. M., Ruthrof, K. X., and Allen, C. D.: Climate Change Risks to Global Forest Health: Emergence of Unexpected Events of Elevated Tree Mortality Worldwide, Annu. Rev. Plant Biol., 73, 673–702, https://doi.org/10.1146/annurev-arplant-102820-012804, 2022. a
Haxeltine, A. and Prentice, I. C.: BIOME3: An Equilibrium Terrestrial Biosphere Model Based on Ecophysiological Constraints, Resource Availability, and Competition among Plant Functional Types, Global Biogeochem. Cy., 10, 693–709, https://doi.org/10.1029/96GB02344, 1996. a, b, c, d
Helton, J. C. and Davis, F. J.: Latin Hypercube Sampling and the Propagation of Uncertainty in Analyses of Complex Systems, Reliabil. Eng. Syst. Safe., 81, 23–69, https://doi.org/10.1016/S0951-8320(03)00058-9, 2003. a
Hickler, T., Prentice, I. C., Smith, B., Sykes, M. T., and Zaehle, S.: Implementing plant hydraulic architecture within the LPJ Dynamic Global Vegetation Model, Global Ecol. Biogeogr., 15, 567–577, https://doi.org/10.1111/j.1466-8238.2006.00254.x, 2006. a, b, c
Hickler, T., Vohland, K., Feehan, J., Miller, P. A., Smith, B., Costa, L., Giesecke, T., Fronzek, S., Carter, T. R., Cramer, W., Kühn, I., and Sykes, M. T.: Projecting the Future Distribution of European Potential Natural Vegetation Zones with a Generalized, Tree Species-Based Dynamic Vegetation Model: Future Changes in European Vegetation Zones, Global Ecol. Biogeogr., 21, 50–63, https://doi.org/10.1111/j.1466-8238.2010.00613.x, 2012. a, b
IIASA – International Institute for Applied Systems Analysis: Harmonized World Soil Database Version 2.0, FAO,, ISBN 978-92-5-137499-3, https://doi.org/10.4060/cc3823en, 2023. a
Jansen, M. J.: Analysis of Variance Designs for Model Output, Comput. Phys. Commun., 117, 35–43, https://doi.org/10.1016/S0010-4655(98)00154-4, 1999. a
Johnson, D., Woodruff, D., McCulloh, K., and Meinzer, F.: Leaf Hydraulic Conductance, Measured in Situ, Declines and Recovers Daily: Leaf Hydraulics, Water Potential and Stomatal Conductance in Four Temperate and Three Tropical Tree Species, Tree Physiol., 29, 879–887, https://doi.org/10.1093/treephys/tpp031, 2009. a
Johnson, D. M., Wortemann, R., McCulloh, K. A., Jordan-Meille, L., Ward, E., Warren, J. M., Palmroth, S., and Domec, J.-C.: A Test of the Hydraulic Vulnerability Segmentation Hypothesis in Angiosperm and Conifer Tree Species, Tree Physiol., 36, 983–993, https://doi.org/10.1093/treephys/tpw031, 2016. a
Jones, H. G. and Sutherland, R. A.: Stomatal Control of Xylem Embolism, Plant Cell Environ., 14, 607–612, https://doi.org/10.1111/j.1365-3040.1991.tb01532.x, 1991. a
Jönsson, A. M., Schroeder, L. M., Lagergren, F., Anderbrant, O., and Smith, B.: Guess the Impact of Ips Typographus – An Ecosystem Modelling Approach for Simulating Spruce Bark Beetle Outbreaks, Agr. Forest Meteorol., 166–167, 188–200, https://doi.org/10.1016/j.agrformet.2012.07.012, 2012. a
Joshi, J., Stocker, B. D., Hofhansl, F., Zhou, S., Dieckmann, U., and Prentice, I. C.: Towards a Unified Theory of Plant Photosynthesis and Hydraulics, Nat. Plants, 8, 1304–1316, https://doi.org/10.1038/s41477-022-01244-5, 2022. a
Kannenberg, S. A., Driscoll, A. W., Malesky, D., and Anderegg, W. R.: Rapid and Surprising Dieback of Utah Juniper in the Southwestern USA Due to Acute Drought Stress, Forest Ecol. Manage., 480, 118639, https://doi.org/10.1016/j.foreco.2020.118639, 2021. a
Kennedy, D., Swenson, S., Oleson, K. W., Lawrence, D. M., Fisher, R., Lola da Costa, A. C., and Gentine, P.: Implementing Plant Hydraulics in the Community Land Model, Version 5, J. Adv. Model. Earth Syst., 11, 485–513, https://doi.org/10.1029/2018MS001500, 2019. a, b
Kirschbaum, M. U. F. and Paul, K. I.: Modelling C and N Dynamics in Forest Soils with a Modified Version of the CENTURY Model, Soil Biol. Biochem., 34, 341–354, https://doi.org/10.1016/S0038-0717(01)00189-4, 2002. a
Klein, T.: The Variability of Stomatal Sensitivity to Leaf Water Potential across Tree Species Indicates a Continuum between Isohydric and Anisohydric Behaviours, Funct. Ecol., 28, 1313–1320, https://doi.org/10.1111/1365-2435.12289, 2014. a, b
Körner, C.: Paradigm Shift in Plant Growth Control, Curr. Opin. Plant Biol., 25, 107–114, https://doi.org/10.1016/j.pbi.2015.05.003, 2015. a, b
Körner, C.: No Need for Pipes When the Well Is Dr – a Comment on Hydraulic Failure in Trees, Tree Physiol., 39, 695–700, https://doi.org/10.1093/treephys/tpz030, 2019. a, b
Köstner, B. M. M., Schulze, E. D., Kelliher, F. M., Hollinger, D. Y., Byers, J. N., Hunt, J. E., McSeveny, T. M., Meserth, R., and Weir, P. L.: Transpiration and Canopy Conductance in a Pristine Broad-Leaved Forest of Nothofagus: An Analysis of Xylem Sap Flow and Eddy Correlation Measurements, Oecologia, 91, 350–359, https://doi.org/10.1007/BF00317623, 1992. a
Lagergren, F., Jönsson, A. M., Blennow, K., and Smith, B.: Implementing Storm Damage in a Dynamic Vegetation Model for Regional Applications in Sweden, Ecol. Model., 247, 71–82, https://doi.org/10.1016/j.ecolmodel.2012.08.011, 2012. a
Lamarque, J.-F., Kyle, G. P., Meinshausen, M., Riahi, K., Smith, S. J., van Vuuren, D. P., Conley, A. J., and Vitt, F.: Global and Regional Evolution of Short-Lived Radiatively-Active Gases and Aerosols in the Representative Concentration Pathways, Climatic Change, 109, 191, https://doi.org/10.1007/s10584-011-0155-0, 2011. a
Lambers, H. and Oliveira, R. S.: Plant Water Relations, Springer International Publishing, Cham, 187–263, ISBN 978-3-030-29638-4, https://doi.org/10.1007/978-3-030-29639-1_5, 2019. a, b, c
Lan, X., Tans, P., Thoning, K., and NOAA Global Monitoring Laboratory: Trends in globally-averaged CO2 determined from NOAA Global Monitoring Laboratory measurements, GML NOAA, https://doi.org/10.15138/9N0H-ZH07, 2023. a
Lindeskog, M., Smith, B., Lagergren, F., Sycheva, E., Ficko, A., Pretzsch, H., and Rammig, A.: Accounting for Forest Management in the Estimation of Forest Carbon Balance Using the Dynamic Vegetation Model LPJ-GUESS (v4.0, R9710): Implementation and Evaluation of Simulations for Europe, Geosci. Model Dev., 14, 6071–6112, https://doi.org/10.5194/gmd-14-6071-2021, 2021. a, b, c
Lloret, F., Siscart, D., and Dalmases, C.: Canopy Recovery after Drought Dieback in Holm-Oak Mediterranean Forests of Catalonia (NE Spain), Global Change Biol., 10, 2092–2099, https://doi.org/10.1111/j.1365-2486.2004.00870.x, 2004. a
Martínez-Vilalta, J. and Garcia-Forner, N.: Water Potential Regulation, Stomatal Behaviour and Hydraulic Transport under Drought: Deconstructing the Iso/Anisohydric Concept, Plant Cell Environ., 40, 962–976, https://doi.org/10.1111/pce.12846, 2017. a
Martínez-Vilalta, J., Poyatos, R., Aguadé, D., Retana, J., and Mencuccini, M.: A New Look at Water Transport Regulation in Plants, New Phytol., 204, 105–115, https://doi.org/10.1111/nph.12912, 2014. a
Martin-StPaul, N., Delzon, S., and Cochard, H.: Sureau Database: A Database Of Hydraulic And Stomatal Traits For Modelling Drought Resistance In Plants, Zenodo [data set], https://doi.org/10.5281/ZENODO.854700, 2017. a, b, c
Mcdowell, N., Pockman, W. T., Allen, C. D., Breshears, D. D., Cobb, N., Kolb, T., Plaut, J., Sperry, J., West, A., Williams, D. G., and Yepez, E. A.: Mechanisms of Plant Survival and Mortality during Drought: Why Do Some Plants Survive While Others Succumb to Drought?, New Phytol., 178, 719–739, https://doi.org/10.1111/j.1469-8137.2008.02436.x, 2008. a, b, c
Mckay, M. D., Beckman, F. J., and Conover, W. J.: A Comparison of Three Methods for Selecting Values of Input Variables in the Analysis of Output From a Computer Code, Technometrics, 42, 55–61, https://doi.org/10.1080/00401706.2000.10485979, 2000. a
Meyer, B. F.: Data analysis pipeline for “Simulating the drought response of European tree species with the dynamic vegetation model LPJ-GUESS”, Zenodo [data set], https://doi.org/10.5281/ZENODO.14001089, 2024. a
Meyer, B. F., Darela-Filho, J. P., Gregor, K., Buras, A., Gu, Q.-L., Krause, A., Liu, D., Papastefanou, P., Asuk, S., Grams, T. E. E., Zang, C. S., and Rammig, A.: LPJ-GUESS model code used in “Simulating the drought response of European tree species with the dynamic vegetation model LPJ-GUESS”, Zenodo [code], https://doi.org/10.5281/ZENODO.14000805, 2024. a
Méndez-Alonzo, R., Ewers, F. W., Jacobsen, A. L., Pratt, R. B., Scoffoni, C., Bartlett, M. K., and Sack, L.: Covariation between Leaf Hydraulics and Biomechanics Is Driven by Leaf Density in Mediterranean Shrubs, Trees, 33, 507–519, https://doi.org/10.1007/s00468-018-1796-7, 2019. a
Nadal-Sala, D., Ruehr, N. K., and Sabaté, S.: Overcoming drought: life traits driving tree strategies to confront drought stress, J. Exp. Bot., 75, 3758–3761, https://doi.org/10.1093/jxb/erae219, 2024. a
Neycken, A., Scheggia, M., Bigler, C., and Lévesque, M.: Long-Term Growth Decline Precedes Sudden Crown Dieback of European Beech, Agr. Forest Meteorol., 324, 109103, https://doi.org/10.1016/j.agrformet.2022.109103, 2022. a
Nolan, R. H., Gauthey, A., Losso, A., Medlyn, B. E., Smith, R., Chhajed, S. S., Fuller, K., Song, M., Li, X., Beaumont, L. J., Boer, M. M., Wright, I. J., and Choat, B.: Hydraulic Failure and Tree Size Linked with Canopy Die-back in Eucalypt Forest during Extreme Drought, New Phytol., 230, 1354–1365, https://doi.org/10.1111/nph.17298, 2021. a
Nolf, M., Creek, D., Duursma, R., Holtum, J., Mayr, S., and Choat, B.: Stem and Leaf Hydraulic Properties Are Finely Coordinated in Three Tropical Rain Forest Tree Species, Plant Cell Environ., 38, 2652–2661, https://doi.org/10.1111/pce.12581, 2015. a
Nord, J., Anthoni, P., Gregor, K., Gustafson, A., Hantson, S., Lindeskog, M., Meyer, B., Miller, P., Nieradzik, L., Olin, S., Papastefanou, P., Smith, B., Tang, J., Wårlind, D., and Past LPJ-GUESS Contributors: LPJ-GUESS Release v4.1.1 model code, Zenodo [code], https://doi.org/10.5281/ZENODO.8065736, 2021. a
Oberpriller, J., Herschlein, C., Anthoni, P., Arneth, A., Krause, A., Rammig, A., Lindeskog, M., Olin, S., and Hartig, F.: Climate and Parameter Sensitivity and Induced Uncertainties in Carbon Stock Projections for European Forests (Using LPJ-GUESS 4.0), Geosci. Model Dev., 15, 6495–6519, https://doi.org/10.5194/gmd-15-6495-2022, 2022. a, b, c, d
Pammenter, N. W. and Van Der Willigen, C.: A Mathematical and Statistical Analysis of the Curves Illustrating Vulnerability of Xylem to Cavitation, Tree Physiol., 18, 589–593, https://doi.org/10.1093/treephys/18.8-9.589, 1998. a
Pan, Y., Birdsey, R. A., Fang, J., Houghton, R., Kauppi, P. E., Kurz, W. A., Phillips, O. L., Shvidenko, A., Lewis, S. L., Canadell, J. G., Ciais, P., Jackson, R. B., Pacala, S. W., Mcguire, A. D., Piao, S., Rautiainen, A., Sitch, S., and Hayes, D.: A Large and Persistent Carbon Sink in the World's Forests, Science, 333, 988–993, https://doi.org/10.1126/science.1201609, 2011. a, b
Pan, Y., Birdsey, R. A., Phillips, O. L., Houghton, R. A., Fang, J., Kauppi, P. E., Keith, H., Kurz, W. A., Ito, A., Lewis, S. L., Nabuurs, G.-J., Shvidenko, A., Hashimoto, S., Lerink, B., Schepaschenko, D., Castanho, A., and Murdiyarso, D.: The Enduring World Forest Carbon Sink, Nature, 631, 563–569, https://doi.org/10.1038/s41586-024-07602-x, 2024. a
Papastefanou, P., Zang, C. S., Pugh, T. A. M., Liu, D., Grams, T. E. E., Hickler, T., and Rammig, A.: A Dynamic Model for Strategies and Dynamics of Plant Water-Potential Regulation Under Drought Conditions, Front. Plant Sci., 11, 373, https://doi.org/10.3389/fpls.2020.00373, 2020. a, b, c, d, e, f, g
Papastefanou, P., Pugh, T. A. M., Buras, A., Fleischer, K., Grams, T. E. E., Hickler, T., Lapola, D., Liu, D., Zang, C. S., and Rammig, A.: Simulated sensitivity of the Amazon rainforest to extreme drought, Environ. Res. Lett., 19, 124072, https://doi.org/10.1088/1748-9326/ad8f48, 2024. a, b, c, d, e
Pappas, C., Fatichi, S., Leuzinger, S., Wolf, A., and Burlando, P.: Sensitivity Analysis of a Process-Based Ecosystem Model: Pinpointing Parameterization and Structural Issues, J. Geophys. Res.-Biogeo., 118, 505–528, https://doi.org/10.1002/jgrg.20035, 2013. a
Parton, W. J., Scurlock, J. M. O., Ojima, D. S., Gilmanov, T. G., Scholes, R. J., Schimel, D. S., Kirchner, T., Menaut, J.-C., Seastedt, T., Garcia Moya, E., Kamnalrut, A., and Kinyamario, J. I.: Observations and Modeling of Biomass and Soil Organic Matter Dynamics for the Grassland Biome Worldwide, Global Biogeochem. Cy., 7, 785–809, https://doi.org/10.1029/93GB02042, 1993. a
Parton, W. J., Hanson, P. J., Swanston, C., Torn, M., Trumbore, S. E., Riley, W., and Kelly, R.: ForCent Model Development and Testing Using the Enriched Background Isotope Study Experiment, J. Geophys. Res.-Biogeo., 115, G04001, https://doi.org/10.1029/2009JG001193, 2010. a
Pastorello, G., Trotta, C., Canfora, E., Chu, H., Christianson, D., Cheah, Y.-W., Poindexter, C., Chen, J., Elbashandy, A., Humphrey, M., Isaac, P., Polidori, D., Reichstein, M., Ribeca, A., Van Ingen, C., Vuichard, N., Zhang, L., Amiro, B., Ammann, C., Arain, M. A., Ardö, J., Arkebauer, T., Arndt, S. K., Arriga, N., Aubinet, M., Aurela, M., Baldocchi, D., Barr, A., Beamesderfer, E., Marchesini, L. B., Bergeron, O., Beringer, J., Bernhofer, C., Berveiller, D., Billesbach, D., Black, T. A., Blanken, P. D., Bohrer, G., Boike, J., Bolstad, P. V., Bonal, D., Bonnefond, J.-M., Bowling, D. R., Bracho, R., Brodeur, J., Brümmer, C., Buchmann, N., Burban, B., Burns, S. P., Buysse, P., Cale, P., Cavagna, M., Cellier, P., Chen, S., Chini, I., Christensen, T. R., Cleverly, J., Collalti, A., Consalvo, C., Cook, B. D., Cook, D., Coursolle, C., Cremonese, E., Curtis, P. S., D'Andrea, E., Da Rocha, H., Dai, X., Davis, K. J., Cinti, B. D., Grandcourt, A. D., Ligne, A. D., De Oliveira, R. C., Delpierre, N., Desai, A. R., Di Bella, C. M., Tommasi, P. D., Dolman, H., Domingo, F., Dong, G., Dore, S., Duce, P., Dufrêne, E., Dunn, A., Dušek, J., Eamus, D., Eichelmann, U., Elkhidir, H. A. M., Eugster, W., Ewenz, C. M., Ewers, B., Famulari, D., Fares, S., Feigenwinter, I., Feitz, A., Fensholt, R., Filippa, G., Fischer, M., Frank, J., Galvagno, M., Gharun, M., Gianelle, D., Gielen, B., Gioli, B., Gitelson, A., Goded, I., Goeckede, M., Goldstein, A. H., Gough, C. M., Goulden, M. L., Graf, A., Griebel, A., Gruening, C., Grünwald, T., Hammerle, A., Han, S., Han, X., Hansen, B. U., Hanson, C., Hatakka, J., He, Y., Hehn, M., Heinesch, B., Hinko-Najera, N., Hörtnagl, L., Hutley, L., Ibrom, A., Ikawa, H., Jackowicz-Korczynski, M., Janouš, D., Jans, W., Jassal, R., Jiang, S., Kato, T., Khomik, M., Klatt, J., Knohl, A., Knox, S., Kobayashi, H., Koerber, G., Kolle, O., Kosugi, Y., Kotani, A., Kowalski, A., Kruijt, B., Kurbatova, J., Kutsch, W. L., Kwon, H., Launiainen, S., Laurila, T., Law, B., Leuning, R., Li, Y., Liddell, M., Limousin, J.-M., Lion, M., Liska, A. J., Lohila, A., López-Ballesteros, A., López-Blanco, E., Loubet, B., Loustau, D., Lucas-Moffat, A., Lüers, J., Ma, S., Macfarlane, C., Magliulo, V., Maier, R., Mammarella, I., Manca, G., Marcolla, B., Margolis, H. A., Marras, S., Massman, W., Mastepanov, M., Matamala, R., Matthes, J. H., Mazzenga, F., Mccaughey, H., Mchugh, I., Mcmillan, A. M. S., Merbold, L., Meyer, W., Meyers, T., Miller, S. D., Minerbi, S., Moderow, U., Monson, R. K., Montagnani, L., Moore, C. E., Moors, E., Moreaux, V., Moureaux, C., Munger, J. W., Nakai, T., Neirynck, J., Nesic, Z., Nicolini, G., Noormets, A., Northwood, M., Nosetto, M., Nouvellon, Y., Novick, K., Oechel, W., Olesen, J. E., Ourcival, J.-M., Papuga, S. A., Parmentier, F.-J., Paul-Limoges, E., Pavelka, M., Peichl, M., Pendall, E., Phillips, R. P., Pilegaard, K., Pirk, N., Posse, G., Powell, T., Prasse, H., Prober, S. M., Rambal, S., Rannik, Ü., Raz-Yaseef, N., Rebmann, C., Reed, D., Dios, V. R. D., Restrepo-Coupe, N., Reverter, B. R., Roland, M., Sabbatini, S., Sachs, T., Saleska, S. R., Sánchez-Cañete, E. P., Sanchez-Mejia, Z. M., Schmid, H. P., Schmidt, M., Schneider, K., Schrader, F., Schroder, I., Scott, R. L., Sedlák, P., Serrano-Ortíz, P., Shao, C., Shi, P., Shironya, I., Siebicke, L., Šigut, L., Silberstein, R., Sirca, C., Spano, D., Steinbrecher, R., Stevens, R. M., Sturtevant, C., Suyker, A., Tagesson, T., Takanashi, S., Tang, Y., Tapper, N., Thom, J., Tomassucci, M., Tuovinen, J.-P., Urbanski, S., Valentini, R., Van Der Molen, M., Van Gorsel, E., Van Huissteden, K., Varlagin, A., Verfaillie, J., Vesala, T., Vincke, C., Vitale, D., Vygodskaya, N., Walker, J. P., Walter-Shea, E., Wang, H., Weber, R., Westermann, S., Wille, C., Wofsy, S., Wohlfahrt, G., Wolf, S., Woodgate, W., Li, Y., Zampedri, R., Zhang, J., Zhou, G., Zona, D., Agarwal, D., Biraud, S., Torn, M., and Papale, D.: The FLUXNET2015 Dataset and the ONEFlux Processing Pipeline for Eddy Covariance Data, Sci. Data, 7, 225, https://doi.org/10.1038/s41597-020-0534-3, 2020. a, b
Peters, R. L., Steppe, K., Cuny, H. E., De Pauw, D. J., Frank, D. C., Schaub, M., Rathgeber, C. B., Cabon, A., and Fonti, P.: Turgor – a Limiting Factor for Radial Growth in Mature Conifers along an Elevational Gradient, New hytol., 229, 213–229, https://doi.org/10.1111/nph.16872, 2021. a, b
Potkay, A., Hölttä, T., Trugman, A. T., and Fan, Y.: Turgor-Limited Predictions of Tree Growth, Height and Metabolic Scaling over Tree Lifespans, Tree Physiol., 42, 229–252, https://doi.org/10.1093/treephys/tpab094, 2022. a
Powell, T. L., Galbraith, D. R., Christoffersen, B. O., Harper, A., Imbuzeiro, H. M. A., Rowland, L., Almeida, S., Brando, P. M., Da Costa, A. C. L., Costa, M. H., Levine, N. M., Malhi, Y., Saleska, S. R., Sotta, E., Williams, M., Meir, P., and Moorcroft, P. R.: Confronting Model Predictions of Carbon Fluxes with Measurements of Amazon Forests Subjected to Experimental Drought, New Phytol., 200, 350–365, https://doi.org/10.1111/nph.12390, 2013. a
Pugh, T. A. M., Arneth, A., Kautz, M., Poulter, B., and Smith, B.: Important Role of Forest Disturbances in the Global Biomass Turnover and Carbon Sinks, Nat. Geosci., 12, 730–735, https://doi.org/10.1038/s41561-019-0427-2, 2019. a
Puy, A., Piano, S. L., Saltelli, A., and Levin, S. A.: sensobol: An R Package to Compute Variance-Based Sensitivity Indices, J. Stat. Soft., 102, 1–37, https://doi.org/10.18637/jss.v102.i05, 2022. a
Rouault, G., Candau, J.-N., Lieutier, F., Nageleisen, L.-M., Martin, J.-C., and Warzée, N.: Effects of Drought and Heat on Forest Insect Populations in Relation to the 2003 Drought in Western Europe, Ann. Forest Sci., 63, 613–624, https://doi.org/10.1051/forest:2006044, 2006. a
Ruffault, J., Pimont, F., Cochard, H., Dupuy, J.-L., and Martin-StPaul, N.: SurEau-Ecos v2.0: A Trait-Based Plant Hydraulics Model for Simulations of Plant Water Status and Drought-Induced Mortality at the Ecosystem Level, Geosci. Model Dev., 15, 5593–5626, https://doi.org/10.5194/gmd-15-5593-2022, 2022. a, b
Saltelli, A. (Ed.): Global Sensitivity Analysis: The Primer, Wiley, Chichester, West Sussex, ISBN 978-0-470-05997-5, 2008. a, b, c, d, e
Saltelli, A., Annoni, P., Azzini, I., Campolongo, F., Ratto, M., and Tarantola, S.: Variance Based Sensitivity Analysis of Model Output. Design and Estimator for the Total Sensitivity Index, Comput. Phys. Commun., 181, 259–270, https://doi.org/10.1016/j.cpc.2009.09.018, 2010. a, b
Saxton, K. E., Rawls, W. J., Romberger, J. S., and Papendick, R. I.: Estimating Generalized Soil-water Characteristics from Texture, Soil Sci. Soc. Am. J., 50, 1031–1036, https://doi.org/10.2136/sssaj1986.03615995005000040039x, 1986. a, b, c
Schönbeck, L. C., Schuler, P., Lehmann, M. M., Mas, E., Mekarni, L., Pivovaroff, A. L., Turberg, P., and Grossiord, C.: Increasing Temperature and Vapour Pressure Deficit Lead to Hydraulic Damages in the Absence of Soil Drought, Plant Cell Environ., 45, 3275–3289, https://doi.org/10.1111/pce.14425, 2022. a, b
Schuldt, B., Buras, A., Arend, M., Vitasse, Y., Beierkuhnlein, C., Damm, A., Gharun, M., Grams, T. E., Hauck, M., Hajek, P., Hartmann, H., Hiltbrunner, E., Hoch, G., Holloway-Phillips, M., Körner, C., Larysch, E., Lübbe, T., Nelson, D. B., Rammig, A., Rigling, A., Rose, L., Ruehr, N. K., Schumann, K., Weiser, F., Werner, C., Wohlgemuth, T., Zang, C. S., and Kahmen, A.: A First Assessment of the Impact of the Extreme 2018 Summer Drought on Central European Forests, Basic Appl. Ecol., 45, 86–103, https://doi.org/10.1016/j.baae.2020.04.003, 2020. a, b
Scoffoni, C., Rawls, M., McKown, A., Cochard, H., and Sack, L.: Decline of Leaf Hydraulic Conductance with Dehydration: Relationship to Leaf Size and Venation Architecture, Plant Physiol., 156, 832–843, https://doi.org/10.1104/pp.111.173856, 2011. a
Seiler, C., Melton, J. R., Arora, V. K., Sitch, S., Friedlingstein, P., Anthoni, P., Goll, D., Jain, A. K., Joetzjer, E., Lienert, S., Lombardozzi, D., Luyssaert, S., Nabel, J. E. M. S., Tian, H., Vuichard, N., Walker, A. P., Yuan, W., and Zaehle, S.: Are Terrestrial Biosphere Models Fit for Simulating the Global Land Carbon Sink?, J. Adv. Model. Earth Syst., 14, e2021MS002946, https://doi.org/10.1029/2021ms002946, 2022. a, b
Senf, C., Buras, A., Zang, C. S., Rammig, A., and Seidl, R.: Excess Forest Mortality Is Consistently Linked to Drought across Europe, Nat. Commun., 11, 6200, https://doi.org/10.1038/s41467-020-19924-1, 2020. a
Sitch, S., Smith, B., Prentice, I. C., Arneth, A., Bondeau, A., Cramer, W., Kaplan, J. O., Levis, S., Lucht, W., Sykes, M. T., Thonicke, K., and Venevsky, S.: Evaluation of Ecosystem Dynamics, Plant Geography and Terrestrial Carbon Cycling in the LPJ Dynamic Global Vegetation Model, Global Change Biol., 9, 161–185, https://doi.org/10.1046/j.1365-2486.2003.00569.x, 2003. a, b
Smith, B., Prentice, I. C., and Sykes, M. T.: Representation of Vegetation Dynamics in the Modelling of Terrestrial Ecosystems: Comparing Two Contrasting Approaches within European Climate Space: Vegetation Dynamics in Ecosystem Models, Global Ecol. Biogeogr., 10, 621–637, https://doi.org/10.1046/j.1466-822X.2001.t01-1-00256.x, 2001. a, b
Smith, B., Wårlind, D., Arneth, A., Hickler, T., Leadley, P., Siltberg, J., and Zaehle, S.: Implications of Incorporating N Cycling and N Limitations on Primary Production in an Individual-Based Dynamic Vegetation Model, Biogeosciences, 11, 2027–2054, https://doi.org/10.5194/bg-11-2027-2014, 2014. a
Sperry, J. S., Adler, F. R., Campbell, G. S., and Comstock, J. P.: Limitation of Plant Water Use by Rhizosphere and Xylem Conductance: Results from a Model, Plant Cell Environ., 21, 347–359, https://doi.org/10.1046/j.1365-3040.1998.00287.x, 1998. a
Steppe, K., De Pauw, D. J. W., Lemeur, R., and Vanrolleghem, P. A.: A Mathematical Model Linking Tree Sap Flow Dynamics to Daily Stem Diameter Fluctuations and Radial Stem Growth, Tree Physiol., 26, 257–273, https://doi.org/10.1093/treephys/26.3.257, 2006. a
Sulman, B. N., Roman, D. T., Yi, K., Wang, L., Phillips, R. P., and Novick, K. A.: High Atmospheric Demand for Water Can Limit Forest Carbon Uptake and Transpiration as Severely as Dry Soil, Geophys. Res. Lett., 43, 9686–9695, https://doi.org/10.1002/2016GL069416, 2016. a
Sykes, M. T. and Prentice, I.: Climate Change, Tree Species Distributions and Forest Dynamics: A Case Study in the Mixed Conifer/Northern Hardwoods Zone of Northern Europe, Climatic Change, 34, 161–177, https://doi.org/10.1007/bf00224628, 1996. a
Tardieu, F., Simonneau, T., and Parent, B.: Modelling the Coordination of the Controls of Stomatal Aperture, Transpiration, Leaf Growth, and Abscisic Acid: Update and Extension of the Tardieu–Davies Model, J. Exp. Bot., 66, 2227–2237, https://doi.org/10.1093/jxb/erv039, 2015. a
Torres-Ruiz, J. M., Cochard, H., Delzon, S., Boivin, T., Burlett, R., Cailleret, M., Corso, D., Delmas, C. E. L., De Caceres, M., Diaz-Espejo, A., Fernández-Conradi, P., Guillemot, J., Lamarque, L. J., Limousin, J.-M., Mantova, M., Mencuccini, M., Morin, X., Pimont, F., De Dios, V. R., Ruffault, J., Trueba, S., and Martin-Stpaul, N. K.: Plant Hydraulics at the Heart of Plant, Crops and Ecosystem Functions in the Face of Climate Change, New Phytol., 241, 984–999, https://doi.org/10.1111/nph.19463, 2024. a
Tschumi, E., Lienert, S., Bastos, A., Ciais, P., Gregor, K., Joos, F., Knauer, J., Papastefanou, P., Rammig, A., van der Wiel, K., Williams, K., Xu, Y., Zaehle, S., and Zscheischler, J.: Large Variability in Simulated Response of Vegetation Composition and Carbon Dynamics to Variations in Drought-Heat Occurrence, J. Geophys. Res.-Biogeo., 128, e2022JG007332, https://doi.org/10.1029/2022JG007332, 2023. a
Tyree, M. T. and Sperry, J. S.: Vulnerability of Xylem to Cavitation and Embolism, Annu. Rev. Plant Physiol. Plant Molec. Biol., 40, 19–36, https://doi.org/10.1146/annurev.pp.40.060189.000315, 1989. a
Tyree, M. T., Davis, S. D., and Cochard, H.: Biophysical Perspectives of Xylem Evolution: Is There a Tradeoff of Hydraulic Efficiency for Vulnerability to Dysfunction?, IAWA J., 15, 335–360, 1994. a
van der Woude, A. M., Peters, W., Joetzjer, E., Lafont, S., Koren, G., Ciais, P., Ramonet, M., Xu, Y., Bastos, A., Botía, S., Sitch, S., de Kok, R., Kneuer, T., Kubistin, D., Jacotot, A., Loubet, B., Herig-Coimbra, P.-H., Loustau, D., and Luijkx, I. T.: Temperature Extremes of 2022 Reduced Carbon Uptake by Forests in Europe, Nature Commun., 14, 6218, https://doi.org/10.1038/s41467-023-41851-0, 2023. a, b, c
Wagner, Y., Volkov, M., Nadal-Sala, D., Ruehr, N. K., Hochberg, U., and Klein, T.: Relationships between Xylem Embolism and Tree Functioning during Drought, Recovery, and Recurring Drought in Aleppo Pine, Physiol. Plant., 175, e13995, https://doi.org/10.1111/ppl.13995, 2023. a
Walthert, L., Ganthaler, A., Mayr, S., Saurer, M., Waldner, P., Walser, M., Zweifel, R., and von Arx, G.: From the Comfort Zone to Crown Dieback: Sequence of Physiological Stress Thresholds in Mature European Beech Trees across Progressive Drought, Sci. Total Environ., 753, 141792, https://doi.org/10.1016/j.scitotenv.2020.141792, 2021. a, b
Warm Winter 2020 Team and ICOS Ecosystem Thematic Centre: Warm Winter 2020 Ecosystem Eddy Covariance Flux Product for 73 Stations in FLUXNET-Archive Format – Release 2022-1 (Version 1.0), https://doi.org/10.18160/2G60-ZHAK, 2022. a, b, c
Whitehead, D.: Regulation of Stomatal Conductance and Transpiration in Forest Canopies, Tree Physiol., 18, 633–644, https://doi.org/10.1093/treephys/18.8-9.633, 1998. a
Xu, C., Christoffersen, B., Robbins, Z., Knox, R., Fisher, R. A., Chitra-Tarak, R., Slot, M., Solander, K., Kueppers, L., Koven, C., and McDowell, N.: Quantification of Hydraulic Trait Control on Plant Hydrodynamics and Risk of Hydraulic Failure within a Demographic Structured Vegetation Model in a Tropical Forest (FATES–HYDRO V1.0), Geosci. Model Dev., 16, 6267–6283, https://doi.org/10.5194/gmd-16-6267-2023, 2023. a, b
Xu, X., Medvigy, D., Powers, J. S., Becknell, J. M., and Guan, K.: Diversity in Plant Hydraulic Traits Explains Seasonal and Inter-Annual Variations of Vegetation Dynamics in Seasonally Dry Tropical Forests, New Phytol., 212, 80–95, https://doi.org/10.1111/nph.14009, 2016. a, b
Yao, Y., Joetzjer, E., Ciais, P., Viovy, N., Cresto Aleina, F., Chave, J., Sack, L., Bartlett, M., Meir, P., Fisher, R., and Luyssaert, S.: Forest Fluxes and Mortality Response to Drought: Model Description (ORCHIDEE-CAN-NHA R7236) and Evaluation at the Caxiuanã Drought Experiment, Geosci. Model Dev., 15, 7809–7833, https://doi.org/10.5194/gmd-15-7809-2022, 2022. a, b
Zaehle, S., Sitch, S., Smith, B., and Hatterman, F.: Effects of Parameter Uncertainties on the Modeling of Terrestrial Biosphere Dynamics, Global Biogeochem. Cy., 19, 2004GB002395, https://doi.org/10.1029/2004GB002395, 2005. a, b, c
Zhou, H., Tang, J., Olin, S., and Miller, P. A.: A Comprehensive Evaluation of Hydrological Processes in a Second-Generation Dynamic Vegetation Model, Hydrol. Process., 38, e15152, https://doi.org/10.1002/hyp.15152, 2024. a
Zhou, S., Duursma, R. A., Medlyn, B. E., Kelly, J. W. G., and Prentice, I. C.: How Should We Model Plant Responses to Drought? An Analysis of Stomatal and Non-Stomatal Responses to Water Stress, Agr. Forest Meteorol., 182–183, 204–214, https://doi.org/10.1016/j.agrformet.2013.05.009, 2013. a
Zweifel, R., Haeni, M., Buchmann, N., and Eugster, W.: Are Trees Able to Grow in Periods of Stem Shrinkage?, New Phytol., 211, 839–849, https://doi.org/10.1111/nph.13995, 2016. a