the Creative Commons Attribution 4.0 License.
the Creative Commons Attribution 4.0 License.
 | 04 Jul 2025
Impact of multiple radar wind profiler data assimilation on convective-scale short-term rainfall forecasts: OSSE studies over the Beijing–Tianjin–Hebei region
Juan Zhao
Jianping Guo
Xiaohui Zheng
The optimal spatial layout of a radar wind profiler (RWP) network for rainfall forecasting, especially over complex terrain, remains uncertain. This study explores the benefits of assimilating vertical wind measurements from various RWP network layouts into convective-scale numerical weather prediction (NWP) through Observing System Simulation Experiments (OSSEs). Synthetic RWP data were assimilated into the Weather Research and Forecasting (WRF) model using the National Severe Storms Laboratory three-dimensional variational data assimilation (DA) system for three southwest (SW)-type heavy rainfall events in the Beijing–Tianjin–Hebei region. Four types of DA experiments were conducted and compared: a control experiment (CTL) that assimilates data solely from the operational RWP network and three additional experiments incorporating foothill (FH), ridge (RD), and combined foothill–ridge (FH_RD) RWP network layouts. A detailed examination of the 21 July 2023 case reveals that the FH_RD experiment generally exhibits more skillful storm forecasts in terms of areal coverage, storm mode, and orientation, benefiting from refined mesoscale wind analysis. Particularly, in the RD experiment, RWP data assimilation notably reduces wind errors and improves the representation of mesoscale atmospheric features near the Taihang Mountains upstream of Beijing, crucial for convective initiation (CI). Aggregated score metrics across all cases also indicate that both FH and RD experiments offer substantial added value over the operational network alone. Further sensitivity experiments on vertical resolution and maximum detection height indicate that the RWP system configuration with the highest detection height achieves the best performance, while lower detection height degrades forecast quality. These findings highlight the importance of strategic RWP network placement along the Taihang Mountains' ridge and foothill for short-term quantitative precipitation forecast in the Beijing–Tianjin–Hebei region.
- Article
(16342 KB) - Full-text XML
- BibTeX
- EndNote


Radar wind profilers (RWPs) are state-of-the-art meteorological observation instruments that provide wind profiles at 6 min intervals with a vertical resolution ranging from 60 to 240 m, enabling the detection of fine-scale atmospheric dynamic structures throughout the troposphere. Research studies have demonstrated the capability of RWP to observe the evolution of mesoscale cyclonic circulations, shear lines, and low-level jets (LLJs), which are closely associated with the development of heavy rainfall and convection (Dunn, 1986; Guo et al., 2023; Liu et al., 2003; Wang et al., 2023b; Zhong et al., 1996). The wind observations from RWPs are expected to improve initial conditions and severe weather forecasts for convective-scale numerical weather prediction (NWP) through data assimilation (DA). Significant progress has been made in RWP data assimilation, resulting in wind analysis error reduction and short-term forecast skill enhancement (Benjamin et al., 2004b; Bouttier, 2001; Ishihara et al., 2006; Liu et al., 2022; St-James and Laroche, 2005; Wang et al., 2022; Zhang et al., 2016). Furthermore, efforts in developing quality control and observation operator schemes are also critical to ensuring the reliability of the observations and enhancing assimilation effectiveness (Wang et al., 2020, 2023a; Zhang et al., 2016, 2017).
In China, the deployment of a nationwide RWP network was initiated in 2008, with over 260 sites established by the end of 2024. These sites primarily utilize the 1290 MHz Doppler radar to monitor the lower and middle atmosphere (Liu et al., 2020). Currently, the nationwide RWP network is unevenly distributed: the spatial concentration of RWP sites over densely populated metropolitan regions, such as the Beijing–Tianjin–Hebei region, Yangtze River Delta, and Pearl River Delta, is above the national average, while the other regions, especially in west-central China, are lagged behind. Notably, in regions where observation data are relatively abundant, there is still an issue of uneven spatial distribution of stations, mainly due to the terrain complexity. Taking the RWP network in the Beijing–Tianjin–Hebei (BTH) region as an example, seven RWPs are deployed in Beijing within an area of approximately 100 km × 100 km, while there are only 11 profilers in the whole of the Hebei Province (Wang et al., 2022; refer to blue stars in Fig. 3).
Accurate short-term forecasts of heavy rainfall are crucial for mitigating the risks posed by severe weather events in the BTH region, one of China's most densely populated and economically vital areas. The BTH region includes the cities of Beijing and Tianjin, and the Hebei Province and is bounded by the Taihang Mountains to the west and Bohai Bay to the east (Fig. 3). Its complex terrain features high elevations in the northwest and north, gradually transitioning into plains in the south and east. The dominant weather circulations affecting heavy rainfall in the BTH region include the cold vortex, the cold trough, and the trough–anticyclone patterns (Sheng et al., 2020; Zhao et al., 2018; Zhou et al., 2018). The complex underlying surface and the interaction with synoptic-scale and mesoscale weather processes make the initiation and maintenance mechanisms of convective systems in the BTH region highly unique. Convective initiation (CI) is especially difficult to predict due to local environmental uncertainties and the rapid evolution of meteorological variables. The existing RWP network is mainly located in urban and lowland areas (Fig. 3, blue stars), while mountainous regions like the Taihang Mountains, where significant terrain-induced convection occurs, are in shortage of sufficient wind profile observations (Liu et al., 2020). These observational gaps can lead to suboptimal initial conditions in NWP models, thereby reducing the accuracy of short-term precipitation forecasts. Therefore, optimizing the distribution of the RWP network, particularly in the Taihang Mountains, could strengthen the ability to monitor these critical regions and improve quantitative precipitation forecasts.
Observation System Simulation Experiments (OSSEs) are widely used to assess the impact of assimilating specific observational data into NWP models (Huang et al., 2022; Zhao et al., 2021a). Previous studies by Zhang and Pu (2010) and Hu et al. (2017) have demonstrated the effectiveness of OSSEs in evaluating the benefits of assimilating RWP data for improving forecasts. Recent research (Bucci et al., 2021; Huo et al., 2023) has also highlighted the advantages of joint assimilation of multiple observational platforms to enhance analysis of convective dynamics, underlining the importance of an optimized RWP network. These OSSEs have provided valuable insights into the strategic RWP site placement to maximize their impact on model performance. To our knowledge, there is little peer-reviewed published research investigating the potential benefit of a RWP network in complex terrain on mesoscale and convective-scale weather forecasts (Bucci et al., 2021; Hu et al., 2017; Huo et al., 2023; Zhang and Pu, 2010).
To investigate the impact of a RWP network in complex terrain on heavy rainfall forecasts, we focus on southwest (SW)-type rainfall events associated with southwesterly flow, which constitutes approximately 40 % of the total circulation patterns in the BTH region during early summer (Li et al., 2024; Zhou et al., 2018). When warm, moist air from the south meets the cold air from the Taihang Mountains, the terrain causes the air to rise, enhancing convective activity. Meanwhile, the topography of the Taihang Mountains affects the distribution and intensity of the wind field, particularly during severe convective weather events (Li et al., 2024; Sheng et al., 2020). For example, a prior study showed that the quasi-linear convective systems with extreme heavy rainfall primarily occurred at the foothills of the Taihang Mountains or in the plains close to the foothills (Sheng et al., 2020). To address observational gaps, simulated RWP stations are strategically placed along the ridge and foothills, reinforcing the existing operational network.
In this study, the following questions will be addressed. How does the assimilation of RWPs from ridge and foothill sites combined with that from operational stations impact heavy rainfall forecast in the BTH region? Do ridge and foothill networks offer added forecast skill over the operational RWP network on short-term convective-scale NWP? Are the benefits of assimilating RWP observations sensitive to the vertical resolution and maximum detection height of profilers? Ultimately, this research aims to provide guidance on optimizing the RWP network to improve forecasting accuracy for heavy rainfall events in the BTH region, thereby enhancing disaster preparedness and response strategies in the region.
To address these questions, a series of OSSEs are conducted, assuming a perfect model, using three representative southwest (SW)-type heavy rainfall cases. The remainder of this paper is organized as follows: Sect. 2 provides an overview of the NWP model and data assimilation system. Truth and background simulation configuration, synthetic observations, experiment design, and evaluation methods are presented in Sect. 3. Section 4 presents the analysis and forecast results for the 21 July 2023 case, as well as the aggregated performance across all three cases. Section 5 summarizes the key findings and conclusions.
The forecast model used in this study is version 3.7.1 of the Weather Research and Forecasting Model (WRF) with the Advanced Research WRF (ARW) dynamic solver (WRF-ARW; Skamarock et al., 2008). All DA and forecast experiments are performed on a 1.5 km grid of 408×480 horizontal points and 51 vertical levels with a model top at 50 hPa. The domain is centered in the northern part of China covering the Beijing–Tianjin–Hebei region (Fig. 3). The physical parameterizations include the National Severe Storms Laboratory (NSSL) two-moment four-ice-category bulk microphysics scheme (Mansell et al., 2010; Mansell and Ziegler, 2013; Ziegler, 1985), the Rapid Radiative Transfer Model (RRTM) longwave radiation scheme (Mlawer et al., 1997), the Dudhia shortwave radiation scheme (Dudhia, 1989), the Rapid Update Cycle (RUC) land surface scheme (Benjamin et al., 2004a), and the Yonsei University (YSU) planetary boundary layer (PBL) scheme (Hong et al., 2006).
This research employs the NSSL Experimental Warn-on-Forecast (WoF) 3DVAR system (NSSL3DVAR) (Gao et al., 2013, 2016; Gao and Stensrud, 2014; Wang et al., 2019; Zhuang et al., 2016), specifically designed for convective-scale NWP and thunderstorm forecasting (Gao et al., 2024; Heinselman et al., 2024). In the NSSL3DVAR system, the analysis is derived by minimizing the cost function defined as the background term Jb and the observation term Jo plus the constraint term Jc:
where x and xb are the analysis and background state vectors, respectively; H is the observation operator projecting analysis into the observational space; and yo is the observation vector. B is the background error covariance matrix, and R is the observation error covariance matrix. Jc represents weak constraints, which include elastic mass continuity equation and diagnostic pressure equation constraints suitable for convective-scale data assimilation (Gao et al., 2004; Ge et al., 2012). Analysis variables include the three-dimensional wind fields; air pressure; potential temperature; water vapor mixing ratio; and the hydrometeors containing the mass mixing ratios for cloud water, rainwater, ice, snow, and graupel (Gao and Stensrud, 2012).
The NSSL3DVAR system assimilates multi-sensor high-resolution observations like radar radial velocity and reflectivity (Gao et al., 2013, 2016), sounding and surface data (Hu et al., 2021), and multiple satellite-retrieved products, such as cloud water path (Pan et al., 2021), total precipitable water (Jones et al., 2018; Pan et al., 2018), atmospheric motion vectors (Mallick and Jones, 2020; Zhao et al., 2021b, 2022), and Geostationary Lightning Mapper (GLM)-derived water vapor (Fierro et al., 2019; Hu et al., 2020). To enhance the wind field analysis, particularly in the PBL, this study incorporates a RWP assimilation module into the system. Since heavy rainfall and other severe weather events require fast and timely delivery of forecasts and early warning to the public, computationally efficient 3DVAR is quite suitable for the severe weather forecasts by providing highly efficient and rapid updating analysis and forecast, such as 15 min cycle intervals. Our focus is to assess the potential impacts of RWP network enhancements on convective-scale analysis and short-term severe weather prediction with this efficient DA method, so we did not use the ensemble derived background error covariance, which is also incorporated in the variational framework (Gao et al., 2016; Gao and Stensrud, 2014; Wang et al., 2019). The background error covariance matrix used in this study is constructed as the product of a diagonal matrix representing the standard deviations of background errors and a spatial recursive filter (Gao et al., 2004, 2013). The standard deviations for the pressure, potential temperature, relative humidity, and zonal and meridional wind components are derived from the statistics of the Rapid Update Cycle (RUC, Benjamin et al., 2004a) 3 h forecasts over several years (Fierro et al., 2019; Pan et al., 2021). The background error correlations are modeled by the recursive filter described by Purser et al. (2003a, b). The recursive filter can be applied in multiple passes (or outer loops), using different correlation length scales tailored to the scale of the weather systems represented by the assimilated observations.
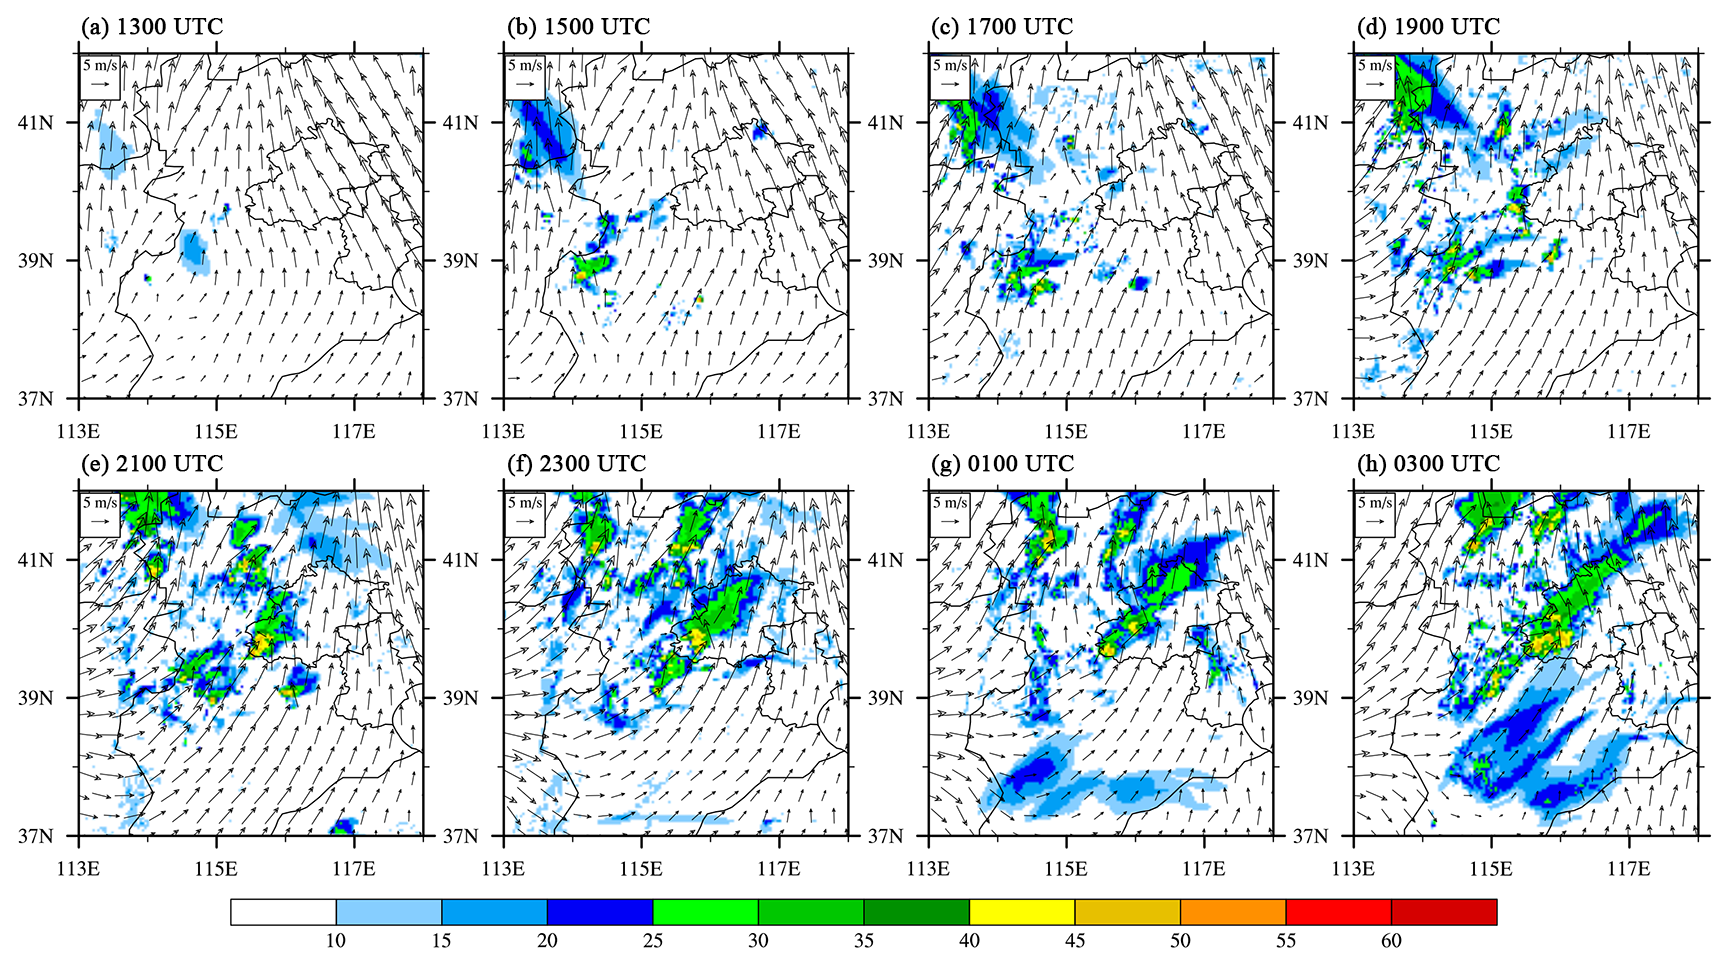
Figure 1Simulated composite reflectivity (dBZ, shaded) and winds at 700 hPa (m s−1, vectors) for the truth simulation from 13:00 UTC 20 July to 03:00 UTC 21 July 2023.
3.1 Truth run and background run for OSSEs
In the OSSE, synthetic RWP observations are generated by adding observation errors to the truth run. To obtain this truth run, the WRF model is initialized with the fifth-generation European Centre for Medium-range Weather Forecasts (ECMWF) atmospheric reanalysis of the global climate (ERA5; Hersbach et al., 2020; Hoffmann et al., 2019), based on the model configuration and parameterization schemes described in Sect. 2. Three SW-type heavy rainfall cases that occurred over the Beijing–Tianjin–Hebei region on 28 June, 12 and 21 July 2023 are selected to construct OSSEs and assess the impact of RWP data observed from different spatial layout schemes on convective initiation and the development of storms. For each case, the model is initialized using the ERA5 data and integrated forward for 15 h, with the boundary conditions also provided by the hourly ERA5 data. An overview of composite reflectivity in the truth simulation from the case on 21 July 2023 is shown in Fig. 1 as an example. This case was characterized by the presence of an upper-level trough gradually moving eastward into the Beijing–Tianjin–Hebei region, accompanied by a corresponding low-level vortex before the evening of 20 July. Meanwhile, southeasterly winds at the lower levels continuously transported moisture, leading to high instability in central Hebei and in the western and southern parts of Beijing. The combination of easterly winds and topographical effects created favorable conditions for heavy precipitation. Several discrete storms initiated and developed in west-central Hebei near the foothills of the Taihang Mountains (Fig. 1a–c). With the westerly trough moving east and strong southerly airflow strengthening water vapor transport, scattered convective cells formed in the vicinity of the boundary between Hebei and southwestern Beijing around 19:00 UTC on 20 July, then aggregated and developed into a mesoscale convective system in southwest Beijing (Fig. 1d–f). Additionally, convective storms in west-central Hebei gradually moved northeastward and merged with the mesoscale convective system (Fig. 1g). The convective system slowly moved northeastward and elongated in the southwest–northeast direction (Fig. 1h), persisting across west-central Beijing until 09:00 UTC on 21 July 2023 (Fig. 2).
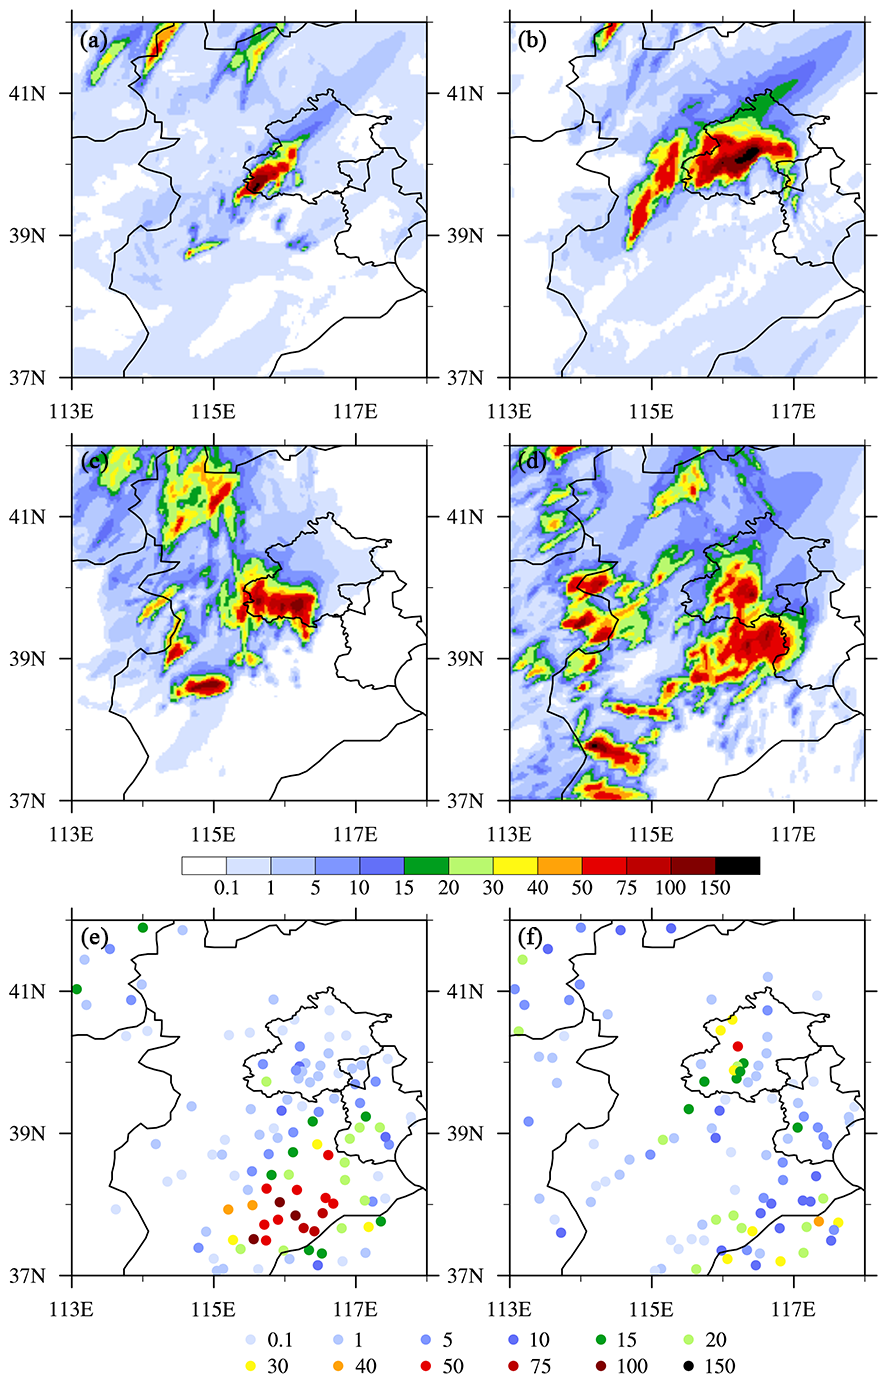
Figure 2The 6 h accumulated precipitation (APCP) forecasts (mm, shaded) from 21:00 UTC 20 July to 03:00 UTC 21 July (a, c, e) and from 03:00 UTC 21 July to 09:00 UTC 21 July 2023 (b, d, f) for (a, b) Truth, (c, d) NoDA experiments, and (e, f) the rain gauge measurements at national weather stations. The rain gauges that did not measure any precipitation are not included here.
This study utilizes an OSSE framework with an identical twin setup, where the same numerical model is used for both the truth simulation and the forecast system. As noted by Hoffman and Atlas (2016), OSSEs with identical twin setups can lead to overly optimistic assessments of data impacts. Therefore, the results should be interpreted within that constraint. To mitigate unrealistic assumptions about observational capabilities and overly optimistic OSSE results, the first-guess background run (NoDA) uses the National Centers for Environmental Prediction (NCEP) Global Forecast System (GFS) forecasts (National Centers for Environmental Prediction et al., 2015) for initial and boundary conditions, which differ from those of the truth run. The 6 h accumulated precipitation (APCP) forecasts from the truth and background runs are verified against the rain gauge measurements at national weather stations in the Beijing–Tianjin–Hebei region (Fig. 2). Compared with the rainfall observations (color-filled dots in Fig. 2e and f), the truth simulation generally captured the southwest-to-northeast orientation and northeastward movement of the observed precipitation in Beijing, although it underpredicted the precipitation in southeastern Hebei (Fig. 2a and b). Conversely, NoDA produced a more west–east-oriented rainfall pattern south of Beijing, rather than a southwest-to-northeast band structure. NoDA missed the precipitation in southeastern Hebei (Fig. 2c), whereas it overpredicted the rainfall in western Hebei and areas along Beijing's southern border (Fig. 2d). Notably, the NoDA experiment failed to predict the convection in southwestern Beijing during the CI stage (discussed later in Sect. 4.1.2).
3.2 Synthetic RWP observations
The real-time Chinese RWP network provides horizontal wind direction, horizontal wind speed, and vertical wind speed at 60–240 m intervals, from the ground surface up to 3–10 km, depending on the operating frequency (Liu et al., 2020). The network comprises three RWP types: high-troposphere, low-troposphere, and boundary layer RWPs, with the majority being boundary layer RWPs operating in the L band. The China Meteorological Administration's data center provides wind profiling products at 6, 30, and 60 min intervals for each operational site. To generate synthetic profiles of zonal and meridional wind (u and v) components at operational RWP sites within the simulation domain (30 sites total), truth wind vectors from model grids are interpolated onto each site using the bilinear interpolation method (Fig. 3, blue stars). Additionally, we assume more observations are available at upstream sites near Beijing, specifically along the foothill and ridge of the Taihang Mountains (Fig. 3, red and magenta stars). The spatial locations for the foothill and ridge sites, with a total of 16 sites each, are determined based on the ETOPO1 Global Relief Model, a 1 arcmin resolution topographic and bathymetric dataset provided by NOAA's National Centers for Environmental Information (Amante and Eakins, 2009). In this study, maximum detection heights of 3, 8, and 12 km and vertical resolutions of 60 and 120 m have been chosen to mimic the vertical range and resolution of most real RWP data. The heights where the winds are measured (H) at each simulated RWP site are as follows:
where Helev is the elevation of the observation site; k is the index number of the vertical level; and Hinc and Hmax are specified vertical resolution and maximum detection height, respectively. The units of all height variables are meters. Similar to Zhang et al. (2016), 500 m is selected as the first level of wind profile used for assimilation. The final observations are obtained by adding perturbations to the wind profiles extracted from the truth run. The perturbations are assumed to be normally distributed Gaussian random errors with a mean of zero and a standard deviation of 2 m s−1 (Hu et al., 2017; Huang et al., 2020; Zhao et al., 2021a).
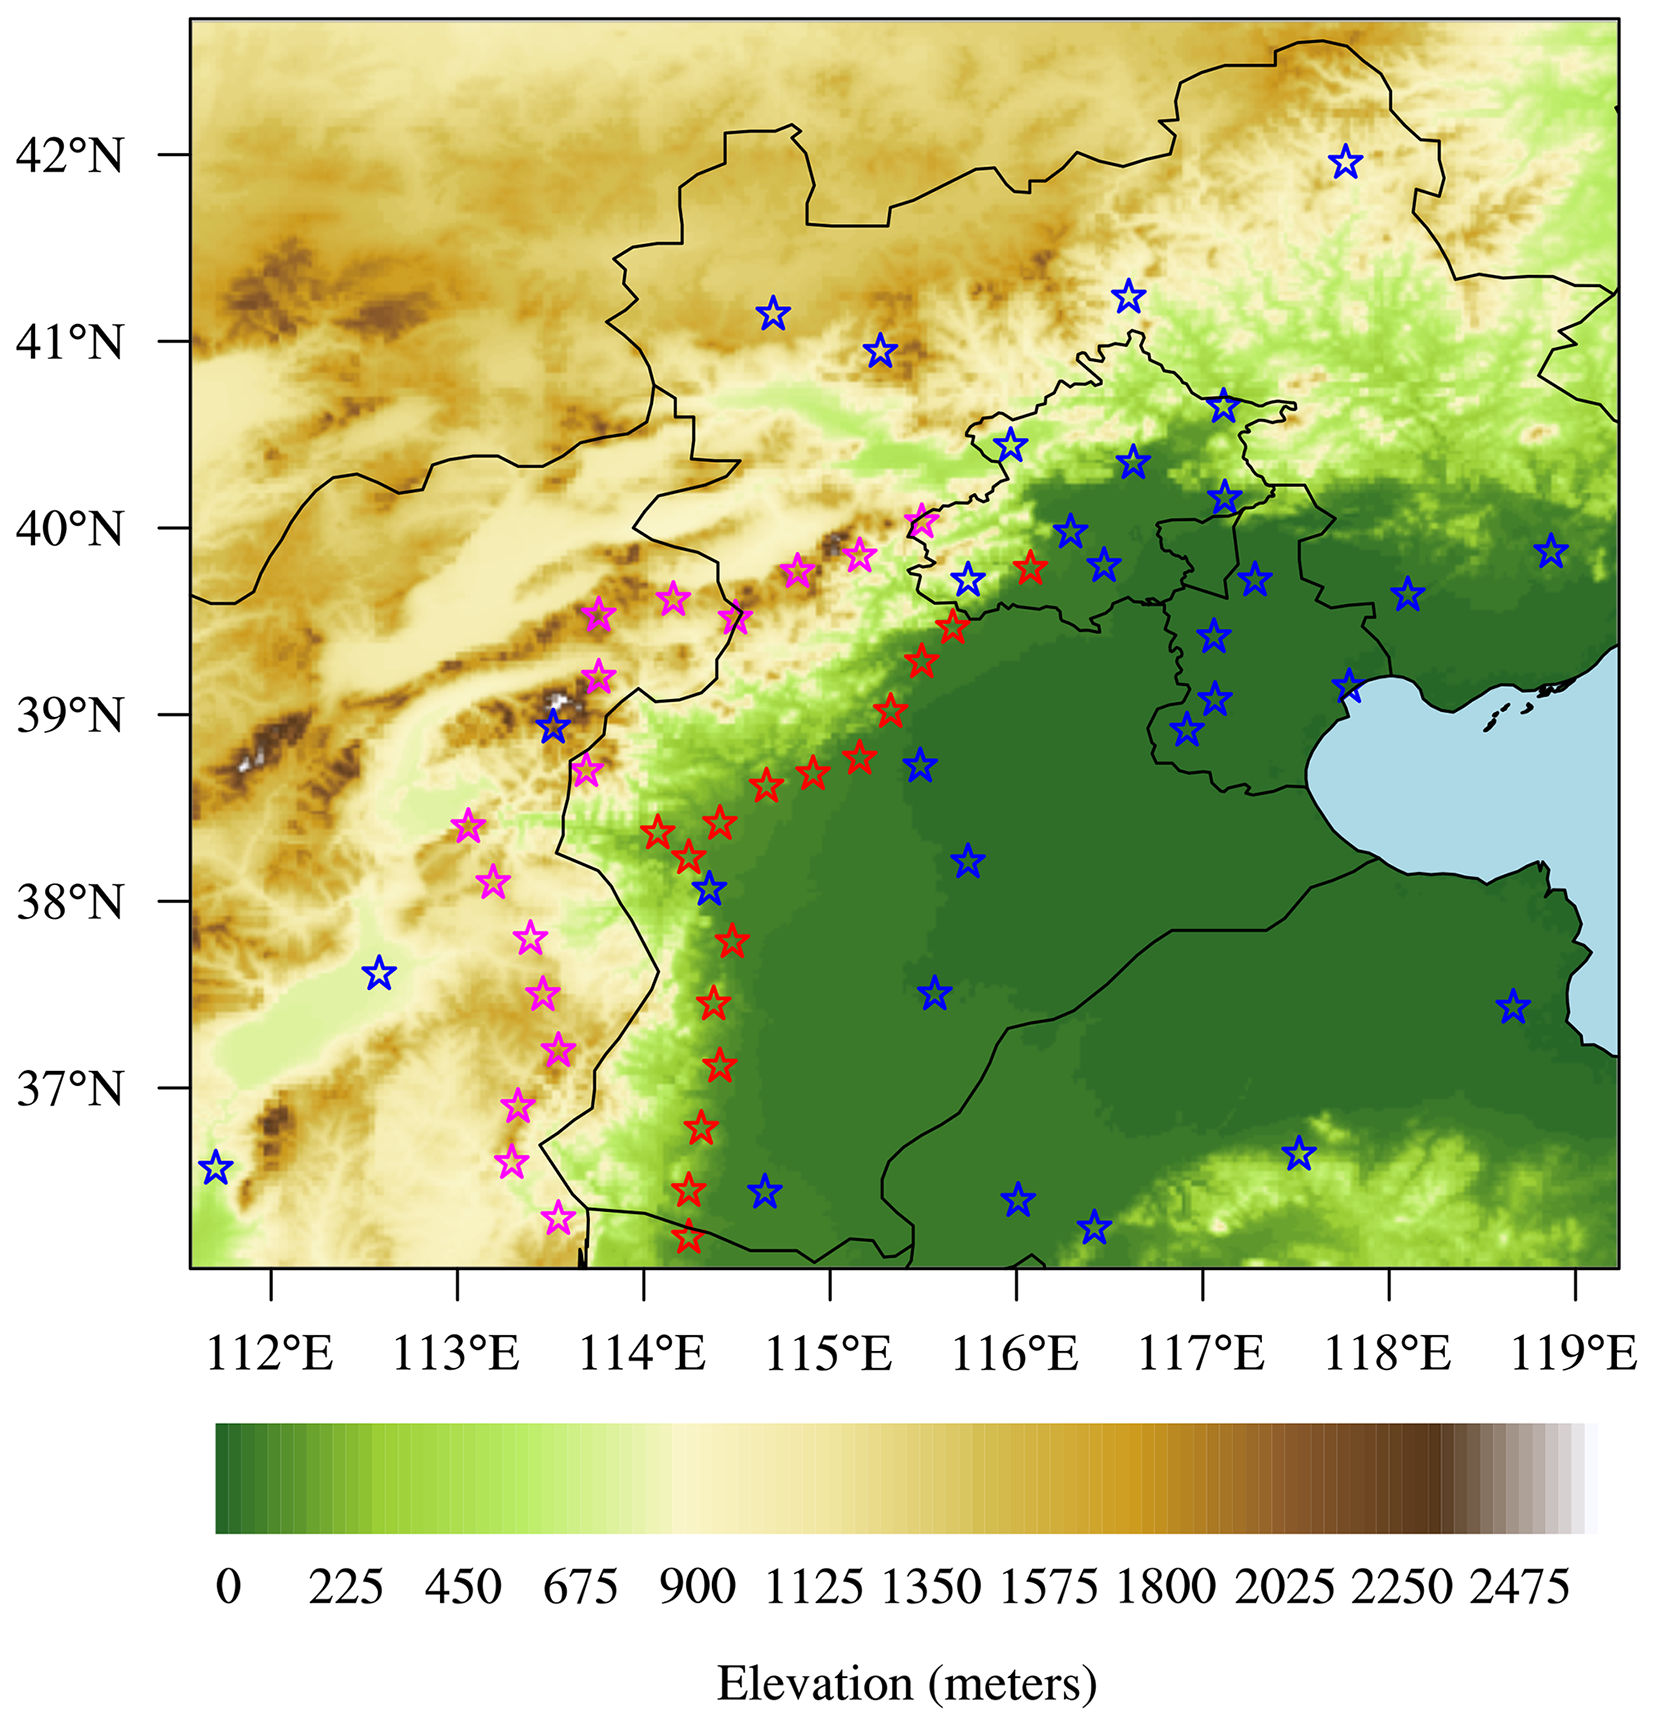
Figure 3Spatial distribution of the operational RWP network (blue stars) and simulated RWP network along the foothill (red stars) and ridge (magenta stars) of the Taihang Mountains within the simulation domain. The terrain is represented by color shading, and the ocean is shown in light blue.
As our focus is to assess the impacts of assimilating wind observations from various RWP network layouts on convective-scale analysis and short-term severe weather prediction, only synthetic RWP data are assimilated in this study, excluding conventional observations such as radiosondes, surface weather stations, and satellite observations. This exclusion simplifies the analysis by isolating the impact of RWPs but may inflate their relative importance (Hoffman and Atlas, 2016).
3.3 Experimental design
To mimic real-world operations, this OSSE study employs a DA and forecast cycle workflow similar to the Warn-on-Forecast System (WoFS) real-time Spring Forecast Experiment (SFE) runs, that is cycling DA for 9 h at 15 min intervals (Heinselman et al., 2024; Hu et al., 2020; Jones et al., 2018) (Fig. 4). To minimize data contamination from precipitation, DA cycles are performed before widespread rainfall occurs in the simulation domain, as wind profile accuracy from RWPs can be degraded by falling hydrometeors (Zhang et al., 2017). The model initial and boundary conditions for all DA and forecast experiments are derived from the 12 h GFS forecasts. Unlike the SFE setup, a 6 h free forecast in this study is launched every hour starting from the sixth hour of the analysis cycles, rather than from the first hour (Fig. 4). This delayed forecast initiation allows convective systems to develop, as they are typically not yet initiated or developed during the initial hours of assimilation cycles. For comparison, a first-guess background run (NoDA) is conducted by advancing the model forward without assimilating any observations.
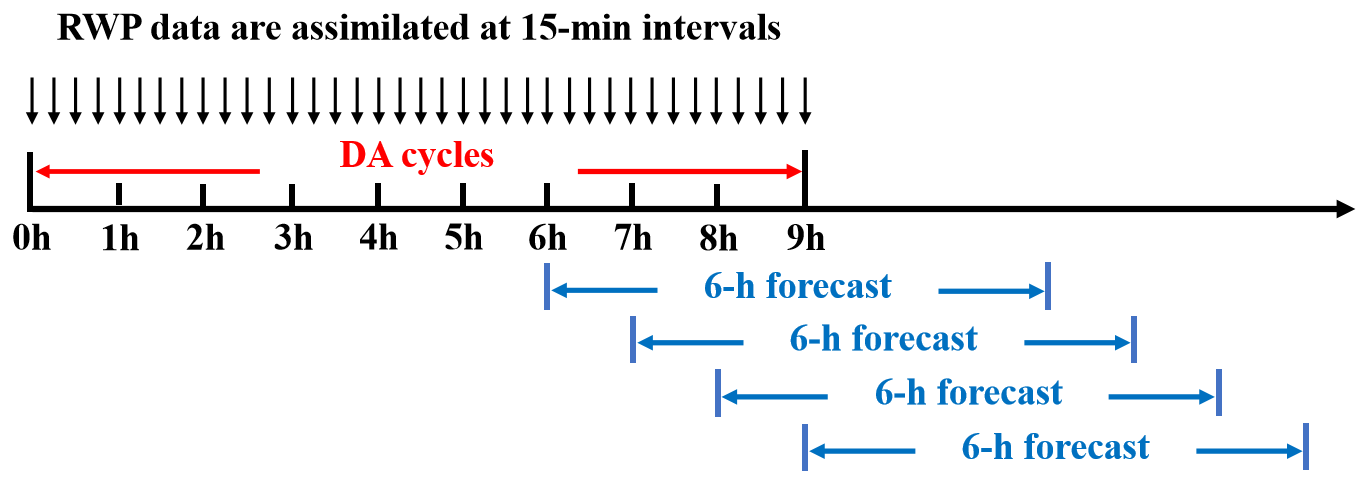
Figure 4Illustration of the data assimilation and forecast cycle workflow. A 6 h forecast is launched every hour from the sixth hour to the end of the DA cycles (namely, four separate forecasts).
Table 1List of the DA sensitivity experiments based on various spatial layout schemes of a radar wind profiler (RWP) network over the Beijing–Tianjin–Hebei region.
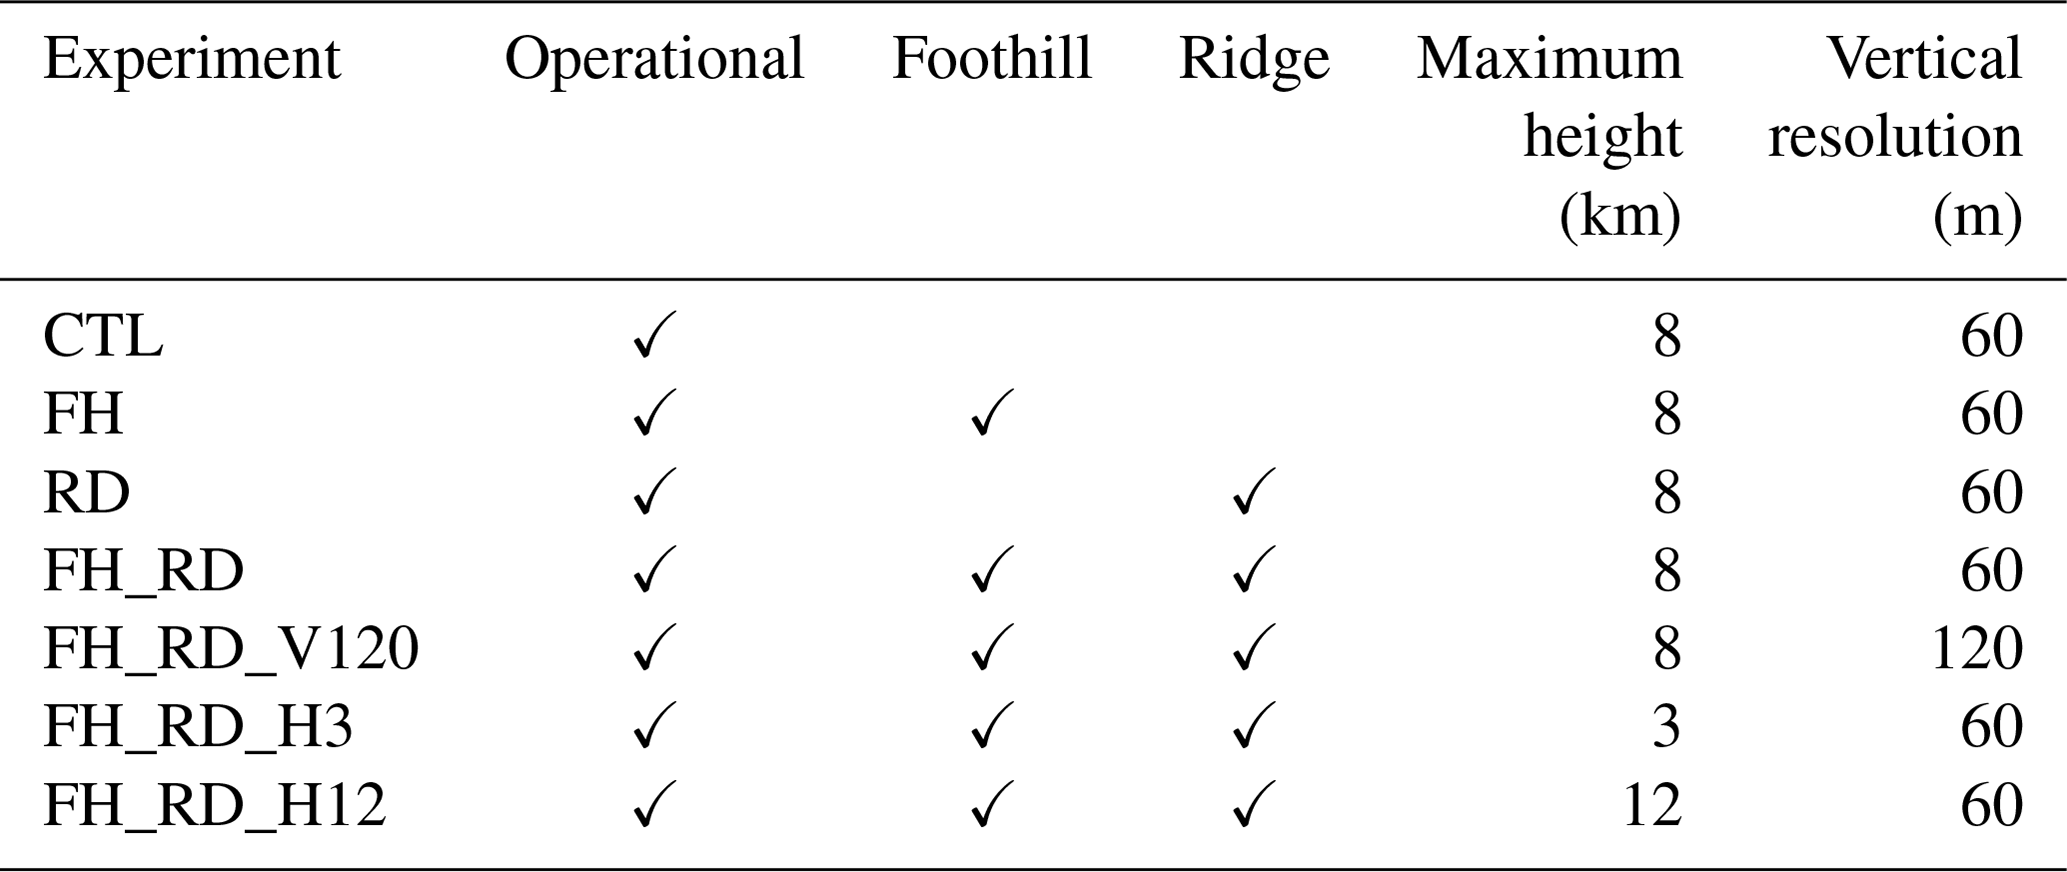
CTL: control DA experiment. FH: foothill. RD: ridge.
To investigate the impact of simulated foothill and ridge RWP networks on convective-scale NWP, four types of DA experiments are performed (Table 1). These experiments differ in their assimilation of synthetic profiler data from various RWP network spatial layouts. The baseline experiment, CTL, assimilates synthetic observations from the operational RWP network with a vertical resolution of 60 m (from 500 m to 8 km height), serving as a benchmark for comparison. This vertical resolution represents a best-case scenario for RWP capabilities.
The second and third types of experiments assimilate the simulated foothill and ridge RWPs, respectively, in conjunction with data from operational sites (referred to as FH (foothill) and RD (ridge)). The fourth type of experiment, combined foothill–ridge (FH_RD), is performed by assimilating the operational, foothill, and ridge profilers with the same vertical resolution and maximum detection height as before. Additionally, three sensitivity experiments FH_RD_V120, FH_RD_H3, FH_RD_H12 are designed to assess the influence of assimilating RWP data with different vertical resolution (120 m) and maximum detection heights (3, 12 km) on the analyses and forecasts, to address the potential usage of real-time data from RWPs operating at different frequencies.
In all DA experiments, the background errors for zonal and meridional wind components are specified as 3–6 m s−1, gradually increasing with altitude from the surface to 20 km a.g.l. (above ground level). The observation error is set to 3 m s−1, based on sensitivity tests within the 2–6 m s−1 range and consistent with previous studies (Hu et al., 2017; Huo et al., 2023; Wang et al., 2022; Zhang et al., 2016). In the minimization process two outer loops are adopted, each with a prescribed horizontal and vertical correlation scale for the recursive filter used in the program (Gao et al., 2004; Purser et al., 2003b). Following previous studies (Wang et al., 2022; Zhao et al., 2022), the horizontal correlation scale lengths are set to be 50 km in the first loop and 20 km in the second loop, while the corresponding vertical correlation lengths are five and two grid points, respectively.
3.4 Evaluation metrics
This study examines the impact of RWP DA on wind analyses and forecasts during a southwest (SW)-type heavy rainfall event on 21 July 2023. To obtain an overall insight into the impact of RWP DA on wind analyses and forecasts, time series and probability density distributions, as well as vertical profiles of root-mean-square errors (RMSEs) for wind components during the DA cycles and 6 h free forecasts, are calculated for each type of assimilation experiment. Additionally, subjective diagnostic analyses of wind vectors improved by assimilation of RWPs are also discussed in more detail. To investigate the impact on short-term forecasts, both qualitative and quantitative assessments of radar reflectivity and accumulated precipitation forecasts are conducted against the truth run. To evaluate the performance quantitatively, the neighborhood-based equitable threat score (ETS, Clark et al., 2010) is calculated using a neighborhood radius of 12 km for different thresholds of composite reflectivity (CREF) and hourly precipitation (HPRCP). Using the same neighborhood radius and thresholds, contingency-table-based metrics including the probability of detection (POD), false alarm ratio (FAR), success ratio (SR), frequency bias (BIAS), and critical success index (CSI) are also calculated to quantify the CREF and HPRCP forecasts. To account for case-to-case variability, two additional SW-type heavy rainfall events (28 June and 12 July 2023) are examined. Finally, score metrics are aggregated from each initialization hour (sixth hour to end of the DA cycles) across three cases, ensuring a fair and consistent measure of forecast skill.
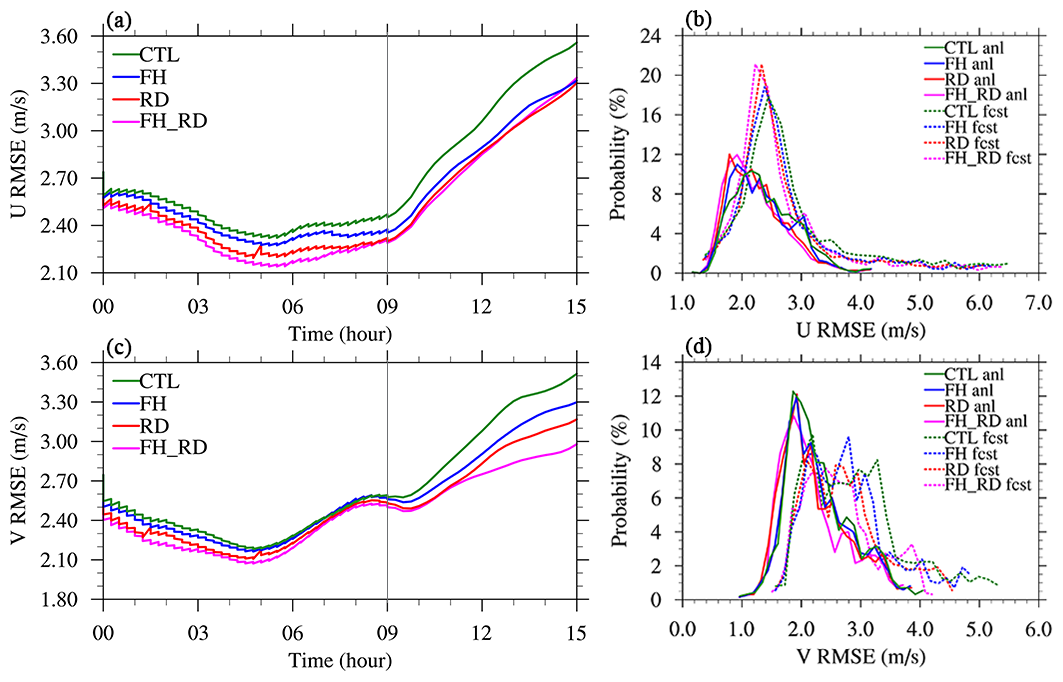
Figure 5Time series of root-mean-square errors (RMSEs) for (a) u (m s−1) and (c) v (m s−1) analyses and forecasts from the CTL (green), FH (blue), RD (red), and FH_RD (magenta) experiments. The thin grey line separates analysis cycling and 6 h free forecasts. Probability density distribution (PDF) of RMSEs for (b) u (m s−1) and (d) v (m s−1) analyses (solid) and forecasts (dashed) from four experiments.
4.1 21 July 2023 case
4.1.1 The impact on wind fields
The first question we attempt to answer is how the spatial distribution of RWP sites should be planned to optimize the accuracy of short-range convection-allowing NWP system. The influence of assimilating RWP data from different networks, as described in Sect. 3.3, on wind analysis and forecast can be straightforwardly assessed by examining the RMSEs of wind components during the 9 h assimilation cycles and 6 h free forecasts. For clarity, the time series and probability density distribution (PDF) of the wind RMSEs from the CTL, FH, RD, and FH_RD experiments are compared in Fig. 5. The statistics are computed against the truth run at all model levels within the simulation domain shown in Fig. 3. Overall, the RMSEs of wind analyses from all DA experiments during the analysis cycling decrease over the first 6 h and then gradually increase afterward, exhibiting an evident staircase pattern (Fig. 5a and c), indicating that the wind field is modified by the NSSL3DVAR system towards the truth in each analysis cycle. A comparison among all DA experiments reveals that the FH_RD experiment yields the smallest wind errors, followed by RD, then FH, with CTL exhibiting the largest errors. This likely occurs because (a) FH_RD assimilates the largest number of wind observations, while CTL assimilates the fewest, and (b) the uncertainties of wind field in the background field are larger in mountainous regions than flatlands (this issue will be discussed in detail later in this section). The superiority of FH_RD, RD, and FH over the CTL experiment persists during the subsequent 6 h free forecasts, highlighting the impact of wind profile observations gathered from ridge and foothill networks. It is also noted that the difference in the meridional wind among FH, RD, and FH_RD is more pronounced than that of the zonal wind, which can be related to the varying degree of improvement in the southerly jet intensity. Generally, the PDF figures show that the distributions of wind analyses are skewed towards smaller error values compared to those of forecasts, with the wind forecasts exhibiting a heavy tail towards larger error values (Fig. 5b and d). For example, the analysis errors for the v variable tend to cluster around 1.6–2.6 m s−1, while the PDFs of forecast errors show peaks near 2.0–3.4 m s−1. The patterns in distributions from different assimilation experiments align with the results observed in the time series analysis.
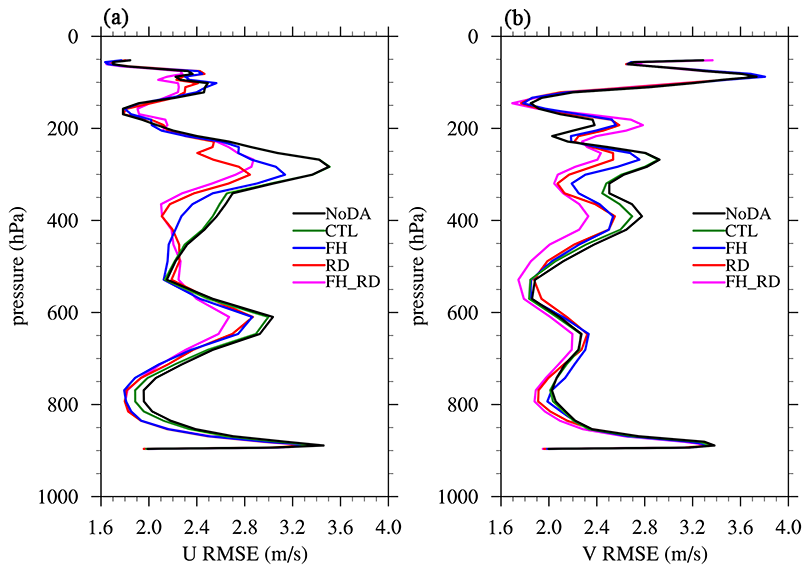
Figure 6Vertical profiles of domain-averaged RMSEs for (a) u (m s−1) and (b) v (m s−1) analyses at 21:00 UTC 20 July 2023 (end of analysis cycling) from the NoDA (black), CTL (green), FH (blue), RD (red), and FH_RD (magenta) experiments.
To assess the impact of the DA experiments at different altitudes, Fig. 6 presents the vertical profiles of domain-averaged RMSEs of wind analyses at the end of the assimilation cycles. Compared to the NoDA experiment, the assimilation of RWPs generally has a positive effect on the wind field throughout the troposphere. The CTL experiment slightly reduces the wind errors, specifically in the layer from 850 to 600 hPa for the u component and from 500 to 300 hPa for both components. It is seen that the DA experiments assimilating ridge and foothill RWPs generally outperform CTL. For the u wind component, the RD experiment has a comparable RMSE profile to FH below 550 hPa but results in a much smaller error above (Fig. 6a). In the analysis of the v wind, RD consistently performs better than FH, except for the layer from 260 to 160 hPa (Fig. 6b). Notably, FH_RD results in the smallest wind errors across most levels, aligning with the previously observed error trends over time.
To examine how the RWP DA adjusts the mesoscale airflow, we present the 700 hPa wind vectors and wind speeds from all experiments as an illustration of the model's dynamic conditions (Fig. 7). For clarity, Fig. 7b–f compare the differences in wind vectors and wind speeds between the DA experiments and the corresponding field from the truth run. These differences, considered wind errors, help evaluate how assimilating RWPs from different observation networks adjusts the wind field. The red (blue) color represents positive (negative) wind speed bias compared to the truth. In the NoDA experiment, there is a notable southeasterly wind bias in Beijing and the mountainous regions to its west, characterized by excessively high wind speeds. Conversely, the true simulation reveals a strong southwesterly flow (Fig. 7b). Meanwhile, the southwest wind is remarkably weaker in southwestern Hebei (at the foothills of the Taihang Mountains), and the westerly wind in the upstream Taihang Mountains region is also underestimated. The CTL experiment significantly reduces the easterly wind bias in Beijing and its surrounding areas while enhancing the southwesterly winds in Hebei (Fig. 7c). However, unignorable wind errors persist upstream of Beijing, particularly along the mountainous regions, due to the absence of operational wind profiler sites. The FH experiment produces wind adjustments similar to those in CTL but further reduces wind errors in the plains of Hebei by assimilating observations from foothill sites (Fig. 7d). Conversely, with the assimilation of RWP data from the ridge network, both RD and FH_RD significantly reduce positive wind speed errors upstream of Beijing along the mountains, which is crucial for convection initiation (CI) near the boundary between Hebei and southwestern Beijing (Fig. 7e and f). While the southwest winds in southwestern Hebei remain slightly weaker in RD, FH_RD addresses this by assimilating ridge RWPs alongside foothill data. However, all DA experiments still show negative wind speed errors and northwesterly/northeasterly wind direction errors near the border of Shanxi, Hebei, and Inner Mongolia, with errors even larger than those in NoDA. This is mainly due to the lack of RWP observations in this tri-provincial border area. As a result, the influence of ridge RWP data may propagate northward into this region by the RD and FH_RD experiments, significantly reducing positive errors upstream of Beijing along the mountains but increasing negative errors in this area.
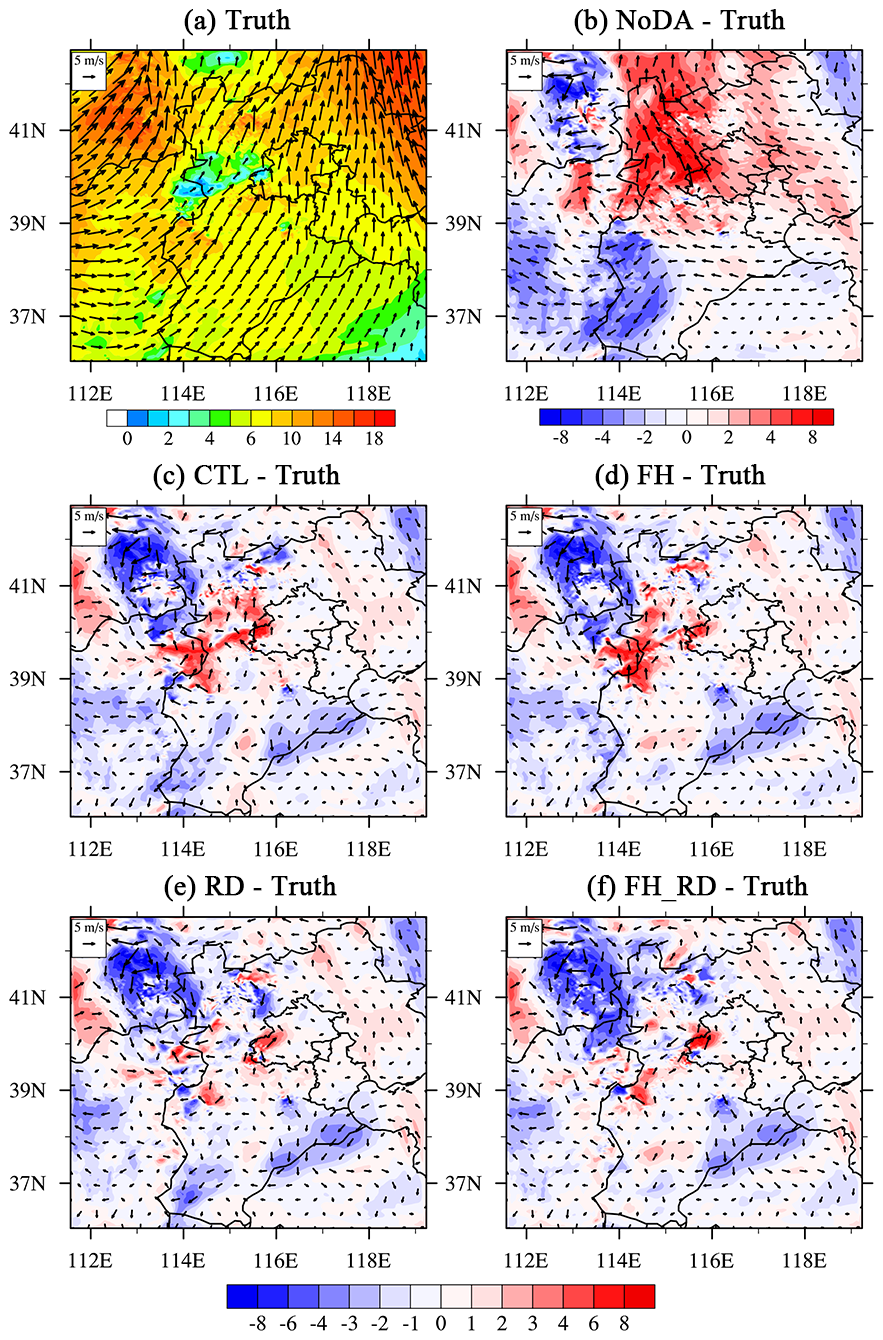
Figure 7(a) 700 hPa wind (vectors) with wind speed (m s−1, color shaded) from the truth run and differences between the 700 hPa winds from (b) NoDA, (c) CTL, (d) RD, (e) FH, and (f) FH_RD experiments and the truth run at 21:00 UTC 20 July 2023 (end of analysis cycling). The red (blue) color represents positive (negative) wind speed bias compared to the truth.
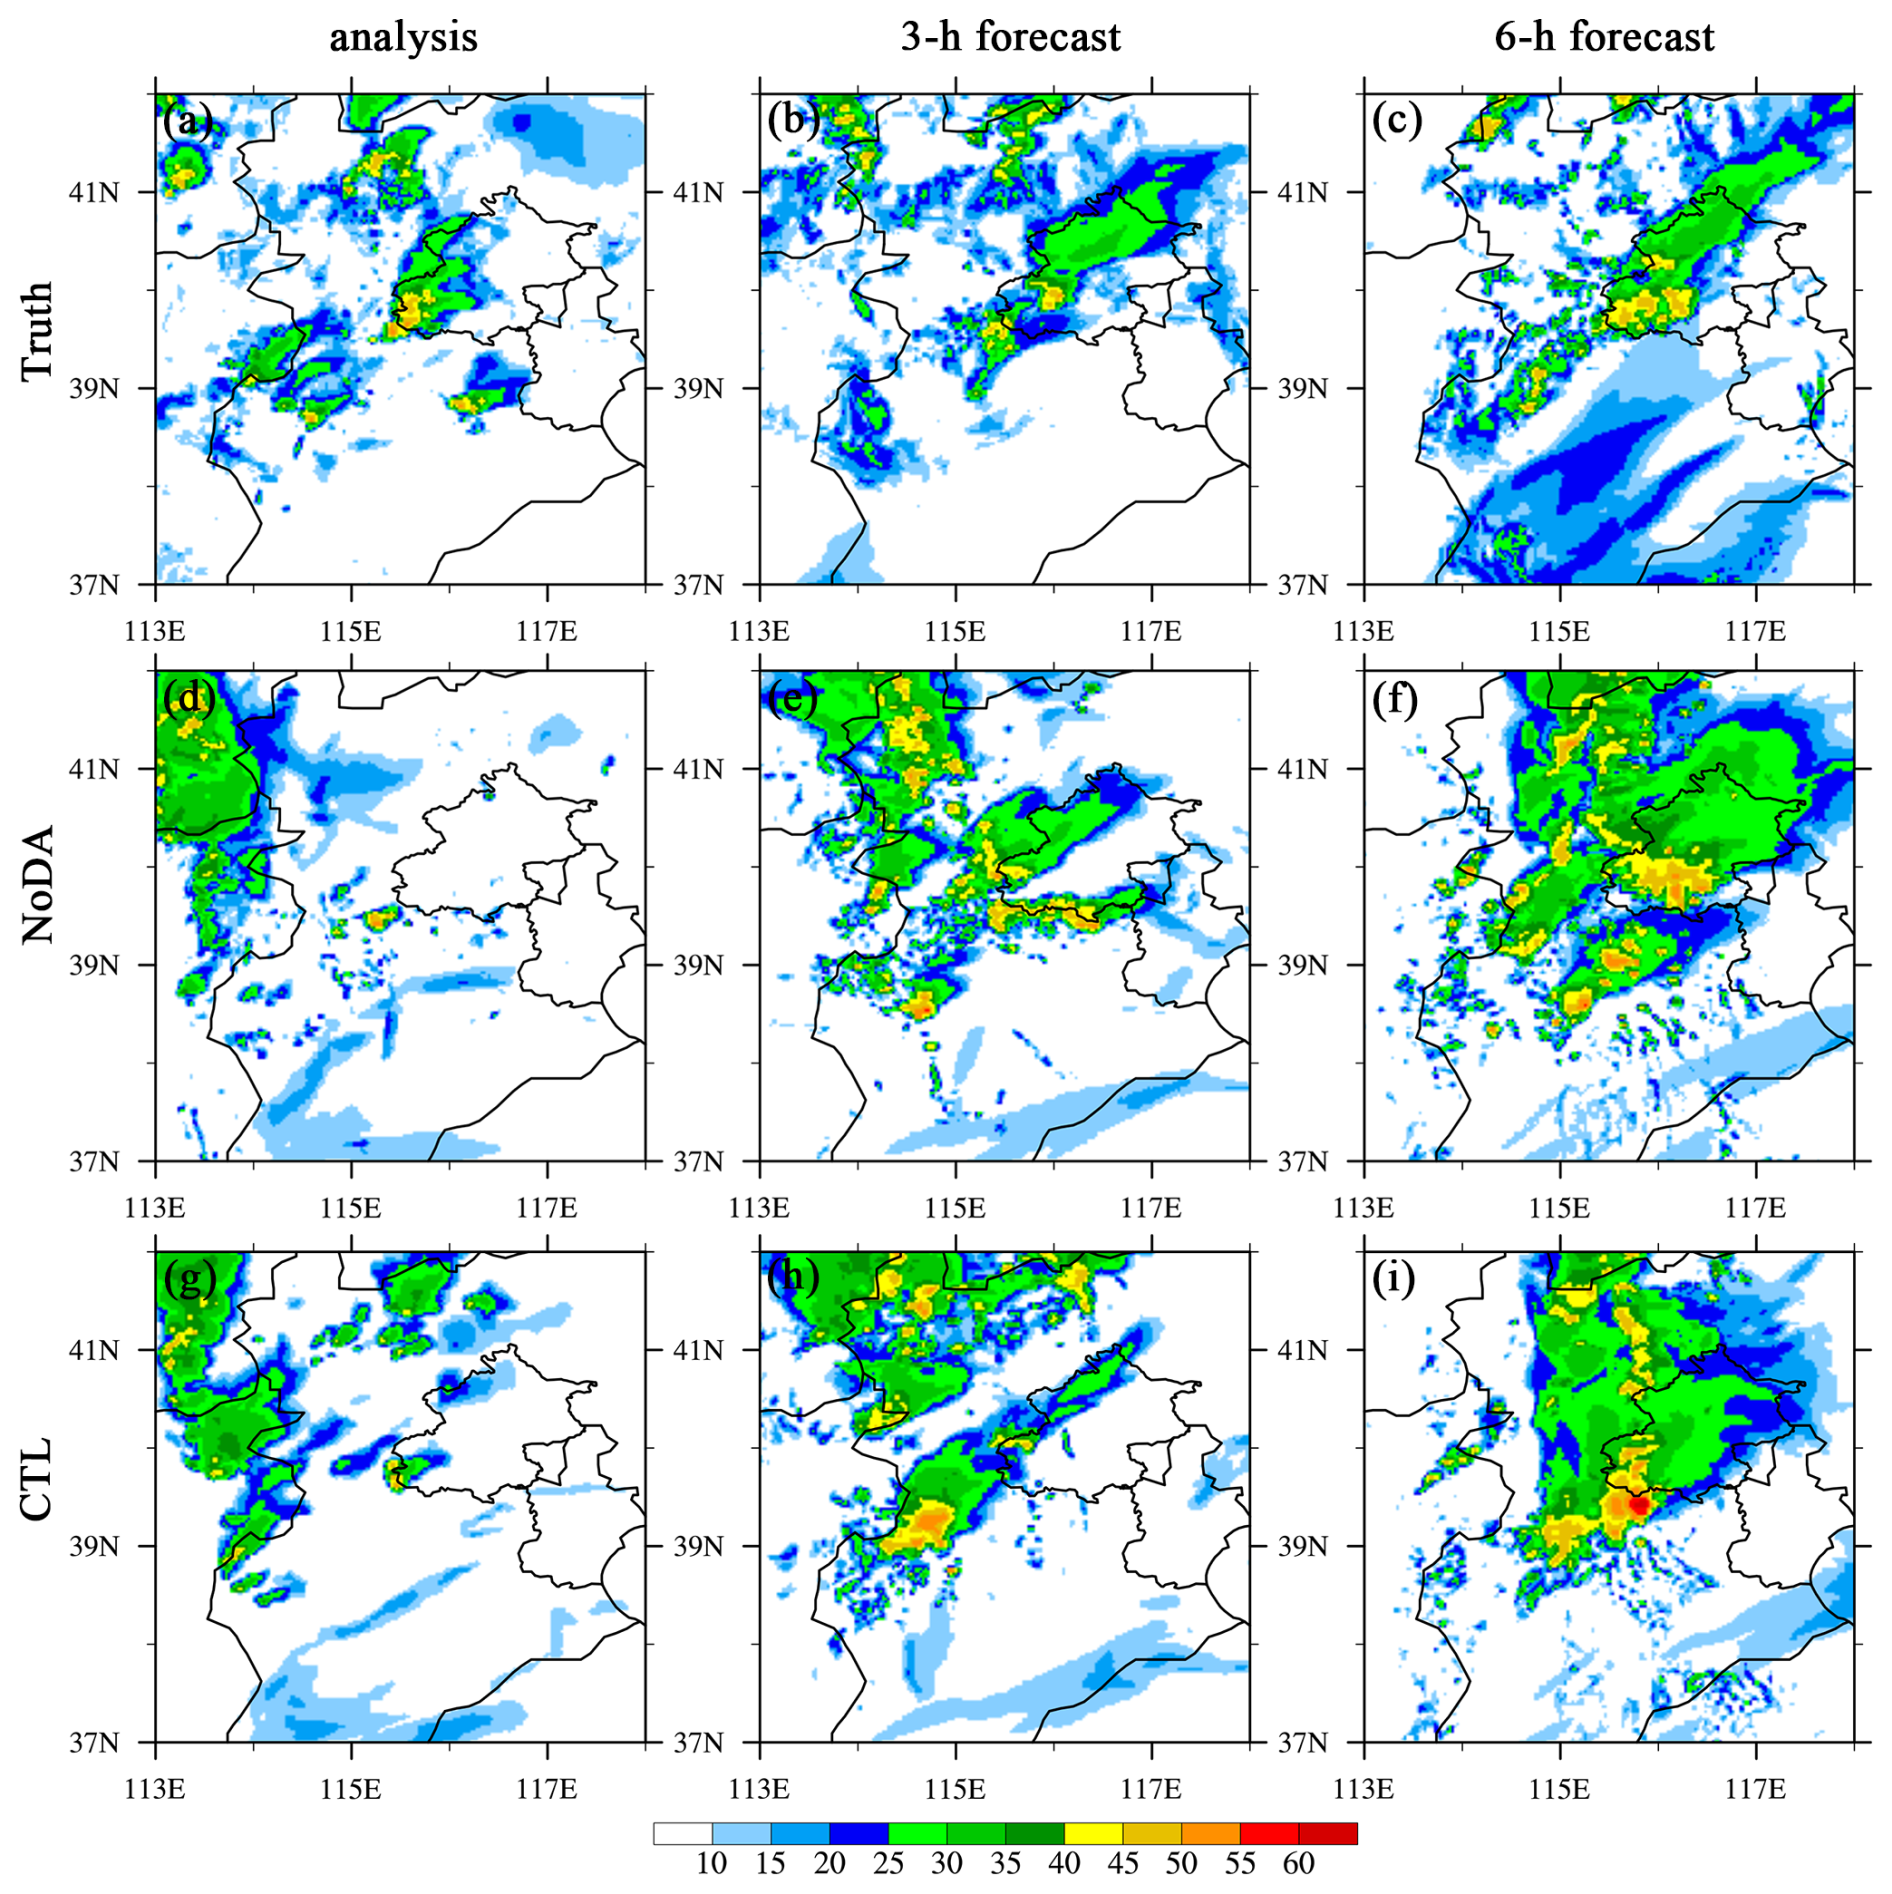
Figure 8The composite reflectivity (dBZ, shaded) for (a, d, g) analysis, (b, e, h) 3 h forecast, and (c, f, i) 6 h forecast from (a–c) truth simulation, (d–f) NoDA, and (g–i) CTL experiments initialized at 21:00 UTC 20 July 2023.
4.1.2 The impact on reflectivity and precipitation forecasts
The analysis, along with the 3 and 6 h forecasts of composite reflectivity from all experiments, is compared to the truth run in Figs. 8 and 9. In the southwest of Beijing, a convective system initiates and develops. As it merges with scattered storms originating in western Hebei near the foothills of the Taihang Mountains, the system intensifies rapidly. Eventually the convection becomes a southwest–northeast-oriented mesoscale system across the western and central parts of Beijing (Fig. 8a–c). At the initial stage, the NoDA experiment underestimates convection in Beijing and Hebei (Fig. 8d), but in the 6 h forecast, NoDA overpredicts the storm coverage and intensity in Beijing and produces excessive spurious convection in western and northern Hebei (Fig. 8d–f). At analysis time, all DA experiments show improvement in the location and shape of the convective system in southwestern Beijing, and FH_RD produces the strongest reflectivity analysis (Figs. 8g and 9a, d, g). This implies that the assimilation of RWP data can improve CI timing and location by capturing the mesoscale flow features in the pre-storm environment (Fig. 7). The RWP DA also helps alleviate storm displacement and intensity errors and suppresses spurious cells in subsequent forecasts, owing to a better representation of the storm environment. Although CTL correctly analyzes the CI near the observed location, its analysis and 3 h lead-time reflectivity forecast show that the storm intensity in Beijing is still weaker than the truth simulation, especially over western and central Beijing (Fig. 8g–i). The FH experiment produces stronger storms with a larger coverage area in Beijing compared to the CTL experiment, although the storm intensity remains slightly underestimated; however, spurious echoes to the west of Beijing remain evident in the 6 h forecast (Fig. 9a–c). With the assimilation of ridge RWP data, the RD and FH_RD experiments further strengthen the CI process and improve the storm pattern and development. A comparison among all experiments reveals that FH_RD demonstrates overwhelming superiority over the other three DA experiments in terms of areal coverage, storm mode, and storm orientation (Fig. 9g–i).
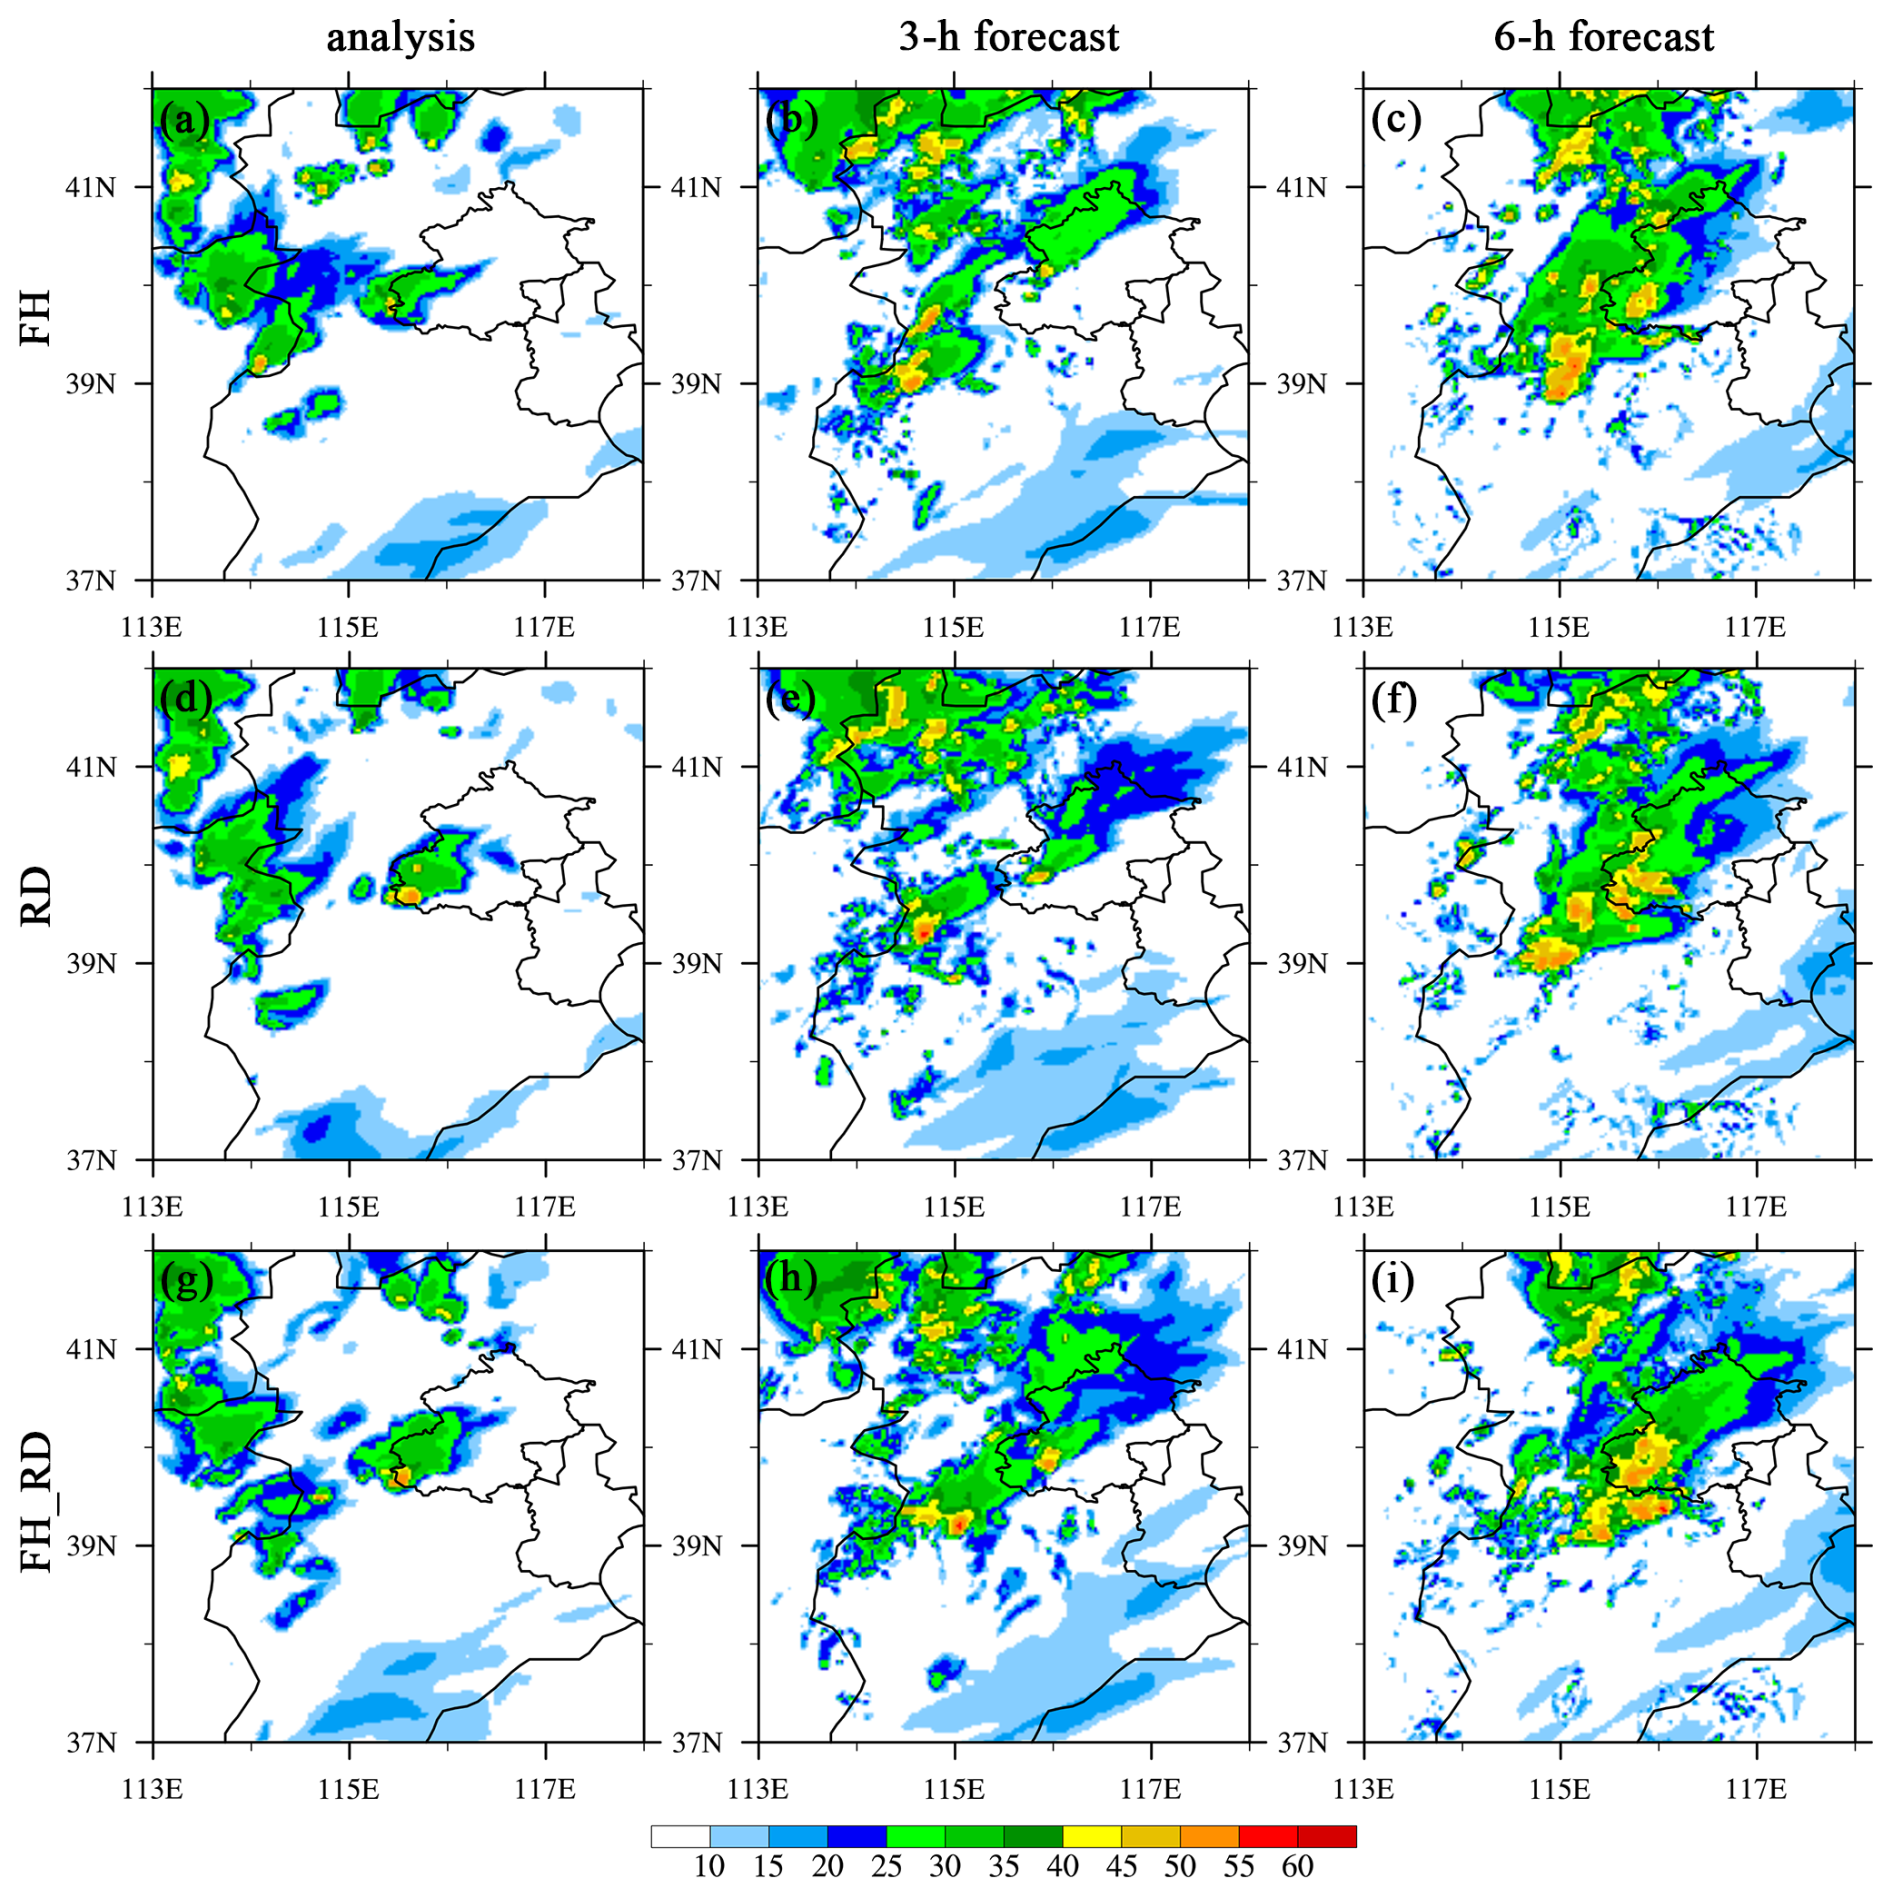
Figure 9Same as in Fig. 8 but for the composite reflectivity (dBZ, shaded) from (a–c) FH, (d–f) RD, and (g–i) FH_RD experiments.
Concerning precipitation, the 1, 3, and 6 h accumulated precipitation (APCP) forecasts exhibit similar behavior to the reflectivity results in terms of rainfall location, onset time, and amount (Figs. 10 and 11). As discussed above, all assimilation experiments predict the initial precipitation area and intensity in the southwest of Beijing more accurately than NoDA, leading to improvements in subsequent APCP forecasts in this area. For example, assimilating ridge and foothill RWPs corrects the weaker biases associated with this storm in the 1 and 3 h forecasts (Fig. 11a, b, d, e, g, and h). Meanwhile, the more west–east-oriented heavy rainfall occurring over the south of Beijing in the 6 h forecast of NoDA is revised by the assimilation experiments, shifting to a southwest–northeast orientation that is closer to the truth simulation. Although the areal coverage of rainfall in the 1 h forecast is better captured by CTL compared to NoDA, CTL still tends to underpredict the precipitation amount in southwestern Beijing, while overestimation is commonly observed in parts of the mountainous areas to the southwest of Beijing (Fig. 10g–i). One potential factor contributing to the overpredicted rainfall in the mountainous areas to the southwest of Beijing is the CTL experiment's reduction of positive wind errors in Beijing, while higher wind speeds (compared to the truth) persist along the upstream mountains. This is due to the absence of operational wind profiler sites. The stronger southwesterly winds of the CTL experiment enhance moisture transport and convergence in the upstream mountains, leading to overestimated rainfall in those areas and underpredicted precipitation over Beijing. Both RD and FH_RD experiments yield a smaller areal coverage of precipitation at the same region, and they also better capture the southwest–northeast orientation of the rainband in southwestern Beijing (Fig. 11d–i), as the large wind errors in the upstream mountains are remarkably reduce by assimilating RWP data from the ridge network (Fig. 7e and f). As expected, the APCP forecasts from FH_RD align well with the true rainfall forecasts in terms of placement, orientation, and amount (Fig. 11g–i vs. Fig. 10a–c).
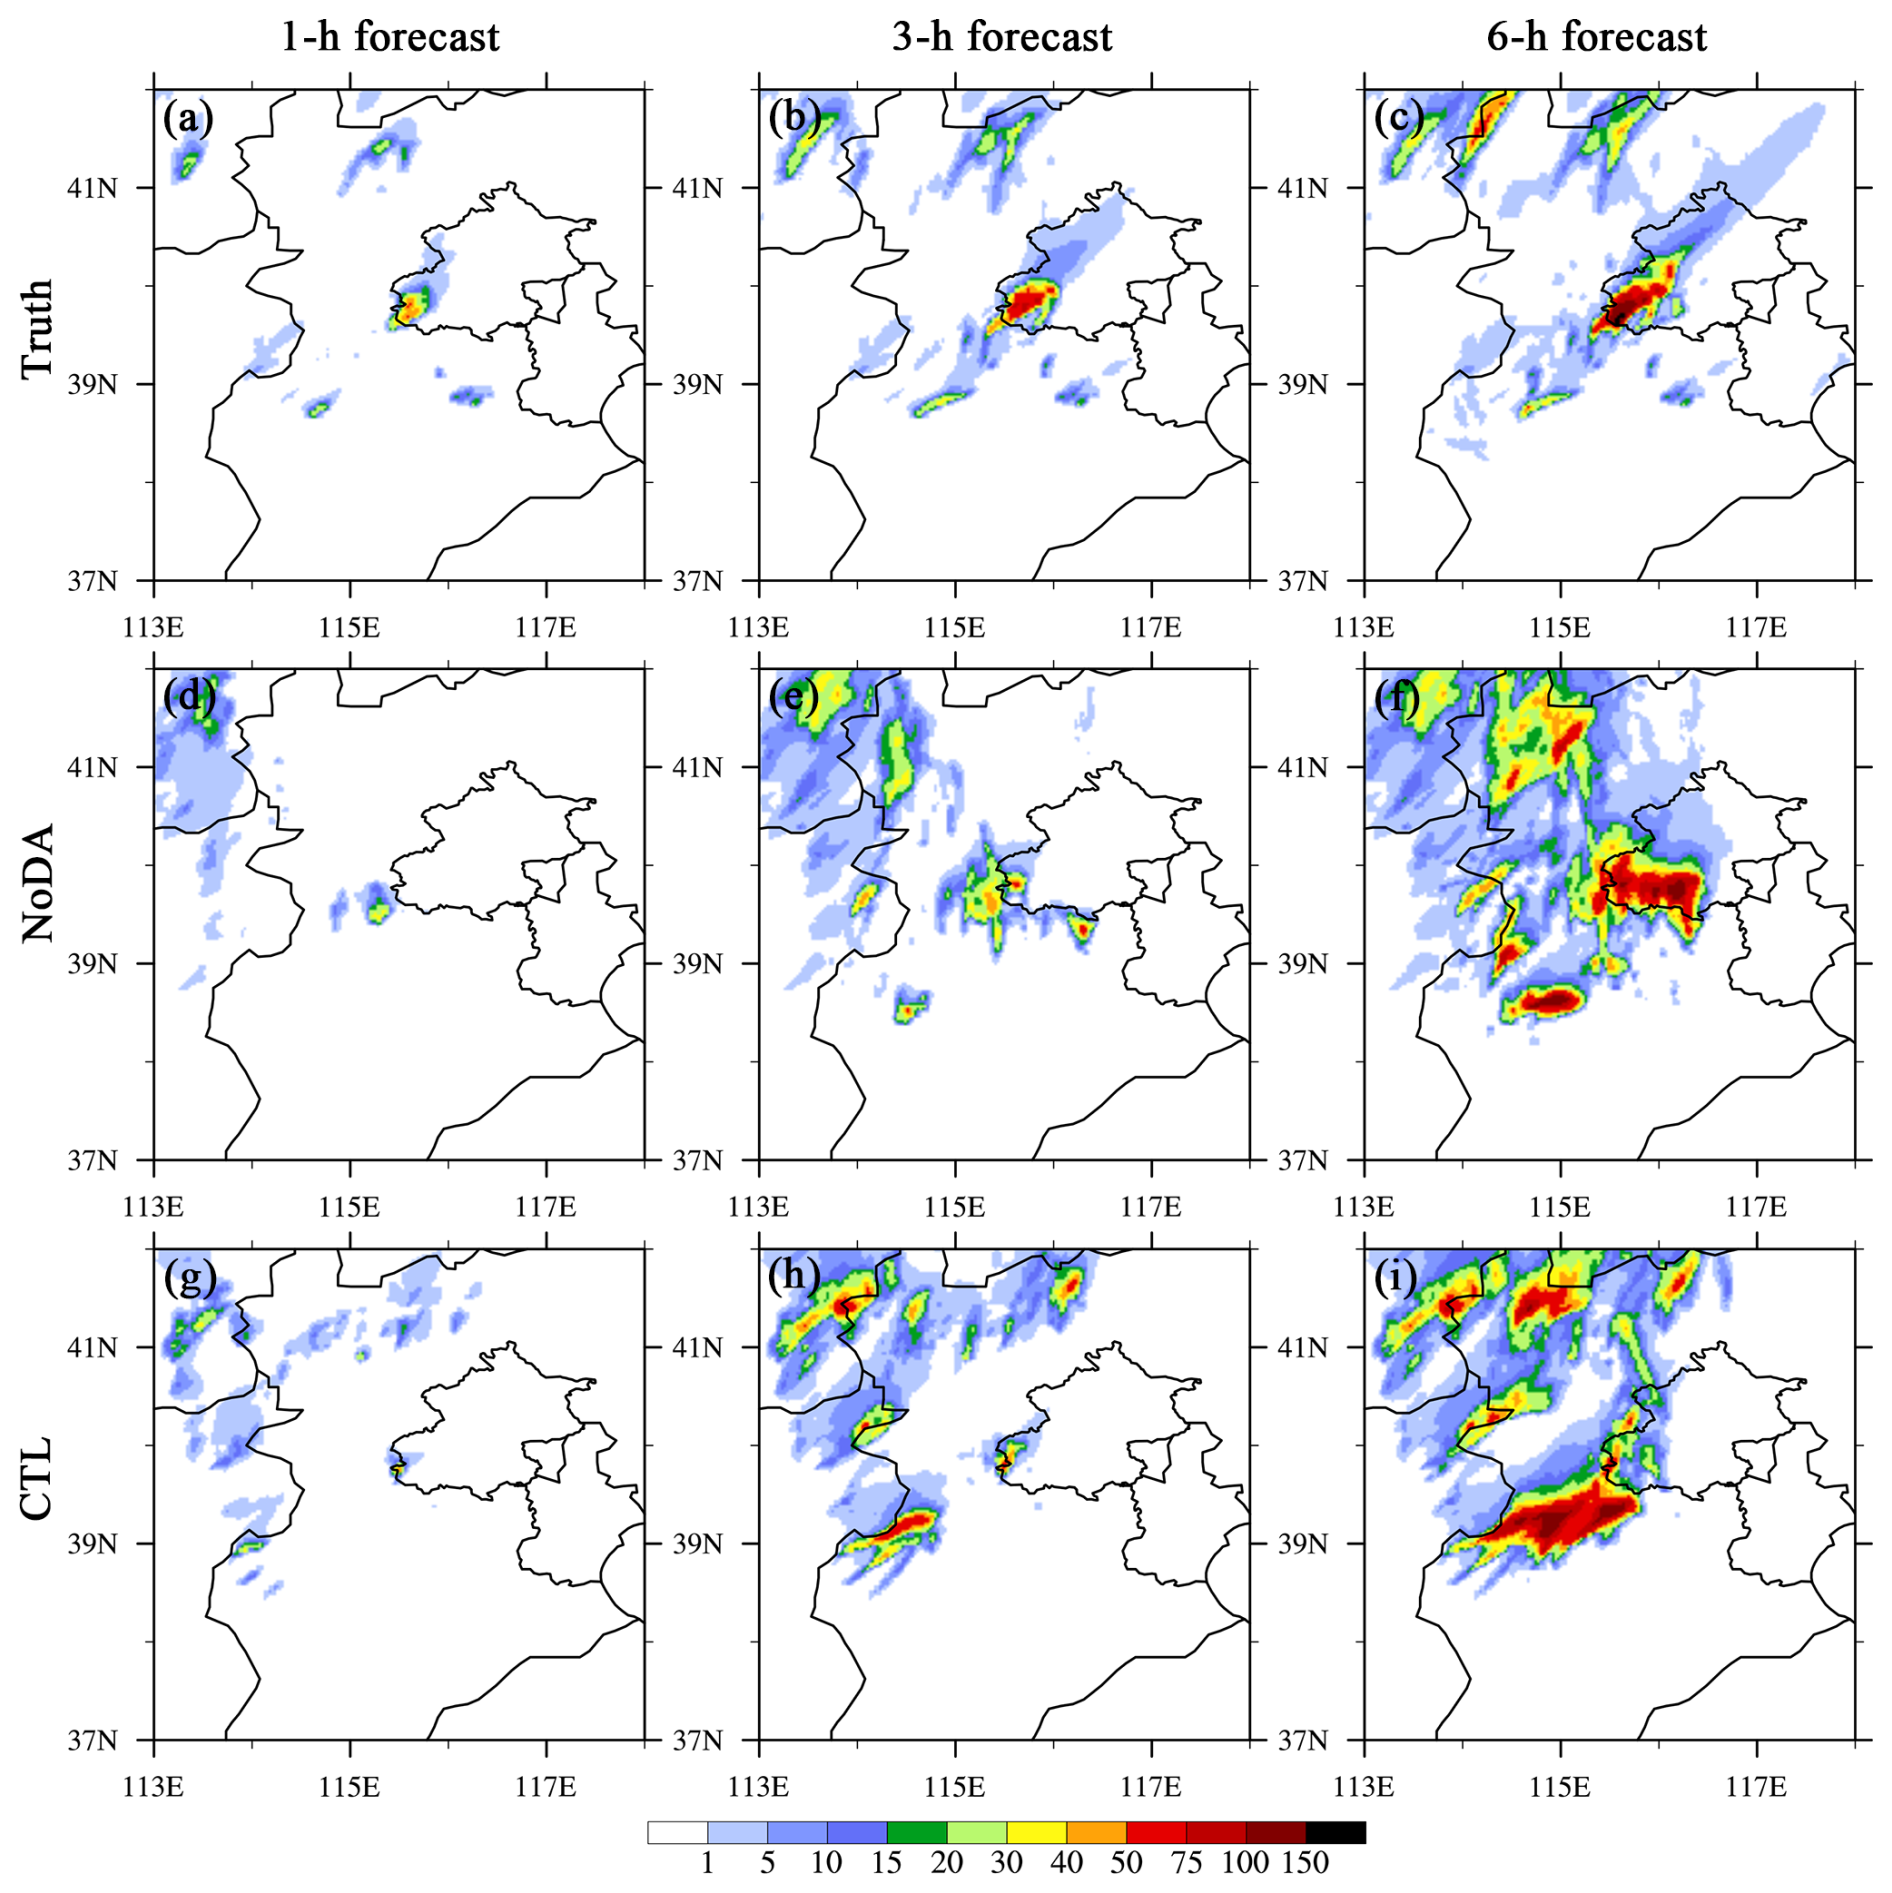
Figure 10The accumulated precipitation (APCP) forecasts (mm, shaded) for (a–c) Truth, (d–f) NoDA, and (g–i) CTL experiments initialized at 21:00 UTC 20 Jul 2023. The (a, d, g) 1 h, b, e, h) 3 h, and (c, f, i) 6 h forecasts are shown.
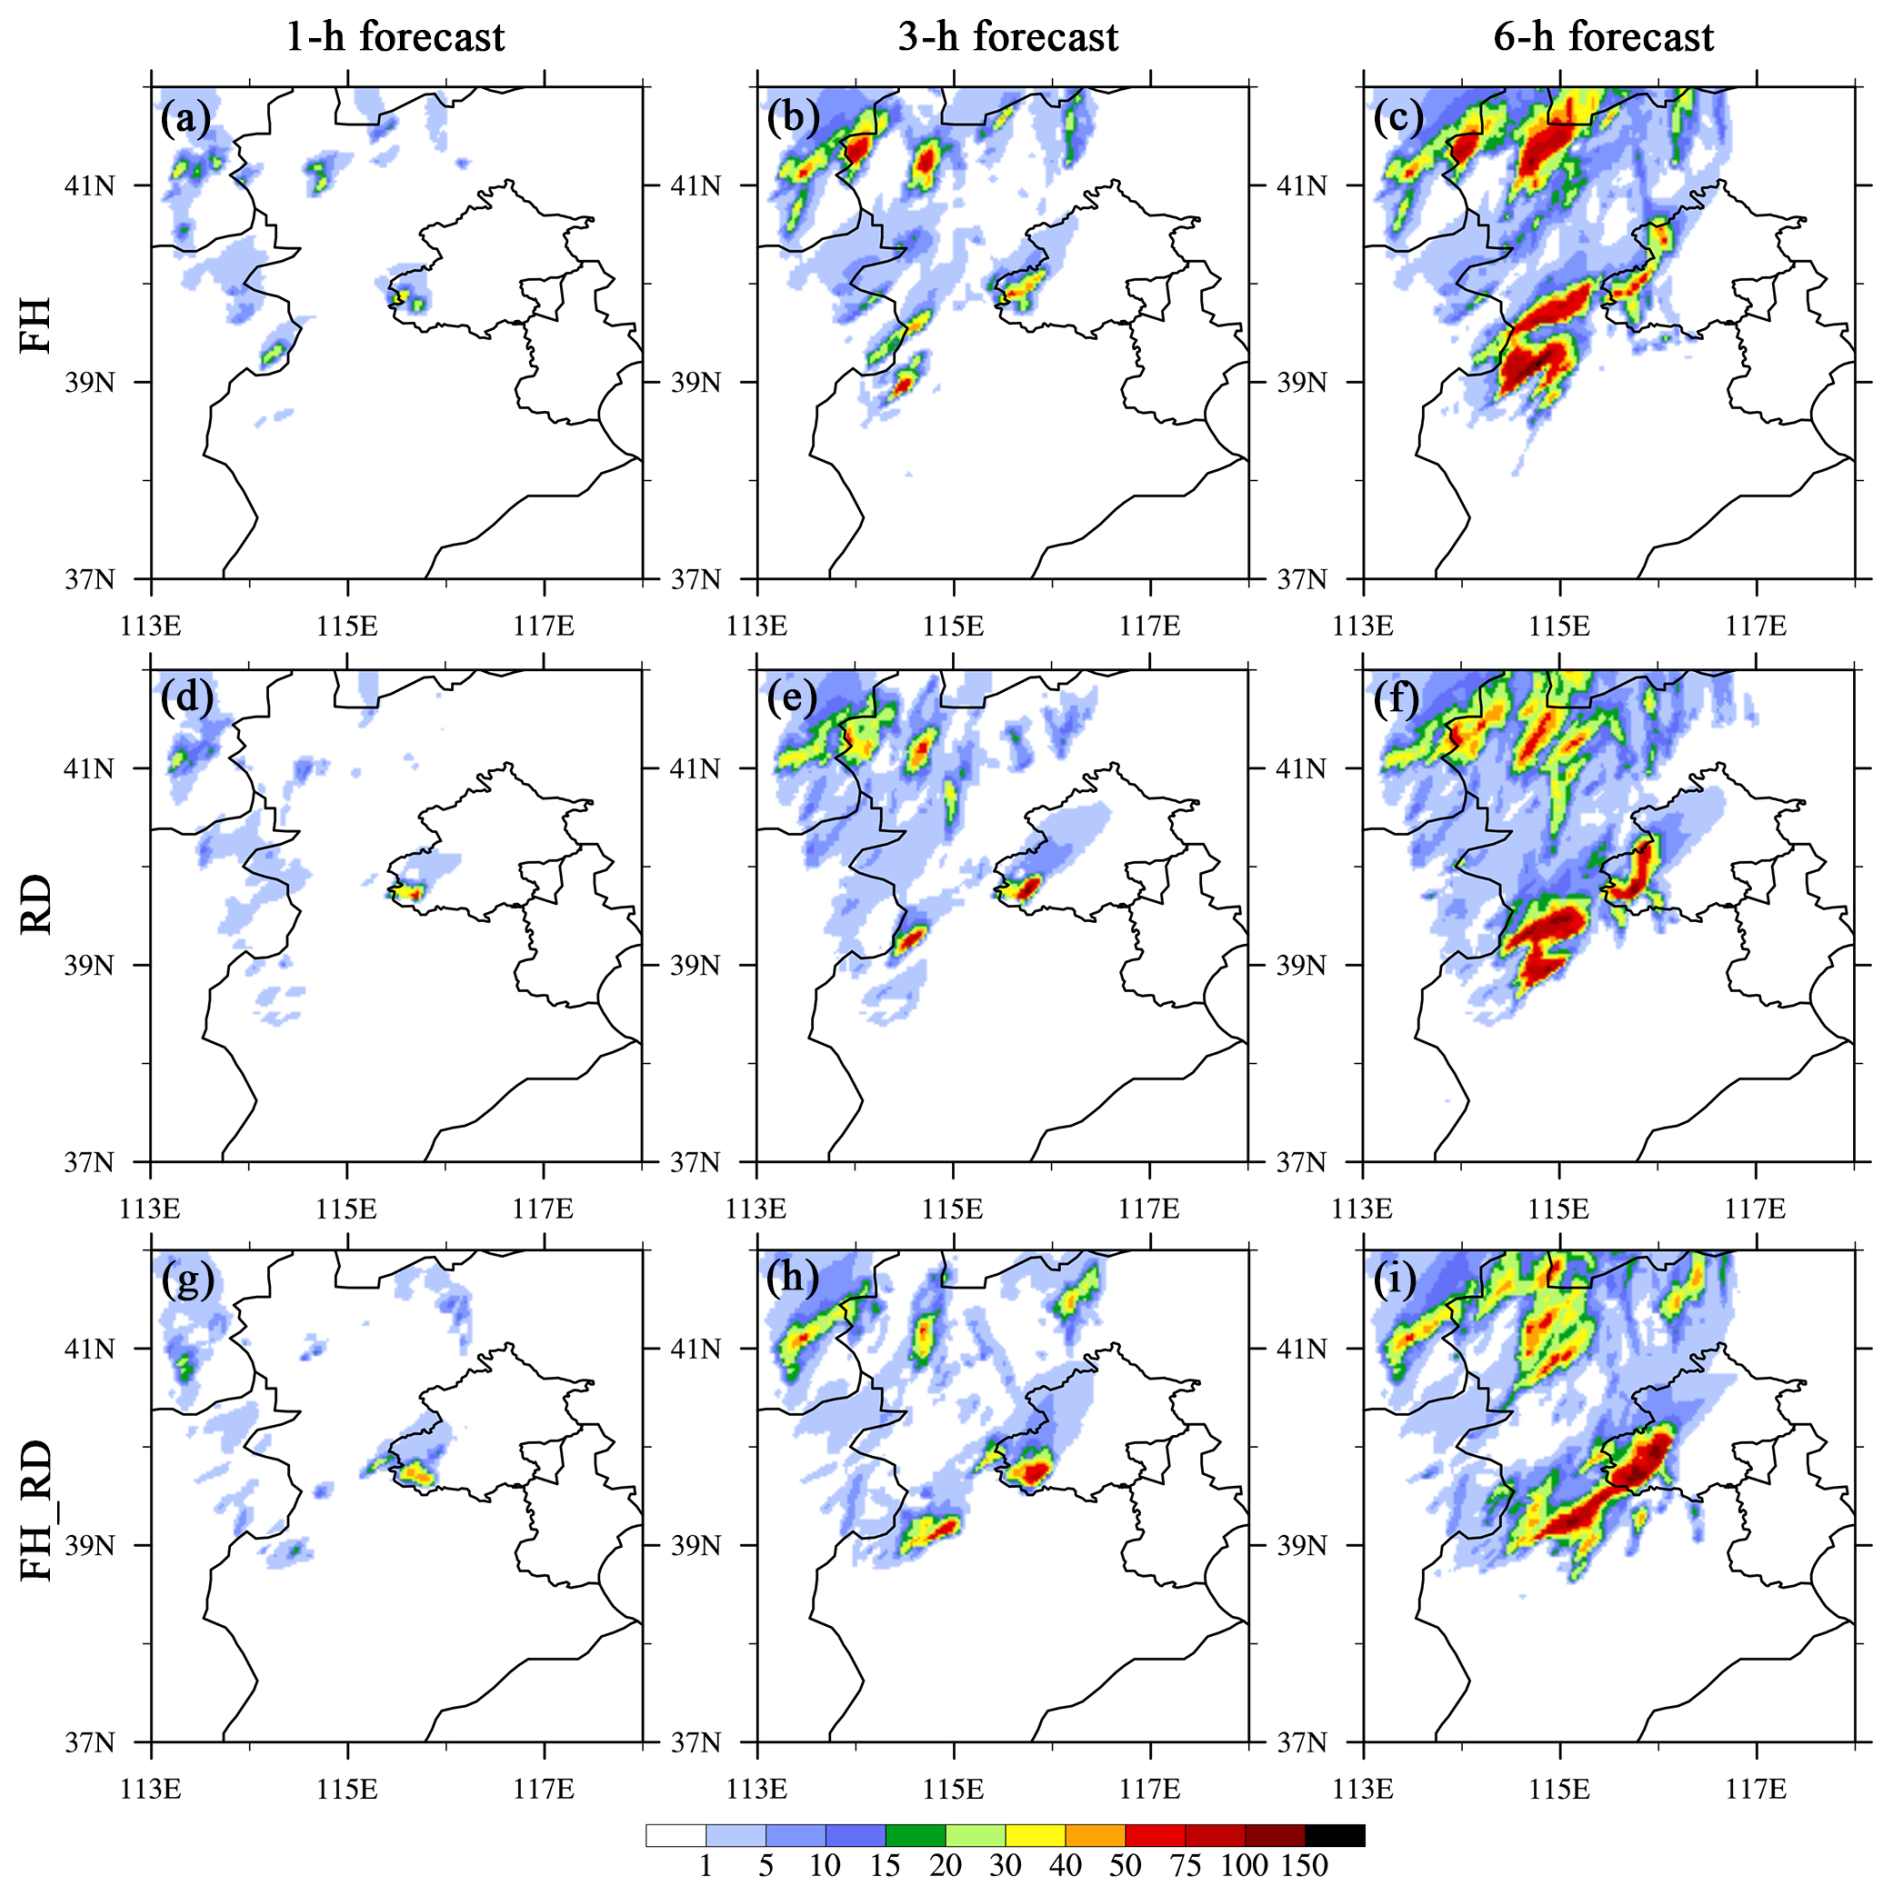
Figure 11Same as in Fig. 10 but for the APCP forecasts (mm, shaded) from (a–c) FH, (d–f) RD, and (g–i) FH_RD experiments.
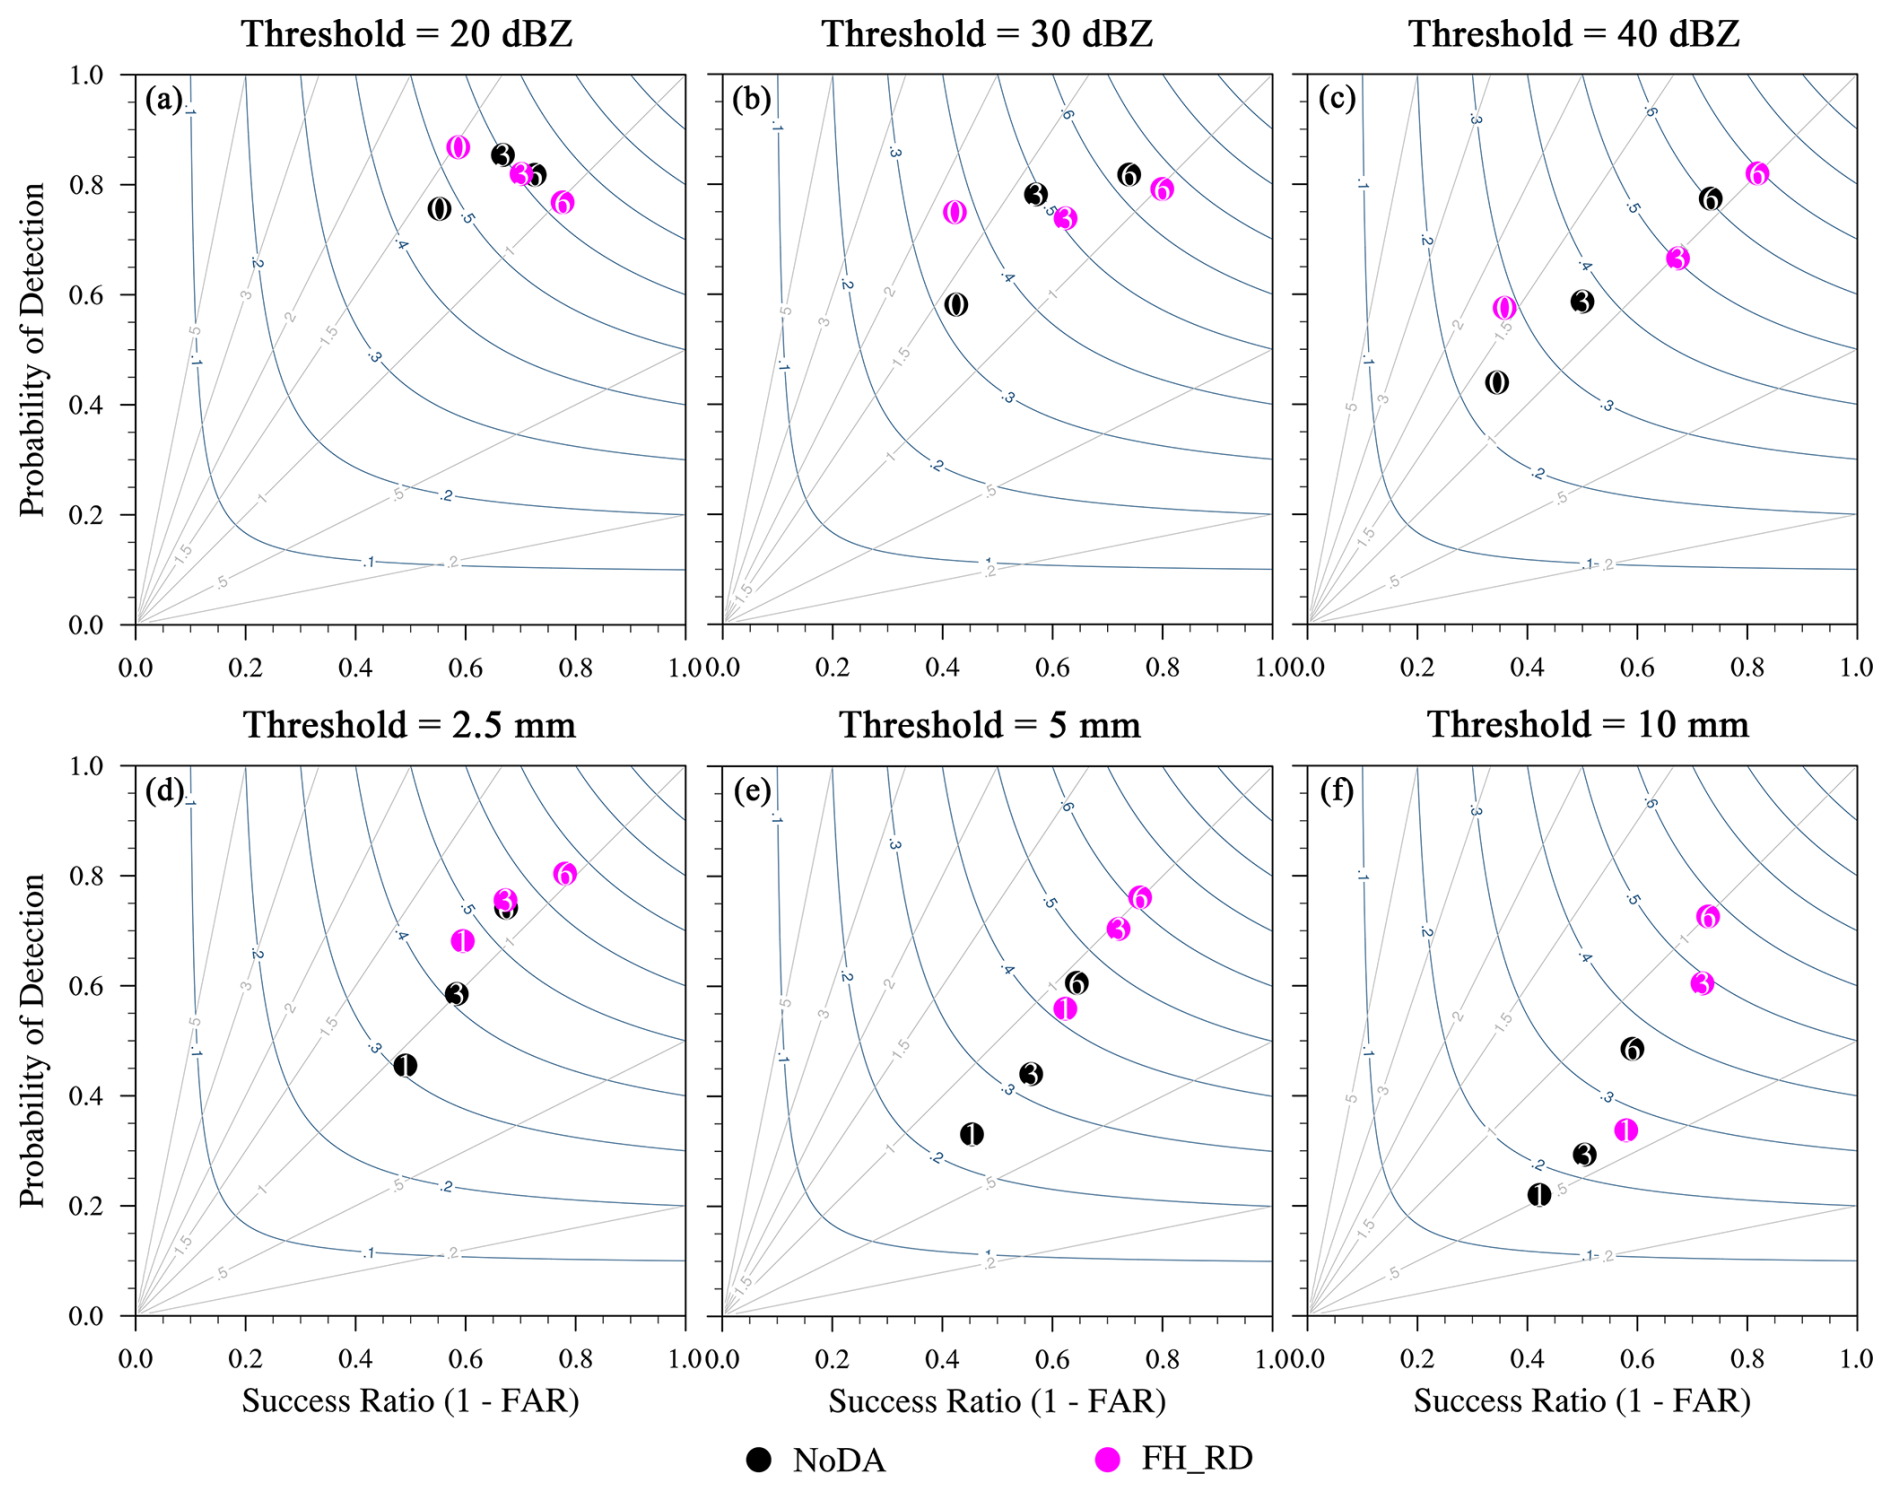
To quantify the performance of the reflectivity and precipitation forecasts by assimilating RWP data from different observation networks, categorical performance diagrams and neighborhood-based ETS are calculated and aggregated over four 6 h free forecasts. These forecasts are launched hourly from the sixth hour to the end of the analysis cycle. All score metrics are computed for a neighborhood radius of 12 km. The ETS for composite reflectivity is calculated every 15 min, while for APCP, it is calculated hourly. In the performance diagrams, values of POD, SR (1-FAR), and CSI closer to unity indicate higher forecast skill, with the perfect forecast located at the upper-right corner of the diagram. A BIAS value greater (less) than unity indicates overprediction (underprediction). Because of decreased PODs along with increased FARs, most experiments show a slight decline in forecast scores when the composite reflectivity threshold increases from 20 to 40 dBZ (Fig. 12). Overall, all DA experiments consistently outperform NoDA at all thresholds, exhibiting higher ETS values, except for the CTL (FH and FH_RD) experiment during the 0–4 h (4–5 h) forecast period at the threshold of 40 dBZ. For most thresholds and forecast lead times, the assimilation experiments generate higher POD, SR, and CSI scores compared to the NoDA experiments (with the exception of a few instances, primarily at the 40 dBZ threshold). Among them, the FH_RD, RD, and FH experiments show overwhelming superiority over CTL for the 0–4 h reflectivity forecasts in terms of ETS, POD, SR, and CSI values at all thresholds. For the 20 and 30 dBZ thresholds, it is evident that FH_RD produces the highest ETS, POD, SR, and CSI scores during the 0–3 h forecast period. However, the BIAS value of the FH_RD experiment is comparable to that of other DA experiments and is sometimes slightly worse (Fig. 12a–d). However, for 40 dBZ, the RD experiment achieves slightly higher ETS, POD, SR, and CSI scores than FH_RD does at most forecast lead times (Fig. 12e and f). It is also worth noting that, for 20 and 30 dBZ thresholds, FH produces higher ETS , POD, and CSI scores than RD does before the 2 h forecast lead time, while RD exhibits better forecast skill thereafter (Fig. 12a–d). This suggests that assimilating RWP data from the foothill network is more effective in the first 2 h, while ridge site observations have a more pronounced positive impact between 2 and 6 h. Additionally, the period during which FH outperforms RD shortens when the threshold increases from 20 to 40 dBZ.
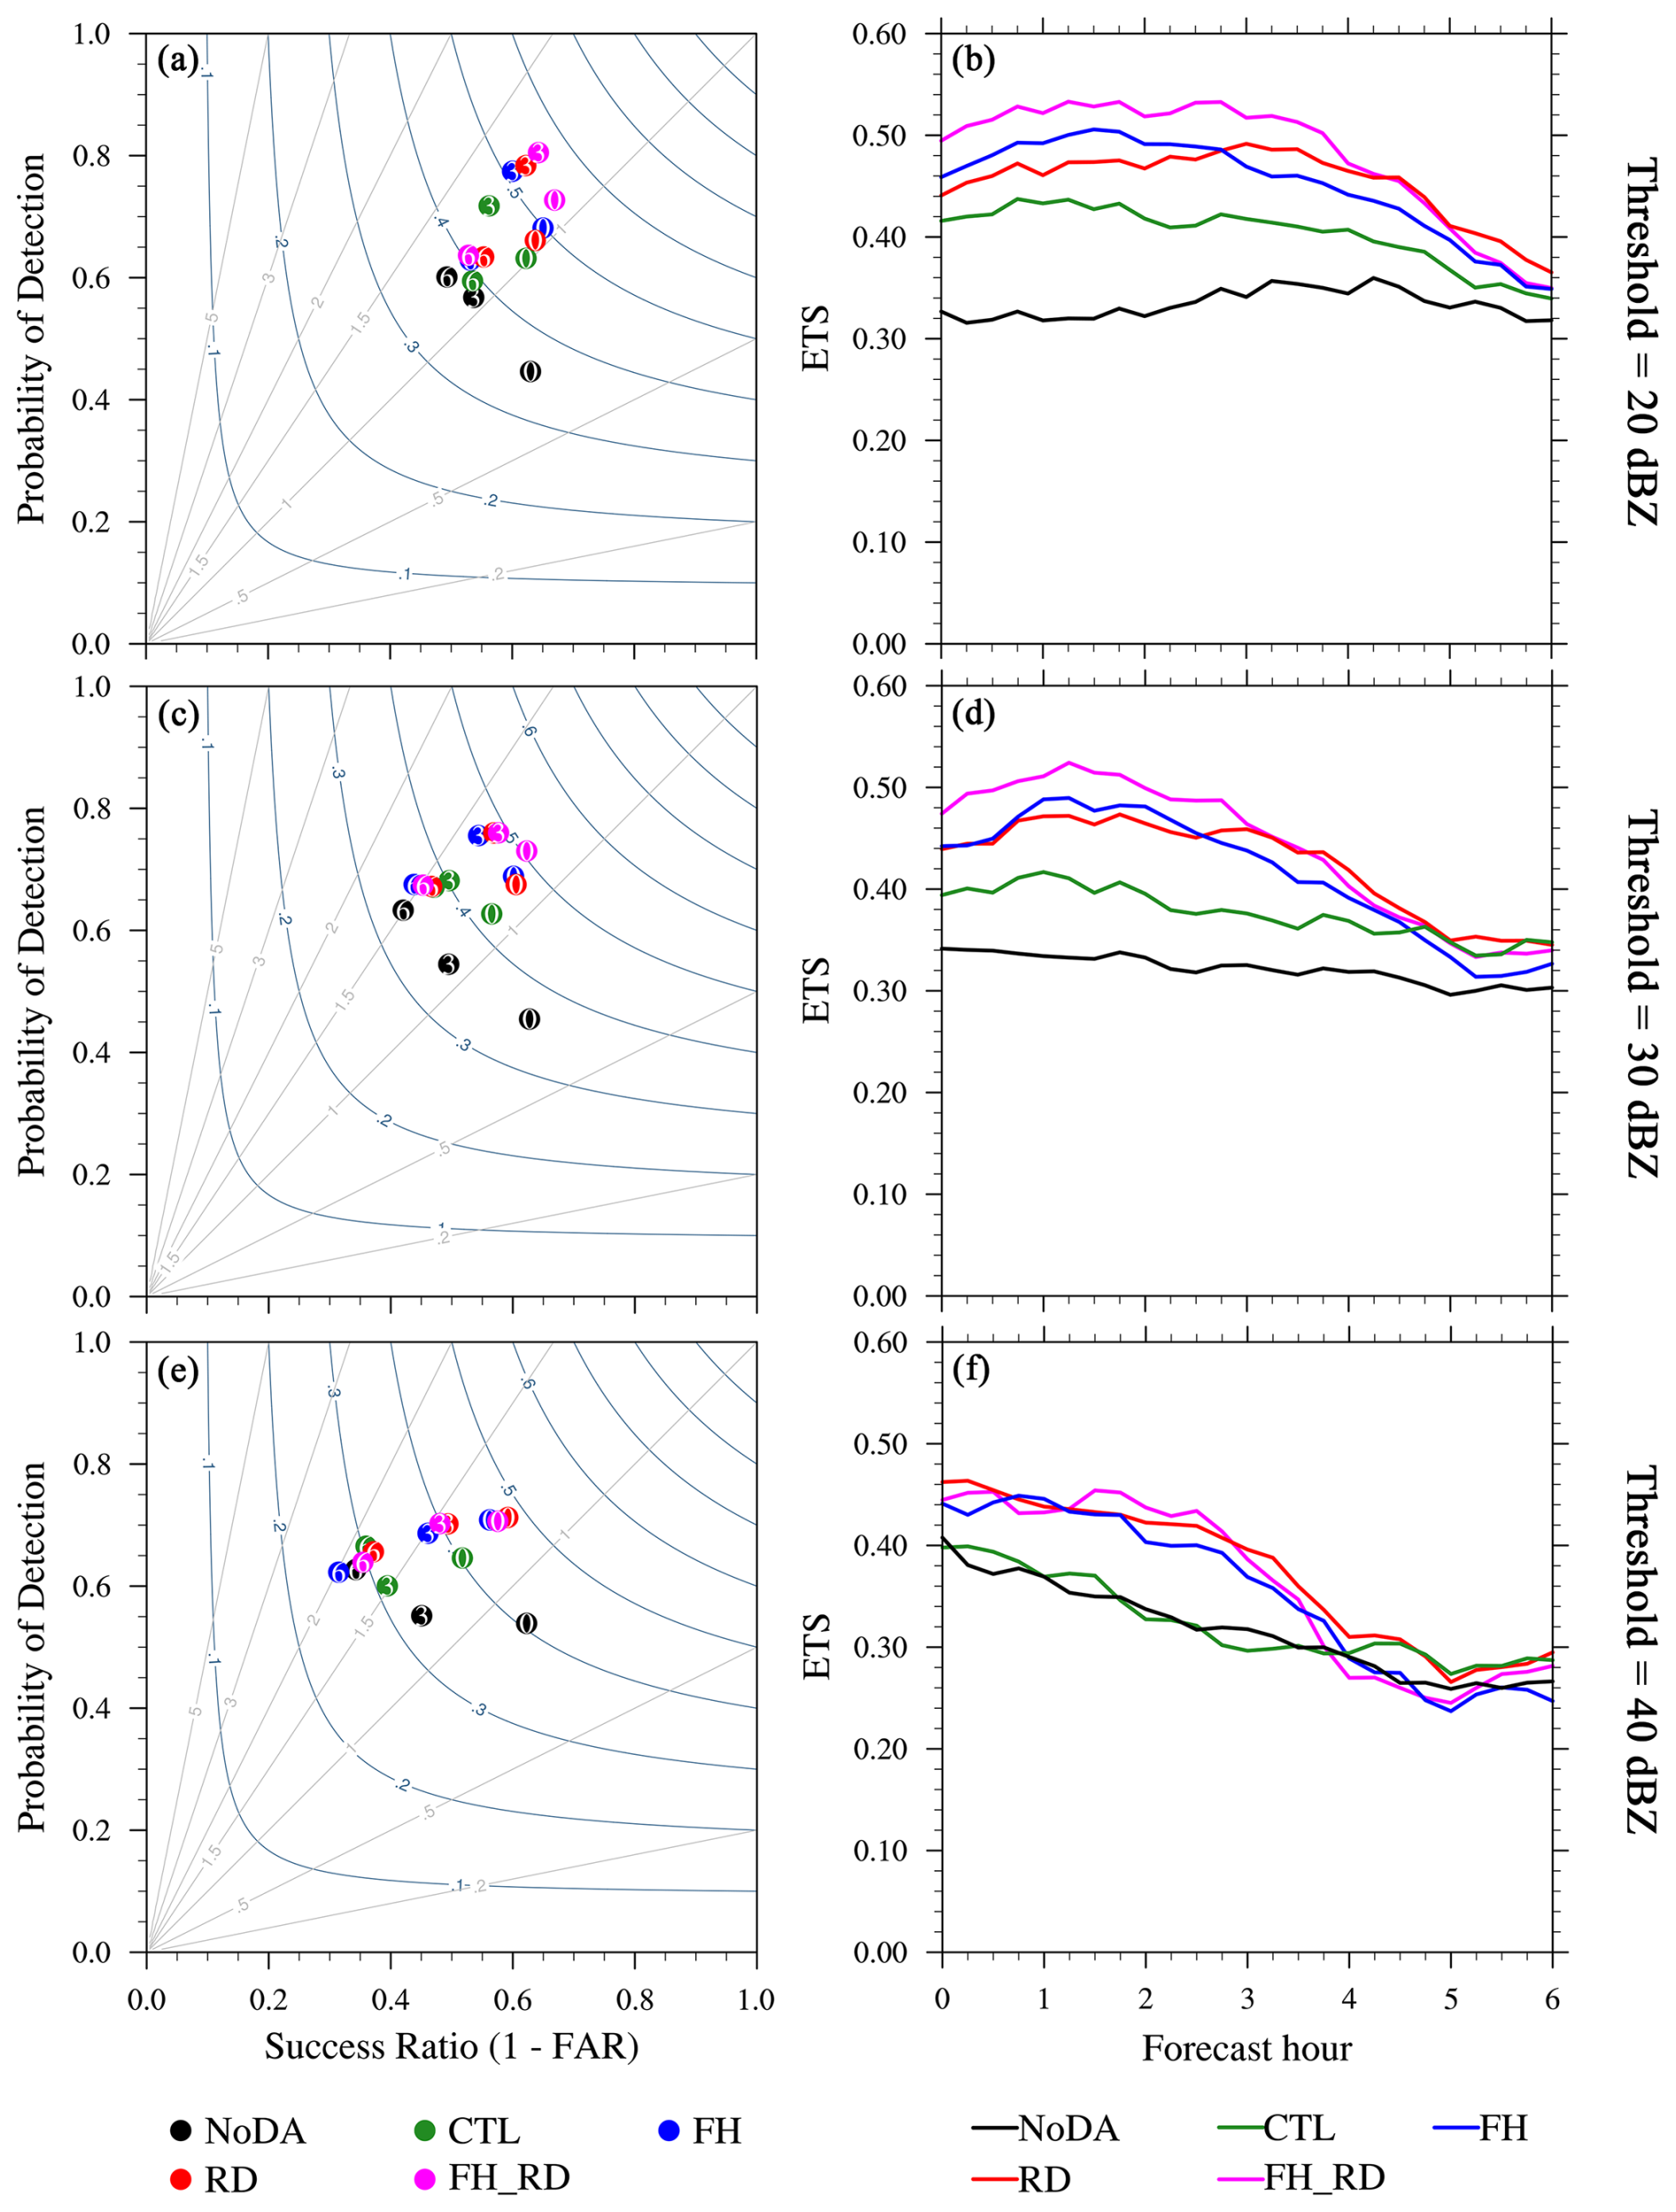
Figure 12Aggregate score metrics of 0–6 h composite reflectivity (CREF) forecasts aggregated from each initialization hour from the sixth hour to the end of the DA cycles for case 1 for the NoDA (black), CTL (green), FH (blue), RD (red), and FH_RD (magenta) experiments. (a, c, e) The performance diagrams and (b, d, f) the equitable threat score (ETS) for (a, b) 20 dBZ, (c, d) 30 dBZ, and (e, f) 40 dBZ thresholds, respectively. Results are shown for a neighborhood radius of 12 km. The numbers within the colored dots in the performance diagrams denote the forecast hour (i.e. 0, 3, and 6 h forecasts).
A similar trend and behavior are observed in the performance diagrams and ETS figures for the HPRCP forecast, highlighting the superior performance of the RD and FH_RD experiments (Fig. 13). In general, lower score metrics are obtained when a higher threshold for precipitation forecasts is evaluated, likely resulting from a lower frequency of occurrence for heavy precipitation. As seen in the CREF forecast, the FH_RD, RD, and FH experiments show more skillful precipitation forecasts than CTL does. In terms of the 2.5 mm precipitation forecast, FH_RD generally achieves the highest POD, SR, CSI, and ETS, along with the smallest BIAS, with RD exhibiting slightly inferior performance (Fig. 13a and b). For the 5 mm threshold, FH generates the highest POD and ETS in the first 3 h, whereas RD delivers the lowest FAR and largest ETS in the subsequent 3 h forecasts (Fig. 13c and d). The RD experiment outperforms all the other experiments in the 1, 3, and 4 h forecasts at the threshold of 10 mm (Fig. 13e and f). One possible reason for the superior performance of RD compared to FH_RD and FH at higher thresholds is that the heavy rainfall coverage forecasted by the RD experiment is the closest to the truth, while FH_RD exhibits a slight southward displacement error, and FH shows a northward displacement error (Fig. 11 vs. Fig. 10a–c). This may lead to larger penalties in the calculation of POD and ETS, resulting in lower scores.
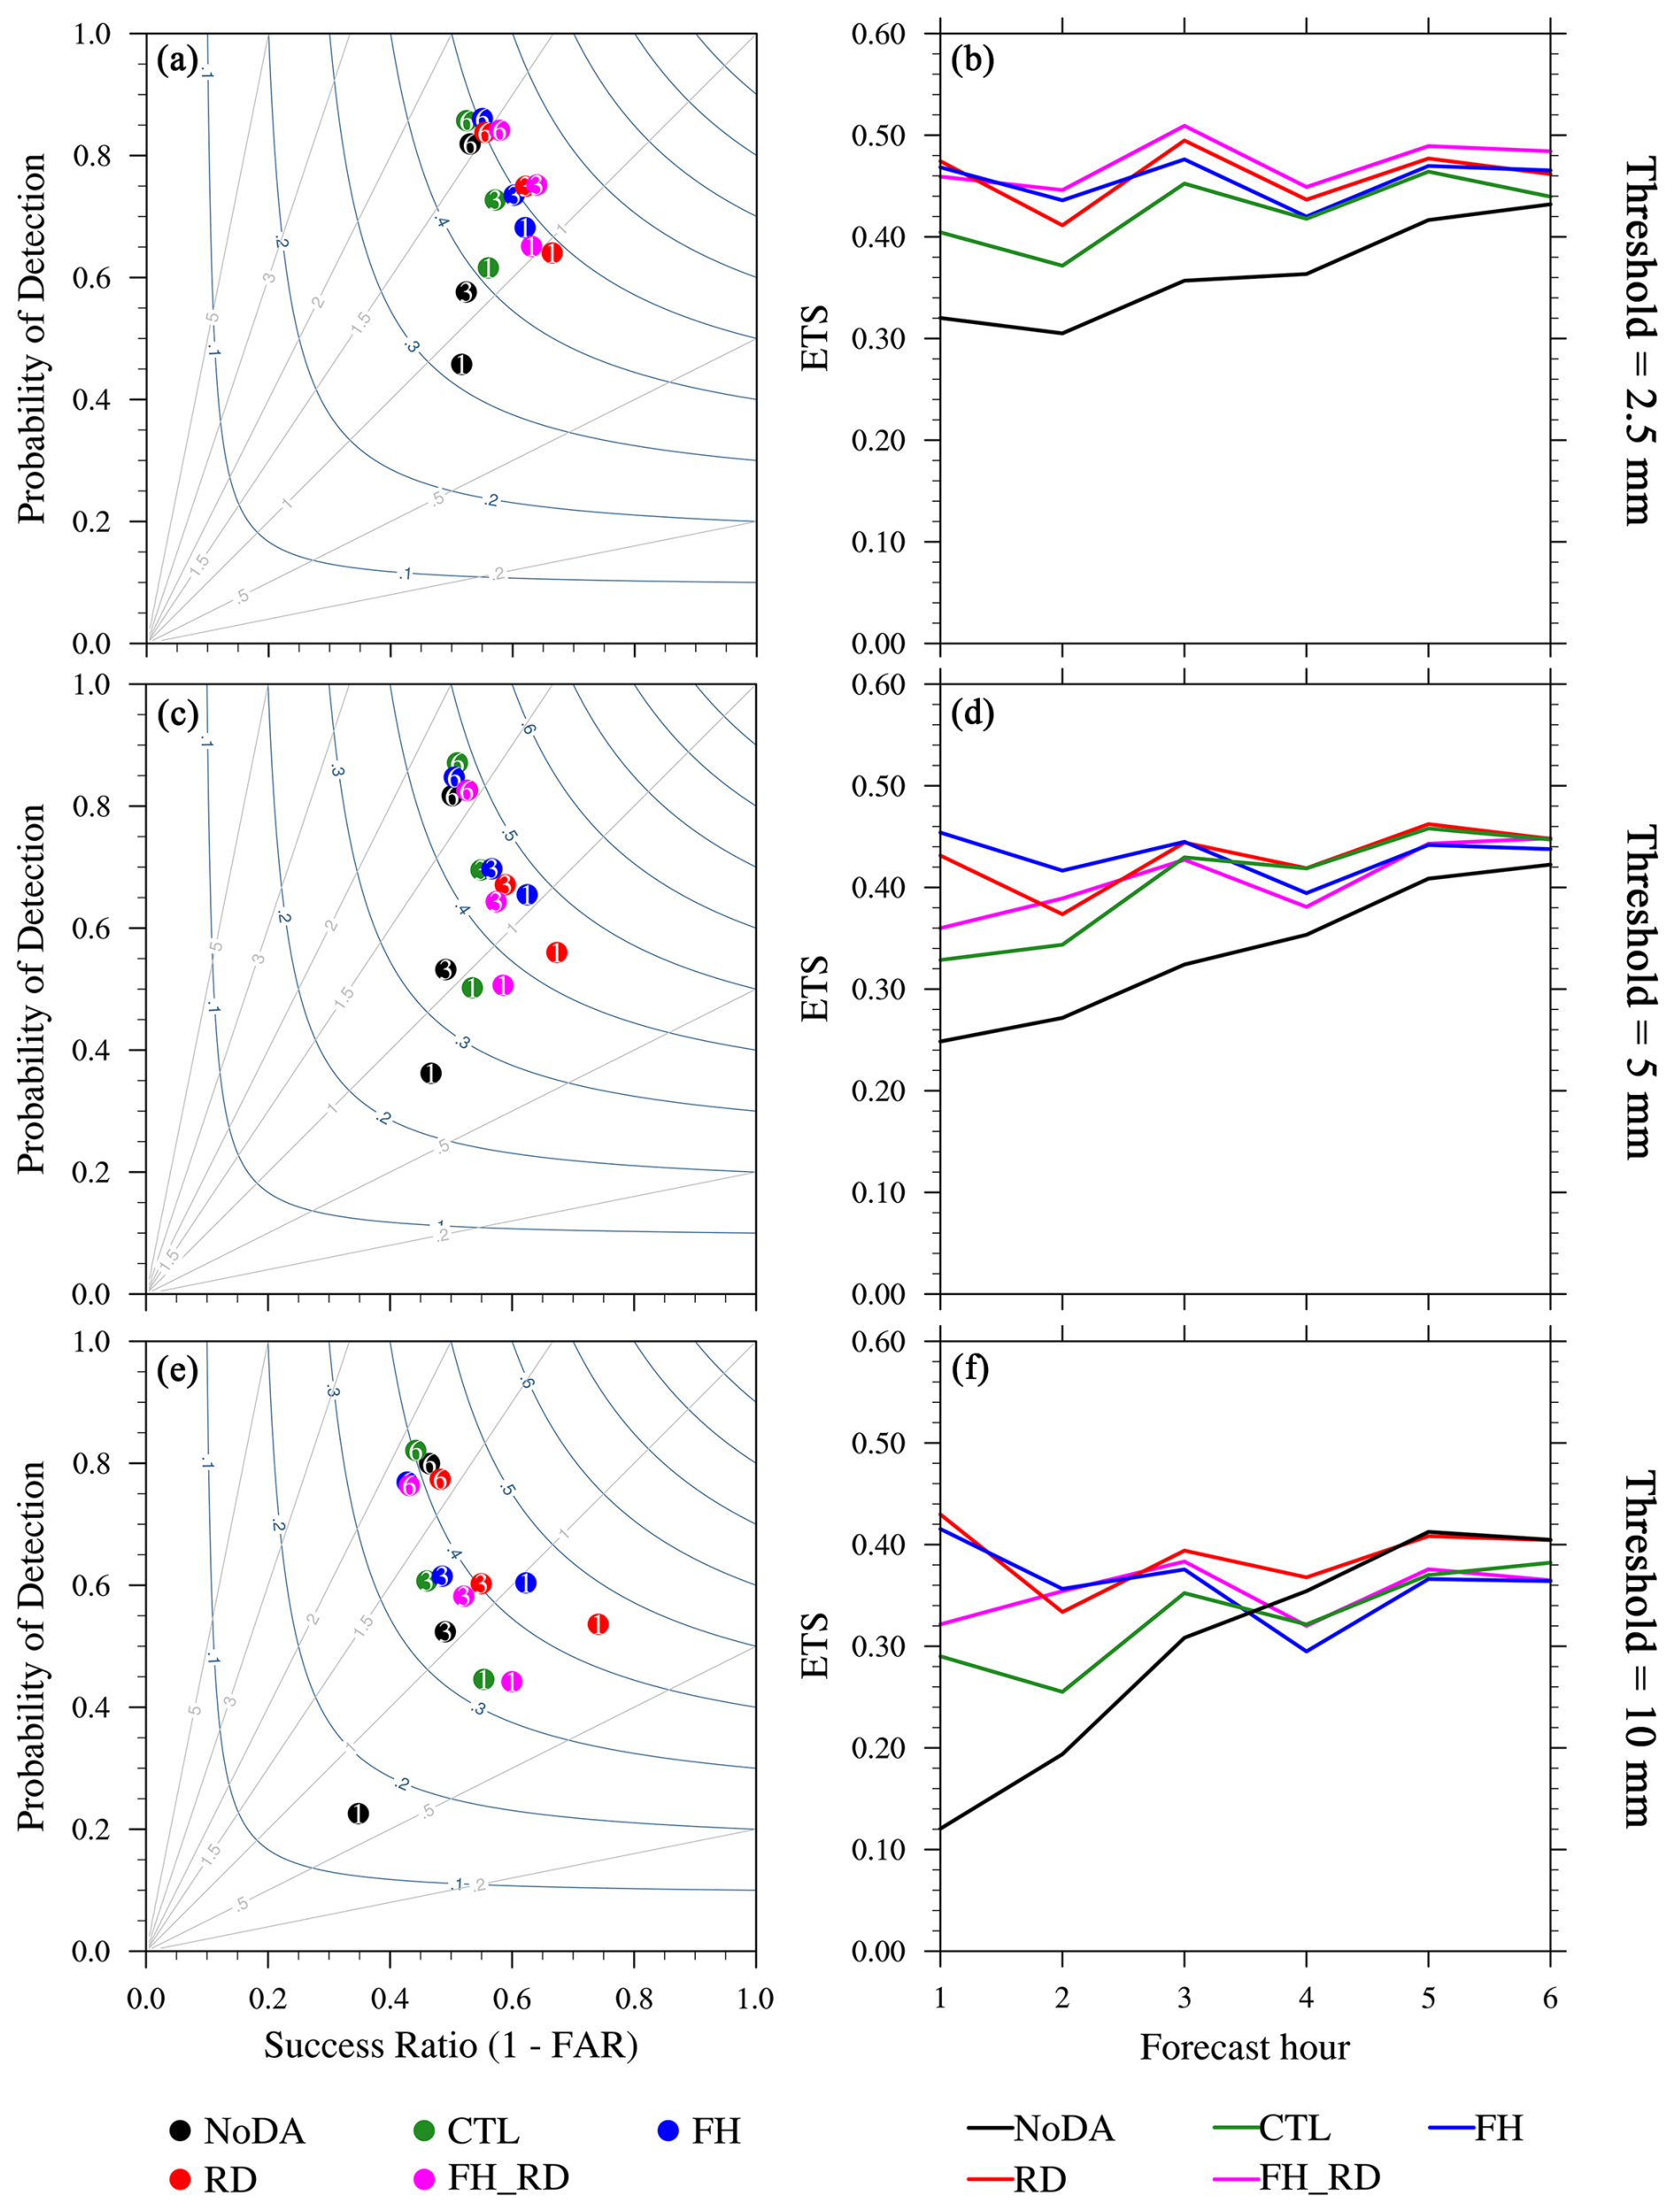
Figure 13Same as in Fig. 12 but for 1–6 h hourly precipitation amount (HPRCP) forecasts for case 1 at thresholds of 2.5 mm (a, b), 5 mm (c, d), and 10 mm (e, f), respectively.
4.1.3 Sensitivity to vertical resolution and detection height
Given the encouraging preliminary results from the FH_RD experiment, ETS figures of CREF and HPRCP forecasts from three additional sensitivity experiments – FH_RD_V120, FH_RD_H3, and FH_RD_H12 – are compared to examine the relative impact of different vertical resolutions and maximum detection heights on the analyses and forecasts (Fig. 14). For reflectivity forecasts at thresholds of 20–40 dBZ, the 0–3 h ETSs of FH_RD and FH_RD_H12 are comparable. However, the FH_RD_H12 experiment achieves higher forecast scores after 3 h, highlighting the benefit of a higher detection height (Fig. 14a–c). Conversely, the FH_RD_H3 experiment (with the lowest detection height of 3 km) shows the smallest ETS values at 20 and 30 dBZ, while FH_RD_V120 (with a lower vertical resolution of 120 m) demonstrates the poorest forecast skill at 40 dBZ. Consistent with the CREF forecast, both FH_RD and FH_RD_H12 show more skillful HPRCP forecasts than FH_RD_V120 and FH_RD_H3. However, the ETSs of FH_RD are higher than those of FH_RD_H12 at most forecast lead times, which differs from the reflectivity results. Additionally, FH_RD_H3 produces the lowest ETS values throughout the 0–6 h forecasts at thresholds of 2.5–10 mm. Generally, the higher the maximum detection height of RWPs and the denser the vertical distribution of observations, the more significant the positive impact of RWP DA in terms of ETS. Moreover, a maximum detection height of 8 km seems to be a reasonable and effective choice, while the reduction of vertical resolution from 60 to 120 m has less impact compared to the effect of decreasing the detection altitude to 3 km.
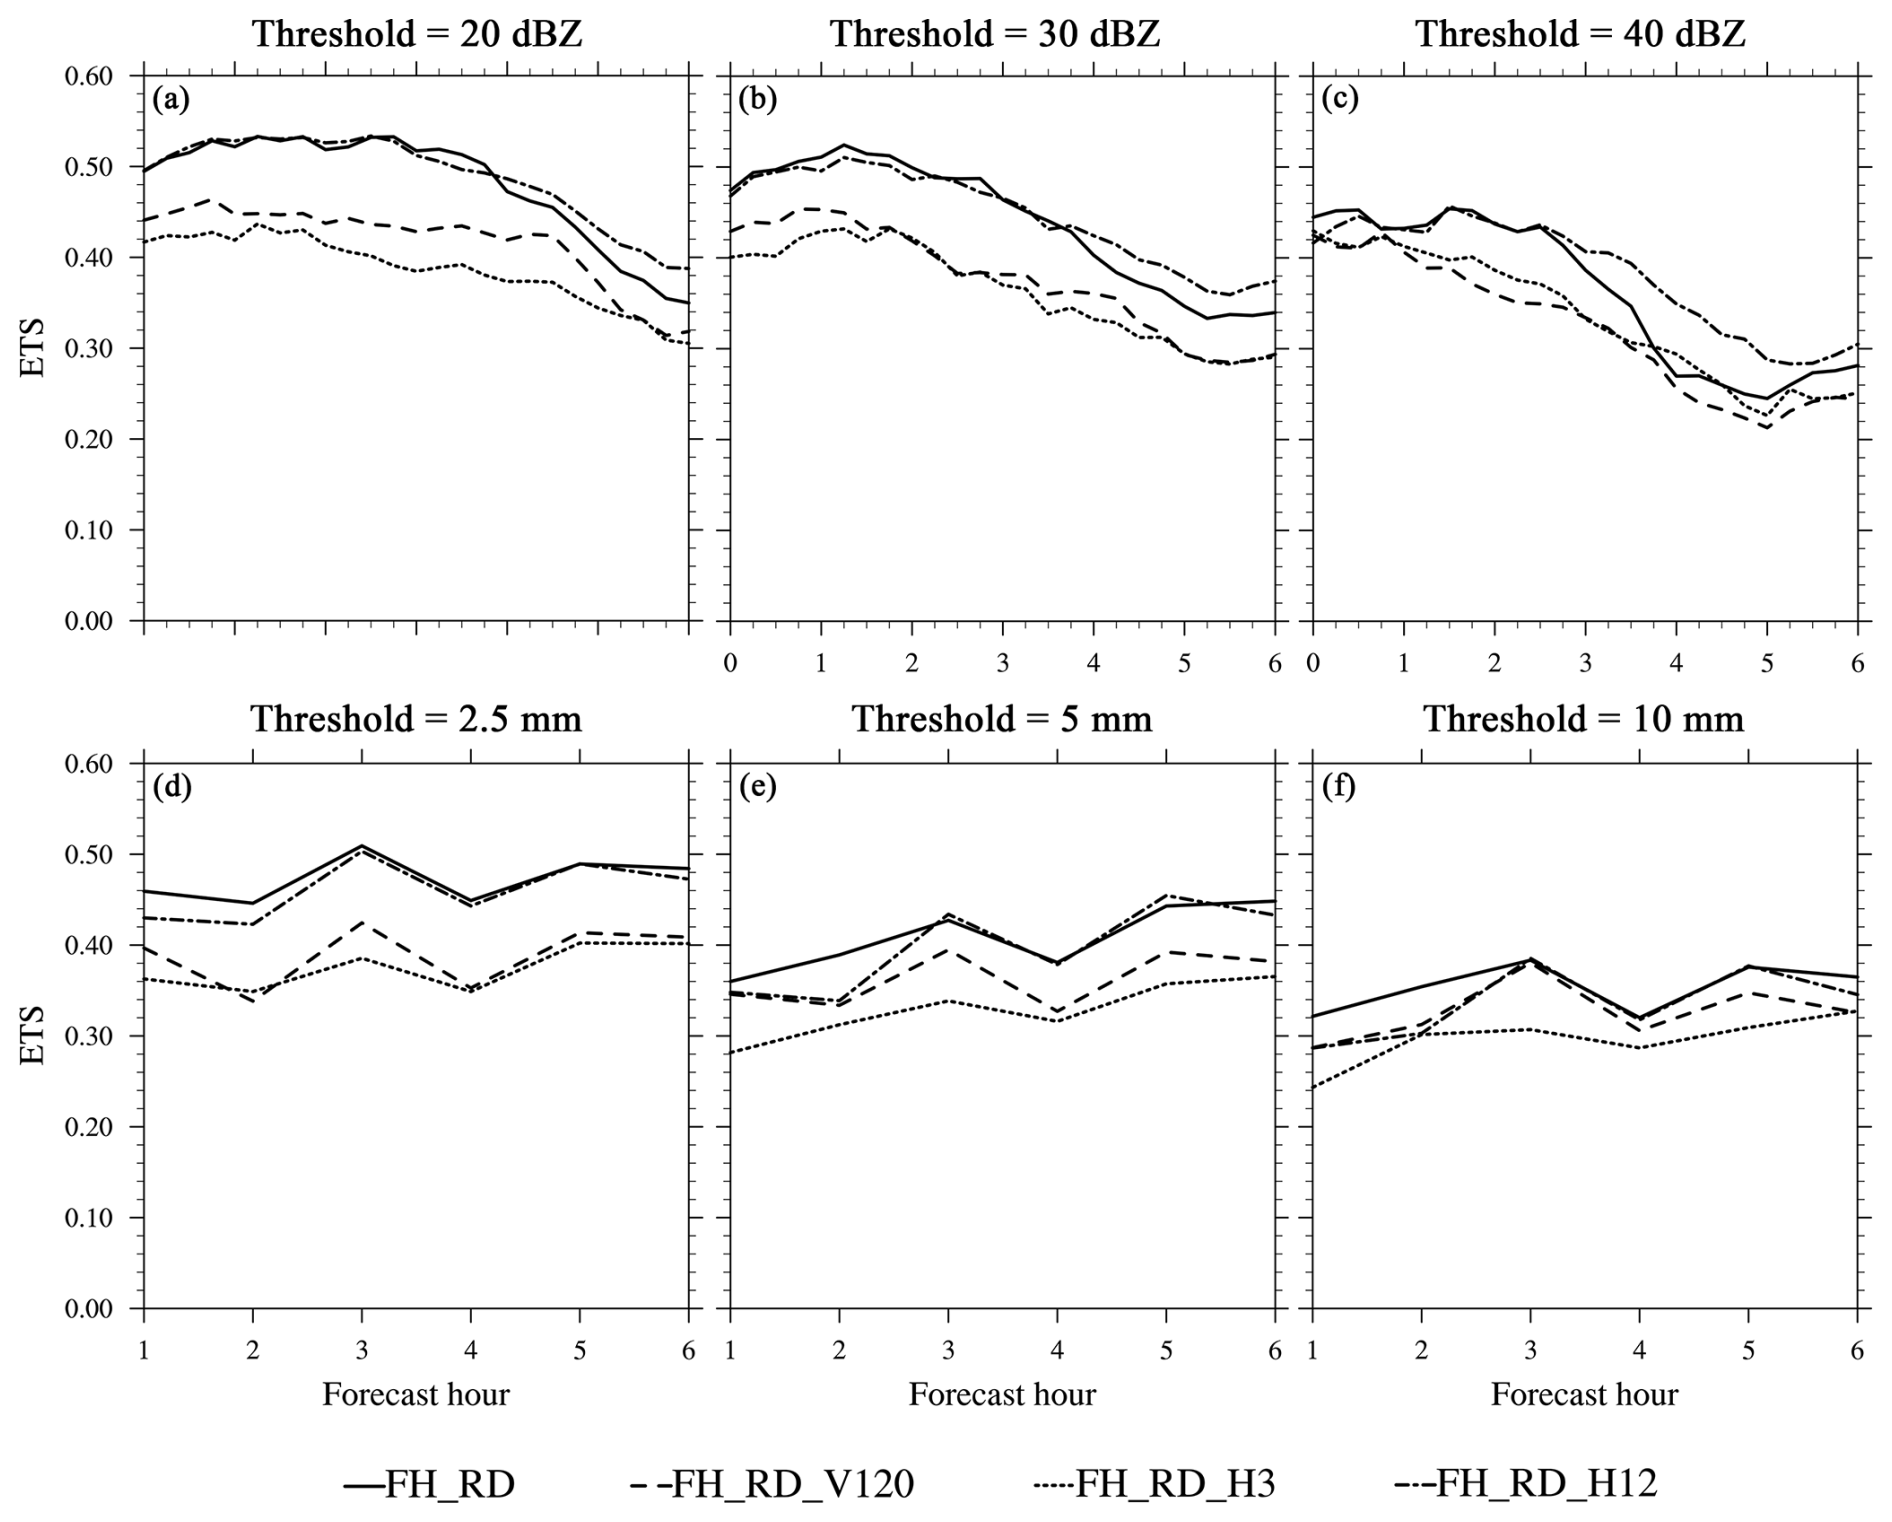
Figure 14Equitable threat score (ETS) for 0–6 h CREF forecasts from the FH_RD (solid), FH_RD_V120 (dashed), FH_RD_H3 (dotted), and FH_RD_H12 (dot-dash) experiments for case 1 at thresholds of (a) 20 dBZ, (b) 30 dBZ, and (c) 40 dBZ, respectively. (d–f) Same as in (a)–(c) but for 1–6 h HPRCP forecasts from each experiment at thresholds of (d) 2.5 mm, (e) 5 mm, and (f) 10 mm, respectively.
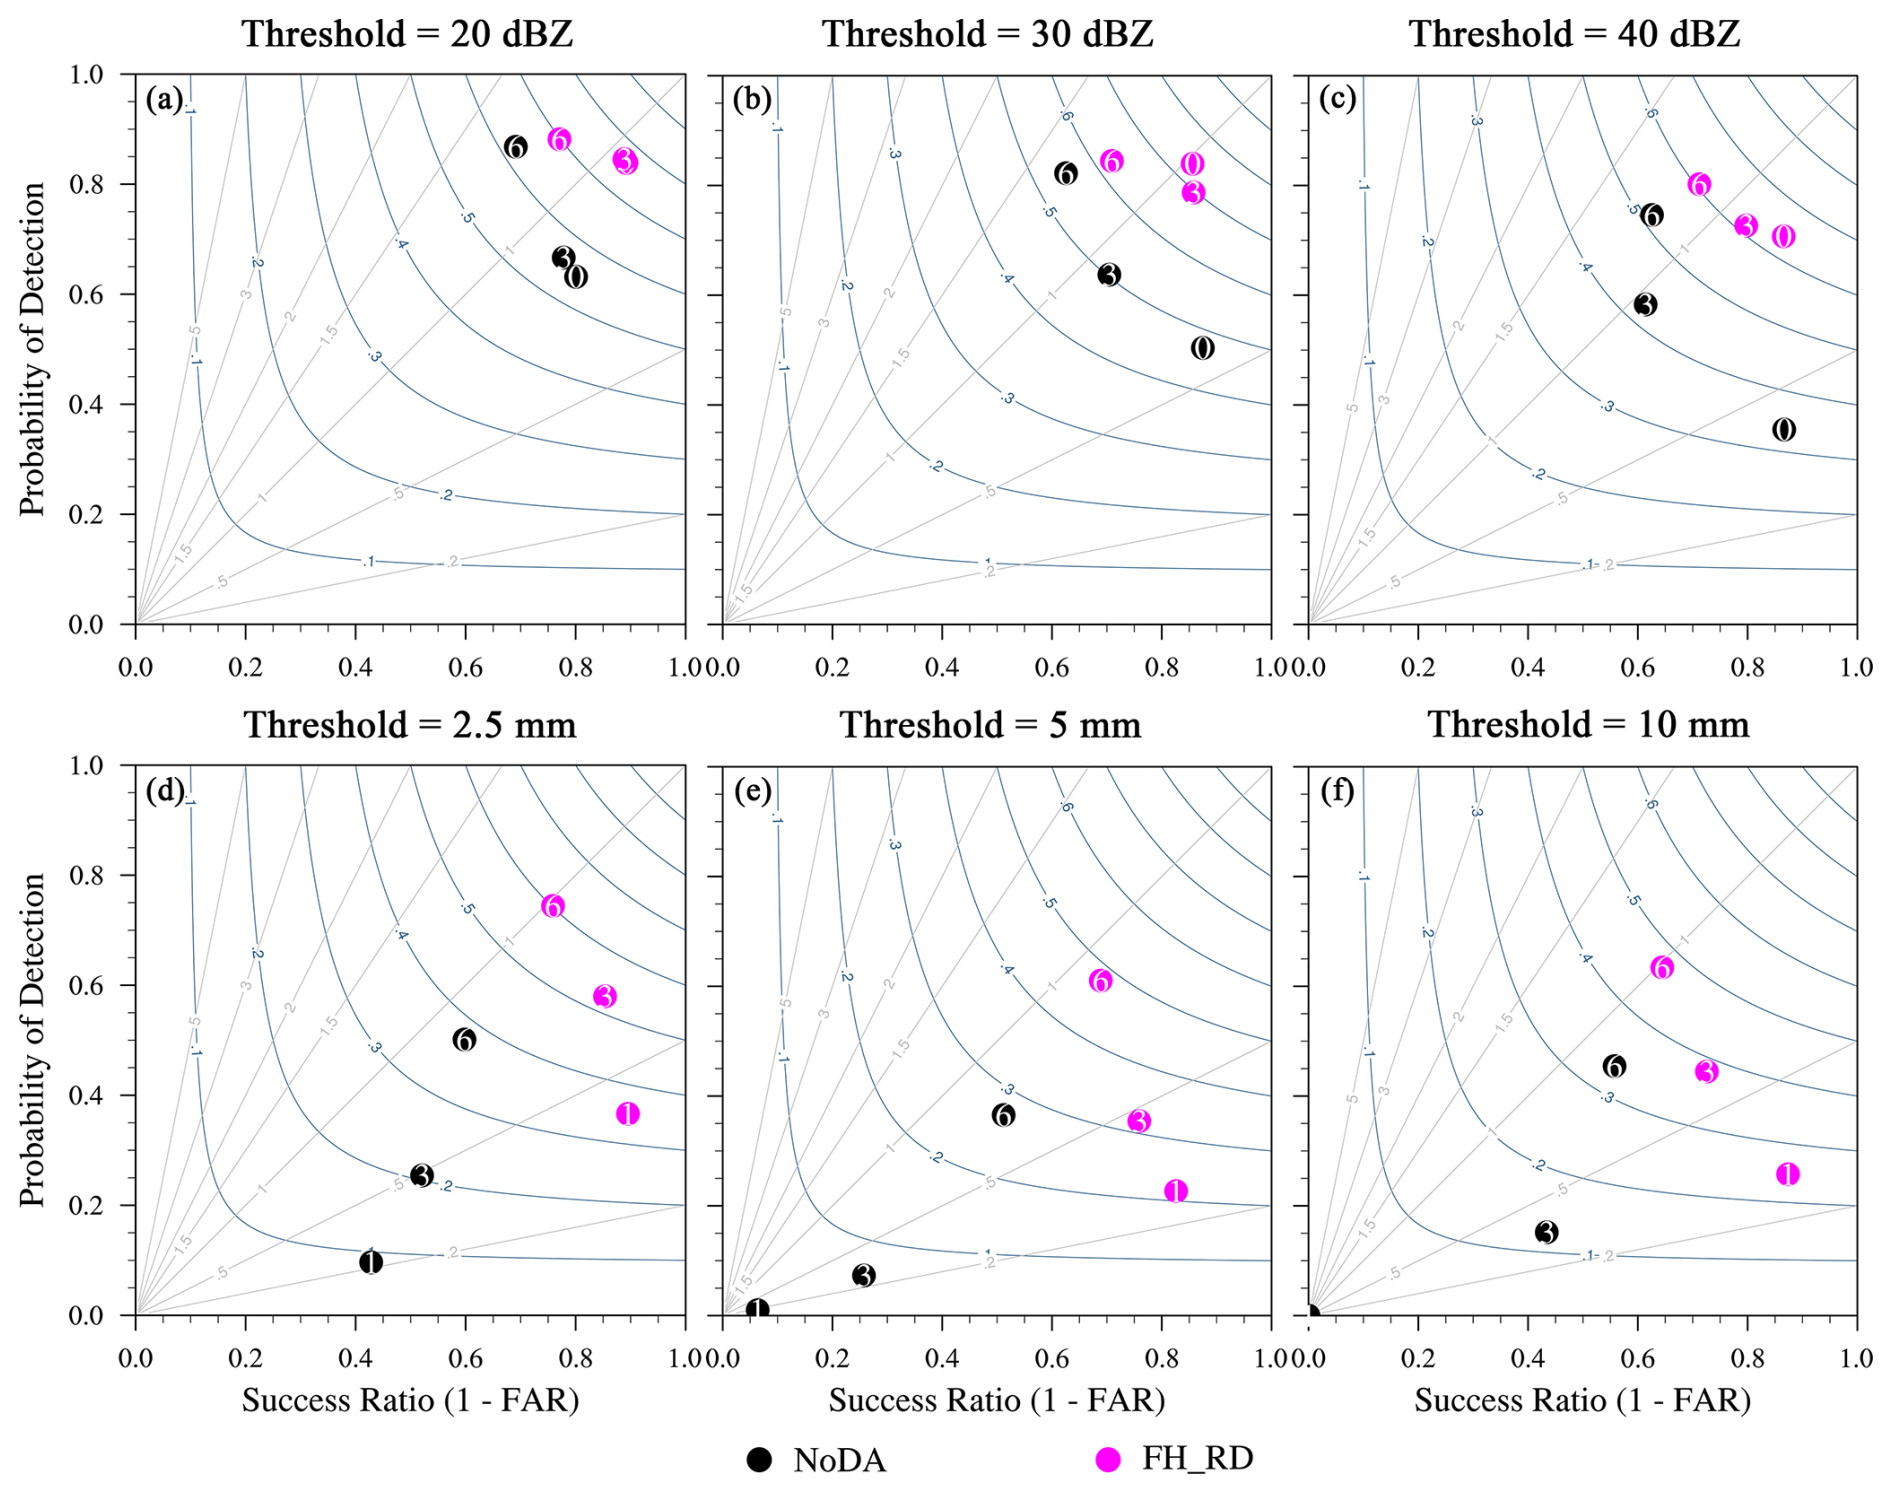
Figure 15Performance diagram for 0–6 h CREF forecasts from the NoDA (black) and FH_RD (magenta) experiments for the case 28 June 2023 at thresholds of (a) 20 dBZ, (b) 30 dBZ, and (c) 40 dBZ, respectively. (d–f) Same as in (a)–(c) but for 1–6 h HPRCP forecasts at thresholds of (d) 2.5 mm, (e) 5 mm, and (f) 10 mm, respectively. The numbers within the colored dots in the performance diagrams denote the forecast hour (i.e. 0, 3, and 6 h forecasts). Results are shown for a neighborhood radius of 12 km.
4.2 Aggregate forecast performance
Considering the variations in weather scenarios and storm environments across cases, we have also examined two additional SW-type heavy rainfall events that occurred over the Beijing–Tianjin–Hebei region on 28 June and 12 July 2023 to evaluate the impact of RWPs in different spatial layouts on short-term forecasts. Despite the presence of a southwesterly jet stream in all three cases, they produced distinct storm modes under different weather conditions. To delve deeper into the verification metrics from the other two cases, we present performance diagrams of CREF and HPRCP forecasts from the FH_RD experiment as the best assimilation experiment (Figs. 15 and 16). The results from the NoDA experiment are also shown to provide a clear picture of how RWP observations improve the short-term forecasts across different cases. For both the NoDA and FH_RD experiments, the forecast skills generally exhibit lower score metrics and more variability at higher thresholds. Overall, for these two cases, the FH_RD experiment shows higher POD, CSI, and SR values compared to the NoDA experiment, with more significant improvements observed in the first 3 h. Except for the 1–3 h precipitation forecasts from the case 28 June 2023, the BIAS values of FH_RD fall within a reasonable range of 0.8–1.7 for reflectivity and precipitation, indicating overall good forecast performance. It is noted that some of the forecast scores do not decrease monotonically with increasing forecast lead time. For example, in the case 12 July 2023, smaller BIAS and FAR values are obtained for the 3 and 6 h reflectivity and precipitation forecasts, along with higher CSI. This occurs due to several factors:
- a.
Initial scattered convection develops into a larger-scale west–east-oriented system covering all of Beijing and central-northern Hebei at later times in this case, which models usually capture better.
- b.
Errors in the timing and location of CI become less significant as convection evolves and forms clearer structures.
- c.
For the free forecasts initialized from the first few hours, convection may not have started until the final forecast hour.
CREF forecasts from FH_RD for the case 28 June 2023 show the best performance in terms of high POD, SR, and CSI. Meanwhile, persistent underprediction throughout the 1–6 h precipitation forecasts at all thresholds from this case can mostly be traced back to the difficulty in forecasting small-scale, short-lived, and relatively weak precipitation events. This phenomenon is more pronounced in the NoDA experiment, manifested by extremely low POD and CSI values.
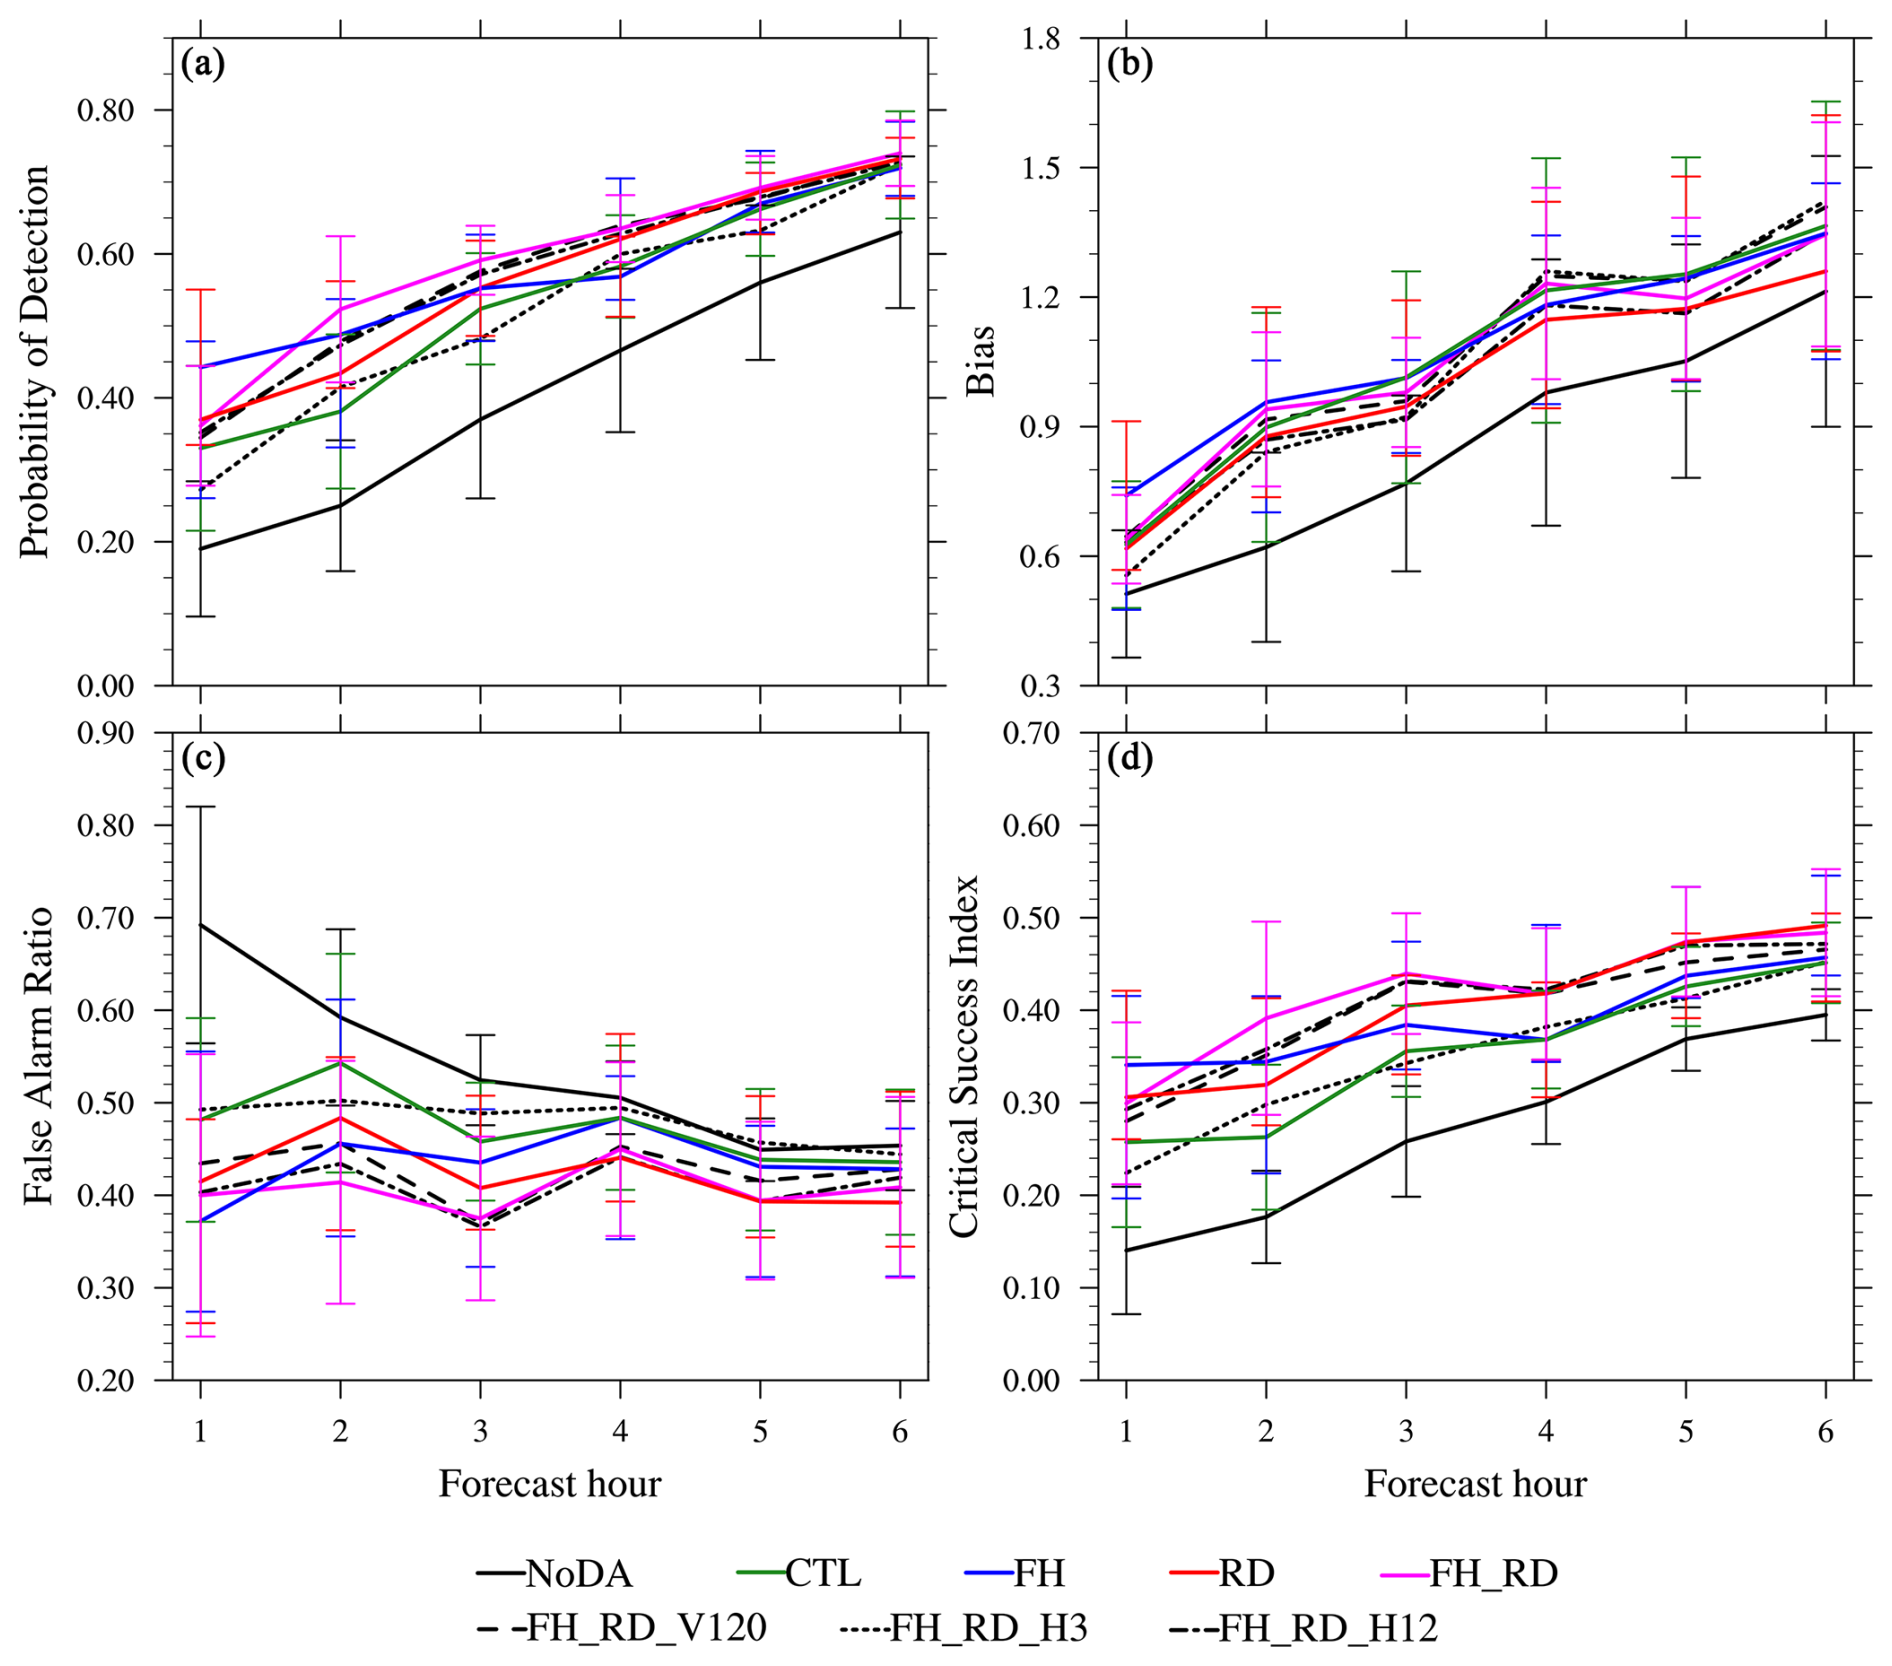
To gain a comprehensive view of assimilating RWPs from multiple networks, quantitative verification parameters (POD, BIAS, FAR, and CSI) from each case are aggregated across all available forecast times. Figures 17 and 18 display time series of aggregated metrics for CREF forecasts from NoDA, CTL, FH, RD, FH_RD, FH_RD_V120, FH_RD_H3, and FH_RD_H12 experiments at 20 and 40 dBZ thresholds, respectively. The error bars for NoDA, CTL, FH, RD, and FH_RD in the graphs represent a 95 % confidence interval. Compared to NoDA, all DA experiments exhibit more skillful 0–6 h reflectivity forecasts, with higher POD and CSI and smaller FAR. The BIAS values of the assimilation experiments are higher than those of the NoDA experiment (close to unity) at the analysis time and then decrease slightly in the 1–6 h forecasts. However, the BIAS of NoDA increases consistently during 1–6 h, making it farther from unity. Among CTL, FH, RD, and FH_RD, FH_RD consistently outperforms others, showing the highest POD values across all forecast hours (Fig. 17a). A slight overprediction bias (1.1–1.2) is observed for all DA experiments at all forecast times (Fig. 17b). CTL exhibits the largest BIAS in the first 3 h, while FH's BIAS increases to 1.2 over time. FH_RD shows the steepest decrease in FAR, indicating the most effective reduction in false alarms (Fig. 17c). CTL remains relatively flat and maintains the highest FAR among the four DA experiments throughout the 0–6h forecasts. The FARs for FH and RD forecasts fall between those of FH_RD and CTL. Specifically, FH has a lower FAR in the first 3 h, whereas in the next 3 h, RD performs better. A similar trend is also evident in CSI values over time (Fig. 17d). In conclusion, FH_RD consistently performs best overall across all metrics, followed by RD and FH. CTL underperforms, with less improvement in score metrics. Sensitivity tests show FH_RD_H12 performs slightly better than FH_RD, while FH_RD_H3 shows the least improvement. FH_RD_V120 falls between FH_RD_H12 and FH_RD_H3, consistent with the single-case study in Sect. 4.1.3.
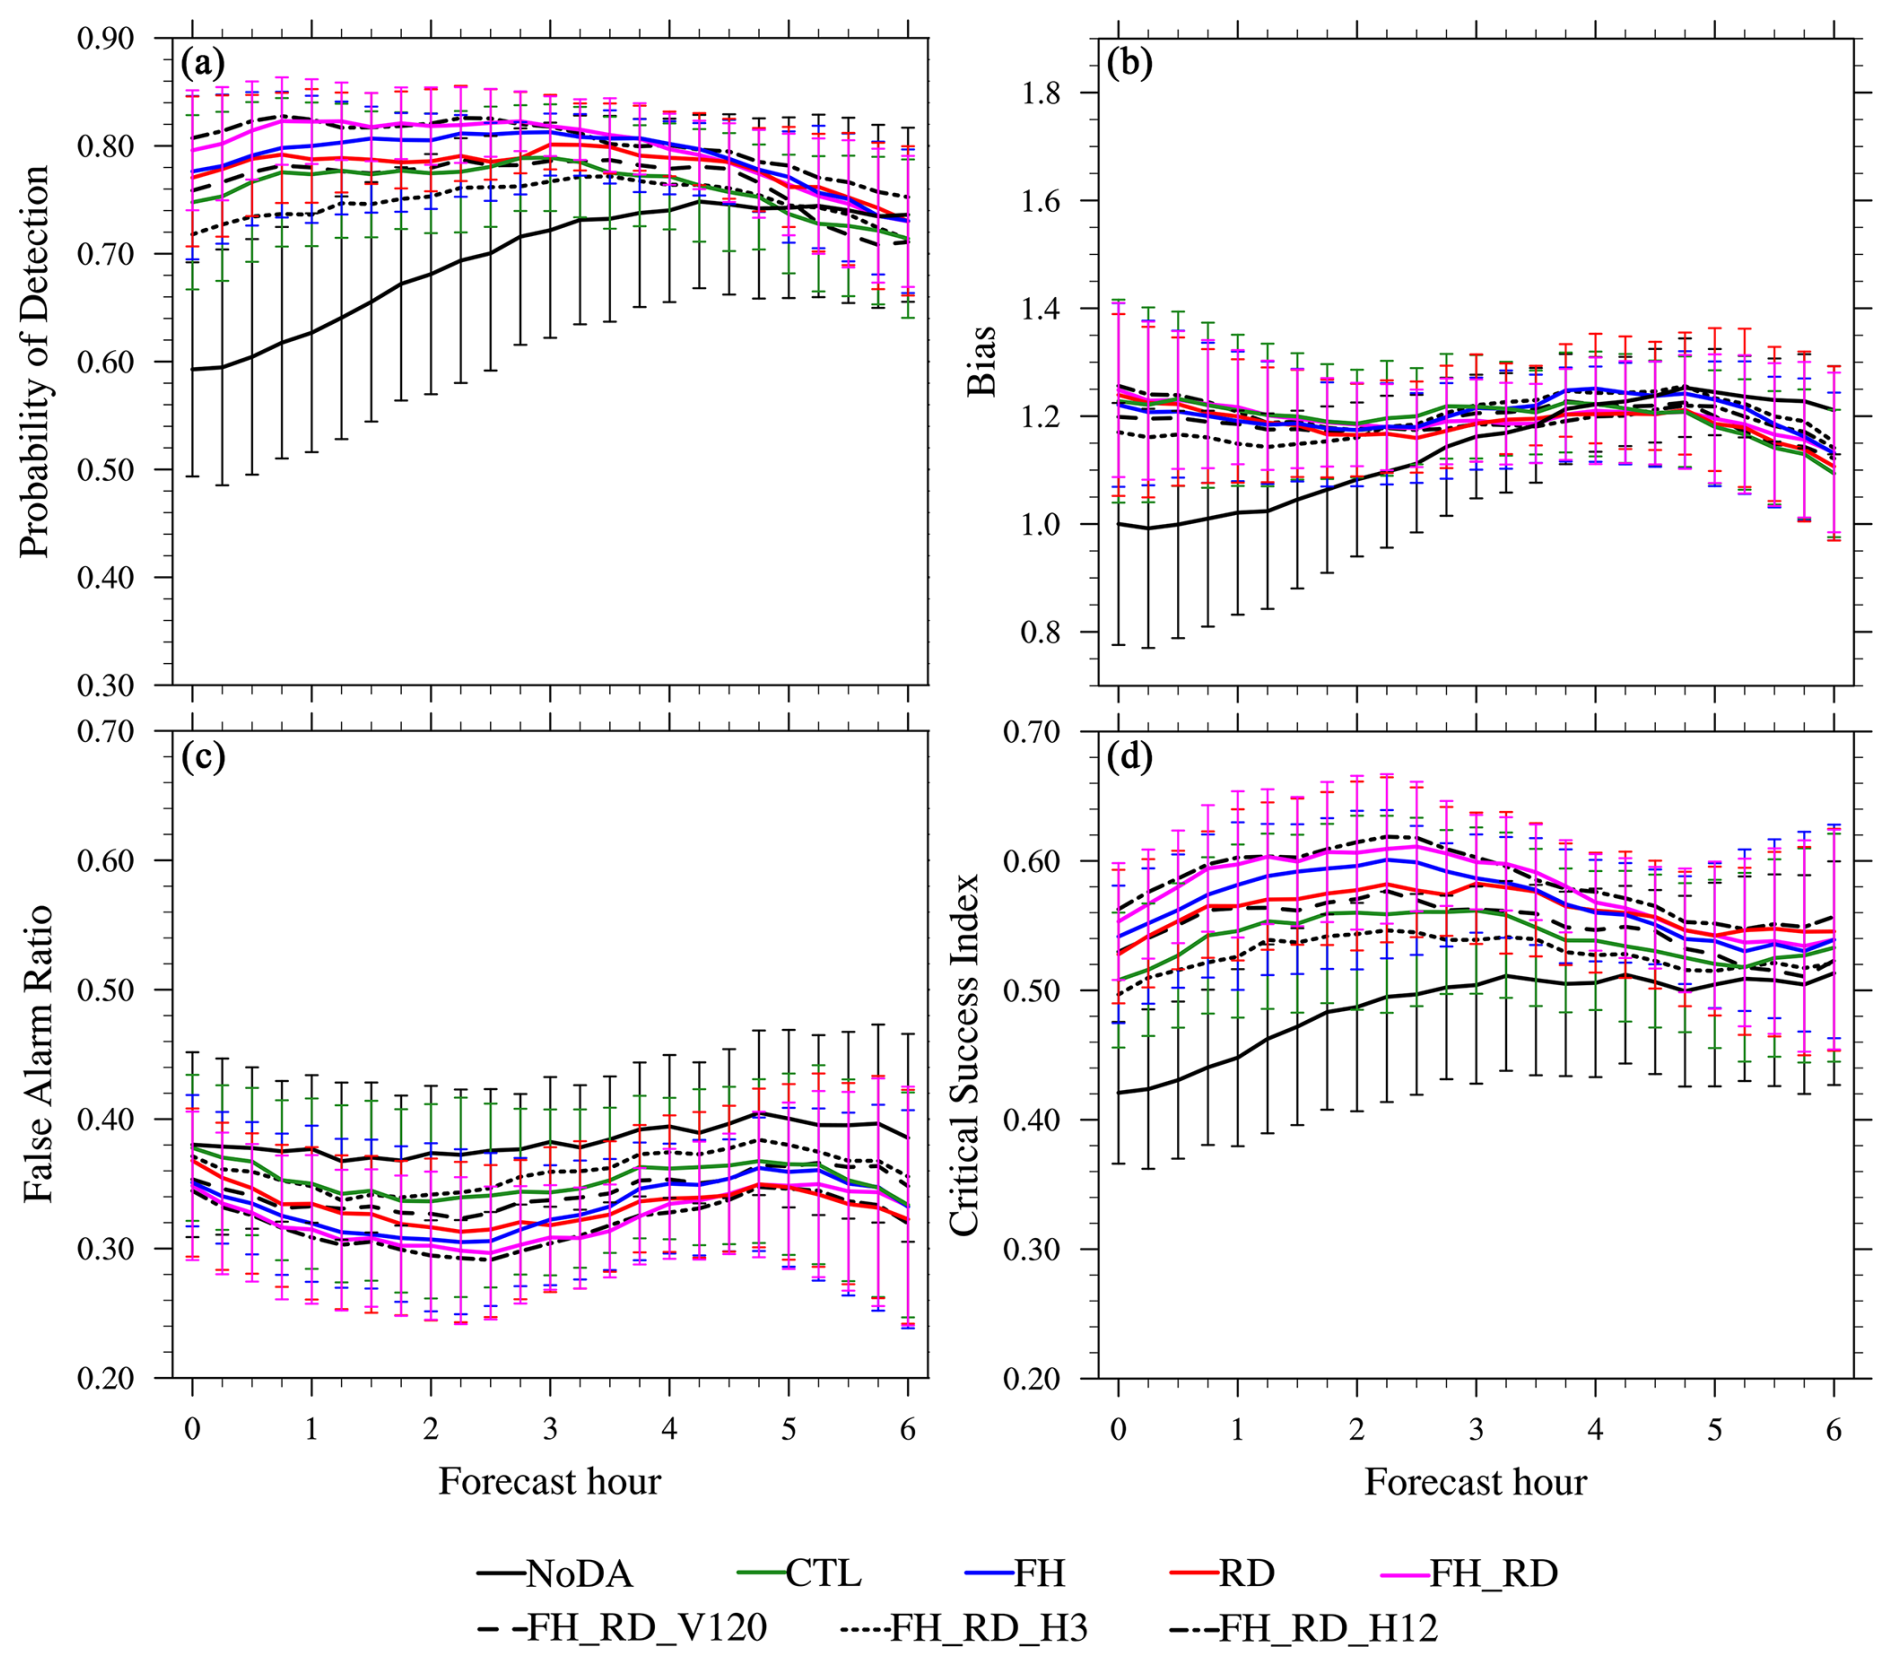
Figure 17Time series of (a) probability of detection (POD), (b) bias, (c) false alarm ratio (FAR), and (d) critical success index (CSI) for CREF forecasts aggregated from each initialization hour from the sixth hour to the end of the DA cycles across three cases (28 June and 12 and 21 July 2023) at the threshold of 20 dBZ for the NoDA (solid black), CTL (solid green), FH (solid blue), RD (solid red), FH_RD (solid magenta), FH_RD_V120 (dashed black), FH_RD_H3 (dotted black), and FH_RD_H12 (dot-dash black) experiments. Results are shown for a neighborhood radius of 12 km. Error bars for NoDA, CTL, FH, RD, and FH_RD experiments represent a 95 % confidence interval.
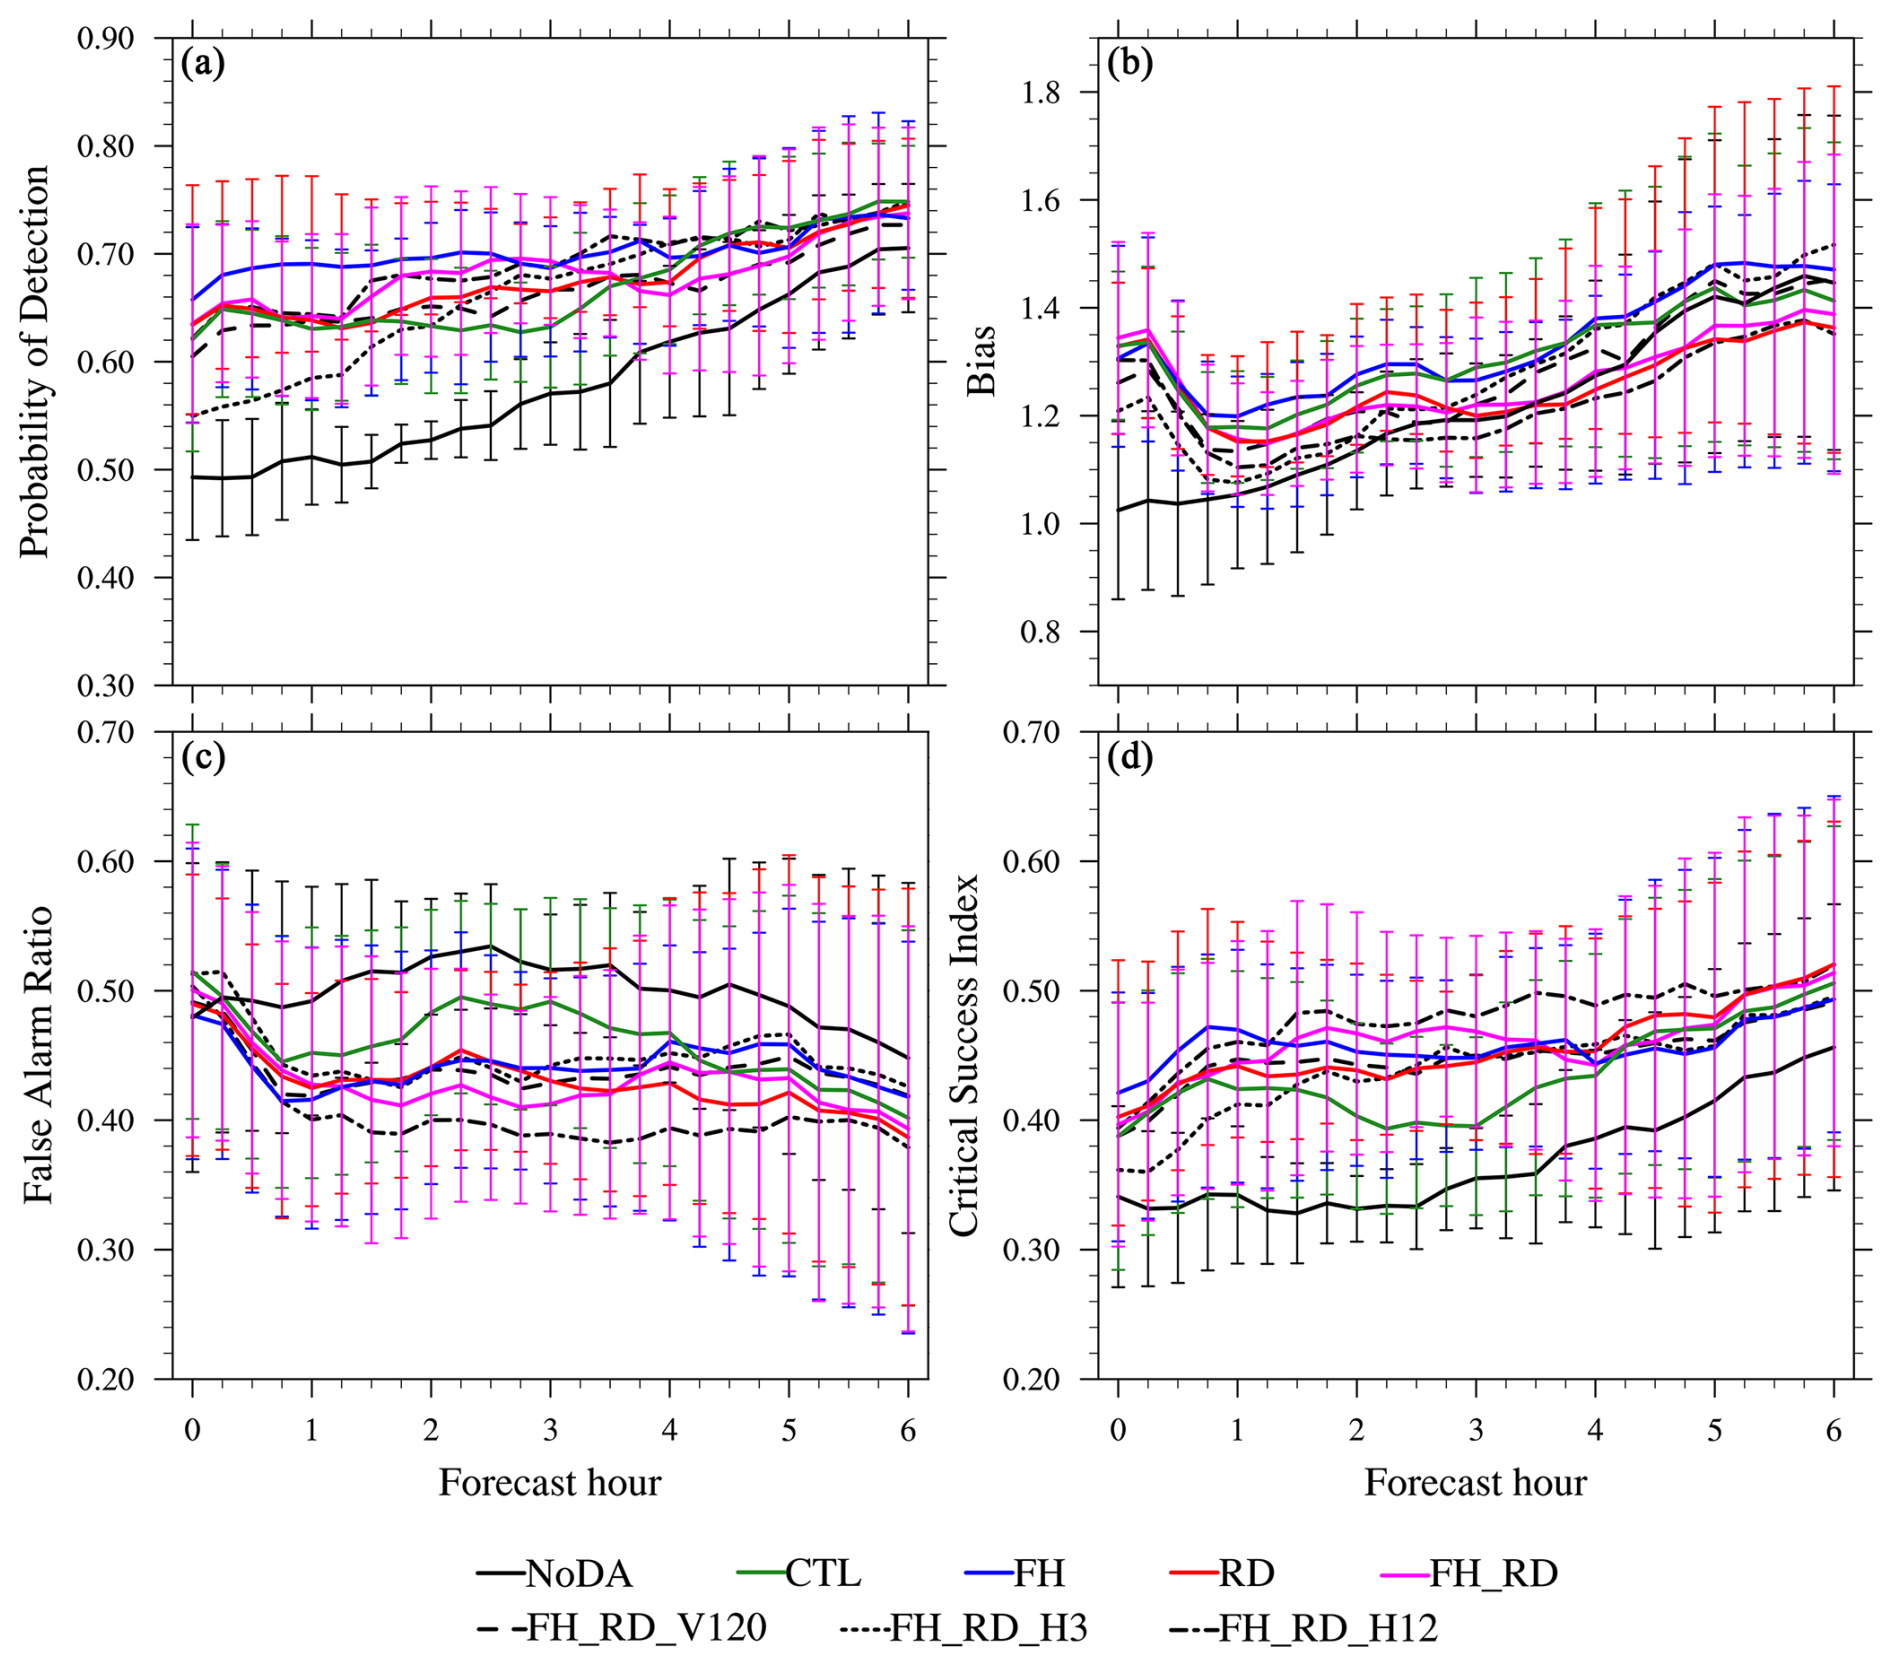
Similar to the 20 dBZ reflectivity forecast, RWP DA experiments outperform NoDA at 40 dBZ, although only the POD result in the first 3 h is statistically significant at the 95 % confidence level. All DA experiments exhibit an overprediction bias (1.1–1.5) throughout the 0–6 h forecasts (Fig. 18b). Notably, FH shows the highest bias. However, FH also exhibits the highest POD in the first 2 h and highest CSI and lowest FAR in the first hour. Subsequently, FH_RD and RD perform better, with FH_RD slightly outperforming RD in 1–3 h forecasts and RD performing better in 4–6 h. Some possible reasons that FH outperforms RD for shorter forecast lengths but RD outperforms FH for longer forecast lengths are as follows:
- a.
For southwest-type rainfall events, the southwesterly wind propagates from upstream ridge stations to downstream foothill sites (Li et al., 2024).
- b.
The dynamic forcing of terrain has a delayed effect on triggering and intensifying storms, leading to improved forecasts for later-occurring storms.
- c.
Assimilating wind observations at foothills, capturing local southwesterly flow characteristics, enhances forecasts of initial moisture lifting and convection triggering.
During the first 45 min, strong overprediction leads to high FARs, which quickly decline as the forecast progresses (Fig. 18a and c). This contributes to an increase in CSI (Fig. 18d). A possible reason is that the model requires time (several minutes to 1 h) to digest and adjust to assimilated wind information. The impact of vertical resolution and detection height on 40 dBZ reflectivity forecasts is consistent with the results observed at the 20 dBZ threshold.
Consistent with the 20 dBZ reflectivity forecast, FH_RD and FH_RD_H12 consistently achieve the best performance across all score metrics in HPRCP forecasts, followed by RD and FH (Figs. 19 and 20). Although the improvements are not statistically significant at the 95 % confidence level, FH_RD and FH_RD_H12 exhibit added forecast skill over the NoDA experiment. In contrast, CTL and FH_RD_H3 show smaller improvement across all metrics. At the 10 mm threshold, FH produces higher forecast scores than the others in the first hour, while FH_RD and RD show superiority in 2–4 and 4–6 h, respectively (Fig. 20).
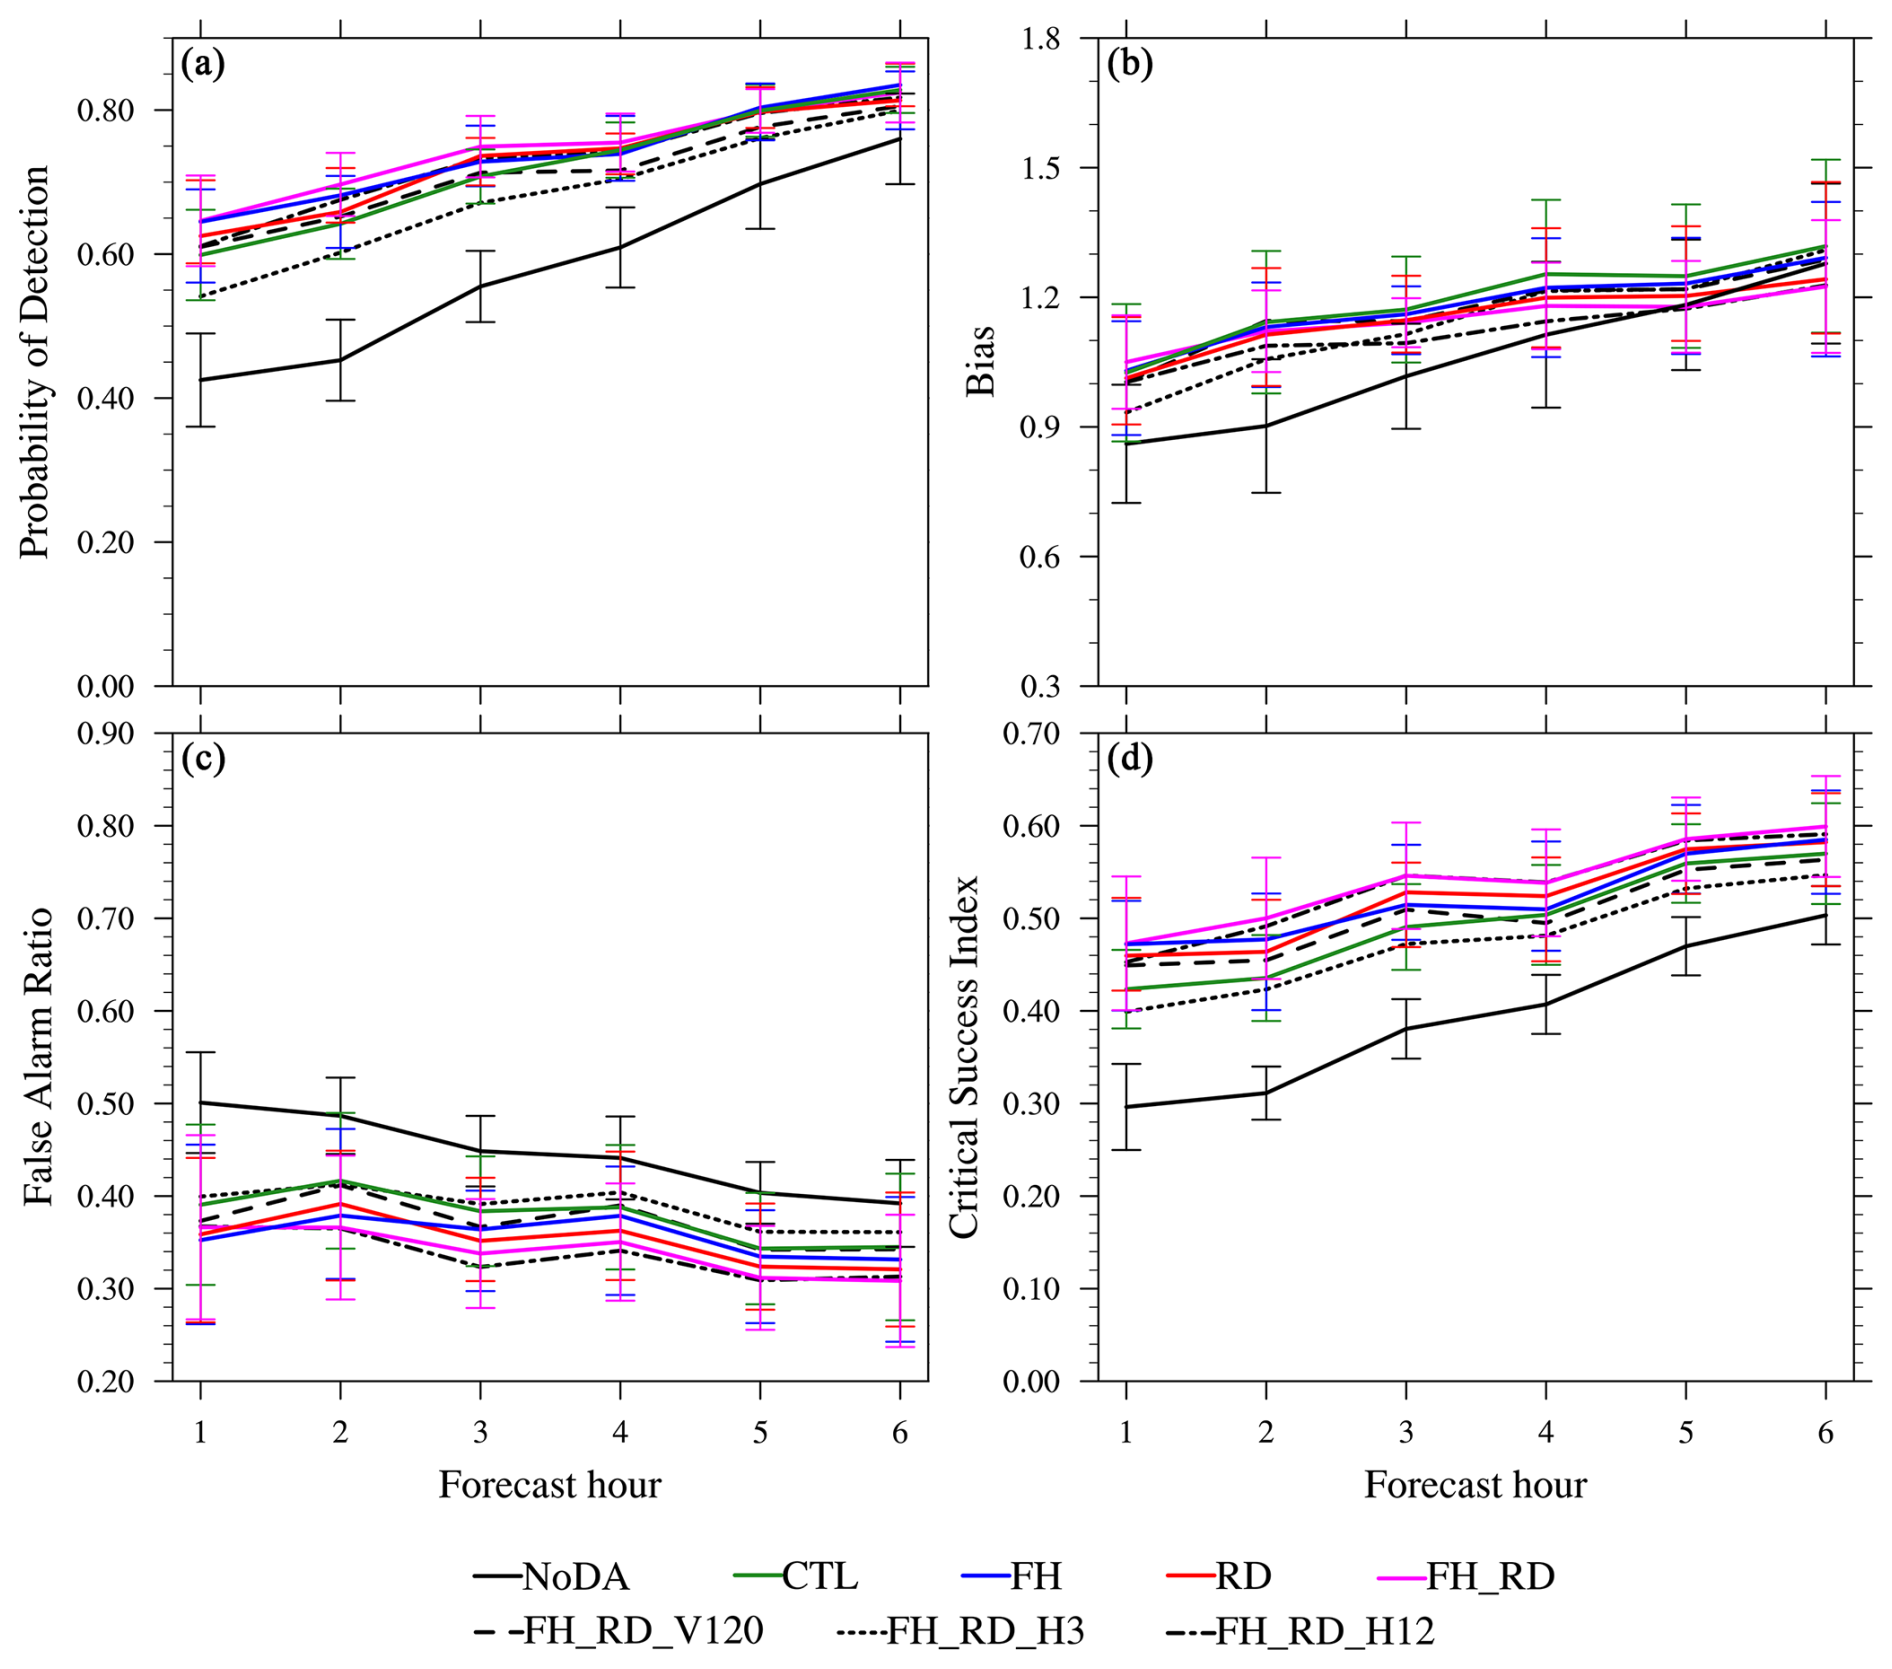
Figure 19Same as in Fig. 17 but for 1–6 h HPRCP forecasts aggregated from three cases at the thresholds of 2.5 mm.
In this research, observing system simulation experiments are performed to study the benefits of assimilating RWP observations for convective-scale short-term heavy rainfall forecasts. Synthetic RWP observations are assimilated into the WRF model using the NSSL3DVAR DA system for three SW-type heavy rainfall events that occurred over the Beijing–Tianjin–Hebei region. To investigate the impact of RWP data observed from multiple networks on convective-scale short-term forecasts, the background run (NoDA), which does not assimilate any observations, and four types of DA experiments are carried out. A baseline experiment (CTL), which assimilates RWPs from the operational network alone, is first performed and serves as a benchmark for comparison with subsequent DA experiments. The FH and RD experiments assimilate simulated RWP observations from the foothill and ridge networks of the Taihang Mountains in addition to the operational network. The FH_RD experiment is conducted by assimilating combined RWP data from the operational, foothill, and ridge sites. Comparison of analyses and forecasts from these four types of experiments reveals improvements in model initial conditions and short-term severe weather forecasts by assimilating simulated RWP observations, as well as the added value of RWPs from the foothill and ridge networks over operational network data. Furthermore, three sensitivity DA experiments (FH_RD_V120, FH_RD_H3, and FH_RD_H12) are carried out to test the impact of vertical resolution and maximum detection heights. The purpose of these experiments is to investigate a potential optimal configuration for the vertical data availability of real-time RWPs to be assimilated in future convective-scale NWP. For each DA experiment, the analysis is cycled for 9 h at 15 min intervals, with a 6 h free forecast initiated every hour starting from the sixth hour of the analysis cycles. First of all, both subjective and objective verifications of the analysis and forecast were performed in detail for the 21 July 2023 case. Then statistical metrics, including neighborhood-based POD, FAR, BIAS, and CSI of reflectivity and precipitation forecasts, were aggregated from each initialization hour across the three cases. The main results are summarized as follows:
-
Comparison of wind analyses and forecasts among the CTL, FH, RD, and FH_RD experiments reveals that the FH_RD experiment yields the smallest wind errors, in terms of both the overall domain average and the vertical profile of RMSEs for wind components. Then, it is followed by RD, then FH, with CTL exhibiting the largest wind errors. A qualitative evaluation of the model's initial mesoscale dynamics indicates that the assimilation of RWP data successfully corrects the wind direction and speed biases in Beijing and its surrounding areas, enhancing the southwesterly jet. Moreover, both RD and FH_RD (with the assimilation of RWP data from the ridge network) remarkably reduce large wind errors in the upstream of Beijing along the mountains, which is crucial for CI in the vicinity of the boundary between Hebei and southwestern Beijing.
-
For the 21 July 2023 event, qualitative verification focused on the convective system initiated southwest of Beijing, which intensified after merging with storms from western Hebei, forming a prominent southwest–northeast-oriented system across Beijing. The NoDA experiment initially underestimates convection in Beijing and Hebei but overpredicts storm coverage and intensity in later forecasts, generating excessive spurious convection. All RWP DA experiments enhance CI timing and location by capturing mesoscale flow features, subsequently reducing storm displacement and intensity errors. Nevertheless, the CTL experiment underestimates storm intensity, while FH still retains some spurious echoes in forecasts. Overall, the FH_RD experiment demonstrates significant superiority in areal coverage, storm mode, and orientation compared to the other DA experiments. The accumulated precipitation forecasts show similar trends to the reflectivity results regarding rainfall location, onset time, and amount. The forecast statistics indicate that FH_RD achieves the best performance in reflectivity and precipitation forecasts at lower thresholds (i.e., 20 and 30 dBZ for CREF and 2.5 mm for HPRCP), whereas the RD experiment slightly surpasses FH_RD at the 50 dBZ and 10 mm thresholds. The lower performance of FH_RD and FH at higher thresholds may be linked to slight displacement errors in heavy precipitation forecasts, impacting their POD and ETS scores.
-
Quantitative verification results aggregated across the three SW-type heavy rainfall cases in the Beijing–Tianjin–Hebei region confirm that FH_RD exhibits the best performance in reflectivity and precipitation forecasts, followed by RD and FH, while CTL shows minimal improvement. An exception is that at higher thresholds, FH achieves the best scores in the first 1 or 2 h despite stronger overprediction, while FH_RD and RD are superior in subsequent hours. This is potentially attributed to the delayed effect of dynamic forcing from the terrain, as well as improvements in capturing the initial southwesterly flow and local convection by assimilating wind observations at the foothills. In addition, the results from sensitivity experiments on vertical resolution and maximum detection height indicate that FH_RD_H12 exhibits comparable or slightly better performance compared to FH_RD, benefiting from its higher detection height. Conversely, the FH_RD_H3 experiment, with the lowest detection height, has the poorest forecast skills among all DA experiments, while FH_RD_V120 generally falls between FH_RD_H12 and FH_RD_H3.
The results consistently demonstrate that the FH_RD experiment, combining data from ridge, foothill, and operational wind profiler networks, delivers the most accurate short-term forecasts. Specifically, the assimilation of RWP data from the ridge network significantly reduces wind errors in complex terrain, such as the Taihang Mountains upstream of Beijing. These regions are critical for convective initiation in Beijing and its surroundings. The findings highlight the essential role of integrating both ridge and foothill data in improving overall reflectivity and precipitation forecasts over the Beijing–Tianjin–Hebei region. Sensitivity experiments on vertical resolution and detection height further emphasize the importance of high vertical resolution and maximization of the detection height in optimizing the RWP network for enhanced forecast accuracy.
The insights gained from this OSSE study on the impacts of RWP observations on heavy rainfall forecasting will inform the design of optimal RWP networks over the Beijing–Tianjin–Hebei region. This preliminary study lays the groundwork for further research to fully understand the complexities of precipitation forecasting related to data assimilation. The current investigation focused on three SW-type heavy rainfall cases occurring in summer over the Beijing–Tianjin–Hebei region, utilizing model-simulated states and observational networks. As the same modeling system is used for the truth run and forecast system, it does not account for model-related errors that occur in real-world applications. Consequently, the results might overestimate the actual benefits of RWP assimilation in operational systems. Furthermore, this study focuses exclusively on assimilating RWP data, without incorporating conventional observations or satellite data. While this approach simplifies the analysis by isolating the impact of RWPs, it may inflate their relative importance. Future research directions include the following: (1) expanding the study to other precipitation types and high-impact convective events under diverse weather scenarios, (2) evaluating the impact of RWP networks by assimilating RWPs together with more diverse observation types and incorporating non-identical twin setups to enhance realism and provide broader operational insights, and (3) investigating the benefits of assimilating real observational data on convective-scale NWP once proposed RWP networks become available. Moreover, future studies can address the limitations of static background errors in 3DVAR by incorporating flow-dependent background error covariances estimated from ensemble forecasts. As ensemble-based background error covariances can dynamically adapt to the evolving state of the atmosphere, the DA system will better represent the spatial and temporal variability of background errors, particularly in regions with complex topography or mesoscale features like convective systems. By leveraging flow-dependent background errors, the analysis can more accurately capture the initial atmospheric state, ultimately leading to more accurate precipitation predictions.
The ERA5 reanalysis and GFS forecast data are accessible from ECMWF (https://www.ecmwf.int/en/forecasts/datasets/reanalysis-datasets/era5/, Hersbach et al., 2020) and National Centers for Environmental Prediction, National Weather Service, NOAA, US Department of Commerce (https://doi.org/10.5065/D65D8PWK, National Centers for Environmental Prediction et al., 2015), respectively. The source code for WRF model version 3.7.1 and the input ERA5 and GFS data used in this study have been archived on Zenodo at https://doi.org/10.5281/zenodo.14321805 (Zhao, 2024a). The namelist files for WRF and the assimilation system used in this study are accessible online (https://doi.org/10.5281/zenodo.14241597, Zhao, 2024b).
JZ and JG conceptualized the study. JZ executed the experiments, analyzed the results, and wrote the paper. JG supervised the project, provided critical feedback during the experiment implementation stage, and revised the paper. XZ assisted in the analysis and visualizations.
The contact author has declared that none of the authors has any competing interests.
Publisher's note: Copernicus Publications remains neutral with regard to jurisdictional claims made in the text, published maps, institutional affiliations, or any other geographical representation in this paper. While Copernicus Publications makes every effort to include appropriate place names, the final responsibility lies with the authors.
Jidong Gao kindly provided an internal review, which led to significant improvement of the manuscript. ChatGPT (GPT-4; OpenAI's large-scale language-generation model) was used to improve the writing style of an earlier draft of this article.
This research has been supported by the National Natural Science Foundation of China (grant nos. U2142209, 42325501, and 42375018) and the China Meteorological Administration Training Centre Key Research Program (2023CMATCZDIAN08).
This paper was edited by Guoqing Ge and reviewed by two anonymous referees.
Amante, C. and Eakins, B. W.: ETOPO1 arc-minute global relief model: procedures, data sources and analysis, http://www.ngdc.noaa.gov/mgg/global/relief/ETOPO1/data/bedrock/cell_registered/netcdf/ (last access: August 2024), 2009.
Benjamin, S. G., Grell, G. A., Brown, J. M., Smirnova, T. G., and Bleck, R.: Mesoscale Weather Prediction with the RUC Hybrid Isentropic–Terrain-Following Coordinate Model, Mon. Weather Rev., 132, 473–494, https://doi.org/10.1175/1520-0493(2004)132<0473:MWPWTR>2.0.CO;2, 2004a.
Benjamin, S. G., Schwartz, B. E., Szoke, E. J., and Koch, S. E.: The Value of Wind Profiler Data in U.S. Weather Forecasting, B. Am. Meteorol. Soc., 85, 1871–1886, https://doi.org/10.1175/BAMS-85-12-1871, 2004b.
Bouttier, F.: The use of profiler data at ECMWF, Meteorol. Z., 10, 497–510, https://doi.org/10.1127/0941-2948/2001/0010-0497, 2001.
Bucci, L. R., Majumdar, S. J., Atlas, R., Emmitt, G. D., and Greco, S.: Understanding the response of tropical cyclone structure to the assimilation of synthetic wind profiles, Mon. Weather Rev., 149, 2031–2047, https://doi.org/10.1175/MWR-D-20-0153.1, 2021.
Clark, A. J., Gallus, W. A., and Weisman, M. L.: Neighborhood-Based Verification of Precipitation Forecasts from Convection-Allowing NCAR WRF Model Simulations and the Operational NAM, Weather Forecast., 25, 1495–1509, https://doi.org/10.1175/2010WAF2222404.1, 2010.
Dudhia, J.: Numerical Study of Convection Observed during the Winter Monsoon Experiment Using a Mesoscale Two-Dimensional Model, J. Atmos. Sci., 46, 3077–3107, https://doi.org/10.1175/1520-0469(1989)046<3077:NSOCOD>2.0.CO;2, 1989.
Dunn, L.: An Example of Subjective Interpretation of Network Profiler Data in Real-Time Forecasting, Weather Forecast., 1, 219–225, https://doi.org/10.1175/1520-0434(1986)001<0219:AEOSIO>2.0.CO;2, 1986.
Fierro, A. O., Wang, Y., Gao, J., and Mansell, E. R.: Variational Assimilation of Radar Data and GLM Lightning-Derived Water Vapor for the Short-Term Forecasts of High-Impact Convective Events, Mon. Weather Rev., 147, 4045–4069, https://doi.org/10.1175/MWR-D-18-0421.1, 2019.
Gao, J. and Stensrud, D. J.: Assimilation of Reflectivity Data in a Convective-Scale, Cycled 3DVAR Framework with Hydrometeor Classification, J. Atmos. Sci., 69, 1054–1065, https://doi.org/10.1175/JAS-D-11-0162.1, 2012.
Gao, J. and Stensrud, D. J.: Some Observing System Simulation Experiments with a Hybrid 3DEnVAR System for Storm-Scale Radar Data Assimilation, Mon. Weather Rev., 142, 3326–3346, https://doi.org/10.1175/MWR-D-14-00025.1, 2014.
Gao, J., Xue, M., Brewster, K., and Droegemeier, K. K.: A Three-Dimensional Variational Data Analysis Method with Recursive Filter for Doppler Radars, J. Atmos. Ocean. Tech., 21, 457–469, https://doi.org/10.1175/1520-0426(2004)021<0457:ATVDAM>2.0.CO;2, 2004.
Gao, J., Smith, T. M., Stensrud, D. J., Fu, C., Calhoun, K., Manross, K. L., Brogden, J., Lakshmanan, V., Wang, Y., Thomas, K. W., Brewster, K., and Xue, M.: A Real-Time Weather-Adaptive 3DVAR Analysis System for Severe Weather Detections and Warnings, Weather Forecast., 28, 727–745, https://doi.org/10.1175/WAF-D-12-00093.1, 2013.
Gao, J., Fu, C., Stensrud, D. J., and Kain, J. S.: OSSEs for an Ensemble 3DVAR Data Assimilation System with Radar Observations of Convective Storms, J. Atmos. Sci., 73, 2403–2426, https://doi.org/10.1175/JAS-D-15-0311.1, 2016.
Gao, J., Heinselman, L. P., Xue, M., Wicker, L. J., Yussouf, N., Stensrud, D. J., and Droegemeier, K. K.: The Numerical Prediction of Severe Convective Storms: Advances in Research and Applications, Remaining Challenges, and Outlook for the Future, in: Encyclopedia of Atmospheric Sciences, Elsevier, https://doi.org/10.1016/B978-0-323-96026-7.00127-2, 2024.
Ge, G., Gao, J., and Xue, M.: Diagnostic Pressure Equation as a Weak Constraint in a Storm-Scale Three-Dimensional Variational Radar Data Assimilation System, J. Atmos. Ocean. Tech., 29, 1075–1092, https://doi.org/10.1175/JTECH-D-11-00201.1, 2012.
Guo, X., Guo, J., Zhang, D., and Yun, Y.: Vertical divergence profiles as detected by two wind-profiler mesonets over East China: Implications for nowcasting convective storms, Q. J. Roy. Meteorol. Soc., 149, 1629–1649, https://doi.org/10.1002/qj.4474, 2023.
Heinselman, P. L., Burke, P. C., Wicker, L. J., Clark, A. J., Kain, J. S., Gao, J., Yussouf, N., Jones, T. A., Skinner, P. S., Potvin, C. K., Wilson, K. A., Gallo, B. T., Flora, M. L., Martin, J., Creager, G., Knopfmeier, K. H., Wang, Y., Matilla, B. C., Dowell, D. C., Mansell, E. R., Roberts, B., Hoogewind, K. A., Stratman, D. R., Guerra, J., Reinhart, A. E., Kerr, C. A., and Miller, W.: Warn-on-Forecast System: From Vision to Reality, Weather Forecast., 39, 75–95, https://doi.org/10.1175/WAF-D-23-0147.1, 2024.
Hersbach, H., Bell, B., Berrisford, P., Hirahara, S., Horányi, A., Muñoz-Sabater, J., Nicolas, J., Peubey, C., Radu, R., Schepers, D., Simmons, A., Soci, C., Abdalla, S., Abellan, X., Balsamo, G., Bechtold, P., Biavati, G., Bidlot, J., Bonavita, M., De Chiara, G., Dahlgren, P., Dee, D., Diamantakis, M., Dragani, R., Flemming, J., Forbes, R., Fuentes, M., Geer, A., Haimberger, L., Healy, S., Hogan, R. J., Hólm, E., Janisková, M., Keeley, S., Laloyaux, P., Lopez, P., Lupu, C., Radnoti, G., De Rosnay, P., Rozum, I., Vamborg, F., Villaume, S., and Thépaut, J.: The ERA5 global reanalysis, Q. J. Roy. Meteorol. Soc., 146, 1999–2049, https://doi.org/10.1002/qj.3803, 2020.
Hoffman, R. N. and Atlas, R.: Future Observing System Simulation Experiments, B. Am. Meteorol. Soc., 97, 1601–1616, https://doi.org/10.1175/BAMS-D-15-00200.1, 2016.
Hoffmann, L., Günther, G., Li, D., Stein, O., Wu, X., Griessbach, S., Heng, Y., Konopka, P., Müller, R., Vogel, B., and Wright, J. S.: From ERA-Interim to ERA5: the considerable impact of ECMWF's next-generation reanalysis on Lagrangian transport simulations, Atmos. Chem. Phys., 19, 3097–3124, https://doi.org/10.5194/acp-19-3097-2019, 2019.
Hong, S.-Y., Noh, Y., and Dudhia, J.: A New Vertical Diffusion Package with an Explicit Treatment of Entrainment Processes, Mon. Weather Rev., 134, 2318–2341, https://doi.org/10.1175/MWR3199.1, 2006.
Hu, H., Sun, J., and Zhang, Q.: Assessing the Impact of Surface and Wind Profiler Data on Fog Forecasting Using WRF 3DVAR: An OSSE Study on a Dense Fog Event over North China, J. Appl. Meteorol. Clim., 56, 1059–1081, https://doi.org/10.1175/JAMC-D-16-0246.1, 2017.
Hu, J., Fierro, A. O., Wang, Y., Gao, J., and Mansell, E. R.: Exploring the Assimilation of GLM-Derived Water Vapor Mass in a Cycled 3DVAR Framework for the Short-Term Forecasts of High-Impact Convective Events, Mon. Weather Rev., 148, 1005–1028, https://doi.org/10.1175/MWR-D-19-0198.1, 2020.
Hu, J., Gao, J., Wang, Y., Pan, S., Fierro, A. O., Skinner, P. S., Knopfmeier, K., Mansell, E. R., and Heinselman, P. L.: Evaluation of an experimental Warn-on-Forecast 3DVAR analysis and forecast system on quasi-real-time short-term forecasts of high-impact weather events, Q. J. Roy. Meteorol. Soc., 147, 4063–4082, https://doi.org/10.1002/qj.4168, 2021.
Huang, Y., Wang, X., Kerr, C., Mahre, A., Yu, T.-Y., and Bodine, D.: Impact of Assimilating Future Clear-Air Radial Velocity Observations from Phased-Array Radar on a Supercell Thunderstorm Forecast: An Observing System Simulation Experiment Study, Mon. Weather Rev., 148, 3825–3845, https://doi.org/10.1175/MWR-D-19-0391.1, 2020.
Huang, Y., Wang, X., Mahre, A., Yu, T.-Y., and Bodine, D.: Impacts of assimilating future clear-air radial velocity observations from phased array radar on convection initiation forecasts: An observing system simulation experiment study, Mon. Weather Rev., 150, 1563–1583, https://doi.org/10.1175/MWR-D-21-0199.1, 2022.
Huo, Z., Liu, Y., Shi, Y., Chen, B., Fan, H., and Li, Y.: An Investigation on Joint Data Assimilation of a Radar Network and Ground-Based Profiling Platforms for Forecasting Convective Storms, Mon. Weather Rev., 151, 2049–2064, https://doi.org/10.1175/MWR-D-22-0332.1, 2023.
Ishihara, M., Kato, Y., Abo, T., Kobayashi, K., and Izumikawa, Y.: Characteristics and Performance of the Operational Wind Profiler Network of the Japan Meteorological Agency, J. Meteorol. Soc. Jpn., 84, 1085–1096, https://doi.org/10.2151/jmsj.84.1085, 2006.
Jones, T. A., Wang, X., Skinner, P., Johnson, A., and Wang, Y.: Assimilation of GOES-13 Imager Clear-Sky Water Vapor (6.5 µm) Radiances into a Warn-on-Forecast System, Mon. Weather Rev. 146, 1077–1107, https://doi.org/10.1175/MWR-D-17-0280.1, 2018.
Li, N., Guo, J., Wu, M., Zhang, F., Guo, X., Sun, Y., Zhang, Z., Liang, H., and Chen, T.: Low-Level Jet and Its Effect on the Onset of Summertime Nocturnal Rainfall in Beijing, Geophys. Res. Lett., 51, e2024GL110840, https://doi.org/10.1029/2024GL110840, 2024.
Liu, B., Guo, J., Gong, W., Shi, L., Zhang, Y., and Ma, Y.: Characteristics and performance of wind profiles as observed by the radar wind profiler network of China, Atmos. Meas. Tech., 13, 4589–4600, https://doi.org/10.5194/amt-13-4589-2020, 2020.
Liu, D., Huang, C., and Feng, J.: Influence of Assimilating Wind Profiling Radar Observations in Distinct Dynamic Instability Regions on the Analysis and Forecast of an Extreme Rainstorm Event in Southern China, Remote Sens., 14, 3478, https://doi.org/10.3390/rs14143478, 2022.
Liu, S., Zheng, Y., and Tao, Z.: The analysis of the relationship between pulse of LLJ and heavy rain using wind profiler data, J. Trop. Meteorol., 9, 158–163, 2003.
Mallick, S. and Jones, T. A.: Assimilation of GOES-16 satellite derived winds into the warn-on-forecast system, Atmos. Res., 245, 105131, https://doi.org/10.1016/j.atmosres.2020.105131, 2020.
Mansell, E. R. and Ziegler, C. L.: Aerosol Effects on Simulated Storm Electrification and Precipitation in a Two-Moment Bulk Microphysics Model, J. Atmos. Sci., 70, 2032–2050, https://doi.org/10.1175/JAS-D-12-0264.1, 2013.
Mansell, E. R., Ziegler, C. L., and Bruning, E. C.: Simulated Electrification of a Small Thunderstorm with Two-Moment Bulk Microphysics, J. Atmos. Sci., 67, 171–194, https://doi.org/10.1175/2009JAS2965.1, 2010.
Mlawer, E. J., Taubman, S. J., Brown, P. D., Iacono, M. J., and Clough, S. A.: Radiative transfer for inhomogeneous atmospheres: RRTM, a validated correlated-k model for the longwave, J. Geophys. Res., 102, 16663–16682, https://doi.org/10.1029/97JD00237, 1997.
National Centers for Environmental Prediction, National Weather Service, NOAA, and US Department of Commerce: NCEP GFS 0.25 Degree Global Forecast Grids Historical Archive, Research Data Archive at the National Center for Atmospheric Research, Computational and Information Systems Laboratory [data set], https://doi.org/10.5065/D65D8PWK, 2015.
Pan, S., Gao, J., Stensrud, D. J., Wang, X., and Jones, T. A.: Assimilation of Radar Radial Velocity and Reflectivity, Satellite Cloud Water Path, and Total Precipitable Water for Convective-Scale NWP in OSSEs, J. Atmos. Ocean. Tech., 35, 67–89, https://doi.org/10.1175/JTECH-D-17-0081.1, 2018.
Pan, S., Gao, J., Jones, T. A., Wang, Y., Wang, X., and Li, J.: The Impact of Assimilating Satellite-Derived Layered Precipitable Water, Cloud Water Path, and Radar Data on Short-Range Thunderstorm Forecasts, Mon. Weather Rev., 149, 1359–1380, https://doi.org/10.1175/MWR-D-20-0040.1, 2021.
Purser, R. J., Wu, W.-S., Parrish, D. F., and Roberts, N. M.: Numerical Aspects of the Application of Recursive Filters to Variational Statistical Analysis. Part I: Spatially Homogeneous and Isotropic Gaussian Covariances, Mon. Weather Rev., 131, 1524–1535, https://doi.org/10.1175//1520-0493(2003)131<1524:NAOTAO>2.0.CO;2, 2003a.
Purser, R. J., Wu, W. S., Parrish, D. F., and Roberts, N. M.: Numerical Aspects of the Application of Recursive Filters to Variational Statistical Analysis. Part II: Spatially Inhomogeneous and Anisotropic General Covariances, Mon. Weather Rev., 131, 1536–1548, 2003b.
Sheng, J., Zheng, Y., and Shen, X.: Climatology and environmental conditions of two types of quasi-linear convective systems with extremely intense weather in North China, Acta Meteorol. Sin., 78, 877–898, 2020.
Skamarock, W., Klemp, J., Dudhia, J., Gill, D., Barker, D., Wang, W., Huang, X.-Y., and Duda, M.: A Description of the Advanced Research WRF Version 3, UCAR/NCAR, https://doi.org/10.5065/D68S4MVH, 2008.
St-James, J. S. and Laroche, S.: Assimilation of Wind Profiler Data in the Canadian Meteorological Centre's Analysis Systems, J. Atmos. Ocean. Tech., 22, 1181–1194, https://doi.org/10.1175/JTECH1765.1, 2005.
Wang, C., Chen, Y., Chen, M., and Shen, J.: Data assimilation of a dense wind profiler network and its impact on convective forecasting, Atmos. Res., 238, 104880, https://doi.org/10.1016/j.atmosres.2020.104880, 2020.
Wang, C., Chen, M., and Chen, Y.: Impact of Combined Assimilation of Wind Profiler and Doppler Radar Data on a Convective-Scale Cycling Forecasting System, Mon. Weather Rev., 150, 431–450, https://doi.org/10.1175/MWR-D-20-0383.1, 2022.
Wang, C., Chen, Y., Chen, M., and Huang, X.-Y.: Evaluation of two observation operator schemes for wind profiler radar data assimilation and its impacts on short-term forecasting, Atmos. Res., 283, 106549, https://doi.org/10.1016/j.atmosres.2022.106549, 2023a.
Wang, S., Guo, J., Xian, T., Li, N., Meng, D., Li, H., and Cheng, W.: Investigation of low-level supergeostrophic wind and Ekman spiral as observed by a radar wind profiler in Beijing, Front. Environ. Sci., 11, 1195750, https://doi.org/10.3389/fenvs.2023.1195750, 2023b.
Wang, Y., Gao, J., Skinner, P. S., Knopfmeier, K., Jones, T., Creager, G., Heiselman, P. L., and Wicker, L. J.: Test of a Weather-Adaptive Dual-Resolution Hybrid Warn-on-Forecast Analysis and Forecast System for Several Severe Weather Events, Weather Forecast., 34, 1807–1827, https://doi.org/10.1175/WAF-D-19-0071.1, 2019.
Zhang, L. and Pu, Z.: An Observing System Simulation Experiment (OSSE) to Assess the Impact of Doppler Wind Lidar (DWL) Measurements on the Numerical Simulation of a Tropical Cyclone, Adv. Meteorol., 2010, 743863, https://doi.org/10.1155/2010/743863, 2010.
Zhang, X., Luo, Y., Wan, Q., Ding, W., and Sun, J.: Impact of Assimilating Wind Profiling Radar Observations on Convection-Permitting Quantitative Precipitation Forecasts during SCMREX, Weather Forecast., 31, 1271–1292, https://doi.org/10.1175/WAF-D-15-0156.1, 2016.
Zhang, Y., Chen, M., and Zhong, J.: A Quality Control Method for Wind Profiler Observations toward Assimilation Applications, J. Atmos. Ocean. Tech., 34, 1591–1606, https://doi.org/10.1175/JTECH-D-16-0161.1, 2017.
Zhao, J.: WRF model and the input ERA5 reanalysis and GFS forecast data, Zenodo [data set], https://doi.org/10.5281/zenodo.14321805, 2024a.
Zhao, J.: Namelist files for WRF and the assimialtion system, Zenodo [code], https://doi.org/10.5281/zenodo.14241597, 2024b.
Zhao, J., Gao, J., Jones, T. A., and Hu, J.: Impact of Assimilating High-Resolution Atmospheric Motion Vectors on Convective Scale Short-Term Forecasts: 1. Observing System Simulation Experiment (OSSE), J. Adv. Model. Earth Syst., 13, e2021MS002484, https://doi.org/10.1029/2021MS002484, 2021a.
Zhao, J., Gao, J., Jones, T. A., and Hu, J.: Impact of Assimilating High-Resolution Atmospheric Motion Vectors on Convective Scale Short-Term Forecasts: 2. Assimilation Experiments of GOES-16 Satellite Derived Winds, J. Adv. Model. Earth Syst., 13, e2021MS002486, https://doi.org/10.1029/2021MS002486, 2021b.
Zhao, J., Gao, J., Jones, T., and Hu, J.: Impact of Assimilating High-Resolution Atmospheric Motion Vectors on Convective Scale Short-Term Forecasts: 3. Experiments With Radar Reflectivity and Radial Velocity, J. Adv. Model. Earth Syst., 14, e2022MS003246, https://doi.org/10.1029/2022MS003246, 2022.
Zhao, N., Yue, T., Li, H., Zhang, L., Yin, X., and Liu, Y.: Spatio-temporal changes in precipitation over Beijing–Tianjin–Hebei region, China, Atmos. Res., 202, 156–168, https://doi.org/10.1016/j.atmosres.2017.11.029, 2018.
Zhong, S., Fast, J. D., and Bian, X.: A Case Study of the Great Plains Low-Level Jet Using Wind Profiler Network Data and a High-Resolution Mesoscale Model, Mon. Weather Rev., 124, 785–806, https://doi.org/10.1175/1520-0493(1996)124<0785:ACSOTG>2.0.CO;2, 1996.
Zhou, S., Yang, J., Wang, W., Gong, D., Shi, P., and Gao, M.: Shift of daily rainfall peaks over the Beijing–Tianjin–Hebei region: An indication of pollutant effects?, Int. J. Climatol., 38, 5010–5019, https://doi.org/10.1002/joc.5700, 2018.
Zhuang, Z., Yussouf, N., and Gao, J.: Analyses and forecasts of a tornadic supercell outbreak using a 3DVAR system ensemble, Adv. Atmos. Sci., 33, 544–558, https://doi.org/10.1007/s00376-015-5072-0, 2016.
Ziegler, C. L.: Retrieval of Thermal and Microphysical Variables in Observed Convective Storms. Part 1: Model Development and Preliminary Testing, J. Atmos. Sci., 42, 1487–1509, https://doi.org/10.1175/1520-0469(1985)042<1487:ROTAMV>2.0.CO;2, 1985.