the Creative Commons Attribution 4.0 License.
the Creative Commons Attribution 4.0 License.
 | 23 Jun 2025
Implementing deep soil and dynamic root uptake in Noah-MP (v4.5): impact on Amazon dry-season transpiration
Carolina A. Bieri
Francina Dominguez
Gonzalo Miguez-Macho
Ying Fan
Plant roots act as critical pathways of moisture from the subsurface to the atmosphere. Deep moisture uptake by plant roots can provide a seasonal buffer mechanism in regions with a well-defined dry season, such as the southern Amazon. Here, mature forests maintain transpiration (a critical source of atmospheric moisture in this part of the world) during drier months. Most existing state-of-the-art Earth system models do not have the necessary features to simulate subsurface-to-atmosphere moisture variations during dry-downs. These features include groundwater dynamics, a sufficiently deep soil column, dynamic root water uptake (RWU), and a fine model spatial resolution (<5 km).
To address this, we present DynaRoot, a dynamic root water uptake scheme implemented in the Noah-Multiparameterization (Noah-MP) land surface model, a widely used model for studying kilometer-scale regional land surface processes. Our modifications include the implementation of DynaRoot, eight additional resolved soil layers reaching a depth of 20 mm, and soil properties that vary with depth. DynaRoot is computationally efficient and ideal for regional- or continental-scale climate simulations. We perform four 20-year uncoupled Noah-MP experiments for a region in the southern Amazon basin. Each experiment incrementally adds physical complexity. The experiments include the default Noah-MP with free drainage (FD), a case with an activated groundwater scheme that resolves water table variations (GW), a case with eight added soil layers and soil properties that vary with depth (SOIL), and a case with DynaRoot activated (ROOT).
Our results show that DynaRoot allows mature forests in upland regions to avoid water stress during dry periods by taking up moisture from the deep vadose zone (where antecedent precipitation still drains downward). Conversely, RWU in valleys can access moisture from groundwater (while remaining constrained by the water table). Temporally, we capture a seasonal shift in RWU from shallower layers in wetter months to deeper soil layers in drier months, particularly over regions with dominant evergreen broadleaf (forest) vegetation. Compared to the control case, there is a domain-averaged increase in transpiration of about 29 % during dry months in the ROOT experiment. Critically, the ROOT experiment performs best in simulating the temporal evolution of dry-season transpiration using an observation-based ET (evapotranspiration) product as the reference. Future work will explore the effect of the DynaRoot uptake scheme on atmospheric variables in a coupled modeling framework.
- Article
(9907 KB) - Full-text XML
- BibTeX
- EndNote


The Amazon region of South America is a critical terrestrial source of atmospheric moisture. Evapotranspiration (ET) from the Amazon basin, defined as the combination of transpiration and evaporation from canopy and ground surfaces, has been estimated to be about 1100 mm yr−1 (Baker et al., 2021). Wei et al. (2017) found the ratio of transpiration to ET (excluding evaporation from canopy interception) to be highest in the Amazon compared to any other region in the world at around 85 %. ET is particularly important for Amazonian hydroclimate as the proportion of precipitation that originates from local ET – known as the recycling ratio – is estimated to be between 25 % and 40 % (Dominguez et al., 2022). During drier months (approximately June through September), the southern Amazon is a net source of moisture as evaporation exceeds precipitation (Zemp et al., 2014). Given the importance of Amazon ET for the water budget of the region, accurate representation of processes which influence ET in numerical models is critical. More generally, the Earth system modeling community has expressed the need for an improved representation of soil hydrology, groundwater variations, and root water uptake (RWU) in global models (Kleidon and Heimann, 2000; Feddes et al., 2001; Pitman, 2003; Fan et al., 2017; Kendon et al., 2021).
During dry months, Amazonian canopies maintain greenness (Saleska et al., 2007) and avoid water stress, resulting in the maintenance of dry-season ET (Nepstad et al., 1994; Kim et al., 2012; Morton et al., 2014). Previous studies suggest that this is due to several possible mechanisms: nighttime transfer of water from dry to moist areas by roots (known as hydraulic redistribution; Oliveira et al., 2005b), deep RWU (Nepstad et al., 1994), and groundwater capillary rise (Markewitz et al., 2010). The importance of a particular mechanism could depend on location (Christoffersen et al., 2014), or multiple mechanisms could operate in synergy (Baker et al., 2009). In this work, we focus on deep RWU given the plentiful evidence for its importance in areas with seasonal dryness (Nepstad et al., 1994; Jipp et al., 1998; von Randow et al., 2004; Davidson et al., 2011; Ivanov et al., 2012; Broedel et al., 2017; Fan et al., 2017; Smith and Boers, 2023).
Deep moisture uptake by roots can be thought of as a “buffer” during seasonally dry periods, allowing vegetation to access deep vadose zone moisture when surface moisture from precipitation is not sufficient (Nepstad et al., 1994; Jipp et al., 1998; Baker et al., 2009). Smith and Boers (2023) posited that deep-rooted vegetation is more resilient during dry periods. Miguez-Macho and Fan (2021) found that 18 % of global annual transpiration originates as deeper soil and rock moisture; in August, this percentage was estimated to be 60 %–90 % in the southern Amazon. Soil moisture observations collected by Bruno et al. (2006) in an Amazonian forest reflected withdrawal of soil moisture up to 10 m below the surface. Broedel et al. (2017) collected soil moisture observations from the central Amazon and found root uptake below 4.8 m during a year that was exceptionally dry. In a modeling study of an artificial throughfall exclusion experiment at Tapajós National Forest in northern Brazil (Nepstad, 2002; Nepstad et al., 2007; Davidson et al., 2011), Markewitz et al. (2010) noted that, while the percentage of RWU occurring at depths of between 5.5 and 11.5 m was relatively small (10 %), model results suggest that it was critical to survival. Thus, while the actual amount of deep RWU may be small compared to uptake from shallower depths, it can have an outsized effect on the vitality of vegetation.
As outlined in Fan et al. (2017) and Miguez-Macho and Fan (2021), topography influences both root access to deep moisture and the source of this moisture. In very low areas with waterlogging, roots do not grow deep to avoid oxygen stress. A synthesis of more than 2000 root observations by Fan et al. (2017) supports this. Moisture flowing downgradient from higher elevations supports valley vegetation via remote recharge; critically, this source accounts for up to 47 % of dry-month RWU (Miguez-Macho and Fan, 2021). In upland regions where the water table is very deep, roots become decoupled from it but rely on moisture from previous precipitation (which infiltrates slowly downward) in the deep vadose zone. It is in mid-slope and upland areas that we expect roots to tap into deep moisture during dry months. The influence of drainage gradient on the RWU source is further explored in Miguez-Macho and Fan (2021).
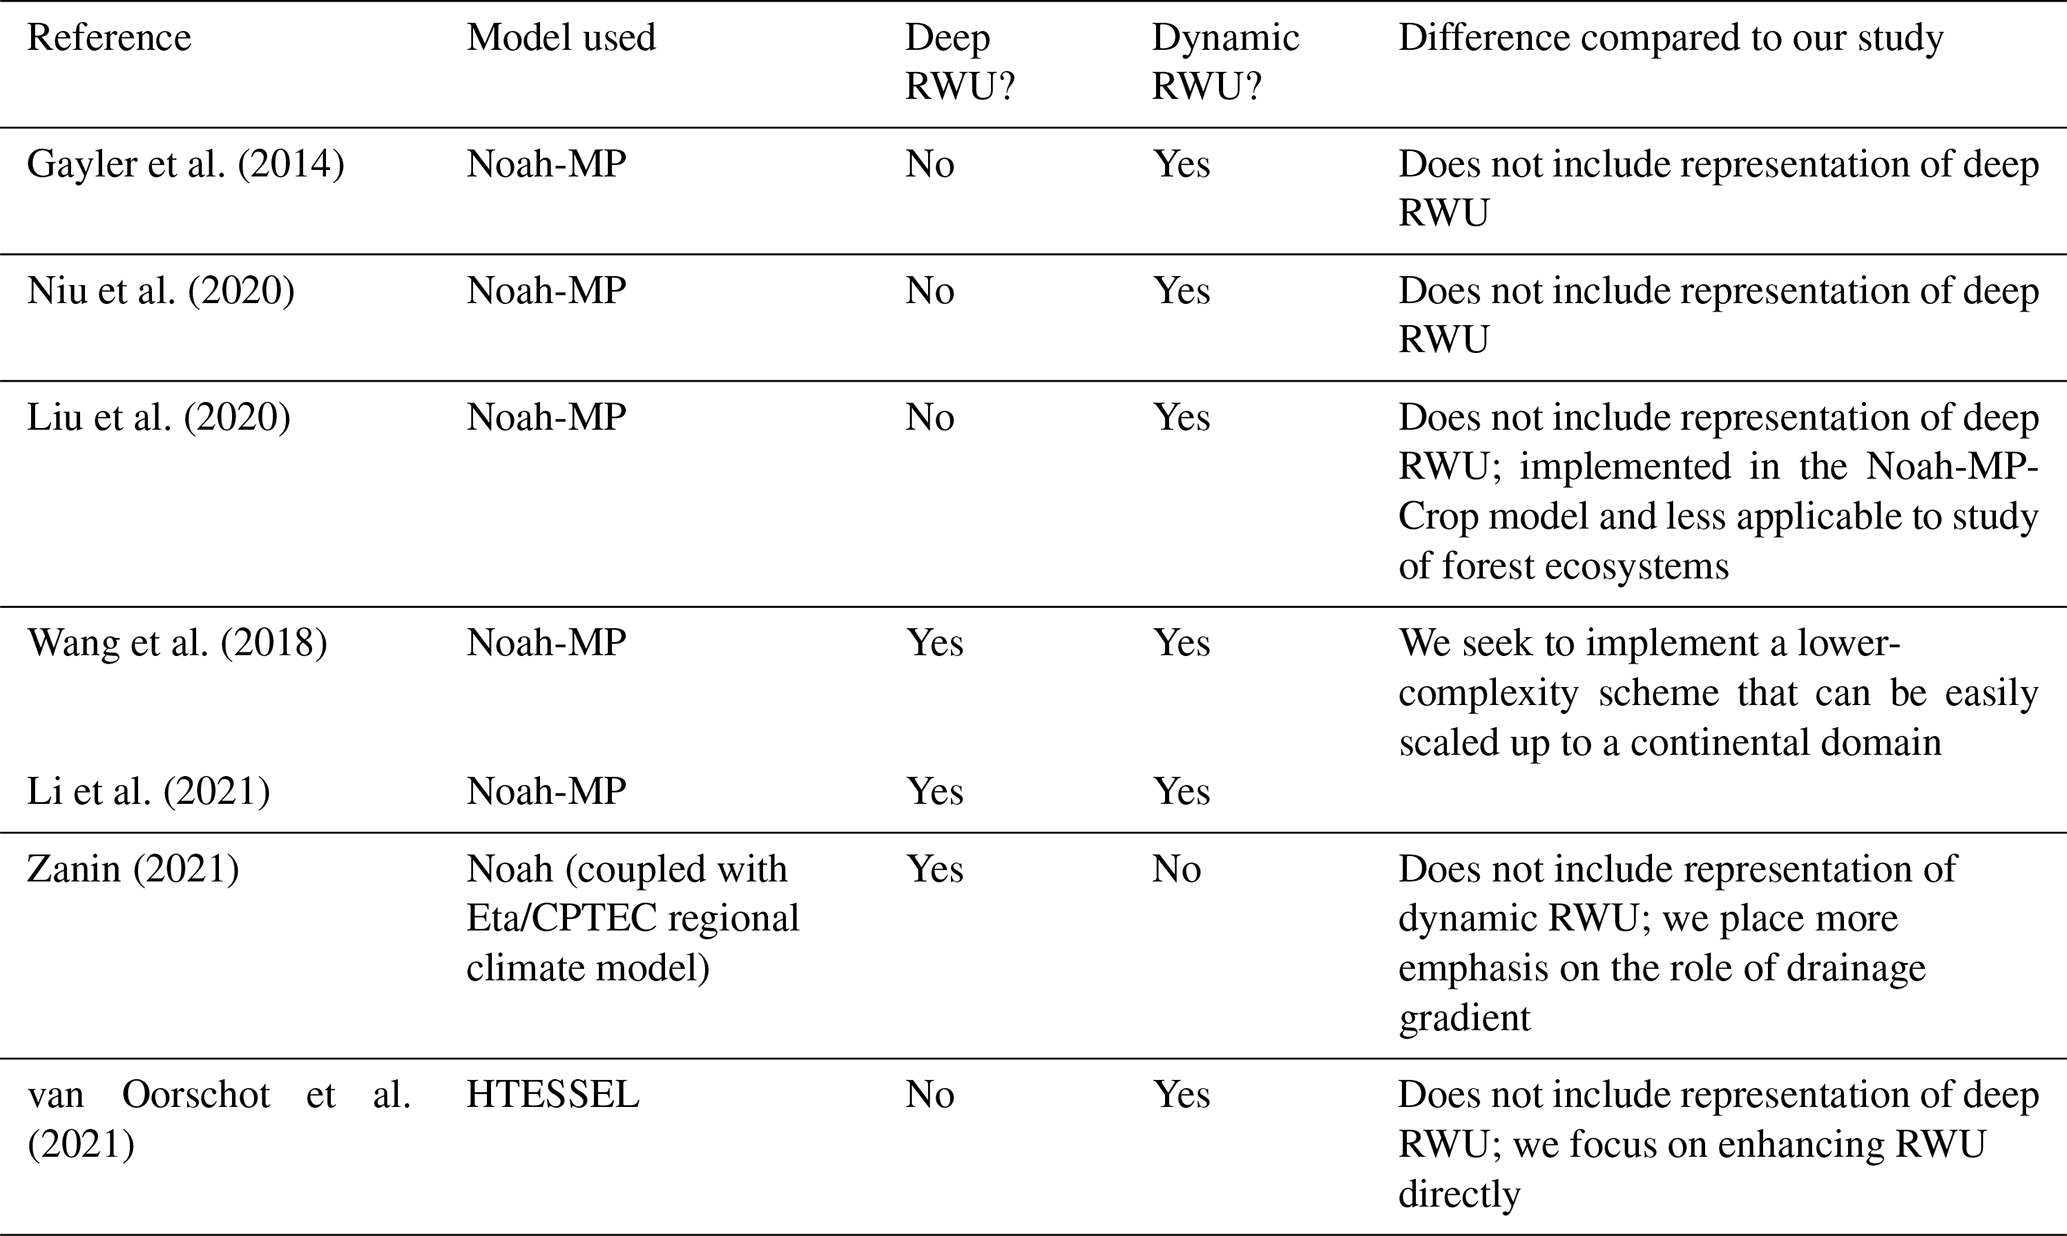
Most state-of-the-art Earth system models do not currently include an integrated representation of groundwater, deep resolved soil layers, and dynamic RWU. Table 1 summarizes the existing representation of fine-scale groundwater variations and deep, dynamic RWU in regional land models. Moreover, we consider whether these models can be coupled to a convection-permitting atmospheric model (CPM) since an adequate representation of convective precipitation is highly relevant to the hydrological cycle in many parts of the world, including the Amazon (Rehbein et al., 2018). All of the models in Table 1 – with the exception of Noah-MP (Noah-Multiparameterization) and ISAM – were employed in the Coupled Model Intercomparison Project Phase 6 (CMIP6; Eyring et al., 2016). To our knowledge, six of the nine models listed in Table 1 include some representation of deep or dynamic RWU in their official releases, but most do not include both. Only three models (CLM, JSBACH, and GFDL LM) include sufficiently deep resolved soil layers to model deep roots in the Amazon. We consider hydrologically active layers extending to 5 m or below to be sufficient based on observations (Restom and Nepstad, 2004; Bruno et al., 2006; Davidson et al., 2011; Fan et al., 2017; Broedel et al., 2017). We consider dynamic RWU to be uptake that varies with time and/or moisture content. Four of the nine models include a groundwater scheme that simulates a lower boundary below the soil column in the form of an aquifer (as opposed to free-draining conditions). One model includes all of the features considered in Table 1, namely the Community Land Model (CLM) of the Community Earth System Model (CESM; Lawrence et al., 2019). We note that representation of deep, dynamic RWU has been included in model versions that have not been distributed publicly and/or included in an official release. We do not consider such contributions in Table 1 and instead provide a summary of these efforts in Table 2.
Niu et al. (2011)He et al. (2023)Jain et al. (2009)Song et al. (2013)Song et al. (2016)Lin (2022)Lin et al. (2023)Lawrence et al. (2019)Kennedy et al. (2019)Oleson et al. (2013)Bisht et al. (2018)Drewniak (2019)Caldwell et al. (2021)Golaz et al. (2022)Qiu et al. (2024)Reick et al. (2021)Schneck et al. (2022)Bao et al. (2024)Balsamo et al. (2011)ECMWF (2023)Krinner et al. (2005)Verbeeck et al. (2011)Guimberteau et al. (2014)Naudts et al. (2015)Yao et al. (2022)Shahi et al. (2022)Joetzjer et al. (2022)Best et al. (2011)Batelis et al. (2020)Jucker et al. (2020)Wiltshire et al. (2020)Milly et al. (2014)Shevliakova et al. (2024)Milly et al. (2014)Shevliakova et al. (2024)Cusack et al. (2024)Table 1Summary of representation of deep, dynamic RWU; groundwater (GW) dynamics; and capability of CPM coupling in existing land surface models. We consider deep RWU to be RWU that occurs at 5 m or below. We consider dynamic RWU to be RWU that changes with time and/or moisture content.
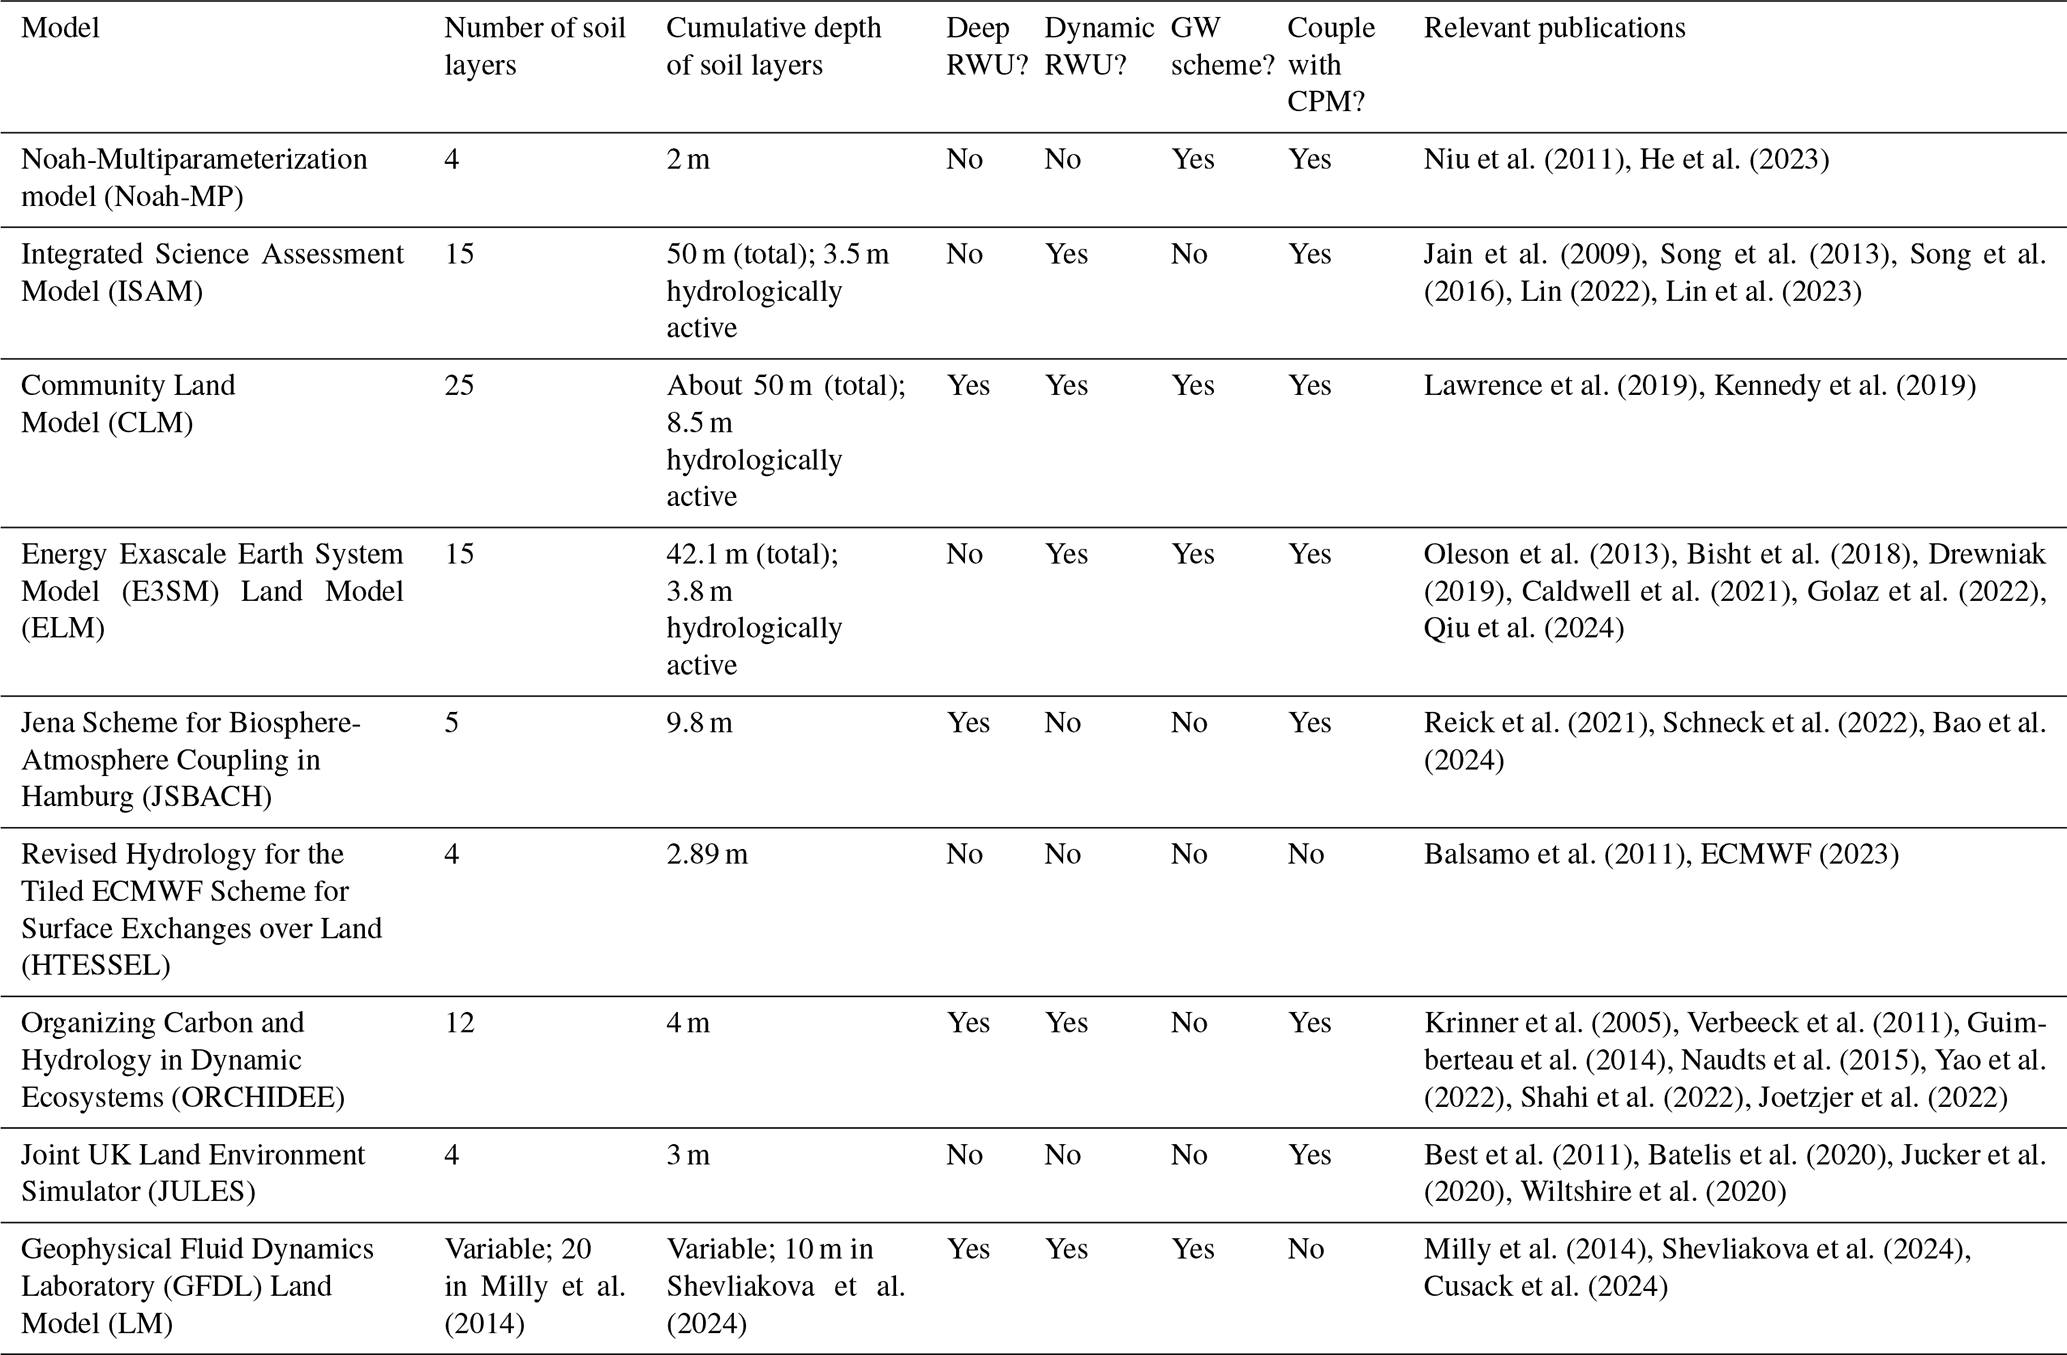
Table 2Summary of existing representations of deep, dynamic RWU in land surface models and how they compare with our approach.
Water table depth variations are best simulated using a fine spatial scale (<5 km) to adequately resolve small-scale topographical features that determine local drainage networks (Fan et al., 2013; Barlage et al., 2021). Advances in groundwater parameterizations – such as the scheme designed and validated in Fan et al. (2007) and Miguez-Macho et al. (2007) – have made it possible to model these fine-scale features. Inclusion of the Miguez-Macho et al. (2007) groundwater scheme (designated as the Miguez-Macho and Fan or MMF scheme for the remainder of this publication) in a model used to simulate regional climate has made it possible to discern links between subsurface moisture variations and land surface fluxes that influence atmospheric heat and moisture budgets, as well as precipitation (Martinez et al., 2016a, b; Barlage et al., 2021).
From Table 1, we see that most existing regional climate models do not offer sufficient capabilities to fully resolve the soil–root–atmosphere moisture pathway, neglecting a vital source of moisture for phreatophytic vegetation and potentially introducing biases with regard to soil moisture, land–atmosphere fluxes, and near-surface atmospheric variables. From Table 2, we see that representations of deep, dynamic RWU that do exist involve more complexity than needed for our purposes or do not include both deep and dynamic RWU. To address the need for more representative deep vadose zone hydrology, including RWU, we introduce a modified version of Noah-MP that incorporates three major enhancements: (1) DynaRoot, a RWU scheme described in Fan et al. (2017) that can be seamlessly coupled to deep vadose zone moisture variations and that is computationally efficient; (2) an increase in the number of resolved soil layers from 4 to 12, with an accordant increase in cumulative depth from 2 to 20 m; and (3) an updated definition of soil properties, which vary with depth based on exponential decay functions without additional input data from the user. Modifications 2 and 3 are necessary for the implementation of DynaRoot.
We implement DynaRoot in the Noah-Multiparameterization model or Noah-MP (Niu et al., 2011). We select Noah-MP for this work since it is commonly used as a land surface parameterization for the Weather Research and Forecasting (WRF) model (Skamarock et al., 2019), a widely used numerical weather model ideal for resolving fine spatial scales. Although we focus on uncoupled Noah-MP simulations in this study, in the future, we will evaluate the impact of deep RWU on atmospheric variables in a coupled land–atmosphere framework. The WRF model is ideal for simulating the atmosphere at spatial scales that can resolve atmospheric convection. Moreover, we can capture fine-scale variations in water table depth at these smaller scales, allowing us to simulate the important connection between RWU and groundwater variations. The fact that the MMF scheme is already implemented in Noah-MP further supports our decision to implement DynaRoot in this model (Barlage et al., 2015; Martinez et al., 2016a, b). Finally, we focus our efforts on Noah-MP because it is one of the three models listed in Table 1 that currently includes no representation of deep or dynamic RWU in its official release. Yet, the Noah-MP–WRF framework is frequently employed in studies of regional climate (Barlage et al., 2015; Martinez et al., 2016a, b; Spera et al., 2018; Fersch et al., 2020; Schwitalla et al., 2020; Barlage et al., 2021; Dominguez et al., 2024).
To focus our work and to demonstrate the functionality of our Noah-MP modifications, we test four hypotheses:
-
H1. Access to moisture from groundwater is critical for valley vegetation.
-
H2. Deep vadose zone moisture is critical for upland vegetation.
-
H3. Dynamic root uptake, according to the soil water profile, is most important during dry months and sustains transpiration.
-
H4. Dynamic root uptake is more prevalent and more strongly influences transpiration for mature forests, which exhibit deeper uptake profiles compared to non-forested areas.
This research is an important step toward more physically realistic simulations of the biophysical link between the subsurface and atmospheric branches of the hydrologic cycle in the model. Critically, this framework can be used for spatial scales that are most relevant for land–atmosphere fluxes. These developments can be valuable contributions to the larger Noah-MP and land surface modeling community and will allow others to more effectively explore scientific questions regarding the role of vegetation in regional hydroclimate.
2.1 Description of default Noah-MP
In this study, we use the High-Resolution Land Data Assimilation System (HRLDAS) Noah-MP version 4.5 (https://github.com/NCAR/hrldas/tree/release-v4.5-WRF, last access: 20 July 2024; Chen et al., 2007), which is consistent with version 4.5 of the WRF (https://github.com/wrf-model/WRF/tree/release-v4.5, last access: 20 July 2024; Skamarock et al., 2019). We use the model in its default state as the control configuration in the suite of simulations described in Sect. 2.3.
A common method of Noah-MP initialization is to provide a file generated by the WRF Preprocessing System (WPS; https://github.com/wrf-model/WPS, last access: 31 January 2024). Model input files from the WPS provide initial values for variables such as soil moisture, soil temperature, and equilibrium water table depth and also define static variables such as vegetation type and dominant soil texture for the domain. There are several vegetation datasets available in the WPS; we use the default 21-class Moderate Resolution Imaging Spectroradiometer (MODIS) land use dataset in all simulations. Outside of the United States, dominant soil texture data in the WPS are sourced from the Food and Agriculture Organization (FAO) Soil Map of the World (FAO/UNESCO, 1971).
The default Noah-MP includes four resolved soil layers which extend to 2 m depth. There are several options for determining soil properties in the model. In our control configuration, we employ the default option in which soil properties are determined by the dominant soil texture at a given grid cell and do not vary with depth. Soil moisture at saturation, saturated hydraulic conductivity, saturated hydraulic diffusivity, soil moisture at wilting point, and saturated soil matric potential, among other soil properties, are defined in a lookup table. In the default Noah-MP, root depth for a given grid point is also specified via a lookup table and is based on the dominant vegetation type at that point. The root depth determines the soil layers from which moisture for transpiration is extracted via RWU. It does not change with time or moisture content.
In Noah-MP, RWU for a given soil layer j is calculated as
where T is transpiration at a given grid cell, and
depending on the option for the calculation of βj (known as the soil moisture stress factor) set by the user (Niu et al., 2011). Several options are available, including Noah-type, CLM-type, and SSiB-type formulations. θj(ψj) is soil moisture (soil matric potential) for layer j, is the wilting-point soil moisture (wilting-point soil matric potential), is the saturated soil matric potential, and is the reference soil moisture. See Niu et al. (2011) for further details on the formulation of βj in Noah-MP.
2.2 Description of modified Noah-MP
2.2.1 Additional soil layers
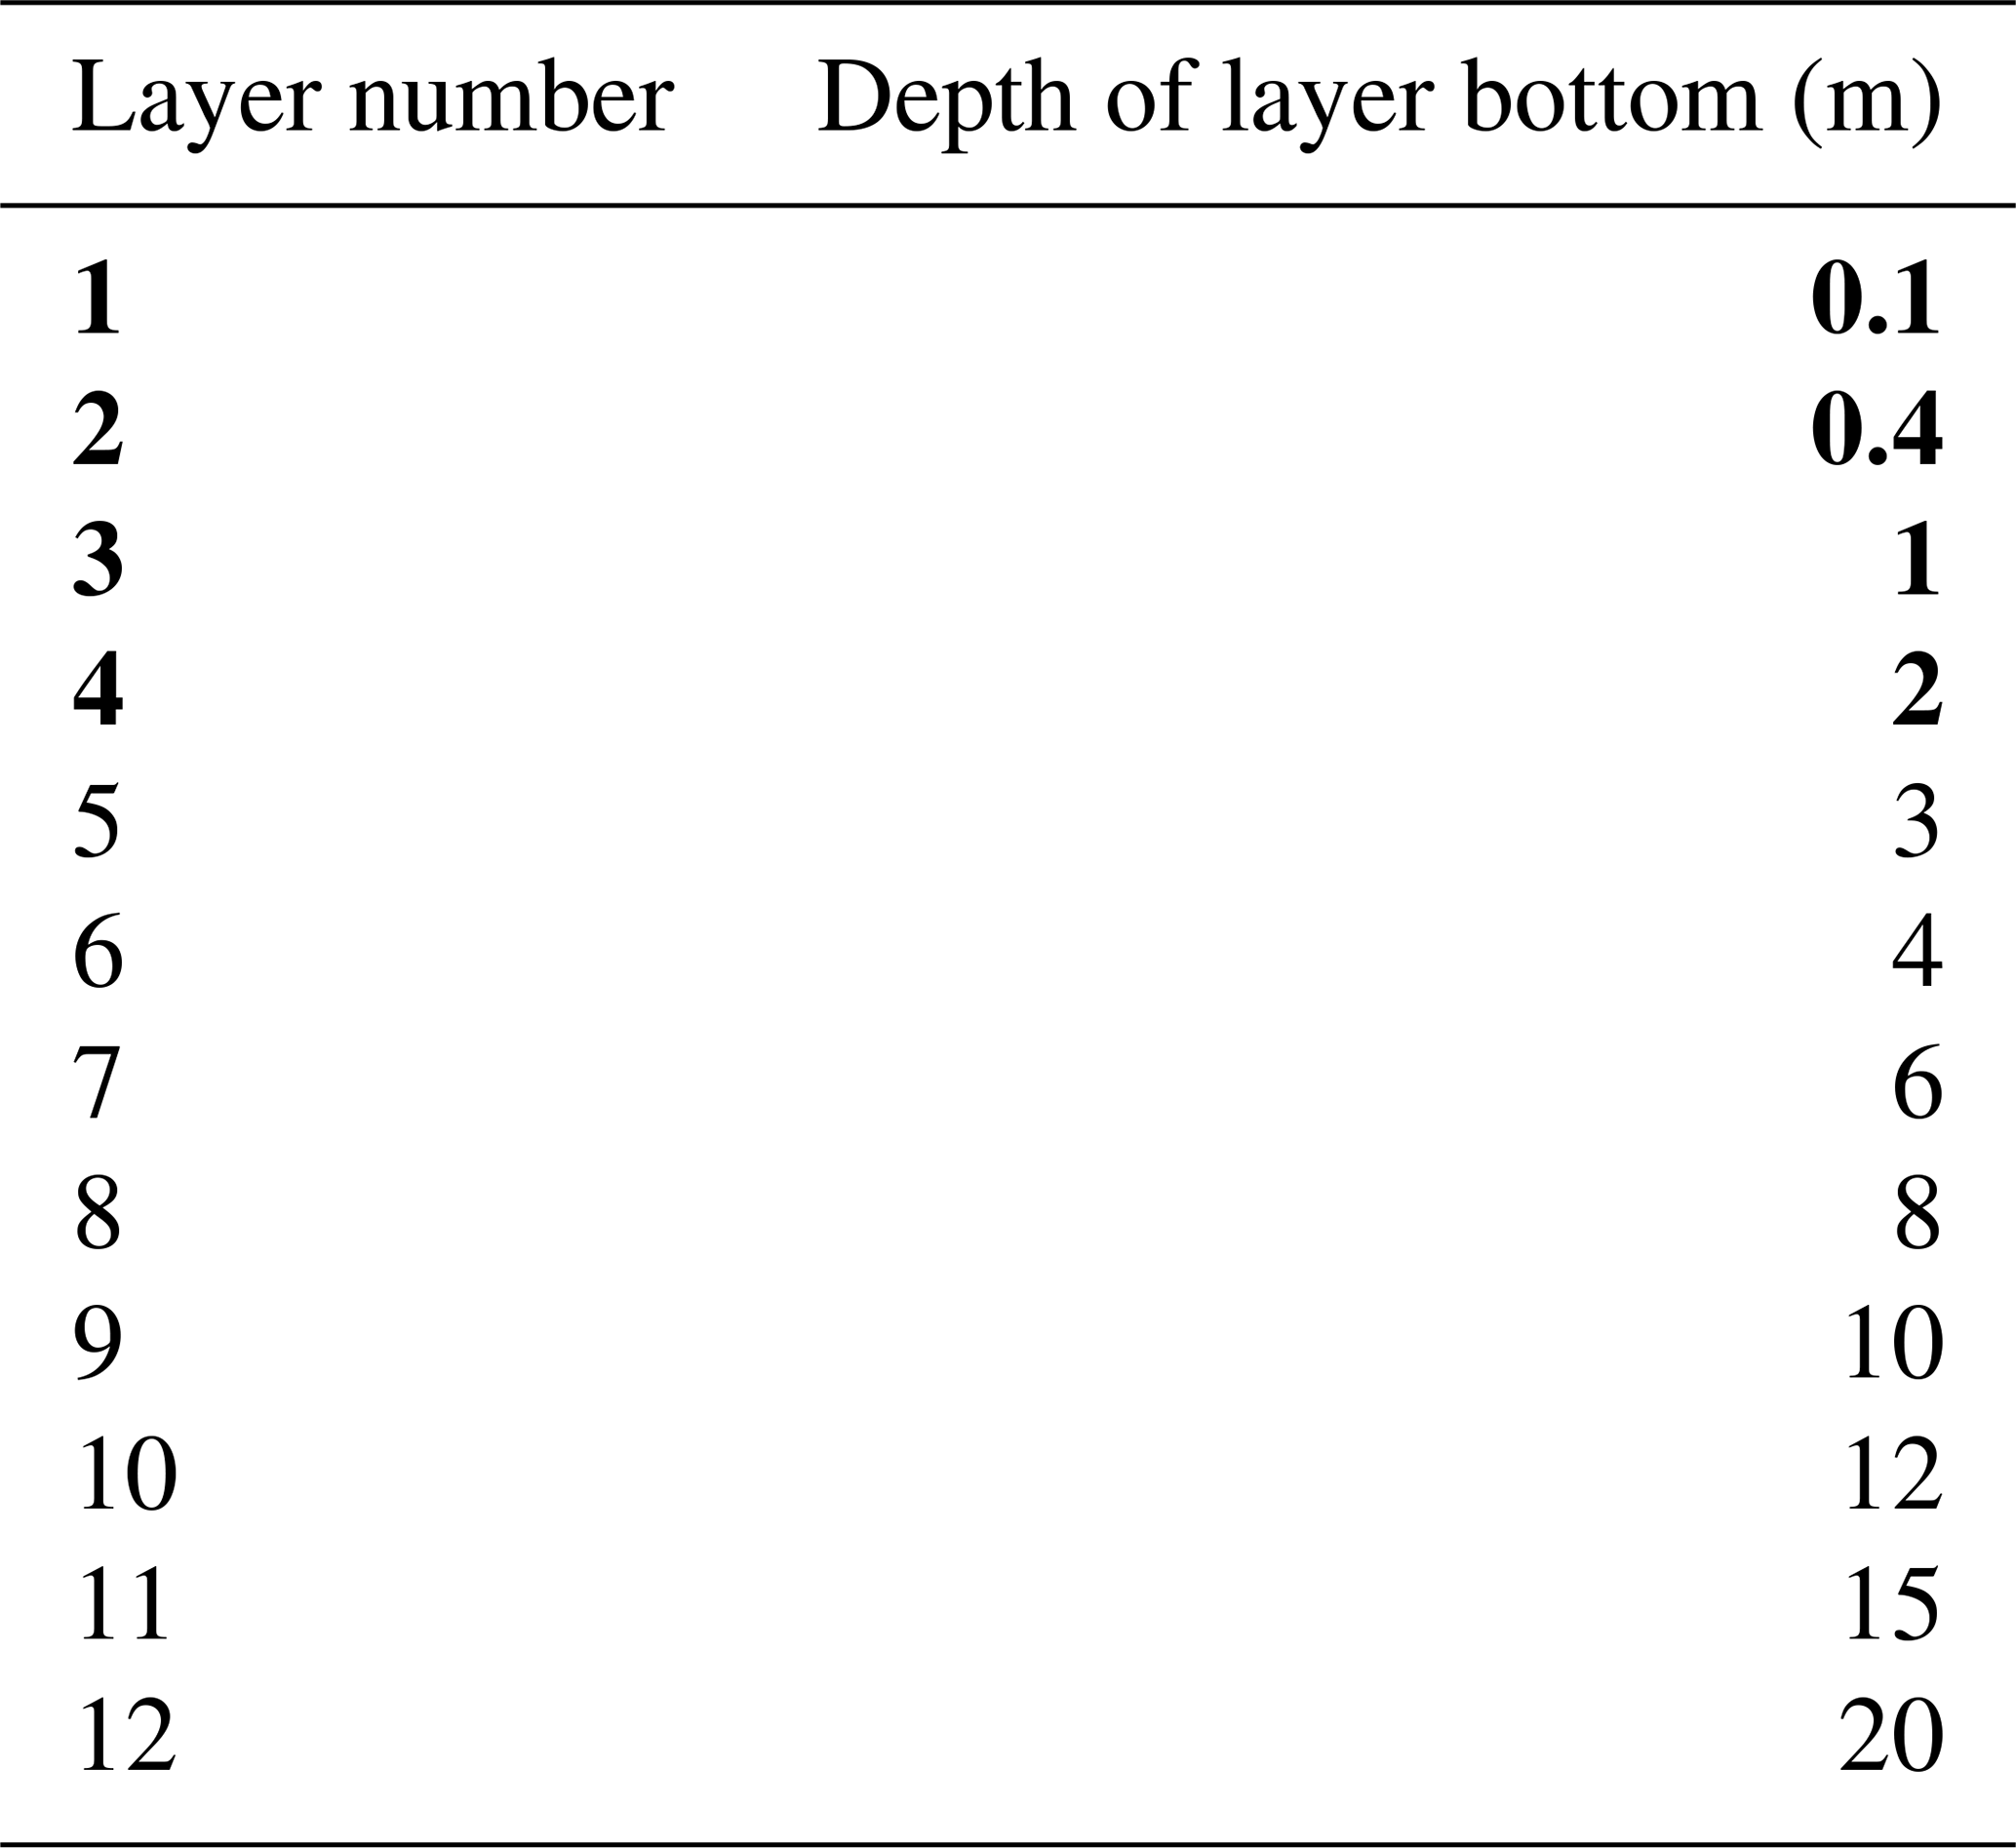
Soil layer depths as defined in our modified Noah-MP simulations are shown in Table 3. We add 8 soil layers, bringing the total number to 12, with a cumulative depth of 20 m. This means that hydrologically active soil layers in the modified Noah-MP are deep enough to capture RWU consistent with uptake depths in the Amazon observed or inferred to be 4.8–18 m (Davidson et al., 2011; Bruno et al., 2006; Broedel et al., 2017). This is not the case in the default Noah-MP. As the WPS only provides initial values for the original four soil layers in the default Noah-MP, it is necessary to obtain initial values of soil moisture and temperature for the additional resolved layers in our modified setup. We assigned soil moisture to these layers via a calculated equilibrium profile based on initial water table values from the WPS. The details of this process are included in the Appendix.
Table 3Soil layer depths as defined in modified Noah-MP simulations (our SOIL and ROOT experiments). Layers in bold are identical to the layers in the unmodified (default) Noah-MP (our FD and GW experiments).
2.2.2 Varying soil properties with depth
It is critical to capture observed decreases in the porosity and permeability of geologic materials with depth (Fan et al., 2007), particularly in the case of a deeper resolved soil column in our modified Noah-MP setup. Parameterization options that allow varying soil properties with depth are included in Noah-MP, but their use requires additional soil input data for the added layers. These data are not possible to obtain at the depths and spatial resolution we are concerned with. Thus, we implement exponential decay functions that can describe changes in soil properties with depth on kilometer scales (Miguez-Macho and Fan, 2012).
In the above, is saturated soil hydraulic conductivity, is saturated soil diffusivity, f is the e-folding depth for permeability, b is the Clapp–Hornberger exponent corresponding to the grid point dominant soil type (Clapp and Hornberger, 1978), and zj is the midpoint of soil layer j. The midpoint of each soil layer is expressed relative to 1.5 m depth, ensuring that soil properties do not vary in the top four shallow soil layers. Variables with a subscript of zero indicate the value of that variable in the first soil layer. Details regarding the calculation of f can be found in Fan et al. (2007) and Miguez-Macho and Fan (2012). f is higher in flat sedimentary basins and lower for steep mountain slopes, which reflects the fact that steep slopes shed sediments, while valleys accumulate them. Equation (7) was derived based on Darcy's law describing flow through a porous medium.
As part of the MMF groundwater scheme, a variably thick soil layer is added in grid points where the water table is below the resolved soil layers (Miguez-Macho et al., 2007). This layer extends from the bottom of the lowest resolved layer to the water table. Soil properties for the variably thick layer are also based on the exponential decay functions shown above, with z set to a constant (22.5 m) for simplicity regardless of the thickness of the layer.
2.2.3 The DynaRoot scheme
Following Fan et al. (2017), DynaRoot is analogous to Ohm's law of current flow between two points given a potential difference and conductor resistance. RWU happens preferentially in layers with lower resistance (wetter and shallower layers). Vegetation relies on RWU from higher-resistance layers (drier and deeper layers) only when the soil water profile “allows” it. In other words, DynaRoot simulates plant behavior in terms of balancing the need for water with the effort required for uptake.
The scheme is composed of two main functions. These include an ease function (ej) calculated at each soil layer (j) and a fractional contribution to RWU for each soil layer (rj), known as the root activity function:
where ψlmin is the minimum leaf water potential (set as a constant at −204 m or −2 MPa), hveg is the vegetation canopy height corresponding to the grid point dominant vegetation type, n is the number of resolved soil layers, and Δzj is the thickness of soil layer j. The ease function ej is based on the idea that RWU is influenced by the local soil water profile, which is determined by both infiltration from above and interactions with groundwater from below. For further information on the conceptual basis of DynaRoot, see the supplementary information provided in Fan et al. (2017). DynaRoot is added as a new module in the energy subroutine in the modified Noah-MP. The values of ej and rj are calculated in the new module. In the water subroutine of Noah-MP, rj replaces the beta factor βj for soil moisture stress such that sj=rj in Eq. (2).
Moreover, soil layers can be designated as having active or inactive root activity. This is determined by the value of ej. If the value of ej for layer j is zero for 1 model year, that layer is flagged as inactive. The layer can only become active again if it is the easiest layer from which to take up moisture, i.e., if the value of ej exceeds the value of ej everywhere else in the soil column. Additionally, in the modified Noah-MP, root depth at a given grid point is allowed to vary in time. Soil layers with active RWU comprise the root zone; the root depth is designated as the depth of the deepest layer with active root uptake.
In the modified Noah-MP, we calculate the maximum depth of RWU DRWU as the soil layer j at which . If T is zero, DRWU is set to the depth of the first resolved layer (0.1 m). DynaRoot constrains RWU to soil layers above the water table. If the water table is calculated to be above the bottom of the first resolved soil layer, RWU is constrained to that layer.
We do not employ Noah-MP's crop model in any of our simulations to lessen complexity and to avoid additional computational cost. Given this, we do not expect our results to be reliable in areas with crop irrigation.
2.3 Description of Noah-MP simulations
We ran the modified Noah-MP for a domain located in the southern Amazon, within the Brazilian state of Rondônia. Figure 1 depicts the simulation domain within South America (Fig. 1a), the elevation (Fig. 1b), the dominant soil texture (Fig. 1c), and the vegetation cover (Fig. 1d) as defined in our simulations. We selected a relatively small region that would allow us to carry out a proof of concept for our modified version of Noah-MP. We sought out a domain which includes areas designated as needing deep soil water, as has been done in studies such as Nepstad et al. (1994).
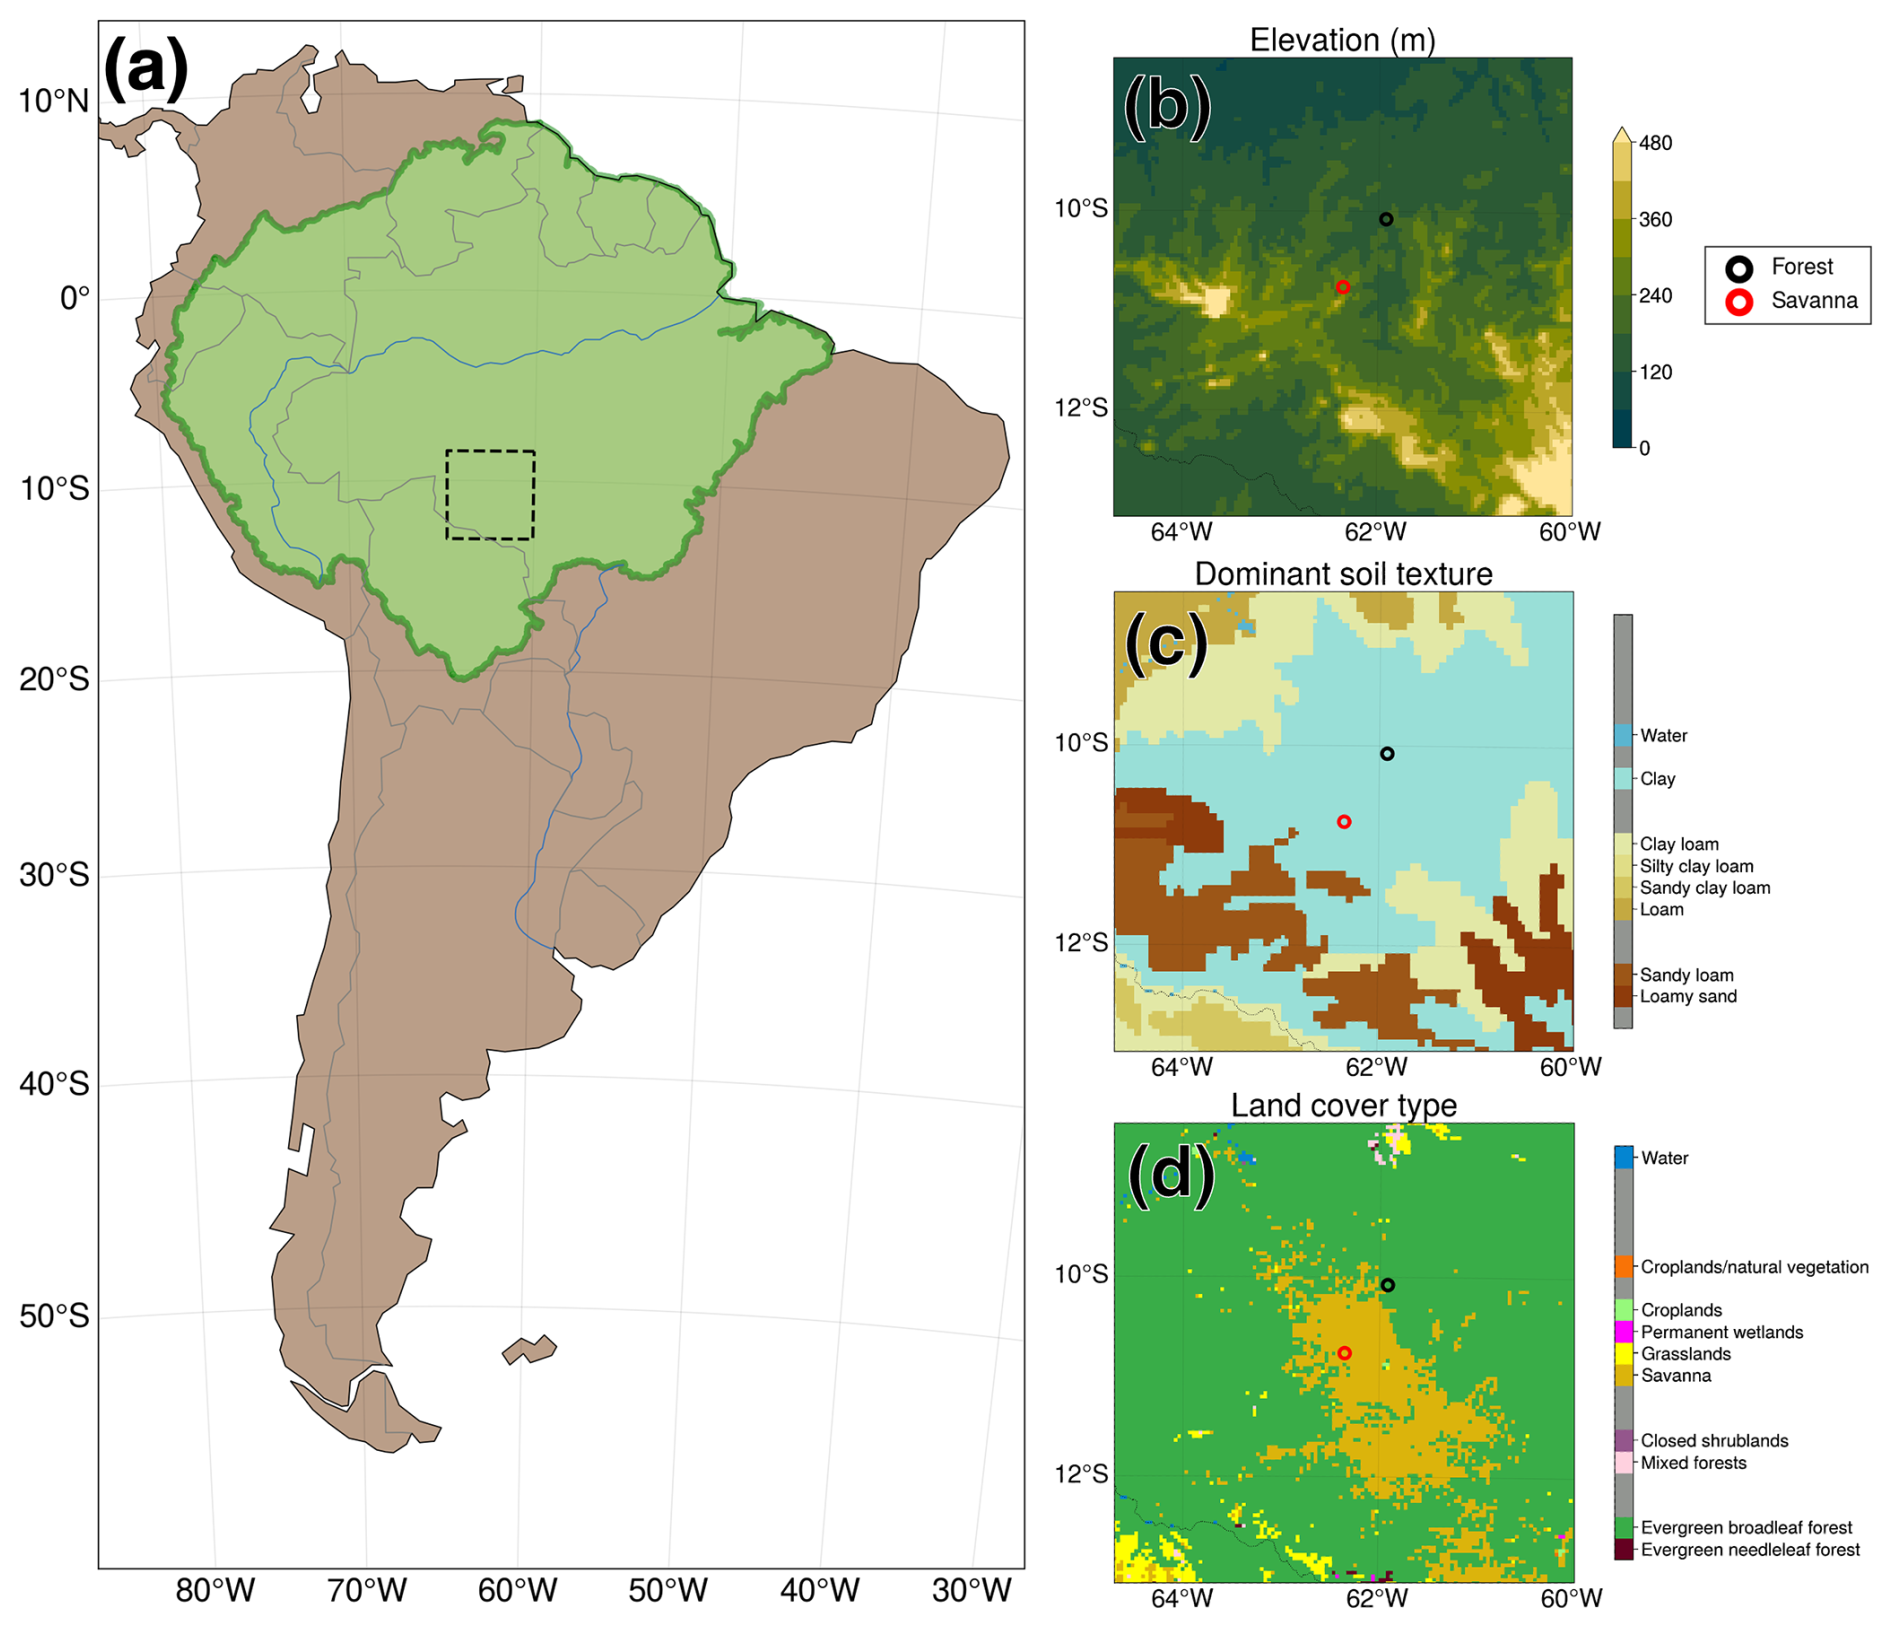
Figure 1Location of Noah-MP simulation domain and static input fields derived from the WPS. (a) Location of Noah-MP simulation domain for all cases (dashed black box). The green-shaded area denotes the boundaries of the Amazon basin. Made with Natural Earth (public domain). (b) Elevation in the simulation domain. (c) Grid point dominant soil texture. (d) Similar to (c) but for grid point dominant vegetation.
Table 4 lists the Noah-MP cases analyzed in this study: FD (free drainage), GW (MMF groundwater scheme activated), SOIL (identical to GW but with additional soil layers), and ROOT (identical to SOIL but with DynaRoot activated). FD acts as the control case in this study. The experimental design allows us to test the hypotheses listed in the Introduction. GW corresponds to H1, enabling us to test the effect of groundwater convergence in valleys on uptake. The SOIL experiment aids in testing H2, with deeper resolved soil layers that can store past precipitation in the deep vadose zone. Finally, the ROOT experiment simulates vegetation reliance on deep RWU via the DynaRoot uptake scheme, allowing us to test H3 and H4. The incremental nature of the cases (increasing in complexity from FD to ROOT) allows us to isolate the effect of individual physics and modifications.
Miguez-Macho et al., 2007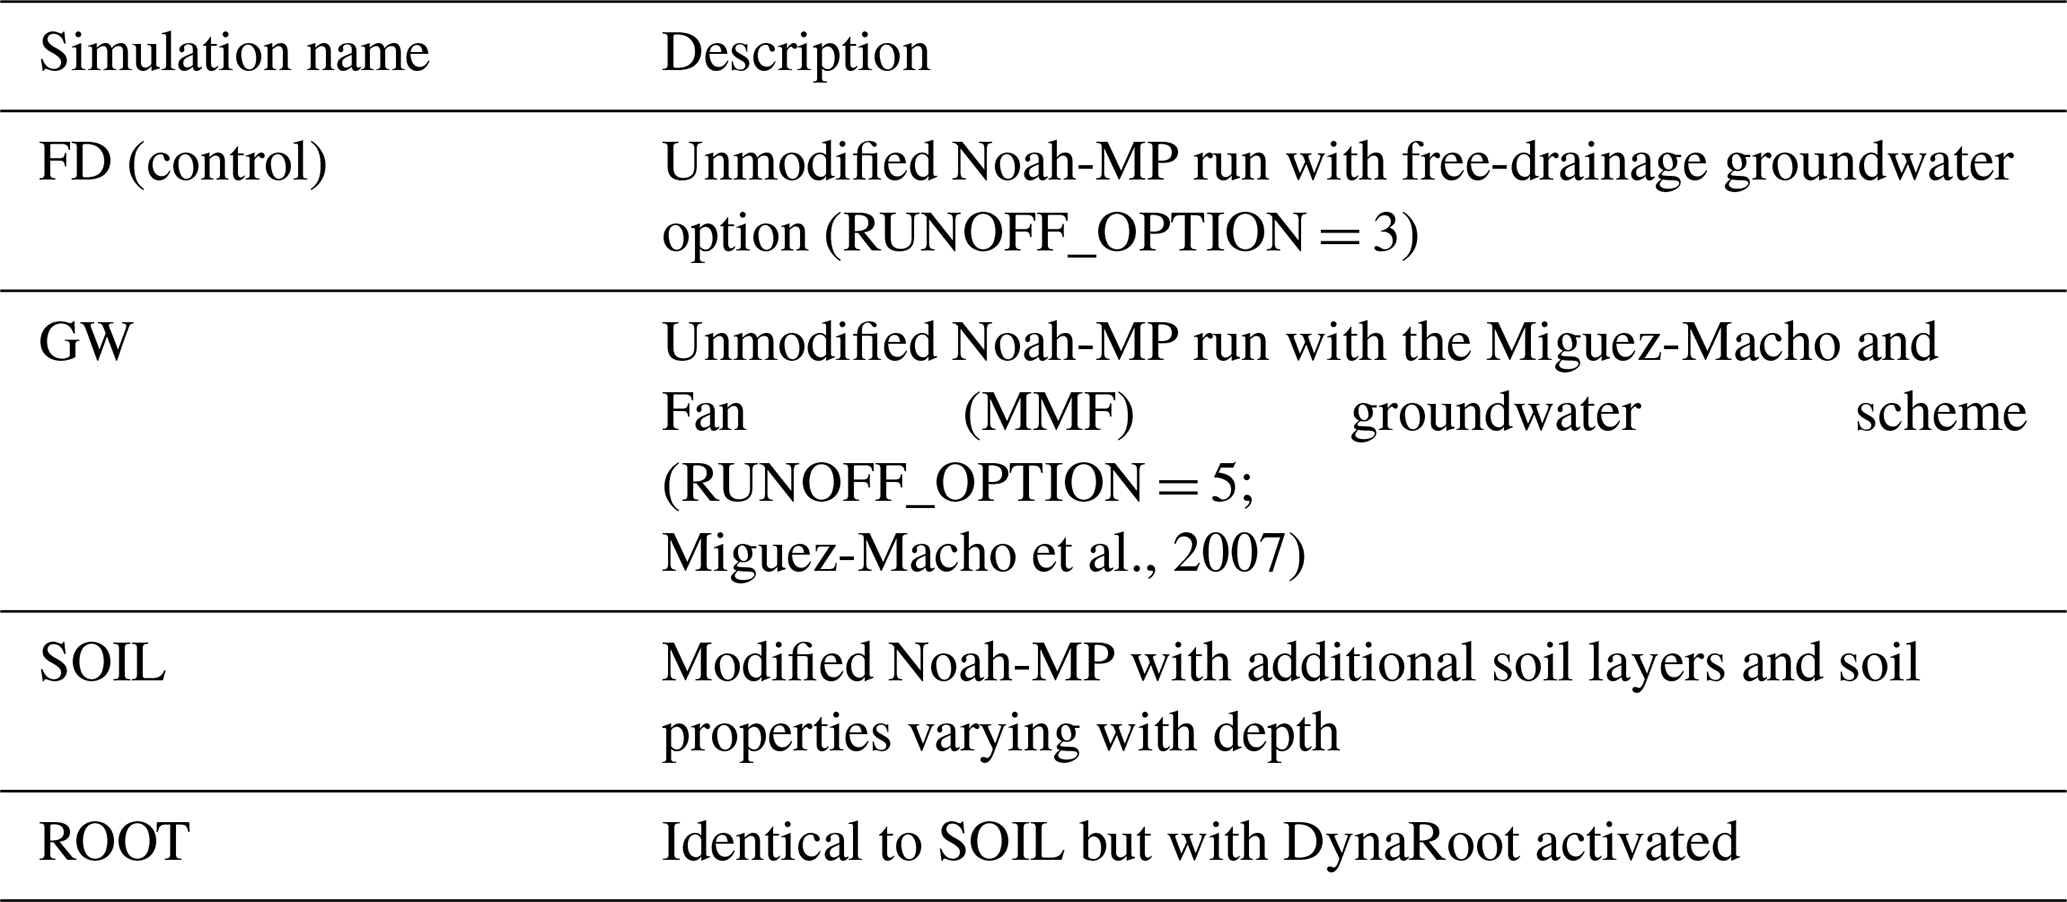
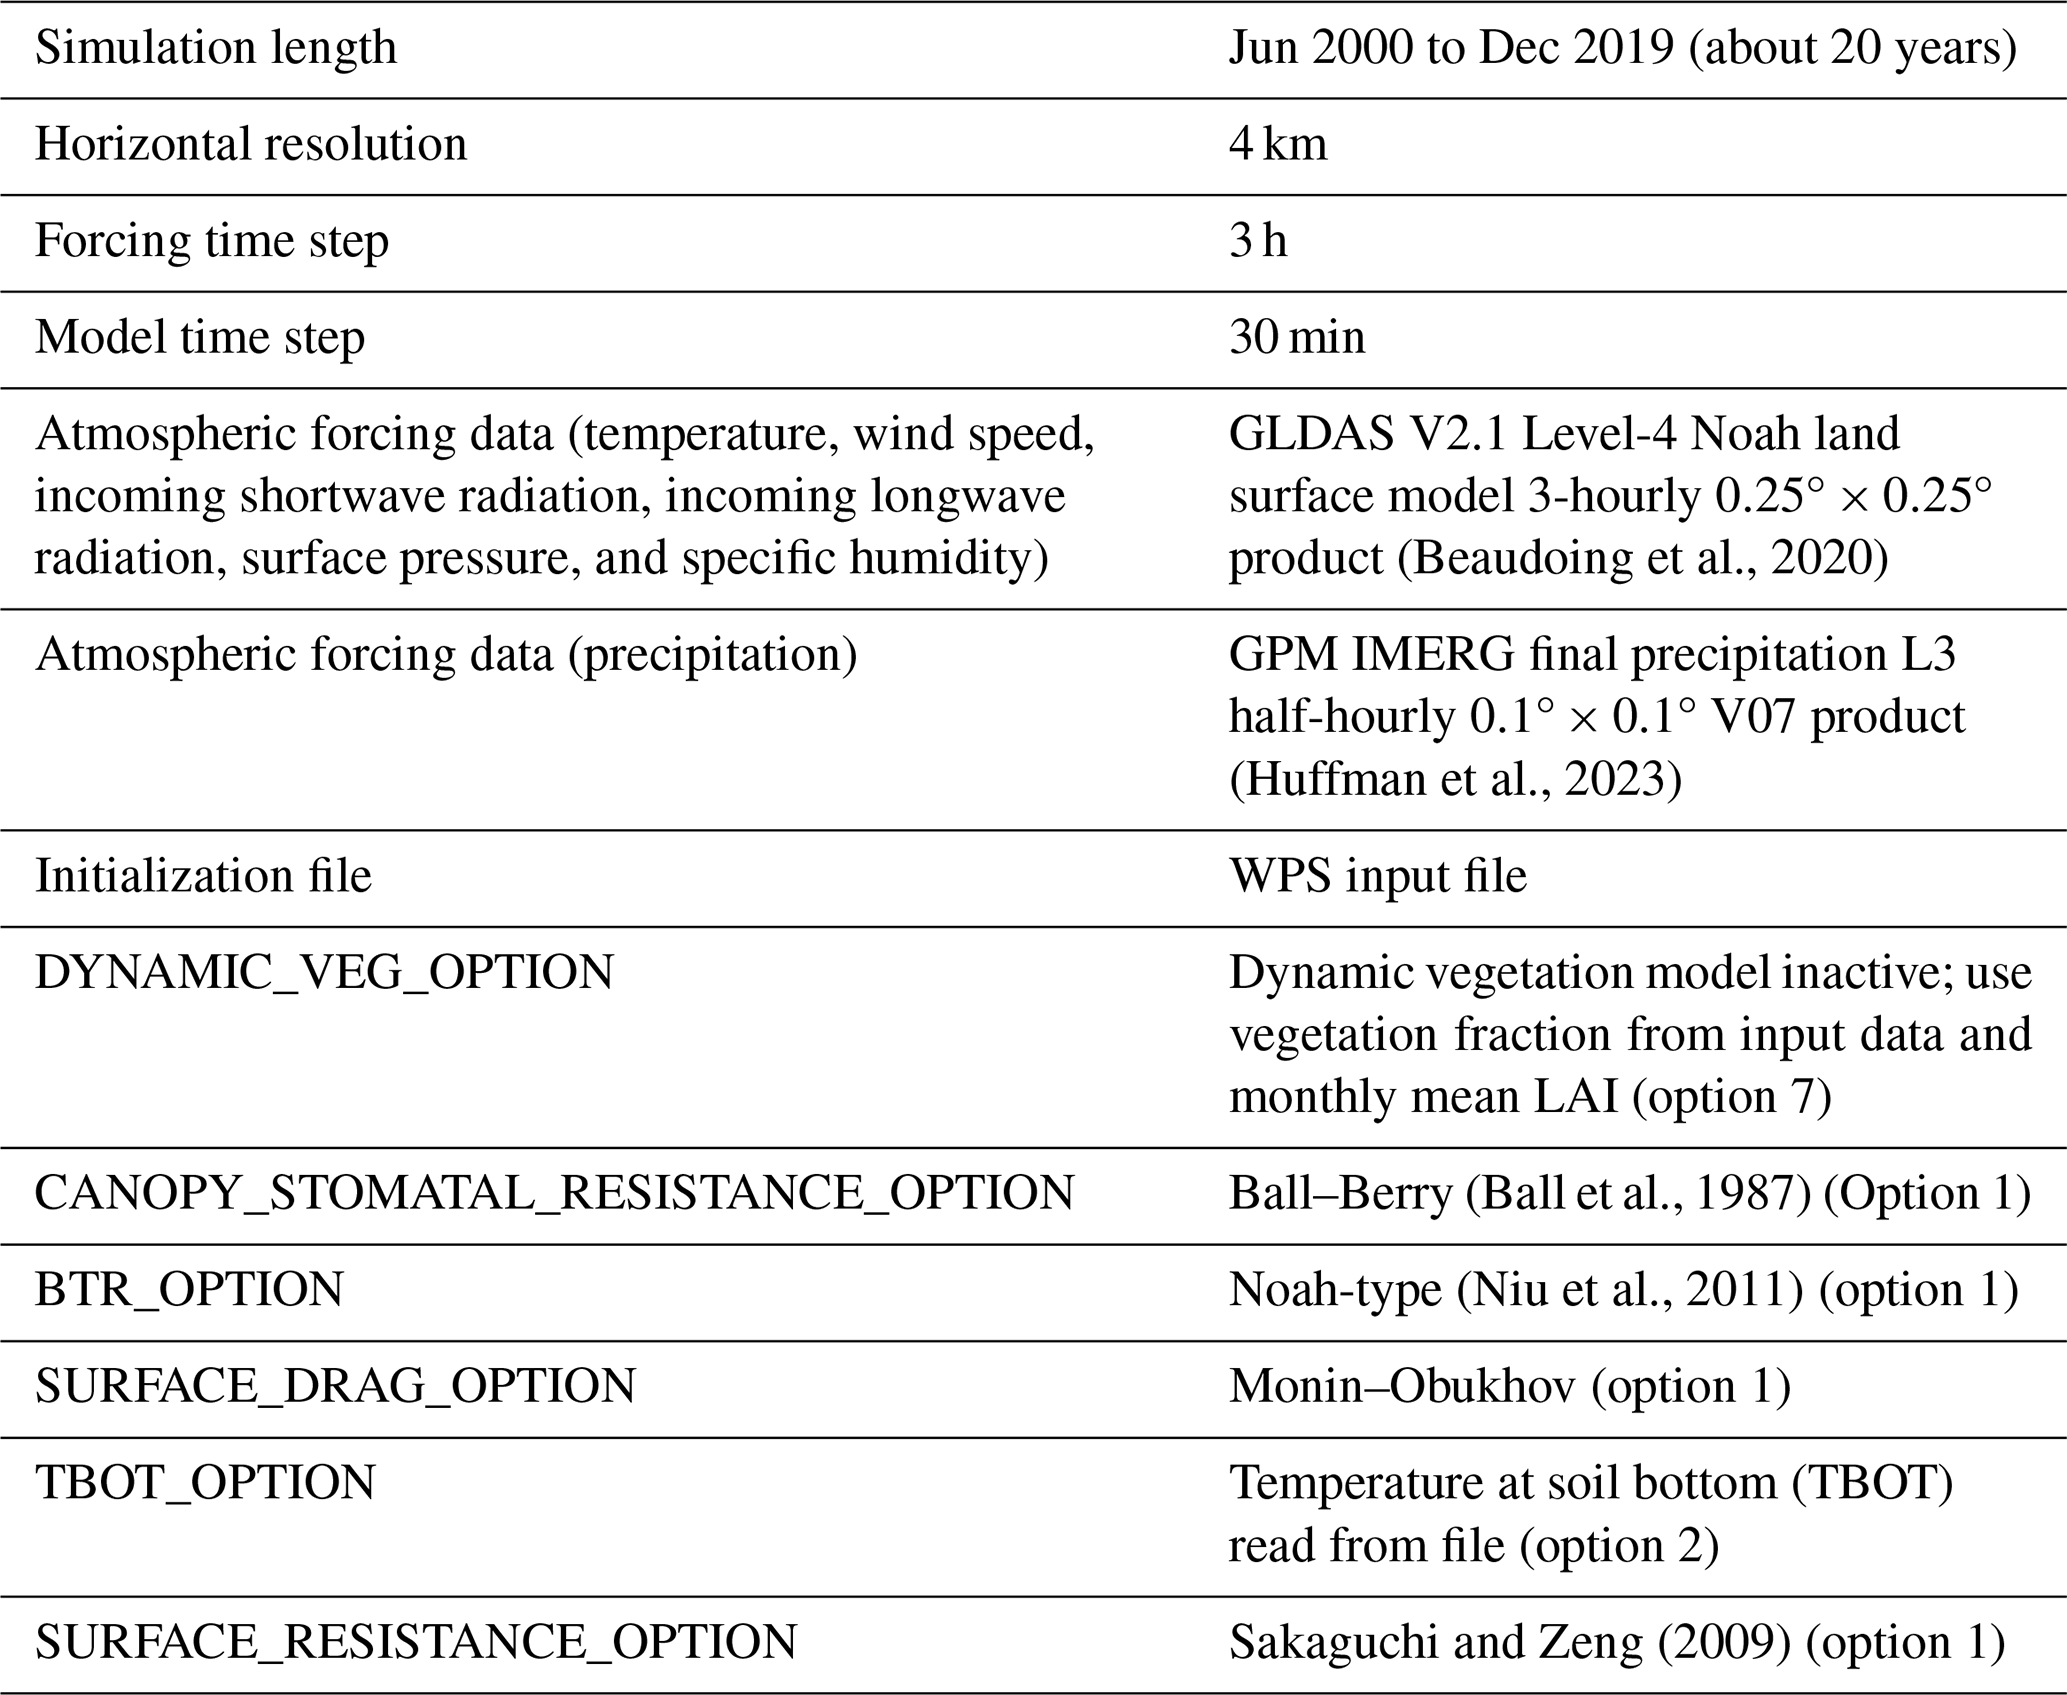
All simulations were offline; i.e., the model was run in an uncoupled state without active interactions between the land and atmospheric components. Rather, 3-hourly atmospheric forcing data, with the exception of precipitation, were sourced from the Global Land Data Assimilation System (GLDAS; Rodell et al., 2004; Beaudoing et al., 2020). Precipitation data were sourced from the Integrated Multi-satellitE Retrievals for GPM (IMERG) product (Huffman et al., 2023). Simulations were completed for a nearly 20-year period from 1 June 2000 to 31 December 2019. In all simulations, the model was run at a 4 km resolution and with 30 min time steps. Model output for the first 3 years was discarded in our analysis to account for model spin-up; about 3 years of model integration are required for soil moisture in the deepest layers to stabilize. Also, the DynaRoot uptake scheme is not fully active until 1 year into the model integration. Additional simulation setup details are shown in Table 5. GLDAS data were processed and converted into the necessary format using scripts provided with the HRLDAS source code. IMERG precipitation rate data were processed separately; data were averaged into 3-hourly intervals and regridded to the resolution of the Noah-MP simulations. All simulations were performed on the National Center for Atmospheric Research (NCAR) Derecho supercomputer (Computational and Information Systems Laboratory, 2024).
(Beaudoing et al., 2020)(Huffman et al., 2023)(Ball et al., 1987)(Niu et al., 2011)Sakaguchi and Zeng (2009)Table 5Technical specifications and selected Noah-MP settings for all simulations. A copy of the name list file used in our simulations is provided with our modified Noah-MP code (see “Code and data availability” section below).
2.4 Comparison with observation-based data
We compared Noah-MP transpiration to gridded data from the Global Land Evaporation Amsterdam Model v3.8a (GLEAM; Miralles et al., 2011; Martens et al., 2017). GLEAM provides estimates of ET and its components via a set of algorithms applied to satellite observations (Martens et al., 2017). An important limitation of GLEAM is the soil module used in deriving the evaporation estimates, which includes shallow soil layers that only extend to 2.5 m (Martens et al., 2017). Despite this limitation, GLEAM is valuable in its temporal availability and partitioning of ET into components. We note that flux tower data are available within our domain from the Large-Scale Biosphere-Atmosphere Experiment in Amazonia (LBA; Restrepo-Coupe et al., 2021). However, these data are only available for the early 2000s, coinciding with years that were discarded from the model output to account for spin-up of deep soil layers.
We apply the Mann–Kendall test for monotonic trends (Mann, 1945; Kendall, 1948; Gilbert, 1987) to the mean time series of transpiration and ET between days 150 and 250 of the year (the height of the dry season) for each point in the domain. We then calculate the slope of the Mann–Kendall trend (known as the Theil–Sen estimator) for the mean time series for each point (Theil, 1992; Sen, 1968). The sign of the Theil–Sen estimator indicates the direction of the trend in the mean time series; a positive (negative) value is associated with generally increasing (decreasing) transpiration or ET. We compare spatial patterns of the Theil–Sen estimator between the SOIL and ROOT Noah-MP model runs and the gridded GLEAM evaporation estimates.
3.1 Noah-MP model output
Figure 2 depicts the simulated mean water table depth (WTD) and uptake from shallower than 1 m in the ROOT experiment for all months, for relatively dry months (June–September), and for wet months (November–February). Mean WTD is generally deeper in drier months (Fig. 2a), reflecting the seasonal availability of moisture from precipitation. WTD is consistent with simulated values for the same region from other studies (Martinez et al., 2016a; Fan et al., 2017). Fractional uptake from shallower than 1 m (Fig. 2b) varies between dry and wet periods, with a clear shift in uptake to depths below 1 m during drier months. This is consistent with a seasonal shift in RWU from shallower to deeper areas of the root zone as moisture from precipitation becomes scarce during drier months.
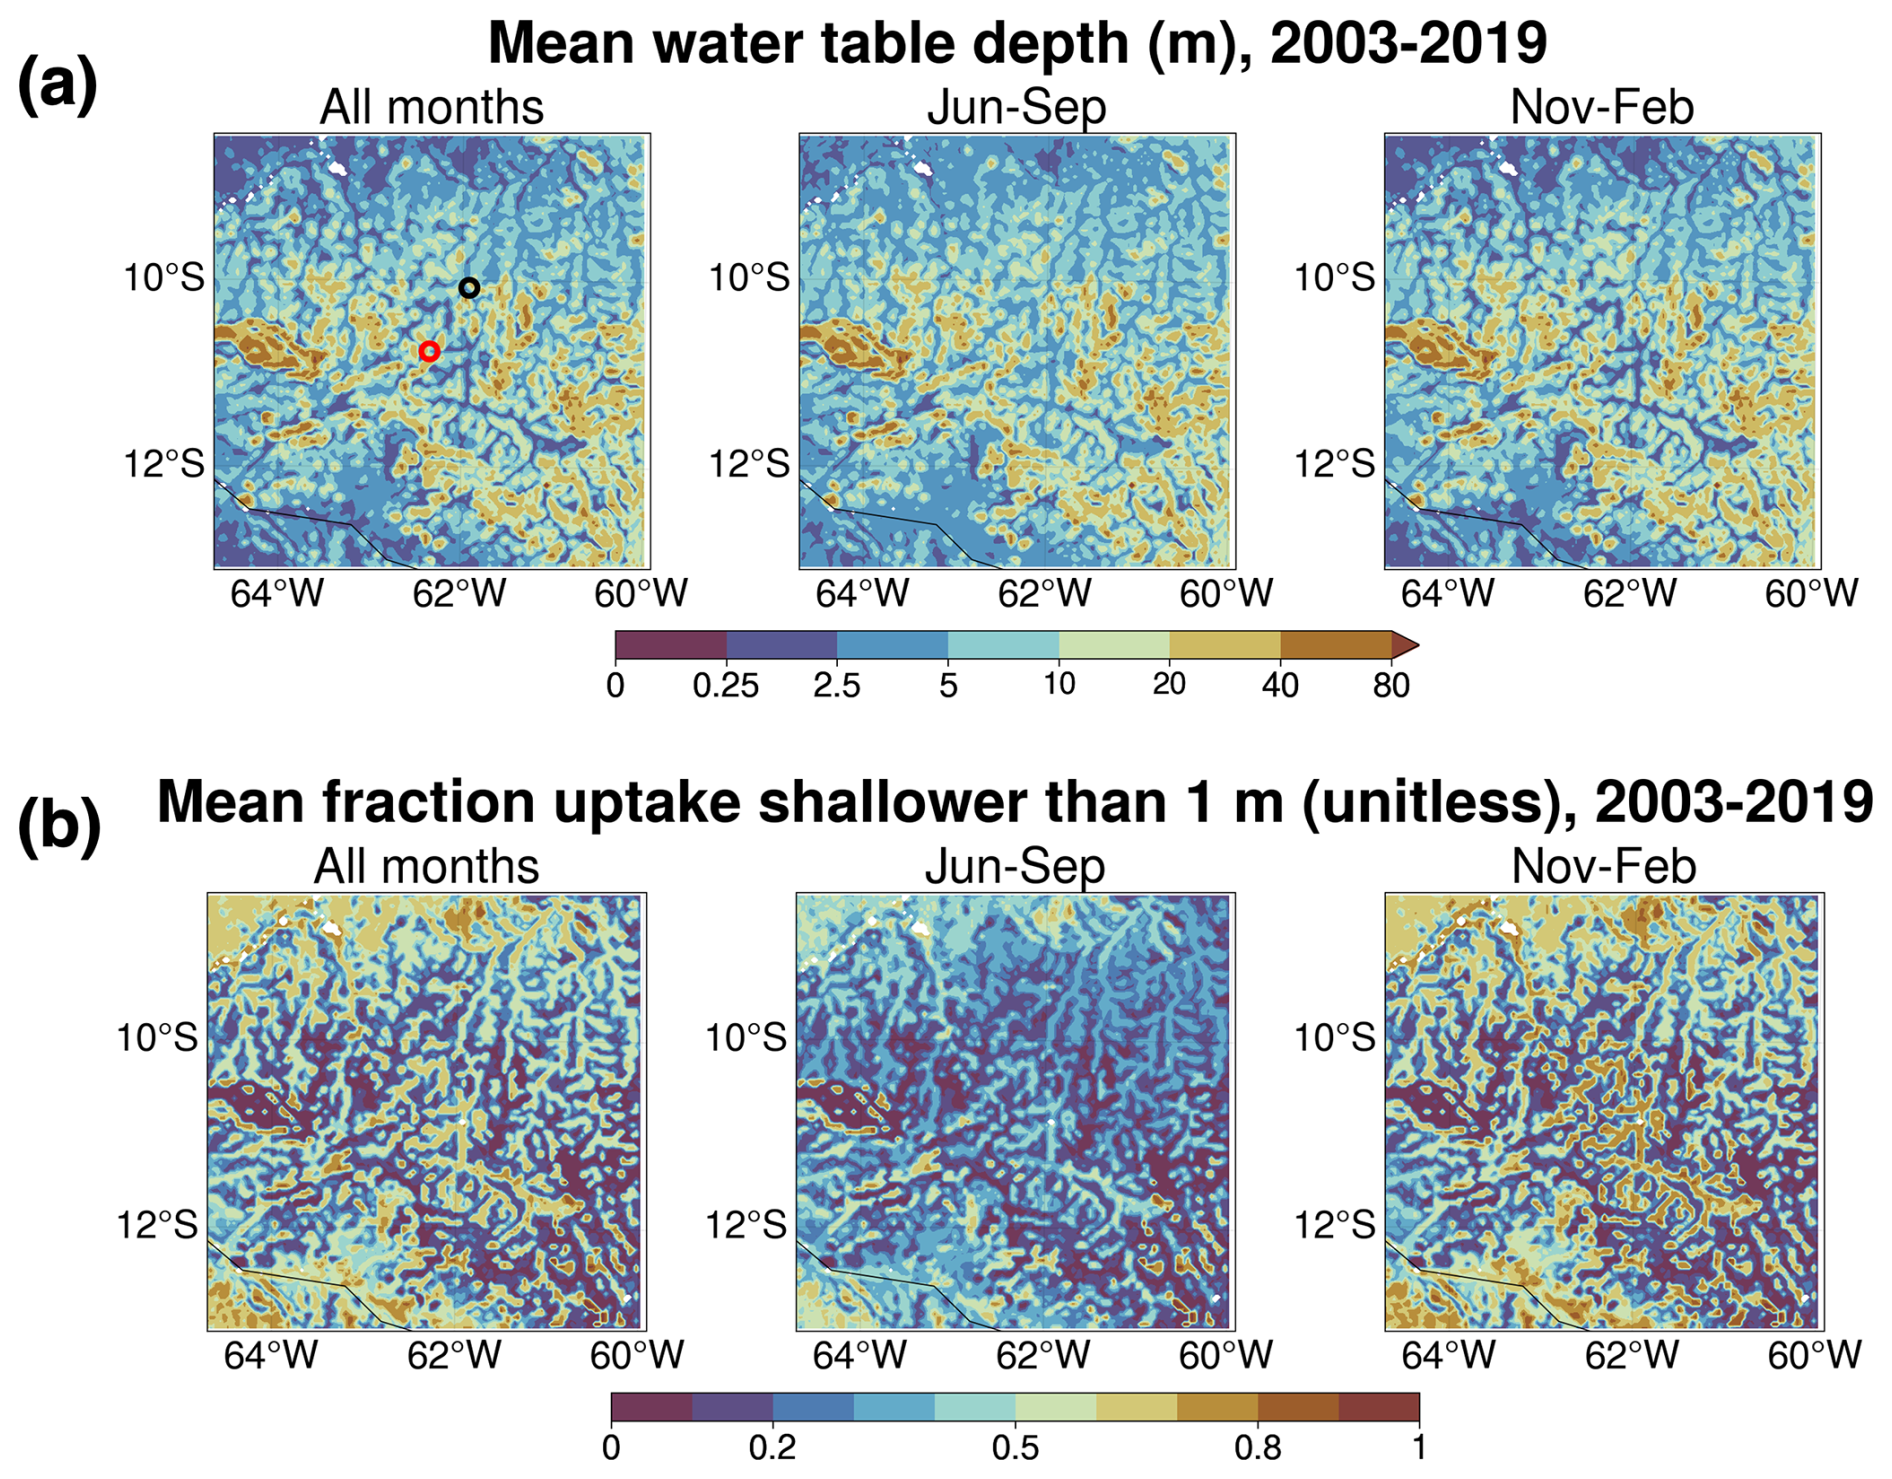
Figure 2Simulation mean results from the ROOT experiment. (a) Simulation mean WTD for all months (left panel), relatively dry months (June–September, center panel) and wet months (November–February, right panel). (b) Simulation mean fraction of uptake from shallower than 1 m for all months (left panel), relatively dry months (June–September, center panel), and wet months (November–February, right panel).
We examine model output at the point scale to gain an understanding of the localized interplay between groundwater, soil moisture, RWU, and land surface fluxes with and without our Noah-MP modifications. We analyze the output for two points in the domain, a point with dominant evergreen broadleaf forest and a point with dominant savanna vegetation. The locations of these points are shown in Fig. 1. Given the mean water table locations at these points, we expect uptake to tap into groundwater capillary rise at the savanna point (in line with H1) and deep vadose zone uptake to occur at the forest point (in line with H2). We expect dry-season deep RWU to be more relevant at the forest point compared to at the savanna point, in accordance with H3 and H4. Note that deep-rooted woody vegetation has been shown to exist in savanna ecosystems (Canadell et al., 1996; Oliveira et al., 2005a; Singh et al., 2020). Most of the areas classified as savanna in our domain are a result of deforestation, with forest giving way to grass-dominant pastures with a shallower rooting depth (Gash and Nobre, 1997; Roberts et al., 2002; von Randow et al., 2004; Piontekowski et al., 2019; Honey, 2023). Additionally, Noah-MP does not capture heterogeneity in growth form within a given vegetation class, making it impossible for us to account for the proportion of potentially deep-rooted woody vegetation in savannas. A single canopy height range is assumed for every grid point classified as savanna (minimum of 0.1 m, maximum of 10 m) and forest (minimum of 8 m, maximum of 20 m). This canopy height is considered in the calculation of ej.
The point-level time series of 1.5 years of model output (Fig. 3) support all four hypotheses. In the GW case, locally higher values of soil moisture exist in the vicinity of the water table at the savanna point (Fig. 3d, bottom panels), consistently with capillary rise. The rooting depth at this point (static at 1 m in this experiment) would allow vegetation to tap into this moisture source, consistently with H1. However, there is a disconnect between resolved soil layers (which extend to a cumulative depth of 2 m) and the water table for both forest and savanna points (Fig. 3d, top and bottom panels) during the entirety or part of the period. Direct interaction between resolved soil layers and the water table can only occur when the water table is 2 m or shallower. When the water table is deeper than 2 m, indirect interaction occurs via the artificial variably thick layer that extends from the bottom of resolved soil layers to the water table.
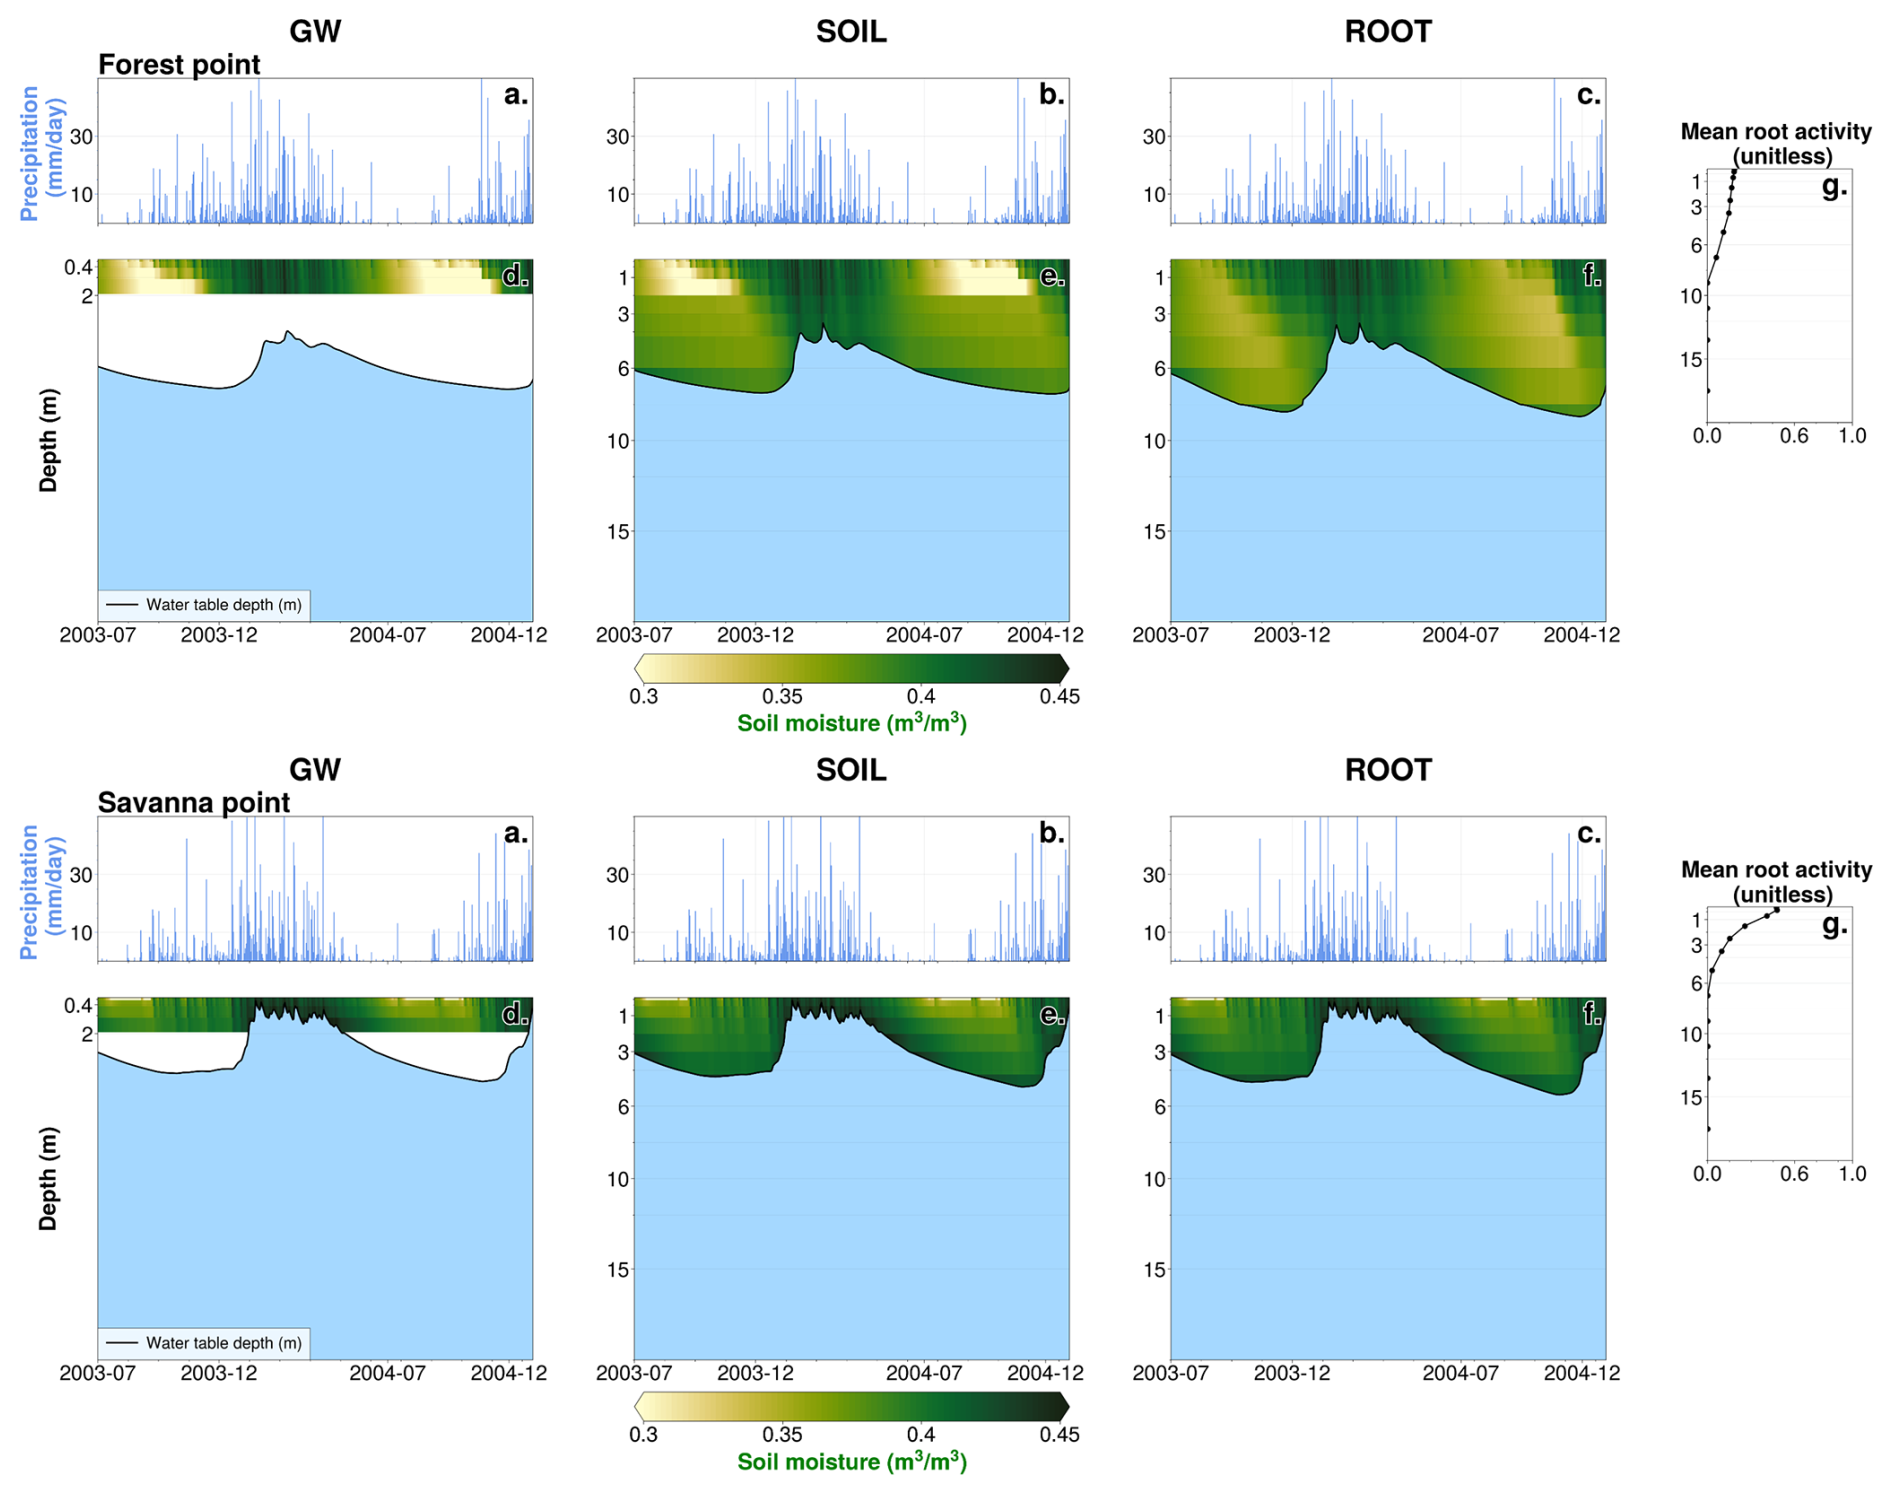
Figure 3Noah-MP model output, July 2003 to December 2004. (a–c) Mean daily precipitation rate for GW, SOIL, and ROOT experiments at the forest point. (d–f) Mean daily soil moisture (shading) and WTD (black line) for GW, SOIL, and ROOT experiments at the forest point. Light-blue shading represents regions below the water table. (g) Simulation mean root activity rj at the forest point (from the ROOT case). (a–g) Identical to (a)–(g) in the top row but for the savanna point.
In the SOIL experiment, the additional soil layers enable direct interaction between resolved layers and the water table at both points. Periodic decreases in shallow soil moisture occur at the forest point in SOIL (light-yellow colors in Fig. 3d and e, top panels). These periods of decreased soil moisture roughly align with seasonally dry periods (Fig. 3a and b, top panels). There is a noticeable discontinuity in soil moisture at 2 m depth at the forest point. This is due to the prescribed rooting depth, which is fixed and constrained to 2 m in the SOIL experiment. With the added soil layers in this case, Fig. 3e (top panel) reflects the added soil moisture store in the deep vadose zone, which cannot be fully accessed unless RWU is allowed to extend deeper (H2). At the savanna point, the seasonal depletion of shallow moisture is not as present, signifying a lack of dependence on root uptake (H4). The vadose zone is not as deep, supporting the accessibility of moisture for uptake in the capillary fringe (H1).
In the ROOT experiment – which is identical to the SOIL setup but with the DynaRoot uptake scheme activated – seasonal soil moisture changes are more uniformly distributed throughout the soil layers, resulting in less shallow soil drying during drier months. This is especially clear at the forest point (Fig. 3f, top panel). Figure 3g (top panel) confirms deep and more uniform RWU with depth at the forest point as non-zero mean root activity rj values extend up to the eighth soil layer (which has a layer bottom that corresponds to 8 m). These results are in support of H2 and H3. When deep moisture is available, vegetation will access it, particularly in drier months when surface moisture from precipitation is not sufficient. The source of this moisture is the deep vadose zone, where moisture from past precipitation is stored. Conversely, Fig. 3g (bottom panel) confirms less reliance on deep RWU at the savanna point in the ROOT case as rj drops off exponentially from its maximum in the shallowest soil layer. At the same time, rj at this point indicates that uptake occurs such that vegetation can tap into groundwater capillary rise, supporting H1. The mean root activity profiles and soil moisture variations at each point illustrate the dependence of DynaRoot on vegetation type, in support of H4.
Figure 4 shows the mean seasonal cycle of soil moisture for multiple soil layers at the forest point (Fig. 4a) and the savanna point (Fig. 4b) and for GW (left panels), SOIL (center panels), and ROOT (right panels). We also show precipitation for reference. In the GW case at the forest point (Fig. 4a), soil moisture in all layers is nearly identical until approximately mid-August, when soil moisture in shallower layers begins to rebound from an annual minimum value. Soil moisture in deeper layers continues to decrease before rebounding by late October. At the savanna point (Fig. 4b), soil moisture in deeper layers varies little throughout the year compared to in the shallowest layer, which exhibits mostly constant behavior followed by a precipitous decline at the end of the dry season and a sharp rebound. In the SOIL experiment, additional deep soil layers do not affect the behavior of soil moisture in shallower layers, which exhibit nearly identical behavior to GW at both points. This is due to the fact that rooting depth is consistent with the unmodified Noah-MP in this experiment, constrained to a 2 m maximum depth. In the ROOT case, soil moisture in shallow layers shows less of a decline throughout the year at the forest point, while deeper layers show a gradual depletion throughout the dry season compared to SOIL. As such, with the addition of deep soil layers and dynamic RWU, water uptake is more uniformly distributed throughout the soil column during the dry season and during the transition to the wet season. At the savanna point, results are relatively unchanged in ROOT, SOIL, and GW. These findings support H3 (dynamic RWU is critical in the dry season) and H4 (dynamic RWU is more important for mature forests compared to for non-forested areas).
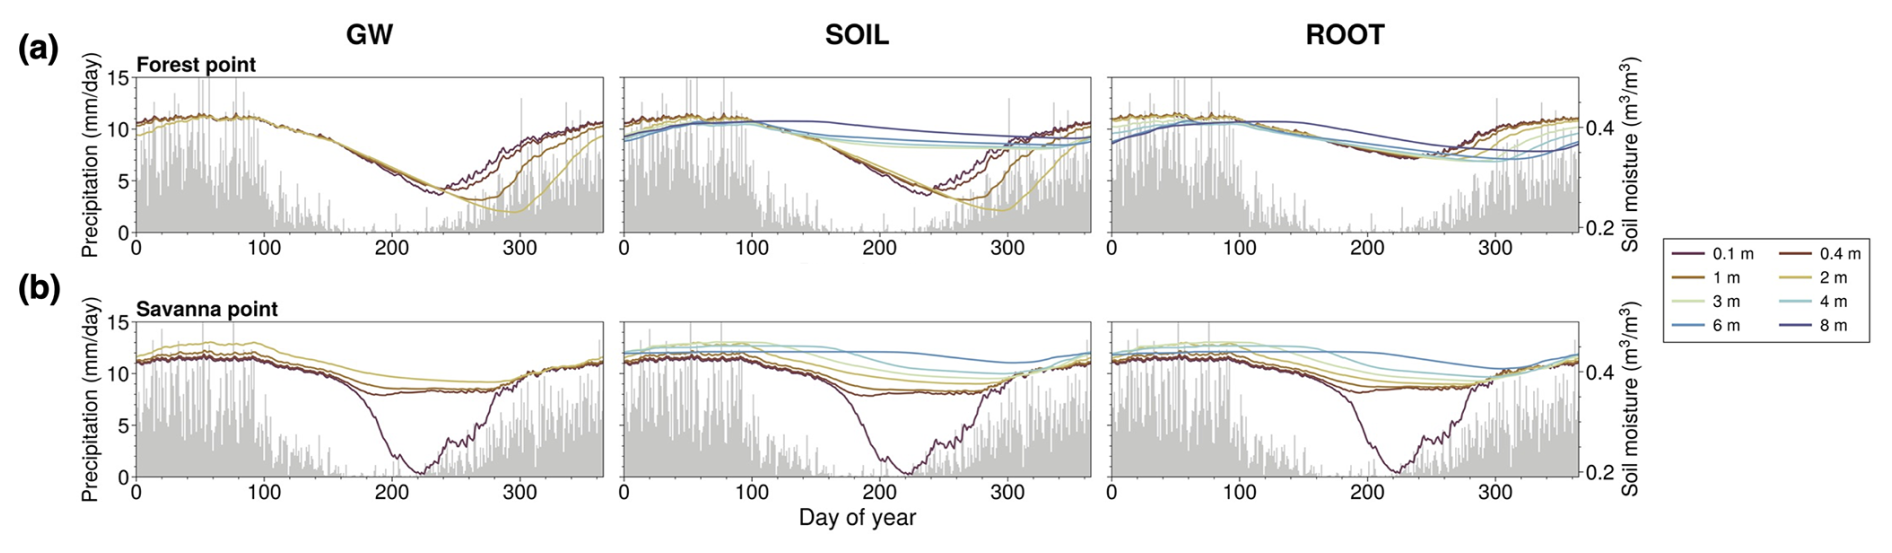
Figure 4(a) Day-of-year mean soil moisture (multicolored lines) and precipitation (gray bars) for GW, SOIL, and ROOT cases at the forest point. (b) Identical to (a) but for the savanna point. Note that soil moisture is only plotted for layers above the water table.
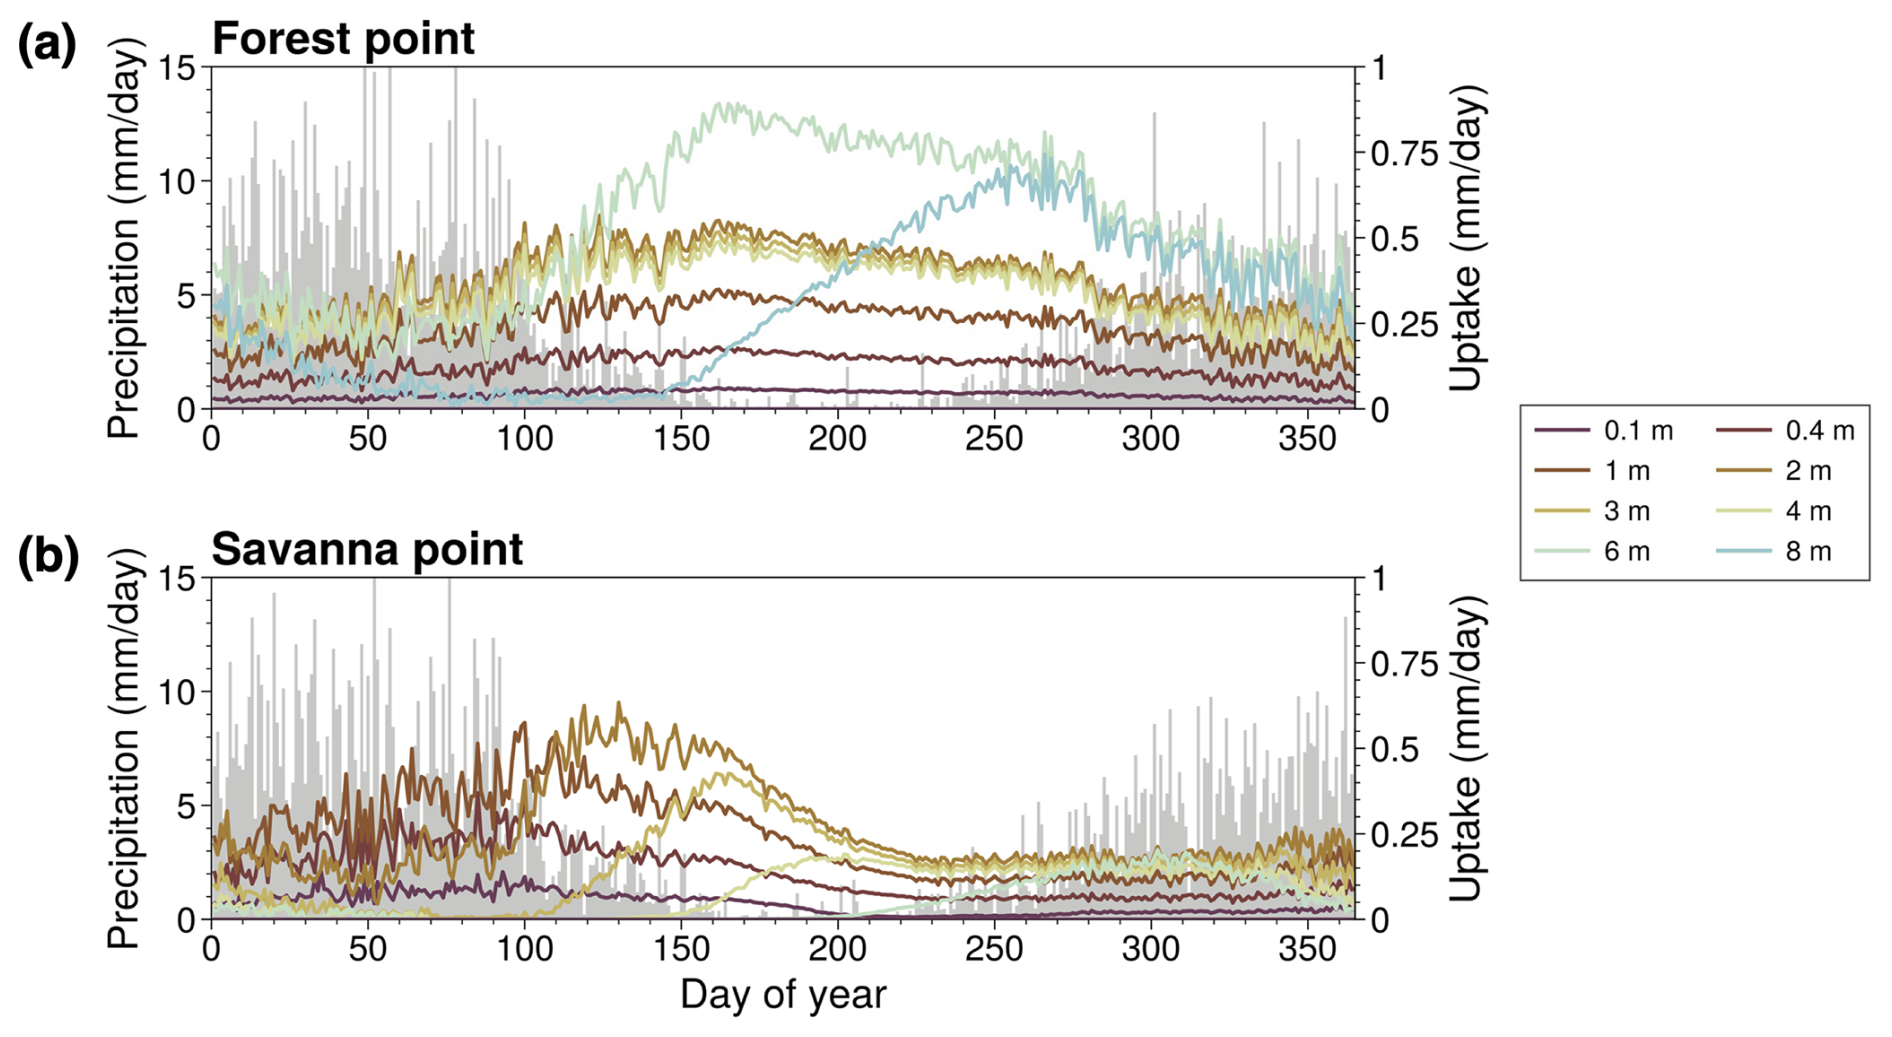
Figure 5(a) Day-of-year mean RWU (multicolored lines) and precipitation (gray bars) for the ROOT experiment at the forest point. (b) Identical to (a) but for the savanna point.
The behavior suggested by Fig. 4 is further supported by Fig. 5, showing the mean seasonal cycle of RWU in the ROOT case at the forest point (Fig. 5a) and the savanna point (Fig. 5b). For reference, the annual precipitation cycle is depicted in these plots as well. At the forest point, RWU predominantly occurs in deeper layers in the dry season. During other times of the year, the magnitude of deep RWU is more comparable to RWU in shallower layers. The clear seasonal behavior of RWU exhibited at the forest point is consistent with seasonal dependence on deep RWU in forested areas of the Amazon (Nepstad et al., 1994; Markewitz et al., 2010; Ivanov et al., 2012), consistently with H3 and H4. Notably, RWU in the deepest layer shown in Fig. 5a is near zero in the first part of the year and quickly ramps up as the dry season progresses. At the savanna point, RWU predominantly occurs in shallower layers. Seasonal changes in RWU are also evident at the savanna point; RWU peaks around the end of the wet season and quickly declines through the dry season. This behavior indicates the lack of reliance on RWU at the savanna point compared to at the forest point; RWU is not maintained through the dry season as it is at the forest point. These findings are supportive of H3 and H4.
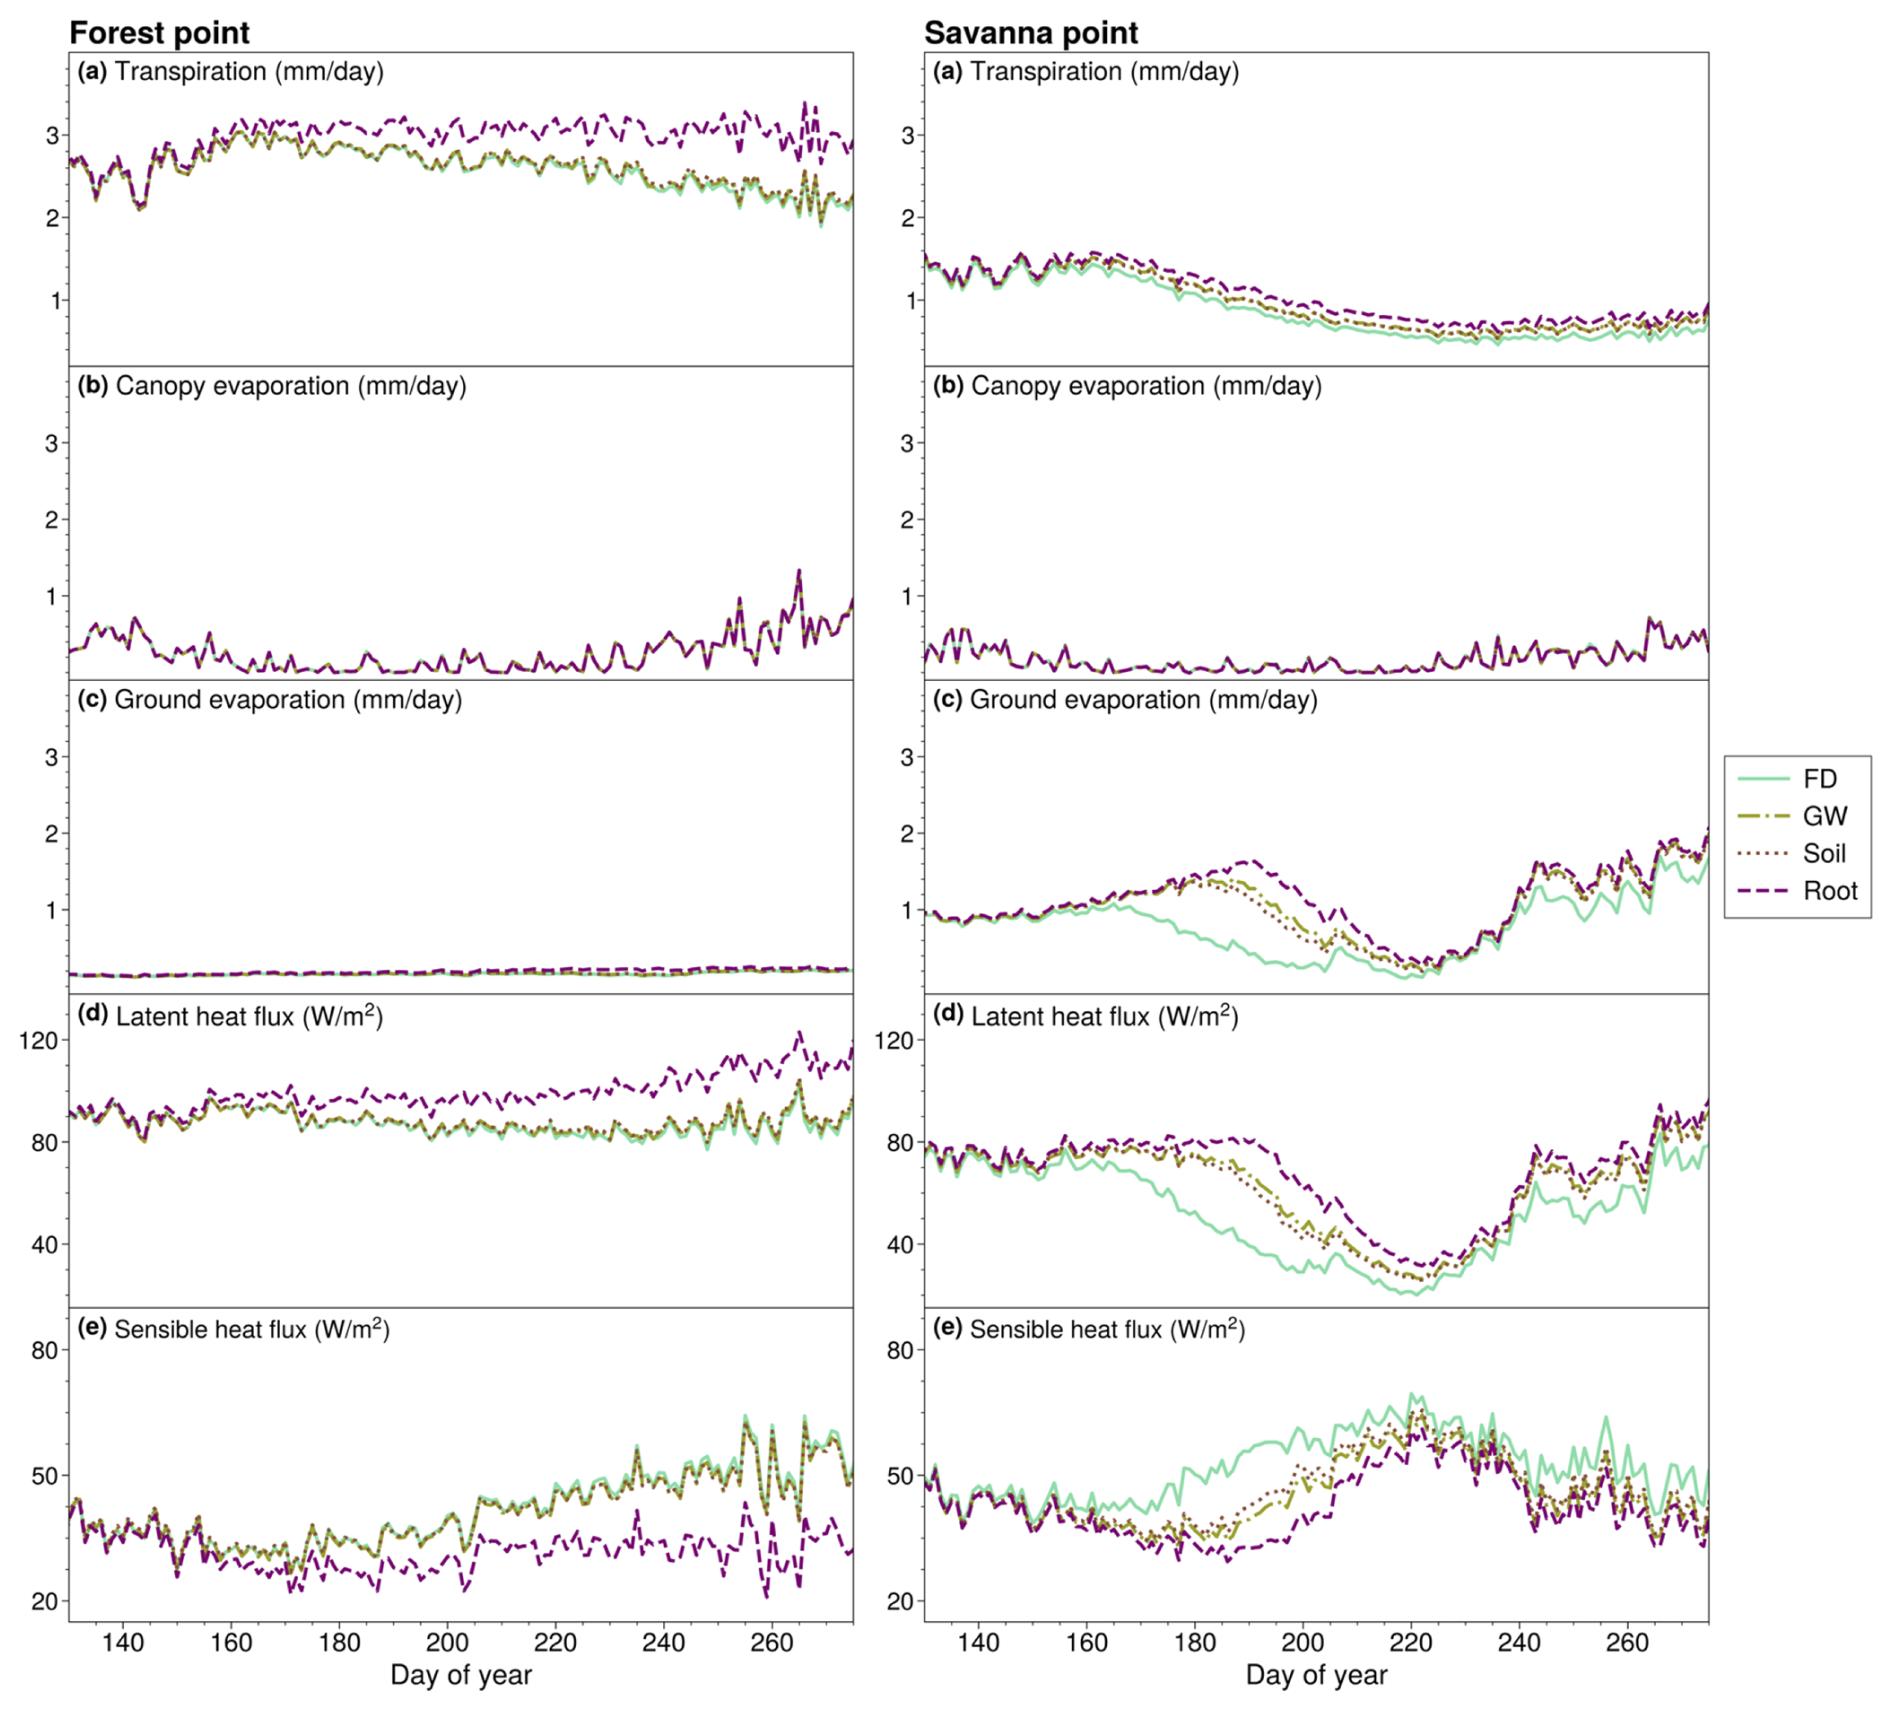
Figure 6The left panels denote the day-of-year mean (a) transpiration, (b) canopy evaporation, (c) ground evaporation, (d) latent heat flux, and (e) sensible heat flux for the FD, GW, SOIL, and ROOT cases at the forest point. The right panels are identical to the left panels but for the savanna point.
Annual mean land surface fluxes at the forest and savanna points, including transpiration, latent heat flux, sensible heat flux, ground evaporation, and canopy evaporation, are depicted in Fig. 6. The results for all four cases – FD, GW, SOIL, and ROOT – are plotted. We show results for the dry season and for the transition to the wet season (days 130 to 270 of the year) as fluxes do not differ between cases during other parts of the year. In the ROOT experiment at the forest point (Fig. 6, left panels), we see an increase (decrease) in transpiration and latent heat flux (sensible heat flux) compared to in other simulations from approximately day 160 (early June) through day 270 (mid-October). Importantly, changes in fluxes are only associated with the ROOT experiment, which includes DynaRoot. Transpiration increases in accordance with increased availability of moisture at depth in the ROOT experiment at the forest point (Figs. 3f, top panels, and 4a). This result is in accordance with H3. As there is nearly zero change in canopy or ground evaporation (Figs. 6b and c, left panels), changes in latent heat flux (Fig. 6d, left panels) can be attributed to changes in transpiration that result from the addition of DynaRoot. This is what we expect given that greater plant access to deep moisture should be reflected in transpiration as opposed to surface or canopy evaporation. Importantly, we note that, in the ROOT case, the magnitude of change in surface fluxes increases throughout the dry season and into the transition to the wet season at the forest point.
In contrast to the forest point, the annual mean cycle of dry-season transpiration at the savanna point (Fig. 6a, right panels) shows little change throughout the year in all cases compared to FD. Increases in latent heat flux (Fig. 6d) and decreases in sensible heat flux (Fig. 6e) are highest in the early dry season and predominantly occur in the GW and ROOT cases. Given that there is little change in transpiration at the savanna point, changes in latent heat flux must be attributable to other components of surface evaporation. This is shown by the mean annual cycle of dry-season ground evaporation at the savanna point (Fig. 6c, right panels), which increases early on and evolves similarly to latent heat flux. We speculate that the increase in early dry-season ground evaporation is tied to increases in soil moisture associated with an active GW scheme in the GW and SOIL cases and more uniform (yet shallow) RWU with depth in the ROOT case. Given the shallow root activity profile at the savanna point (Fig. 3g, bottom panels) and the lack of change in dry-season transpiration (Fig. 6a, right panels), we deduce that changes in the surface energy balance are not associated with enhanced uptake as a result of adding DynaRoot. These results support H4.
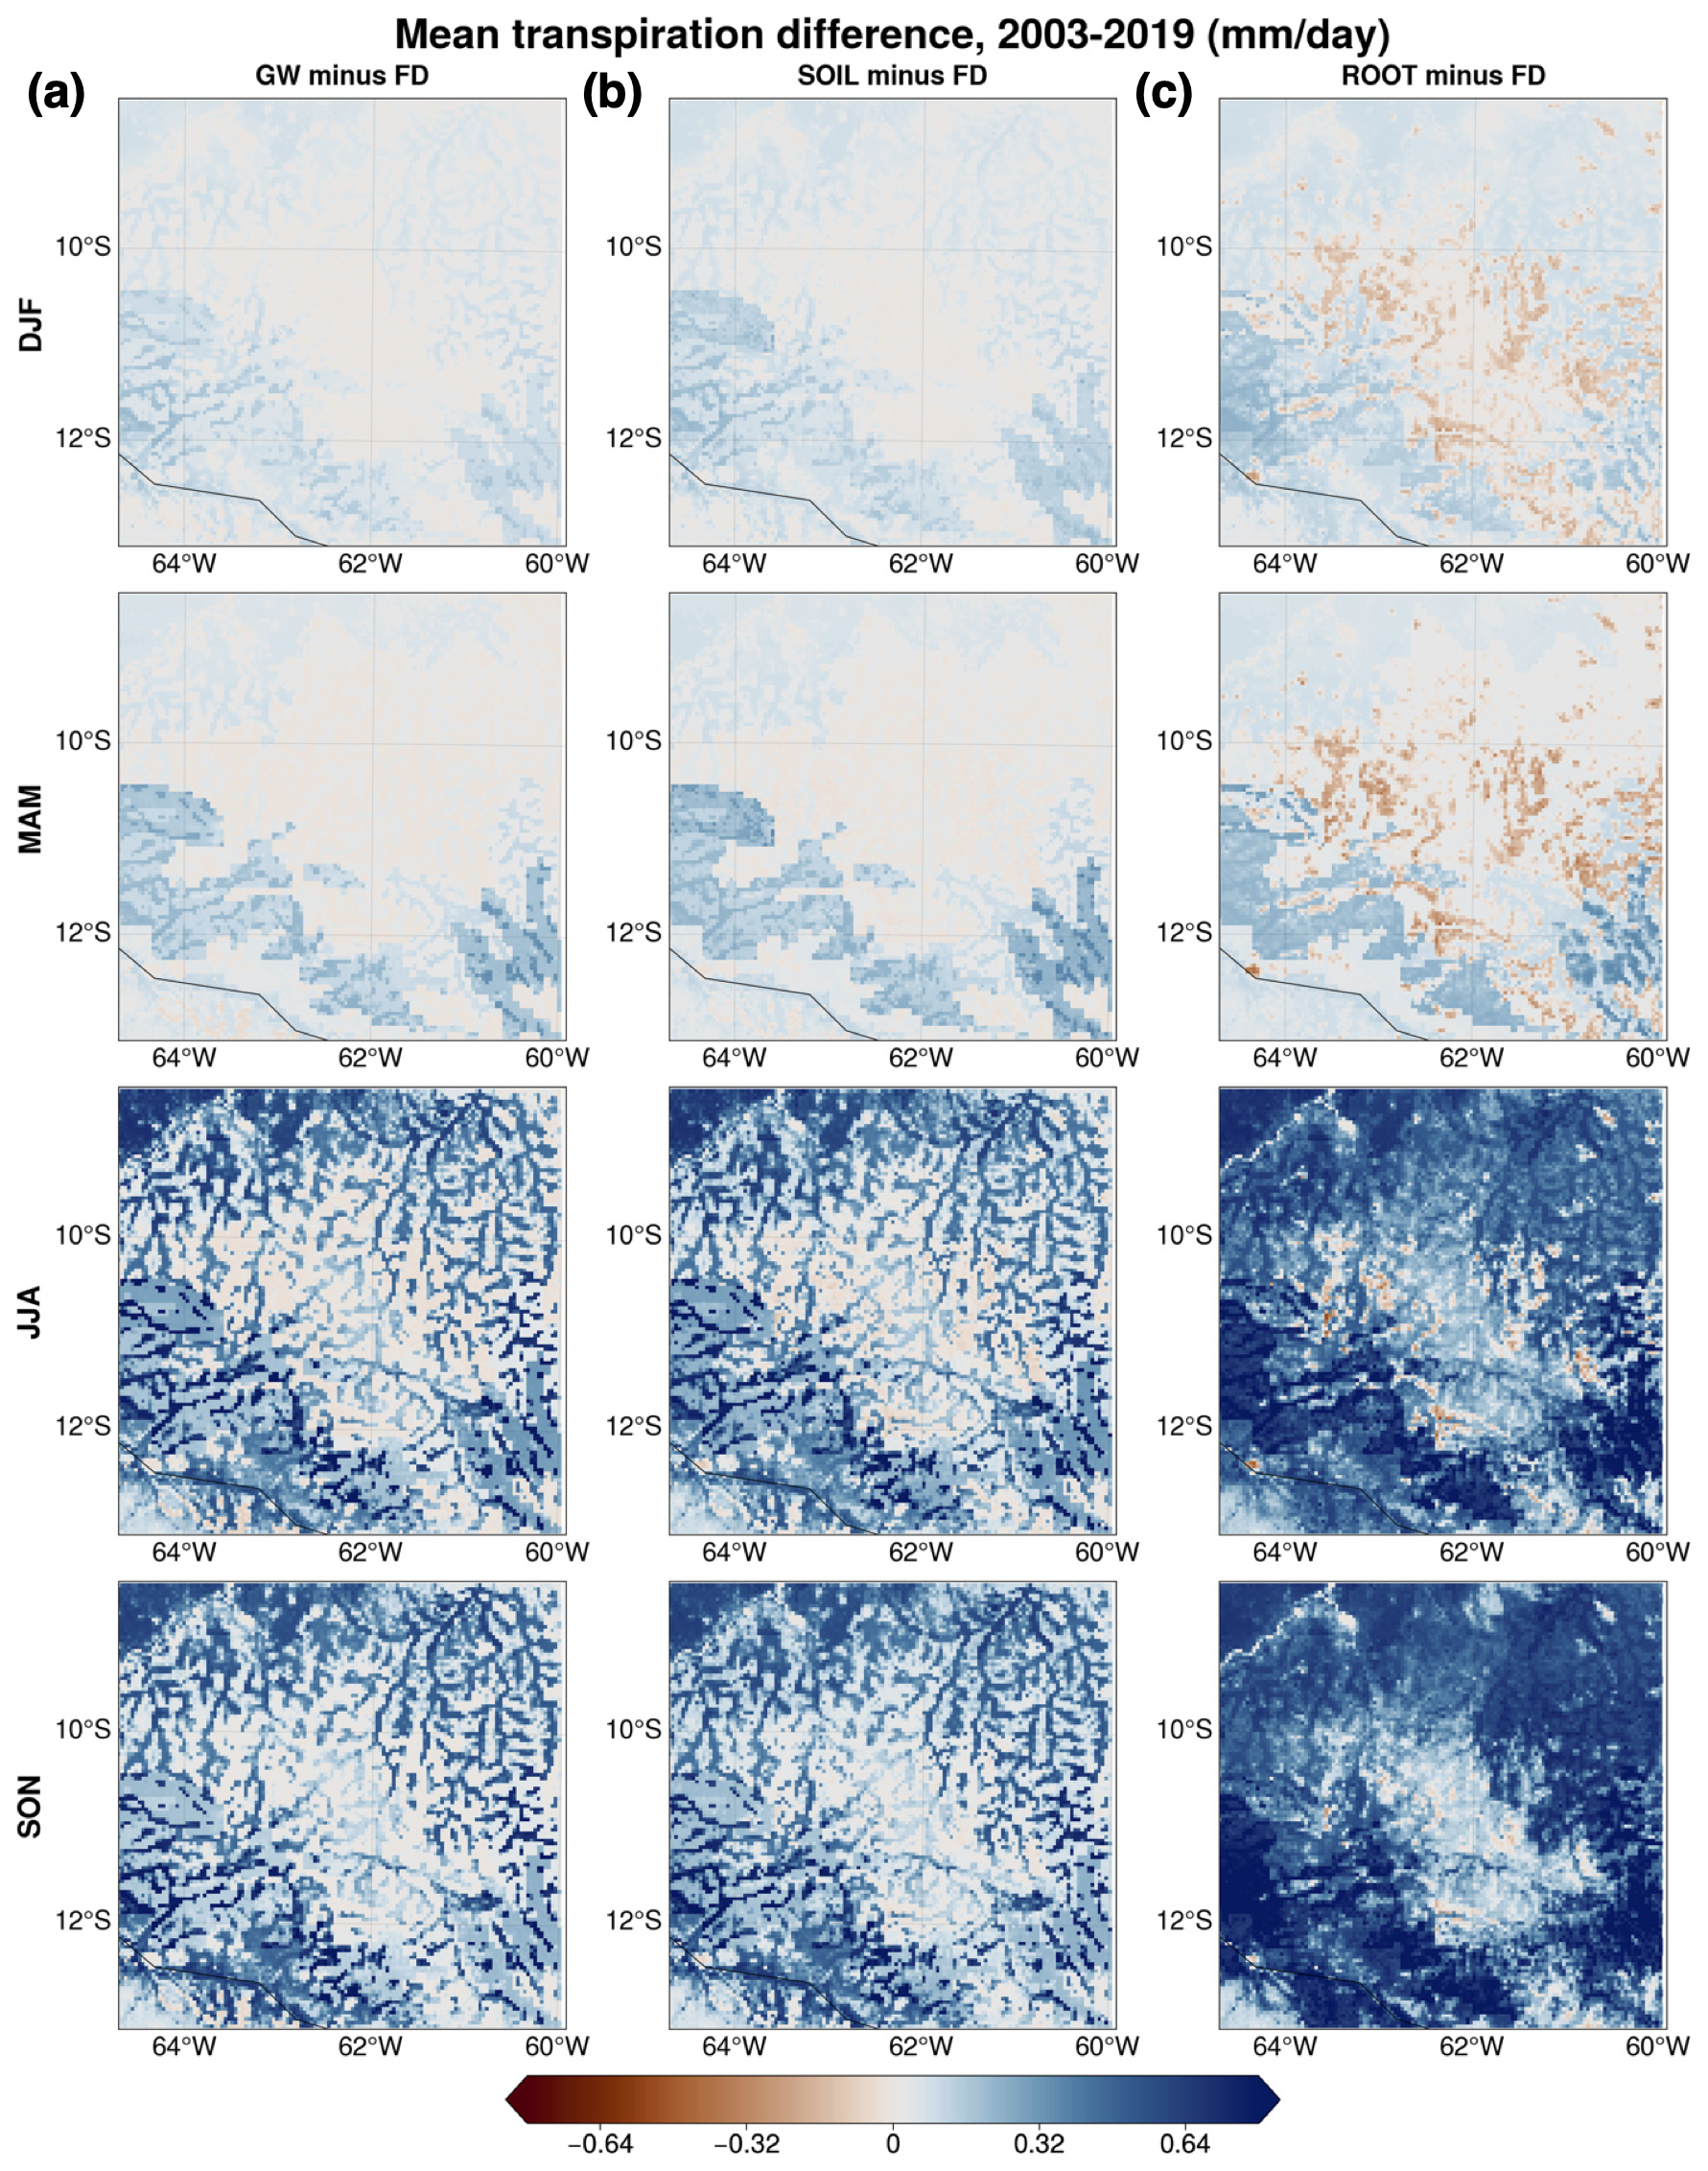
Figure 7Seasonal mean transpiration differences between (a) GW and FD, (b) SOIL and FD, and (c) ROOT and FD.
We present a regional analysis to highlight geographical variations within the domain. Figure 7 depicts the seasonal mean difference in terms of transpiration between FD and all other simulations averaged over all years of model output. As expected from the point analysis, differences are minimal during wetter seasons (DJF and MAM) and largely positive during drier seasons (JJA and SON). In SON, when the greatest difference between runs is calculated, the domain average percent difference between the ROOT and FD experiments is about 29 %, corresponding to an increase in the domain mean transpiration of 0.46 mm d−1. Regarding the spatial distribution of transpiration differences in Fig. 7, there is a visible pattern that is consistent with the mean WTD simulated by the model (Fig. 2). Critically, transpiration differences between GW and FD (Fig. 7a) in JJA and SON are mostly in lower-lying areas, where we expect moisture from groundwater to influence soil moisture and, in turn, transpiration (Miguez-Macho and Fan, 2021). This result supports H1. Transpiration differences between ROOT and FD (Fig. 7c) in JJA and SON are non-negligible in areas with a higher drainage position, suggesting that upland vegetation taps into moisture in the deep vadose zone when DynaRoot is activated. This finding is consistent with H2 and H3. Moreover, differences in transpiration reflect the dominant vegetation cover at each grid point (Fig. 1); differences are generally larger for forested grid points, in agreement with the point analysis and H4.
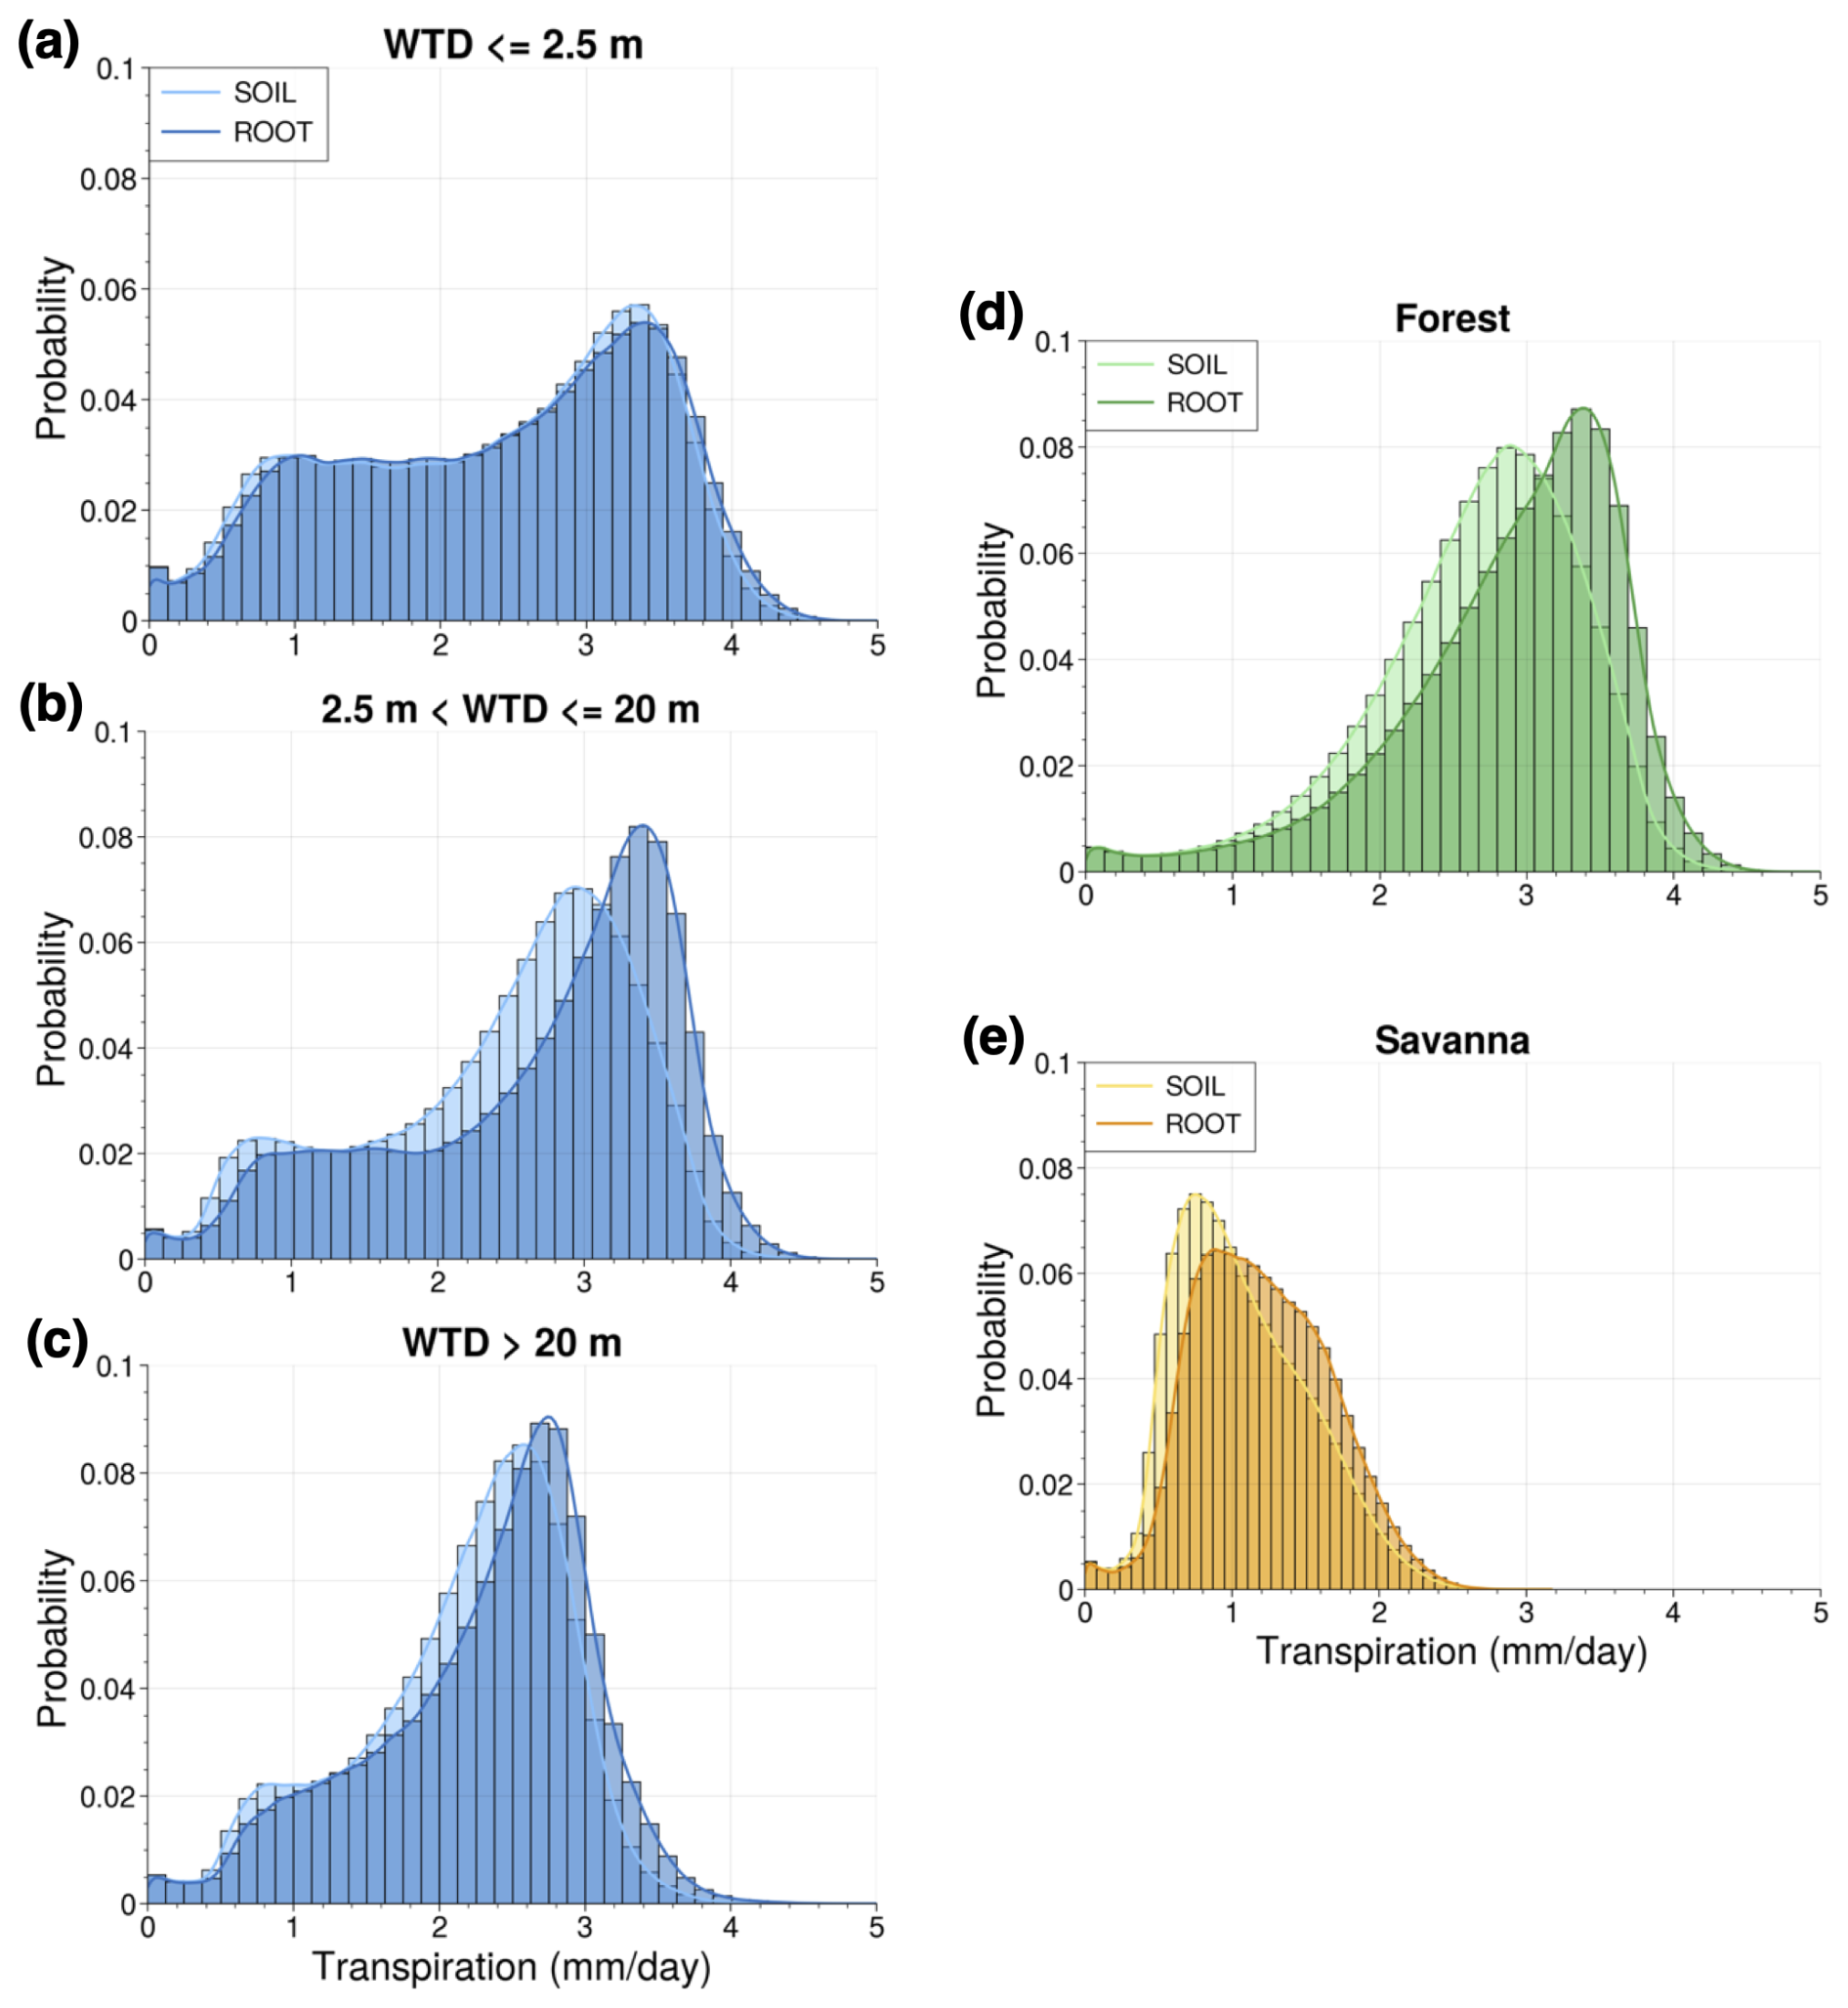
Figure 8Probability density functions depicting distribution of SOIL and ROOT mean dry-season transpiration for different groupings of grid points: (a) points with mean shallow WTD (≤2.5 m) in the dry season, (b) points with mean dry-season WTD between 2.5 and 20 m, (c) points with mean dry-season WTD below 20 m, (d) points with evergreen broadleaf forest dominant vegetation, and (e) points with savanna dominant vegetation.
We calculated probability density functions (PDFs) of mean dry-season transpiration for the simulation with only deep soils (SOIL) and the simulation with deep soils and DynaRoot (ROOT). We analyze points with a mean water table that is 2.5 m or shallower in the dry season, points with a dry-season mean water table between 2.5 and 20 m, and points with a dry-season mean water table below 20 m. These PDFs are shown in Fig. 8. We expect to see the DynaRoot uptake scheme mainly impacting mid-slope (Fig. 8b) and upland points (Fig. 8c) where uptake from the deep vadose zone is important (in accordance with H2). This is indeed what we see in Fig. 8a–c, with the activation of DynaRoot resulting in a more noticeable shift toward higher values of dry-season transpiration in Fig. 8b and c compared to in Fig. 8a. This is particularly true for Fig. 8b, which corresponds to points with a mean dry-season WTD between 2.5 and 20 m.
Additionally, we calculated PDFs of mean dry-season transpiration for points with evergreen broadleaf dominant vegetation (forested) and savanna dominant vegetation (non-forested; Fig. 8d and e). We see a greater impact at forested points where leaf area index (LAI) is higher, and we expect vegetation to be more dependent on deep RWU during the dry season. While there seems to be somewhat of a shift toward higher values of dry-season transpiration for savanna points (Fig. 8e), there is a much clearer shift for forested points (Fig. 8d). This result is supportive of H4.
3.2 Comparison with observation-based ET product
One of the difficulties in evaluating our model results via comparison to observations is the very limited number of eddy covariance observations in the region and the large uncertainties in ET estimates using remote sensing (Baker et al., 2021). As an alternative to validation via direct comparison, we can evaluate how the addition of DynaRoot affects dry-season dynamics when compared to observation-based estimates. Dry-season behavior reflects the resilience of forest vs. savanna vegetation during periods of water stress and can have an important effect on subseasonal surface flux interactions with the overlying atmosphere.
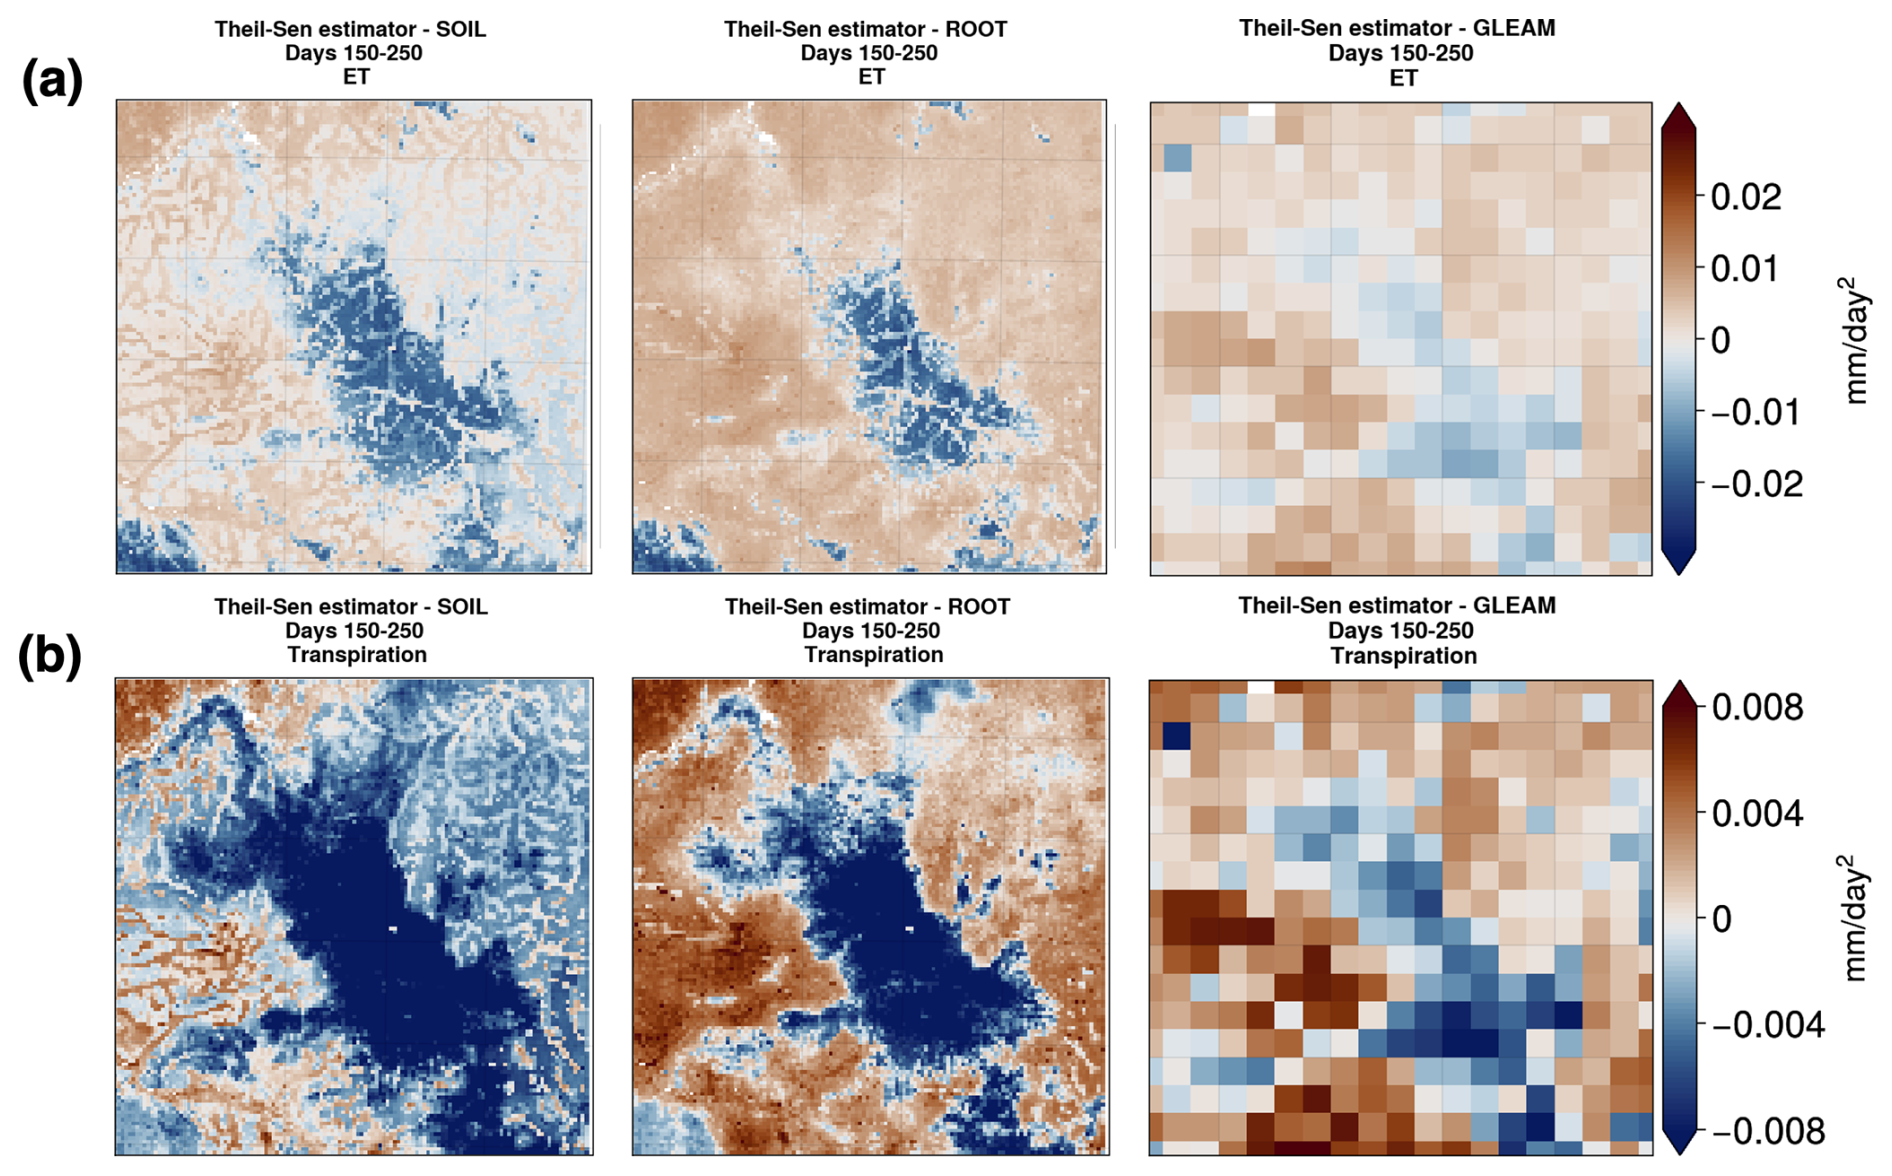
Figure 9(a) Theil–Sen slope for mean ET and (b) transpiration between days 150 and 250 of the year for the SOIL (left panels) and ROOT (middle panels) Noah-MP experiments and GLEAM (right panels) transpiration and ET.
To assess the ability of the modified Noah-MP to represent dry-season transpiration and ET dynamics, we perform a comparison with GLEAM data. In Fig. 9a, we see that the Theil–Sen slope (Theil, 1992; Sen, 1968) for ET is generally negative for non-forested areas with savanna and positive for forested areas with evergreen broadleaf vegetation in Noah-MP. This is especially true in the ROOT experiment. We see that, with the addition of DynaRoot, the sign of the Theil–Sen slope for ET exhibits slightly more agreement with GLEAM than results from the SOIL experiment. To further quantify this, we remapped the Noah-MP and GLEAM ET and transpiration fields to the GLEAM resolution (0.25°), determined the Theil–Sen slopes, and calculated the Pearson correlation coefficient between the SOIL case, ROOT case, and GLEAM. The Pearson correlation with GLEAM increases only slightly between the SOIL and ROOT cases, from 0.586 to 0.588.
Focusing on transpiration in Fig. 9b, we see that, generally speaking, negative Theil–Sen slopes are calculated for model grid points with savanna, and positive slopes are calculated for forested points. Exceptions to this are present in the eastern part of the domain in the SOIL experiment. This is where vegetation is largely classified as evergreen broadleaf forest, but the Theil–Sen slope is generally negative. Comparing with slopes calculated from GLEAM transpiration estimates, we see that results from the ROOT experiment are more in line with observation-based estimates. The Pearson correlation between the SOIL (ROOT) slopes and GLEAM slopes is 0.592 (0.649), further supporting this. Keeping in mind the shallow soil module used to produce the GLEAM estimates, we note that GLEAM values may be lower than if deeper soils were included.
Overall, we can glean something critical from Fig. 9: addition of the DynaRoot uptake scheme results in a dry-season evolution of transpiration that is more in line with observation-based estimates than in a Noah-MP configuration without it. This highlights the role of DynaRoot in realistically simulating dry-season surface flux dynamics at the land–atmosphere interface. Moreover, this result is in support of H3 as we show that the inclusion of deep, dynamic RWU is necessary to realistically model the mean evolution of dry-season transpiration for this domain.
Overall, we find that the results of this work support the hypotheses detailed in the Introduction and are in accordance with previous studies that motivated these hypotheses. These include the study of Fan et al. (2017), which highlighted the importance of groundwater as a moisture source for vegetation during dry periods, and the study of Miguez-Macho and Fan (2021), which clarified that, while moisture from groundwater is important in valleys, deep vadose zone storage of past precipitation is critically important in uplands during dry months. Additionally, the findings of this study are in line with others listed in Table 2, all of which found that the inclusion of deep and/or dynamic RWU in Noah-MP improved model performance (Gayler et al., 2014; Wang et al., 2018; Liu et al., 2020; Niu et al., 2020; Li et al., 2021). In particular, Niu et al. (2020) and Li et al. (2021) noted improvements in Noah-MP's performance during drier periods after enhancements were made. The study of Zanin (2021) is the only study in Table 2 that focused on the Amazon region and included the domain for this study. They compared their model results to flux tower data from the LBA project. Similarly to our work, they found changes in the seasonality of soil moisture in shallow and deep layers resulting from the addition of deep RWU. While simulation of sensible heat flux improved in Zanin (2021) when deep RWU was activated, latent heat flux was overestimated. However, the seasonality of evapotranspiration was reduced.
The results of this work reflect an advancement in the representation of the link between subsurface and atmospheric fluxes of moisture via RWU in the offline configuration of Noah-MP. To demonstrate this, we focus on a region centered on the state of Rondônia in the southern Amazon. The structure of the model in its default state made it impossible to represent time-varying moisture uptake from subsurface sources below 2 m depth, a critical source of dry-season moisture in southern Amazon forests. Now, we have a way of representing the seasonal reliance of vegetation on deep RWU. Moreover, with the availability of an active groundwater scheme in Noah-MP, we can study the interplay between groundwater, soil moisture, roots, and land surface fluxes. This allows us to more fully resolve moisture pathways from the subsurface to the atmosphere, enabling future studies that continue to investigate the role of deep RWU in modulating vegetation water stress and in determining atmospheric moisture availability. This is especially important as the Amazon is projected to experience drier conditions in the future as a result of climate change (Joetzjer et al., 2013), and the ecosystem's drought resilience may be at risk (Chen et al., 2024).
Additionally, in this work, we have described an approach to account for variations in soil properties with depth. Such properties are constant through the soil profile in the unmodified Noah-MP unless the user provides input soil texture data for each layer. We incorporate exponential decay functions that describe changes in soil properties with depth without the need for additional user-provided data. This enhances the realism of the model with minimal overhead and facilitates simulations with additional deep soil layers.
We focus on the Amazon region in this work because of its critical importance for global climate (Werth and Avissar, 2002; Liu et al., 2023). However, our modified model would be useful in simulating any ecosystem where vegetation has adapted to periodic water stress. The simplicity of DynaRoot is ideal for coupling with atmospheric models with high computational overheads such as the WRF, providing a realistic approach to accounting for critical land surface and subsurface processes in a coupled land–atmosphere modeling framework without added parameters or calibration.
We note that the DynaRoot uptake scheme does not consider the role of carbon availability in determining RWU depth and the presence of roots; rather, it depends solely on the soil water profile. While the role of carbon is certainly relevant to studies focused on directly simulating root growth based on principles of plant physiology and resource acquisition, here, we focus on hydrologically based rooting depth, allowing the soil water profile to drive root growth. This is sufficient for the scope of our work without the use of an active dynamic vegetation module that would predict resource-based rooting growth. We elect to run simulations without such a module in the interest of minimizing complexity and computational cost.
5.1 Summary of findings
This work details the implementation of a deep, dynamic RWU scheme known as DynaRoot in the Noah-MP land surface model. The conceptual details of this scheme are outlined in Fan et al. (2017). DynaRoot makes it possible to capture deep, dynamic RWU based on the local soil water profile, which was not previously possible in Noah-MP. Additionally, DynaRoot allows us to obtain a measure of rooting depth based on the depth of RWU. In addition to implementing DynaRoot, we enhanced other parts of Noah-MP, including the addition of eight resolved soil layers and varying soil properties with depth.
Previous studies have illustrated the crucial reliance of Amazonian forests on deep RWU via observational (Nepstad et al., 1994; Bruno et al., 2006; Broedel et al., 2017) and modeling-based (Kleidon and Heimann, 2000; Markewitz et al., 2010) methods, supporting our focus on this region in this work. We completed several offline Noah-MP simulations for a domain in the southern Amazon. These cases include an out-of-the-box unmodified Noah-MP case with free drainage (FD), which acts as a control configuration; an unmodified Noah-MP case with a groundwater scheme activated (GW); a modified Noah-MP case with additional resolved soil layers and soil properties that vary with depth (SOIL); and a modified Noah-MP case identical to SOIL but with the DynaRoot uptake scheme activated (ROOT). Each case facilitates the testing of a different hypothesis. Our main findings are listed below:
-
At the savanna point, capillary rise in the vicinity of the water table is simulated. Mean root activity indicates uptake sourced from the capillary fringe, consistently with H1. RWU predominantly occurs in shallower layers and is maximized early in the dry season.
-
At the forest point, RWU shifts to the deep vadose zone during the dry season, supporting H2, H3, and H4. The seasonal cycle of RWU indicates deeper RWU at the forest point during the dry season compared to at the savanna point, further supporting H4.
-
Dry-season transpiration and latent heat flux (sensible heat flux) increase (decreases) as a result of adding DynaRoot, signifying a change in surface energy flux partitioning. Changes in latent heat flux at the forest point are mostly accounted for by changes in transpiration, while changes in latent heat flux at the savanna point are accounted for by changes in ground evaporation that are likely to be unrelated to deep RWU. Changes in surface fluxes are in accordance with H3 and H4.
-
The domain-averaged increase in transpiration between the ROOT and FD experiments is about 29 %, corresponding to an increase in transpiration of 0.46 mm d−1.
Comparison of our simulation results with GLEAM remote-sensing-based estimates of dry-season moisture fluxes for the domain reveal that the dry-season temporal evolution of transpiration in forested areas agrees better with GLEAM in the ROOT case (DynaRoot activated) compared to in the SOIL case (DynaRoot not activated). These results confirm the value of our Noah-MP modifications in realistically capturing seasonal moisture flux dynamics at the land–atmosphere interface in an ecosystem that is dependent on deep RWU to buffer rainfall deficits. Moreover, the results of this comparison provide further support for H3.
5.2 Significance and future work
Critically, the changes to Noah-MP outlined in this work mean we now have a numerical model that can capture the spectrum of interactions from groundwater through deep soil and plant roots to the atmosphere via transpiration. To our knowledge, no existing land–atmosphere modeling framework includes a sufficient representation of all of these components to capture the influence of groundwater and the local soil moisture profile on rooting depth for convection-resolving simulations. We plan to implement our enhancements in the community version of Noah-MP to facilitate access to the DynaRoot scheme within the larger land–atmosphere modeling community. In the meantime, access to the version of the model used for this study is provided in an online repository (see the “Code and data availability” section below).
Noah-MP with DynaRoot enabled can be used to investigate a number of different scientific questions with wide-ranging implications. Given the role of plant trait diversity in the resilience of the Amazon as studied by Sakschewski et al. (2016) and the identification of deep rooting as a drought resilience strategy by Chen et al. (2024), DynaRoot could be used to study changes in forest resilience under deforestation scenarios. Moreover, given that moisture varies slowly in subsurface soils (Amenu et al., 2005), DynaRoot makes it possible to characterize the role of deep soil moisture memory in influencing surface moisture via transpiration in a coupled land–atmosphere framework. Such research has been alluded to in Niu et al. (2020) and Zanin (2021) and could have implications for the predictability of atmospheric moisture on longer timescales. Dominguez et al. (2024) discuss two multidecadal convection-permitting simulations that were completed for the entire South American continent. In their analysis of these runs, Zilli et al. (2024) identified land–atmosphere coupling in CPMs as an outstanding area of investigation. This motivates potential future work that focuses on the role of fine-scale land surface characteristics – such as water table depth and vegetation traits (including rooting depth) – in simulating convection. DynaRoot would be applicable in such work, particularly in global convection-permitting simulations that have become a priority in the climate modeling community (Satoh et al., 2019; Caldwell et al., 2021; Feng et al., 2023).
Future work will focus on further validating these efforts by comparing modeled root depth with remote-sensing-based root depth estimates, which offer more spatiotemporal coverage than in situ data. An additional goal in the future is to complete coupled Noah-MP and WRF simulations that will allow us to investigate some of the scientific questions mentioned in the previous paragraph. As we strive to understand the state of our changing world, it is more imperative than ever to adequately characterize vegetation and its influence on hydroclimate in critical ecosystems such as the Amazon.
Initial soil moisture values for layers 5 through 12 were derived using a formulation of the Richards equation describing water flow in unsaturated soils:
where qj is the flux of water between a soil layer j and the layer below it j+1, is saturated soil hydraulic diffusivity, θj is soil moisture in soil layer j, Δzj is the thickness of soil layer j, is saturated hydraulic conductivity, is soil moisture at saturation, and b is the Clapp–Hornberger exponent corresponding to the grid point dominant soil type (Clapp and Hornberger, 1978). We assume qj to be zero at the initial time step for simplicity.
Equilibrium WTD, which is sourced from the input file generated by the WPS, is used for the initial WTD values. The details of how the equilibrium WTD data were created can be found in Fan et al. (2007). Given the equilibrium WTD at a given grid point, we can infer θj at each layer by starting at the layer j+1 with the water table and iterating upward. θj+1 can be determined by considering equilibrium soil moisture (soil moisture corresponding to the scenario in which the water table is located exactly at the bottom of the soil layer, as previously calculated in the model) and :
where zj and zj+1 are the depths of soil layers j and j+1. From there, θj can be estimated by solving Eq. (A1) iteratively using the Newton–Raphson method, a numerical method that solves for the root of a well-behaved function (Press et al., 1992). In the next iteration, θj replaces θj+1, and the new θj corresponds to the next layer (moving upward). This continues until initial soil moisture values for remaining layers (until the fourth layer) are calculated.
Initial soil temperature values were obtained by means of linear interpolation. Initial values for the first four layers were provided by the WPS input file, as well as a deep soil temperature initialization value corresponding to 8 m depth. We took this value to be representative of 20 m depth (the bottom of the soil column in our modified Noah-MP simulations; Fei Chen, personal communication, 16 August 2021) and estimated initial values for soil temperature in the additional layers based on this value and the initial value at the fourth layer (2 m depth).
The version of HRLDAS Noah-MP used in this study is available at https://doi.org/10.5281/zenodo.13137184 (Bieri et al., 2025a). The model configuration, input, and forcing files are available at https://doi.org/10.5281/zenodo.13061969 (Bieri et al., 2025). The scripts used to process, analyze, and the plot model and observation-based data are available at https://doi.org/10.5281/zenodo.13137807 (Bieri et al., 2025b). HRLDAS Noah-MP model outputs from this study are provided at https://doi.org/10.13012/B2IDB-8777292_V1 (Bieri et al., 2025c).
The atmospheric forcing data used for the model simulations in this study are publicly available online. GLDAS data are available from Rodell et al. (2004) and Beaudoing et al. (2020) (https://doi.org/10.5067/E7TYRXPJKWOQ). IMERG data are available from Huffman et al. (2023) (https://doi.org/10.5067/GPM/IMERG/3B-HH/07). Static input data used for the model simulations are available at Skamarock et al. (2019) (https://doi.org/10.5065/1dfh-6p97). The base HRLDAS Noah-MP source code and documentation are available at Niu et al. (2011) and Chen et al. (2007). The WPS source code and documentation are available at Skamarock et al. (2019) (https://doi.org/10.5065/1dfh-6p97). GLEAM ET and transpiration data used in this study are available at Martens et al. (2017) and Miralles et al. (2011). The Amazon basin shapefile used to generate Fig. 1 is available at https://github.com/gamamo/AmazonBasinLimits (AmazonBasinLimits, 2017).
CAB prepared the paper with contributions from all of the co-authors. CAB carried out the Noah-MP code modifications with contributions from GMM. The DynaRoot scheme was developed by YF and GMM. CAB completed the simulations and analyses with contributions from FD. FD, YF, and GMM were responsible for the conceptualization of the study. FD supervised the execution of the study and the preparation of the paper.
The contact author has declared that none of the authors has any competing interests.
The contents of this publication are solely the responsibility of the authors and do not necessarily represent the official views of the Fulbright Program, the Government of the United States, or the US–Spain Fulbright Commission.
Publisher's note: Copernicus Publications remains neutral with regard to jurisdictional claims made in the text, published maps, institutional affiliations, or any other geographical representation in this paper. While Copernicus Publications makes every effort to include appropriate place names, the final responsibility lies with the authors.
The HRLDAS modeling system was developed at the National Center for Atmospheric Research (NCAR). NCAR is sponsored by the United States National Science Foundation. The authors are grateful for the helpful comments on the manuscript provided by the two reviewers.
This material is based upon work supported by the National Science Foundation under grant nos. 1852707 and 1852709. Any opinions, findings, and conclusions or recommendations expressed in this material are those of the author(s) and do not necessarily reflect the views of the National Science Foundation. Carolina A. Bieri received financial support for this research from the Fulbright US Student Program, which is sponsored by the US Department of State and the US–Spain Fulbright Commission. Carolina A. Bieri received financial support from the Alfred P. Sloan Foundation's Minority PhD Program.
This paper was edited by Hans Verbeeck and reviewed by Paulo Zanin and one anonymous referee.
AmazonBasinLimits: GitHub [data set], https://github.com/gamamo/AmazonBasinLimits (last access: 20 July 2024), 2017. a
Amenu, G. G., Kumar, P., and Liang, X.-Z.: Interannual variability of deep-layer hydrologic memory and mechanisms of its influence on surface energy fluxes, J. Climate, 18, 5024–5045, https://doi.org/10.1175/JCLI3590.1, 2005. a
Baker, I. T., Prihodko, L., Denning, A. S., Goulden, M., Miller, S., and da Rocha, H. R.: Seasonal drought stress in the amazon: Reconciling models and observations, J. Geophys. Res.-Biogeo., 113, G00B01, https://doi.org/10.1029/2007JG000644, 2009. a, b
Baker, J. C., Garcia-Carreras, L., Gloor, M., Marsham, J. H., Buermann, W., da Rocha, H. R., Nobre, A. D., de Araujo, A. C., and Spracklen, D. V.: Evapotranspiration in the Amazon: spatial patterns, seasonality, and recent trends in observations, reanalysis, and climate models, Hydrol. Earth Syst. Sci., 25, 2279–2300, https://doi.org/10.5194/hess-25-2279-2021, 2021. a, b
Ball, J. T., Woodrow, I. E., and Berry, J. A.: A model predicting stomatal conductance and its contribution to the control of photosynthesis under different environmental conditions, in: Progress in photosynthesis research: Volume 4 Proceedings of the VIIth International Congress on Photosynthesis, Providence, 10–15 August 1986, Rhode Island, USA, Springer, 221–224, https://doi.org/10.1007/978-94-017-0519-6_48, 1987. a
Balsamo, G., Pappenberger, F., Dutra, E., Viterbo, P., and Van den Hurk, B.: A revised land hydrology in the ECMWF model: A step towards daily water flux prediction in a fully-closed water cycle, Hydrol. Process., 25, 1046–1054, https://doi.org/10.1002/hyp.7808, 2011. a
Bao, J., Stevens, B., Kluft, L., and Muller, C.: Intensification of daily tropical precipitation extremes from more organized convection, Sci. Adv., 10, eadj6801, https://doi.org/10.1126/sciadv.adj6801, 2024. a
Barlage, M., Tewari, M., Chen, F., Miguez-Macho, G., Yang, Z.-L., and Niu, G.-Y.: The effect of groundwater interaction in North American regional climate simulations with WRF/Noah-MP, Climatic Change, 129, 485–498, https://doi.org/10.1007/s10584-014-1308-8, 2015. a, b
Barlage, M., Chen, F., Rasmussen, R., Zhang, Z., and Miguez-Macho, G.: The importance of scale-dependent groundwater processes in land-atmosphere interactions over the central United States, Geophys. Res. Lett., 48, e2020GL092171, https://doi.org/10.1029/2020GL092171, 2021. a, b, c
Batelis, S.-C., Rahman, M., Kollet, S., Woods, R., and Rosolem, R.: Towards the representation of groundwater in the Joint UK Land Environment Simulator, Hydrol. Process., 34, 2843–2863, https://doi.org/10.1002/hyp.13767, 2020. a
Beaudoing, H., Rodell, M., and NASA/GSFC/HSL: GLDAS Noah Land Surface Model L4 3 hourly 0.25×0.25 degree, Version 2.1, Goddard Earth Sciences Data and Information Services Center [data set], https://doi.org/10.5067/E7TYRXPJKWOQ, 2020. a, b, c
Best, M. J., Pryor, M., Clark, D. B., Rooney, G. G., Essery, R. L. H., Ménard, C. B., Edwards, J. M., Hendry, M. A., Porson, A., Gedney, N., Mercado, L. M., Sitch, S., Blyth, E., Boucher, O., Cox, P. M., Grimmond, C. S. B., and Harding, R. J.: The Joint UK Land Environment Simulator (JULES), model description – Part 1: Energy and water fluxes, Geosci. Model Dev., 4, 677–699, https://doi.org/10.5194/gmd-4-677-2011, 2011. a
Bieri, C. A., Dominguez, F., Miguez-Macho, G., and Fan, Y.: Model configuration files and forcing data for Implementing deep soil and dynamic root uptake in Noah-MP (v4.5): impact on Amazon dry-season transpiration, Zenodo [data set], https://doi.org/10.5281/zenodo.13061969, 2024. a
Bieri, C. A., Dominguez, F., Miguez-Macho, G., and Fan, Y.: DynaRoot Noah-MP, Zenodo [code], https://doi.org/10.5281/zenodo.13137184, 2025a. a
Bieri, C. A., Dominguez, F., Miguez-Macho, G., and Fan, Y.: Analysis scripts for Implementing deep soil and dynamic root uptake in Noah-MP (v4.5): impact on Amazon dry-season transpiration, Zenodo [code], https://doi.org/10.5281/zenodo.13137807, 2025b. a
Bieri, C. A., Dominguez, F., Miguez-Macho, G., and Fan, Y.: Data for Implementing Deep Soil and Dynamic Root Uptake in Noah-MP (v4.5): Impact on Amazon Dry-Season Transpiration, University of Illinois Urbana-Champaign [data set], https://doi.org/10.13012/B2IDB-8777292_V1, 2025c. a
Bisht, G., Riley, W. J., Hammond, G. E., and Lorenzetti, D. M.: Development and evaluation of a variably saturated flow model in the global E3SM Land Model (ELM) version 1.0, Geosci. Model Dev., 11, 4085–4102, https://doi.org/10.5194/gmd-11-4085-2018, 2018. a
Broedel, E., Tomasella, J., Cândido, L. A., and von Randow, C.: Deep soil water dynamics in an undisturbed primary forest in central Amazonia: Differences between normal years and the 2005 drought, Hydrol. Process., 31, 1749–1759, https://doi.org/10.1002/hyp.11143, 2017. a, b, c, d, e
Bruno, R. D., da Rocha, H. R., De Freitas, H. C., Goulden, M. L., and Miller, S. D.: Soil moisture dynamics in an eastern Amazonian tropical forest, Hydrol. Process., 20, 2477–2489, https://doi.org/10.1002/hyp.6211, 2006. a, b, c, d
Caldwell, P. M., Terai, C. R., Hillman, B., Keen, N. D., Bogenschutz, P., Lin, W., Beydoun, H., Taylor, M., Bertagna, L., Bradley, A. M., Clevenger, T. C., Donahue, A. S., Eldred, C., Foucar, J., Golaz, J.-C., Guba, O., Jacob, R., Johnson, J., Krishna, J., Liu, W., Pressel, K., Salinger, A. G., Singh, B., Steyer, A., Ullrich, P., Wu, D., Yuan, X., Shpund, J., Ma, H.-Y., and Zender, C. S.: Convection-permitting simulations with the E3SM global atmosphere model, J. Adv. Model. Earth Syst., 13, e2021MS002544, https://doi.org/10.1029/2021MS002544, 2021. a, b
Canadell, J., Jackson, R. B., Ehleringer, J., Mooney, H. A., Sala, O. E., and Schulze, E.-D.: Maximum rooting depth of vegetation types at the global scale, Oecologia, 108, 583–595, https://doi.org/10.1007/BF00329030, 1996. a
Chen, F., Manning, K. W., Lemone, M. A., Trier, S. B., Alfieri, J. G., Roberts, R., Tewari, M., Niyogi, D., Horst, T. W., Oncley, S. P., Basara, J. B., and Blanken, P. D.: Description and evaluation of the characteristics of the NCAR high-resolution land data assimilation system, J. Appl. Meteorol. Clim., 46, 694–713, https://doi.org/10.1175/JAM2463.1, 2007. a, b
Chen, S., Stark, S. C., Nobre, A. D., Cuartas, L. A., de Jesus Amore, D., Restrepo-Coupe, N., Smith, M. N., Chitra-Tarak, R. and Ko, H., Nelson, B. W., and Saleska, S. R.: Amazon forest biogeography predicts resilience and vulnerability to drought, Nature, 631, 111–117, https://doi.org/10.1038/s41586-024-07568-w, 2024. a, b
Christoffersen, B. O., Restrepo-Coupe, N., Arain, M. A., Baker, I. T., Cestaro, B. P., Ciais, P., Fisher, J. B., Galbraith, D., Guan, X., Gulden, L., van den Hurk, B., Ichii, K., Imbuzeiro, H., Jain, A., Levine, N., Miguez-Macho, G., Poulter, B., Roberti, D. R., Sakaguchi, K., Sahoo, A., Schaefer, K., Shi, M., Verbeeck, H., Yang, Z. L., Araújo, A. C., Kruijt, B., Manzi, A. O., da Rocha, H. R., von Randow, C., Muza, M. N., Borak, J., Costa, M. H., de Gonçalves, L. G. G., Zeng, X., and Saleska, S. R.: Mechanisms of water supply and vegetation demand govern the seasonality and magnitude of evapotranspiration in Amazonia and Cerrado, Agr. Forest Meteorol., 191, 33–50, https://doi.org/10.1016/j.agrformet.2014.02.008, 2014. a
Clapp, R. B. and Hornberger, G. M.: Empirical equations for some soil hydraulic properties, Water Resour. Res., 14, 601–604, https://doi.org/10.1029/WR014i004p00601, 1978. a, b
Computational and Information Systems Laboratory: Derecho: HPE Cray EX System (University Community Computing), https://doi.org/10.5065/qx9a-pg09, 2024. a
Cusack, D. F., Christoffersen, B., Smith-Martin, C. M., Andersen, K. M., Cordeiro, A. L., Fleischer, K., Wright, S. J., Guerrero-Ramírez, N. R., Lugli, L. F., McCulloch, L. A., Sanchez-Julia, M., Batterman, S. A., Dallstream, C., Fortunel, C., Toro, L., Fuchslueger, L., Wong, M. Y., Yaffar, D., Fisher, J. B., Arnaud, M., Dietterich, L. H., Addo-Danso, S. D., Valverde-Barrantes, O. J., Weemstra, M., Ng, J. C., and Norby, R. J.: Toward a coordinated understanding of hydro-biogeochemical root functions in tropical forests for application in vegetation models, New Phytol., 242, 351–371, https://doi.org/10.1111/nph.19561, 2024. a
Davidson, E., Lefebvre, P. A., Brando, P. M., Ray, D. M., Trumbore, S. E., Solorzano, L. A., Ferreira, J. N., Bustamante, M. M. d. C., and Nepstad, D. C.: Carbon inputs and water uptake in deep soils of an eastern Amazon forest, Forest Sci., 57, 51–58, https://doi.org/10.1093/forestscience/57.1.51, 2011. a, b, c, d
Dominguez, F., Eiras-Barca, J., Yang, Z., Bock, D., Nieto, R., and Gimeno, L.: Amazonian Moisture Recycling Revisited Using WRF With Water Vapor Tracers, J. Geophys. Res.-Atmos., 127, e2021JD035259, https://doi.org/10.1029/2021JD035259, 2022. a
Dominguez, F., Rasmussen, R., Liu, C., Ikeda, K., Prein, A., Varble, A., Arias, P. A., Bacmeister, J., Bettolli, M. L., Callaghan, P., Carvalho, L. M. V., Castro, C. L., Chen, F., Chug, D., Chun, K. P., Dai, A., Danaila, L., da Rocha, R. P., Nascimento, E. D. L., Dougherty, E., Dudhia, J., Eidhammer, T., Feng, Z., Fita, L., Fu, R., Giles, J., Gilmour, H., Halladay, K., Huang, Y., Iza Wong, A. M., Lagos-Zúñiga, M. Á., Jones, C., Llamocca, J., Llopart, M., Martinez, J. A., Martinez, J. C., Minder, J. R., Morrison, M., Moon, Z. L., Mu, Y., Neale, R. B., Núñez Ocasio, K. M., Pal, S., Potter, E., Poveda, G., Puhales, F., Rasmussen, K. L., Rehbein, A., Rios-Berrios, R., Risanto, C. B., Rosales, A., Scaff, L., Seimon, A., Somos-Valenzuela, M., Tian, Y., Van Oevelen, P., Veloso-Aguila, D., Xue, L., and Schneider, T.: Advancing South American Water and Climate Science through Multidecadal Convection-Permitting Modeling, B. Am. Meteorol. Soc., 105, E32–E44, https://doi.org/10.1175/BAMS-D-22-0226.1, 2024. a, b
Drewniak, B. A.: Simulating dynamic roots in the energy exascale earth system land model, J. Adv. Model. Earth Syst., 11, 338–359, https://doi.org/10.1029/2018MS001334, 2019. a
ECMWF: IFS Documentation CY48R1 – Part IV: Physical Processes, ECMWF, https://doi.org/10.21957/02054f0fbf, 2023. a
Eyring, V., Bony, S., Meehl, G. A., Senior, C. A., Stevens, B., Stouffer, R. J., and Taylor, K. E.: Overview of the Coupled Model Intercomparison Project Phase 6 CMIP6) experimental design and organization, Geosci. Model Dev., 9, 1937–1958, https://doi.org/10.5194/gmd-9-1937-2016, 2016. a
Fan, Y., Miguez-Macho, G., Weaver, C. P., Walko, R., and Robock, A.: Incorporating water table dynamics in climate modeling: 1. Water table observations and equilibrium water table simulations, J. Geophys. Res.-Atmos., 112, D10125, https://doi.org/10.1029/2006JD008111, 2007. a, b, c, d
Fan, Y., Li, H., and Miguez-Macho, G.: Global patterns of groundwater table depth, Science, 339, 940–943, 2013. a
Fan, Y., Miguez-Macho, G., Jobbágy, E. G., Jackson, R. B., and Otero-Casal, C.: Hydrologic regulation of plant rooting depth, P. Natl. Acad. Sci. USA, 114, 10572–10577, https://doi.org/10.1073/pnas.1712381114, 2017. a, b, c, d, e, f, g, h, i, j, k
FAO/UNESCO: The FAO-UNESCO Soil Map of the World, https://www.fao.org/soils-portal/data-hub/soil-maps-and-databases/faounesco-soil-map-of-the-world/en/ (last access: 20 July 2024), 1971. a
Feddes, R. A., Hoff, H., Bruen, M., Dawson, T., de Rosnay, P., Dirmeyer, P., Jackson, R. B., Kabat, P., Kleidon, A., Lilly, A., and Pitman, A. J.: Modeling root water uptake in hydrological and climate models, B. Am. Meteorol. Soc., 82, 2797–2810, https://doi.org/10.1175/1520-0477(2001)082<2797:MRWUIH>2.3.CO;2, 2001. a
Feng, Z., Leung, L. R., Hardin, J., Terai, C. R., Song, F., and Caldwell, P.: Mesoscale convective systems in DYAMOND global convection-permitting simulations, Geophys. Res. Lett., 50, e2022GL102603, https://doi.org/10.1029/2022GL102603, 2023. a
Fersch, B., Senatore, A., Adler, B., Arnault, J., Mauder, M., Schneider, K., Völksch, I., and Kunstmann, H.: High-resolution fully coupled atmospheric–hydrological modeling: a cross-compartment regional water and energy cycle evaluation, Hydrol. Earth Syst. Sci., 24, 2457–2481, https://doi.org/10.5194/hess-24-2457-2020, 2020. a
Gash, J. and Nobre, C.: Climatic effects of Amazonian deforestation: Some results from ABRACOS, B. Am. Meteorol. Soc., 78, 823–830, https://doi.org/10.1175/1520-0477(1997)078<0823:CEOADS>2.0.CO;2, 1997. a
Gayler, S., Wöhling, T., Grzeschik, M., Ingwersen, J., Wizemann, H.-D., Warrach-Sagi, K., Högy, P., Attinger, S., Streck, T., and Wulfmeyer, V.: Incorporating dynamic root growth enhances the performance of Noah-MP at two contrasting winter wheat field sites, Water Resour. Res., 50, 1337–1356, https://doi.org/10.1002/2013WR014634, 2014. a, b
Gilbert, R. O.: Statistical methods for environmental pollution monitoring, John Wiley & Sons, ISBN 978-0-471-28878-7, 1987. a
Golaz, J.-C., Van Roekel, L. P., Zheng, X., Roberts, A. F., Wolfe, J. D., Lin, W., Bradley, A. M., Tang, Q., Maltrud, M. E., Forsyth, R. M., Zhang, C., Zhou, T., Zhang, K., Zender, C. S., Wu, M., Wang, H., Turner, A. K., Singh, B., Richter, J. H., Qin, Y., Petersen, M. R., Mametjanov, A., Ma, P.-L., Larson, V. E., Krishna, J., Keen, N. D., Jeffery, N. and Hunke, E. C., Hannah, W. M., Guba, O., Griffin, B. M., Feng, Y., Engwirda, D., Di Vittorio, A. V., Dang, C., Conlon, L. M., Chen, C.-C.-J., Brunke, M. A., Bisht, G., Benedict, J. J., Asay-Davis, X. S., Zhang, Y., Zhang, M., Zeng, X., Xie, S., Wolfram, P. J., Vo, T., Veneziani, M., Tesfa, T. K., Sreepathi, S., Salinger, A. G., Reeves Eyre, J. E. J., Prather, M. J., Mahajan, S., Li, Q., Jones, P. W., Jacob, R. L., Huebler, G. W., Huang, X., Hillman, B. R., Harrop, B. E., Foucar, J. G., Fang, Y., Comeau, D. S., Caldwell, P. M., Bartoletti, T., Balaguru, K., Taylor, M. A., McCoy, R. B., Leung, L. R., and Bader, D. C.: The DOE E3SM Model Version 2: Overview of the physical model and initial model evaluation, J. Adv. Model. Earth Syst., 14, e2022MS003156, https://doi.org/10.1029/2022MS003156, 2022. a
Guimberteau, M., Ducharne, A., Ciais, P., Boisier, J. P., Peng, S., De Weirdt, M., and Verbeeck, H.: Testing conceptual and physically based soil hydrology schemes against observations for the Amazon Basin, Geosci. Model Dev., 7, 1115–1136, https://doi.org/10.5194/gmd-7-1115-2014, 2014. a
He, C., Valayamkunnath, P., Barlage, M., Chen, F., Gochis, D., Cabell, R., Schneider, T., Rasmussen, R., Niu, G.-Y., Yang, Z.-L., Niyogi, D., and Ek, M.: Modernizing the open-source community Noah with multi-parameterization options (Noah-MP) land surface model (version 5.0) with enhanced modularity, interoperability, and applicability, Geosci. Model Dev., 16, 5131–5151, https://doi.org/10.5194/gmd-16-5131-2023, 2023. a
Honey, M.: Mapping Tree and Shrub Cover on Pastures in Rondônia, Brazil, MS thesis, San Diego State University, https://www.proquest.com/dissertations-theses/mapping-tree-shrub-cover-on-pastures-rondonia/docview/2819930021/se-2 (last access: 15 January 2025), 2023. a
Huffman, G., Stocker, E., Bolvin, D., Nelkin, E., and Tan, J.: GPM IMERG Final Precipitation L3 Half Hourly 0.1 degree × 0.1 degree V07, Goddard Earth Sciences Data and Information Services Center [data set], https://doi.org/10.5067/GPM/IMERG/3B-HH/07, 2023. a, b, c
Ivanov, V. Y., Hutyra, L. R., Wofsy, S. C., Munger, J. W., Saleska, S. R., Oliveira, R. C. D., and Camargo, P. B. D.: Root niche separation can explain avoidance of seasonal drought stress and vulnerability of overstory trees to extended drought in a mature Amazonian forest, Water Resour. Res., 48, W12507, https://doi.org/10.1029/2012WR011972, 2012. a, b
Jain, A., Yang, X., Kheshgi, H., McGuire, A. D., Post, W., and Kicklighter, D.: Nitrogen attenuation of terrestrial carbon cycle response to global environmental factors, Global Biogeochem. Cy., 23, GB4028, https://doi.org/10.1029/2009GB003519, 2009. a
Jipp, P. H., Nepstad, D. C., Cassel, D., and Reis de Carvalho, C.: Deep soil moisture storage and transpiration in forests and pastures of seasonally-dry Amazonia, Climatic Change, 39, 395–412, https://doi.org/10.1023/A:1005308930871, 1998. a, b
Joetzjer, E., Douville, H., Delire, C., and Ciais, P.: Present-day and future Amazonian precipitation in global climate models: CMIP5 versus CMIP3, Clim. Dynam., 41, 2921–2936, https://doi.org/10.1007/s00382-012-1644-1, 2013. a
Joetzjer, E., Maignan, F., Chave, J., Goll, D., Poulter, B., Barichivich, J., Maréchaux, I., Luyssaert, S., Guimberteau, M., Naudts, K., Bonal, D., and Ciais, P.: Effect of tree demography and flexible root water uptake for modeling the carbon and water cycles of Amazonia, Ecol. Model., 469, 109969, https://doi.org/10.1016/j.ecolmodel.2022.109969, 2022. a
Jucker, M., Lane, T., Vincent, C., Webster, S., Wales, S., and Louf, V.: Locally forced convection in subkilometre-scale simulations with the Unified Model and WRF, Q. J. Roy. Meteorol. Soc., 146, 3450–3465, https://doi.org/10.1002/qj.3855, 2020. a
Kendall, M. G.: Rank correlation methods, Charles Griffin & Company, London, England, 1948. a
Kendon, E., Prein, A., Senior, C., and Stirling, A.: Challenges and outlook for convection-permitting climate modelling, Philos. T. Roy. Soc. A, 379, 20190547, https://doi.org/10.1098/rsta.2019.0547, 2021. a
Kennedy, D., Swenson, S., Oleson, K. W., Lawrence, D. M., Fisher, R., Lola da Costa, A. C., and Gentine, P.: Implementing plant hydraulics in the community land model, version 5, J. Adv. Model. Earth Syst., 11, 485–513, https://doi.org/10.1029/2018MS001500, 2019. a
Kim, Y., Knox, R. G., Longo, M., Medvigy, D., Hutyra, L. R., Pyle, E. H., Wofsy, S. C., Bras, R. L., and Moorcroft, P. R.: Seasonal carbon dynamics and water fluxes in an Amazon rainforest, Global Change Biol., 18, 1322–1334, https://doi.org/10.1111/j.1365-2486.2011.02629.x, 2012. a
Kleidon, A. and Heimann, M.: Assessing the role of deep rooted vegetation in the climate system with model simulations: mechanism, comparison to observations and implications for Amazonian deforestation, Clim. Dynam., 16, 183–199, https://doi.org/10.1007/s003820050012, 2000. a, b
Krinner, G., Viovy, N., de Noblet-Ducoudré, N., Ogée, J., Polcher, J., Friedlingstein, P., Ciais, P., Sitch, S., and Prentice, I. C.: A dynamic global vegetation model for studies of the coupled atmosphere-biosphere system, Global Biogeochem. Cy., 19, GB1015, https://doi.org/10.1029/2003GB002199, 2005. a
Lawrence, D. M., Fisher, R. A., Koven, C. D., Oleson, K. W., Swenson, S. C., Bonan, G. Collier, N., Ghimire, B., van Kampenhout, L., Kennedy, D., Kluzek, E., Lawrence, P. J., Li, F., Li, H., Lombardozzi, D., Riley, W. J., Sacks, W. J., Shi, M., Vertenstein, M., Wieder, W. R., Xu, C., Ali, A. A., Badger, A. M., Bisht, G., van den Broeke, M., Brunke, M. A., Burns, S. P., Buzan, J., Clark, M., Craig, A., Dahlin, K., Drewniak, B., Fisher, J. B., Flanner, M., Fox, A. M., Gentine, P., Hoffman, F., Keppel-Aleks, G., Knox, R., Kumar, S., Lenaerts, J., Leung, L. R., Lipscomb, W. H., Lu, Y., Pandey, A., Pelletier, J. D., Perket, J., Randerson, J. T., Ricciuto, D. M., Sanderson, B. M., Slater, A., Subin, Z. M., Tang, J., Thomas, R. Q., Val Martin, M., and Zeng, X.: The Community Land Model version 5: Description of new features, benchmarking, and impact of forcing uncertainty, J. Adv. Model. Earth Syst., 11, 4245–4287, https://doi.org/10.1029/2018MS001583, 2019. a, b
Li, L., Yang, Z.-L., Matheny, A. M., Zheng, H., Swenson, S. C., Lawrence, D. M., Barlage, M., Yan, B., McDowell, N. G., and Leung, L. R.: Representation of plant hydraulics in the Noah-MP land surface model: Model development and multiscale evaluation, J. Adv. Model. Earth Syst., 13, e2020MS002214, https://doi.org/10.1029/2020MS002214, 2021. a, b, c
Lin, T.-S.: Modeling the effects of environmental and management variables on crop productivity, PhD thesis, University of Illinois at Urbana-Champaign, https://hdl.handle.net/2142/117585 (last access: 20 July 2024), 2022. a
Lin, T.-S., Kheshgi, H. S., Song, Y., Vörösmarty, C. J., and Jain, A. K.: Which crop has the highest bioethanol yield in the United States?, Front. Energ. Res., 11, 1070186, https://doi.org/10.3389/fenrg.2023.1070186, 2023. a
Liu, T., Chen, D., Yang, L., Meng, J., Wang, Z., Ludescher, J., Fan, J., Yang, S., Chen, D., Kurths, J., Chen, X., Havlin, S., and Schellnhuber, H. J.: Teleconnections among tipping elements in the Earth system, Nat. Clim. Change, 13, 67–74, https://doi.org/10.1038/s41558-022-01558-4, 2023. a
Liu, X., Chen, F., Barlage, M., and Niyogi, D.: Implementing dynamic rooting depth for improved simulation of soil moisture and land surface feedbacks in Noah-MP-Crop, J. Adv. Model. Earth Syst., 12, e2019MS001786, https://doi.org/10.1029/2019MS001786, 2020. a, b
Mann, H. B.: Nonparametric tests against trend, Econometrica, 13, 245–259, https://doi.org/10.2307/1907187, 1945. a
Markewitz, D., Devine, S., Davidson, E. A., Brando, P., and Nepstad, D. C.: Soil moisture depletion under simulated drought in the Amazon: Impacts on deep root uptake, New Phytol., 187, 592–607, https://doi.org/10.1111/j.1469-8137.2010.03391.x, 2010. a, b, c, d
Martens, B., Miralles, D. G., Lievens, H., van der Schalie, R., de Jeu, R. A. M., Fernández-Prieto, D., Beck, H. E., Dorigo, W. A., and Verhoest, N. E. C.: GLEAM v3: satellite-based land evaporation and root-zone soil moisture, Geosci. Model Dev., 10, 1903–1925, https://doi.org/10.5194/gmd-10-1903-2017, 2017. a, b, c, d
Martinez, J. A., Dominguez, F., and Miguez-Macho, G.: Effects of a groundwater scheme on the simulation of soil moisture and evapotranspiration over southern South America, J. Hydrometeorol., 17, 2941–2957, https://doi.org/10.1175/JHM-D-16-0051.1, 2016a. a, b, c, d
Martinez, J. A., Dominguez, F., and Miguez-Macho, G.: Impacts of a groundwater scheme on hydroclimatological conditions over southern South America, J Hydrometeorol., 17, 2959–2978, https://doi.org/10.1175/JHM-D-16-0052.1, 2016b. a, b, c
Miguez-Macho, G. and Fan, Y.: The role of groundwater in the Amazon water cycle: 1. Influence on seasonal streamflow, flooding and wetlands, J. Geophys. Res.-Atmos., 117, D15113, https://doi.org/10.1029/2012JD017539, 2012. a, b
Miguez-Macho, G. and Fan, Y.: Spatiotemporal origin of soil water taken up by vegetation, Nature, 598, 624–628, https://doi.org/10.1038/s41586-021-03958-6, 2021. a, b, c, d, e, f
Miguez-Macho, G., Fan, Y., Weaver, C. P., Walko, R., and Robock, A.: Incorporating water table dynamics in climate modeling: 2. Formulation, validation, and soil moisture simulation, J. Geophys. Res.-Atmos., 112, D13108, https://doi.org/10.1029/2006JD008112, 2007. a, b, c, d
Milly, P. C., Malyshev, S. L., Shevliakova, E., Dunne, K. A., Findell, K. L., Gleeson, T., Liang, Z., Phillipps, P., Stouffer, R. J., and Swenson, S.: An enhanced model of land water and energy for global hydrologic and earth-system studies, J. Hydrometeorol., 15, 1739–1761, https://doi.org/10.1175/JHM-D-13-0162.1, 2014. a, b
Miralles, D. G., Holmes, T. R. H., De Jeu, R. A. M., Gash, J. H., Meesters, A. G. C. A., and Dolman, A. J.: Global land-surface evaporation estimated from satellite-based observations, Hydrol. Earth Syst. Sci., 15, 453–469, https://doi.org/10.5194/hess-15-453-2011, 2011. a, b
Morton, D. C., Nagol, J., Carabajal, C. C., Rosette, J., Palace, M., Cook, B. D., Vermote, E. F., Harding, D. J., and North, P. R.: Amazon forests maintain consistent canopy structure and greenness during the dry season, Nature, 506, 221–224, https://doi.org/10.1038/nature13006, 2014. a
Naudts, K., Ryder, J., McGrath, M. J., Otto, J., Chen, Y., Valade, A., Bellasen, V., Berhongaray, G., Bönisch, G., Campioli, M., Ghattas, J., De Groote, T., Haverd, V., Kattge, J., MacBean, N., Maignan, F., Merilä, P., Penuelas, J., Peylin, P., Pinty, B., Pretzsch, H., Schulze, E. D., Solyga, D., Vuichard, N., Yan, Y., and Luyssaert, S.: A vertically discretised canopy description for ORCHIDEE (SVN r2290) and the modifications to the energy, water and carbon fluxes, Geosci. Model Dev., 8, 2035–2065, https://doi.org/10.5194/gmd-8-2035-2015, 2015. a
Nepstad, D. C.: The effects of partial throughfall exclusion on canopy processes, aboveground production, and biogeochemistry of an Amazon forest, J. Geophys. Res., 107, 8085, https://doi.org/10.1029/2001JD000360, 2002. a
Nepstad, D. C., de Carvalho, C. R., Davidson, E. A., Jipp, P. H., Lefebvre, P. A., Negreiros, G. H., da Silva, E. D., Stone, T. A., Trumbore, S. E., and Vieira, S.: The role of deep roots in the hydrological and carbon cycles of Amazonian forests and pastures, Nature, 372, 666–669, https://doi.org/10.1890/06-1046.1, 1994. a, b, c, d, e, f, g
Nepstad, D. C., Tohver, I. M., David, R., Moutinho, P., and Cardinot, G.: Mortality of large trees and lianas following experimental drought in an amazon forest, Ecology, 88, 2259–2269, 2007. a
Niu, G. Y., Yang, Z. L., Mitchell, K. E., Chen, F., Ek, M. B., Barlage, M., Kumar, A., Manning, K., Niyogi, D., Rosero, E., Tewari, M., and Xia, Y.: The community Noah land surface model with multiparameterization options (Noah-MP): 1. Model description and evaluation with local-scale measurements, J. Geophys. Res.-Atmos., 116, D12109, https://doi.org/10.1029/2010JD015139, 2011. a, b, c, d, e, f
Niu, G.-Y., Fang, Y.-H., Chang, L.-L., Jin, J., Yuan, H., and Zeng, X.: Enhancing the Noah-MP ecosystem response to droughts with an explicit representation of plant water storage supplied by dynamic root water uptake, J. Adv. Model. Earth Syst., 12, e2020MS002062, https://doi.org/10.1029/2020MS002062, 2020. a, b, c, d
Oleson, K. W., Lawrence, D. M., Bonan, G. B., Drewniak, B., Huang, M., Koven, C., Levis, S., Li, F., Riley, W., Subin, Z., Swenson, S., Thornton, P., Bozbiyik, A., Fisher, R. A., Heald, C., Kluzek, E., Lamarque, J.-F., Lawrence, P. J., Leung, L. R., Lipscomb, W., Muszala, S., Ricciuto, D. M., Sacks, W., Sun Y., Tang, J., and Yang, Z.-L.: Technical description of version 4.5 of the Community Land Model (CLM), Technical Note No. NCAR/TN-503+STR, National Center for Atmospheric Research Earth System Laboratory, Boulder, CO, https://doi.org/10.5065/D6RR1W7M, 2013. a
Oliveira, R., Bezerra, L., Davidson, E., Pinto, F., Klink, C., Nepstad, D., and Moreira, A.: Deep root function in soil water dynamics in cerrado savannas of central Brazil, Funct. Ecol., 19, 574–581, https://doi.org/10.1111/j.1365-2435.2005.01003.x, 2005a. a
Oliveira, R. S., Dawson, T. E., Burgess, S. S., and Nepstad, D. C.: Hydraulic redistribution in three Amazonian trees, Oecologia, 145, 354–363, https://doi.org/10.1007/s00442-005-0108-2, 2005b. a
Piontekowski, V. J., Ribeiro, F. P., Matricardi, E. A. T., Lustosa Junior, I. M., Bussinguer, A. P., and Gatto, A.: Modeling deforestation in the state of Rondônia, Floresta Ambient., 26, e20180441, https://doi.org/10.1590/2179-8087.044118, 2019. a
Pitman, A.: The evolution of, and revolution in, land surface schemes designed for climate models, Int. J. Climatol., 23, 479–510, https://doi.org/10.1002/joc.893, 2003. a
Press, W. H., Teukolsky, S. A., Vetterling, W. T., and Flannery, B. P.: Numerical recipes in FORTRAN : the art of scientific computing, Cambridge University Press, ISBN 9780521430647, 1992. a
Qiu, H., Bisht, G., Li, L., Hao, D., and Xu, D.: Development of inter-grid-cell lateral unsaturated and saturated flow model in the E3SM Land Model (v2.0), Geosci. Model Dev., 17, 143–167, https://doi.org/10.5194/gmd-17-143-2024, 2024. a
Rehbein, A., Ambrizzi, T., and Mechoso, C. R.: Mesoscale convective systems over the Amazon basin. Part I: climatological aspects, Int. J. Climatol., 38, 215–229, https://doi.org/10.1002/joc.5171, 2018. a
Reick, C. H., Gayler, V., Goll, D., Hagemann, S., Heidkamp, M., Nabel, J. E. M. S., Raddatz, T., Roeckner, E., Scnhur, R., and Wilkenskjeld, S.: JSBACH 3 – The land component of the MPI Earth System Model: documentation of version 3.2, Berichte zur Erdsystemforschung, 240, https://doi.org/10.17617/2.3279802, 2021. a
Restom, T. G. and Nepstad, D. C.: Seedling growth dynamics of a deeply rooting liana in a secondary forest in eastern Amazonia, Forest Ecol. Manage., 190, 109–118, https://doi.org/10.1016/j.foreco.2003.10.010, 2004. a
Restrepo-Coupe, N., da Rocha, H., Hutyra, L., de Araujo, A., Borma, L., Christoffersen, B., Cabral, O., de Camargo, P., Cardoso, F., Costa, A., Fitzjarrald, D., Goulden, M., Kruijt, B., Maia, J., Malhi, Y., Manzi, A., Miller, S., Nobre, A., von Randow, C., Abreu Safaj, L., Sakai, R., Tota, J., Wofsy, S., Zanchi, F., and Saleska, S.: LBA-ECO CD-32 Flux Tower Network Data Compilation, Brazilian Amazon: 1999–2006, V2, ORNL DAAC [data set], https://doi.org/10.3334/ORNLDAAC/1842, 2021. a
Roberts, D., Numata, I., Holmes, K., Batista, G., Krug, T., Monteiro, A., Powell, B., and Chadwick, O.: Large area mapping of land-cover change in Rondônia using multitemporal spectral mixture analysis and decision tree classifiers, J. Geophys. Res.-Atmos., 107, 8073, https://doi.org/10.1029/2001JD000374, 2002. a
Rodell, M., Houser, P. R., Jambor, U., Gottschalck, J., Mitchell, K., Meng, C., Arsenault, K., Cosgrove, B., Radakovich, J., Bosilovich, M., Entin, J. K., Walker, J. P., Lohmann, D., and Toll, D.: The global land data assimilation system, B. Am. Meteorol. Soc., 85, 381–394, https://doi.org/10.1175/BAMS-85-3-381, 2004. a, b
Sakaguchi, K. and Zeng, X.: Effects of soil wetness, plant litter, and under-canopy atmospheric stability on ground evaporation in the Community Land Model (CLM3.5), J. Geophys. Res.-Atmos., 114, D01107, https://doi.org/10.1029/2008JD010834, 2009. a
Sakschewski, B., Von Bloh, W., Boit, A., Poorter, L., Peña-Claros, M., Heinke, J., Joshi, J., and Thonicke, K.: Resilience of Amazon forests emerges from plant trait diversity, Nat. Clim. Change, 6, 1032–1036, https://doi.org/10.1038/nclimate3109, 2016. a
Saleska, S. R., Didan, K., Huete, A. R., and Rocha, H. R. D.: Amazon forests green-up during 2005 drought, Science, 318, 612, https://doi.org/10.1126/science.1146663, 2007. a
Satoh, M., Stevens, B., Judt, F., Khairoutdinov, M., Lin, S.-J., Putman, W. M., and Düben, P.: Global cloud-resolving models, Curr. Clim. Change Rep., 5, 172–184, https://doi.org/10.1007/s40641-019-00131-0, 2019. a
Schneck, R., Gayler, V., Nabel, J. E. M. S., Raddatz, T., Reick, C. H., and Schnur, R.: Assessment of JSBACHv4.30 as a land component of ICON-ESM-V1 in comparison to its predecessor JSBACHv3.2 of MPI-ESM1.2, Geosci. Model Dev., 15, 8581–8611, https://doi.org/10.5194/gmd-15-8581-2022, 2022. a
Schwitalla, T., Warrach-Sagi, K., Wulfmeyer, V., and Resch, M.: Near-global-scale high-resolution seasonal simulations with WRF-Noah-MP v.3.8.1, Geosci. Model Dev., 13, 1959–1974, https://doi.org/10.5194/gmd-13-1959-2020, 2020. a
Sen, P. K.: Estimates of the regression coefficient based on Kendall's tau, J. Am. Stat. Assoc., 63, 1379–1389, https://doi.org/10.1080/01621459.1968.10480934, 1968. a, b
Shahi, N. K., Polcher, J., Bastin, S., Pennel, R., and Fita, L.: Assessment of the spatio-temporal variability of the added value on precipitation of convection-permitting simulation over the Iberian Peninsula using the RegIPSL regional earth system model, Clim. Dynam., 59, 471–498, https://doi.org/10.1007/s00382-022-06138-y, 2022. a
Shevliakova, E., Malyshev, S., Martinez-Cano, I., Milly, P. C. D., Pacala, S. W., Ginoux, P., Dunne, K. A., Dunne, J. P., Dupuis, C., Findell, K. L., Ghannam, K., Horowitz, L. W., Knutson, T. R., Krasting, J. P., Naik, V., Phillipps, P., Zadeh, N., Yu, Y., Zeng, F., and Zeng, Y.: The land component LM4.1 of the GFDL Earth System Model ESM4.1: Model description and characteristics of land surface climate and carbon cycling in the historical simulation, J. Adv. Model. Earth Syst., 16, e2023MS003922, https://doi.org/10.1029/2023MS003922, 2024. a, b
Singh, C., Wang-Erlandsson, L., Fetzer, I., Rockström, J., and Van Der Ent, R.: Rootzone storage capacity reveals drought coping strategies along rainforest-savanna transitions, Environ. Res. Lett., 15, 124021, https://doi.org/10.1088/1748-9326/abc377, 2020. a
Skamarock, W. C., Klemp, J. B., Dudhia, J., Gill, D. O., Liu, Z., Berner, J., Wang, W., Powers, J. G., Duda, M. G., Barker, D. M., and Huang, X.-Y.: A Description of the Advanced Research WRF Version 4, NCAR Tech. Note NCAR/TN-556+STR, NCAR [data set], https://doi.org/10.5065/1dfh-6p97, 2019. a, b, c, d
Smith, T. and Boers, N.: Global vegetation resilience linked to water availability and variability, Nat. Commun., 14, 498, https://doi.org/10.1038/s41467-023-36207-7, 2023. a, b
Song, Y., Jain, A. K., and McIsaac, G. F.: Implementation of dynamic crop growth processes into a land surface model: evaluation of energy, water and carbon fluxes under corn and soybean rotation, Biogeosciences, 10, 8039–8066, https://doi.org/10.5194/bg-10-8039-2013, 2013. a
Song, Y., Cervarich, M., Jain, A. K., Kheshgi, H. S., Landuyt, W., and Cai, X.: The interplay between bioenergy grass production and water resources in the United States of America, Environ. Sci. Technol., 50, 3010–3019, https://doi.org/10.1021/acs.est.5b05239, 2016. a
Spera, S. A., Winter, J. M., and Chipman, J. W.: Evaluation of agricultural land cover representations on regional climate model simulations in the Brazilian Cerrado, J. Geophys. Res.-Atmos., 123, 5163–5176, https://doi.org/10.1029/2017JD027989, 2018. a
Theil, H.: A Rank-Invariant Method of Linear and Polynomial Regression Analysis, in: Henri Theil's Contributions to Economics and Econometrics, Advanced Studies in Theoretical and Applied Econometrics, vol. 23, edited by: Raj, B. and Koerts, J., Springer, 345–381, https://doi.org/10.1007/978-94-011-2546-8_20, 1992. a, b
van Oorschot, F., van der Ent, R. J., Hrachowitz, M., and Alessandri, A.: Climate-controlled root zone parameters show potential to improve water flux simulations by land surface models, Earth Syst. Dynam., 12, 725–743, https://doi.org/10.5194/esd-12-725-2021, 2021. a
Verbeeck, H., Peylin, P., Bacour, C., Bonal, D., Steppe, K., and Ciais, P.: Seasonal patterns of CO2 fluxes in Amazon forests: Fusion of eddy covariance data and the ORCHIDEE model, J. Geophys. Res.-Biogeo., 116, G02018, https://doi.org/10.1029/2010JG001544, 2011. a
von Randow, C., Manzi, A. O., Kruijt, B., de Oliveira, P. J., Zanchi, F. B., Silva, R. L., Hodnett, M. G., Gash, J. H., Elbers, J. A., Waterloo, M. J., Cardoso, F. L., and Kabat, P.: Comparative measurements and seasonal variations in energy and carbon exchange over forest and pasture in South West Amazonia, Theor. Appl. Climatol., 78, 5–26, https://doi.org/10.1007/s00704-004-0041-z, 2004. a, b
Wang, P., Niu, G.-Y., Fang, Y.-H., Wu, R.-J., Yu, J.-J., Yuan, G.-F., Pozdniakov, S. P., and Scott, R. L.: Implementing dynamic root optimization in Noah-MP for simulating phreatophytic root water uptake, Water Resour. Res., 54, 1560–1575, https://doi.org/10.1002/2017WR021061, 2018. a, b
Wei, Z., Yoshimura, K., Wang, L., Miralles, D. G., Jasechko, S., and Lee, X.: Revisiting the contribution of transpiration to global terrestrial evapotranspiration, Geophys. Res. Lett., 44, 2792–2801, https://doi.org/10.1002/2016GL072235, 2017. a
Werth, D. and Avissar, R.: The local and global effects of Amazon deforestation, J. Geophys Res.-Atmos., 107, 8087, https://doi.org/10.1029/2001JD000717, 2002. a
Wiltshire, A. J., Duran Rojas, M. C., Edwards, J. M., Gedney, N., Harper, A. B., Hartley, A. J., Hendry, M. A., Robertson, E., and Smout-Day, K.: JULES-GL7: the Global Land configuration of the Joint UK Land Environment Simulator version 7.0 and 7.2, Geosci. Model Dev., 13, 483–505, https://doi.org/10.5194/gmd-13-483-2020, 2020. a
Yao, Y., Joetzjer, E., Ciais, P., Viovy, N., Cresto Aleina, F., Chave, J., Sack, L., Bartlett, M., Meir, P., Fisher, R., and Luyssaert, S.: Forest fluxes and mortality response to drought: model description (ORCHIDEE-CAN-NHA r7236) and evaluation at the Caxiuanã drought experiment, Geosci. Model Dev., 15, 7809–7833, https://doi.org/10.5194/gmd-15-7809-2022, 2022. a
Zanin, P. R.: Soil Water Uptake by Amazonian Trees and Simulation of Impacts on Energy Fluxes and Soil Moisture Dynamics at the LBA Flux Towers, Rev. Bras. Meteorol., 36, 441–454, https://doi.org/10.1590/0102-77863630029, 2021. a, b, c, d
Zemp, D. C., Schleussner, C.-F., Barbosa, H. M. J., van der Ent, R. J., Donges, J. F., Heinke, J., Sampaio, G., and Rammig, A.: On the importance of cascading moisture recycling in South America, Atmos. Chem. Phys., 14, 13337–13359, https://doi.org/10.5194/acp-14-13337-2014, 2014. a
Zilli, M. T., Lemes, M. R., Hart, N. C. G., Halladay, K., Kahana, R., Fisch, G., Prein, A., Ikeda, K., and Liu, C.: The added value of using convective-permitting regional climate model simulations to represent cloud band events over South America, Clim. Dynam., 62, 10543–10564, https://doi.org/10.1007/s00382-024-07460-3, 2024. a