the Creative Commons Attribution 4.0 License.
the Creative Commons Attribution 4.0 License.
 | 03 Mar 2025
High-Resolution Model Intercomparison Project phase 2 (HighResMIP2) towards CMIP7
Malcolm J. Roberts
Kevin A. Reed
Qing Bao
Joseph J. Barsugli
Suzana J. Camargo
Louis-Philippe Caron
Ping Chang
Cheng-Ta Chen
Hannah M. Christensen
Gokhan Danabasoglu
Ivy Frenger
Neven S. Fučkar
Shabeh ul Hasson
Helene T. Hewitt
Huanping Huang
Daehyun Kim
Chihiro Kodama
Michael Lai
Lai-Yung Ruby Leung
Ryo Mizuta
Paulo Nobre
Pablo Ortega
Dominique Paquin
Christopher D. Roberts
Enrico Scoccimarro
Jon Seddon
Anne Marie Treguier
Chia-Ying Tu
Paul A. Ullrich
Pier Luigi Vidale
Michael F. Wehner
Colin M. Zarzycki
Bosong Zhang
Wei Zhang
Ming Zhao
Robust projections and predictions of climate variability and change, particularly at regional scales, rely on the driving processes being represented with fidelity in model simulations. Consequently, the role of enhanced horizontal resolution in improved process representation in all components of the climate system continues to be of great interest. Recent simulations suggest the possibility of significant changes in both large-scale aspects of the ocean and atmospheric circulations and in the regional responses to climate change, as well as improvements in representations of small-scale processes and extremes, when resolution is enhanced.
The first phase of the High-Resolution Model Intercomparison Project (HighResMIP1) was successful at producing a baseline multi-model assessment of global simulations with model grid spacings of 25–50 km in the atmosphere and 10–25 km in the ocean, a significant increase when compared to models with standard resolutions on the order of 1° that are typically used as part of the Coupled Model Intercomparison Project (CMIP) experiments. In addition to over 250 peer-reviewed manuscripts using the published HighResMIP1 datasets, the results were widely cited in the Intergovernmental Panel on Climate Change report and were the basis of a variety of derived datasets, including tracked cyclones (both tropical and extratropical), river discharge, storm surge, and impact studies. There were also suggestions from the few ocean eddy-rich coupled simulations that aspects of climate variability and change might be significantly influenced by improved process representation in such models.
The compromises that HighResMIP1 made should now be revisited, given the recent major advances in modelling and computing resources. Aspects that will be reconsidered include experimental design and simulation length, complexity, and resolution. In addition, larger ensemble sizes and a wider range of future scenarios would enhance the applicability of HighResMIP.
Therefore, we propose the High-Resolution Model Intercomparison Project phase 2 (HighResMIP2) to improve and extend the previous work, to address new science questions, and to further advance our understanding of the role of horizontal resolution (and hence process representation) in state-of-the-art climate simulations. With further increases in high-performance computing resources and modelling advances, along with the ability to take full advantage of these computational resources, an enhanced investigation of the drivers and consequences of variability and change in both large- and synoptic-scale weather and climate is now possible. With the arrival of global cloud-resolving models (currently run for relatively short timescales), there is also an opportunity to improve links between such models and more traditional CMIP models, with HighResMIP providing a bridge to link understanding between these domains. HighResMIP also aims to link to other CMIP projects and international efforts such as the World Climate Research Program lighthouse activities and various digital twin initiatives. It also has the potential to be used as training and validation data for the fast-evolving machine learning climate models.
- Article
(3791 KB) - Full-text XML
- BibTeX
- EndNote


Understanding the connections between large-scale climate change and local impacts remains a significant challenge. One approach used by the scientific community to advance our capabilities in this area is the development of higher horizontal resolution (i.e. reduced grid spacing) general circulation models (GCMs) (e.g. Satoh et al., 2008; Small et al., 2014; Wehner et al., 2014; Zhao et al., 2009) to better represent key components of the Earth system (e.g. Athanasiadis et al., 2022; Camargo and Wing, 2016; Chen and Lin, 2011; Shaevitz et al., 2014). Over the last 5 decades, the horizontal resolutions that are used for the World Climate Research Programme (WCRP) Coupled Model Intercomparison Project phase 6 (CMIP6; Eyring et al., 2016) have continually improved. More recently, efforts to simulate the global atmosphere and ocean at grid spacings of less than 50 km have become more commonplace in the community (e.g. Caldwell et al., 2019; Chang et al., 2020; Giorgetta et al., 2018; Roberts et al., 2019; Scoccimarro et al., 2022) as advancements in numerical models and high-performance computing continue. Storm-resolving models with grid spacings of 10 km and less (e.g. Stevens et al., 2019) allow us to further expand our scientific understanding of climate processes and impacts at regional and local scales.
The High-Resolution Model Intercomparison Project phase 1 (hereafter HighResMIP1; Haarsma et al., 2016) was a new project within the Coupled Model Intercomparison Project (CMIP) phase 6. Its main focus was to develop a better understanding of the role of increased horizontal resolution in climate simulations via a simple experimental design, which would be affordable for many modelling groups. It proposed using ∼25 km grid spacing in the atmosphere (and ocean) as the baseline high-resolution model configuration, with a comparable lower-resolution counterpart at ∼100 km (consistent with an equivalent CMIP6 model configuration). As of early 2024, 17 modelling groups using 40 different models (including both lower- and higher-resolution versions) have contributed data to the Earth System Grid Federation (ESGF CMIP6 HighResMIP Data Holdings, 2024) linked to HighResMIP1, of which 21 models used coupled atmosphere–ocean–sea ice (IPCC, 2021, Annex II, Models, Table AII.6). More than 250 peer-reviewed papers using HighResMIP data have been published to date (Fig. 1 displays a word cloud compiled from these papers), the HighResMIP1 paper has been cited over 580 times, and there were more than 150 direct references to HighResMIP in the Intergovernmental Panel on Climate Change (IPCC) Sixth Assessment Report (AR6) from Working Group I (IPCC, 2021), putting it in the top-three most directly referenced model intercomparison projects (MIPs). Given the broad impacts of the HighResMIP1 outcomes and continuing needs for improved high-resolution climate data in climate change impact assessments, it is important to extend HighResMIP towards CMIP7 and hence continue to provide important insights in time for the next IPCC report.
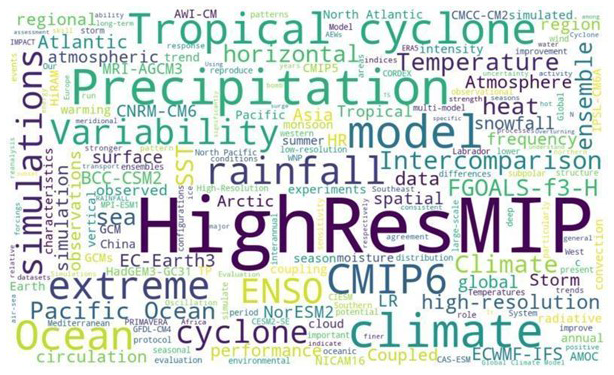
Figure 1A word cloud chart of CMIP6 HighResMIP compiled from published papers using its data, which highlights the prominent research areas and applications that the data have been used for.
The main achievements from HighResMIP1 fall into several categories: quantifying the impacts of model resolution on simulated climate and extreme events (Bador et al., 2020; Gore et al., 2023; Huang et al., 2021; Moon et al., 2022; Roberts et al., 2020a; Scoccimarro et al., 2022); improved understanding of the causes of mean-state model biases (Moreno-Chamarro et al., 2022; Xu et al., 2022); improved process representation, including processes related to topography (Rhoades et al., 2022) and extreme weather (Intergovernmental Panel on Climate Change (IPCC), 2023; Liu et al., 2021; Scoccimarro et al., 2017) and their consequences for simulated climate and climate change; indications that observed large-scale trends (e.g. the eastern Pacific and Southern Ocean cooling) may be captured in high-resolution but not standard-resolution models (Yeager et al., 2023); and implications for decadal variability and climate projections associated with better-captured trends (Sobel et al., 2023; Yeager et al., 2023; Zhao and Knutson, 2024). Many groups have previously produced high-resolution simulations individually, but HighResMIP1 provided a protocol for model simulations (both atmosphere-only and coupled) to be consistently performed and compared to each other and available observations, e.g. to understand where and how a high resolution systematically reduces large-scale model biases (e.g. Athanasiadis et al., 2022; Bock et al., 2020; Docquier et al., 2019; Moreno-Chamarro et al., 2022; Scoccimarro et al., 2022; Vannière et al., 2019). Resolutions of 25 km or finer also enabled improved representation of atmospheric extreme processes such as tropical and extratropical cyclones and atmospheric rivers and ocean mesoscale phenomena and extremes such as marine heatwaves, and hence they provide deeper insights into how these might change in the future (e.g. Bian et al., 2023; Chang et al., 2023; Liu et al., 2021; Priestley and Catto, 2022; Roberts et al., 2020b; Yamada et al., 2021; Yin et al., 2020; Zhao, 2020, 2022). In addition to these fundamental scientific insights, HighResMIP outputs were also used to produce datasets useful for impacts and event attribution studies, such as winter windstorms (Lockwood et al., 2022), synthetic tropical cyclones (Bloemendaal et al., 2022), and global water level change (Muis et al., 2023).
We also recognise that the HighResMIP1 experimental design had limitations, often due to deliberate choices to make it more tractable and to enhance process understanding. The relatively short length of simulations made examination of decadal and longer variability difficult. The strongly parsimonious use of ensembles raised questions about robustly disentangling externally forced signals from internally driven variability, including extremes. The suggested use of simplified aerosol forcing and lack of tuning for these high-resolution models improved the comparability with their lower-resolution counterparts but was not conducive to producing optimal simulations (as is commonplace for model development). The short spinup for the coupled models (based on 1950s conditions) means that the ocean continued to drift in these HighResMIP1 simulations (Caldwell et al., 2019; Roberts et al., 2019). As a result, it was also difficult to characterise the models, as is conventionally done with CMIP Diagnostic, Evaluation and Characterization of Klima (DECK) simulations, hence limiting the uptake of the data by the scientific community more broadly. We propose addressing some of these limitations in HighResMIP2, although some compromises will remain to keep the simulations affordable.
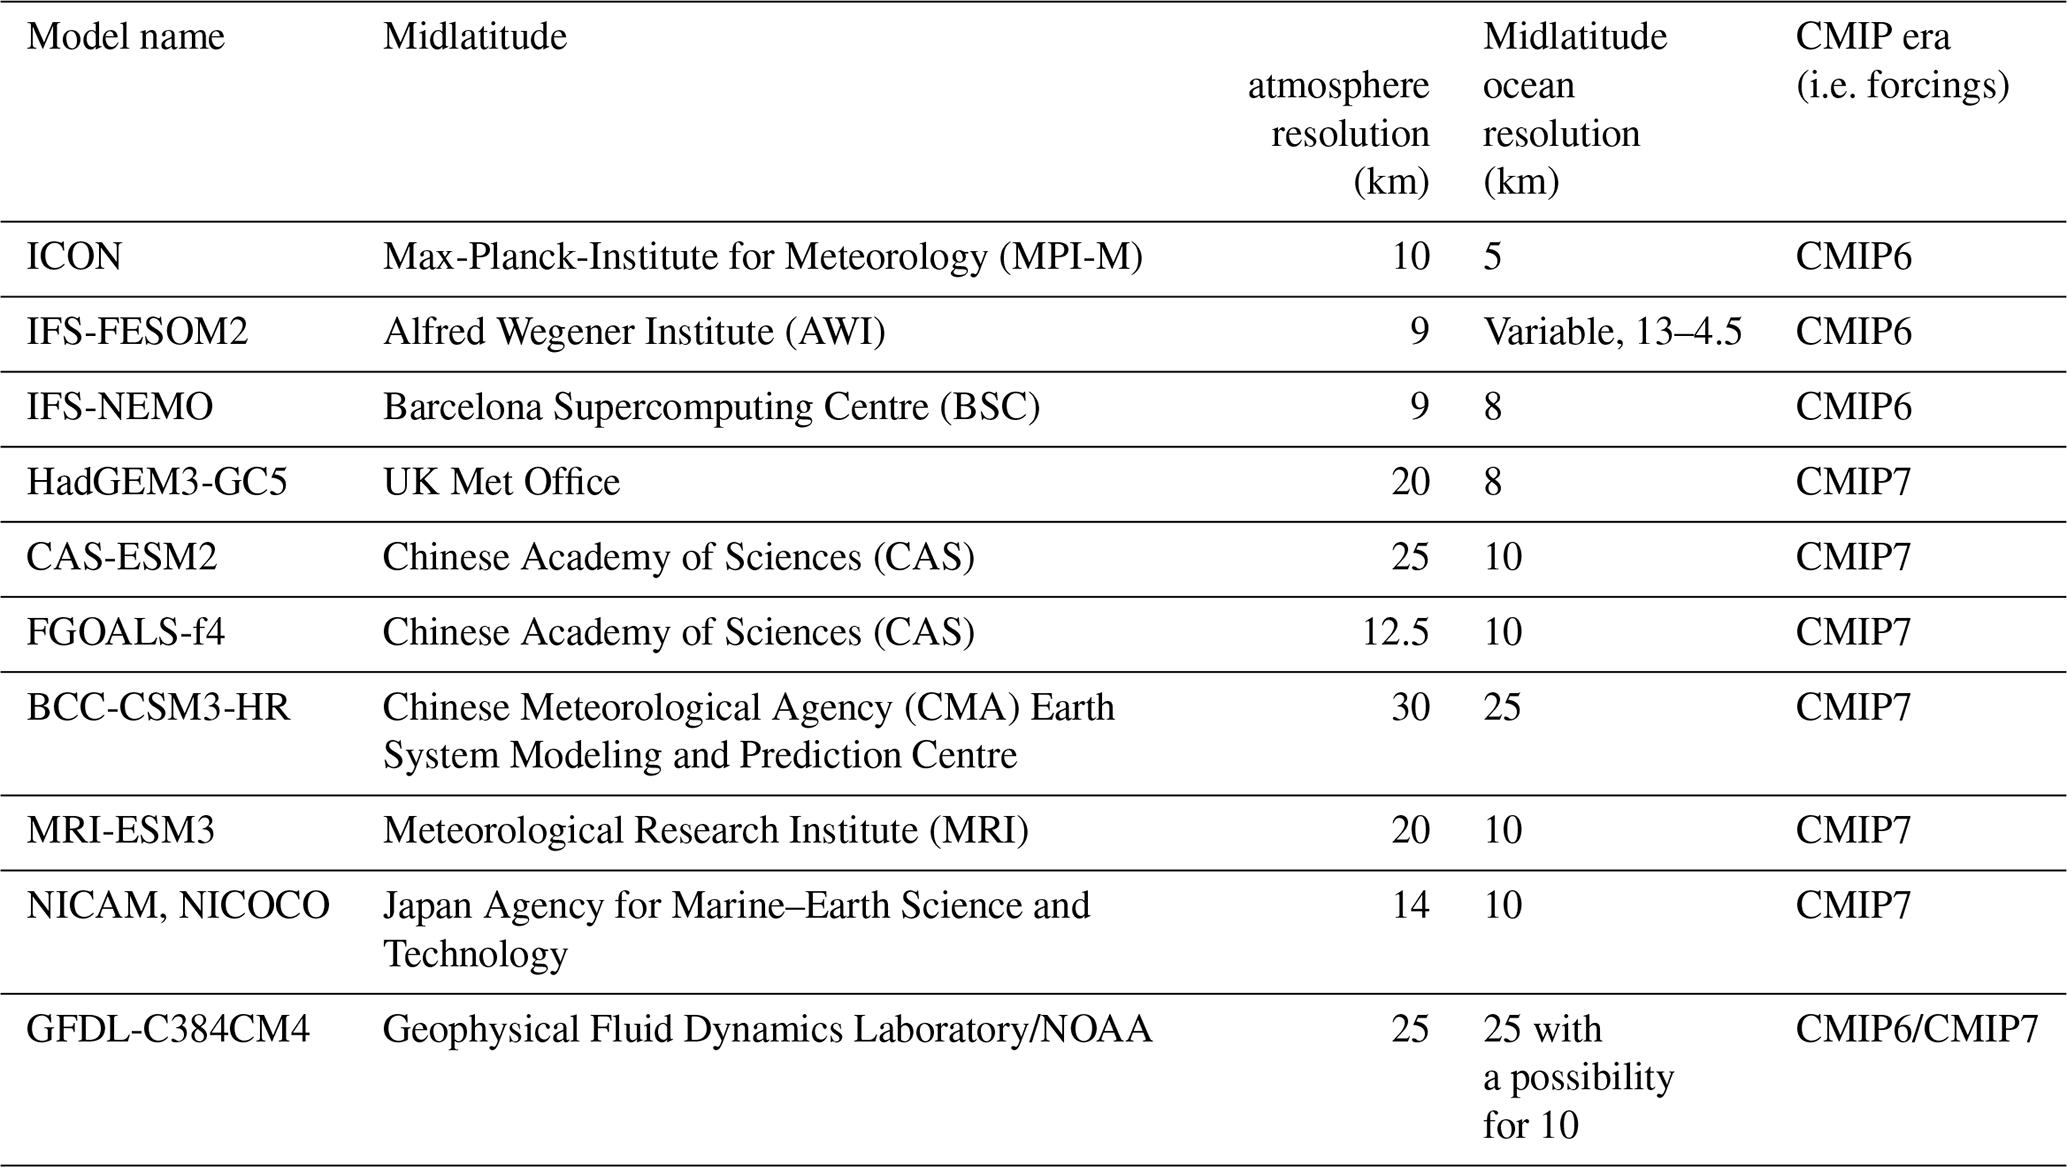
In discussions with the scientific community, one important question came up often: why propose an update to HighResMIP now? In particular and given that the CMIP7 experimental design and forcings are not yet available, the community already has access to existing HighResMIP1 data from simulations that were computationally expensive and take considerable time to complete. However, the proposed timescale is primarily driven by the HighResMIP community (i.e. the groups with the computational resources to complete such simulations), with several groups having expressed interest in starting new simulations as early as 2024. A key reason for this keenness is the increased maturity of models optimised to run at a high resolution, both scientifically and technically. It was therefore important to give modelling groups (see Table 1) an early sign of the HighResMIP2 simulation design (prior to CMIP7 forcings being available) so that they could make informed choices about when to start new simulations and understand how HighResMIP1 and HighResMIP2 simulations would relate to each other. Another factor that was considered is the time needed to develop high-resolution configurations, particularly of coupled climate models with eddy-rich ocean components, which often lags a standard-resolution model by years, as well as forward planning to access the large computational resources necessary. If we want the unique insights from global high-resolution coupled simulations to feed into the next IPCC cycle with its fast-approaching deadlines, insights that are simply not available from standard-resolution models, we need considerably more lead time for such models. The new HighResMIP2 described here enables this by providing a future path and giving groups time to plan. We accept that at the time of this paper, HighResMIP2 is effectively bridging both CMIP6 and CMIP7, and consequently, there may be some confusion in this paper when new simulations are described, but not all the information is available yet. We have attempted to be as clear as possible, and further details will be documented via standard CMIP protocols at the earliest opportunity.
Table 1Modelling groups proposing to contribute to HighResMIP2 with coupled model simulations (which are more challenging and for which the model diversity was low in HighResMIP1). Many more atmosphere-only simulations are anticipated (not shown).
Given this timing, what can we hope to gain from new simulations? Key limitations of the HighResMIP1 simulation data included un-optimised high-resolution models (i.e. configured as similarly as possible to the standard-resolution counterpart, including simplified aerosol forcing); few ensemble members (generally only one); a small diversity of models, particularly with coupled simulations; and resolutions that were generally 25 km or coarser. We have ambition for new simulations to have further enhanced resolutions (aiming for around 10 km in the atmosphere and ocean; see Table 1), producing larger ensembles and using models that are optimised for a high resolution (scientifically and technically). In addition, we propose new experiments that will help to better characterise the models and build links with other communities. One emerging area where global high-resolution simulation data could play a key role is that of machine learning, which is clearly making huge advances but is constrained by the quality and quantity of training and assessment data. Results from CMIP6 and HighResMIP1 and conclusions from IPCC AR6 also suggest that significant scientific uncertainties remain in future projections due to a lack of resolution. With such new simulations building on the HighResMIP1 archive, we believe that the existing and new science questions proposed in Sect. 2 can be addressed in a more complete way.
Throughout the paper we refer to “high-resolution” global climate models, which will be defined as models that have smaller grid spacings than are typical of CMIP6 DECK climate simulations, where the vast majority of models had grid spacings of 100–200 km in the atmosphere and 50–100 km in the ocean (IPCC, 2021, Fig. 1.19). Our current understanding is that such resolutions (henceforth described as standard resolution) will likely remain typical in CMIP7 (Dunne et al., 2024), given historic rates of increase in model resolution (Hewitt et al., 2022). We will also refer to climate models and Earth system models (ESMs) interchangeably in the text, although we expect that most models in HighResMIP2 will have limited Earth system complexity (but may, for example, include interactive aerosols, which were not recommended in HighResMIP1).
HighResMIP, however, is just one part of community efforts to produce climate information at resolutions beyond the standard CMIP model capabilities, and we aim to enhance our collaborations with these other, related initiatives. The DYAMOND project (Stevens et al., 2019; Takasuka et al., 2024) pushed forward the evolution of global storm-resolving climate simulation in a multi-model framework, and this is being expanded by both national efforts and potential international initiatives such as the Earth Virtualization Engines (EVE; Stevens et al., 2024). These global storm-resolving modelling (GSRM) efforts share with HighResMIP a lack of basic characterisation – one example would be metrics of climate sensitivity – and so several new experiments are proposed in HighResMIP2 to improve the links with CMIP models and potentially address this lack of metrics. GSRM models would obviously be welcome in HighResMIP2, especially if they can complete the full HighResMIP2 Tier 1 simulations. This work also builds on and complements other WCRP activities, including those with similar goals of exploring climate change impacts at regional scales using other techniques such as downscaling via the Coordinated Regional Climate Downscaling Experiment (CORDEX), often with similar resolutions at the regional scale. Furthermore, new international efforts such as the WCRP lighthouse activities, including Digital Earths, Explaining and Predicting Earth System Change, and Safe Landing Climates activities (Sherwood et al., 2024), as well as the European Destination Earth programme (Hoffmann et al., 2023; Wedi et al., 2022), are well-positioned to make use of HighResMIP2 simulations to explore extreme events and regional impacts of climate change.
This paper is structured as follows. Section 2 outlines the specific goals of HighResMIP2, as well as the general simulation approach. Section 3 details the experimental design and HighResMIP2 protocols. The data issues are discussed in Sect. 4, and Sect. 5 provides an overview of the evaluation and metrics framework to be used for analysis. Finally, Sect. 6 discusses the main takeaways of the effort.
Three overarching questions frame the scientific scope of HighResMIP2.
-
Can HighResMIP simulations help to better quantify and even reduce key structural uncertainties in future climate projections discussed in the IPCC AR6 report, and can it contribute to and supplement the CMIP7 AR7 Fast Track science goals, particularly those related to future weather extremes, the pattern effect (interaction of forcings, feedbacks, and natural variability), and tipping points?
-
What resolution-dependent atmospheric or oceanic processes are missing from standard-resolution CMIP6 models that might explain recent changes in our climate and might produce different future climate projections over the next few decades?
-
Can we combine information from HighResMIP2 and CMIP7, together with other data sources and processing (e.g. bias correction), to produce more robust plans for future adaptation and climate risk planning?
The main reason that such questions cannot already be answered with existing data is that the models in HighResMIP1 were configured to be as similar as possible to their standard-resolution counterparts and used simplified aerosol forcings. This provided an important baseline for scientific understanding of the role of horizontal resolution on simulation quality but crucially did not produce optimal simulations of present and future climate at high resolutions. In addition, most of the existing simulations do not have eddy-rich ocean resolutions, which limits the processes they are able to explicitly simulate and hence our ability to quantify future uncertainty (e.g. Chang et al., 2020; Yeager et al., 2023).
As noted above, CMIP6 HighResMIP1 enabled significant progress in studying the role of horizontal resolution in global climate simulations. Various aspects of global and regional climate have been assessed (HighResMIP publications, 2024), including scale interactions, circulation in the atmosphere and ocean, the role of ocean eddies in upwelling systems, extremes and hydrological cycles, and tropical and extratropical cyclones. The poor representation of these processes due to a lack of resolution led to key uncertainties in future projections (e.g. as described in the IPCC AR6 report, with specific examples below). The main objective of HighResMIP2 is to build on the HighResMIP1 baseline to further our understanding of how model resolution affects various aspects of climate simulation and to assess the implications for future climate projections and climate risk and adaptation planning with optimised high-resolution models.
To scope our ambitions, it is useful to consider what model resolutions may be possible for CMIP7 HighResMIP2, given ongoing advancements in models and supercomputing. Chang et al. (2020, 2023) have demonstrated that it is now possible to produce long CMIP DECK-style simulations (with multiple ensemble members) using coupled model resolutions of 25 km in the atmosphere and 10 km in the ocean component, while several groups used similar eddy-rich ocean resolutions (below 10 km) in CMIP6 HighResMIP1 (Caldwell et al., 2019; Chang et al., 2020; Grist et al., 2021; Roberts et al., 2019). Hence we anticipate more coupled models with an ocean resolution that can more accurately represent the ocean's mesoscale, including eddies, boundary currents, and Southern Ocean processes (see Table 1). We also expect enhancements in atmosphere resolution, perhaps to 10 km or finer; this may lead to challenges related to spatial scales at which resolved model physics and dynamics may overlap with convective parameterisation (Hong and Dudhia, 2012), the “grey zone”, but this has the potential to produce more realistic climate extremes and upscale feedbacks (Scaife et al., 2019). In addition to resolution alone, many model developments (both scientific and technical) flowing from storm-resolving modelling approaches can also help to optimise model configurations for HighResMIP2. We emphasise that the choice of model physics and dynamics settings with resolution (such as the treatment of atmospheric deep convection or implementation of aerosol forcing) is left with the modelling groups.
It is likely that most if not all of the HighResMIP2 simulations will only include the physical climate and will lack many aspects of Earth system complexity (for example the carbon cycle and biogeochemistry), given the cost, but such simulations would be warmly welcomed to begin exploring the interactions between resolution and complexity. Other aspects of complexity, such as the representation of ocean tides, ocean waves, and ice–ocean interactions including ice shelves and sheets, may be represented in some models.
We organise the science questions into several broad areas that are enabled by the different simulation types (as detailed in Sect. 3): atmosphere-only and coupled. We recognise the relative strengths and limitations of prescribed sea surface temperature (SST) or sea ice configurations related to the realism of upscale feedbacks, which are complementary to coupled simulations that allow us to explore a fully interactive system, as well as understand the potential role of SST biases in the coupled simulations.
Atmosphere-only simulations allow us to ask the following question: given external forcings and prescribed SST and sea ice, how does the coupled atmosphere–land system respond via processes and extremes? We can thus ask whether increasing model resolution can lead to fundamentally different insights into large-scale climate variability and future trends, with implications for policy and climate risk. Extreme precipitation events and mesoscale convective systems (MCSs) also require further investigation (e.g. Na et al., 2022; Zhao, 2022). These events have a significant impact on the environment and can cause severe damage to infrastructure and human life. It may also be possible to identify potential future risks associated with specified patterns and levels of warming (Zhao and Knutson, 2024). Atmospheric resolutions of around 10 km and higher are expected to offer a much more realistic range of intensities for extreme events, such as tropical cyclones (TCs; Li et al., 2021) and MCSs. This enhancement could offer new insights into how TC genesis and rapid intensification, as well as MCSs, may change in a warmer climate. Such processes can also be assessed in fully coupled models, which enable a full range of interactions and feedbacks.
With horizontal resolutions beginning to edge into the grey zone, aspects of climate variability, such as the Madden–Julian Oscillation, the diurnal cycle, and hot spots with complex terrain like the Tibetan Plateau, can be addressed (Bao et al., 2020). This opens up new avenues for research and allows us to better understand the underlying mechanisms relevant to these phenomena and regions. For this reason we propose new short simulations (1 year) to incorporate contributions from models with resolutions ranging from the standard CMIP to storm resolving (e.g. linking with DYAMOND3; Takasuka et al., 2024). These simulations will focus on process-based analysis and linking understanding across different communities.
Coupled simulations will investigate the robustness of projected large-scale changes to the climate as ocean grids are refined, ideally down to eddy-rich scales. The ocean mesoscale, which refers to the physical processes that occur on a scale of 10–100 km, plays a crucial role in key aspects of ocean circulation (e.g. Chang et al., 2020; Chassignet et al., 2020; Hewitt et al., 2022; Small et al., 2014) and shows evidence for substantial changes in a warming world (Beech et al., 2022; Martínez-Moreno et al., 2021), but it is unresolved in standard-resolution CMIP simulations. However, the IPCC AR6 report acknowledges that, due to insufficient model resolution, there is considerable uncertainty in predicting future trends in regions such as the Southern Ocean (Fox-Kemper et al., 2022) since eddies control the Southern Ocean overturning by compensating for wind-driven changes (e.g. Bishop et al., 2016; Farneti et al., 2010, 2015; Gent and Danabasoglu, 2011; Meredith et al., 2012). This uncertainty could have significant implications for sea level rise (Li et al., 2022), as well as the uptake of heat and carbon (Xu et al., 2023), for example, with new observations suggesting an important role of ocean eddies in Antarctic ice shelf melting (Gao et al., 2024). The ocean mesoscale is also important in eastern boundary upwelling systems (EBUSs; Chang et al., 2023), which are nutrient-rich and provide a large proportion of productive biomes. Refined ocean resolution in EBUSs leads to narrower and stronger along-shore ocean flow and coastal upwelling, resulting in larger across-shore temperature gradients than in coarse-resolution models (Small et al., 2024). In terms of ocean boundary currents such as the Gulf Stream, nearly all CMIP6 models (including most of HighResMIP1) have a common bias in which the current separates from the coastline too far north (Chassignet et al., 2020), which can be improved at eddy-rich resolutions, with implications for regional climate and future projections (Grist et al., 2021; Moreno-Chamarro et al., 2021). Enhancing the representation of ocean transports through narrow straits, such as the Bering Strait, has been demonstrated to have significant upscaling effects on large-scale climate responses, such as Arctic amplification (Xu et al., 2024). Models with an ocean resolution of 25 km or finer are beginning to explore these emerging features and their implications for present and future climate (e.g. Chang et al., 2023; Moreno-Chamarro et al., 2021; Rackow et al., 2022). Hence new simulations and more multi-model studies will better constrain and may be able to reduce structural uncertainty in future projections in all these regions.
Ongoing analysis of the only existing CMIP6-style multicentennial simulation with an eddy-rich ocean (Chang et al., 2020) has demonstrated how such model resolutions can open up new science. In addition to exploring the impacts on mean state and variability, ongoing work (Yeager et al., 2023) indicates that these higher-resolution models may capture SST trends of the recent historical period, particularly the relative cooling in the Southern Ocean and tropical eastern Pacific, which are poorly represented in all CMIP6 models (Seager et al., 2019, 2022). Such results have important implications for climate risk and adaptation planning over the next few decades (Sobel et al., 2023; Zhao and Knutson, 2024) because the state of the tropical Pacific has implications for teleconnections and regional extremes at large-scales (e.g. floods and droughts as seen during El Niño–Southern Oscillation (ENSO) events) and implications for the distribution of extreme events such as TCs. The model used in Chang et al. (2020) also has improved skill and signal-to-noise properties (Yeager et al., 2023), suggesting that reducing biases in the Southern Ocean is important for better decadal predictions.
In addition to the role that increased resolution might have in the large-scale climate, high-resolution simulations underpin new science endeavours to model scale interactions and upscale effects of small-scale processes that are relatively unexplored due to the lack of available simulations. Scoccimarro et al. (2020) show how tropical cyclones can lead to drying of large areas such as the Maritime Continent. For questions such as how extreme events impact the main modes of climate variability (e.g. TCs and ENSO modulation), we need models that faithfully represent chains of processes from extreme events back to the large scale. In a similar vein, Schemm (2023) shows how small-scale diabatic processes can play a key role in addressing long-standing midlatitude storm track biases.
Using eddy-rich or kilometre-scale models, we might obtain new insights into abrupt changes or tipping points (Armstrong McKay et al., 2022). Abrupt changes can include events like the collapse of the Atlantic meridional overturning circulation (AMOC) or Amazon rainforest or melting of Arctic or Antarctic ice sheets and the consequences for the global climate and extremes. For example, an enhanced atmospheric resolution improves the spatiotemporal distribution of rainfall over the Amazon basin due to improved representation of atmospheric dynamics (Monerie et al., 2020). Ocean eddies have also been shown to be important in the development and properties of marine heatwave extremes (Bian et al., 2023).
The IPCC AR6 chapter on extremes described uncertainties in future changes to processes such as TCs, which need both high-resolution and decade-to-century-timescale simulations to assess variability and change. We hope that HighResMIP2 simulations can help to further address some of these uncertainties. Using a 1-year atmosphere-only experiment (see Sect. 3) as a common baseline for models from CMIP6 resolution down to the kilometre scale, we hope to better understand the drivers and processes that govern such extremes (e.g. precursor TC seeds such as MCSs) and hence better constrain likely future changes. As indicated in the Introduction, many of the HighResMIP areas of interest are strongly aligned with national and international projects. We will be working in collaboration with these projects, via both coordinated experiments and data sharing, as well as analysis, and we anticipate that this will make HighResMIP2 an invaluable platform for both scientific research and stakeholder engagement.
HighResMIP1 focused on the time period of 1950–2014 (historical) and 2015–2050 (future) for atmosphere-only and coupled simulations, using only one future scenario (the Shared Socioeconomic Pathway, SSP5-8.5, from ScenarioMIP; O'Neill et al., 2016), with standard- and high-resolution versions of each model, to balance affordability by as many modelling groups as possible, while still retaining multidecadal timescales to examine model biases, climate variability, and extremes. The standard-resolution versions of the models were meant to have a counterpart in CMIP6 DECK and hence be characterised there. It should be noted that in CMIP6, the historical period was defined as 1850–2014, and future scenarios started from 2015. In CMIP7 we anticipate that the historical period will extend to 2022. Once the CMIP7 forcings (Dunne et al., 2024) are available, HighResMIP2 will provide details of how these should be implemented in our proposed simulations.
Based on feedback from users and producers of the HighResMIP output data, we propose some key changes to the experimental designs used in HighResMIP1 (see Fig. 2).
-
We will extend the coupled future simulation (highres-future) to at least 2100, with a change in future scenario away from the high-emission SSP5-8.5 scenario to one with lower radiative forcing magnitude (CMIP7 ScenarioMIP medium scenario; van Vuuren et al., 2025), also enabling stronger links with the CMIP, CORDEX, and impacts communities.
-
We will encourage groups to produce simulations with models optimised for use at a high resolution (e.g. Hourdin et al., 2017), with transparent and documented methods.
-
We will allow the use of any aerosol scheme desired (rather than utilising the MacV2-SP aerosol properties scheme (Stevens et al., 2017) as in HighResMIP1) – this is a significant change that reduces the burden of developing and tuning a separate model from that used for other modelling activities, including CMIP.
-
We will reduce the length of the highresSST-present experiment (atmosphere-only) to 1980–2022 to focus on a period with better observations and enable the use of a satellite-derived product for SST and sea ice with a native resolution of °, also suitable as a boundary condition for much-higher-resolution simulations.
-
We will remove the highresSST-future experiment (atmosphere-only). This attempted to extend highresSST-present into the future (2015–2050) by constructing SST and sea ice forcings that combined observations and model projections. However it was a source of some misinterpretations and highlighted the difficulty of joining the historical forcing to a projected future change in a meaningful way.
We also propose several new experiments based on our science questions and on an aspiration to better connect with the CMIP DECK simulations.
-
We propose specific warming level experiments using patterned SST and sea ice changes, parallel to highresSST-present over the 2003–2022 period, as an idealised way to investigate the impact on climate extreme processes.
-
We propose a uniform +4 K SST experiment in the atmosphere-only experiment in order to calculate some overall HighResMIP model metrics and characterisations useful for comparison with CMIP and DYAMOND efforts (this is a standard experiment in the Cloud Feedback Model Intercomparison project, CFMIP; Webb et al., 2017).
-
We propose adding a 4xCO2 experiment to the coupled simulations in order to diagnose effective climate sensitivity (EffCS), although here that measure will be relative to a 1950-control rather than the standard CMIP DECK experiment relative to 1850. There is some evidence that 20–30 years of this simulation may be adequate to estimate the final EffCS (usually after 150 years; Dong et al., 2020).
-
We propose adding a short experiment (∼1 year in length) to enhance collaboration across more modelling groups, from standard CMIP-type models to kilometre-scale global models and including numerical weather prediction centres. This atmosphere-only simulation would be in support of the process intercomparison projects (PIPs) advocated by the WCRP (World Climate Research Programme, 2022), would have strong links to DYAMOND3 (Takasuka et al., 2024), and would enable coordinated detailed analysis (with an expanded diagnostics list).
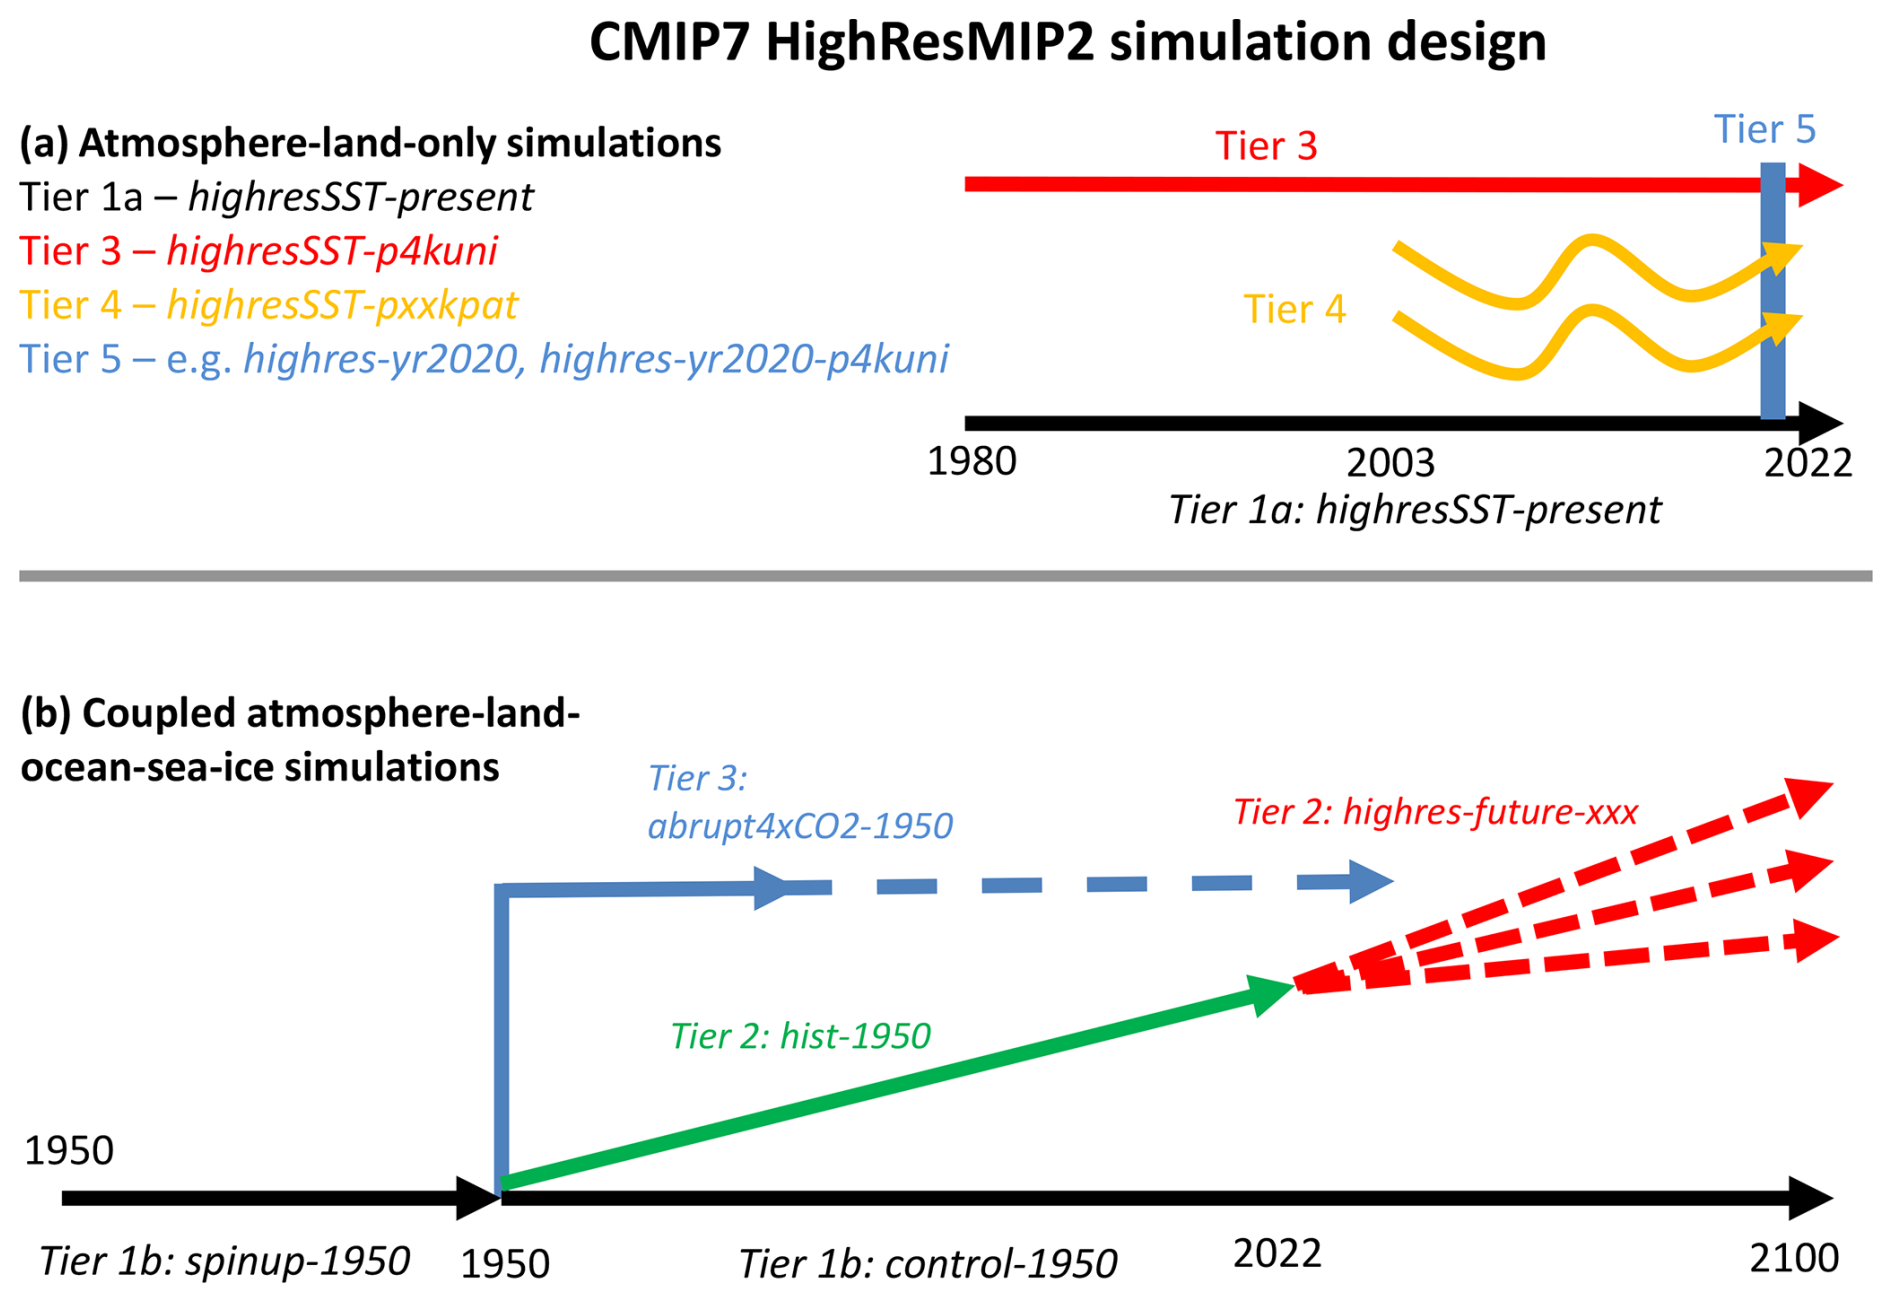
Figure 2Illustration of the HighResMIP2 simulations in tiers 1–5 for (a) atmosphere-only and (b) coupled model experiments. The experiment names (in italics) and tiers refer to the information in Table 2.
Figure 2 illustrates the experiments envisioned for HighResMIP2. As with HighResMIP1, we consider several tiers of experiments (Table 2), but Tier 1 remains the essential entry card to HighResMIP2, while the others are optional but individually stand as useful community simulations. Figure 3 illustrates how these simulations link to existing simulations in CMIP and in other community MIPs.
Table 2Proposed HighResMIP2 experiments, including tier, name, model years, total lengths, and desired minimum-ensemble size.
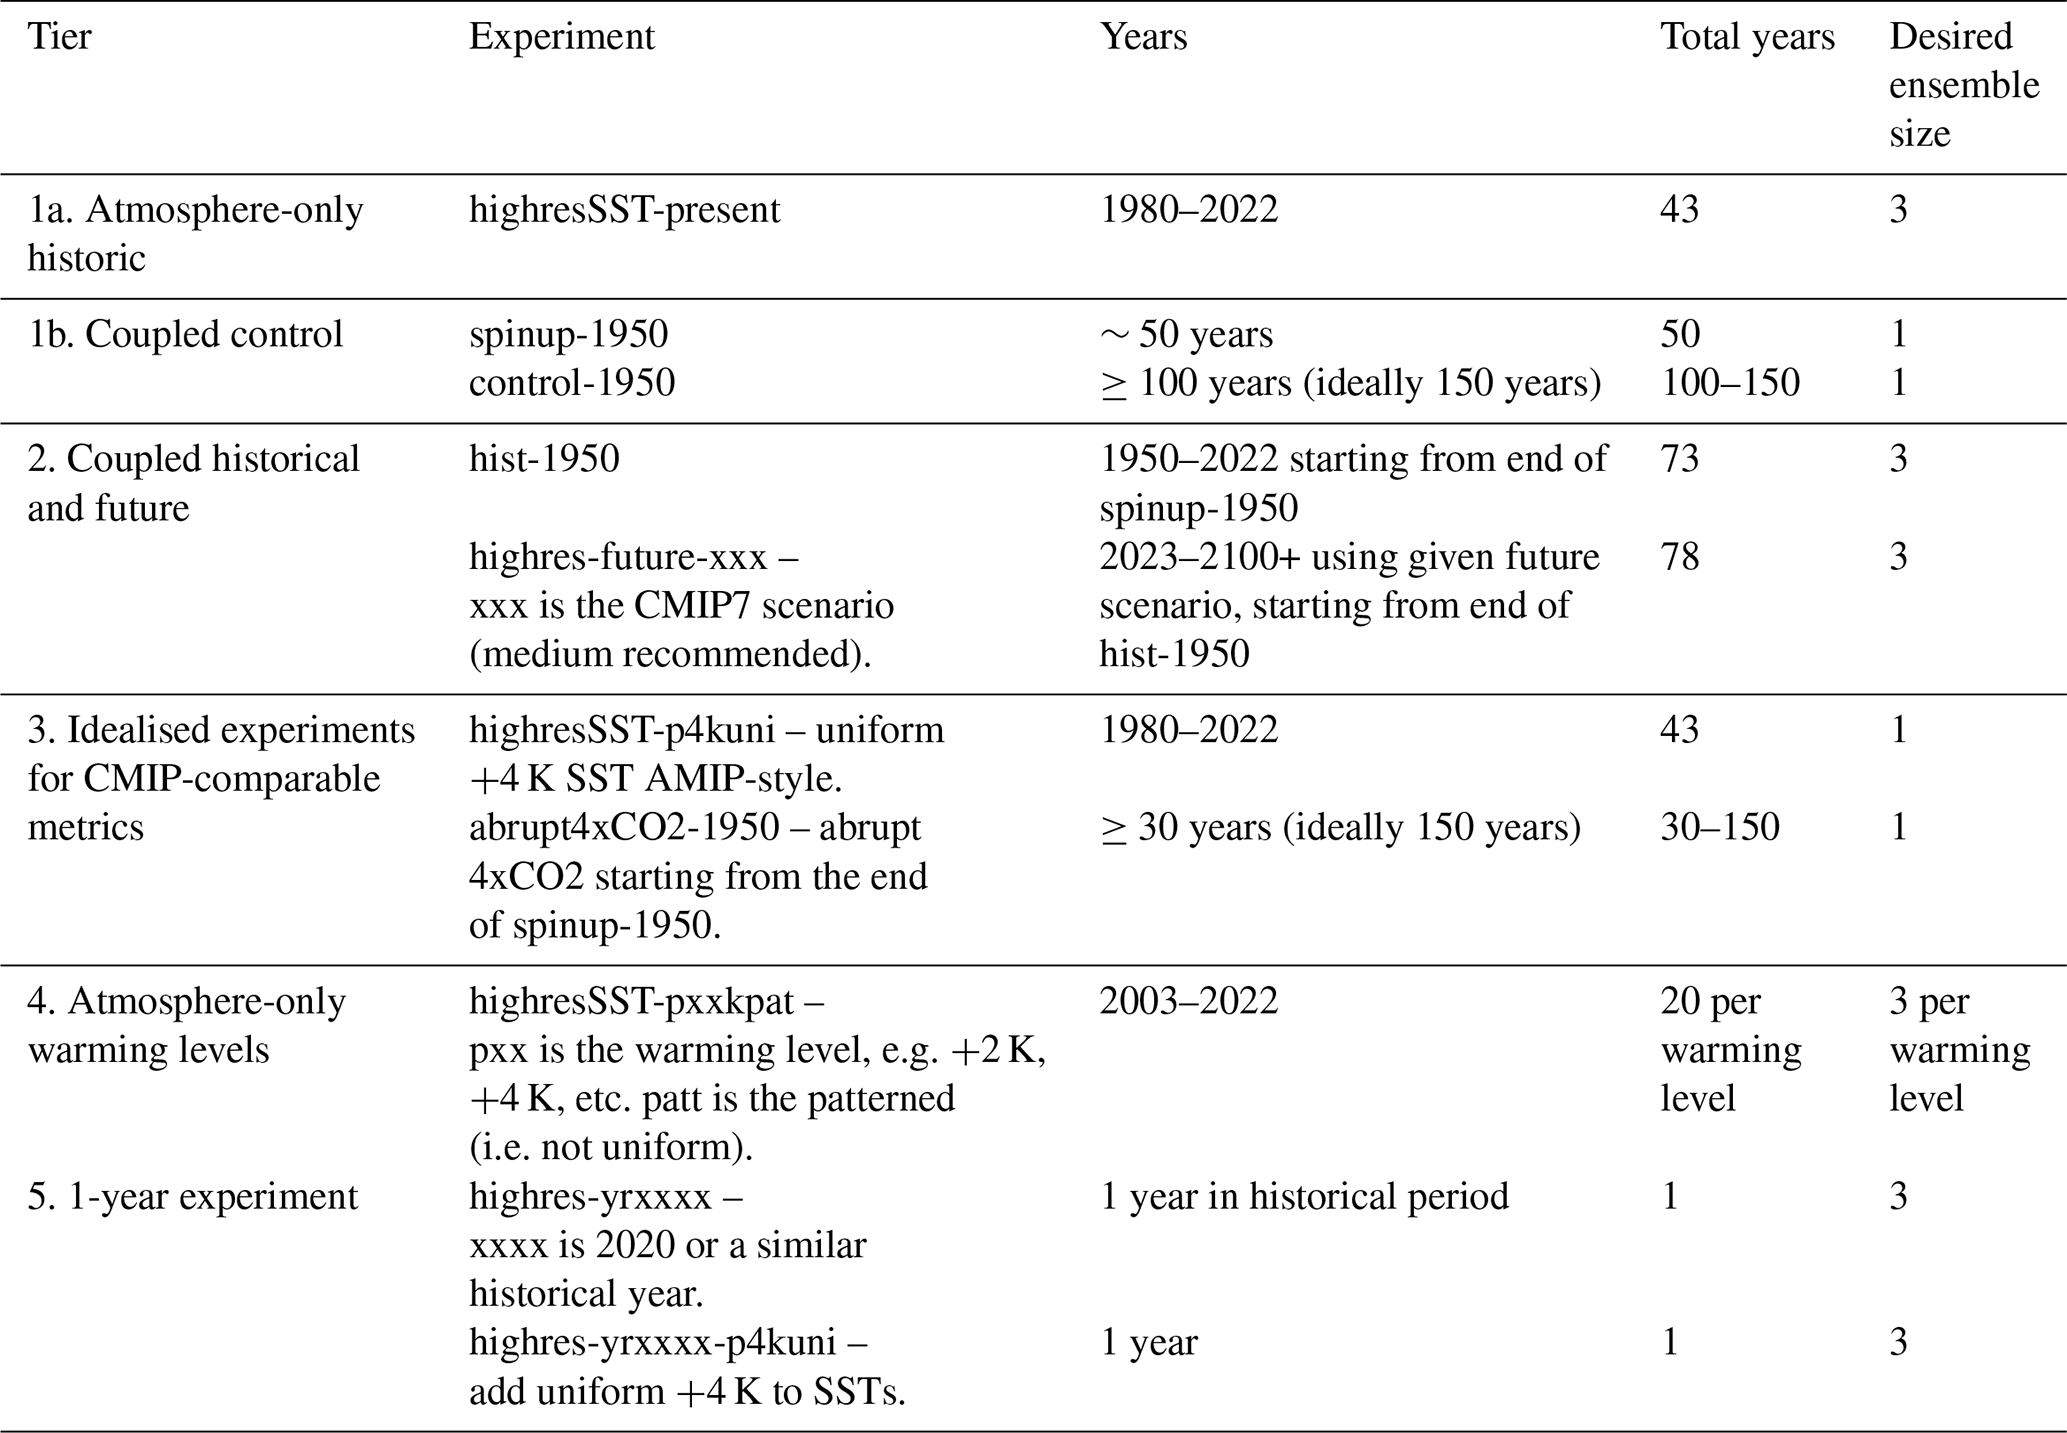
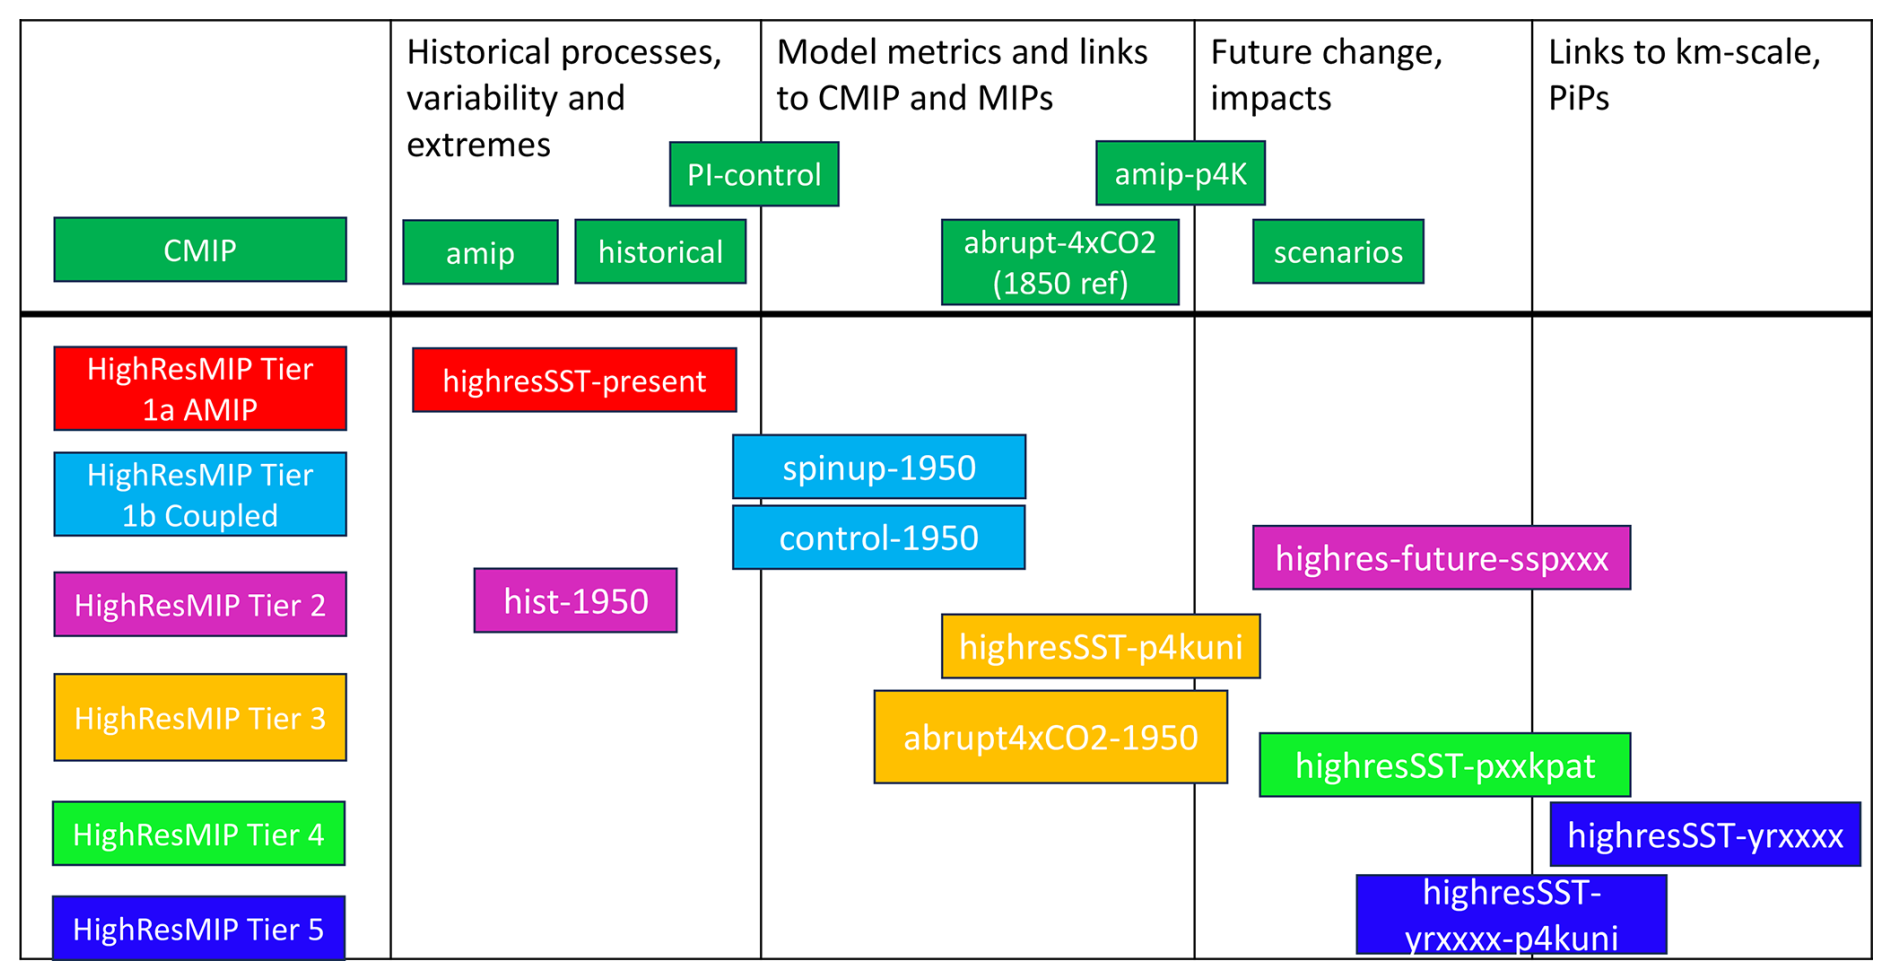
Figure 3Illustration of the different tiers of HighResMIP2 simulations and how they align with applications and correspond to CMIP simulations.
3.1 Detailed description of tiered experiments
The entry card to HighResMIP2 will require at least one of the Tier 1 simulations (1a or 1b) to be completed at high resolution, to allow groups with different capabilities (i.e. atmosphere-only or coupled modelling) to contribute. As stated before, we consider high resolution to be 25 km or finer in both the atmosphere and ocean/sea ice components. Both Tier 1 simulations can be completed using the recommended initial conditions for the atmosphere and ocean, with forcings available via CMIP inputs4MIPs or from other open-access datasets (detailed below), and hence do not require any previous simulation or spinup (Haarsma et al., 2016). Groups unable to complete the Tier 1 simulations are still encouraged to participate in other experiments, but their data will not be able to be published to ESGF as HighResMIP2.
For HighResMIP2, we do not require a parallel standard-resolution simulation (i.e. using a CMIP-class model), given the existing archive from CMIP and HighResMIP1. We recognise that such simulations still have value for understanding the impact of resolution and will still be welcomed if produced, but for some groups, HighResMIP itself is “low” resolution, and we do not want to exclude such groups. For coupled models, we advocate for more models with an eddy-rich ocean (∼10 km resolution or finer), as there is increasing evidence that such models can provide new insights into climate variability and change (e.g. Chang et al., 2020; Zhang et al., 2022).
Providing multiple ensemble members for each simulation is very important to enable some measure of variability and uncertainty, as well as increase the sample size of any event sets. Although one ensemble member will remain the entry point for participating in HighResMIP2, we advocate for at least three members for each simulation, as that would give more confidence in the results of model analysis (e.g. Bacmeister et al., 2018; Kay et al., 2015; Roberts et al., 2020a; Rodgers et al., 2021; Stansfield et al., 2020) and the role of external forcing, particularly given that eddy-rich oceans might enhance variability (Penduff et al., 2018). The provision of even larger ensemble sizes (likely at a standard resolution) would be welcome to enable detection of differences using a smaller ensemble of high-resolution simulations.
Given the costs involved, we anticipate that most HighResMIP2 models will not include the Earth system components that enable the simulation of a carbon cycle, and hence the following will assume the use of concentration-driven rather than emissions-driven simulations.
As noted above, appropriate CMIP7 forcings should be used where possible. If complexity is reduced (for example aerosol forcing being prescribed rather than prognostic), then full details of the implementation should be documented so that users of the data can be fully informed. In the choice of future scenarios, we will be guided by advice from ScenarioMIP and their official CMIP7 scenarios (van Vuuren et al., 2025) – given the small ensemble sizes likely from HighResMIP2 simulations, we propose recommending the medium scenario in order to produce a larger multi-model ensemble but welcome additional simulations exploring uncertainty in future warming. However, the main goal of HighResMIP2 is not to explore this uncertainty but to understand the implications of a given scenario in terms of future climate extremes, impacts, and feedbacks at resolutions well beyond those typically used in CMIP.
3.1.1 Tier 1a: highresSST-present
This is an atmosphere-only simulation similar to the CMIP Atmosphere Model Intercomparison Project phase 2 (AMIP; Gates et al., 1999). The period of 1980–2022 is chosen to maximise comparability with observational datasets, to align better with CMIP AMIP, and to enable ensembles of simulations to be produced. At the model resolutions used in HighResMIP, the resolution of the forcing has been shown to be important in the simulation of extremes (Liu et al., 2021), and hence HighResMIP retains the use of high-resolution daily forcing (in contrast to CMIP AMIP). However, we propose switching from the previous daily ° HadISST.2.2.0 dataset (Kennedy et al., 2017) to the 0.05° European Space Agency (ESA) SST Climate Change Initiative (CCI) Analysis v3.0 and associated sea ice concentration data from the EUMETSAT Ocean and Sea Ice Satellite Application Facility (OSI SAF) (Embury et al., 2024; Good and Embury, 2024) for both its high-resolution and its regular update cycles. We continue to use daily mean fields with no diurnal cycle, which modelling groups should interpolate to their model grid in the usual way. A comparison of the trends in surface temperature from these various SST products is shown in Fig. 4 (calculated following Sobel et al., 2023), as the trends have important consequences for the model simulations (Sobel et al., 2023; Zhao and Knutson, 2024) and are generally not replicated in coupled model simulations (Seager et al., 2022). The noise seen in Fig. 4b is thought to be a result of how that dataset was constructed (specifically for CMIP6 HighResMIP).
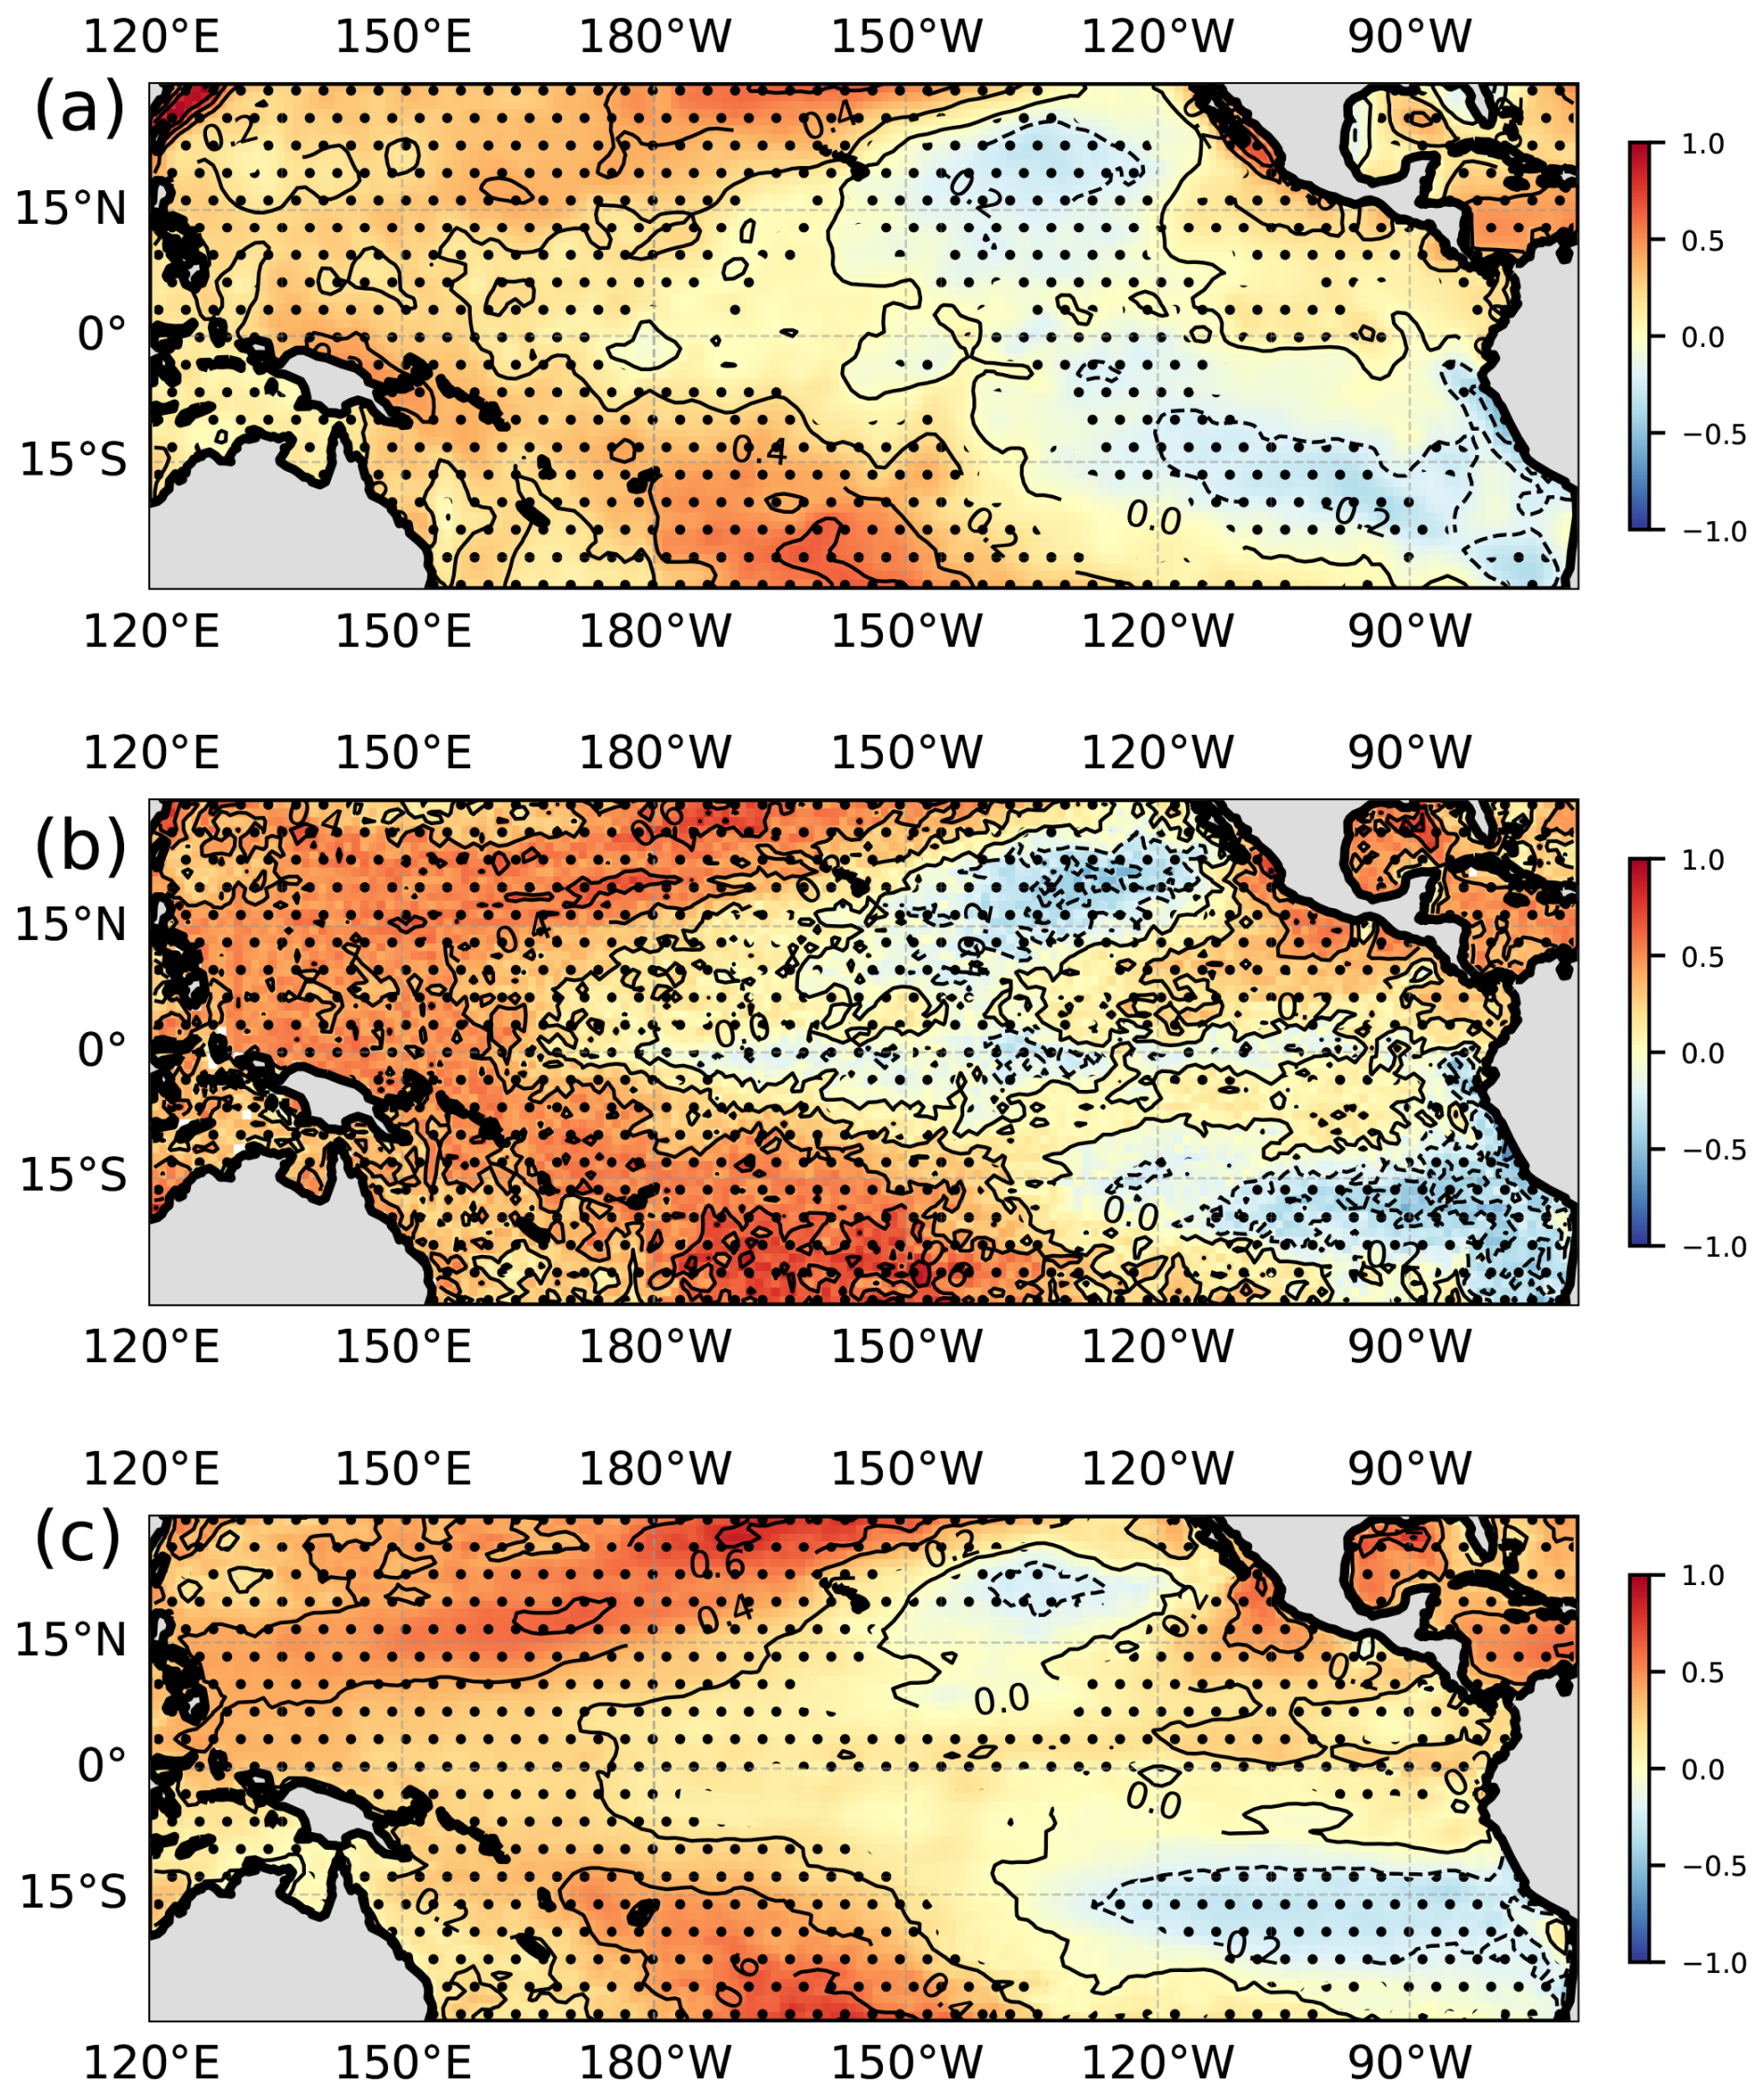
Figure 4Sea surface temperature trends (per time period, i.e. 36 years, 1980–2015 using annual means) for different datasets. (a) HadISST1, (b) the HighResMIP dataset used in HighResMIP1, (c) the ESA CCI SST dataset proposed for HighResMIP2. The common time period is constrained by HighResMIP1 only reaching 2015 with the observed data and ESA CCI only starting in 1980. The units are K per 36 years.
We recommend using the European Centre for Medium Range Weather Forecasting (ECMWF) Reanalysis v5 (ERA5; Hersbach et al., 2020) for the atmosphere and land initial conditions for 1 January 1980. These can be obtained as described in Appendix A. The first 2 years (1980–1981) will be considered spinup for the land surface, so detailed analysis should be done on the period of 1982–2022. Other forcings are the same as for CMIP7 AMIP. However, we recognise that 2 years may be too short for the land surface to spin up, and so alternative methods to produce its initialisation are acceptable but should be fully documented.
We recognise the many limitations of SST-driven simulations, particularly in terms of unrealistic surface heat fluxes in both the extratropics (e.g. Kim et al., 2024; O'Reilly et al., 2023) and tropics (Wang et al., 2005) that potentially worsen as resolution increases and more features are resolved. However, it remains the simplest, most accepted, and most comparable experimental design.
3.1.2 Tier 1b: spinup-1950
This experiment provides a multidecadal spinup for the coupled model simulations, and its final output is used as initial conditions for the control-1950, hist-1950, and highres-4xCO2 scenarios. It is essentially the same as in HighResMIP1. Most groups in HighResMIP1 ran the spinup-1950 simulation for 50 years, starting from initial conditions defined in Appendix B. There are trade-offs between the length of this simulation (to produce a more equilibrated ocean) and the nonzero top of atmosphere (TOA) in 1950 providing net heating of the ocean and hence forcing it away from its initial conditions. Other methods to provide improved ocean initial conditions and spinup are being sought, led by the WCRP ESMO (Earth System Modelling and Observations) group (World Climate Research Programme, 2024).
All forcings should be set to values representative of a constant 1950s state, but the precise form may vary according to the forcing. For solar and ozone forcings, we suggest producing an 11-year climatology centred on 1950 to average the solar cycle. Greenhouse gas (GHG) concentrations can simply use the values reached in 1950 as defined in CMIP. For aerosol emissions and volcanic forcing, a mean over 10 years is suggested around 1950 (i.e. 1946–1955 if available or 1950–1959 if not).
3.1.3 Tier 1b: control-1950
This will be a backward-compatible simulation design (although with updated forcings) to HighResMIP1 and remains a valuable way to gauge model variability without changes in interannual forcing. It is initialised from the end of spinup-1950, with constant 1950s forcings as were used there. It will be essential to compare the optimised high-resolution model versions in HighResMIP2 to those submitted previously in HighResMIP1. This simulation should be run for at least 100 years, ideally 150 years if the future scenarios are also going to be produced (see below), to act as a reference to the simulations with varying forcings and hence enable some comparison of model drift against forced changes.
3.1.4 Tier 2: hist-1950
This is similarly backward compatible to HighResMIP1 and is initialised from the end of spinup-1950. It uses time-varying forcings from CMIP7, mimicking the CMIP7 historical simulation but running from 1950 to 2022.
3.1.5 Tier 2: highres-future-xxx
This is the coupled future projection simulation and is initialised from the end of the hist-1950 simulation. HighResMIP1 only used the “high-emissions” future scenario SSP5-8.5 in the simulation design, but based on current policy and actions, the current level of CO2 emissions is well below this scenario (Hausfather and Peters, 2020), making it less attractive for use. Factors influencing our choice include the need to explore plausible worst-case scenarios; examining the implications of a wide range of warming levels, including the possibility of tipping points; a desire for enhanced collaboration with other groups (e.g. CORDEX used SSP3-7.0 as one of their scenarios); and advice from the CMIP Panel. Based on the CMIP7 ScenarioMIP proposals (van Vuuren et al., 2025), we propose recommending their medium future scenario, estimated to produce a radiative forcing around or possibly slightly above 5 W m−2 at the end of the century. Simulations using other scenarios will still be accepted, but a larger multi-model ensemble using this preferred scenario would enable more coordinated science.
We propose adding several idealised simulations to mirror those in CMIP DECK so that we can build a comparison of metrics between DECK and HighResMIP2 and hence have some characterisation of HighResMIP2 models.
3.1.6 Tier 3: highresSST-p4kuni
To this end, we propose a uniform +4 K experiment. This simulation is parallel to highresSST-present, using all the same forcings apart from SST, with +4 K added to all SST points uniformly. It is analogous to the CFMIP experiment amip-p4k but using the HighResMIP2 SST forcing rather than AMIP. It will be used to look at climate feedbacks and precipitation responses, with further work needed to build a correspondence between metrics from this simulation and comparable ones from CMIP/CFMIP simulations.
3.1.7 Tier 3: abrupt4xCO2-1950
In addition, we propose an abrupt 4xCO2 simulation. This coupled simulation starts from the end of the spinup-1950 experiment and enforces an instantaneous increase in 4xCO2 (analogous to the CMIP experiment abrupt-4xCO2) but referenced to 1950 and parallel to the control-1950 simulation. Evidence suggests (Dong et al., 2020) that for the abrupt 4xCO2 simulation, years 1–20 of the simulation produce metrics (such as effective climate sensitivity, EffCS) that strongly correlate with the longer-term (years 21–150) feedback but may be considerably smaller in magnitude. Given the expense of high-resolution simulations, just 20–30 years of this simulation could produce useful information for the community. Further work will be needed to understand the relationship between the 4xCO2 experiment referenced to 1850 (as in CMIP) and 1950 (as here in HighResMIP) and the role of ongoing model drift. An illustrative example comparing the EffCS calculated from CMIP and HighResMIP simulations (three ensemble members each) using the same model science configuration from one model is shown in Fig. 5.
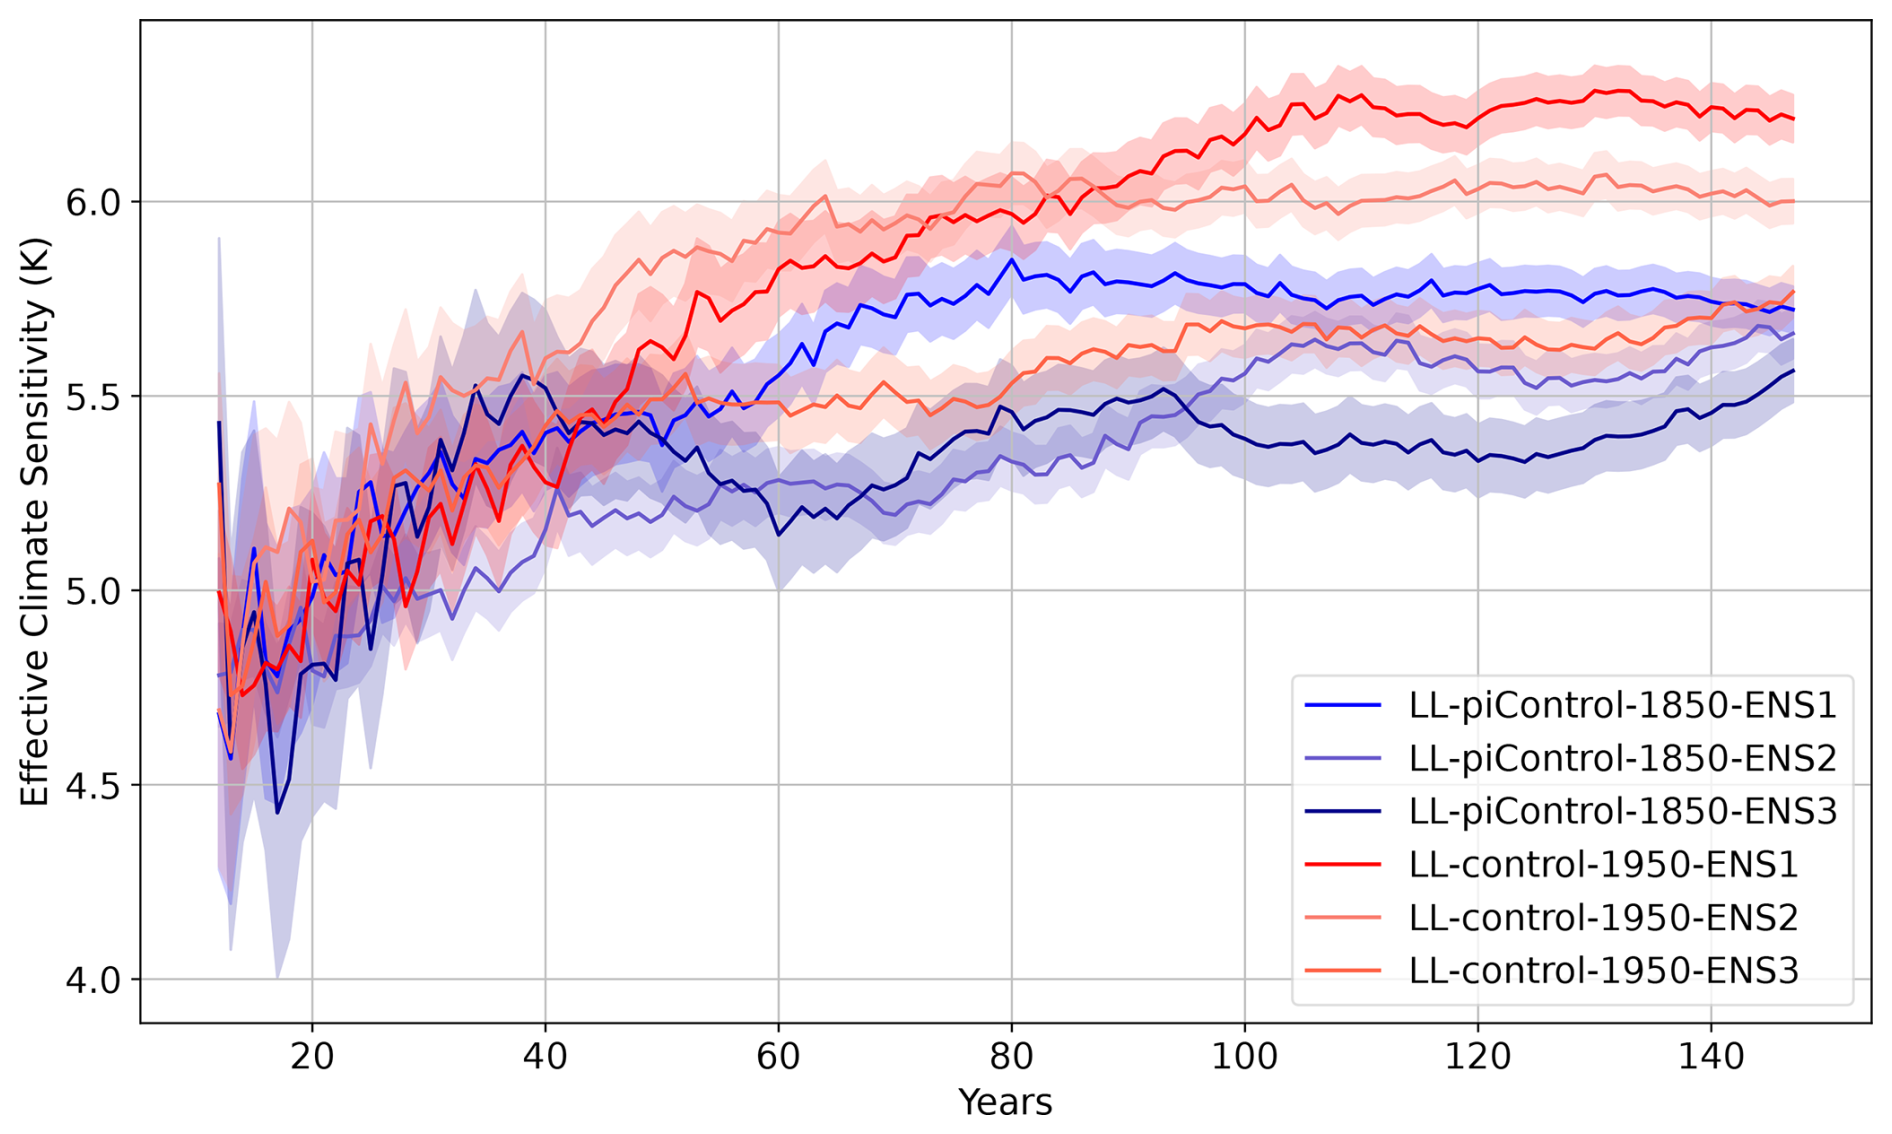
Figure 5An illustrative example of model metrics enabled by new HighResMIP2 simulations: effective climate sensitivity (EffCS) calculated with successively more years of data using one model, in this case an ∼130 km atmosphere coupled to a ∼100 km ocean. Blue shades show three ensemble members using the standard CMIP6 DECK piControl and abrupt-4xCO2 simulations to calculate EffCS over 150 years. Red shades show three ensemble members using the standard HighResMIP experimental design, 50 years of spinup-1950, and then the control-1950 and abrupt4xCO2-1950 simulations in parallel. Using only 30 years of simulation clearly does not define the final (150-year) EffCS but may at least give a useful lower bound. Establishing a relationship across experimental designs will need more (multi-model) analysis.
3.1.8 Tier 4: highresSST-pxxkpat
In order to make the SST-forced simulations more clearly actionable than they were in HighResMIP1, we propose creating different global warming level experiments to be run in parallel with the highresSST-present simulation. Such atmosphere-only experiments use patterned SST (and sea ice) changes imposed on the observed 2003–2022 period (a 20-year subset to reduce the global trend within the period), with the globally averaged warming levels of surface air temperature calculated above the historical values and with appropriate changes to other forcings. The approach has been demonstrated by the “half a degree additional warming, projections, prognosis and impacts” (HAPPI) experiment (Mitchell et al., 2017; Wehner et al., 2018) and the database for policy decision-making for future climate changes framework (Ishii and Mori, 2020). Similar to the global warming levels methodology used in IPCC AR6 for global surface air temperature, these simulations can be linked to global mitigation policy targets and are shorter and less computationally expensive than fully coupled integrations, thus permitting ensembles of simulations. Structural uncertainty in SST changes (and consequences for climate impacts) can be directly examined by utilising multiple perturbed SST datasets constructed from individual large-ensemble CMIP-class models or the entire CMIP database or by explicitly encompassing different SST trend patterns such as in the tropical Pacific. Such simulations enable the study of impacts for a given warming level in a simplified atmosphere-only framework, thus providing improved links with CMIP and insight into processes of climate extremes. It is worth noting that the use of warming level experiments is commonplace in event storyline simulations as well (e.g. Huprikar et al., 2023).
3.1.9 Tier 5: highres-yrxxxx (and highres-yrxxxx-p4kuni)
These simulations are expected to be 1 year in duration, short enough to be feasible for kilometre-scale models (finer resolution than Tier 1) as well as more typical climate resolutions (including those used for Tier 1 and CMIP7 more broadly) and hence enabling comparisons across classes of models. This will be designed to be as consistent with the DYAMOND3 protocol as possible (Takasuka et al., 2024) and is envisioned to enable faster testing and experimentation (compared to the Tier 1–4 simulations) and to allow assessment of basic aspects of climatology and daily–subdaily aspects of variability. These will be atmosphere-only with prescribed SSTs and sea ice. Groups could consider using this simulation to test further increases in their underlying model component resolutions that approach those of DYAMOND. The preferred year is 1 March 2020–28 February 2021 to match that used in DYAMOND3, and it lies within and towards the end of the time range of highresSST-present in Tier 1 in order to make the most use of the newest observational datasets. Additional years could be added (e.g. to accompany new satellites such as EarthCARE; Illingworth et al., 2015). A uniform +4 K experiment (highres-yrxxxx-p4kuni) following Cess and Potter (1988) is also likely, enabling a chain of metrics on climate feedbacks to be evaluated sequentially from this 1-year simulation to the longer highresSST-present then to AMIP and hence CMIP. Pairing of the historical and +4 K simulations would allow us to address questions related to the sensitivity of cloud feedbacks to model resolution and related topics. It should be noted that this is not meant to repeat DYAMOND3 but to build a bridge between their GSRM (below a 5 km resolution) models and CMIP communities.
As discussed in Haarsma et al. (2016), the output, storage, and publication of high-resolution model data are challenging issues. As the resolution of HighResMIP1 models approaches the scales necessary for realistic simulation of synoptic and mesoscale phenomena, daily and subdaily multilevel data (in both the ocean and atmosphere) are of increasing interest to allow the investigation of weather phenomena such as those related to midlatitude storms, blocking, tropical cyclones, and monsoon systems, as well as ocean mesoscale processes and ocean extremes such as marine heatwaves. In addition, they could be valuable data to train or evaluate new machine learning (ML) models and approaches. However, increased data outputs can have significant impacts on model speed due to input/output operations, the size of data archives to enable storage, the challenge of formatting via the Climate Model Output Rewriter (CMOR; the CMORisation of variables), and data volumes. Feedback from modelling groups after HighResMIP1 suggested that the data volumes requested were narrowly manageable, and data providers would not want to have them grow significantly. In the following we discuss options for managing data volumes.
The data request (DReq), the variables and frequencies that are required and are suggested to be produced from a CMIP to answer its science questions, is being developed for HighResMIP2 and will be informed by the CMIP7 plans following on from CMIP6 (Juckes et al., 2020). The EU PRIMAVERA project undertook a study of the variables downloaded from the HighResMIP1 archive (either from ESGF or within the PRIMAVERA project over a 6-month period) and produced tables of data access by volume and by frequency (Seddon et al., 2020). Together with community engagement, we have used these tables as a basis for an initial updated data request for HighResMIP2, including prioritising the variable and frequency based on their access. We kept all monthly data requests the same as for HighResMIP1 and have listed the top-60 downloaded variables as priority 1 data as well. In addition, as part of the EU EERIE project (EERIE, 2024), we have added specific extra tables to the data request for high-frequency outputs (Savage, 2023), but the applicability of this for the broader HighResMIP community will need to be reviewed. It is possible that limiting output variables in this way may restrict future novel analysis ideas, but the additional experiments suggested for HighResMIP2, specifically the shorter simulations, may give more scope for additional outputs tailored to these simulations. Based on the recommendations of the metrics section (Sect. 5), we will prioritise variables that can contribute to key metrics and assessment packages to be used for evaluating HighResMIP2 simulations (and CMIP models more generally).
By implementing the DReq in this way, we aim to keep the number of variables at a manageable level. However, the data volumes are also determined by the spatial resolution, precision, and compression at which the variables are stored. Although the DReq states where native resolution data are required, making such choices depends on the properties of the data and underlying processes, as well as what information is relevant for end users and the available observational products for comparison and evaluation. Generally, the most relevant data for impacts are at the planetary surface where observational datasets have the highest resolution. It is therefore desirable to store surface and near-surface variables at higher temporal and spatial resolutions than variables elsewhere. Furthermore, in order to evaluate the HighResMIP ensemble, the high-frequency output should contain variables for which high-frequency observations are available as well.
Guidance by the CMIP6 panel and the working group on climate modelling (WGCM) infrastructure panel on model grids (e.g. Griffies et al., 2016; CMIP6 Output Grid Guidance, 2024) will be used to help inform our choices. Consideration of effective model resolution (e.g. Klaver et al., 2020) based on kinetic energy spectra can also help to inform choices about the “optimal” resolution to share data generated by HighResMIP2, and we encourage modelling groups to calculate and publish this metric to inform data users.
Models using unstructured meshes are becoming increasingly common, which produces new challenges for both data providers and users. Using conventional CMOR data standards can greatly increase the published volumes of such data (due to grid descriptors in every file), and so HighResMIP2 will (informally) experiment with ways to address this issue in addition to standard CMIP formats. There is a growing ecosystem to handle unstructured grids (e.g. UXarray Organisation; Chmielowiec et al., 2024), and we encourage data users to consider building new workflows to take advantage of these tools rather than simply regridding data to regular latitude–longitude meshes to fit with existing analysis code. Using native grid data may also obviate the production of a duplicate of the data on an alternative grid, thus saving storage space and processing. For some analyses, there is no substitute for using data on the native model grid, particularly when calculating integrated transport quantities where conservation is important or for some extreme events. Preserving as much data on native grids as is feasible also maintains provenance and improves transparency and reproducibility by mitigating the data loss associated with postprocessing.
However, regridding to standard or target grids can still play an important role in some analyses, particularly when confronted with decisions in the face of limited resources. Away from the planetary surface, it may be more valuable to provide high-frequency output at a “useful” resolution (e.g. a lower spatial resolution but hourly) rather than making no compromises on horizontal grid spacing but having to limit temporal resolution (e.g. a higher spatial resolution but daily). Using standard grids can also be enough to produce standard metrics (see Sect. 5), fit into existing workflows, and be more comparable to existing observational datasets on regular grids.
If data volumes really become so large that they are impractical to work with (e.g. at the time step level), then performing such calculations online (i.e. either within the model itself or as a part of postprocessing) may be much preferred for accuracy. A simple example is integrated vapour transport (IVT), which is commonly used to track atmospheric rivers (Sect. 5). IVT, at any given time, is a two-dimensional field that is the vertical integral of multiple three-dimensional fields. Calculating such variables as far “upstream” as possible reduces the data burden on scientists and other end users of HighResMIP2 data.
Data compression is another promising avenue to keep data volumes manageable regardless of the output spatial and temporal resolution. This can range from relatively simple improved lossless compression settings in CMORised netCDF files that provide marginal file size reduction to lossy compression methods that reduce data storage more aggressively at the expense of bit-for-bit reproducibility (Baker et al., 2016; Klöwer et al., 2021). We will be advised by CMIP7 on any plans for enhanced data compression, as any method would still need to conform to CMOR standards.
An alternative way to reduce the data volumes is to only output a more demanding set of data over subperiods of the full simulation (e.g. the time-slice method). In an eddy-rich ocean model, daily or 3-daily three-dimensional output is needed to analyse the variability in western boundary currents and subsurface eddies and to estimate the eddy contribution to the meridional overturning circulation in density space in z-coordinate models. To understand processes leading to TC development, subdaily three-dimensional output and a variety of subdaily radiative and surface flux data are needed to quantify cloud radiative and surface flux feedbacks (Dirkes et al., 2023; Wing et al., 2019). Such time-slice methods can enable more detailed process-based analysis while not overwhelming processing capacity. A downside of this method is that it makes the simulations more complicated to set up and run. We propose that for coupled simulations, there are enhanced data output periods near the start, around present day, and towards the end of the simulation (e.g. 1950–1960, 2010–2020, and 2090–2100), where we encourage modelling groups to produce more variables outside of priority 1 (which we expect to be produced throughout). The different tiers of simulation in HighResMIP2 may also require an amended DReq, for example in the Tier 5 1-year simulations where the focus will be on higher-frequency processes.
We also encourage the modelling groups to produce more derived diagnostics for HighResMIP2, which to some extent can obviate the need to publish all the high-frequency outputs at a native resolution. Various analyses in HighResMIP1 made use of derived datasets that were created from multi-model output and then made available to the community separately (e.g. model TC tracks from Roberts, 2019; synthetic tracks from Bloemendaal et al., 2022; sea level and storm surge from Muis et al., 2023; and wind storm footprints from Lockwood et al., 2022). As discussed in Sect. 5, there are several sets of algorithms and parameter settings that, if used by the modelling groups, could lead to extremely valuable datasets that have a common baseline and could be published. Publishing such datasets to ESGF might require some refinement of data standards, but this should be minimal as long as the variables within the derived dataset follow CMOR standards.
One strong recommendation from our past experience is to take the analysis tools to the data where possible, instead of moving the data. An example of this would be the UK CEDA-JASMIN platform (Seddon et al., 2023), where many of the simulations from HighResMIP1 were published and where collaborators could obtain access to the systems and analyse the data. Similarly, a large chunk of the HighResMIP1 archive was copied once to the US National Energy Research Scientific Computing Centre (NERSC, William Collins, personal communication, 2020), enabling many collaborators in the USA to access and analyse the data without further duplication. This was facilitated via the availability of Globus at JASMIN, enabling access to high-speed data transfer nodes and providing transfer speeds 100 times faster than those available via ESGF.
In order to make use of HighResMIP2 simulations to advance the scientific questions outlined, we propose a standard set of metrics and diagnostics of both the mean climate and individual processes of interest. The various metrics and diagnostics that we anticipate using are summarised in Table 3. We also build on experience and lessons learned from the analysis and advances from HighResMIP1.
Table 3Summary of planned metrics and diagnostics for HighResMIP2; see text for explanation of software packages.
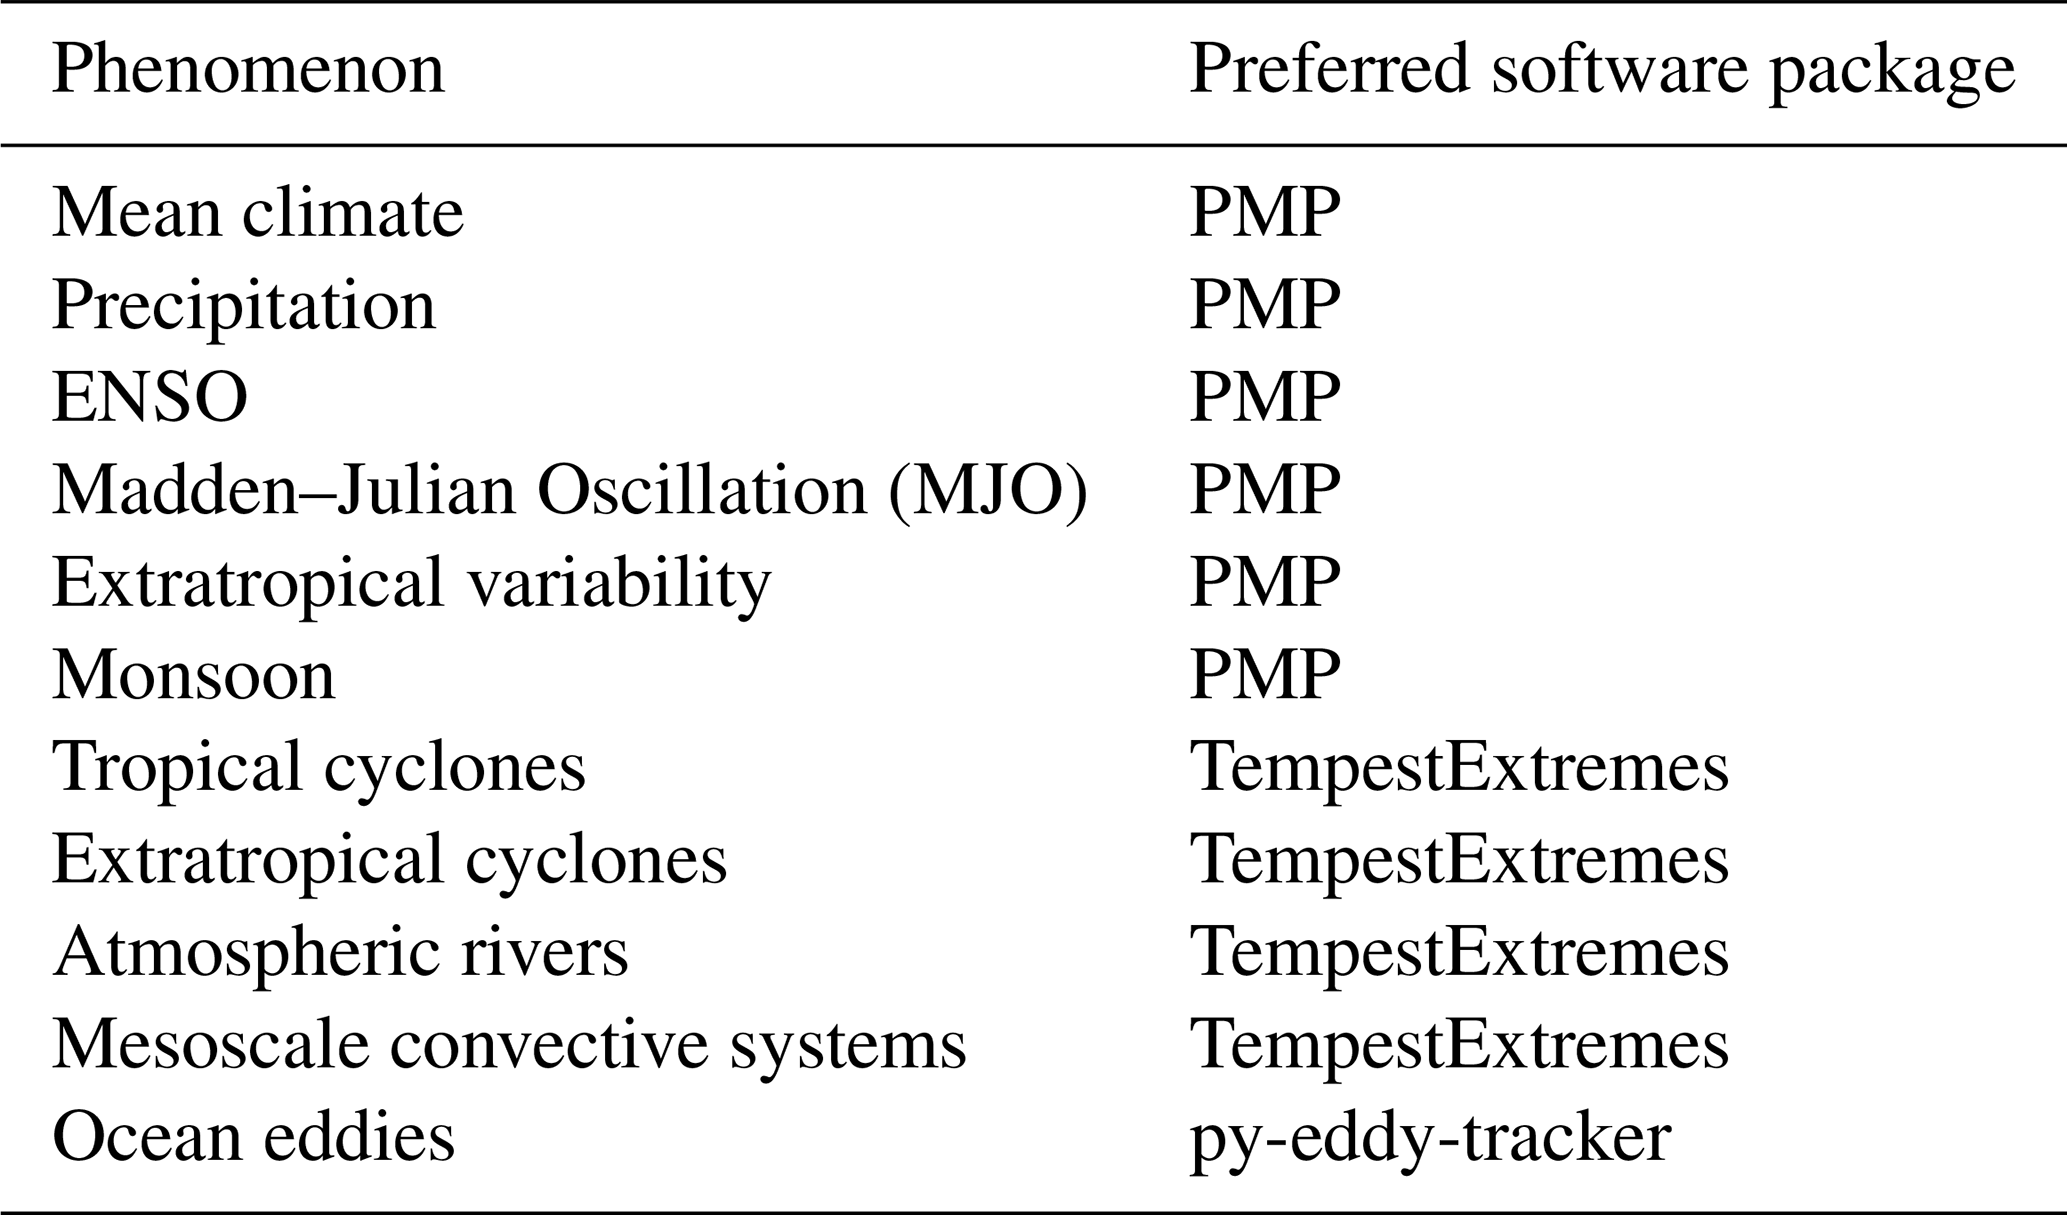
The routine benchmarking used for ESM metrics is needed for each modelling group to quantify potential reductions in existing biases, as well as to address stakeholder needs and applications (Reed et al., 2022). To this end and following the CMIP7 model benchmarking task team, HighResMIP2 can make use of the rapid evaluation framework (REF, https://wcrp-cmip.org/cmip7/rapid-evaluation-framework/, last access: 18 February 2025), which is built atop the coordinated model evaluation capabilities (CMEC, https://cmec.llnl.gov/, last access: 18 February 2025). The Program for Climate Model Diagnosis and Intercomparison (PCMDI) metrics package (PMP) (Lee et al., 2024) includes a CMEC interface and is a publicly available Python software package that has been developed to provide objective comparisons between climate and Earth system models. Thus HighResMIP2 participants can readily compare their high-resolution simulations with conventional versions of their modelling systems that have been submitted to CMIP6 and CMIP7, including DECK simulations. PMP includes typical metrics for mean climate at the global and regional scales that allow for comparisons between simulations, as well as between a simulation and observations (or reanalysis), for a variety of variables, including precipitation, sea level pressure, radiative fluxes, winds, and temperature. These metrics use traditional measures like bias, root-mean-square differences, and pattern correlations. Additional metrics for precipitation, including extremes, drought, and seasonal and daily cycles, are also included. The PMP also contains standard metrics for important modes of climate variability, including El Niño–Southern Oscillation (ENSO), the Madden–Julian Oscillation (MJO), and monsoon characteristics in various regions. In addition, PMP quantifies various important modes of extratropical variability, including the Northern Annular Mode (NAM), the North Atlantic Oscillation (NAO), the Southern Annular Mode (SAM), the Pacific–North American pattern (PNA), the North Pacific Oscillation (NPO), the Pacific Decadal Oscillation (PDO), and the North Pacific Gyre Oscillation (NPGO). Finally, the package also includes a standard metric for cloud radiative feedbacks, including using the abrupt4xCO2-1950 Tier 3 experiment for estimating climate sensitivity.
In addition to documenting the output of PMP, we ask that participating modelling groups also provide monthly output of standard mean climate fields on a 0.25° latitude–longitude grid for each simulation (although details are left to the typical approach by modelling groups for archiving CMIP output). This output could then be used to apply other variability and mean climate metrics as needed but also significantly cuts down on the data submission requirements. Given that these are monthly data on a coarsened grid, we anticipate that these will be provided for all simulations.
Process-level analysis will be a critical component of HighResMIP2 science activities. Following HighResMIP1, individual events such as TCs, extratropical cyclones, atmospheric rivers, and MCSs will be studied. Such events are often underresolved or not captured at all in traditional CMIP-class models, as demonstrated in HighResMIP1 activities. Given the large data volumes typically required for objective tracking at high temporal resolutions, as well as the advantages of tracking such events on the native grids of models, HighResMIP2 can make use of the open-source TempestExtremes package (Ullrich et al., 2021). To identify and track these features, output will be required at a minimum of 6-hourly intervals, using the specific parameters and thresholds documented in Ullrich et al. (2021) for TCs, extratropical cyclones, and atmospheric rivers and in Hsu et al. (2023) for MCSs, as is common for model evaluation (e.g. Reed et al., 2023). Ocean features will also be a focus of HighResMIP2. It is expected that ocean eddies and their role in the climate system will become more prominent in HighResMIP2 simulations as model resolution increases (see Table 1). To detect and track eddies, the py-eddy-tracker toolbox will be used (Mason et al., 2014). Additional ocean extremes such as marine heatwaves (MHWs) would also be welcome to be provided as outputs, following an agreed-upon method such as that of Hobday et al. (2016).
While we strongly encourage modelling groups to provide the feature characteristics and trajectories from these specific software packages, modelling groups that are interested in submitting trajectories from other techniques are welcome to do so to complement the standardised forms. In all cases, we recommend that the features be tracked for the full length of all simulations, but understand that in some cases, modelling groups may need to prioritise feature tracking for a subset of the simulations, given data loads.
In addition to the above metrics and diagnostics, as part of the data request for HighResMIP2, we ask that the modelling groups also provide a standard set of two-dimensional output for each simulation that could be used to help inform studies related to future adaptation and climate risk planning. In particular, precipitation, near-surface temperature, surface pressure, and surface winds at a 6-hourly temporal resolution for the historical and future (both AMIP and coupled) scenarios are requested on a 0.25° latitude–longitude grid, as discussed earlier, or on the native grid of the model. This output could be used for additional analysis of extremes, as well as to force other downscaling or relevant hazard models (e.g. storm surge, flooding, etc.) that focus more on climate impacts. By comparing different future scenarios and warming levels, scientists and practitioners might be able to better inform resilience measures at regional-to-local scales, given the high resolution of HighResMIP2. Again, we expect that these two-dimensional fields will be provided for all simulations but understand that some model groups may need to prioritise a subset of the simulations or time periods.
CMIP6 HighResMIP was the first global high-resolution model intercomparison as part of a CMIP effort, and as such it continues to expand our understanding of the role of grid resolution in multi-model climate simulations, including new insights into large-scale variability and trends as well as extremes. With the rapid developments in this arena (e.g. via improved and optimised models capable of being deployed at global storm-permitting and global kilometre scales) over the last decade, as well as the fast evolution of machine learning methods and requirements for training data, there is a demand for a new set of global high-resolution simulations.
The key advancement for HighResMIP2 will be the use of models optimised for high resolution rather than the models being constrained to be as similar as possible to standard-resolution models. Together with anticipated increases in model resolution to better represent processes and address climate projection uncertainties (specifically towards ocean eddy-rich and atmosphere storm-resolving resolutions) and relaxation of other constraints from HighResMIP1 (such as idealised aerosols), we believe that our new HighResMIP2 protocol will further advance our understanding of climate. Together with updated and new simulations, data requirements, and metrics, HighResMIP2 outputs will be capable of making important contributions to impact and hazard modellers' work, climate risk assessments, and policy.
Our new idealised simulations should also enable improved characterisation of HighResMIP models and hence enable improved links to CMIP-class models, as well as giving some extra flexibility, such as encouraging the use of older models (already tested at high resolutions) rather than having to await new CMIP7 model versions.
The development of the approach for HighResMIP2 documented here has been a collaborative process among the authors, the HighResMIP2 working group members, the CMIP panel, and the broader community. As a result, it is expected that there will be a natural integration of HighResMIP2 analysis and existing efforts into CMIP and the WCRP. An obvious example will be the comparison of the HighResMIP2 simulations to the CMIP7 DECK simulations, which will directly advance the science questions stated in Sect. 2. Another example is related to CORDEX as a leader in utilising regional models to downscale CMIP output to inform regional climate applications. This provides an opportunity to coordinate analysis approaches between CORDEX and HighResMIP2, allowing for the investigation of the relative strengths of the different approaches to regional climate and extreme event simulation. Furthermore, willing modelling centres could consider using HighResMIP2 output to drive their CORDEX models, which could further advance the scientific questions and shed light on potential approaches to high resolution in future intercomparisons. In the broader context, HighResMIP2 will complement other CMIP activities and help advance the objectives of many of the WCRP lighthouse activities.
Data volumes are an ongoing concern for HighResMIP2 (and the community more generally), and we will continue to engage with others, including the Fresh Eyes on CMIP group, to understand which model variables at what frequencies are the most valuable to produce and to engage with other groups on new methods for reducing data sizes.
However, although model data at high spatial and temporal resolutions are difficult to manage and store, we must recognise that these data are important. Understanding the weather of the future (not just the climate) will be key to implementing climate mitigation action, adaptation planning, and risk reduction (Christian Jakob, personal communication, 2024). It will also become increasingly important with the rapid advance of machine learning technologies. The development of subgrid parameterisation processes partly and fully utilising these technologies has significantly improved the accuracy of climate and Earth system models while also reducing computing costs. Correction techniques by machine learning and deep learning can use historical HighResMIP dataset outputs as training data to improve future climate change projections, similar to the correction method used in numerical weather forecasting models. HighResMIP data could also be used to develop and challenge existing and new ML-based weather and climate models, ranging from testing specific processes to using them as global training data, and hence help the community to better understand what the weather of the future will look like.
The atmosphere (and land and lakes if required) initial conditions for 1 January 1980 come from the ERA5 reanalysis (Hersbach et al., 2020) on that day. These can be obtained via the Copernicus Climate Change Service (C3S) Climate Data Store (CDS) (https://doi.org/10.24381/cds.adbb2d47) by constructing an API script using the how-to guide (https://cds.climate.copernicus.eu/how-to-api, last access: 18 February 2025) and variable selection from https://apps.ecmwf.int/data-catalogues/era5/?stream=oper&levtype=ml&expver=1&month=jan&year=1980&type=an&class=ea (last access: 18 February 2025).
The SST and sea ice forcing for highresSST-present come from the ESA CCI dataset version 3.0 and can be obtained from Good and Embury (2024). This dataset does not include temperatures for inland lakes, so for models without their own lake parameterisations, lake temperatures can, for example, be obtained from the OSTIA dataset (https://data.marine.copernicus.eu/product/SST_GLO_SST_L4_REP_OBSERVATIONS_010_011/description, last access: 18 February 2025).
For the initialisation of ensembles, we recommend generation via perturbations of initial conditions rather than perturbation of forcing fields.
The initial conditions for the coupled spinup-1950 experiment, by default, remain the same as in HighResMIP (Haarsma et al., 2016): the ERA-20C reanalysis for atmosphere and land (Poli et al., 2016) and EN4 ocean analysis for ocean temperature and salinity (Good et al., 2013), specifically version EN.4.2.2.g10, taken as a climatology around 1950. The sea ice can be initialised in any appropriate way. While we acknowledge that different ocean analysis products and other developments (e.g. Hermanson et al., 2024; Karspeck et al., 2017) may give “better” initial conditions, using a common approach will make analysis and comparison of the multi-model dataset much more straightforward.
The SST data used to construct Fig. 4 are freely available: HadISST1 (Rayner et al., 2003) from https://www.metoffice.gov.uk/hadobs/hadisst/data/download.html (Met Office, 2025), HighResMIP1 data from inputs4MIPs (Kennedy et al., 2017), and ESA-CCI SST data from Good and Embury (2024). The trend files and code that produced the figure are available from https://doi.org/10.5281/zenodo.14500187 (Roberts and Lai, 2025) and follow Sobel et al. (2023).
The data and code used to produce Fig. 5 are available also from https://doi.org/10.5281/zenodo.14500187 (Roberts and Lai, 2025). These include time series of annual mean surface air temperature (TAS) and top-of-atmosphere (TOA) radiation from the three model simulations.
The HighResMIP co-leads MJR, KAR, and QB conceptualised the structure of the paper and led the writing of the original draft, as well as developed the visualisations for HighResMIP2. All other co-authors contributed to the review and editing of the paper. MJR and ML provided software for Figs. 4 and 5.
The contact author has declared that none of the authors has any competing interests.
The views and opinions expressed in this paper are those of the author(s) only and do not necessarily reflect those of the European Union or the European Research Council. Neither the European Union nor the granting authority can be held responsible for them.
The statements, findings, conclusions, and recommendations in this paper are those of the author(s) and do not necessarily reflect the views of the National Oceanic and Atmospheric Administration or the US Department of Commerce.
Publisher's note: Copernicus Publications remains neutral with regard to jurisdictional claims made in the text, published maps, institutional affiliations, or any other geographical representation in this paper. While Copernicus Publications makes every effort to include appropriate place names, the final responsibility lies with the authors.
Support for this work was provided by numerous funding sources and is summarised here (grouped by author's name and/or funder): Malcolm J. Roberts, Hannah M. Christensen, Michael Lai, Jon Seddon, and Pier Luigi Vidale were supported by UK Research and Innovation (UKRI) under the UK government's Horizon Europe funding guarantee (grant nos. 10057890, 10049639, 10040510) as a part of EU EERIE. Malcolm J. Roberts, Helene T. Hewitt, and Michael Lai were supported by the Met Office Hadley Centre Climate Programme funded by DSIT. Kevin A. Reed was supported by NSF AGS2217620, NSF AGS22449170, Dept. of Energy DE-SC0016605, and Dept. of Energy E-SC0023333. Qing Bao was funded by the National Key Research and Development Program of China (grant no. 2022YFF0802003). Louis-Philippe Caron and Dominique Paquin were supported by the Ministère des Relations internationales et de la Francophonie. Suzana J. Camargo was supported by the National Science Foundation (AGS-2043142, AGS-2244918), the NOAA MAPP program (NA21OAR4310345, NA23OAR4310600, NA23OAR4310598), and the NOAA CVP program (NA22OAR4310610). Ping Chang and Gokhan Danabasoglu were supported by the National Science Foundation grant no. AGS-2231237 and the National Academies of Science and Engineering Gulf Research Program grant no. 2000013283. Hannah M. Christensen was funded by the Natural Environment Research Council grant no. NE/P018238/1 and through a Leverhulme Trust Research Leadership Award. The US National Science Foundation (NSF) National Centre for Atmospheric Research (NCAR) is a major facility sponsored by the US NSF under cooperative agreement 1852977, which was used by Gokhan Danabasoglu. Ivy Frenger was funded/co-funded by the European Union (ERC, OSTIA, 1 101116545). Neven S. Fučkar was funded by the European Union's Horizon 2020 research and innovation programme under the Marie Skłodowska-Curie grant agreement no. 846824 and the National Institute for Health and Care NE/Y503319/1. Shabeh ul Hasson was supported by the Deutsche Forschungsgemeinschaft (DFG, German Research Foundation) under Germany's Excellence Strategy-EXC 2037 “CLICCS-Climate, Climatic Change, and Society” project no. 390683824, a contribution to the Centre for Earth System Research and Sustainability (CEN) of Universität Hamburg. Daehyun Kim was funded by the New Faculty Startup Fund and Creative-Pioneering Researchers Program from Seoul National University; by a National Research Foundation of Korea (NRF) grant funded by the Korean government (MSIT) (RS-2024-00336160); and by the NASA MAP program (80NSSC21K1495), NOAA MAPP program (NA21OAR4310343), and NOAA CVP program (NA22OAR4310608). Chihiro Kodama was supported by JSPS KAKENHI grant no. JP20H05728 and by MEXT through “Feasibility Studies on Next-Generation Supercomputing Infrastructures”. Lai-Yung Ruby Leung was supported by the Office of Science, US Department of Energy Biological and Environmental Research as part of the Regional and Global Model Analysis program area; PNNL is operated by Battelle Memorial Institute for the US Department of Energy under contract DEAC05-76RL01830. Ryo Mizuta was supported by the MEXT program for the advanced studies of climate change projection (SENTAN) grant no. JPMXD0722680734. Paulo Nobre was funded by INCT-MC2 under grants CNPq 465501/2014-1, FAPESP 2014/50848-9, CAPES 88887.136402/2017-00, and CAPES 88887.115872/2015. Pablo Ortega was supported by the Spanish fellowship YC-2017-22772. Christopher D. Roberts and Anne Marie Treguier were supported by the EERIE project (grant agreement no. 101081383) funded by the European Union as a part of Horizon Europe. Enrico Scoccimarro was funded by the EU project BlueAdapt under grant agreement 101057764. Chia-Ying Tu was funded by the NSTC (112-2111-M-001-010) and Academia Sinica (AS-GCP-112-M03). Paul A. Ullrich was supported by the Program for Climate Model Diagnosis and Intercomparison (PCMDI) under the auspices of the US DOE by Lawrence Livermore National Laboratory under contract DE-AC52-07NA27344. Pier Luigi Vidale was supported by the NCAS core grant. Michael F. Wehner was supported by the Office of Science, Office of Biological and Environmental Research of the US Department of Energy under contract no. DE340AC02-05CH11231 under the Regional and Global Model Analysis (RGMA) program. Colin M. Zarzycki was supported by the US Dept. of Energy (DE-SC0016605 and “Integrated Coastal Modeling”). Bosong Zhang was supported by the NOAA Climate Program Office through the Climate Process Team (140Y8R1ES2/24P01). Wei Zhang was supported by the NOAA (award NA23OAR4310611-T1-01), Utah Department of Natural Resources (award 205396), and the US Geological Survey under grant G24AP00051-00. We also thank Timothy Andrews (Met Office) for the original code for Fig. 5.
This research has been supported by the Department for Science, Innovation and Technology (Hadley Centre Climate Programme); the UK Research and Innovation (grant no. 10057890); the National Science Foundation (grant nos. AGS2217620 and AGS22449170); the US Department of Energy (Integrated Coastal Modeling and grant nos. DE-SC0016605 and DE-SC0023333); the National Key Research and Development Program of China (grant no. 2022YFF0802003); the National Science Foundation (grant nos. AGS-2043142 and AGS-2244918); the National Oceanic and Atmospheric Administration (grant nos. NA21OAR4310345, NA23OAR4310600, NA23OAR4310598, NA22OAR4310610, NA21OAR4310343, NA22OAR4310608, 140Y8R1ES2/24P01, and NA23OAR4310611-T1-01); the National Science Foundation (grant no. AGS-2231237); the National Academy of Sciences (grant no. 2000013283); the Natural Environment Research Council (grant nos. NE/P018238/1 and NE/Y503319/1); the EU Horizon 2020 programme (grant no. 846824); the National Institute for Health and Care Research (grant no. NIHR204850); the Deutsche Forschungsgemeinschaft (grant no. 390683824); the Ministry of Science and ICT, South Korea (grant no. RS-2024-00336160); the National Aeronautics and Space Administration (grant no. 80NSSC21K1495); the Japan Society for the Promotion of Science (grant no. JP20H05728); the Ministry of Education, Culture, Sports, Science and Technology (Feasibility Studies on Next-Generation Supercomputing Infrastructures); the US Department of Energy (Regional and Global Model Analysis program and grant no. DE340AC02-05CH11231); the US Department of Energy (grant no. DEAC05-76RL01830); the Ministry of Education, Culture, Sports, Science and Technology (grant no. JPMXD0722680734); the HORIZON EUROPE Climate, Energy and Mobility programme (grant nos. 101081383 and 101057764); the National Science and Technology Council (grant no. 112-2111-M-001-010); the Academia Sinica (grant no. AS-GCP-112-M03); the US Department of Energy (grant no. DE-AC52-07NA27344); the Utah Department of Natural Resources (grant no. 205396); and the US Geological Survey (grant no. G24AP00051-00).
This paper was edited by Riccardo Farneti and reviewed by Claudia Tebaldi and two anonymous referees.
Armstrong McKay, D. I., Staal, A., Abrams, J. F., Winkelmann, R., Sakschewski, B., Loriani, S., Fetzer, I., Cornell, S. E., Rockström, J., and Lenton, T. M.: Exceeding 1.5 °C global warming could trigger multiple climate tipping points, Science, 377, eabn7950, https://doi.org/10.1126/science.abn7950, 2022.
Athanasiadis, P. J., Ogawa, F., Omrani, N.-E., Keenlyside, N., Schiemann, R., Baker, A. J., Vidale, P. L., Bellucci, A., Ruggieri, P., Haarsma, R., Roberts, M., Roberts, C., Novak, L., and Gualdi, S.: Mitigating Climate Biases in the Midlatitude North Atlantic by Increasing Model Resolution: SST Gradients and Their Relation to Blocking and the Jet, J. Climate, 35, 3385–3406, https://doi.org/10.1175/JCLI-D-21-0515.1, 2022.
Bacmeister, J. T., Reed, K. A., Hannay, C., Lawrence, P., Bates, S., Truesdale, J. E., Rosenbloom, N., and Levy, M.: Projected changes in tropical cyclone activity under future warming scenarios using a high-resolution climate model, Climatic Change, 146, 547–560, https://doi.org/10.1007/s10584-016-1750-x, 2018.
Bador, M., Boé, J., Terray, L., Alexander, L. V., Baker, A., Bellucci, A., Haarsma, R., Koenigk, T., Moine, M.-P., Lohmann, K., Putrasahan, D. A., Roberts, C., Roberts, M., Scoccimarro, E., Schiemann, R., Seddon, J., Senan, R., Valcke, S., and Vanniere, B.: Impact of Higher Spatial Atmospheric Resolution on Precipitation Extremes Over Land in Global Climate Models, J. Geophys. Res.-Atmos., 125, e2019JD032184, https://doi.org/10.1029/2019JD032184, 2020.
Baker, A. H., Hammerling, D. M., Mickelson, S. A., Xu, H., Stolpe, M. B., Naveau, P., Sanderson, B., Ebert-Uphoff, I., Samarasinghe, S., De Simone, F., Carbone, F., Gencarelli, C. N., Dennis, J. M., Kay, J. E., and Lindstrom, P.: Evaluating lossy data compression on climate simulation data within a large ensemble, Geosci. Model Dev., 9, 4381–4403, https://doi.org/10.5194/gmd-9-4381-2016, 2016.
Bao, Q., Liu, Y., Wu, G., He, B., Li, J., Wang, L., Wu, X., Chen, K., Wang, X., Yang, J., and Zhang, X.: CAS FGOALS-f3-H and CAS FGOALS-f3-L outputs for the high-resolution model intercomparison project simulation of CMIP6, Atmospheric Ocean. Sci. Lett., 13, 576–581, https://doi.org/10.1080/16742834.2020.1814675, 2020.
Beech, N., Rackow, T., Semmler, T., Danilov, S., Wang, Q., and Jung, T.: Long-term evolution of ocean eddy activity in a warming world, Nat. Clim. Change, 12, 910–917, https://doi.org/10.1038/s41558-022-01478-3, 2022.
Bian, C., Jing, Z., Wang, H., Wu, L., Chen, Z., Gan, B., and Yang, H.: Oceanic mesoscale eddies as crucial drivers of global marine heatwaves, Nat. Commun., 14, 2970, https://doi.org/10.1038/s41467-023-38811-z, 2023.
Bishop, S. P., Gent, P. R., Bryan, F. O., Thompson, A. F., Long, M. C., and Abernathey, R.: Southern Ocean Overturning Compensation in an Eddy-Resolving Climate Simulation, J. Phys. Oceanogr., 46, 1575–1592, https://doi.org/10.1175/JPO-D-15-0177.1, 2016.
Bloemendaal, N., de Moel, H., Martinez, A. B., Muis, S., Haigh, I. D., van der Wiel, K., Haarsma, R. J., Ward, P. J., Roberts, M. J., Dullaart, J. C. M., and Aerts, J. C. J. H.: A globally consistent local-scale assessment of future tropical cyclone risk, Sci. Adv., 8, eabm8438, https://doi.org/10.1126/sciadv.abm8438, 2022.
Bock, L., Lauer, A., Schlund, M., Barreiro, M., Bellouin, N., Jones, C., Meehl, G. A., Predoi, V., Roberts, M. J., and Eyring, V.: Quantifying Progress Across Different CMIP Phases With the ESMValTool, J. Geophys. Res.-Atmos., 125, e2019JD032321, https://doi.org/10.1029/2019JD032321, 2020.
Caldwell, P. M., Mametjanov, A., Tang, Q., Van Roekel, L. P., Golaz, J.-C., Lin, W., Bader, D. C., Keen, N. D., Feng, Y., Jacob, R., Maltrud, M. E., Roberts, A. F., Taylor, M. A., Veneziani, M., Wang, H., Wolfe, J. D., Balaguru, K., Cameron-Smith, P., Dong, L., Klein, S. A., Leung, L. R., Li, H.-Y., Li, Q., Liu, X., Neale, R. B., Pinheiro, M., Qian, Y., Ullrich, P. A., Xie, S., Yang, Y., Zhang, Y., Zhang, K., and Zhou, T.: The DOE E3SM Coupled Model Version 1: Description and Results at High Resolution, J. Adv. Model. Earth Sy., 11, 4095–4146, https://doi.org/10.1029/2019MS001870, 2019.
Camargo, S. J. and Wing, A. A.: Tropical cyclones in climate models, WIREs Clim. Change, 7, 211–237, https://doi.org/10.1002/wcc.373, 2016.
Cess, R. D. and Potter, G. L.: A methodology for understanding and intercomparing atmospheric climate feedback processes in general circulation models, J. Geophys. Res.-Atmos., 93, 8305–8314, https://doi.org/10.1029/JD093iD07p08305, 1988.
Chang, P., Zhang, S., Danabasoglu, G., Yeager, S. G., Fu, H., Wang, H., Castruccio, F. S., Chen, Y., Edwards, J., Fu, D., Jia, Y., Laurindo, L. C., Liu, X., Rosenbloom, N., Small, R. J., Xu, G., Zeng, Y., Zhang, Q., Bacmeister, J., Bailey, D. A., Duan, X., DuVivier, A. K., Li, D., Li, Y., Neale, R., Stössel, A., Wang, L., Zhuang, Y., Baker, A., Bates, S., Dennis, J., Diao, X., Gan, B., Gopal, A., Jia, D., Jing, Z., Ma, X., Saravanan, R., Strand, W. G., Tao, J., Yang, H., Wang, X., Wei, Z., and Wu, L.: An Unprecedented Set of High-Resolution Earth System Simulations for Understanding Multiscale Interactions in Climate Variability and Change, J. Adv. Model. Earth Sy., 12, e2020MS002298, https://doi.org/10.1029/2020MS002298, 2020.
Chang, P., Xu, G., Kurian, J., Small, R. J., Danabasoglu, G., Yeager, S., Castruccio, F., Zhang, Q., Rosenbloom, N., and Chapman, P.: Uncertain future of sustainable fisheries environment in eastern boundary upwelling zones under climate change, Commun. Earth Environ., 4, 19, https://doi.org/10.1038/s43247-023-00681-0, 2023.
Chassignet, E. P., Yeager, S. G., Fox-Kemper, B., Bozec, A., Castruccio, F., Danabasoglu, G., Horvat, C., Kim, W. M., Koldunov, N., Li, Y., Lin, P., Liu, H., Sein, D. V., Sidorenko, D., Wang, Q., and Xu, X.: Impact of horizontal resolution on global ocean–sea ice model simulations based on the experimental protocols of the Ocean Model Intercomparison Project phase 2 (OMIP-2), Geosci. Model Dev., 13, 4595–4637, https://doi.org/10.5194/gmd-13-4595-2020, 2020.
Chen, J. H. and Lin, S. J.: The remarkable predictability of inter-annual variability of Atlantic hurricanes during the past decade, Geophys. Res. Lett., 38, 1–6, https://doi.org/10.1029/2011GL047629, 2011.
Chmielowiec, P., Jain, R., Eroglu, O., Chen, H., Sizemore, M., Zacharias, A., Zedwick, A., Rodriguez, J. M. A., Ullrich, P., Kootz, A., Franda, I., Ahijevych, D., Filipe, Galicia, D., Nam, K., Thyng, K., Liquet, M., and Gierz, P.: UXARRAY/uxarray: v2024.05.0, Zenodo [code], https://doi.org/10.5281/zenodo.11218523, 2024.
CMIP6 Output Grid Guidance: https://goo.gl/1oA7bO (last access: 14 August 2024), 2024.
Dirkes, C. A., Wing, A. A., Camargo, S. J., and Kim, D.: Process-Oriented Diagnosis of Tropical Cyclones in Reanalyses Using a Moist Static Energy Variance Budget, J. Climate, 36, 5293–5317, https://doi.org/10.1175/JCLI-D-22-0384.1, 2023.
Docquier, D., Grist, J. P., Roberts, M. J., Roberts, C. D., Semmler, T., Ponsoni, L., Massonnet, F., Sidorenko, D., Sein, D. V., Iovino, D., Bellucci, A., and Fichefet, T.: Impact of model resolution on Arctic sea ice and North Atlantic Ocean heat transport, Clim. Dynam., 53, 4989–5017, https://doi.org/10.1007/s00382-019-04840-y, 2019.
Dong, Y., Armour, K. C., Zelinka, M. D., Proistosescu, C., Battisti, D. S., Zhou, C., and Andrews, T.: Intermodel Spread in the Pattern Effect and Its Contribution to Climate Sensitivity in CMIP5 and CMIP6 Models, J. Climate, 33, 7755–7775, https://doi.org/10.1175/JCLI-D-19-1011.1, 2020.
Dunne, J. P., Hewitt, H. T., Arblaster, J., Bonou, F., Boucher, O., Cavazos, T., Durack, P. J., Hassler, B., Juckes, M., Miyakawa, T., Mizielinski, M., Naik, V., Nicholls, Z., O'Rourke, E., Pincus, R., Sanderson, B. M., Simpson, I. R., and Taylor, K. E.: An evolving Coupled Model Intercomparison Project phase 7 (CMIP7) and Fast Track in support of future climate assessment, EGUsphere [preprint], https://doi.org/10.5194/egusphere-2024-3874, 2024.
EERIE: EU Project, https://eerie-project.eu/ (last access: 14 August 2024), 2024.
Embury, O., Merchant, C. J., Good, S. A., Rayner, N. A., Høyer, J. L., Atkinson, C., Block, T., Alerskans, E., Pearson, K. J., Worsfold, M., McCarroll, N., and Donlon, C.: Satellite-based time-series of sea-surface temperature since 1980 for climate applications, Sci. Data, 11, 326, https://doi.org/10.1038/s41597-024-03147-w, 2024.
ESGF CMIP6 HighResMIP Data Holdings: https://pcmdi.llnl.gov/CMIP6/ArchiveStatistics/esgf_data_holdings/HighResMIP/index.html (last access: 14 August 2024), 2024.
Eyring, V., Bony, S., Meehl, G. A., Senior, C. A., Stevens, B., Stouffer, R. J., and Taylor, K. E.: Overview of the Coupled Model Intercomparison Project Phase 6 (CMIP6) experimental design and organization, Geosci. Model Dev., 9, 1937–1958, https://doi.org/10.5194/gmd-9-1937-2016, 2016.
Farneti, R., Delworth, T. L., Rosati, A. J., Griffies, S. M., and Zeng, F.: The Role of Mesoscale Eddies in the Rectification of the Southern Ocean Response to Climate Change, J. Phys. Oceanogr., 40, 1539–1557, https://doi.org/10.1175/2010JPO4353.1, 2010.
Farneti, R., Downes, S. M., Griffies, S. M., Marsland, S. J., Behrens, E., Bentsen, M., Bi, D., Biastoch, A., Böning, C., Bozec, A., Canuto, V. M., Chassignet, E., Danabasoglu, G., Danilov, S., Diansky, N., Drange, H., Fogli, P. G., Gusev, A., Hallberg, R. W., Howard, A., Ilicak, M., Jung, T., Kelley, M., Large, W. G., Leboissetier, A., Long, M., Lu, J., Masina, S., Mishra, A., Navarra, A., George Nurser, A. J., Patara, L., Samuels, B. L., Sidorenko, D., Tsujino, H., Uotila, P., Wang, Q., and Yeager, S. G.: An assessment of Antarctic Circumpolar Current and Southern Ocean meridional overturning circulation during 1958–2007 in a suite of interannual CORE-II simulations, Ocean Model., 93, 84–120, https://doi.org/10.1016/j.ocemod.2015.07.009, 2015.
Fox-Kemper, B., Hewitt, H. T., Xiao, C., Aoalgeirsdottir, G., Drijfhout, S. S., Edwards, T. L., Golledge, N. R., Hemer, M., Kopp, R. E., Krinner, G., Mix, A., Notz, D., Nowicki, S., Nurhati, I. S., Ruiz, L., Sallee, J.-B., Slanger, A. B. A., and Yu, Y.: Ocean, Cryosphere and Sea Level Change, in: Climate Change 2021: The Physical Science Basis. Contribution of Working Group I to the Sixth Assessment Report of the Intergovernmental Panel on Climate Change, edited by: Mason-Delmotte, V., Zhai, P., Pirani, A., Connors, S. L., Pean, C., Berger, S., Caud, N., Chen, Y., Goldfarb, L., Gomis, M. I., Huang, M., Leitzell, K., Lonnoy, E., Matthews, J. B. R., Maycock, K., Waterfield, T., Yelekci, O., Yu, R., and Zhou, B., Cambridge University Press, https://doi.org/10.1017/9781009157896.011, 22.
Gao, L., Yuan, X., Cai, W., Guo, G., Yu, W., Shi, J., Qiao, F., Wei, Z., and Williams, G. D.: Persistent warm-eddy transport to Antarctic ice shelves driven by enhanced summer westerlies, Nat. Commun., 15, 671, https://doi.org/10.1038/s41467-024-45010-x, 2024.
Gates, W. L., Boyle, J. S., Covey, C., Dease, C. G., Doutriaux, C. M., Drach, R. S., Fiorino, M., Gleckler, P. J., Hnilo, J. J., Marlais, S. M., Phillips, T. J., Potter, G. L., Santer, B. D., Sperber, K. R., Taylor, K. E., and Williams, D. N.: An Overview of the Results of the Atmospheric Model Intercomparison Project (AMIP I), B. Am. Meteorol. Soc., 80, 29–56, https://doi.org/10.1175/1520-0477(1999)080<0029:AOOTRO>2.0.CO;2, 1999.
Gent, P. R. and Danabasoglu, G.: Response to Increasing Southern Hemisphere Winds in CCSM4, J. Climate, 24, 4992–4998, https://doi.org/10.1175/JCLI-D-10-05011.1, 2011.
Giorgetta, M. A., Brokopf, R., Crueger, T., Esch, M., Fiedler, S., Helmert, J., Hohenegger, C., Kornblueh, L., Köhler, M., Manzini, E., Mauritsen, T., Nam, C., Raddatz, T., Rast, S., Reinert, D., Sakradzija, M., Schmidt, H., Schneck, R., Schnur, R., Silvers, L., Wan, H., Zängl, G., and Stevens, B.: ICON-A, the Atmosphere Component of the ICON Earth System Model: I. Model Description, J. Adv. Model. Earth Sy., 10, 1613–1637, https://doi.org/10.1029/2017MS001242, 2018.
Good, S. and Embury, O.: ESA Sea Surface Temperature Climate Change Initiative (SST_cci): Level 4 Analysis product, version 3.0, NERC EDS Centre for Environmental Data Analysis, https://doi.org/10.5285/4a9654136a7148e39b7feb56f8bb02d2, 2024.
Good, S. A., Martin, M. J., and Rayner, N. A.: EN4: Quality controlled ocean temperature and salinity profiles and monthly objective analyses with uncertainty estimates, J. Geophys. Res.-Oceans, 118, 6704–6716, https://doi.org/10.1002/2013JC009067, 2013.
Gore, M. J., Zarzycki, C. M., and Gervais, M. M.: Connecting Large-Scale Meteorological Patterns to Extratropical Cyclones in CMIP6 Climate Models Using Self-Organizing Maps, Earths Future, 11, e2022EF003211, https://doi.org/10.1029/2022EF003211, 2023.
Griffies, S. M., Danabasoglu, G., Durack, P. J., Adcroft, A. J., Balaji, V., Böning, C. W., Chassignet, E. P., Curchitser, E., Deshayes, J., Drange, H., Fox-Kemper, B., Gleckler, P. J., Gregory, J. M., Haak, H., Hallberg, R. W., Heimbach, P., Hewitt, H. T., Holland, D. M., Ilyina, T., Jungclaus, J. H., Komuro, Y., Krasting, J. P., Large, W. G., Marsland, S. J., Masina, S., McDougall, T. J., Nurser, A. J. G., Orr, J. C., Pirani, A., Qiao, F., Stouffer, R. J., Taylor, K. E., Treguier, A. M., Tsujino, H., Uotila, P., Valdivieso, M., Wang, Q., Winton, M., and Yeager, S. G.: OMIP contribution to CMIP6: experimental and diagnostic protocol for the physical component of the Ocean Model Intercomparison Project, Geosci. Model Dev., 9, 3231–3296, https://doi.org/10.5194/gmd-9-3231-2016, 2016.
Grist, J. P., Josey, S. A., Sinha, B., Catto, J. L., Roberts, M. J., and Coward, A. C.: Future Evolution of an Eddy Rich Ocean Associated with Enhanced East Atlantic Storminess in a Coupled Model Projection, Geophys. Res. Lett., 48, e2021GL092719, https://doi.org/10.1029/2021GL092719, 2021.
Haarsma, R. J., Roberts, M. J., Vidale, P. L., Senior, C. A., Bellucci, A., Bao, Q., Chang, P., Corti, S., Fučkar, N. S., Guemas, V., von Hardenberg, J., Hazeleger, W., Kodama, C., Koenigk, T., Leung, L. R., Lu, J., Luo, J.-J., Mao, J., Mizielinski, M. S., Mizuta, R., Nobre, P., Satoh, M., Scoccimarro, E., Semmler, T., Small, J., and von Storch, J.-S.: High Resolution Model Intercomparison Project (HighResMIP v1.0) for CMIP6, Geosci. Model Dev., 9, 4185–4208, https://doi.org/10.5194/gmd-9-4185-2016, 2016.
Hausfather, Z. and Peters, G. P.: Emissions – the “business as usual” story is misleading, Nature, 577, 618–620, https://doi.org/10.1038/d41586-020-00177-3, 2020.
Hermanson, L., Dunstone, N., Eade, R., and Smith, D.: An ensemble reconstruction of ocean temperature, salinity and Atlantic Meridional Overturning Circulation 1960–2021, Q. J. Roy. Meteor. Soc., 150, 98–111, https://doi.org/10.1002/qj.4587, 2024.
Hersbach, H., Bell, B., Berrisford, P., Hirahara, S., Horányi, A., Muñoz-Sabater, J., Nicolas, J., Peubey, C., Radu, R., Schepers, D., Simmons, A., Soci, C., Abdalla, S., Abellan, X., Balsamo, G., Bechtold, P., Biavati, G., Bidlot, J., Bonavita, M., De Chiara, G., Dahlgren, P., Dee, D., Diamantakis, M., Dragani, R., Flemming, J., Forbes, R., Fuentes, M., Geer, A., Haimberger, L., Healy, S., Hogan, R. J., Hólm, E., Janisková, M., Keeley, S., Laloyaux, P., Lopez, P., Lupu, C., Radnoti, G., de Rosnay, P., Rozum, I., Vamborg, F., Villaume, S., and Thépaut, J.-N.: The ERA5 global reanalysis, Q. J. Roy. Meteor. Soc., 146, 1999–2049, https://doi.org/10.1002/qj.3803, 2020.
Hewitt, H., Fox-Kemper, B., Pearson, B., Roberts, M., and Klocke, D.: The small scales of the ocean may hold the key to surprises, Nat. Clim. Change, 12, 496–499, https://doi.org/10.1038/s41558-022-01386-6, 2022.
Hobday, A. J., Alexander, L. V., Perkins, S. E., Smale, D. A., Straub, S. C., Oliver, E. C. J., Benthuysen, J. A., Burrows, M. T., Donat, M. G., Feng, M., Holbrook, N. J., Moore, P. J., Scannell, H. A., Sen Gupta, A., and Wernberg, T.: A hierarchical approach to defining marine heatwaves, Prog. Oceanogr., 141, 227–238, https://doi.org/10.1016/j.pocean.2015.12.014, 2016.
Hoffmann, J., Bauer, P., Sandu, I., Wedi, N., Geenen, T., and Thiemert, D.: Destination Earth – A digital twin in support of climate services, Clim. Serv., 30, 100394, https://doi.org/10.1016/j.cliser.2023.100394, 2023.
Hong, S.-Y. and Dudhia, J.: Next-Generation Numerical Weather Prediction: Bridging Parameterization, Explicit Clouds, and Large Eddies, B. Am. Meteorol. Soc., 93, ES6–ES9, https://doi.org/10.1175/2011BAMS3224.1, 2012.
Hourdin, F., Mauritsen, T., Gettelman, A., Golaz, J.-C., Balaji, V., Duan, Q., Folini, D., Ji, D., Klocke, D., Qian, Y., Rauser, F., Rio, C., Tomassini, L., Watanabe, M., and Williamson, D.: The Art and Science of Climate Model Tuning, B. Am. Meteorol. Soc., 98, 589–602, https://doi.org/10.1175/BAMS-D-15-00135.1, 2017.
Hsu, W.-C., Kooperman, G. J., Hannah, W. M., Reed, K. A., Akinsanola, A. A., and Pendergrass, A. G.: Evaluating Mesoscale Convective Systems Over the US in Conventional and Multiscale Modeling Framework Configurations of E3SMv1, J. Geophys. Res.-Atmos., 128, e2023JD038740, https://doi.org/10.1029/2023JD038740, 2023.
Huang, H., Patricola, C. M., and Collins, W. D.: The Influence of Ocean Coupling on Simulated and Projected Tropical Cyclone Precipitation in the HighResMIP–PRIMAVERA Simulations, Geophys. Res. Lett., 48, e2021GL094801, https://doi.org/10.1029/2021GL094801, 2021.
Huprikar, A. S., Stansfield, A. M., and Reed, K. A.: A storyline analysis of Hurricane Irma's precipitation under various levels of climate warming, Environ. Res. Lett., 19, 014004, https://doi.org/10.1088/1748-9326/ad0c89, 2023.
Illingworth, A. J., Barker, H. W., Beljaars, A., Ceccaldi, M., Chepfer, H., Clerbaux, N., Cole, J., Delanoë, J., Domenech, C., Donovan, D. P., Fukuda, S., Hirakata, M., Hogan, R. J., Huenerbein, A., Kollias, P., Kubota, T., Nakajima, T., Nakajima, T. Y., Nishizawa, T., Ohno, Y., Okamoto, H., Oki, R., Sato, K., Satoh, M., Shephard, M. W., Velázquez-Blázquez, A., Wandinger, U., Wehr, T., and van Zadelhoff, G.-J.: The EarthCARE Satellite: The Next Step Forward in Global Measurements of Clouds, Aerosols, Precipitation, and Radiation, B. Am. Meteorol. Soc., 96, 1311–1332, https://doi.org/10.1175/BAMS-D-12-00227.1, 2015.
IPCC: Climate Change 2021: The Physical Science Basis. Contribution of Working Group I to the Sixth Assessment Report of the Intergovernmental Panel on Climate Change, edited by: Mason-Delmotte, V., Zhai, P., Pirani, A., Connors, S. L., Pean, C., Berger, S., Caud, N., Chen, Y., Goldfarb, L., Gomis, M. I., Huang, M., Leitzell, K., Lonnoy, E., Matthews, J. B. R., Maycock, K., Waterfield, T., Yelekci, O., Yu, R., and Zhou, B., Cambridge University Press, https://doi.org/10.1017/9781009157896, 2021.
IPCC – Intergovernmental Panel on Climate Change (Ed.): Weather and Climate Extreme Events in a Changing Climate, in: Climate Change 2021 – The Physical Science Basis: Working Group I Contribution to the Sixth Assessment Report of the Intergovernmental Panel on Climate Change, Cambridge University Press, Cambridge, 1513–1766, https://doi.org/10.1017/9781009157896.013, 2023.
Ishii, M. and Mori, N.: d4PDF: large-ensemble and high-resolution climate simulations for global warming risk assessment, Prog. Earth Planet. Sci., 7, 58, https://doi.org/10.1186/s40645-020-00367-7, 2020.
Juckes, M., Taylor, K. E., Durack, P. J., Lawrence, B., Mizielinski, M. S., Pamment, A., Peterschmitt, J.-Y., Rixen, M., and Sénési, S.: The CMIP6 Data Request (DREQ, version 01.00.31), Geosci. Model Dev., 13, 201–224, https://doi.org/10.5194/gmd-13-201-2020, 2020.
Karspeck, A. R., Stammer, D., Köhl, A., Danabasoglu, G., Balmaseda, M., Smith, D. M., Fujii, Y., Zhang, S., Giese, B., Tsujino, H., and Rosati, A.: Comparison of the Atlantic meridional overturning circulation between 1960 and 2007 in six ocean reanalysis products, Clim. Dynam., 49, 957–982, https://doi.org/10.1007/s00382-015-2787-7, 2017.
Kay, J. E., Deser, C., Phillips, A., Mai, A., Hannay, C., Strand, G., Arblaster, J. M., Bates, S. C., Danabasoglu, G., Edwards, J., Holland, M., Kushner, P., Lamarque, J.-F., Lawrence, D., Lindsay, K., Middleton, A., Munoz, E., Neale, R., Oleson, K., Polvani, L., and Vertenstein, M.: The Community Earth System Model (CESM) Large Ensemble Project: A Community Resource for Studying Climate Change in the Presence of Internal Climate Variability, B. Am. Meteorol. Soc., 96, 1333–1349, https://doi.org/10.1175/BAMS-D-13-00255.1, 2015.
Kennedy, J., Titchner, H., Rayner, N., and Roberts, M.: input4MIPs.MOHC.SSTsAndSeaIce.HighResMIP.MOHC-HadISST-2-2-0-0-0, ESGF, https://doi.org/10.22033/ESGF/input, 2017.
Kim, W. M., Ruprich-Robert, Y., Zhao, A., Yeager, S., and Robson, J.: North Atlantic Response to Observed North Atlantic Oscillation Surface Heat Flux in Three Climate Models, J. Climate, 37, 1777–1796, https://doi.org/10.1175/JCLI-D-23-0301.1, 2024.
Klaver, R., Haarsma, R., Vidale, P. L., and Hazeleger, W.: Effective resolution in high resolution global atmospheric models for climate studies, Atmos. Sci. Lett., 21, e952, https://doi.org/10.1002/asl.952, 2020.
Klöwer, M., Razinger, M., Dominguez, J. J., Düben, P. D., and Palmer, T. N.: Compressing atmospheric data into its real information content, Nat. Comput. Sci., 1, 713–724, https://doi.org/10.1038/s43588-021-00156-2, 2021.
Lee, J., Gleckler, P. J., Ahn, M.-S., Ordonez, A., Ullrich, P. A., Sperber, K. R., Taylor, K. E., Planton, Y. Y., Guilyardi, E., Durack, P., Bonfils, C., Zelinka, M. D., Chao, L.-W., Dong, B., Doutriaux, C., Zhang, C., Vo, T., Boutte, J., Wehner, M. F., Pendergrass, A. G., Kim, D., Xue, Z., Wittenberg, A. T., and Krasting, J.: Systematic and objective evaluation of Earth system models: PCMDI Metrics Package (PMP) version 3, Geosci. Model Dev., 17, 3919–3948, https://doi.org/10.5194/gmd-17-3919-2024, 2024.
Li, D., Chang, P., Yeager, S. G., Danabasoglu, G., Castruccio, F. S., Small, J., Wang, H., Zhang, Q., and Gopal, A.: The Impact of Horizontal Resolution on Projected Sea-Level Rise Along US East Continental Shelf With the Community Earth System Model, J. Adv. Model. Earth Sy., 14, e2021MS002868, https://doi.org/10.1029/2021MS002868, 2022.
Li, J., Bao, Q., Liu, Y., Wang, L., Yang, J., Wu, G., Wu, X., He, B., Wang, X., Zhang, X., Yang, Y., and Shen, Z.: Effect of horizontal resolution on the simulation of tropical cyclones in the Chinese Academy of Sciences FGOALS-f3 climate system model, Geosci. Model Dev., 14, 6113–6133, https://doi.org/10.5194/gmd-14-6113-2021, 2021.
Liu, X., Ma, X., Chang, P., Jia, Y., Fu, D., Xu, G., Wu, L., Saravanan, R., and Patricola, C. M.: Ocean fronts and eddies force atmospheric rivers and heavy precipitation in western North America, Nat. Commun., 12, 1268, https://doi.org/10.1038/s41467-021-21504-w, 2021.
Lockwood, J. F., Guentchev, G. S., Alabaster, A., Brown, S. J., Palin, E. J., Roberts, M. J., and Thornton, H. E.: Using high-resolution global climate models from the PRIMAVERA project to create a European winter windstorm event set, Nat. Hazards Earth Syst. Sci., 22, 3585–3606, https://doi.org/10.5194/nhess-22-3585-2022, 2022.
Martínez-Moreno, J., Hogg, A. M., England, M. H., Constantinou, N. C., Kiss, A. E., and Morrison, A. K.: Global changes in oceanic mesoscale currents over the satellite altimetry record, Nat. Clim. Change, 11, 397–403, https://doi.org/10.1038/s41558-021-01006-9, 2021.
Mason, E., Pascual, A., and McWilliams, J. C.: A new sea surface height-based code for oceanic mesoscale eddy tracking, J. Atmos. Ocean. Tech., 31, 1181–1188, https://doi.org/10.1175/JTECH-D-14-00019.1, 2014.
Meredith, M. P., Garabato, A. C. N., Hogg, A. M., and Farneti, R.: Sensitivity of the Overturning Circulation in the Southern Ocean to Decadal Changes in Wind Forcing, J. Climate, 25, 99–110, https://doi.org/10.1175/2011JCLI4204.1, 2012.
Met Office: HadISST1, Met Office [data set], https://www.metoffice.gov.uk/hadobs/hadisst/data/download.html (last access: 18 February 2025), 2025.
Mitchell, D., AchutaRao, K., Allen, M., Bethke, I., Beyerle, U., Ciavarella, A., Forster, P. M., Fuglestvedt, J., Gillett, N., Haustein, K., Ingram, W., Iversen, T., Kharin, V., Klingaman, N., Massey, N., Fischer, E., Schleussner, C.-F., Scinocca, J., Seland, Ø., Shiogama, H., Shuckburgh, E., Sparrow, S., Stone, D., Uhe, P., Wallom, D., Wehner, M., and Zaaboul, R.: Half a degree additional warming, prognosis and projected impacts (HAPPI): background and experimental design, Geosci. Model Dev., 10, 571–583, https://doi.org/10.5194/gmd-10-571-2017, 2017.
Monerie, P.-A., Chevuturi, A., Cook, P., Klingaman, N. P., and Holloway, C. E.: Role of atmospheric horizontal resolution in simulating tropical and subtropical South American precipitation in HadGEM3-GC31, Geosci. Model Dev., 13, 4749–4771, https://doi.org/10.5194/gmd-13-4749-2020, 2020.
Moon, Y., Kim, D., Wing, A. A., Camargo, S. J., Zhao, M., Leung, L. R., Roberts, M. J., Cha, D.-H., and Moon, J.: An Evaluation of Tropical Cyclone Rainfall Structures in the HighResMIP Simulations against Satellite Observations, J. Climate, 35, 7315–7338, https://doi.org/10.1175/JCLI-D-21-0564.1, 2022.
Moreno-Chamarro, E., Caron, L. P., Ortega, P., Loosveldt Tomas, S., and Roberts, M. J.: Can we trust CMIP5/6 future projections of European winter precipitation?, Environ. Res. Lett., 16, 054063, https://doi.org/10.1088/1748-9326/abf28a, 2021.
Moreno-Chamarro, E., Caron, L.-P., Loosveldt Tomas, S., Vegas-Regidor, J., Gutjahr, O., Moine, M.-P., Putrasahan, D., Roberts, C. D., Roberts, M. J., Senan, R., Terray, L., Tourigny, E., and Vidale, P. L.: Impact of increased resolution on long-standing biases in HighResMIP-PRIMAVERA climate models, Geosci. Model Dev., 15, 269–289, https://doi.org/10.5194/gmd-15-269-2022, 2022.
Muis, S., Aerts, J. C. J. H., Á. Antolínez, J. A., Dullaart, J. C., Duong, T. M., Erikson, L., Haarsma, R. J., Apecechea, M. I., Mengel, M., Le Bars, D., O'Neill, A., Ranasinghe, R., Roberts, M. J., Verlaan, M., Ward, P. J., and Yan, K.: Global Projections of Storm Surges Using High-Resolution CMIP6 Climate Models, Earths Future, 11, e2023EF003479, https://doi.org/10.1029/2023EF003479, 2023.
Na, Y., Fu, Q., Leung, L. R., Kodama, C., and Lu, R.: Mesoscale Convective Systems Simulated by a High-Resolution Global Nonhydrostatic Model Over the United States and China, J. Geophys. Res.-Atmos., 127, e2021JD035916, https://doi.org/10.1029/2021JD035916, 2022.
O'Neill, B. C., Tebaldi, C., van Vuuren, D. P., Eyring, V., Friedlingstein, P., Hurtt, G., Knutti, R., Kriegler, E., Lamarque, J.-F., Lowe, J., Meehl, G. A., Moss, R., Riahi, K., and Sanderson, B. M.: The Scenario Model Intercomparison Project (ScenarioMIP) for CMIP6, Geosci. Model Dev., 9, 3461–3482, https://doi.org/10.5194/gmd-9-3461-2016, 2016.
O'Reilly, C. H., Patterson, M., Robson, J., Monerie, P. A., Hodson, D., and Ruprich-Robert, Y.: Challenges with interpreting the impact of Atlantic Multidecadal Variability using SST-restoring experiments, Npj Clim. Atmospheric Sci., 6, 1–12, https://doi.org/10.1038/s41612-023-00335-0, 2023.
Penduff, T., Sérazin, G., Leroux, S., Close, S., and Molines, J.-M.: Chaotic Variability of Ocean Heat Content: Climate-Relevant Features and Observational Implications, Oceanography, 31, 63–71, https://doi.org/10.5670/oceanog.2018.210, 2018.
Poli, P., Hersbach, H., Dee, D. P., Berrisford, P., Simmons, A. J., Vitart, F., Laloyaux, P., Tan, D. G. H., Peubey, C., Thépaut, J.-N., Trémolet, Y., Hólm, E. V., Bonavita, M., Isaksen, L., and Fisher, M.: ERA-20C: An Atmospheric Reanalysis of the Twentieth Century, J. Climate, 29, 4083–4097, https://doi.org/10.1175/JCLI-D-15-0556.1, 2016.
Priestley, M. D. K. and Catto, J. L.: Improved representation of extratropical cyclone structure in HighResMIP models, Geophys. Res. Lett., 49, e2021GL096708, https://doi.org/10.1029/2021GL096708, 2022.
Rackow, T., Danilov, S., Goessling, H. F., Hellmer, H. H., Sein, D. V., Semmler, T., Sidorenko, D., and Jung, T.: Delayed Antarctic sea-ice decline in high-resolution climate change simulations, Nat. Commun., 13, 637, https://doi.org/10.1038/s41467-022-28259-y, 2022.
Rayner, N. A., Parker, D. E., Horton, E. B., Folland, C. K., Alexander, L. V., Rowell, D. P., Kent, E. C., and Kaplan, A.: Global analyses of sea surface temperature, sea ice, and night marine air temperature since the late nineteenth century, J. Geophys. Res.-Atmos., 108, 4407, https://doi.org/10.1029/2002JD002670, 2003.
Reed, K. A., Goldenson, N., Grotjahn, R., Gutowski, W. J., Jagannathan, K., Jones, A. D., Leung, L. R., McGinnis, S. A., Pryor, S. C., Srivastava, A. K., Ullrich, P. A., and Zarzycki, C. M.: Metrics as tools for bridging climate science and applications, WIREs Clim. Change, 13, e799, https://doi.org/10.1002/wcc.799, 2022.
Reed, K. A., Stansfield, A. M., Hsu, W.-C., Kooperman, G. J., Akinsanola, A. A., Hannah, W. M., Pendergrass, A. G., and Medeiros, B.: Evaluating the Simulation of CONUS Precipitation by Storm Type in E3SM, Geophys. Res. Lett., 50, e2022GL102409, https://doi.org/10.1029/2022GL102409, 2023.
Rhoades, A. M., Hatchett, B. J., Risser, M. D., Collins, W. D., Bambach, N. E., Huning, L. S., McCrary, R., Siirila-Woodburn, E. R., Ullrich, P. A., Wehner, M. F., Zarzycki, C. M., and Jones, A. D.: Asymmetric emergence of low-to-no snow in the midlatitudes of the American Cordillera, Nat. Clim. Change, 12, 1151–1159, https://doi.org/10.1038/s41558-022-01518-y, 2022.
Roberts, M.: CMIP6 HighResMIP: Tropical storm tracks as calculated by the TempestExtremes algorithm, http://catalogue.ceda.ac.uk/uuid/438268b75fed4f27988dc02f8a1d756d (last access: 18 February 2025), 2019.
Roberts, M. J. and Lai, M.: HighResMIP2/HighResMIP2-Roberts-et-al-2024-GMD, Zenodo [code and data set], https://doi.org/10.5281/zenodo.14500187, 2025.
Roberts, M. J., Baker, A., Blockley, E. W., Calvert, D., Coward, A., Hewitt, H. T., Jackson, L. C., Kuhlbrodt, T., Mathiot, P., Roberts, C. D., Schiemann, R., Seddon, J., Vannière, B., and Vidale, P. L.: Description of the resolution hierarchy of the global coupled HadGEM3-GC3.1 model as used in CMIP6 HighResMIP experiments, Geosci. Model Dev., 12, 4999–5028, https://doi.org/10.5194/gmd-12-4999-2019, 2019.
Roberts, M. J., Camp, J., Seddon, J., Vidale, P. L., Hodges, K., Vanniere, B., Mecking, J., Haarsma, R., Bellucci, A., Scoccimarro, E., Caron, L.-P., Chauvin, F., Terray, L., Valcke, S., Moine, M.-P., Putrasahan, D., Roberts, C., Senan, R., Zarzycki, C., and Ullrich, P.: Impact of Model Resolution on Tropical Cyclone Simulation Using the HighResMIP–PRIMAVERA Multimodel Ensemble, J. Climate, 33, 2557–2583, https://doi.org/10.1175/JCLI-D-19-0639.1, 2020a.
Roberts, M. J., Camp, J., Seddon, J., Vidale, P. L., Hodges, K., Vannière, B., Mecking, J., Haarsma, R., Bellucci, A., Scoccimarro, E., Caron, L.-P., Chauvin, F., Terray, L., Valcke, S., Moine, M.-P., Putrasahan, D., Roberts, C. D., Senan, R., Zarzycki, C., Ullrich, P., Yamada, Y., Mizuta, R., Kodama, C., Fu, D., Zhang, Q., Danabasoglu, G., Rosenbloom, N., Wang, H. and Wu, L.: Projected Future Changes in Tropical Cyclones Using the CMIP6 HighResMIP Multimodel Ensemble, Geophys. Res. Lett., 47, e2020GL088662, https://doi.org/10.1029/2020GL088662, 2020b.
Rodgers, K. B., Lee, S.-S., Rosenbloom, N., Timmermann, A., Danabasoglu, G., Deser, C., Edwards, J., Kim, J.-E., Simpson, I. R., Stein, K., Stuecker, M. F., Yamaguchi, R., Bódai, T., Chung, E.-S., Huang, L., Kim, W. M., Lamarque, J.-F., Lombardozzi, D. L., Wieder, W. R., and Yeager, S. G.: Ubiquity of human-induced changes in climate variability, Earth Syst. Dynam., 12, 1393–1411, https://doi.org/10.5194/esd-12-1393-2021, 2021.
Satoh, M., Matsuno, T., Tomita, H., Miura, H., Nasuno, T., and Iga, S.: Nonhydrostatic icosahedral atmospheric model (NICAM) for global cloud resolving simulations, J. Comput. Phys., 227, 3486–3514, https://doi.org/10.1016/j.jcp.2007.02.006, 2008.
Savage, N.: eerie-project/dreq_tools: Mint DOI, https://doi.org/10.5281/zenodo.8296685, 2023.
Scaife, A. A., Camp, J., Comer, R., Davis, P., Dunstone, N., Gordon, M., MacLachlan, C., Martin, N., Nie, Y., Ren, H.-L., Roberts, M., Robinson, W., Smith, D., and Vidale, P. L.: Does increased atmospheric resolution improve seasonal climate predictions?, Atmos. Sci. Lett., 20, e922, https://doi.org/10.1002/asl.922, 2019.
Schemm, S.: Toward Eliminating the Decades-Old “Too Zonal and Too Equatorward” Storm-Track Bias in Climate Models, J. Adv. Model. Earth Sy., 15, e2022MS003482, https://doi.org/10.1029/2022MS003482, 2023.
Scoccimarro, E., Fogli, P. G., Reed, K. A., Gualdi, S., Masina, S., and Navarra, A.: Tropical Cyclone Interaction with the Ocean: The Role of High-Frequency (Subdaily) Coupled Processes, J. Climate, 30, 145–162, https://doi.org/10.1175/JCLI-D-16-0292.1, 2017.
Scoccimarro, E., Gualdi, S., Bellucci, A., Peano, D., Cherchi, A., Vecchi, G. A., and Navarra, A.: The typhoon-induced drying of the Maritime Continent, P. Natl. Acad. Sci. USA, 117, 3983–3988, https://doi.org/10.1073/pnas.1915364117, 2020.
Scoccimarro, E., Peano, D., Gualdi, S., Bellucci, A., Lovato, T., Fogli, P. G., and Navarra, A.: Extreme events representation in CMCC-CM2 standard and high-resolution general circulation models, Geosci. Model Dev., 15, 1841–1854, https://doi.org/10.5194/gmd-15-1841-2022, 2022.
Seager, R., Cane, M., Henderson, N., Lee, D.-E., Abernathey, R., and Zhang, H.: Strengthening tropical Pacific zonal sea surface temperature gradient consistent with rising greenhouse gases, Nat. Clim. Change, 9, 517–522, https://doi.org/10.1038/s41558-019-0505-x, 2019.
Seager, R., Henderson, N., and Cane, M.: Persistent Discrepancies between Observed and Modeled Trends in the Tropical Pacific Ocean, J. Climate, 35, 4571–4584, https://doi.org/10.1175/JCLI-D-21-0648.1, 2022.
Seddon, J., Mizielinski, M. S., Roberts, M., Stephens, A., Hegewald, J., Semmler, T., Bretonnière, P.-A., Caron, L.-P., D'Anca, A., Fiore, S., Moine, M.-P., Roberts, C., Senan, R., and Fladrich, U.: Deliverable D9.6 Review of DMP and lessons learnt for future projects, Zenodo [data set], https://doi.org/10.5281/zenodo.3961932, 2020.
Seddon, J., Stephens, A., Mizielinski, M. S., Vidale, P. L., and Roberts, M. J.: Technology to aid the analysis of large-volume multi-institute climate model output at a central analysis facility (PRIMAVERA Data Management Tool V2.10), Geosci. Model Dev., 16, 6689–6700, https://doi.org/10.5194/gmd-16-6689-2023, 2023.
Shaevitz, D. A., Camargo, S. J., Sobel, A. H., Jonas, J. A., Kim, D., Kumar, A., Larow, T. E., Lim, Y.-K., Murakami, H., Reed, K. A., Roberts, M. J., Scoccimarro, E., Vidale, P. L., Wang, H., Wehner, M. F., Zhao, M., and Henderson, N.: Characteristics of tropical cyclones in high-resolution models in the present climate, J. Adv. Model. Earth Sy., 6, 1154–1172, https://doi.org/10.1002/2014MS000372, 2014.
Sherwood, S. C., Hegerl, G., Braconnot, P., Friedlingstein, P., Goelzer, H., Harris, N. R. P., Holland, E., Kim, H., Mitchell, M., Naish, T., Nobre, P., Otto-Bliesner, B. L., Reed, K. A., Renwick, J., and van der Wel, N. P. M.: Uncertain Pathways to a Future Safe Climate, Earths Future, 12, e2023EF004297, https://doi.org/10.1029/2023EF004297, 2024.
Small, R. J., Bacmeister, J., Bailey, D., Baker, A., Bishop, S., Bryan, F., Caron, J., Dennis, J., Gent, P., Hsu, H., Jochum, M., Lawrence, D., Muñoz, E., DiNezio, P., Scheitlin, T., Tomas, R., Tribbia, J., Tseng, Y., and Vertenstein, M.: A new synoptic scale resolving global climate simulation using the Community Earth System Model, J. Adv. Model. Earth Sy., 6, 1065–1094, https://doi.org/10.1002/2014MS000363, 2014.
Small, R. J., Kurian, J., Chang, P., Xu, G., Tsujino, H., Yeager, S., Danabasoglu, G., Kim, W. M., Altuntas, A., and Castruccio, F.: Eastern Boundary Upwelling Systems in Ocean–Sea Ice Simulations Forced by CORE and JRA55-do: Mean State and Variability at the Surface, J. Climate, 37, 2821–2848, https://doi.org/10.1175/JCLI-D-23-0511.1, 2024.
Sobel, A. H., Lee, C.-Y., Bowen, S. G., Camargo, S. J., Cane, M. A., Clement, A., Fosu, B., Hart, M., Reed, K. A., Seager, R., and Tippett, M. K.: Near-term tropical cyclone risk and coupled Earth system model biases, Proc. Natl. Acad. Sci. USA, 120, e2209631120, https://doi.org/10.1073/pnas.2209631120, 2023.
Stansfield, A. M., Reed, K. A., and Zarzycki, C. M.: Changes in Precipitation From North Atlantic Tropical Cyclones Under RCP Scenarios in the Variable-Resolution Community Atmosphere Model, Geophys. Res. Lett., 47, e2019GL086930, https://doi.org/10.1029/2019GL086930, 2020.
Stevens, B., Fiedler, S., Kinne, S., Peters, K., Rast, S., Müsse, J., Smith, S. J., and Mauritsen, T.: MACv2-SP: a parameterization of anthropogenic aerosol optical properties and an associated Twomey effect for use in CMIP6, Geosci. Model Dev., 10, 433–452, https://doi.org/10.5194/gmd-10-433-2017, 2017.
Stevens, B., Satoh, M., Auger, L., Biercamp, J., Bretherton, C. S., Chen, X., Düben, P., Judt, F., Khairoutdinov, M., Klocke, D., Kodama, C., Kornblueh, L., Lin, S.-J., Neumann, P., Putman, W. M., Röber, N., Shibuya, R., Vanniere, B., Vidale, P. L., Wedi, N., and Zhou, L.: DYAMOND: the DYnamics of the Atmospheric general circulation Modeled On Non-hydrostatic Domains, Prog. Earth Planet. Sci., 6, 61, https://doi.org/10.1186/s40645-019-0304-z, 2019.
Stevens, B., Adami, S., Ali, T., Anzt, H., Aslan, Z., Attinger, S., Bäck, J., Baehr, J., Bauer, P., Bernier, N., Bishop, B., Bockelmann, H., Bony, S., Brasseur, G., Bresch, D. N., Breyer, S., Brunet, G., Buttigieg, P. L., Cao, J., Castet, C., Cheng, Y., Dey Choudhury, A., Coen, D., Crewell, S., Dabholkar, A., Dai, Q., Doblas-Reyes, F., Durran, D., El Gaidi, A., Ewen, C., Exarchou, E., Eyring, V., Falkinhoff, F., Farrell, D., Forster, P. M., Frassoni, A., Frauen, C., Fuhrer, O., Gani, S., Gerber, E., Goldfarb, D., Grieger, J., Gruber, N., Hazeleger, W., Herken, R., Hewitt, C., Hoefler, T., Hsu, H.-H., Jacob, D., Jahn, A., Jakob, C., Jung, T., Kadow, C., Kang, I.-S., Kang, S., Kashinath, K., Kleinen-von Königslöw, K., Klocke, D., Kloenne, U., Klöwer, M., Kodama, C., Kollet, S., Kölling, T., Kontkanen, J., Kopp, S., Koran, M., Kulmala, M., Lappalainen, H., Latifi, F., Lawrence, B., Lee, J. Y., Lejeun, Q., Lessig, C., Li, C., Lippert, T., Luterbacher, J., Manninen, P., Marotzke, J., Matsouoka, S., Merchant, C., Messmer, P., Michel, G., Michielsen, K., Miyakawa, T., Müller, J., Munir, R., Narayanasetti, S., Ndiaye, O., Nobre, C., Oberg, A., Oki, R., Özkan-Haller, T., Palmer, T., Posey, S., Prein, A., Primus, O., Pritchard, M., Pullen, J., Putrasahan, D., Quaas, J., Raghavan, K., Ramaswamy, V., Rapp, M., Rauser, F., Reichstein, M., Revi, A., Saluja, S., Satoh, M., Schemann, V., Schemm, S., Schnadt Poberaj, C., Schulthess, T., Senior, C., Shukla, J., Singh, M., Slingo, J., Sobel, A., Solman, S., Spitzer, J., Stier, P., Stocker, T., Strock, S., Su, H., Taalas, P., Taylor, J., Tegtmeier, S., Teutsch, G., Tompkins, A., Ulbrich, U., Vidale, P.-L., Wu, C.-M., Xu, H., Zaki, N., Zanna, L., Zhou, T., and Ziemen, F.: Earth Virtualization Engines (EVE), Earth Syst. Sci. Data, 16, 2113–2122, https://doi.org/10.5194/essd-16-2113-2024, 2024.
Takasuka, D., Satoh, M., Miyakawa, T., Kodama, C., Klocke, D., Stevens, B., Vidale, P. L., and Terai, C. R.: A protocol and analysis of year-long simulations of global storm-resolving models and beyond, 23 May 2024, Research Square, https://doi.org/10.21203/rs.3.rs-4458164/v1, 2024.
Ullrich, P. A., Zarzycki, C. M., McClenny, E. E., Pinheiro, M. C., Stansfield, A. M., and Reed, K. A.: TempestExtremes v2.1: a community framework for feature detection, tracking, and analysis in large datasets, Geosci. Model Dev., 14, 5023–5048, https://doi.org/10.5194/gmd-14-5023-2021, 2021.
Vannière, B., Demory, M.-E., Vidale, P. L., Schiemann, R., Roberts, M. J., Roberts, C. D., Matsueda, M., Terray, L., Koenigk, T., and Senan, R.: Multi-model evaluation of the sensitivity of the global energy budget and hydrological cycle to resolution, Clim. Dynam., 52, 6817–6846, https://doi.org/10.1007/s00382-018-4547-y, 2019.
van Vuuren, D., O'Neill, B., Tebaldi, C., Chini, L., Friedlingstein, P., Hasegawa, T., Riahi, K., Sanderson, B., Govindasamy, B., Bauer, N., Eyring, V., Fall, C., Frieler, K., Gidden, M., Gohar, L., Jones, A., King, A., Knutti, R., Kriegler, E., Lawrence, P., Lennard, C., Lowe, J., Mathison, C., Mehmood, S., Prado, L., Zhang, Q., Rose, S., Ruane, A., Schleussner, C.-F., Seferian, R., Sillmann, J., Smith, C., Sörensson, A., Panickal, S., Tachiiri, K., Vaughan, N., Vishwanathan, S., Yokohata, T., and Ziehn, T.: The Scenario Model Intercomparison Project for CMIP7 (ScenarioMIP-CMIP7), EGUsphere [preprint], https://doi.org/10.5194/egusphere-2024-3765, 2025.
Wang, B., Ding, Q., Fu, X., Kang, I.-S., Jin, K., Shukla, J., and Doblas-Reyes, F.: Fundamental challenge in simulation and prediction of summer monsoon rainfall, Geophys. Res. Lett., 32, L15711, https://doi.org/10.1029/2005GL022734, 2005.
Webb, M. J., Andrews, T., Bodas-Salcedo, A., Bony, S., Bretherton, C. S., Chadwick, R., Chepfer, H., Douville, H., Good, P., Kay, J. E., Klein, S. A., Marchand, R., Medeiros, B., Siebesma, A. P., Skinner, C. B., Stevens, B., Tselioudis, G., Tsushima, Y., and Watanabe, M.: The Cloud Feedback Model Intercomparison Project (CFMIP) contribution to CMIP6, Geosci. Model Dev., 10, 359–384, https://doi.org/10.5194/gmd-10-359-2017, 2017.
Wedi, N., Bauer, P., Sandu, I., Hoffmann, J., Sheridan, S., Cereceda, R., Quintino, T., Thiemert, D., and Geenen, T.: Destination Earth: High-Performance Computing for Weather and Climate, Comput. Sci. Eng., 24, 29–37, https://doi.org/10.1109/MCSE.2023.3260519, 2022.
Wehner, M. F., Reed, K. A., Li, F., Prabhat, Bacmeister, J., Chen, C.-T., Paciorek, C., Gleckler, P. J., Sperber, K. R., Collins, W. D., Gettelman, A., and Jablonowski, C.: The effect of horizontal resolution on simulation quality in the Community Atmospheric Model, CAM5.1, J. Adv. Model. Earth Sy., 6, 980–997, https://doi.org/10.1002/2013MS000276, 2014.
Wehner, M. F., Reed, K. A., Loring, B., Stone, D., and Krishnan, H.: Changes in tropical cyclones under stabilized 1.5 and 2.0 °C global warming scenarios as simulated by the Community Atmospheric Model under the HAPPI protocols, Earth Syst. Dynam., 9, 187–195, https://doi.org/10.5194/esd-9-187-2018, 2018.
Wing, A. A., Camargo, S. J., Sobel, A. H., Kim, D., Moon, Y., Murakami, H., Reed, K. A., Vecchi, G. A., Wehner, M. F., Zarzycki, C., and Zhao, M.: Moist Static Energy Budget Analysis of Tropical Cyclone Intensification in High-Resolution Climate Models, J. Climate, 32, 6071–6095, https://doi.org/10.1175/JCLI-D-18-0599.1, 2019.
World Climate Research Programme: Report of the WCRP km-scale modeling workshop, 8/2022, 3–7 October 2022, https://www.wcrp-climate.org/WCRP-publications/2022/WCRP_Report_08-2022_k-scale-report-final.pdf (last access: 18 February 2025), 2022.
World Climate Research Programme: ESMO: Earth System Modelling and Observation, https://www.wcrp-climate.org/esmo-overview (last access: 14 August 2024), 2024.
Xu, G., Chang, P., Ramachandran, S., Danabasoglu, G., Yeager, S., Small, J., Zhang, Q., Jing, Z., and Wu, L.: Impacts of Model Horizontal Resolution on Mean Sea Surface Temperature Biases in the Community Earth System Model, J. Geophys. Res.-Oceans, 127, e2022JC019065, https://doi.org/10.1029/2022JC019065, 2022.
Xu, G., Chang, P., Small, J., Danabasoglu, G., Yeager, S., Ramachandran, S., and Zhang, Q.: Enhanced Upper Ocean Warming Projected by the Eddy-Resolving Community Earth System Model, Geophys. Res. Lett., 50, e2023GL106100, https://doi.org/10.1029/2023GL106100, 2023.
Xu, G., Rencurrel, M. C., Chang, P., Liu, X., Danabasoglu, G., Yeager, S. G., Steele, M., Weijer, W., Li, Y., Rosenbloom, N., Castruccio, F., and Zhang, Q.: High-resolution modelling identifies the Bering Strait's role in amplified Arctic warming, Nat. Clim. Change, 14, 615–622, https://doi.org/10.1038/s41558-024-02008-z, 2024.
Yamada, Y., Kodama, C., Satoh, M., Sugi, M., Roberts, M. J., Mizuta, R., Noda, A. T., Nasuno, T., Nakano, M., and Vidale, P. L.: Evaluation of the contribution of tropical cyclone seeds to changes in tropical cyclone frequency due to global warming in high-resolution multi-model ensemble simulations, Prog. Earth Planet. Sci., 8, 11, https://doi.org/10.1186/s40645-020-00397-1, 2021.
Yeager, S. G., Chang, P., Danabasoglu, G., Rosenbloom, N., Zhang, Q., Castruccio, F. S., Gopal, A., Cameron Rencurrel, M., and Simpson, I. R.: Reduced Southern Ocean warming enhances global skill and signal-to-noise in an eddy-resolving decadal prediction system, Npj Clim. Atmospheric Sci., 6, 107, https://doi.org/10.1038/s41612-023-00434-y, 2023.
Yin, J., Griffies, S. M., Winton, M., Zhao, M., and Zanna, L.: Response of Storm-Related Extreme Sea Level along the U. S. Atlantic Coast to Combined Weather and Climate Forcing, J. Climate, 33, 3745–3769, doi10.1175/JCLI-D-19-0551.1, 2020.
Zhang, W., Kirtman, B., Siqueira, L., Xiang, B., Infanti, J., and Perlin, N.: Decadal Variability of Southeast US Rainfall in an Eddying Global Coupled Model, Geophys. Res. Lett., 49, e2021GL096709, https://doi.org/10.1029/2021GL096709, 2022.
Zhao, M.: Simulations of Atmospheric Rivers, Their Variability, and Response to Global Warming Using GFDL's New High-Resolution General Circulation Model, J. Climate, 33, 10287–10303, https://doi.org/10.1175/JCLI-D-20-0241.1, 2020.
Zhao, M.: A Study of AR-, TS-, and MCS-Associated Precipitation and Extreme Precipitation in Present and Warmer Climates, J. Climate, 35, 479–497, https://doi.org/10.1175/JCLI-D-21-0145.1, 2022.
Zhao, M. and Knutson, T.: Crucial role of sea surface temperature warming patterns in near-term high-impact weather and climate projection, Npj Clim. Atmospheric Sci., 7, 1–13, https://doi.org/10.1038/s41612-024-00681-7, 2024.
Zhao, M., Held, I. M., Lin, S. J. S.-J., and Vecchi, G. A.: Simulations of global hurricane climatology, interannual variability, and response to global warming using a 50-km resolution GCM, J. Climate, 22, 6653–6678, https://doi.org/10.1175/2009JCLI3049.1, 2009.
- Abstract
- Introduction
- Science questions
- Experimental design and protocol
- Data requirements
- Towards standard metrics and diagnostics
- Summary and discussion
- Appendix A: Initial conditions for highresMIP-present
- Appendix B: Initial conditions for spinup-1950
- Code and data availability
- Author contributions
- Competing interests
- Disclaimer
- Acknowledgements
- Financial support
- Review statement
- References