the Creative Commons Attribution 4.0 License.
the Creative Commons Attribution 4.0 License.
NAQPMS-PDAF v2.0: a novel hybrid nonlinear data assimilation system for improved simulation of PM2.5 chemical components
Hongyi Li
Lars Nerger
Dawei Zhang
Di Zhang
Guigang Tang
Haibo Wang
Pingqing Fu
Hang Su
Zifa Wang
Identifying PM2.5 chemical components is crucial for formulating emission strategies, estimating radiative forcing, and assessing human health effects. However, accurately describing spatiotemporal variations in PM2.5 chemical components remains a challenge. In our earlier work, we developed an aerosol extinction coefficient data assimilation (DA) system (Nested Air Quality Prediction Model System with the Parallel Data Assimilation Framework (NAQPMS-PDAF) v1.0) that was suboptimal for chemical components. This paper introduces a novel hybrid nonlinear chemical DA system (NAQPMS-PDAF v2.0) to accurately interpret key chemical components (SO, NO, NH, OC, and EC). NAQPMS-PDAF v2.0 improves upon v1.0 by effectively handling and balancing stability and nonlinearity in chemical DA, which is achieved by incorporating the non-Gaussian distribution ensemble perturbation and hybrid localized Kalman–nonlinear ensemble transform filter with an adaptive forgetting factor for the first time. The dependence tests demonstrate that NAQPMS-PDAF v2.0 provides excellent DA results with a minimal ensemble size of 10, surpassing previous reports and v1.0. A 1-month DA experiment shows that the analysis field generated by NAQPMS-PDAF v2.0 is in good agreement with observations, especially in reducing the underestimation of NH and NO and the overestimation of SO, OC, and EC. In particular, the Pearson correlation coefficient (CORR) values for NO, OC, and EC are above 0.96, and the R2 values are above 0.93. NAQPMS-PDAF v2.0 also demonstrates superior spatiotemporal interpretation, with most DA sites showing improvements of over 50 %–200 % in CORR and over 50 %–90 % in RMSE for the five chemical components. Compared to the poor performance in the global reanalysis dataset (CORR: 0.42–0.55, RMSE: 4.51–12.27 µg m−3) and NAQPMS-PDAF v1.0 (CORR: 0.35–0.98, RMSE: 2.46–15.50 µg m−3), NAQPMS-PDAF v2.0 has the highest CORR of 0.86–0.99 and the lowest RMSE of 0.14–3.18 µg m−3. The uncertainties in ensemble DA are also examined, further highlighting the potential of NAQPMS-PDAF v2.0 for advancing aerosol chemical component studies.
- Article
(15803 KB) - Full-text XML
- Companion paper
-
Supplement
(1896 KB) - BibTeX
- EndNote
PM2.5 is a complex mixture of various chemical fractions, mainly including sulfate (SO), nitrate (NO), ammonium (NH), organic carbon (OC), and elemental carbon (EC). These chemical components exert diverse influences on the atmospheric environment (Khanna et al., 2018), human health (Bell et al., 2007; Schlesinger, 2007; J. Li et al., 2022; Alves et al., 2023), and climate change (Schult et al., 1997; Park et al., 2014; Wilcox et al., 2016). However, current detection technologies, such as direct observation by sampling and chemical analysis (Zhang et al., 2015; Ming et al., 2017), ground-based remote sensing inversion (Nishizawa et al., 2008, 2011, 2017), and observation-based machine learning (Lin et al., 2022; Lee et al., 2023; Li et al., 2025), are insufficient in interpreting spatiotemporally continuous information of PM2.5 chemical components due to the limited number of observation sites or platforms. Although atmospheric chemistry transport models (CTMs) (Wang et al., 2014, 2015; Jia et al., 2017; Yang et al., 2019; Li et al., 2020; Lv et al., 2020) are widely used to characterize the spatiotemporal distribution of multiple chemical species, they are constrained by uncertainties in initial-boundary conditions, physiochemical mechanisms, emission inventories, and meteorological fields (Sax and Isakov, 2003; Mallet and Sportisse, 2006; Rodriguez et al., 2007; Chang et al., 2015; Miao et al., 2020; Xie et al., 2022), resulting in notable discrepancies between the model simulations and accurate observations.
Data assimilation (DA) offers a solution to integrate the multi-source observations, CTMs, and their uncertainties effectively to enhance the simulation and forecasting capabilities of CTMs. Variational methods (3D-Var/4D-Var) (Talagrand and Courtier, 1987), an ensemble Kalman filter (EnKF) (Evensen, 1994, 2003), EnKF variants (EnKFs) (Bishop et al., 2001; Tippett et al., 2003; Hunt et al., 2007; Nerger et al., 2012), and hybrid EnKF–Var methods (Hamill and Snyder, 2000; Schwartz et al., 2014) are most widely applied in DA. However, variational methods have a flow-independent background error covariance (BEC) with the assumption of isotropic, static, and uniform characteristics, and they need to develop a tangent linear adjoint model, which is difficult to practice for complex models. Although EnKFs and hybrid EnKF–Var methods have a flow-dependent BEC, they are sensitive to inadequate ensemble sampling and have high computational costs. Importantly, these methods cannot address model nonlinearity and non-Gaussian error distribution, yielding suboptimal results for DA in highly nonlinear CTMs.
Currently, nonlinear filters, such as the particle filter (PF) (Gordon et al., 1993) and nonlinear ensemble transform filter (NETF) (Tödter and Ahrens, 2015), have been proposed to approximate the complete posterior probability distribution of model states and provide a better representation of non-Gaussian information based on Monte Carlo random sampling and Bayesian theory. However, PF is unstable and susceptible to filter degeneration compared to EnKFs. In a recent study, Nerger (2022) proposed the hybrid Kalman–nonlinear ensemble transform filter (KNETF) to achieve excellent DA performance in the Lorenz-63 and Lorenz-96 models with a smaller ensemble size, which combines the stability of EnKFs and the nonlinearity of NETF (Nerger, 2022). However, to the authors' knowledge, this algorithm has not been applied to the chemical DA of CTMs.
Studies on chemical DA involve the assimilation of aerosol optical properties, such as aerosol optical depth (AOD) and extinction coefficient (EXT), and particulate matter (PM), such as the mass concentrations of PM2.5 and PM10. The common AOD observations for DA include the OMI AOD (Ali et al., 2013), MODIS AOD (Zhang et al., 2008; Huneeus et al., 2012, 2013; Rubin and Collins, 2014; Lynch et al., 2016; Werner et al., 2019; Kumar et al., 2020), AERONET AOD (Schutgens et al., 2010; Li et al., 2016), sun–sky photometer multiband AOD (Chang et al., 2021), GOCI AOD (Saide et al., 2014; Luo et al., 2020; Kim et al., 2021), and Fengyun/Himawari-8 AOD (Bao et al., 2019; Jin et al., 2019; Xia et al., 2019, 2020). These studies indicated that AOD observations can enhance the accuracy of aerosol simulation and forecast. Compared to AOD, EXT DA effectively improves the interpretation of aerosol vertical distribution (Zhang et al., 2014; Cheng et al., 2019; Wang et al., 2022). Additionally, the simultaneous DA of aerosol optical properties and PM is widely applied in aerosol studies (Tang et al., 2015; Chai et al., 2017). According to our literature review (Yang et al., 2023), there is currently no DA study on aerosol chemical components due to the limited DA influence of PM and AOD on chemical compositions (Chang et al., 2021) and the limited chemical observations with an extensive spatial range. Moreover, the aerosol chemical components exhibit nonlinearity and a non-Gaussian distribution (Ha, 2022), while current mainstream algorithms, such as variational methods or EnKFs, are suboptimal for chemical component DA.
In our previous work, we developed an aerosol vertical DA system (NAQPMS-PDAF v1.0) based on EnKFs to improve the simulation of the extinction coefficient vertical profile (Wang et al., 2022). In this study, we present a novel hybrid nonlinear DA system (NAQPMS-PDAF v2.0) to interpret various PM2.5 chemical components through online integration of the Parallel Data Assimilation Framework (PDAF; version 2.1, released on 21 February 2023), Observation Module Infrastructure (OMI), and Nested Air Quality Prediction Model System (NAQPMS). We collected 1-month hourly surface observations of five PM2.5 chemical components (NH, SO, NO, OC, and EC) over northern China and the surrounding areas. We utilized the hybrid localized Kalman–nonlinear ensemble transform filter (LKNETF) to generate a high-resolution and high-accuracy reanalysis dataset of PM2.5 chemical components for the first time. Notably, the ensemble members in NAQPMS-PDAF v2.0 are generated by perturbing emission species based on their uncertainties and non-Gaussian distribution assumption. Section 2 briefly introduces NAQPMS and PDAF v2.1 with OMI and details the development of NAQPMS-PDAF v2.0, including the system structure, configuration, ensemble generation, and LKNETF algorithm. The data used in this study and experimental settings are also described in Sect. 2. Section 3 presents the DA results, including an evaluation of dependencies, performance, and external comparisons, as well as a discussion of the ensemble DA uncertainty. Section 4 summarizes the conclusions and outlook.
2.1 NAQPMS
The Nested Air Quality Prediction Modeling System (NAQPMS), developed by the Institute of Atmospheric Physics (IAP), Chinese Academy of Sciences (CAS), is used to provide background fields for key aerosol chemical components in this study. NAQPMS is a multi-scale gridded 3D Eulerian chemical transport model based on continuity equations. The nested grids in the horizontal direction enable data exchange between different domains. Applying terrain-following coordinates in the vertical direction mitigates numerical calculation errors to enhance model accuracy. NAQPMS comprises an input section, a numerical computation section, and an output section. The input section incorporates static terrain data, emission inventories, meteorological fields, and initial-boundary conditions. The numerical computation section performs multiple physicochemical process calculations, including the advection process, eddy diffusion, dry deposition, wet scavenging, gas-phase chemistry, aqueous chemistry, aerosol physicochemical processes (including heterogeneous reactions at the aerosol surface), and other processes. The schemes and features of the physicochemical processes are summarized in Table S1 in the Supplement. The output section is responsible for model post-processing, data diagnostics, and source identification.
NAQPMS is capable of characterizing the 3D spatiotemporal distribution of various atmospheric compositions at global and regional scales and has been widely used in atmospheric pollution and chemistry research, such as O3 pollution (Wang et al., 2001), haze episodes (Wang et al., 2014; Du et al., 2021), regional transport (Wang et al., 2017, 2019), source identification (Y. Li et al., 2022), air quality simulation at a global scale (Ye et al., 2021) and an urban-street scale (Wang et al., 2023), and acid deposition (Ge et al., 2014).
2.2 PDAF v2.1 with OMI
The Parallel Data Assimilation Framework (PDAF; https://pdaf.awi.de/trac/wiki, last access: 8 March 2024) is an open-source and high-expandability software developed by the Alfred Wegener Institute (AWI) in Germany to integrate observations, numerical models, and assimilation systems for DA tasks and is widely applied in numerical models of meteorology, ocean, land surface, and atmospheric chemistry (Kurtz et al., 2016; Nerger et al., 2020; Mingari et al., 2022; Strebel et al., 2022; Wang et al., 2022; Yu et al., 2022). The initial version of PDAF (PDAF v1.0) was released in 2004. It has undergone continuous improvements and updates, with major updates including the introduction of the ensemble transform Kalman filter (ETKF) and its localized variant (LETKF) in version 1.6; the implementation of PDAF-OMI (Observation Module Infrastructure) in version 1.16; the integration of 3D-Var methods in version 2.0; and the incorporation of the hybrid KNETF and its localized variant (LKNETF) for the first time in version 2.1, which was released in 2023 to handle complex DA situations, such as nonlinearity of the system and non-Gaussian error distribution of the model state. Notably, the version of PDAF coupled in NAQPMS-PDAF v1.0 is PDAF v1.15 (released in 2019), implying that NAQPMS-PDAF v1.0 has more limited applicability and functionality. In this work, PDAF v2.1 is coupled in NAQPMS-PDAF v2.0.
PDAF has offline and online modes. For the offline mode, PDAF and the model perform separately without coupling, obviating the need to modify the model code. For the online mode, PDAF is coupled with the model, and model calculation and data assimilation are performed continuously. Compared to the offline mode, the online coupling has several advantages. Firstly, the initialization of PDAF and the model is integrated, necessitating a single execution rather than two separate executions. Secondly, the model integration result can be directly passed to PDAF for data assimilation. Additionally, the assimilation result of PDAF can be directly passed to the model for the next model integration. The online mode eliminates the need for intermediate steps and improves efficiency. Thirdly, the online mode is controlled by a main program, which allows for efficient use of several processors in the high-performance computing cluster. Conversely, in the offline mode, PDAF and the model are managed by distinct programs, often with fewer processors available for each program. Therefore, the online-mode PDAF is used in this study.
PDAF-OMI, an extension of PDAF, provides I/O interfaces for multi-type observations, simplifying user observation handling by offering generic PDAF-OMI core routines and independent user-supplied routines for each observational type. The user-supplied routines, namely init_dim_obs, init_dim_obs_l, obs_op, and localize_covar, are responsible for reading and writing multi-type observations, applying corresponding observation operators, and performing covariance localization, respectively. The modules for all observation types are integrated into callback_obs_pdafomi, allowing free combinations between different observation types without interference and facilitating collaborative DA for various aerosol chemical components. PDAF-OMI was not applied in NAQPMS-PDAF v1.0. Consequently, NAQPMS-PDAF v1.0 cannot switch between different observational type combinations, and users need to define complete routines for each observation type for the DA process, resulting in more tedious code writing and higher computational costs in NAQPMS-PDAF v1.0.
2.3 NAQPMS-PDAF v2.0
2.3.1 Structure of NAQPMS-PDAF v2.0
Figure 1 illustrates the structure (left portion) and main workflow (right portion) of NAQPMS-PDAF v2.0. As described in the left portion of Fig. 1, the observation part involves the integration of multi-type observations (the purple cuboids) and the utilization of PDAF-OMI. PDAF-OMI enables the simultaneous access and scheduling of multi-type and multi-source observations by employing observational indices, thereby facilitating flexible combinations of observations. The ensemble initial fields (the dark blue cuboids) are crucial inputs for the numerical simulation of NAQPMS. The ensemble forecast/background fields (the dark yellow cuboids) are generated by perturbing emission species based on hypothesized distributions (see Sect. 2.3.3) and performing physiochemical calculations in NAQPMS (the green rectangles). Then, chemical DA is performed by a novel hybrid localized nonlinear DA algorithm (LKNETF; see Sect. 2.3.4) with an adaptive hybrid weight and an adaptive forgetting factor to generate analysis fields (the orange cuboids) for the next realization.
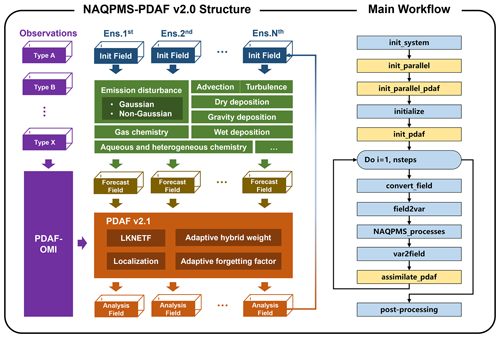
Figure 1The structure of NAQPMS-PDAF v2.0. (left) The purple cuboids represent the multi-type observations, the dark blue cuboids represent the initial fields, the dark yellow cuboids represent the forecast or background fields, and the orange cuboids represent the analysis fields. Ens.1st represents the first ensemble member, and Ens.Nth represents the Nth ensemble member. (right) The main workflow in NAQPMS-PDAF v2.0, where the blue rectangles represent the modules in NAQPMS, and the yellow rectangles represent the modules in PDAF).
NAQPMS-PDAF v2.0 implements an online coupling between NAQPMS and PDAF v2.1 with OMI, utilizing a level-2 parallel computational framework. The level-2 parallel implementation has been described in our previous work (Wang et al., 2022). The online coupling ensures the continuous operation of model forecasts and assimilation analysis at each time step, achieved by directly integrating PDAF routines into the prototype code of NAQPMS (the right portion of Fig. 1; the blue represents NAQPMS main routines, while the yellow represents PDAF main routines). The level-2 parallel computational framework, which utilizes the message passing interface (MPI) standard, facilitates concurrent processing and data exchange among multiple ensemble members and parallel computation among model state matrixes within each ensemble member, enhancing the efficiency of ensemble analysis and numerical model computations. For instance, the operation of 20 ensemble members necessitates the execution of 20 model tasks, each of which performs integral calculations on a large model grid. A total of 20 model tasks can be executed simultaneously at 20 computational nodes with sufficient computational resources. Each model task can then perform parallel computation with multiple processors by splitting the large model grid into multiple sub-grids. As illustrated in the right portion of Fig. 1, the workflow of NAQPMS-PDAF v2.0 is outlined as follows:
-
Step 1. The init_system module initializes NAQPMS by defining all model state variables; allocating numerical matrixes; and configuring parameters, the I/O of meteorological fields, and emission input.
-
Step 2. The init_parallel module initializes MPI (MPI_ COMM_WORLD) and the model communicator (MPI_COMM_MODEL), their number of processes, and the rank of a process, followed by init_parallel_pdaf, which initializes MPI communicators for the model tasks, the filter tasks, and the coupling between model and filter tasks.
-
Step 3. The initialize module initializes the parameters of the target field, including spatiotemporal dimensions (longitude, latitude, and time steps) and variable dimensions.
-
Step 4. The init_pdaf module initializes PDAF variables, such as the local state dimension, global state dimension, and settings for analysis steps.
-
Step 5. In this step, the time loop of the forecast and the analysis are performed. The convert_field module is employed to match the matrix storage rule of the target field between NAQPMS and PDAF to ensure compatibility. The field2var module collects the analysis field/initial field and establishes a relationship between the initial field/analysis field and sub-variables in NAQPMS. Subsequently, the analysis field values are allocated to the corresponding NAQPMS sub-variables, and then the NAQPMS_processes module performs the forecast. Afterwards, the var2field module, the inverse of the field2var module, assigns the NAQPMS sub-variables to the forecast field/background field. Finally, the assimilate_pdaf module assimilates the target field with observations to generate an analysis field for the next iteration.
-
Step 6. The post-processing module is responsible for finalizing NAQPMS-PDAF, data analysis, and DA evaluation.
2.3.2 Configurations
The meteorological field for NAQPMS is provided by the Weather Research and Forecasting model version 4.0 (WRFv4.0; https://www.mmm.ucar.edu/models/wrf, last access: 26 March 2023). The initial-boundary conditions for WRF are obtained from the NCEP Global Data Assimilation System (GDAS) Final analysis (https://rda.ucar.edu/datasets/ds083.3/, last access: 26 March 2023), with a horizontal resolution of 0.25° × 0.25° and a temporal resolution of 6 h, produced by GDAS. The land use data for WRF were updated by USGS's MCD12Q1 v006 in 2019 (https://lpdaac.usgs.gov/products/mcd12q1v006/, last access: 14 January 2022) with 20 categories. Three nested model domains are conducted with horizontal resolutions of 45 km in the East Asia region (domain 1), 15 km in most areas of China except for the western area (domain 2), and 5 km in the northern China region (domain 3, target research region). WRF and NAQPMS have 40 vertical layers with 27 layers within 2 km. The parameterization schemes for physical processes in WRF are shown in Table S2. The boundary condition input for NAQPMS is provided by the Model for OZone And Related chemical Tracers version 2.4 (MOZART v2.4) global chemistry transport model (Horowitz et al., 2003). The anthropogenic emissions for NAQPMS are from Tsinghua University's 2016 Multi-resolution Emission Inventory for China (MEIC; http://www.meicmodel.org/, last access: 11 March 2023) with a spatial resolution of 0.25° × 0.25°, including residential sources, transportation sources, agricultural sources, industrial sources, and power plant sources. The computational platform is the high-performance supercomputer subsystem cluster with 320 computation nodes, a total of 12 800 processors, and about 153 TB memory on the Big Data Cloud Service Infrastructure Platform (BDCSIP), which meets the demand of NAQPMS-PDAF v2.0 for high-performance parallel computing.
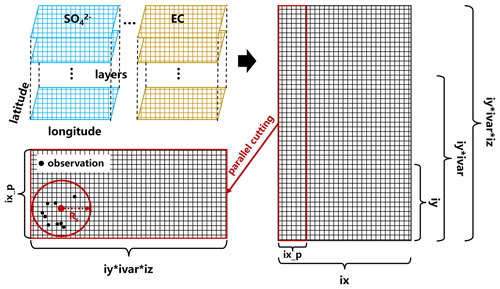
The model state variables include NH, SO, NO, OC, EC, Na+, brown carbon, soil PM2.5, soil PM10, sea salt, fine dust, coarse dust, SO2, NO2, and RH. As shown in Fig. 2, the model state has a 4D structure with a longitudinal dimension (ix, 300 grids), latitudinal dimension (iy, 249 grids), variable dimension (ivar, 15), and vertical dimension (iz, 40 layers), in that order. The 4D model state with 15 variables is converted to a 2D state matrix in PDAF; the number of grids in the horizontal-axis direction is ix, and the number of grids in the vertical-axis direction is . Notably, the 2D state matrix coordinate index contains 3D information for each variable to implement the horizontal and vertical domain localization separately because the horizontal and vertical resolutions are not uniform. This structure has two advantages. First, the parallel cutting of the horizontal axis enables the local domain to retain the full dimensional information (, where ix_p is the longitudinal dimension of the local domain). Second, the localization in the local domain permits the analysis to be executed only within a small domain (ix_p×iy) when the length of the horizontal localization radius (Rs) is smaller than iy, effectively reducing the influence of spurious correlations between different state variables. In this study, we set the horizontal and vertical domain localization radius to 200 km (40 grids) and one layer. Additionally, we further implement the observation localization to consider the influence of distance between the analysis grid and observational grid (see Sect. 2.3.4). To minimize computational complexity, the observation errors were assumed to be spatially isotropic, with 0.40, 1.00, 0.50, 3.00, and 0.50 µg m−3 for NH, SO, NO, OC, and EC, respectively.
2.3.3 Generation of ensemble members
In ensemble DA, ensemble members interpret the uncertainty in the model or system, characterized by BEC, which significantly impacts the DA performance (Dai et al., 2014). For CTMs, emission input directly influences the chemical calculation and substantially contributes to the uncertainty. Perturbing emission input can effectively represent the uncertainty in aerosol emissions and enhance the consistency of ensemble error spread, thereby improving aerosol DA (Huang et al., 2023). CTMs are nonlinear, and model state errors are non-Gaussian distributions. To obtain non-Gaussian error distributions, we followed the Kong et al. (2021) method to assume that the emission errors are spatially correlated by an isotropic correlation model with a decorrelation length of 150 km and to generate perturbation coefficient matrixes with the same Gaussian distribution as the emission species, which are subsequently transformed into non-Gaussian distribution matrixes through non-Gaussian process generation v1.2 (Cheynet, 2023).
The target PM2.5 chemical components are NH, SO, NO, OC, and EC. The perturbed emission species that can directly or indirectly affect the component concentration calculations include SO2, NOx, VOCs, NH3, CO, PM10, PM2.5, EC, and OC, with the corresponding uncertainties (δ) listed in Table 1. As shown in Eq. (1), the original emission input matrix (Ep) is multiplied by the corresponding perturbation coefficient matrix (θi) to generate the perturbed emission input matrix (Ei) for each emission species. The calculation of the perturbation coefficient matrix (θi) is followed by Eqs. (2)–(3). Firstly, N 2D pseudorandom perturbation fields (Pi) are created using Evensen's method (Evensen, 1994). The uncertainties (δ) in the emission species are incorporated into the 2D pseudorandom perturbation fields (Pi) to obtain the final perturbation coefficient matrixes (θi). Finally, the Gaussian distribution perturbation coefficient matrixes (θi) were transformed into non-Gaussian distribution coefficient matrixes with a given target skewness (set to 1) and kurtosis (set to 6) by non-Gaussian process generation v1.2, which employs the moment-based Hermite transformation model and a cubic transformation.
Notably, all matrix operations involved are Schur products. Here, Ei denotes the ith ensemble perturbed emission input matrix, Ep indicates the original unperturbed emission input matrix, and θi represents the ith ensemble perturbation coefficient matrix. is the ith ensemble original perturbation coefficient matrix, which is obtained by mathematical transformation of the ith ensemble pseudorandom perturbation matrix Pi, including standardization and scaling by uncertainty (δ), as well as a logarithm.
2.3.4 Hybrid nonlinear DA algorithm with adaptive forgetting factor
To thoroughly integrate the stability of EnKFs with the nonlinearity of nonlinear filters and be ideal for the nonlinear and non-Gaussian distribution situations, the hybrid LKNETF is used in this study. This section reviews the algorithms of LETKF, LNETF, and their combination (LKNETF).
ETKF, a deterministic filter in EnKFs, efficiently obtains analysis samples using a transformation matrix and the square root of the forecast error covariance (Bishop et al., 2001). In contrast to stochastic filters in EnKFs, ETKF prevents underestimation of the analysis error covariance resulting from the random observation perturbations. And it is particularly applicable in situations with small ensemble sizes (Lawson and Hansen, 2004). The realization of ETKF can be divided into the forecast and analysis steps.
In the forecast step, the forecast state vector () at t is generated by numerical model (M) integration of the analysis state vector () at t−1. The forecast error covariance matrix () can be calculated by the perturbation of the forecast ensemble ():
where is the forecast ensemble at t, and K is the number of ensemble members. is the perturbation of the forecast ensemble at t, calculated by , and the forecast ensemble mean at t.
In the analysis step, the forecast error covariance matrix () at t is transformed to the analysis error covariance matrix () at t by a transform matrix (T):
The transform matrix (T) is defined as follows and can be decomposed to a left singular vector matrix (U), a singular value matrix (S), and a right singular vector matrix (V) through the singular value decomposition:
where ρadaptive is an adaptive forgetting factor used for the inflation of error covariance estimation (the initial ρadaptive is set to 0.9 in this study). is the mean ensemble variance, is the mean of the observation-minus-forecast residual, and is the mean observation variance. I is the identity matrix. H is the observation operator. L is the localization matrix, a weight matrix calculated by the fifth-order polynomial (Nerger, 2015), implemented in LETKF for observation localization analysis to avoid observational spurious correlation and filter divergence effectively (Hunt et al., 2007). R is the observation error covariance matrix.
The analysis state vector () at t is calculated by the forecast state vector () at t, the perturbation of the forecast ensemble () at t, and a weight vector (w):
The weight vector (w) is given by the following equation:
where y is observations.
The analysis ensemble () at t can be obtained by the analysis ensemble mean () at t, the perturbation of the forecast ensemble () at t, and a transform matrix (C) represented by the symmetric square root of T:
The transform matrix (C) is calculated as follows:
NETF is a second-order exact ensemble square root filter effectively applied to the nonlinear and non-Gaussian DA (Tödter and Ahrens, 2015). Like PF, NETF indirectly updates the model state by using observations to affect the weights of the prior ensemble. However, PF and NETF differ in the sampling method. PF utilizes the Monte Carlo and Bayesian approaches to calculate particle weights based on observations, which are then used to generate the analysis ensemble by weighting the resampling forecast ensemble. In high-dimensional systems, as the DA progresses, the weight differences among particles increase, with most particles having weights close to 0, leading to filter degeneration. In contrast, NETF generates the analysis ensemble through a deterministic matrix square root transformation of the forecast ensemble, where the mean and covariance matrix of the analysis ensemble match the weighted values in PF (as shown in Eqs. 13–14). Due to the similarity between NETF and ETKF, the localization can be implemented in NETF (LNETF) (Tödter et al., 2016).
Here, is the analysis state vector mean, K is the number of ensemble members, is the ith analysis state vector, wi is the ith particle weight in PF (which is calculated by the Bayesian method ), y is the observations, and is the ith forecast state vector.
Here, Pa is the error covariance matrix of the analysis ensemble, calculated by the perturbation of the analysis ensemble.
In NETF, A acts as a transform matrix like the transform matrix (T) in ETKF, which can be obtained from the weight vector (w).
Here, the matrix W≡diag(w) is defined as a diagonal matrix created from the weight vector (w). A can be decomposed (A=VDVT) by a singular value decomposition as it is a real, symmetric, positive semidefinite matrix. V is the orthogonal matrix, and D is a diagonal matrix.
Then, the perturbation of the analysis ensemble () and the analysis ensemble (Xa) can be obtained by applying the square root of A as a transform matrix:
LKNETF combines LETKF and LNETF through a hybrid weight γ to perform better in systems with different nonlinearity degrees and to be implemented in situations with smaller ensemble sizes (Nerger, 2022). When γ approaches 1, the analysis increment (ΔXLETKF) computed by LETKF becomes more significant and appropriate for linear systems with Gaussian distributions. Conversely, when γ approaches 0, the analysis increment (ΔXLNETF) computed by LNETF becomes more significant and appropriate for nonlinear systems with non-Gaussian distributions. The one-step update scheme is used in this study.
2.4 Data
2.4.1 Observation
A total of 1 month's (February 2022) hourly mass concentration observations of five PM2.5 chemical components (NH, SO, NO, OC, and EC) from 33 ground-based sites in northern China and the surrounding areas were collected for this work (Fig. 3). Out of the 33 sites, 24 (DA sites) were utilized for DA and internal validation, and the remaining 9 (VE sites) were used for independent verification to assess the influence of DA sites on neighboring areas. These sites were divided using the K-means clustering algorithm (Lloyd, 1982; Arthur and Vassilvitskii, 2007). The Supplement provides a detailed description (Sect. S1). PM2.5 hourly observations from the China National Environmental Monitoring Centre (CNEMC; http://www.cnemc.cn/, last access: 1 November 2023) were employed to assess the overall mass concentration of PM2.5 chemical components in NAQPMS-PDAF v2.0. Due to incomplete spatial overlap between the PM2.5 sites and the chemical component sites, the PM2.5 sites were selected based on the closest Euclidean distance between PM2.5 sites and chemical component sites.
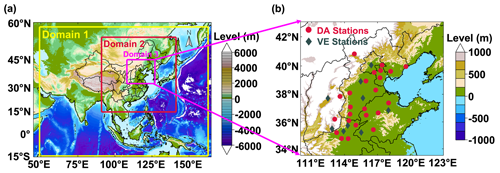
Figure 3The model domains in the WRF simulation (a) and the location of the observations (b). Domain 3 in (a) is the target area of this study. The 24 red sites in (b) represent the sites for data assimilation, and the 9 green sites in (b) represent the sites for independent spatial validation. The topographic dataset is from the ETOPO1 1 arcmin global relief model, taken from the National Geophysical Data Center (NOAA National Geophysical Data Center, 2009).
2.4.2 Global reanalysis dataset
The global reanalysis datasets of PM2.5 chemical components in February 2022 were obtained from the Copernicus Atmosphere Monitoring Service ReAnalysis (CAMSRA; 0.75° × 0.75°) (Inness et al., 2019) and the Modern-Era Retrospective analysis for Research and Applications, Version 2 (MERRA-2; 0.5° × 0.625°) (Randles et al., 2017) to compare with the reanalysis dataset generated by NAQPMS-PDAF v2.0. For the data consistency, the global reanalysis surface grid data located in the observation sites of the PM2.5 chemical component were extracted through the k-nearest-neighbor search method (Friedman et al., 1977), which can efficiently match grid points and observation sites based on latitude and longitude data and Euclidean distances. Our 3-hourly NAQPMS-PDAF v2.0 output of NO and NH was extracted to compare with the CAMSRA dataset, and hourly NAQPMS-PDAF v2.0 output of SO, OC, and EC was extracted to compare with the MERRA-2 M2T1NXAER dataset.
2.5 Experimental setting and evaluation method
In our study, four tests were conducted to evaluate the performance of NAQPMS-PDAF v2.0 with hourly observations of five PM2.5 chemical components, including (1) the dependence on ensemble size and assimilation frequency, (2) the ability to interpret mass concentration and spatiotemporal characteristics, (3) the quality of output data compared to other reanalysis datasets, and (4) the uncertainty in ensemble assimilation. In practice, the ratio of the ensemble size to the number of processes – 1:50 – in high-performance computers was the optimal parallel scheme to balance computing efficiency and computing resources (Wang et al., 2022).
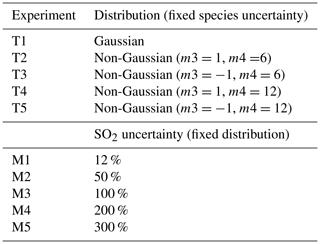
All the tests were run in NAQPMS-PDAF v2.0 after a spin-up experiment with 24 time steps from 00:00 to 23:00 (LST) on 1 February 2022. (1) For the first test, we assimilated the hourly observations of five PM2.5 chemical components from all sites with 48 time steps from 00:00 (LST) on 2 February to 23:00 (LST) on 3 February 2022. In the first scenario, we controlled a fixed assimilation frequency of 1 h and changed the ensemble size to 2, 5, 10, 15, 20, 30, 40, and 50. In the second scenario, we controlled a fixed ensemble size of 20 and changed the assimilation frequency to 1, 2, 3, 4, 5, 6, 8, and 12 h. (2) For the second test, we set an ensemble size of 20 and an assimilation frequency of 1 h and assimilated the hourly observations of five PM2.5 chemical components from DA sites with 648 time steps from 00:00 (LST) on 2 February to 23:00 (LST) on 28 February 2022. We also conducted a free-running (FR) experiment without assimilation in the same period for comparison. (3) For the third test, we followed the settings in the second test but assimilated the observation from all sites to generate a high-quality reanalysis dataset of five PM2.5 chemical components. (4) The final test was analogous to the first test but with a distinct scenario designed to examine the influence of ensemble perturbation on ensemble assimilation. From Table 2, we fixed species uncertainty (M4 setting) with five distribution types in the first scenario and fixed distribution type (T2 setting) with five SO2 uncertainties in the second.
We used the continuous ranked probability score (CRPS) to evaluate ensemble size dependency, which measures the consistency between the ensemble forecast distribution and corresponding observations (Jolliffe and Stephenson, 2012). The calculation rules are referred to in Hersbach's study (Hersbach, 2000). Moreover, four common statistical indicators, the Pearson correlation coefficient (CORR), root mean square error (RMSE), mean absolute error (MAE), and coefficient of determination (R2), were used to assess the DA system performance in interpreting PM2.5 chemical components (SO, NO, NH, OC, and EC). The CORR measures the correlation between the system outputs and corresponding observations, the RMSE and MAE indicate the overall system accuracy, and the R2 reflects the proportion of variability in the observations explained by the assimilation system.
3.1 The dependence on ensemble size and assimilation frequency for five components
Ensemble size is a crucial parameter in ensemble assimilation, determining the model state's uncertainty range. A larger ensemble size more accurately represents the error distribution of state variables but requires considerable computing resources and time, especially for high-dimensional systems. A smaller ensemble size can easily lead to underestimating the error covariance matrix, especially for the fine-resolution model (Kong et al., 2021). Thus, identifying an appropriate ensemble size to balance computational efficiency and accuracy is the primary step in ensemble DA. Our prior study (NAQPMS-PDAF v1.0) only evaluated the correlation between ensemble size and parallel efficiency and concluded that the ratio of ensemble size to high-performance computing processors was 1:50 (Wang et al., 2022), while the impact of ensemble size on the accuracy and computational efficiency was neglected. This study assesses the NAQPMS-PDAF v2.0 dependency on ensemble size through three statistical indicators (CRPS, RMSE, and CORR). Figure 4 shows the mean CRPS, RMSE, and CORR values and the statistical averages of the elapsed time over 48 time steps with the ensemble sizes of 2, 5, 10, 15, 20, 30, 40, and 50.
From Fig. 4a, when the ensemble size is at its minimum level of 2, the mean CRPS values of the five PM2.5 chemical components are more significant, with NO exhibiting the most considerable difference between the simulation distribution and observations (more than 4). With each increase in ensemble size, the mean CRPS values of the five chemical components progressively reduce and eventually reach convergence when the ensemble size is 10, implying that a hybrid nonlinear filter can maintain high accuracy and reliability in ensemble assimilation with an ensemble size that is smaller than the traditional minimum of 20 ensemble members, as observed in prior ensemble assimilation studies (Constantinescu et al., 2007; Miyazaki et al., 2012; Schwartz et al., 2014; Rubin et al., 2017; Kong et al., 2021; Tsikerdekis et al., 2021; Wang et al., 2022), including NAQPMS-PDAF v1.0. The mean CRPS value of EC is the lowest among the five chemical components, indicating the highest accuracy and reliability of EC ensemble DA. The performance of other components is similar. Like CRPS values, the values of RMSE and CORR decrease and increase, respectively, as the ensemble size increases, and convergence begins to occur when the ensemble size is 10 (Fig. 4b and c). Compared with other chemical components, the CORR value of SO is significantly lower, less than 0.8, possibly due to its estimated background field error covariance driven by the inadequate ensemble perturbations. Therefore, in the Discussion section, we discuss the uncertainties in ensemble perturbations.
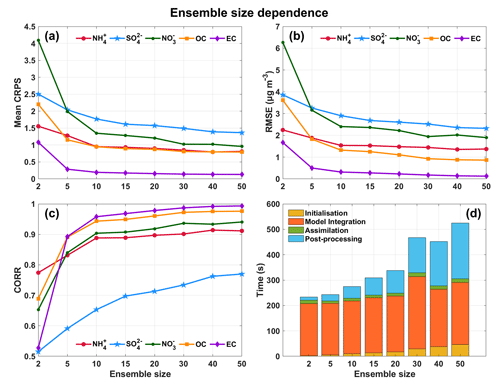
Figure 4Assessment of ensemble size dependency based on mean continuous ranked probability score (CRPS) (a), root mean square error (RMSE) (b), correlation coefficient (CORR) (c), and time (d).
Figure 4d shows the time required for the four processes of ensemble assimilation under different ensemble sizes, including initialization, model integration, assimilation, and post-processing. The model integration process in NAQPMS-PDAF v2.0 takes the longest, followed by post-processing, initialization, and assimilation. The required time for initialization and post-processing increases with increasing ensemble size, while for model integration and assimilation, except for ensemble size 30, the required time is the same under different ensemble sizes. Generally, the time needed for ensemble sizes of 30–50 is considerably higher than that for smaller ones. Although convergence occurs with an ensemble size of 10, our work illustrates a similar time required between ensemble sizes 10 and 20. Consequently, we selected an ensemble size of 20 to ensure optimal performance of NAQPMS-PDAF v2.0, considering both assimilation efficiency and accuracy.
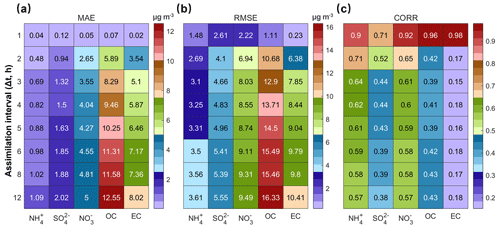
The assimilation frequency is the interval at which observational data are introduced into the DA system, directly affecting the practical assimilation data volume and computation cost. High-frequency DA with high-quality observations is crucial for improving numerical simulations and forecasts (Liu et al., 2021). Figure 5 demonstrates that the MAE values of the five chemical component analysis fields range from 0.02 to 0.12 µg m−3, RMSE values range from 0.23 to 2.61 µg m−3, and CORR values range from 0.71 to 0.98 at a 1 h assimilation time interval, which is significantly better than the statistical indicators at lower assimilation frequencies. Even at a 2 h assimilation frequency, the assimilation effect drops sharply compared to the 1 h interval, especially for NO, OC, and EC. The values of MAE and RMSE increase by 2.6–5.82 and 4.72–9.57 µg m−3, respectively, and the CORR values decrease by 0.27–0.81. Gradual increasing trends in MAE and RMSE values and a slight decreasing trend in CORR values are observed as the assimilation frequency decreases from the 2 h interval. Therefore, the fast-updating assimilation with a 1 h interval significantly improves the NAQPMS simulation. For the forecasting field (Fig. S2), the low sensitivity of state variables to assimilation frequency suggests that NAQPMS-PDAF v2.0 can appropriately reduce assimilation frequency during the actual forecasting phase, lowering the demand for high-temporal-resolution observations and computational resources.
3.2 Evaluation of NAQPMS-PDAF v2.0 performance
3.2.1 Overall validation of DA results
We conducted a control experiment (free-running (FR) field) without any DA and with a DA experiment. This section verifies the forecast (FOR) field and analysis (ANA) field at 24 DA sites and 9 VE sites, respectively. Figure 6 shows the scatter distribution of observations and simulations at DA sites. For the FR field (Fig. 6a1–a5), five chemical components have CORR values ranging from 0.32 to 0.56, and R2 values do not exceed 0.3, indicating poor consistency between observations and simulations. In detail, the simulated mass concentrations of SO, OC, and EC are significantly overestimated, while the simulated concentrations of NH and NO are underestimated. OC has the most significant error, with an RMSE value of 25.84 µg m−3 and an MAE value of 19.41 µg m−3. Moreover, the error distributions of SO, NO, and NH are close to a symmetric distribution with a mean value of 0, while the error distributions of OC and EC are skewed to the left from the mean value of 0 (Fig. 7a1–a5), showing the relatively better simulations in SO, NO, and NH than in OC and EC. Overall, NAQPMS cannot interpret the mass concentrations of the five chemical components with significant errors, mainly due to the uncertainties in chemical mechanisms (Miao et al., 2020).
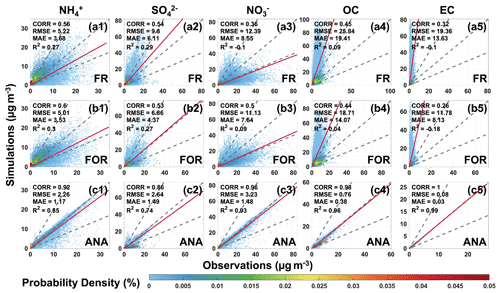
Figure 6Scatterplots of the DA site simulations versus the DA site observations with probability density for the free-running (FR) field (a1–a5), forecast (FOR) field (b1–b5), and analysis (ANA) field (c1–c5). The stippled gray lines represent the 2:1, 1:1, and 1:2 lines, and the solid red line represents the fitting regression line.
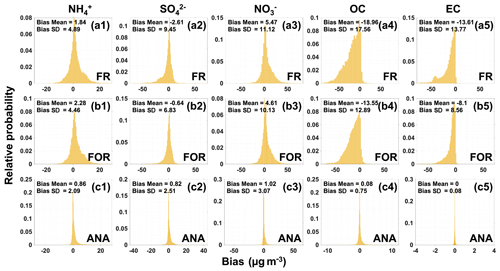
Figure 7Probability distributions of bias between DA site observations and DA site simulations for the free-running (FR) field (a1–a5), forecast (FOR) field (b1–b5), and analysis (ANA) field (c1–c5).
After DA, FOR shows a slight improvement with a slight increase in CORR and R2 and a decrease in RMSE and MAE, especially for NH and NO (Fig. 6b1–b5). Although SO, OC, and EC are significantly overestimated with a slight decrease in CORR and R2, the RMSE and MAE values decrease. Additionally, the error distributions of the five chemical components are concentrated at 0, and the overestimation of OC and EC has been improved compared to FR (Fig. 7b1–b5). These results indicate that DA reduces the overall FOR errors in NAQPMS due to improved forecasting ability by obtaining optimal initial fields. However, further improvements are necessary to address the NAQPMS uncertainties in emission sources, meteorological input, and imperfect physiochemical mechanisms. For ANA (Fig. 6c1–c5), DA significantly improves the simulations of the five chemical components, making the ANA consistent with the observations. The CORR values are not less than 0.86; the RMSE and MAE values do not exceed 3.23 and 1.49 µg m−3, respectively; and the R2 values are not less than 0.74. Specifically, the CORR values for NO, OC, and EC are not less than 0.96, and the R2 values are not less than 0.93. The error distributions of the five chemical components concentrate to 0, with the mean bias ranging from 0 ± 0.08 to 1.02 ± 3.07 µg m−3 (Fig. 7c1–c5). The results of VE sites show similar characteristics to the DA sites (Figs. S3 and S4). Compared to FR, the overall errors of the FOR and ANA for the five chemical components decrease with a significant improvement in ANA, showing that the CORR values of NH and NO increase by 0.15 and 0.45, respectively; the R2 values of NH and NO increase by 0.22 and 0.81, respectively; and the RMSE values of OC and EC decrease by 21.77 and 17.79 µg m−3, respectively. Overall, the FOR and ANA errors decreased significantly. The ANA of the five chemical components at DA sites is almost entirely consistent with the observations, indicating excellent DA performance.
3.2.2 Assessment of temporal variation in chemical components
The ensemble DA employs a cyclic updating process wherein the forecast and analysis steps are continuously completed at each iteration (Evensen, 2003; Houtekamer and Zhang, 2016). In the forecast step, the ANA at the current time step serves as the optimal initial field to advance the model integration and obtain the FOR at the next step. In the analysis step, the FOR at the next time step provides background field information for the subsequent DA analysis to generate the ANA at the next time step. The FOR and ANA interact with each other in the temporal dimension. Therefore, in this section, we assess the ability of NAQPMS-PDAF v2.0 to interpret the temporal variations in the five chemical components. Figure 8 illustrates the time series of the five chemical components at two representative sites, including a DA site in Tianjin and a VE site in Heze. For the DA site (Fig. 8a), the temporal variations in NH and NO in FR and FOR exhibit better agreement with the observed temporal variations (OBS) than those of SO, OC, and EC. However, NH and NO mass concentrations are significantly lower than the high-value mass concentrations observed on 25 February. The mass concentration of SO in FR is greatly overestimated during the periods of 9–11, 18–19, and 24–25 February. The mass concentrations of OC and EC in FR are overestimated throughout February with substantial temporal fluctuations. Although the time series of SO, OC, and EC in FOR show some improvement, noticeable differences from the OBS are still apparent. After DA, the ANA time series for the five chemical components align well with the OBS, indicating good consistency and accurate representation of temporal characteristics, such as the NH4NO3 pollution captured on 25 February. Notably, the mass concentrations of SO, NO, and NH peaked on 10–11 and 26 February, indicating intensified atmospheric secondary chemical reactions, primarily due to neutralization reactions of acidic pollutants capturing NH3. The temporal variations in NH and NO are more similar because atmospheric NO mainly exists as NH4NO3 rather than other metal nitrates, and NH4NO3 can form before the complete neutralization of H2SO4 (Ge et al., 2017). The improvements at the VE site (Fig. 8b) are like those at the DA site, with the ANA time series of the five chemical components showing closer agreement with the OBS, which suggests that the localization analysis in DA effectively facilitates the propagation of observations within a specific spatial range and mitigates the assimilation anomalies caused by spurious correlations from the distant sites (Hunt et al., 2007).
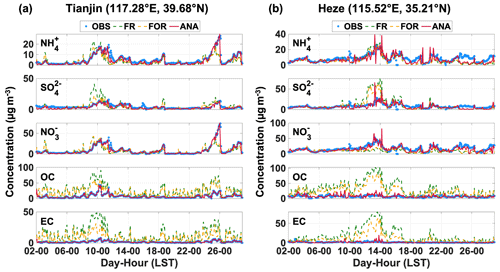
Figure 8Hourly variation in five PM2.5 chemical components in a representative DA site (a) and a representative VE site (b).
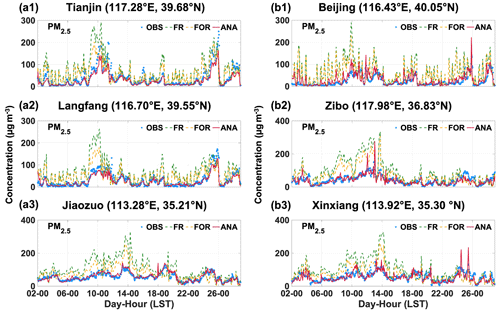
NH, SO, NO, OC, and EC are critical chemical components of PM2.5, and the sum of their mass concentrations can be approximated as the PM2.5 mass concentration. We further assessed the simulation enhancement of PM2.5 time series based on ground-level PM2.5 observations. Six representative sites were selected, including three DA sites (Fig. 9a1–a3) and three VE sites (Fig. 9b1–b3). The FR and FOR in DA and VE sites show significant overestimation and poor consistency with the OBS, mainly due to the overestimation of OC and EC mass concentrations. Conversely, the PM2.5 time series in ANA closely matches that of the OBS, accurately capturing the actual variation in PM2.5. In some specific instances, such as on 26 February at 00:00 in Tianjin and Langfang, the peak value of ANA was lower than that of the OBS, which could be attributed to the negligence of other PM2.5 components (such as mineral dust and sea salt) and the inconsistency in location between ground-level PM2.5 observational sites and chemical component observational sites. Overall, the DA of chemical component observations significantly enhanced the simulation of PM2.5 time series in NAQPMS. Compared to the CORR values of FR and FOR, the CORR values of ANA at the six representative sites increased by 13.64 %–89.58 % and 17.19 %–75.00 %, while the RMSE values decreased by 56.03 %–83.13 % and 40.74 %–72.20 % (Table S3).
3.2.3 Assessment of spatial distribution in chemical components
DA can improve the interpretation of model states in the analysis domain by using a limited number of observations. The ability to represent spatial distribution accurately is a crucial function for aerosol DA. Figure 10 displays the spatial distribution of the monthly average mass concentrations for the five chemical components, including OBS, FR, FOR, ANA, and analysis increment (INC). The spatial distributions of bias and statistical indicators for FR, FOR, and ANA are shown in Figs. 11 and 12, respectively.
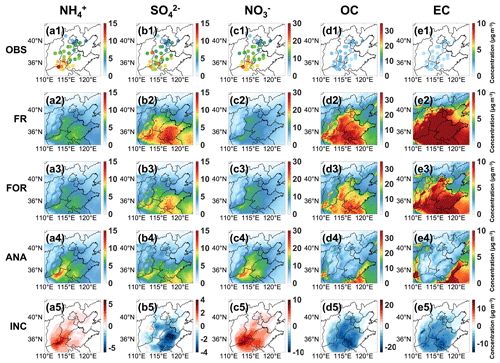
Figure 10Spatial concentration distribution of the site observation (OBS) (a1–e1), free-running (FR) field (a2–e2), forecast (FOR) field (a3–e3), analysis (ANA) field (a4–e4), and increment (INC) between ANA and FR (a5–e5) for five PM2.5 chemical components.
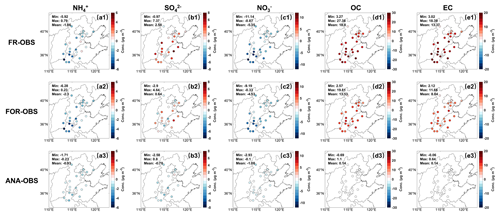
Figure 11Spatial distribution of DA site bias for five PM2.5 chemical components from the observation (OBS) for the free-running (FR) field (a1–e1), forecast (FOR) field (a2–e2), and analysis (ANA) field (a3–e3).
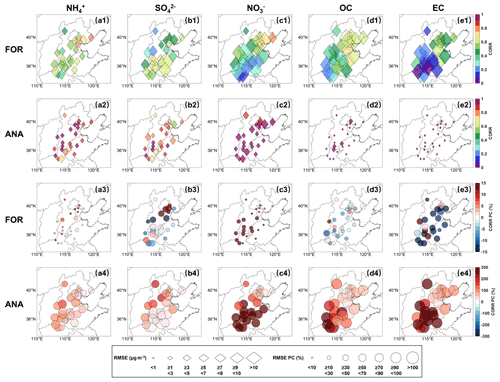
Figure 12Spatial distribution of DA site statistical indicators for five PM2.5 chemical components. Panels (a1)–(e1) represent the values of RMSE and CORR for the forecast (FOR) field, (a2)–(e2) are the same as (a1)–(e1) but for the analysis (ANA) field, (a3)–(e3) represent the improvement in RMSE and CORR for the forecast (FOR) field, and (a4)–(e4) are the same as (a3)–(e3) but for the analysis (ANA) field. The size represents the value of RMSE in (a1)–(e2) and the improvement percentage compared to non-assimilation in (a3)–(e4).
The spatial characteristics of NH and NO are similar. Compared to the OBS (Fig. 10a1 and c1), the FR (Fig. 10a2 and c2) and FOR (Fig. 10a3 and c3) have failed to capture the high-value mass concentrations in the border area between Hebei Province, Shanxi Province, Henan Province, and Shandong Province, especially in the northern region of Henan Province. The primary reason is the uncertainties in emission inventories in winter heating periods, which result in insufficient emission statistics of gaseous precursors NOx and NH3 (Aleksankina et al., 2018). After DA, this situation is significantly improved with the ANA (Fig. 10a4 and c4). The INCs in the Beijing–Tianjin–Hebei region, Shanxi Province, Henan Province, and Shandong Province are positive (Fig. 10a5 and c5), indicating varying degrees of improvement in correcting the underestimation of mass concentrations. Specifically, for NH and NO at DA sites, the biases between the OBS and ANA are significantly reduced compared to the biases between the OBS and FR (Fig. 11), with the mean absolute bias decreasing by 0.93 and 4.27 µg m−3, respectively. Moreover, the overall biases at VE sites also decrease (Fig. S5). As for the spatial statistical indicators of NH (Fig. 12a1 and a2), the CORR values in FOR and ANA range from 0.39 to 0.79 and 0.70 to 0.97, respectively, and the RMSE values range from 3.16 to 7.65 µg m−3 and 1.20 to 3.49 µg m−3, respectively. As for the spatial statistical indicators of NO (Fig. 12c1 and c2), the CORR values in FOR and ANA range from 0.09 to 0.76 and 0.89 to 0.99, respectively, and the RMSE values range from 4.88 to 15.69 µg m−3 and 1.34 to 5.39 µg m−3, respectively. For the FOR, the improvement in accuracy for NO is more significant than that for NH, with the CORR values of most DA sites increasing by more than 10 % and the RMSE of most DA sites decreasing by no less than 10 % (Fig. 12a3 and c3). For the ANA, NH and NO exhibit significant improvements in CORR and RMSE, as most DA sites show over 150 % improvement in CORR and over 50 % improvement in RMSE (Fig. 12a4 and c4). Improvements can also be found in NH and NO at VE sites (Fig. S6). The spatial consistency of NH and NO indicates that NH4NO3 is the primary aerosol chemical component, highlighting the necessity of coordinated control of precursor NOx and NH3.
Unlike NH and NO, compared to the OBS (Fig. 10b1), the mass concentrations of SO in the FR and FOR (Fig. 10b2 and b3) are significantly overestimated, especially in Shandong Province. In contrast, the ANA has improved dramatically (Fig. 10b4), with most areas showing negative INCs (Fig. 10b5). The mean absolute biases in DA and VE sites have decreased by 1.80 and 2.68 µg m−3, respectively (Figs. 11 and S5). Specifically, after DA, the CORR values of the FOR and ANA range from 0.22 to 0.71 and 0.58 to 0.97, and the RMSE values range from 3.42 to 11.07 µg m−3 and 1.20 to 4.30 µg m−3, respectively (Fig. 12b1 and b2). The CORR and RMSE values in FOR improved significantly (Fig. 12b3) at DA sites around Beijing, while the CORR values in ANA increased by more than 13 %, with most DA sites showing an increase of over 50 %, and RMSE values decreased by no less than 30 %, with most DA sites showing a decrease of over 70 % (Fig. 12b4). Moreover, half of the VE sites show significant improvement in the CORR and RMSE in the FOR and ANA, mainly due to their proximity to more DA sites (Fig. S6). The OBS and ANA indicate a considerable control in SO pollution during the winter heating period due to the emission reduction in gaseous precursors (Zhai et al., 2019; Yan et al., 2021).
The spatial distributions of OC and EC exhibit similarities (Fig. 10d1 and e1), consistent with the finding of a strong correlation between OC and EC in winter (Cao et al., 2007). The low temperature and weakened photochemical reactions in winter reduced secondary OC (SOC) generation, and primary OC (POC) and EC mainly originate from direct anthropogenic emissions, such as combustion (Guo, 2016). Compared to the OBS, the mass concentrations in FR (Fig. 10d2–d3) and FOR (Fig. 10e2–e3) are significantly overestimated over a wide range. Similar overestimations have also been reported in the global reanalysis datasets CAMS and MERRA-2, likely attributed to the hygroscopic growth scheme of carbonaceous aerosols in the models, poorly constrained semi-volatile species escaping from primary organic aerosols (Soni et al., 2021), and aging mechanisms in the models (Huang et al., 2013). After DA, the spatial distribution of the ANA aligns entirely with that of the OBS (Fig. 10d4 and e4), with improvements in all overestimations (Fig. 10d5 and e5), and the average biases of both OC and EC at DA sites significantly decrease to 0.14 µg m−3 (Fig. 11d3 and e3). The VE sites show similar results to the DA sites, with average biases of less than 2 µg m−3 (Fig. S5d3 and e3). Specifically, for OC (Fig. 12d1 and d2), the CORR values in FOR and ANA are 0.18–0.71 and 0.92–1.00, respectively, with RMSE values of 7.91–26.27 µg m−3 and 0.16–1.45 µg m−3, respectively. For EC (Fig. 12e1 and e2), the CORR values in FOR and ANA are 0.01–0.66 and 0.97–1.00, respectively, with RMSE values of 5.33–16.91 µg m−3 and 0.01–0.26 µg m−3, respectively. Although significant improvements are not observed in FOR at some specific DA sites, the RMSE values at all DA sites decrease by 10 %–50 % (Fig. 12d3 and e3). The CORR values of OC and EC in ANA increase by more than 30 %, with most DA sites exceeding 200 %, and the RMSE values decrease by more than 90 % (Fig. 12d4 and e4). At VE sites (Fig. S6), significant improvements in the CORR are not observed, but the RMSE values in the FOR and ANA decrease, which indicates that DA has limited benefits for whole areas but can effectively reduce biases of entire regions.
3.3 Comparison to NAQPMS-PDAF v1.0 and global reanalysis dataset
To comprehensively evaluate the competitiveness and superiority of NAQPMS-PDAF v2.0 in generating the reanalysis datasets of the PM2.5 chemical compositions, we assimilated the mass concentrations of the five PM2.5 chemical components from all sites (sum of DA sites and VE sites) in February 2022 to generate a reanalysis dataset. We compared our reanalysis dataset with the global reanalysis (RA) datasets (CAMSRA and MERRA-2) and NAQPMS-PDAF v1.0 output. Figure 13 illustrates the spatial distribution of the monthly average mass concentrations for the five chemical components. Compared to the OBS (Fig. 13a1 and c1), CAMSRA underestimates the NH and NO concentrations and fails to capture the high-value concentration in the northern part of Henan Province (Fig. 13a2 and c2). In contrast, MERRA-2 overestimates the concentrations of SO, OC, and EC (Fig. 13b2, d2, and e2), particularly SO, exhibiting a large region with inaccurately high concentrations. Moreover, CAMSRA (approximately 80×80 km2) and MERRA-2 (55×70 km2) have significantly lower spatial resolutions compared to NAQPMS-PDAF v2.0 (5×5 km2). Therefore, NAQPMS-PDAF v2.0 provides a more detailed description of the pollution characteristics of chemical components in northern China and the surrounding areas compared to RA.
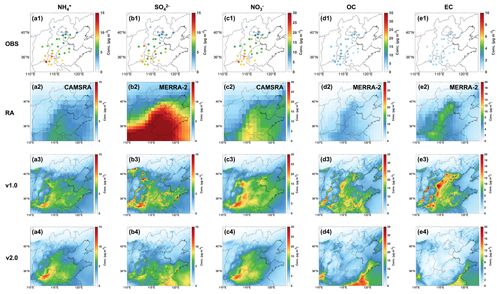
Figure 13Spatial distribution of the monthly averaged concentration of five PM2.5 chemical components for observations (OBS; a1–e1), global reanalysis (RA) data (a2–e2), NAQPMS-PDAF v1.0 analysis data (a3–e3), and NAQPMS-PDAF v2.0 analysis data (a4–e4).
Although NAQPMS-PDAF v1.0 demonstrates a superior spatial representation of the five chemical components when compared to RA, it fails to capture the high-value concentrations of NH in the northwest of Henan Province and correct the high-value concentrations of NH in the central and western areas of Hebei Province (Fig. 13a3). Moreover, the scattered high-value concentrations of SO in the North China Plain do not align with the spatial characteristics of the OBS (Fig. 13b3). Notably, NAQPMS-PDAF v1.0 exhibits poor performance in interpreting OC and EC, with significant overestimations in a wide range (Fig. 13d3 and e3), which indicates that NAQPMS-PDAF v1.0 is weaker than NAQPMS-PDAF v2.0 in terms of DA performance on chemical components, primarily due to insufficient propagation of observations. In NAQPMS-PDAF v2.0, the LKNETF algorithm with an adaptive forgetting factor is more suitable for the nonlinear and non-Gaussian situations compared to EnKFs in NAQPMS-PDAF v1.0, and the ensemble perturbation with a non-Gaussian distribution can better represent the reasonable error distribution of model states.
Table 3 presents a quantitative comparison of three reanalysis datasets. Compared to the CORR of NAQPMS-PDAF v2.0 (0.86–0.99), the CORR of RA for the five chemical components is significantly lower (0.42–0.55). Moreover, NAQPMS-PDAF v1.0 exhibits significantly poorer consistency in SO, OC, and EC, with CORR values ranging from 0.35 to 0.57. NAQPMS-PDAF v2.0 has lower overall RMSE values (0.14–3.18 µg m−3) compared to RA and NAQPMS-PDAF v1.0, with RMSE values ranging from 4.51 to 12.27 µg m−3 and 2.46 to 15.50 µg m−3, respectively. The characteristics of R2 are similar to those of CORR and RMSE. For NH and NO, NAQPMS-PDAF v2.0 (0.85 and 0.93) and v1.0 (0.80 and 0.96) are much higher than RA (0.09 and 0.13). Notably, for SO, OC, and EC, NAQPMS-PDAF v2.0 (0.74–0.98) is significantly higher than v1.0 (−0.16–0.25) and RA (−0.15–0.25). Overall, NAQPMS-PDAF v2.0 more accurately and consistently interprets the five chemical components, particularly for NH, SO, OC, and EC. The reasons are summarized as follows. (1) The DA frequency of CAMSRA is 12 h, which is lower than the hourly DA frequency in NAQPMS-PDAF v2.0. (2) CAMSRA only assimilates satellite retrievals (Inness et al., 2019), and MERRA-2 only assimilates aerosol optical depth (AOD) from both ground-based and space-based remote sensing platforms (Randles et al., 2017). The aerosol optical information analysis increment cannot be allocated to each chemical component accurately and reasonably due to the lack of a deterministic relationship between aerosol optical information and PM2.5 chemical components. (3) NAQPMS-PDAF v1.0 has evident DA shortcomings for chemical components due to the limited DA algorithm under the assumption of a linear model or system, inappropriate ensemble perturbation under the assumption of Gaussian distribution, and inadequate observational modules. (4) The state variable structure in NAQPMS-PDAF v1.0 cannot effectively mitigate the impact of spurious correlations between chemical component variables, even when using analytical localization.
3.4 The uncertainty in NAQPMS-PDAF v2.0
In ensemble DA, the ensemble members represent possible values of the model states, and the ensemble sampling can determine the uncertainties in the model states. Therefore, the ensemble generation directly affects the propagation of observations and subsequently impacts the final DA performance. Previous studies have generated ensemble members based on the uncertainties in emission species and the Gaussian distribution assumption to satisfy the requirements of EnKF algorithms (Kong et al., 2021; Wang et al., 2022). However, the true error probability distribution of emission species is not an ideal Gaussian distribution, and the assumption will introduce errors. In this study, we coupled the hybrid nonlinear DA algorithm (LKNETF) with NAQPMS to handle the nonlinear and non-Gaussian situations, which combines the stability of LETKF with the nonlinearity of LNETF. Therefore, we evaluate the performance of ensemble members with different uncertainties and error probability distributions in NAQPMS-PDAF v2.0 through two groups of sensitivity experiments.
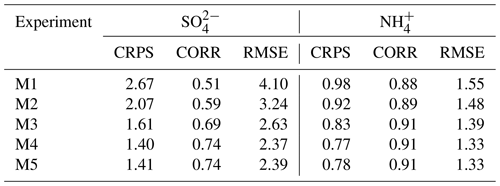
The first group of experiments (T1–T5) involves controlling the SO2 uncertainty as a fixed value of 200 % and transforming the distribution of the perturbation coefficient matrix. The second group of experiments (M1–M5) focuses on assessing the influence of SO2 uncertainty on NH and SO DA based on a fixed non-Gaussian distribution (m3=1, m4=6). Figure 14 shows the statistical indicators of the five chemical components under different error probability distributions, including a Gaussian distribution (T1) and four non-Gaussian distributions (T2–T5). The mean CRPS and RMSE in T2 and T4 are lower than those in T1, T3, and T5, and the CORR values in T2 and T4 are higher than those in T1, T3, and T5, indicating that the DA performance of the non-Gaussian distribution assumption is superior to that of the Gaussian distribution assumption. Moreover, positively skewed non-Gaussian distribution performs better than negatively skewed distribution. Except for SO, the performance in T2 outweighs that in T4 for other chemical components, implying that higher kurtosis harms the chemical component DA.
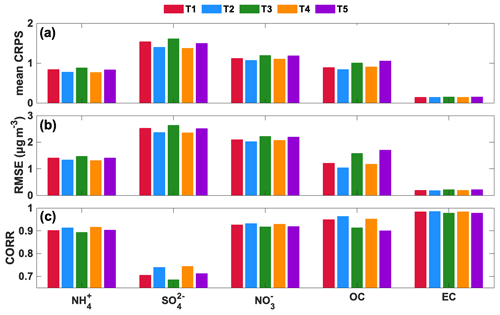
Figure 14Statistical indicators (mean CRPS a, RMSE b, and CORR c) of five PM2.5 chemical components for five perturbation experiments based on distribution.
SO2 is a crucial precursor of NH and SO, and perturbing SO2 affects the forecast and simulation of NH and SO. Table 4 presents statistical indicators of NH and SO analysis fields based on ensemble perturbations with different SO2 uncertainties (12 %–300 %). Increasing the uncertainty in SO2 from 12 % to 200 % leads to a decrease in the mean CRPS in the SO analysis field from 2.67 to 1.40, an increase in the CORR from 0.51 to 0.74, and a reduction in the RMSE from 4.10 to 2.37 µg m−3. Similarly, the mean CRPS in the NH analysis field decreases from 0.98 to 0.77, the CORR increases from 0.88 to 0.91, and the RMSE decreases from 1.55 to 1.33 µg m−3. This indicates that increasing the uncertainty in SO2 improves the DA performance on NH and SO because the higher SO2 uncertainty makes SO2 sufficiently perturbed, and the estimated error probability distribution is closer to the real distribution, resulting in a sufficient spread of observations. However, when the uncertainty in SO2 reaches 300 %, the statistical indicators do not significantly improve and even worsen because excessively high SO2 uncertainty causes the estimated error probability distribution to deviate from the true distribution. Thus, selecting appropriate uncertainties for emission species is crucial in aerosol chemical component DA.
To summarize, the non-Gaussian distribution assumption outperforms the Gaussian distribution assumption in NAQPMS-PDAF v2.0. Positive skewness performs better than negative skewness, and excessively high kurtosis should be avoided. Additionally, appropriately increasing the uncertainty in SO2 enhances the DA performance on NH and SO. Future studies should conduct more sensitivity experiments on emission species perturbation to determine suitable schemes for different aerosol chemical components.
In this paper, we online coupled NAQPMS with PDAF-OMI to develop a novel hybrid nonlinear DA system (NAQPMS-PDAF v2.0) with level-2 parallelization based on a hybrid localized Kalman–nonlinear ensemble transform filter (LKNETF) for the first time. Compared to NAQPMS-PDAF v1.0, NAQPMS-PDAF v2.0 with OMI can be applied with multiple component types and nonlinear/non-Gaussian situations in chemical analysis to effectively interpret five PM2.5 chemical components (NH, SO, NO, OC, and EC), which has not been achieved in previous studies. The background error covariance was calculated by ensemble perturbation based on adaptive uncertainties and a non-Gaussian distribution assumption of emission species. The DA experiments were conducted based on 33 observational sites in northern China and the surrounding areas.
NAQPMS-PDAF v2.0 with LKNETF can maintain high accuracy and reliability in ensemble DA with an ensemble size of 10, which is smaller than the traditional minimum of 20 ensemble members, as observed in prior ensemble assimilation studies. The free-running (FR) fields without DA have a poor consistency with the observations, with the CORR values ranging from 0.32–0.56 and the R2 values being less than 0.3, showing that SO, OC, and EC are significantly overestimated, while NH and NO are underestimated. A significant improvement was observed in the analysis (ANA) fields at the DA sites. The CORR values are not less than 0.86; the RMSE and MAE values do not exceed 3.23 and 1.49 µg m−3, respectively; and R2 is not less than 0.74. Specifically, the CORR values for NO, OC, and EC are not less than 0.96, and R2 is not less than 0.93. The error distributions of the five chemical components concentrate to 0, with the mean bias ranging from 0 ± 0.08 to 1.02 ± 3.07 µg m−3. These improvements are also found in the ANA fields at VE sites, indicating an excellent DA performance of NAQPMS-PDAF v2.0.
The ability of NAQPMS-PDAF v2.0 to interpret the spatiotemporal characteristics of the five chemical components was examined. For temporal variations, compared to the FR and forecast (FOR) fields, the ANA closely aligned with the observations (OBS) and accurately captured the peak concentrations of SO, NO, and NH in specific periods (such as 25 February), indicating good consistency and accurate characterization. Specifically, the CORR of the ANA at the six representative sites increased by 13.64 %–89.58 % and 17.19 %–75.00 %, while the RMSE decreased by 56.03 %–83.13 % and 40.74 %–72.20 %. For spatial distributions, after DA, both NH and NO with positive analysis increments exhibited significant improvements in CORR and RMSE, as most DA sites showed improvements of over 150 % in CORR and over 50 % in RMSE. SO, OC, and EC with negative analysis increments were also improved. For OC and EC in particular, the improvements in CORR and RMSE at most DA sites were over 200 % and over 90 %, respectively. The improvements at VE sites were also identified. Consequently, DA successfully aligned the spatiotemporal characteristics of the ANA with OBS and significantly reduced the biases of five chemical components.
Compared to the global reanalysis datasets (CORR: 0.42–0.55, RMSE: 4.51–12.27 µg m−3) and NAQPMS-PDAF v1.0 (CORR: 0.35–0.98, RMSE: 2.46–15.50 µg m−3), NAQPMS-PDAF v2.0 (CORR: 0.86–0.99, RMSE: 0.14–3.18 µg m−3) has significant superiority in generating the reanalysis datasets of the PM2.5 chemical compositions with high spatiotemporal resolution. Moreover, NAQPMS-PDAF v1.0 cannot capture the high-value concentrations and exhibits poor performance when interpreting SO, OC, and EC with CORR values ranging from 0.35 to 0.57. In contrast, NAQPMS-PDAF v2.0 interprets the five chemical components more accurately and consistently.
Finally, the uncertainties in NAQPMS-PDAF v2.0 are examined by identifying the influence of ensemble generation on ensemble DA performance. The non-Gaussian distribution assumption outperforms the Gaussian distribution assumption in NAQPMS-PDAF v2.0. Positive skewness performs better than negative skewness, and excessively high kurtosis should be avoided. Additionally, appropriately increasing the uncertainty in SO2 enhances the DA performance on NH and SO. Future studies should conduct more sensitivity experiments on emission species perturbation to determine the schemes that are suitable for different aerosol chemical components.
The novel hybrid nonlinear DA system (NAQPMS-PDAF v2.0) can be effectively applied in the interpretation of chemical components and outperforms the reanalysis datasets in generating the five PM2.5 chemical components with high accuracy and high consistency, thus providing a sufficient channel to investigate spatiotemporal characteristics, identify regional transport, and prevent and control aerosol composition pollution. In future work, we plan to research the vertical DA of chemical components, introduce more vertical information from more observational platforms, and verify the simultaneous DA performance of surface and vertical mass concentrations.
The source codes and related data in our work are openly accessible at https://doi.org/10.5281/zenodo.10886914 (Li et al., 2024).
The supplement related to this article is available online at: https://doi.org/10.5194/gmd-17-8495-2024-supplement.
HL developed the data assimilation system, performed numerical experiments, carried out the analysis, and wrote the original manuscript. TY provided scientific guidance, designed the paper structure, and wrote this paper. LN developed PDAF and provided help with the model code. DaZ, DiZ, and GT provided PM2.5 chemical component data. HW provided help with the model code. YS, PF, HS, and ZW did overall supervision. All authors reviewed and revised this paper.
The contact author has declared that none of the authors has any competing interests.
Publisher's note: Copernicus Publications remains neutral with regard to jurisdictional claims made in the text, published maps, institutional affiliations, or any other geographical representation in this paper. While Copernicus Publications makes every effort to include appropriate place names, the final responsibility lies with the authors.
This work was supported by the National Key Research and Development Program for Young Scientists of China (no. 2022YFC3704000). We thank the National Natural Science Foundation of China (no. 42275122), the National Key Scientific and Technological Infrastructure's Earth System Science Numerical Simulator Facility (EarthLab) project, and the Big Data Cloud Service Infrastructure Platform (BDCSIP) for providing data storage and computing resources. Ting Yang would like to express gratitude towards the program of the Youth Innovation Promotion Association (CAS).
This research has been supported by the National Key Research and Development Program of China (grant no. 2022YFC3704000).
This paper was edited by Lele Shu and reviewed by three anonymous referees.
Aleksankina, K., Heal, M. R., Dore, A. J., Van Oijen, M., and Reis, S.: Global sensitivity and uncertainty analysis of an atmospheric chemistry transport model: the FRAME model (version 9.15.0) as a case study, Geosci. Model Dev., 11, 1653–1664, https://doi.org/10.5194/gmd-11-1653-2018, 2018.
Ali, A., Amin, S. E., Ramadan, H. H., and Tolba, M. F.: Enhancement of OMI aerosol optical depth data assimilation using artificial neural network, Neural Comput. Appl., 23, 2267–2279, https://doi.org/10.1007/s00521-012-1178-9, 2013.
Alves, C., Evtyugina, M., Vicente, E., Vicente, A., Rienda, I. C., de la Campa, A. S., Tomé, M., and Duarte, I.: PM2.5 chemical composition and health risks by inhalation near a chemical complex, J. Environ. Sci., 124, 860–874, https://doi.org/10.1016/j.jes.2022.02.013, 2023.
Arthur, D. and Vassilvitskii, S.: K-means: the advantages of careful seeding, Proceedings of the eighteenth annual ACM-SIAM symposium on Discrete algorithms, 1027–1035, https://dl.acm.org/doi/10.5555/1283383.1283494 (last access: 22 August 2023), 2007
Bao, Y., Zhu, L., Guan, Q., Guan, Y., Lu, Q., Petropoulos, G. P., Che, H., Ali, G., Dong, Y., Tang, Z., Gu, Y., Tang, W., and Hou, Y.: Assessing the impact of Chinese FY-3/MERSI AOD data assimilation on air quality forecasts: Sand dust events in northeast China, Atmos. Environ., 205, 78–89, https://doi.org/10.1016/j.atmosenv.2019.02.026, 2019.
Bell, M. L., Dominici, F., Ebisu, K., Zeger, S. L., and Samet, J. M.: Spatial and temporal variation in PM2.5 chemical composition in the United States for health effects studies, Environ. Health Perspect., 115, 989–995, https://doi.org/10.1289/ehp.9621, 2007.
Bishop, C. H., Etherton, B. J., and Majumdar, S. J.: Adaptive Sampling with the Ensemble Transform Kalman Filter. Part I: Theoretical Aspects, Mon. Weather Rev., 129, 420–436, https://doi.org/10.1175/1520-0493(2001)129<0420:ASWTET>2.0.CO;2, 2001.
Cao, J. J., Lee, S. C., Chow, J. C., Watson, J. G., Ho, K. F., Zhang, R. J., Jin, Z. D., Shen, Z. X., Chen, G. C., Kang, Y. M., Zou, S. C., Zhang, L. Z., Qi, S. H., Dai, M. H., Cheng, Y., and Hu, K.: Spatial and seasonal distributions of carbonaceous aerosols over China, J. Geophys. Res.-Atmos., 112, D22S11, https://doi.org/10.1029/2006jd008205, 2007.
Chai, T., Kim, H. C., Pan, L., Lee, P., and Tong, D.: Impact of moderate resolution imaging spectroradiometer aerosol optical depth and airnow PM2.5 assimilation on community multi-scale air quality aerosol predictions over the contiguous United States, J. Geophys. Res., 122, 5399–5415, https://doi.org/10.1002/2016JD026295, 2017.
Chang, W., Liao, H., Xin, J., Li, Z., Li, D., and Zhang, X.: Uncertainties in anthropogenic aerosol concentrations and direct radiative forcing induced by emission inventories in eastern China, Atmos. Res., 166, 129–140, https://doi.org/10.1016/j.atmosres.2015.06.021, 2015.
Chang, W., Zhang, Y., Li, Z., Chen, J., and Li, K.: Improving the sectional Model for Simulating Aerosol Interactions and Chemistry (MOSAIC) aerosols of the Weather Research and Forecasting-Chemistry (WRF-Chem) model with the revised Gridpoint Statistical Interpolation system and multi-wavelength aerosol optical measurements: the dust aerosol observation campaign at Kashi, near the Taklimakan Desert, northwestern China, Atmos. Chem. Phys., 21, 4403–4430, https://doi.org/10.5194/acp-21-4403-2021, 2021.
Cheng, Y., Dai, T., Goto, D., Schutgens, N. A. J., Shi, G., and Nakajima, T.: Investigating the assimilation of CALIPSO global aerosol vertical observations using a four-dimensional ensemble Kalman filter, Atmos. Chem. Phys., 19, 13445–13467, https://doi.org/10.5194/acp-19-13445-2019, 2019.
Cheynet, E.: Non-Gaussian process generation, GitHub [code], https://github.com/ECheynet/Gaussian_to_nonGaussian, last access: 30 June 2023.
Constantinescu, E. M., Sandu, A., Chai, T., and Carmichael, G. R.: Assessment of ensemble-based chemical data assimilation in an idealized setting, Atmos. Environ., 41, 18–36, https://doi.org/10.1016/j.atmosenv.2006.08.006, 2007.
Dai, T., Schutgens, N. A. J., Goto, D., Shi, G., and Nakajima, T.: Improvement of aerosol optical properties modeling over Eastern Asia with MODIS AOD assimilation in a global non-hydrostatic icosahedral aerosol transport model, Environ. Pollut., 195, 319–329, https://doi.org/10.1016/j.envpol.2014.06.021, 2014.
Du, W., Dada, L., Zhao, J., Chen, X., Daellenbach, K. R., Xie, C., Wang, W., He, Y., Cai, J., Yao, L., Zhang, Y., Wang, Q., Xu, W., Wang, Y., Tang, G., Cheng, X., Kokkonen, T. V., Zhou, W., Yan, C., Chu, B., Zha, Q., Hakala, S., Kurppa, M., Järvi, L., Liu, Y., Li, Z., Ge, M., Fu, P., Nie, W., Bianchi, F., Petäjä, T., Paasonen, P., Wang, Z., Worsnop, D. R., Kerminen, V.-M., Kulmala, M., and Sun, Y.: A 3D study on the amplification of regional haze and particle growth by local emissions, npj Climate and Atmospheric Science, 4, 4, https://doi.org/10.1038/s41612-020-00156-5, 2021.
Evensen, G.: Sequential data assimilation with a nonlinear quasi-geostrophic model using Monte Carlo methods to forecast error statistics, J. Geophys. Res., 99, 10143–10162, https://doi.org/10.1029/94jc00572, 1994.
Evensen, G.: The Ensemble Kalman Filter: Theoretical formulation and practical implementation, Ocean Dynam., 53, 343–367, https://doi.org/10.1007/s10236-003-0036-9, 2003.
Friedman, J. H., Bentley, J. L., and Finkel, R. A.: An algorithm for finding best matches in logarithmic expected time, ACM T. Math. Software, 3, 209–226, https://doi.org/10.1145/355744.355745, 1977.
Ge, B., Wang, Z., Xu, X., Wu, J., Yu, X., and Li, J.: Wet deposition of acidifying substances in different regions of China and the rest of East Asia: Modeling with updated NAQPMS, Environ. Pollut., 187, 10–21, https://doi.org/10.1016/j.envpol.2013.12.014, 2014.
Ge, X., He, Y., Sun, Y., Xu, J., Wang, J., Shen, Y., and Chen, M.: Characteristics and Formation Mechanisms of Fine Particulate Nitrate in Typical Urban Areas in China, Atmosphere, 8, 62, https://doi.org/10.3390/atmos8030062, 2017.
Gordon, N. J., Salmond, D. J., and Smith, A. F.: Novel approach to nonlinear/non-Gaussian Bayesian state estimation, IEE Proc.-F, 140, 107–113, https://doi.org/10.1049/ip-f-2.1993.0015, 1993.
Guo, Y.: Characteristics of size-segregated carbonaceous aerosols in the Beijing-Tianjin-Hebei region, Environ. Sci. Pollut. R., 23, 13918–13930, https://doi.org/10.1007/s11356-016-6538-z, 2016.
Ha, S.: Implementation of aerosol data assimilation in WRFDA (v4.0.3) for WRF-Chem (v3.9.1) using the RACM/MADE-VBS scheme, Geosci. Model Dev., 15, 1769–1788, https://doi.org/10.5194/gmd-15-1769-2022, 2022.
Hamill, T. M. and Snyder, C.: A Hybrid Ensemble Kalman Filter–3D Variational Analysis Scheme, Mon. Weather Rev., 128, 2905–2919, https://doi.org/10.1175/1520-0493(2000)128<2905:AHEKFV>2.0.CO;2, 2000.
Hersbach, H.: Decomposition of the continuous ranked probability score for ensemble prediction systems, Wea. Forecasting, 15, 559-570, https://doi.org/10.1175/1520-0434(2000)015<0559:DOTCRP>2.0.CO;2, 2000.
Horowitz, L. W., Walters, S., Mauzerall, D. L., Emmons, L. K., Rasch, P. J., Granier, C., Tie, X., Lamarque, J. F., Schultz, M. G., Tyndall, G. S., Orlando, J. J., and Brasseur, G.P.: A global simulation of tropospheric ozone and related tracers: Description and evaluation of MOZART, version 2, J. Geophys. Res.-Atmos., 108, 4784, https://doi.org/10.1029/2002JD002853, 2003.
Houtekamer, P. L. and Zhang, F.: Review of the Ensemble Kalman Filter for Atmospheric Data Assimilation, Mon. Weather Rev., 144, 4489–4532, https://doi.org/10.1175/mwr-d-15-0440.1, 2016.
Huang, B., Pagowski, M., Trahan, S., Martin, C. R., Tangborn, A., Kondragunta, S., and Kleist, D. T.: JEDI-Based Three-Dimensional Ensemble-Variational Data Assimilation System for Global Aerosol Forecasting at NCEP, J. Adv. Model. Earth Sy., 15, e2022MS003232, https://doi.org/10.1029/2022ms003232, 2023.
Huang, Y., Wu, S., Dubey, M. K., and French, N. H. F.: Impact of aging mechanism on model simulated carbonaceous aerosols, Atmos. Chem. Phys., 13, 6329–6343, https://doi.org/10.5194/acp-13-6329-2013, 2013.
Huneeus, N., Chevallier, F., and Boucher, O.: Estimating aerosol emissions by assimilating observed aerosol optical depth in a global aerosol model, Atmos. Chem. Phys., 12, 4585–4606, https://doi.org/10.5194/acp-12-4585-2012, 2012.
Huneeus, N., Boucher, O., and Chevallier, F.: Atmospheric inversion of SO2 and primary aerosol emissions for the year 2010, Atmos. Chem. Phys., 13, 6555–6573, https://doi.org/10.5194/acp-13-6555-2013, 2013.
Hunt, B. R., Kostelich, E. J., and Szunyogh, I.: Efficient data assimilation for spatiotemporal chaos: A local ensemble transform Kalman filter, Physica D, 230, 112–126, https://doi.org/10.1016/j.physd.2006.11.008, 2007.
Inness, A., Ades, M., Agustí-Panareda, A., Barré, J., Benedictow, A., Blechschmidt, A.-M., Dominguez, J. J., Engelen, R., Eskes, H., Flemming, J., Huijnen, V., Jones, L., Kipling, Z., Massart, S., Parrington, M., Peuch, V.-H., Razinger, M., Remy, S., Schulz, M., and Suttie, M.: The CAMS reanalysis of atmospheric composition, Atmos. Chem. Phys., 19, 3515–3556, https://doi.org/10.5194/acp-19-3515-2019, 2019.
Jia, J., Cheng, S., Liu, L., Lang, J., Wang, G., Chen, G., and Liu, X.: An Integrated WRF-CAMx Modeling Approach for Impact Analysis of Implementing the Emergency PM2.5 Control Measures during Red Alerts in Beijing in December 2015, Aerosol Air Qual. Res., 17, 2491–2508, https://doi.org/10.4209/aaqr.2017.01.0009, 2017.
Jin, J., Segers, A., Heemink, A., Yoshida, M., Han, W., and Lin, H. X.: Dust Emission Inversion Using Himawari-8 AODs Over East Asia: An Extreme Dust Event in May 2017, J. Adv. Model. Earth Sy., 11, 446–467, https://doi.org/10.1029/2018MS001491, 2019.
Jolliffe, I. T. and Stephenson, D. B.: Forecast verification: a practitioner's guide in atmospheric science, John Wiley & Sons, https://doi.org/10.1002/9781119960003, 2012.
Khanna, I., Khare, M., Gargava, P., and Khan, A. A.: Effect of PM2.5 chemical constituents on atmospheric visibility impairment, J. Air Waste Manage., 68, 430–437, https://doi.org/10.1080/10962247.2018.1425772, 2018.
Kim, G., Lee, S., Im, J., Song, C.-K., Kim, J., and Lee, M.-i.: Aerosol data assimilation and forecast using Geostationary Ocean Color Imager aerosol optical depth and in-situ observations during the KORUS-AQ observing period, GISci. Remote Sens., 58, 1175–1194, https://doi.org/10.1080/15481603.2021.1972714, 2021.
Kong, L., Tang, X., Zhu, J., Wang, Z., Li, J., Wu, H., Wu, Q., Chen, H., Zhu, L., Wang, W., Liu, B., Wang, Q., Chen, D., Pan, Y., Song, T., Li, F., Zheng, H., Jia, G., Lu, M., Wu, L., and Carmichael, G. R.: A 6-year-long (2013–2018) high-resolution air quality reanalysis dataset in China based on the assimilation of surface observations from CNEMC, Earth Syst. Sci. Data, 13, 529–570, https://doi.org/10.5194/essd-13-529-2021, 2021.
Kumar, R., Ghude, S. D., Biswas, M., Jena, C., Alessandrini, S., Debnath, S., Kulkarni, S., Sperati, S., Soni, V. K., Nanjundiah, R. S., and Rajeevan, M.: Enhancing Accuracy of Air Quality and Temperature Forecasts During Paddy Crop Residue Burning Season in Delhi Via Chemical Data Assimilation, J. Geophys. Res.-Atmos., 125, e2020JD033019, https://doi.org/10.1029/2020JD033019, 2020.
Kurtz, W., He, G., Kollet, S. J., Maxwell, R. M., Vereecken, H., and Hendricks Franssen, H.-J.: TerrSysMP–PDAF (version 1.0): a modular high-performance data assimilation framework for an integrated land surface–subsurface model, Geosci. Model Dev., 9, 1341–1360, https://doi.org/10.5194/gmd-9-1341-2016, 2016.
Lawson, W. G. and Hansen, J. A.: Implications of Stochastic and Deterministic Filters as Ensemble-Based Data Assimilation Methods in Varying Regimes of Error Growth, Mon. Weather Rev., 132, 1966–1981, https://doi.org/10.1175/1520-0493(2004)132<1966:IOSADF>2.0.CO;2, 2004.
Lee, Y. S., Choi, E., Park, M., Jo, H., Park, M., Nam, E., Gon Kim, D., Yi, S.-M., and Young Kim, J.: Feature Extraction and Prediction of Fine Particulate Matter (PM2.5) Chemical Constituents using Four Machine Learning Models, Expert Syst. Appl., 221, 119696, https://doi.org/10.1016/j.eswa.2023.119696, 2023.
Li, H., Yang, T., and Wang, H.: NAQPMS-PDAF v2.0, Zenodo [code and data set], https://doi.org/10.5281/zenodo.10886914, 2024.
Li, H., Yang, T., Du, Y., Tan, Y., and Wang, Z.: Interpreting hourly mass concentrations of PM2.5 chemical components with an optimal deep-learning model. J. Environ. Sci., 151, 125–139, https://doi.org/10.1016/j.jes.2024.03.037, 2025.
Li, J., Li, X., Carlson, B. E., Kahn, R. A., Lacis, A. A., Dubovik, O., and Nakajima, T.: Reducing multisensor satellite monthly mean aerosol optical depth uncertainty: 1. Objective assessment of current AERONET locations, J. Geophys. Res.-Atmos., 121, 609–627, https://doi.org/10.1002/2016JD025469, 2016.
Li, J., Dong, Y., Song, Y., Dong, B., van Donkelaar, A., Martin, R. V., Shi, L., Ma, Y., Zou, Z., and Ma, J.: Long-term effects of PM2.5 components on blood pressure and hypertension in Chinese children and adolescents, Environ. Int., 161, 107134, https://doi.org/10.1016/j.envint.2022.107134, 2022.
Li, S., Chen, L., Huang, G., Lin, J., Yan, Y., Ni, R., Huo, Y., Wang, J., Liu, M., Weng, H., Wang, Y., and Wang, Z.: Retrieval of surface PM2.5 mass concentrations over North China using visibility measurements and GEOS-Chem simulations, Atmos. Environ., 222, 117121, https://doi.org/10.1016/j.atmosenv.2019.117121, 2020.
Li, Y., Wang, X., Li, J., Zhu, L., and Chen, Y.: Numerical Simulation of Topography Impact on Transport and Source Apportionment on PM2.5 in a Polluted City in Fenwei Plain, Atmosphere, 13, 233, https://doi.org/10.3390/atmos13020233, 2022.
Lin, G. Y., Chen, H. W., Chen, B. J., and Chen, S. C.: A machine learning model for predicting PM2.5 and nitrate concentrations based on long-term water-soluble inorganic salts datasets at a road site station, Chemosphere, 289, 133123, https://doi.org/10.1016/j.chemosphere.2021.133123, 2022.
Liu, Y., Liu, J., Li, C., Yu, F., and Wang, W.: Effect of the Assimilation Frequency of Radar Reflectivity on Rain Storm Prediction by Using WRF-3DVAR, Remote Sens., 13, 2103, https://doi.org/10.3390/rs13112103, 2021.
Lloyd, S.: Least squares quantization in PCM, IEEE T. Inform. Theory, 28, 129–137, https://doi.org/10.1109/TIT.1982.1056489, 1982.
Luo, X., Liu, X., Pan, Y., Wen, Z., Xu, W., Zhang, L., Kou, C., Lv, J., and Goulding, K.: Atmospheric reactive nitrogen concentration and deposition trends from 2011 to 2018 at an urban site in north China, Atmos. Environ., 224, 117298, https://doi.org/10.1016/j.atmosenv.2020.117298, 2020.
Lv, Z., Wei, W., Cheng, S., Han, X., and Wang, X.: Meteorological characteristics within boundary layer and its influence on PM2.5 pollution in six cities of North China based on WRF-Chem, Atmos. Environ., 228, 117417, https://doi.org/10.1016/j.atmosenv.2020.117417, 2020.
Lynch, P., Reid, J. S., Westphal, D. L., Zhang, J., Hogan, T. F., Hyer, E. J., Curtis, C. A., Hegg, D. A., Shi, Y., Campbell, J. R., Rubin, J. I., Sessions, W. R., Turk, F. J., and Walker, A. L.: An 11-year global gridded aerosol optical thickness reanalysis (v1.0) for atmospheric and climate sciences, Geosci. Model Dev., 9, 1489–1522, https://doi.org/10.5194/gmd-9-1489-2016, 2016.
Mallet, V. and Sportisse, B.: Uncertainty in a chemistry-transport model due to physical parameterizations and numerical approximations: An ensemble approach applied to ozone modeling, J. Geophys. Res.-Atmos., 111, D01302, https://doi.org/10.1029/2005jd006149, 2006.
Miao, R., Chen, Q., Zheng, Y., Cheng, X., Sun, Y., Palmer, P. I., Shrivastava, M., Guo, J., Zhang, Q., Liu, Y., Tan, Z., Ma, X., Chen, S., Zeng, L., Lu, K., and Zhang, Y.: Model bias in simulating major chemical components of PM2.5 in China, Atmos. Chem. Phys., 20, 12265–12284, https://doi.org/10.5194/acp-20-12265-2020, 2020.
Ming, L., Jin, L., Li, J., Fu, P., Yang, W., Liu, D., Zhang, G., Wang, Z., and Li, X.: PM2.5 in the Yangtze River Delta, China: Chemical compositions, seasonal variations, and regional pollution events, Environ. Pollut., 223, 200–212, 2017.
Mingari, L., Folch, A., Prata, A. T., Pardini, F., Macedonio, G., and Costa, A.: Data assimilation of volcanic aerosol observations using FALL3D+PDAF, Atmos. Chem. Phys., 22, 1773–1792, https://doi.org/10.5194/acp-22-1773-2022, 2022.
Miyazaki, K., Eskes, H. J., Sudo, K., Takigawa, M., van Weele, M., and Boersma, K. F.: Simultaneous assimilation of satellite NO2, O3, CO, and HNO3 data for the analysis of tropospheric chemical composition and emissions, Atmos. Chem. Phys., 12, 9545–9579, https://doi.org/10.5194/acp-12-9545-2012, 2012.
Nerger, L.: On Serial Observation Processing in Localized Ensemble Kalman Filters, Mon. Weather Rev., 143, 1554–1567, https://doi.org/10.1175/mwr-d-14-00182.1, 2015.
Nerger, L.: Data assimilation for nonlinear systems with a hybrid nonlinear Kalman ensemble transform filter, Q. J. Roy. Meteor. Soc., 148, 620–640, https://doi.org/10.1002/qj.4221, 2022.
Nerger, L., Janjić, T., Schröter, J., and Hiller, W.: A Unification of Ensemble Square Root Kalman Filters, Mon. Weather Rev., 140, 2335–2345, https://doi.org/10.1175/mwr-d-11-00102.1, 2012.
Nerger, L., Tang, Q., and Mu, L.: Efficient ensemble data assimilation for coupled models with the Parallel Data Assimilation Framework: example of AWI-CM (AWI-CM-PDAF 1.0), Geosci. Model Dev., 13, 4305–4321, https://doi.org/10.5194/gmd-13-4305-2020, 2020.
Nishizawa, T., Okamoto, H., Takemura, T., Sugimoto, N., Matsui, I., and Shimizu, A.: Aerosol retrieval from two-wavelength backscatter and one-wavelength polarization lidar measurement taken during the MR01K02 cruise of the R/V Mirai and evaluation of a global aerosol transport model, J. Geophys. Res.-Atmos., 113, D21201, https://doi.org/10.1029/2007jd009640, 2008.
Nishizawa, T., Sugimoto, N., Matsui, I., Shimizu, A., and Okamoto, H.: Algorithms to retrieve optical properties of three component aerosols from two-wavelength backscatter and one-wavelength polarization lidar measurements considering nonsphericity of dust, J. Quant. Spectrosc. Ra., 112, 254–267, https://doi.org/10.1016/j.jqsrt.2010.06.002, 2011.
Nishizawa, T., Sugimoto, N., Matsui, I., Shimizu, A., Hara, Y., Itsushi, U., Yasunaga, K., Kudo, R., and Kim, S. W.: Ground-based network observation using Mie-Raman lidars and multi-wavelength Raman lidars and algorithm to retrieve distributions of aerosol components, J. Quant. Spectrosc. Ra., 188, 79–93, https://doi.org/10.1016/j.jqsrt.2016.06.031, 2017.
NOAA National Geophysical Data Center: ETOPO1 1 arc-minute global relief model, NOAA National Centers for Environmental Information [data set], https://www.ngdc.noaa.gov/mgg/global/relief/ETOPO1/data (last access: 13 January 2022), 2009.
Park, R. S., Lee, S., Shin, S.-K., and Song, C. H.: Contribution of ammonium nitrate to aerosol optical depth and direct radiative forcing by aerosols over East Asia, Atmos. Chem. Phys., 14, 2185–2201, https://doi.org/10.5194/acp-14-2185-2014, 2014.
Randles, C. A., da Silva, A. M., Buchard, V., Colarco, P. R., Darmenov, A., Govindaraju, R., Smirnov, A., Holben, B., Ferrare, R., Hair, J., Shinozuka, Y., and Flynn, C. J.: The MERRA-2 aerosol reanalysis, 1980 onward. Part I: System description and data assimilation evaluation, J. Climate, 30, 6823–6850, https://doi.org/10.1175/JCLI-D-16-0609.1, 2017.
Rodriguez, M. A., Brouwer, J., Samuelsen, G. S., and Dabdub, D.: Air quality impacts of distributed power generation in the South Coast Air Basin of California 2: Model uncertainty and sensitivity analysis, Atmos. Environ., 41, 5618–5635, https://doi.org/10.1016/j.atmosenv.2007.02.049, 2007.
Rubin, J. I. and Collins, W. D.: Global simulations of aerosol amount and size using MODIS observations assimilated with an Ensemble Kalman Filter, J. Geophys. Res.-Atmos., 119, 12780–12806, https://doi.org/10.1002/2014JD021627, 2014.
Rubin, J. I., Reid, J. S., Hansen, J. A., Anderson, J. L., Holben, B. N., Xian, P., Westphal, D. L., and Zhang, J. L.: Assimilation of AERONET and MODIS AOT observations using variational and ensemble data assimilation methods and its impact on aerosol forecasting skill, J. Geophys. Res.-Atmospheres, 122, 4967–4992, https://doi.org/10.1002/2016jd026067, 2017.
Saide, P. E., Kim, J., Song, C. H., Choi, M., Cheng, Y., and Carmichael, G. R.: Assimilation of next generation geostationary aerosol optical depth retrievals to improve air quality simulations, Geophys. Res. Lett., 41, 9188–9196, https://doi.org/10.1002/2014GL062089, 2014.
Sax, T. and Isakov, V.: A case study for assessing uncertainty in local-scale regulatory air quality modeling applications, Atmos. Environ., 37, 3481–3489, https://doi.org/10.1016/S1352-2310(03)00411-4, 2003.
Schlesinger, R. B.: The health impact of common inorganic components of fine particulate matter (PM2.5) in ambient air: a critical review, Inhal. Toxicol., 19, 811–832, https://doi.org/10.1080/08958370701402382, 2007.
Schult, I., Feichter, J., and Cooke, W. F.: Effect of black carbon and sulfate aerosols on the Global Radiation Budget, J. Geophys. Res.-Atmospheres, 102, 30107–30117, https://doi.org/10.1029/97jd01863, 1997.
Schutgens, N. A. J., Miyoshi, T., Takemura, T., and Nakajima, T.: Applying an ensemble Kalman filter to the assimilation of AERONET observations in a global aerosol transport model, Atmos. Chem. Phys., 10, 2561–2576, https://doi.org/10.5194/acp-10-2561-2010, 2010.
Schwartz, C. S., Liu, Z., Lin, H.-C., and Cetola, J. D.: Assimilating aerosol observations with a “hybrid” variational-ensemble data assimilation system, J. Geophys. Res.-Atmospheres, 119, 4043–4069, https://doi.org/10.1002/2013jd020937, 2014.
Soni, A., Mandariya, A. K., Rajeev, P., Izhar, S., Singh, G. K., Choudhary, V., Qadri, A. M., Gupta, A. D., Singh, A. K., and Gupta, T.: Multiple site ground-based evaluation of carbonaceous aerosol mass concentrations retrieved from CAMS and MERRA-2 over the Indo-Gangetic Plain, Environ. Sci.-Atmos., 1, 577–590, https://doi.org/10.1039/d1ea00067e, 2021.
Strebel, L., Bogena, H. R., Vereecken, H., and Hendricks Franssen, H.-J.: Coupling the Community Land Model version 5.0 to the parallel data assimilation framework PDAF: description and applications, Geosci. Model Dev., 15, 395–411, https://doi.org/10.5194/gmd-15-395-2022, 2022.
Talagrand, O. and Courtier, P.: Variational Assimilation of Meteorological Observations With the Adjoint Vorticity Equation. I: Theory, Q. J. Roy. Meteor. Soc., 113, 1311–1328, https://doi.org/10.1002/qj.49711347812, 1987.
Tang, Y., Chai, T., Pan, L., Lee, P., Tong, D., Kim, H. C., and Chen, W.: Using optimal interpolation to assimilate surface measurements and satellite AOD for ozone and PM2.5: A case study for July 2011, J. Air Waste Manage., 65, 1206–1216, https://doi.org/10.1080/10962247.2015.1062439, 2015.
Tippett, M. K., Anderson, J. L., Bishop, C. H., Hamill, T. M., and Whitaker, J. S.: Ensemble Square Root Filters, Mon. Weather Rev., 131, 1485–1490, https://doi.org/10.1175/1520-0493(2003)131<1485:ESRF>2.0.CO;2, 2003.
Tödter, J. and Ahrens, B.: A Second-Order Exact Ensemble Square Root Filter for Nonlinear Data Assimilation, Mon. Weather Rev., 143, 1347–1367, https://doi.org/10.1175/MWR-D-14-00108.1, 2015.
Tödter, J., Kirchgessner, P., Nerger, L., and Ahrens, B.: Assessment of a Nonlinear Ensemble Transform Filter for High-Dimensional Data Assimilation, Mon. Weather Rev., 144, 409–427, https://doi.org/10.1175/MWR-D-15-0073.1, 2016.
Tsikerdekis, A., Schutgens, N. A. J., and Hasekamp, O. P.: Assimilating aerosol optical properties related to size and absorption from POLDER/PARASOL with an ensemble data assimilation system, Atmos. Chem. Phys., 21, 2637–2674, https://doi.org/10.5194/acp-21-2637-2021, 2021.
Wang, H., Yang, T., Wang, Z., Li, J., Chai, W., Tang, G., Kong, L., and Chen, X.: An aerosol vertical data assimilation system (NAQPMS-PDAF v1.0): development and application, Geosci. Model Dev., 15, 3555–3585, https://doi.org/10.5194/gmd-15-3555-2022, 2022.
Wang, N., Guo, H., Jiang, F., Ling, Z. H., and Wang, T.: Simulation of ozone formation at different elevations in mountainous area of Hong Kong using WRF-CMAQ model, Sci. Total Environ., 505, 939–951, https://doi.org/10.1016/j.scitotenv.2014.10.070, 2015.
Wang, T., Liu, H., Li, J., Wang, S., Kim, Y., Sun, Y., Yang, W., Du, H., Wang, Z., and Wang, Z.: A two-way coupled regional urban–street network air quality model system for Beijing, China, Geosci. Model Dev., 16, 5585–5599, https://doi.org/10.5194/gmd-16-5585-2023, 2023.
Wang, Z., Maeda, T., Hayashi, M., Hsiao, L. F., and Liu, K. Y.: A Nested Air Quality Prediction Modeling System for Urban and Regional Scales: Application for High-Ozone Episode in Taiwan, Water Air Soil Poll., 130, 391–396, https://doi.org/10.1023/A:1013833217916, 2001.
Wang, Z., Li, J., Wang, Z., Yang, W., Tang, X., Ge, B., Yan, P., Zhu, L., Chen, X., Chen, H., Wand, W., Li, J., Liu, B., Wang, X., Wand, W., Zhao, Y., Lu, N., and Su, D.: Modeling study of regional severe hazes over mid-eastern China in January 2013 and its implications on pollution prevention and control, Sci. China Earth Sci., 57, 3–13, https://doi.org/10.1007/s11430-013-4793-0, 2014.
Wang, Z., Itahashi, S., Uno, I., Pan, X., Osada, K., Yamamoto, S., Nishizawa, T., Tamura, K., and Wang, Z.: Modeling the Long-Range Transport of Particulate Matters for January in East Asia using NAQPMS and CMAQ, Aerosol Air Qual. Res., 17, 3065–3078, https://doi.org/10.4209/aaqr.2016.12.0534, 2017.
Wang, Z., Uno, I., Yumimoto, K., Pan, X., Chen, X., Li, J., Wang, Z., Shimizu, A., and Sugimoto, N.: Dust Heterogeneous Reactions during Long-Range Transport of a Severe Dust Storm in May 2017 over East Asia, Atmosphere, 10, 680, https://doi.org/10.3390/atmos10110680, 2019.
Werner, M., Kryza, M., and Guzikowski, J.: Can Data Assimilation of Surface PM2.5 and Satellite AOD Improve WRF-Chem Forecasting? A Case Study for Two Scenarios of Particulate Air Pollution Episodes in Poland, Remote Sens., 11, 2364, https://doi.org/10.3390/rs11202364, 2019.
Wilcox, E. M., Thomas, R. M., Praveen, P. S., Pistone, K., Bender, F. A., and Ramanathan, V.: Black carbon solar absorption suppresses turbulence in the atmospheric boundary layer, P. Natl. Acad. Sci. USA, 113, 11794–11799, https://doi.org/10.1073/pnas.1525746113, 2016.
Xia, X., Min, J., Wang, Y., Shen, F., Yang, C., and Sun, Z.: Assimilating Himawari-8 AHI aerosol observations with a rapid-update data assimilation system, Atmos. Environ., 215, 116866, https://doi.org/10.1016/j.atmosenv.2019.116866, 2019.
Xia, X., Min, J., Shen, F., Wang, Y., Xu, D., Yang, C., and Zhang, P.: Aerosol data assimilation using data from Fengyun-4A, a next-generation geostationary meteorological satellite, Atmos. Environ., 237, 117695, https://doi.org/10.1016/j.atmosenv.2020.117695, 2020.
Xie, X., Hu, J., Qin, M., Guo, S., Hu, M., Wang, H., Lou, S., Li, J., Sun, J., Li, X., Sheng, L., Zhu, J., Chen, G., Yin, J., Fu, W., Huang, C., and Zhang, Y.: Modeling particulate nitrate in China: Current findings and future directions, Environ. Int., 166, 107369, https://doi.org/10.1016/j.envint.2022.107369, 2022.
Yan, Y., Zhou, Y., Kong, S., Lin, J., Wu, J., Zheng, H., Zhang, Z., Song, A., Bai, Y., Ling, Z., Liu, D., and Zhao, T.: Effectiveness of emission control in reducing PM2.5 pollution in central China during winter haze episodes under various potential synoptic controls, Atmos. Chem. Phys., 21, 3143–3162, https://doi.org/10.5194/acp-21-3143-2021, 2021.
Yang, T., Li, H., Wang, H., Sun, Y., Chen, X., Wang, F., Xu, L., and Wang, Z.: Vertical aerosol data assimilation technology and application based on satellite and ground lidar: A review and outlook, J. Environ. Sci., 123, 292–305, https://doi.org/10.1016/j.jes.2022.04.012, 2023.
Yang, X., Wu, Q., Zhao, R., Cheng, H., He, H., Ma, Q., Wang, L., and Luo, H.: New method for evaluating winter air quality: PM2.5 assessment using Community Multi-Scale Air Quality Modeling (CMAQ) in Xi'an, Atmos. Environ., 211, 18–28, https://doi.org/10.1016/j.atmosenv.2019.04.019, 2019.
Ye, Q., Li, J., Chen, X., Chen, H., Yang, W., Du, H., Pan, X., Tang, X., Wang, W., Zhu, L., Li, J., Wang, Z., and Wang, Z.: High-resolution modeling of the distribution of surface air pollutants and their intercontinental transport by a global tropospheric atmospheric chemistry source–receptor model (GNAQPMS-SM), Geosci. Model Dev., 14, 7573–7604, https://doi.org/10.5194/gmd-14-7573-2021, 2021.
Yu, H.-C., Zhang, Y. J., Nerger, L., Lemmen, C., Yu, J. C. S., Chou, T.-Y., Chu, C.-H., and Terng, C.-T.: Development of a flexible data assimilation method in a 3D unstructured-grid ocean model under Earth System Modeling Framework, EGUsphere [preprint], https://doi.org/10.5194/egusphere-2022-114, 2022.
Zhai, S., Jacob, D. J., Wang, X., Shen, L., Li, K., Zhang, Y., Gui, K., Zhao, T., and Liao, H.: Fine particulate matter (PM2.5) trends in China, 2013–2018: separating contributions from anthropogenic emissions and meteorology, Atmos. Chem. Phys., 19, 11031–11041, https://doi.org/10.5194/acp-19-11031-2019, 2019.
Zhang, F., Wang, Z.-w., Cheng, H.-r., Lv, X.-p., Gong, W., Wang, X.-m., and Zhang, G.: Seasonal variations and chemical characteristics of PM2.5 in Wuhan, central China, Sci. Total Environ., 518–519, 97–105, https://doi.org/10.1016/j.scitotenv.2015.02.054, 2015.
Zhang, J., Reid, J. S., Westphal, D. L., Baker, N. L., and Hyer, E. J.: A system for operational aerosol optical depth data assimilation over global oceans, J. Geophys. Res., 113, D10208, https://doi.org/10.1029/2007jd009065, 2008.
Zhang, J., Campbell, J. R., Hyer, E. J., Reid, J. S., Westphal, D. L., and Johnson, R. S.: Evaluating the impact of multisensor data assimilation on a global aerosol particle transport model, J. Geophys. Res.-Atmos., 119, 4674–4689, https://doi.org/10.1002/2013jd020975, 2014.


