the Creative Commons Attribution 4.0 License.
the Creative Commons Attribution 4.0 License.
 | 25 Sep 2024
A new lightning scheme in the Canadian Atmospheric Model (CanAM5.1): implementation, evaluation, and projections of lightning and fire in future climates
Montana Etten-Bohm
Courtney Schumacher
Ayodeji Akingunola
Vivek Arora
Jason Cole
Michael Lazare
David Plummer
Knut von Salzen
Barbara Winter
Lightning is an important atmospheric process for generating reactive nitrogen, resulting in the production of tropospheric ozone, as well as igniting wildland fires, which result in potentially large emissions of many pollutants and short-lived climate forcers. Lightning is also expected to change in frequency and location with the changing climate. As such, lightning is an important component of Earth system models. Until now, the Canadian Earth System Model (CanESM) did not contain an interactive-lightning parameterization. The fire parameterization in CanESM5.1 was designed to use prescribed monthly climatological lightning. In this study, we have added a logistical regression lightning model that predicts lightning occurrence interactively based on three environmental variables and their interactions in CanESM5.1's atmospheric model, CanAM5.1 (Canadian Atmospheric Model), creating the capacity to interactively model lightning, allowing for future projections under different climate scenarios. The modelled lightning and resulting burned area were evaluated against satellite measurements over the historical period, and model biases were found to be acceptable. Modelled lightning had a small negative bias and excellent land–ocean ratio compared to satellite measurements.
The modified version of CanESM5.1 was used to simulate two future climate scenarios (SSP2-4.5 and SSP5-8.5; Shared Socioeconomic Pathway) to assess how lightning and burned area change in the future. Under the higher-emissions scenario (SSP5-8.5), CanESM5.1 predicts almost no change to the global mean lightning flash rate by the end of the century (2081–2100 vs. 2015–2035 average). However, there are substantial regional changes to lightning – particularly over land – such as a mean increase of 6 % in the northern mid-latitudes and decrease of −8 % in the tropics. By the century's end, the change in global total burned area with prescribed climatological lightning was about 2 times greater than that with interactive lightning (42 % vs. 26 % increase, respectively). Conversely, in the northern mid-latitudes the use of interactive lightning resulted in 3 times more burned area compared to that with unchanging lightning (48 % vs. 16 % increase, respectively). These results show that the future changes to burned area are greatly dependent on a model's lightning scheme, both spatially and overall.
- Article
(4935 KB) - Full-text XML
-
Supplement
(1455 KB) - BibTeX
- EndNote


In addition to being a hazard to human health (Jensen et al., 2024) and infrastructure (Mills et al., 2010), lightning is an indirect source of short-lived climate forcers (SLCFs) given that it produces nitrogen oxides (NOx) – a tropospheric ozone (O3) precursor – in the atmosphere, and it is responsible for igniting wildland fires, which in turn emit numerous greenhouse gases and SLCFs, such as methane (CH4), black carbon, and O3 precursors (e.g., CH4; volatile organic compounds, VOCs; and NOx). Lightning is also expected to increase with climate change in several regions, though studies differ greatly depending on which lightning parameterization and model is used (Williams, 2005; Zeng et al., 2008; Hui and Hong, 2013; Price, 2013; Krause et al., 2014; Banerjee et al., 2014; Clark et al., 2017; Finney et al., 2018; Chen et al., 2021).
Lightning is also difficult to model accurately. The processes responsible for cloud electrification are not simulated in current climate models, so parameterizations of lightning have relied on associations between lightning and large-scale or uncertain variables, like cloud height. However, many lightning schemes do not reproduce the observed ocean–land gradient and/or need separate parameters over land vs. over ocean (e.g., Murray et al., 2012; Romps et al., 2018). To reliably project changes to lightning and wildfires in the future, as well as to better understand their interactions, it is imperative to realistically simulate lightning in Earth system models.
Several lightning parameterizations are available for use in atmospheric models, each with its own benefits and drawbacks. For example, the Price and Rind (1992, 1993) lightning scheme, based on cloud-top height, is popular in climate models due to its computational efficiency but exhibits poor skill (Tost et al., 2007; Murray et al., 2012). The Finney et al. (2014) and Allen and Pickering (2002) schemes are based on upward ice flux at 440 hPa and show better results than cloud-top height models over the oceans. The Lopez (2016) lightning scheme is based on the charging rate and convective available potential energy (CAPE), but it requires graupel, snow, and cloud condensate in updrafts, and these are often not explicitly simulated in most atmospheric models. Similarly, McCaul et al. (2009) have a scheme based on upward flux of graupel and the integral of solid precipitate. However, because it, too, requires the explicit simulation of microphysics for cloud water, snow, and graupel, it is only appropriate for very high-horizontal-resolution models. He et al. (2022) developed a scheme based on Lopez (2016) and McCaul et al. (2009). Finally, the lightning scheme based on the product of CAPE and precipitation (Romps et al., 2014) has gained recent attention, but this, too, has been shown to perform poorly over ocean (Romps et al., 2018).
Projected lightning changes with climate differ greatly depending on the lightning parameterization and the underlying model. For example, in the tropics, lightning has been projected to increase based on cloud-top schemes but decrease based on ice-flux schemes (Finney et al., 2018). Generally, lightning is projected to increase in the northern mid-latitudes (e.g., Janssen et al., 2023) and even in the Arctic where it was previously non-existent (Chen et al., 2021), but this continues to be a highly uncertain projection.
In this study, we evaluated a logistic regression lightning model from Etten-Bohm et al. (2021) in version 5.1 of the Canadian Earth System Model, CanESM5.1 (Sigmond et al., 2023). The Etten-Bohm et al. (2021) lightning scheme has the benefit of a single formulation that works well over both land and ocean. It depends on well-known environmental variables that atmospheric models compute routinely, and it does not require tuning to a global mean value. In Sect. 2 we describe this lightning scheme, its implementation in CanESM5.1, and its subsequent evaluation. Section 3 shows the modelled-lightning and burned-area results and their comparisons to observation-based datasets. In Sect. 4, we report results from future CanESM5.1 simulations with the new interactive-lightning scheme to the end of the century to examine how lightning and the burned area change in future climate scenarios. Finally, conclusions are presented in Sect. 5.
2.1 Lightning model
The lightning parameterization we have selected for use in CanESM5.1 was derived in Etten-Bohm et al. (2021), where the relationship between lightning and several large-scale environmental variables were assessed. We use “model b” from Etten-Bohm et al. (2021), which provided the best lightning results based on three environmental variables, i.e., undilute CAPE, lifting condensation level (LCL), and column saturation fraction (r), and their interactions to determine the probability (p) of a lightning occurrence at grid point s (Eq. 1):
where the Bi coefficients are given in Table 1 and LCL is in pressure coordinates (in mbar). The coefficients were determined through a logistic regression, which was trained on 1 year (2003) of 0.5° gridded lightning data from the Tropical Rainfall Measuring Mission (TRMM) Lightning Imaging Sensor (LIS) and environmental variables from the Modern-Era Retrospective analysis for Research and Applications, Version 2 (MERRA-2), and tested with data from 2004.
Note that all input variables Vi (CAPE, LCL, r) in model grid i are standardized before going into Eq. (1). This means, CAPE, LCL, and r of Eq. (1) are actually
This standardization acts to minimize the impact of systematic biases in the input variables.
Table 1Fitted coefficients in the lightning model from Etten-Bohm et al. (2021) used in Eq. (1).
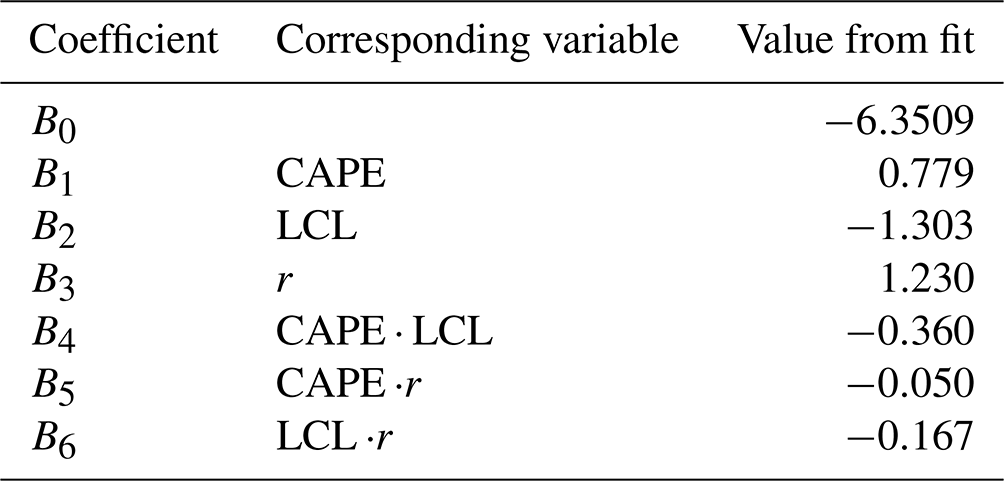
As discussed in Sect. 1, CAPE has been used in some lightning parameterizations because of its strong link to a storm's potential updraft intensity. The column saturation fraction r is a measure of how humid a column is relative to its saturation specific humidity and is analogous to column water vapour. r has been shown to be highly related to convective precipitation, especially over tropical oceans (Bretherton et al., 2004) but also over warm land regions (Ahmed and Schumacher, 2017). LCL and related proxies have been shown to help distinguish between land and ocean lightning occurrence because moister areas, like over the ocean, tend to have lower LCLs and therefore lower cloud bases, which has been linked to less lightning (Etten-Bohm et al., 2021; Stolz et al., 2015; Williams and Stanfill, 2002).
2.2 CanESM5.1
We implement the above lightning scheme as a new subroutine in the physics module of CanAM5.1 (Canadian Atmospheric Model; Cole et al., 2023), the atmospheric model component of CanESM5.1 (Swart et al., 2019). The operational horizontal resolution of CanESM5.1 is T63 (∼2.8°) resolution in the atmosphere and ∼1° in the ocean, which is based on the Nucleus for European Modelling of the Ocean (NEMO; Madec and the NEMO team, 2012) model. The land component of CanESM5.1 is based on the Canadian Land Surface Scheme–Canadian Terrestrial Ecosystem Model (CLASS–CTEM), which simulates the burned area and fire CO2 emissions (Arora and Melton, 2018; Arora and Boer, 2005). The emissions of several other species are based on specified emissions factors. In CanESM5.1, atmospheric pollutant concentrations from fires are specified based on the CMIP6 protocol (Verseghy, 1991; Verseghy et al., 1993; Verseghy, 2000; Arora, 2003; Arora and Boer, 2003, 2005; Swart et al., 2019), that is, from input emissions. The linkage between CLASS–CTEM fire emissions of various species and the atmospheric aerosols module is not made in this study but will be a subject of future work.
Figure S1 and Sect. S1 in the Supplement explain how CanAM5.1 computes CAPE within its convection subroutines and description of CanAM5.1's convection, respectively. In this formulation, CAPE is defined as negative when the air parcel moves downward. We adjust this for the lightning calculation such that CAPE input for lightning is only positive for upward moving parcels and zero otherwise. LCL is also calculated as a vertical index in the same subroutine as CAPE and is passed to the new lightning subroutine where the pressure at that index is used for the lightning calculation. r is a new calculation in CanESM5.1, based on the model's specific humidity and saturation mixing ratio (Ahmed and Schumacher, 2017). CanESM simulations in this paper are not nudged, as we typically find that nudging degrades cloud properties and precipitation in the model, even though temperature, winds, and humidity are improved. This is because cloud and convection parameterizations have been developed and tuned using observational constraints using un-nudged simulations. Also given that we standardized the CAPE, LCL, and r inputs to the lightning equation, their systematic biases do not greatly impact lightning results.
New model outputs include lightning occurrence (given as a percent probability), the total lightning flash rate (given in flashes km−2 yr−1), and the cloud-to-ground and cloud-to-cloud flash rates. Lightning occurrence is calculated from Eq. (1), and the total flash rate is calculated using the product of a scale factor and lightning occurrence. Etten-Bohm et al. (2021) showed that the mean lightning occurrence and mean flash rates observed by the TRMM LIS have very similar geographical patterns, so the scale factor was found by determining the multiplicative factor that results in a global average flash rate that is similar to that observed by the TRMM LIS Optical Transient Detector (hereafter “LIS/OTD”). The cloud-to-ground fraction was set to a linearly increasing value based on latitude, with a 10 % fraction at the Equator, increasing to 40 % at mid-latitudes (±45°) and up to 70 % at the poles, based on observations of the freezing height in the clouds and resulting cloud-to-ground fraction (Uman, 1986). Note that an alternative cloud-to-ground fraction based on the thickness of the cold cloud region in thunderstorms is described in Price and Rind (1993), but it was not tried in our study, as we aim to avoid dependence on highly uncertain cloud properties.
2.2.1 Fires in CanESM5.1
In the simulation with interactive lightning, the cloud-to-ground lightning flash rate is used in place of the specified climatological lightning for natural wildfire ignition in CLASS–CTEM. The specified climatological lightning is based on the LIS/OTD total lightning flash rate, pre-converted to the cloud-to-ground fraction for the input file. CLASS–CTEM's fire module also has a human ignition and suppression component (Arora and Melton, 2018), which is based on population density. In this study, we used an unchanging present-day human population density corresponding to the average of 2010–2019.
The fire module in CLASS–CTEM is designed to capture large-scale global fire behaviour and, in addition to lightning, is dependent on simulated vegetation biomass and soil moisture. The fire module calculates the probability of fire based on the availability of biomass as a fuel source, combustibility of fuel based on its moisture content, and presence of an ignition source (be it human or lightning). Since CTEM, the biogeochemistry component, operates at a daily time step, the burned area is calculated daily. The burned area in 1 d is based on the probability of fire; wind speed; and the fire duration, which is expressed in terms of the fire-extinguishing probability. The fire-extinguishing probability in turn is dependent on the human population density. CLASS–CTEM fire emissions and the burned area have been evaluated when the model is driven offline (driven by bias-corrected climate input) (Li et al., 2019) and by reanalysis data (Arora and Melton, 2018). However, CLASS–CTEM's burned-area estimates have not been evaluated within the CanESM5.1 framework before this study.
Note that two preindustrial spin-up simulations (one with prescribed lightning and one with interactive lightning) of CanESM5.1 were conducted for 150 years each in order for the global vegetation to equilibrate after having fire turned on the first time. Then the transient historical simulations of this study were performed, with 10 ensemble members, starting from 1850 for additional historical spin-up time, where we keep the results from 1995 onward for evaluation and analysis.
2.2.2 Future simulations
We simulate the future time period (2015 to 2100) with 10 ensemble members for two future climate change scenarios: the severe (SSP5-8.5) and the moderate (SSP2-4.5) Shared Socioeconomic Pathway (Riahi et al., 2017). We average model results over the last 20 years (2081–2100) of the future scenarios and compare them to the average of the first 20 years (2015–2035, representing the present).
2.2.3 Evaluation
In Sect. 3, we evaluate the lightning occurrence, flash rate, and burned area against the following observation-based datasets, for different groupings of years:
-
the International Space Station (ISS) Lightning Imaging Sensor (LIS), hereafter “ISS LIS”, lightning occurrence dataset, which covers from 54° S to 54° N and started on 1 March 2017 (Blakeslee et al., 2020) (we evaluate the years 2017–2019);
-
the gridded climatology of the total lightning flash rate from the spaceborne OTD and TRMM LIS (same as LIS/OTD mentioned above) (Cecil et al., 2014a) (we evaluate 1995–2014);
-
the MODIS Fire_cci (Climate Change Initiative) burned-area grid product v5.1 (Lizundia-Loiola et al., 2020) (we evaluate 2001–2014).
Note that while the LIS/OTD flash rate is a global product, its OTD data were collected from May 1995 to March 2000 and its TRMM LIS data (equatorward of about 38°) are from 1998 to 2014. Thus, the LIS/OTD climatology is most robust in the tropics and subtropics, while the high-latitude data are entirely from OTD (Cecil et al., 2014a). The uncertainties in the instrument bulk flash detection efficiency of LIS are 88±9 %, and those of OTD are 54±8 % (Boccippio et al., 2002; He et al., 2022). CanAM5.1's CAPE, LCL, and r were compared to those from the MERRA-2 reanalysis (Sect. 3.2 and in the Supplement), informing the results of the lightning evaluation.
Here we show the total (which includes cloud-to-ground and cloud-to-cloud) lightning results from the CanESM5.1 simulation that contains the Etten-Bohm et al. (2021) lightning scheme and compare those results to both the ISS LIS lightning occurrence dataset (Sect. 3.1) for 2017–2019 (Figs. 1 and 2) and to the LIS/OTD lightning flash rate climatology for 1995–2014 (Sect. 3.3, Figs. 3 and 4). We also evaluate the burned area (Sect. 3.4) against MODIS-derived data for 2001–2014, as modelled burned area is impacted by the cloud-to-ground component of the new lightning.
3.1 Lightning occurrence
The annual average lightning occurrence, given as a percentage of lightning occurring in each model column, is evaluated using the 54° S–54° N observations from the ISS LIS instrument. The ISS LIS observations were first interpolated onto the model grid. These geographical distributions are compared in Fig. 1, and the zonal means and the seasonal cycle (regionally averaged monthly means) are compared in Fig. 2. The model-over-measurement mean ratio is 0.7, and there is a spatial correlation coefficient (R) of 0.57 and a root mean square error (RMSE) of 1.7 % between the model and ISS LIS measurements.
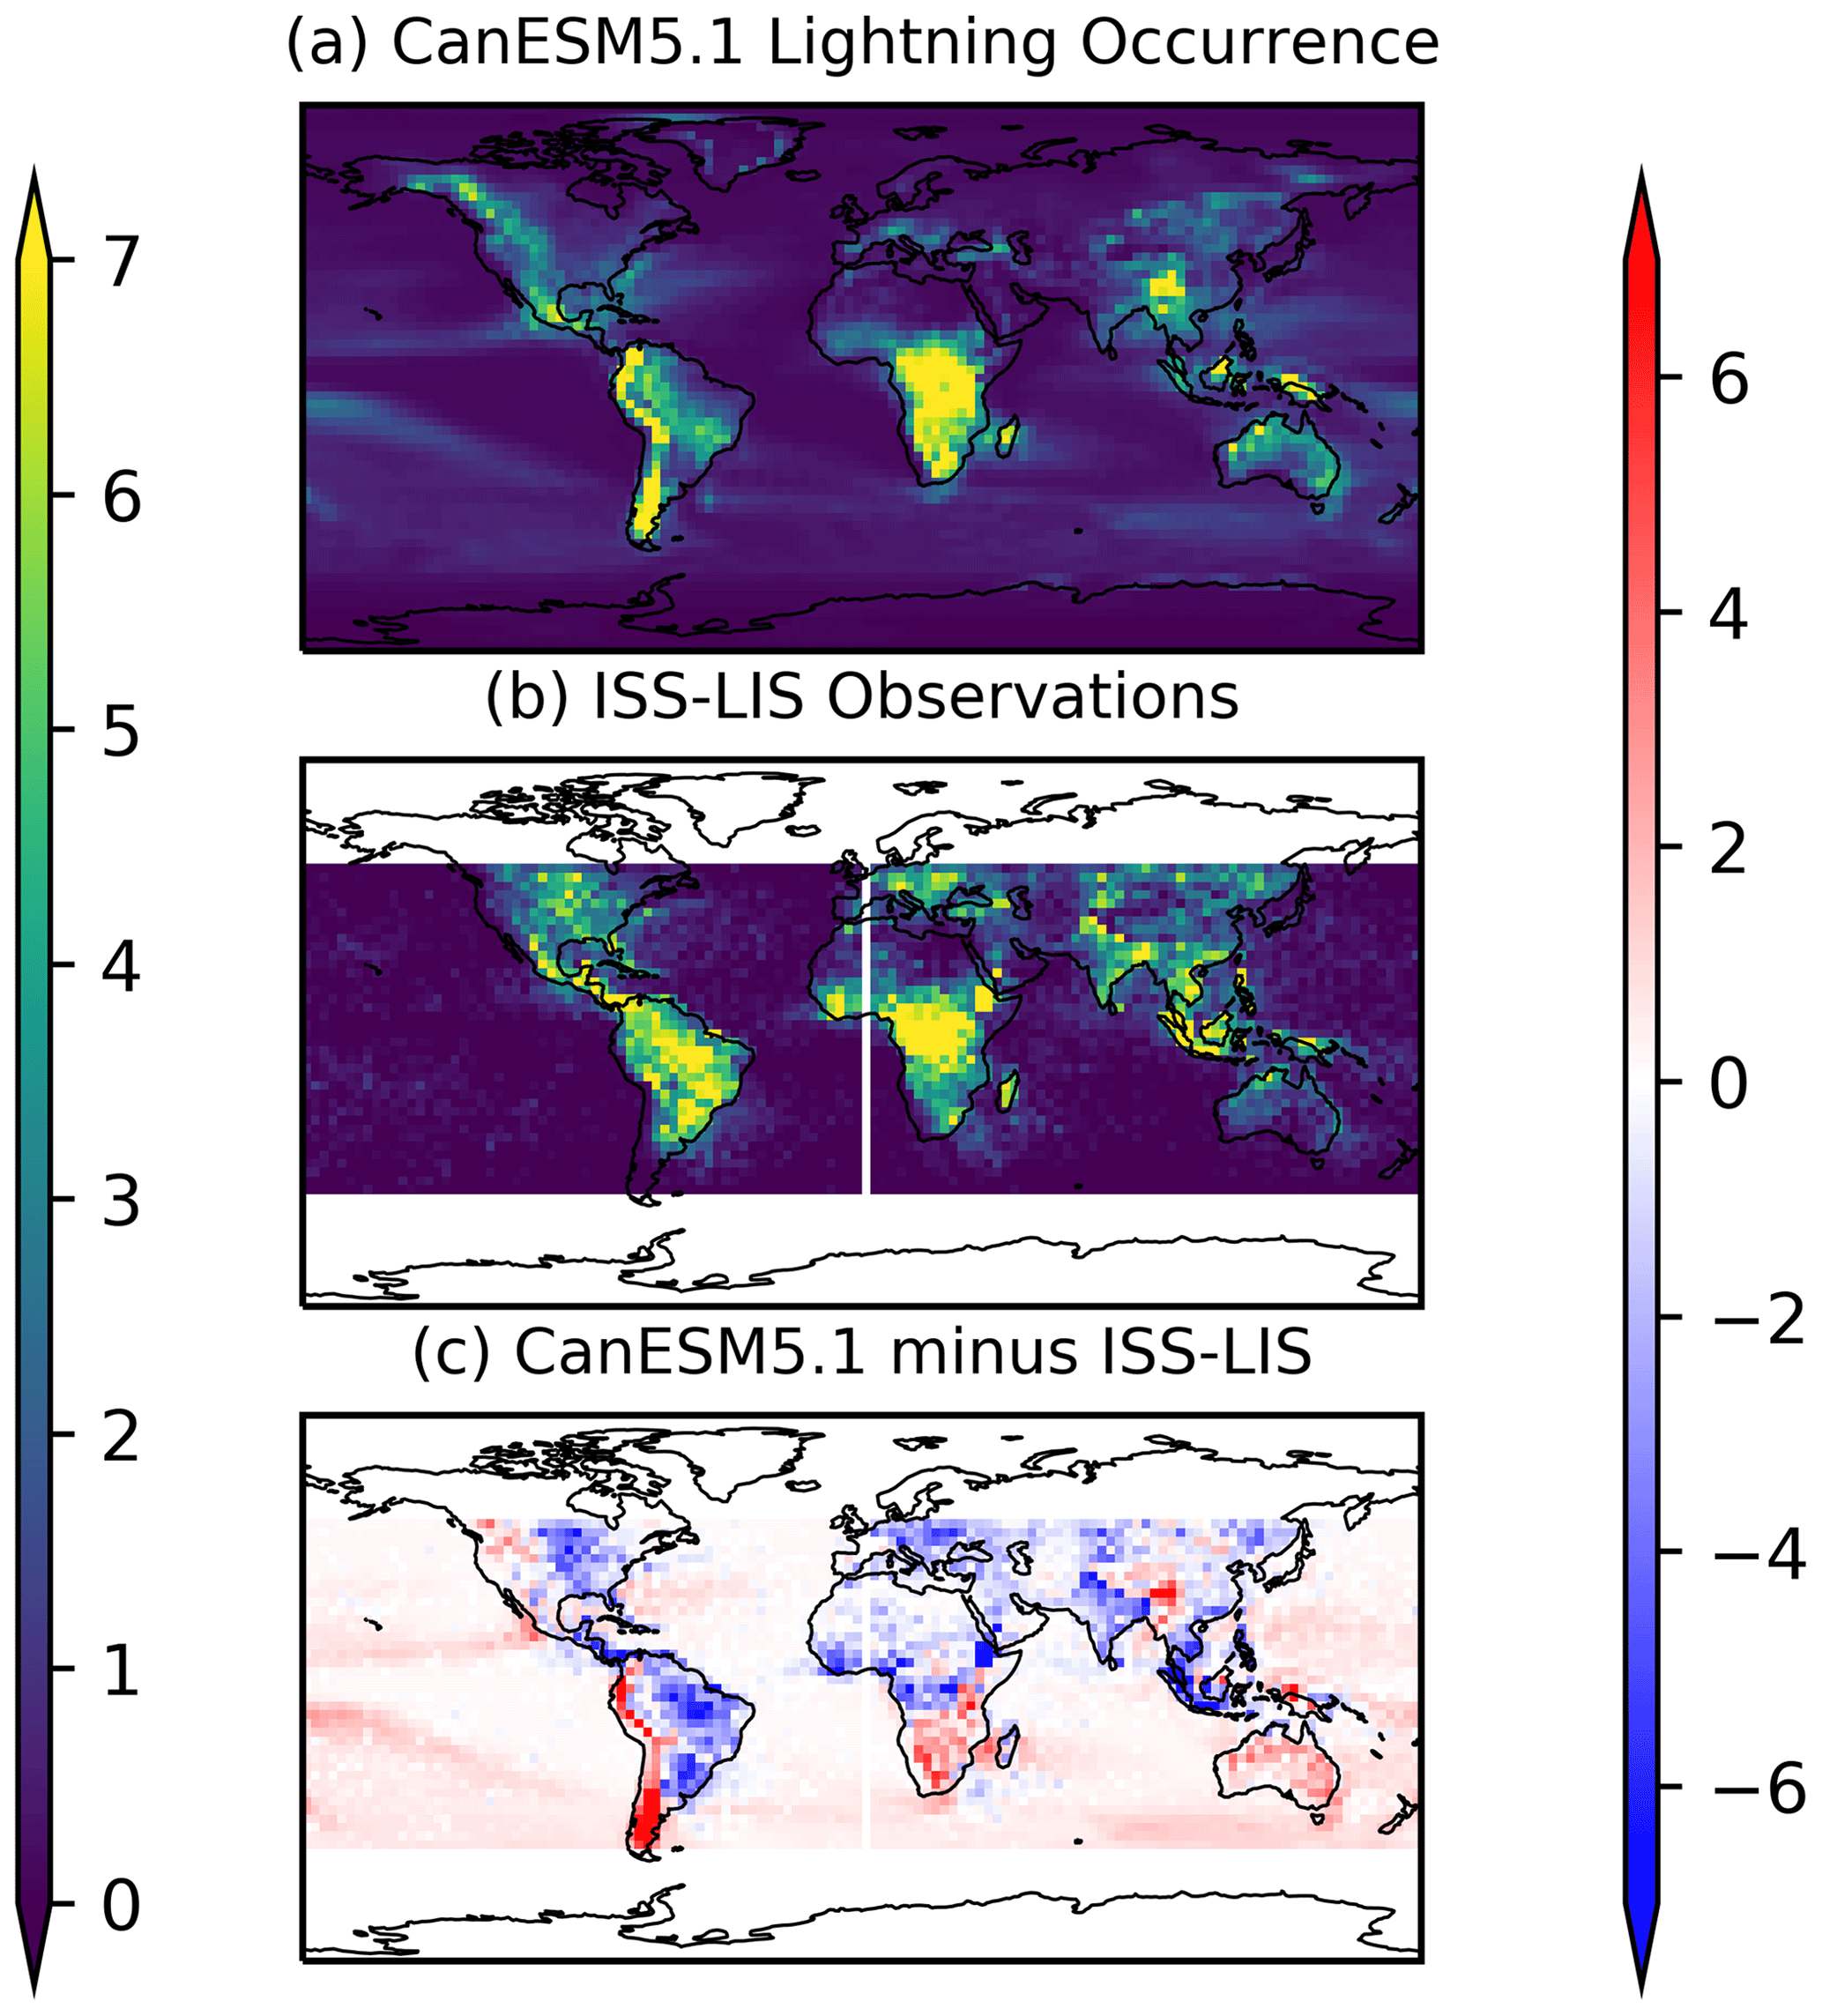
Figure 1Comparison of the 2017–2019 mean modelled-lightning occurrence from CanESM5.1 to that measured by the ISS LIS instrument and their absolute difference (all in %).
The spatial distribution of lightning occurrence shows that our model configuration results in a good land–ocean contrast for lightning, with very little lightning over the ocean. The land–ocean ratio of our modelled-lightning occurrence is 2.7 when the whole globe is considered and is 4.0 when only 54° S–54° N is considered. The latter can be more directly compared to the land–ocean ratio from ISS LIS, which is 5.0. That ratio in other models is often less than 1 (Charn and Parishani, 2021). This is already a large advantage over other lightning schemes mentioned in the Introduction and is consistent with the Etten-Bohm et al. (2024) results, where this lightning scheme was implemented in the CAM5 model.
However, over some parts of the western coasts of North and South America, the modelled lightning is significantly higher than that observed. One feature noted during development was that this lightning scheme has resulted in too much lightning over the mountains. In Etten-Bohm et al. (2021, 2024), the mountainous regions with elevation greater than 1500 m were removed from their analysis and figures. In an effort to improve this aspect, we removed the primary LCL term in Eq. (1) for model grid cells with topography elevation greater than 1500 m, and this resulted in less lightning over the North American Cordillera and over the Himalayas. The results shown in this paper include this adjustment and still have the overestimation over mountains that are >1500 m.
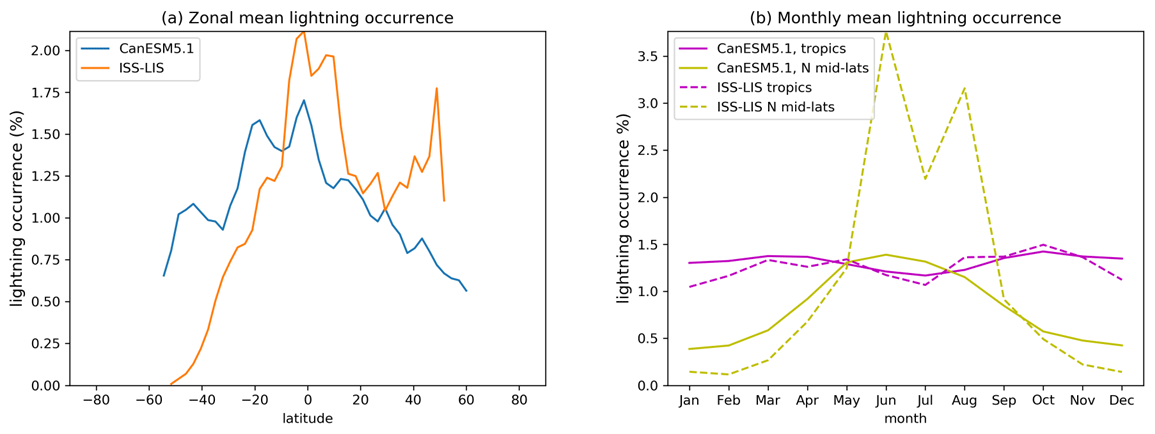
Figure 2(a) Comparison of zonal mean lightning occurrence from CanESM5.1 and that measured from ISS LIS for 2017–2019. (b) Comparison of the seasonal cycle in the lightning occurrence from CanESM5.1 (solid lines) and that measured from ISS LIS (dashed lines) for 2017–2019 in the tropics (30° S–30° N) and Northern Hemisphere mid-latitudes (30–54° N).
Conversely, the modelled lightning is biased low over the eastern half of North and South America and India. In Sect. 3.2, we will see that these low biases correspond spatially to negative biases in CAPE for the former and LCL and r for the latter. In Africa, there is a negative bias in the northern half and a positive bias in the southern half. Those regional biases are consistent with all of the CAPE, LCL, and r spatial bias patterns (Sect. 3.2). Finally, Australia has a positive bias, where LCL and r are biased positive as well. In order to improve CanESM lightning, further improvements to the underlying parameters are needed.
The zonal mean in Fig. 2a highlights that the modelled lightning is also biased high over southern latitudes and low over northern latitudes. But from about 20° S to 40° N, the zonal pattern is modelled correctly. Note that 54° S and N are the maximum bounds of the ISS LIS observations.
Finally, the regional seasonal cycles of lightning occurrence are shown in Fig. 2b for the average within defined latitude bands. We define the tropics as the mean between 30° S to 30° N and the mid-latitudes as 30 to 54° N. The modelled-lightning seasonality for the tropics is similar, with a minimum in the summertime and increases in the spring and fall. Aside from the systematic offset in the northern mid-latitude lightning occurrence, both the model and observations have a summertime peak as well, though the model peak is wider than observed. The southern mid-latitudes (not shown) have a seasonal peak in December and January and a minimum in July for both the model and measurements. Since ISS LIS cannot observe the Arctic region and the southern mid-latitudes have little land, we do not include those in Fig. 2b. We will see in the next section that the high-latitude (>75°) model results should not be considered.
3.2 Evaluation of input parameters
CanESM5.1's CAPE, LCL, and r (the lightning input parameters) are evaluated against those computed from the MERRA-2 reanalysis, with figures shown in the Supplement. CanESM5.1 underestimates CAPE (Figs. S2 and S3), except in the Southern Ocean and North Atlantic Ocean regions, where it is overestimated slightly. It is likely that the positive CAPE bias in the Southern Ocean contributes to the increased lightning in that region. The negatively biased CAPE in the tropics is also likely the reason why CanESM's lightning occurrence is biased low there too. CanAM5.1's low CAPE bias has been documented previously in Mitovski et al. (2019), where it was found to be about 3 times too low in the tropics, consistent with the findings here. However, because the environmental variables are standardized around their mean value (Sect. 2.2) before being input into the logistic regression (Eq. 1), overall biases are mitigated such that the geographical pattern and interactions between variables contain more weight in the resulting lightning prediction. Indeed, we have tested a new alternate entrainment and detrainment (AED) deep-convection scheme, which will become available in CanAM(5.2+), and found that while CAPE was greatly improved, the impact on lightning was minimal.
CanESM's LCL matches MERRA-2 LCL well (Figs. S4 and S5), while CanESM's r, the column saturation fraction, is biased high (Figs. S6 and S7) across most of the globe. The high bias in r likely compensates for the low CAPE bias, resulting in an overall global lightning occurrence that is of a reasonable magnitude. Note that r from CanESM5.1 drops greatly near the poles (>75°) when looking at the annual mean, which implies that CanAM5.1's atmosphere in polar night is too cold and dry for adequate moisture. For context, we also plot the northern summertime (June–July–August) means in Fig. S6 in order to show that when there is sunlight at the Arctic pole, r results are more reasonable there. While it is highly unlikely for lightning (and even more unlikely for natural fire ignition) to occur near the poles during polar night, we nevertheless keep this in mind when plotting the seasonal cycles and when interpreting the results in Sect. 4.1.
3.3 Lightning flash rate
The spatial distribution of the CanESM5.1 lightning flash rate compared to the LIS/OTD climatology (Fig. 3) is very similar to the model's lightning occurrence compared to the ISS LIS (Fig. 1). The RMSE is 5.8 flashes km−2 yr−1, the model-over-measurement mean ratio is 0.8, and R=0.65. These lightning evaluation results are on par with evaluations of other lightning parameterizations. For example, studies such as Tost et al. (2007), Finney et al. (2014), Gordillo-Vázquez et al. (2019), Stolz et al. (2021), and He et al. (2022) evaluated several different lightning parameterizations and found that the simulated global total lightning is often within a factor of 2–3 from that observed.
As the cloud-to-ground flash rate gets used in CanESM's wildfire ignition, this means that the burned area will be influenced by the regional biases when this lightning scheme is used.
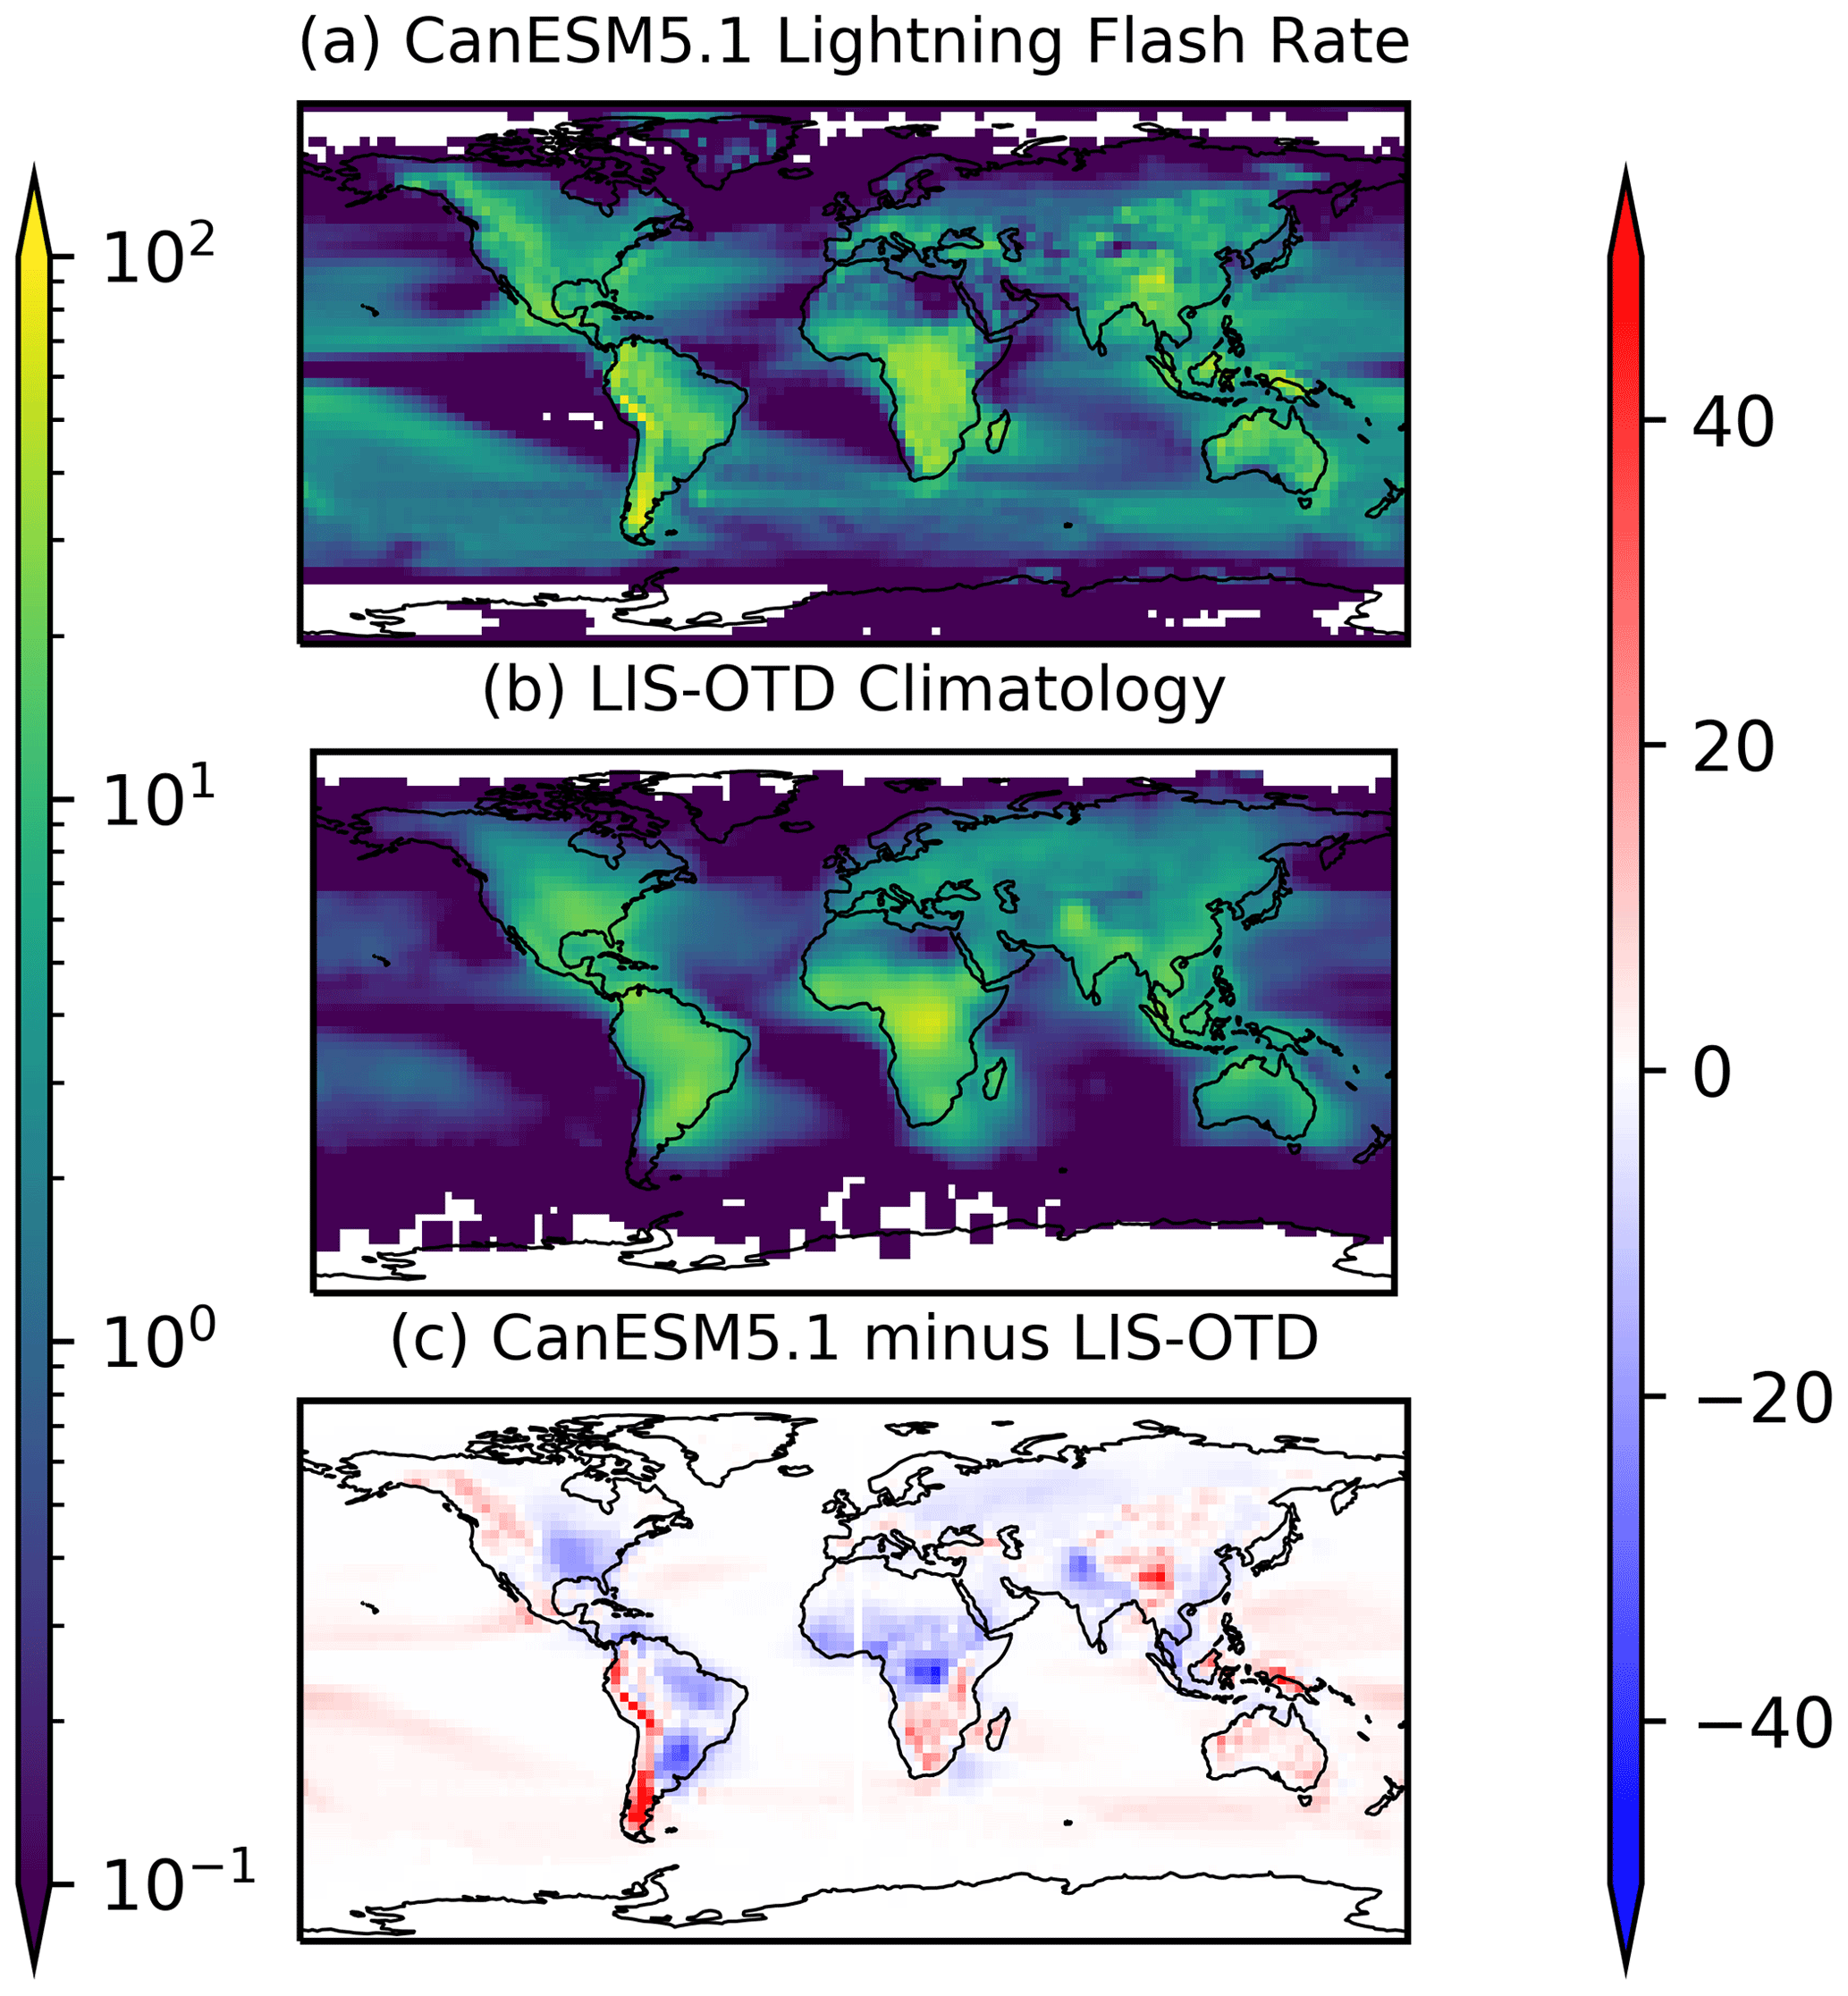
Figure 3Comparison of the 1995–2014 mean modelled-lightning flash rate to the LIS/OTD observed climatology and their difference (all in flashes km−2 yr−1).
The zonal mean shape in the lightning flash rate from LIS/OTD (Fig. 4a) is more symmetrical around the Equator than the ISS LIS lightning occurrence (Fig. 2a), with the larger difference in the Northern Hemisphere. The modelled zonal mean flash rate is similar to LIS/OTD but with a slight shift southward. However, it is important to note that LIS/OTD results are more uncertain at high latitudes, where only OTD contributes to the data product, having a smaller flash detection frequency than LIS (Boccippio et al., 2002; He et al., 2022) (Sect. 2.2.3). In addition, the global mean seasonal cycle of the modelled flash rate is centered on May–June (Fig. 4b), while the LIS/OTD flash rate peaks in August.
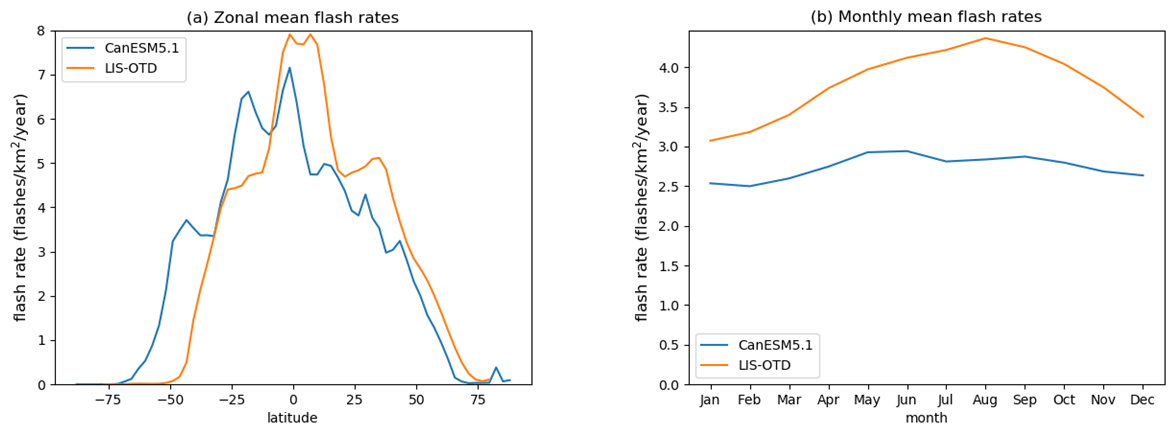
Figure 4(a) Comparison of the zonal mean flash rates and (b) seasonal cycle from CanESM (model) and the LIS/OTD observed climatology.
We can also evaluate the change in lightning that has occurred in the recent 20-year period (1995–2014) and compare it to published observation-based lightning trends. Figure 5 presents the 2012–2014 3-year average lightning minus the 1995–1997 3-year average, which shows the simulated change in lightning that occurred over this historical period. The magnitude and spatial pattern of the differences are very similar to those in observations (e.g., Qie et al., 2020). There are some regional differences in the sign compared to previous studies in northern and eastern Australia (Bates et al., 2015), the southeastern US (Qie et al., 2020), and India (Chakraborty et al., 2021). However, these studies utilized trend lines because of the significant interannual variability in the lightning parameters, so the apparent differences may be muted if we employed the same trend analysis. Further, while there are regions with increasing and decreasing lightning, the mean global change in lightning over this time period is zero, consistent with other studies (e.g., He and Sudo, 2023).
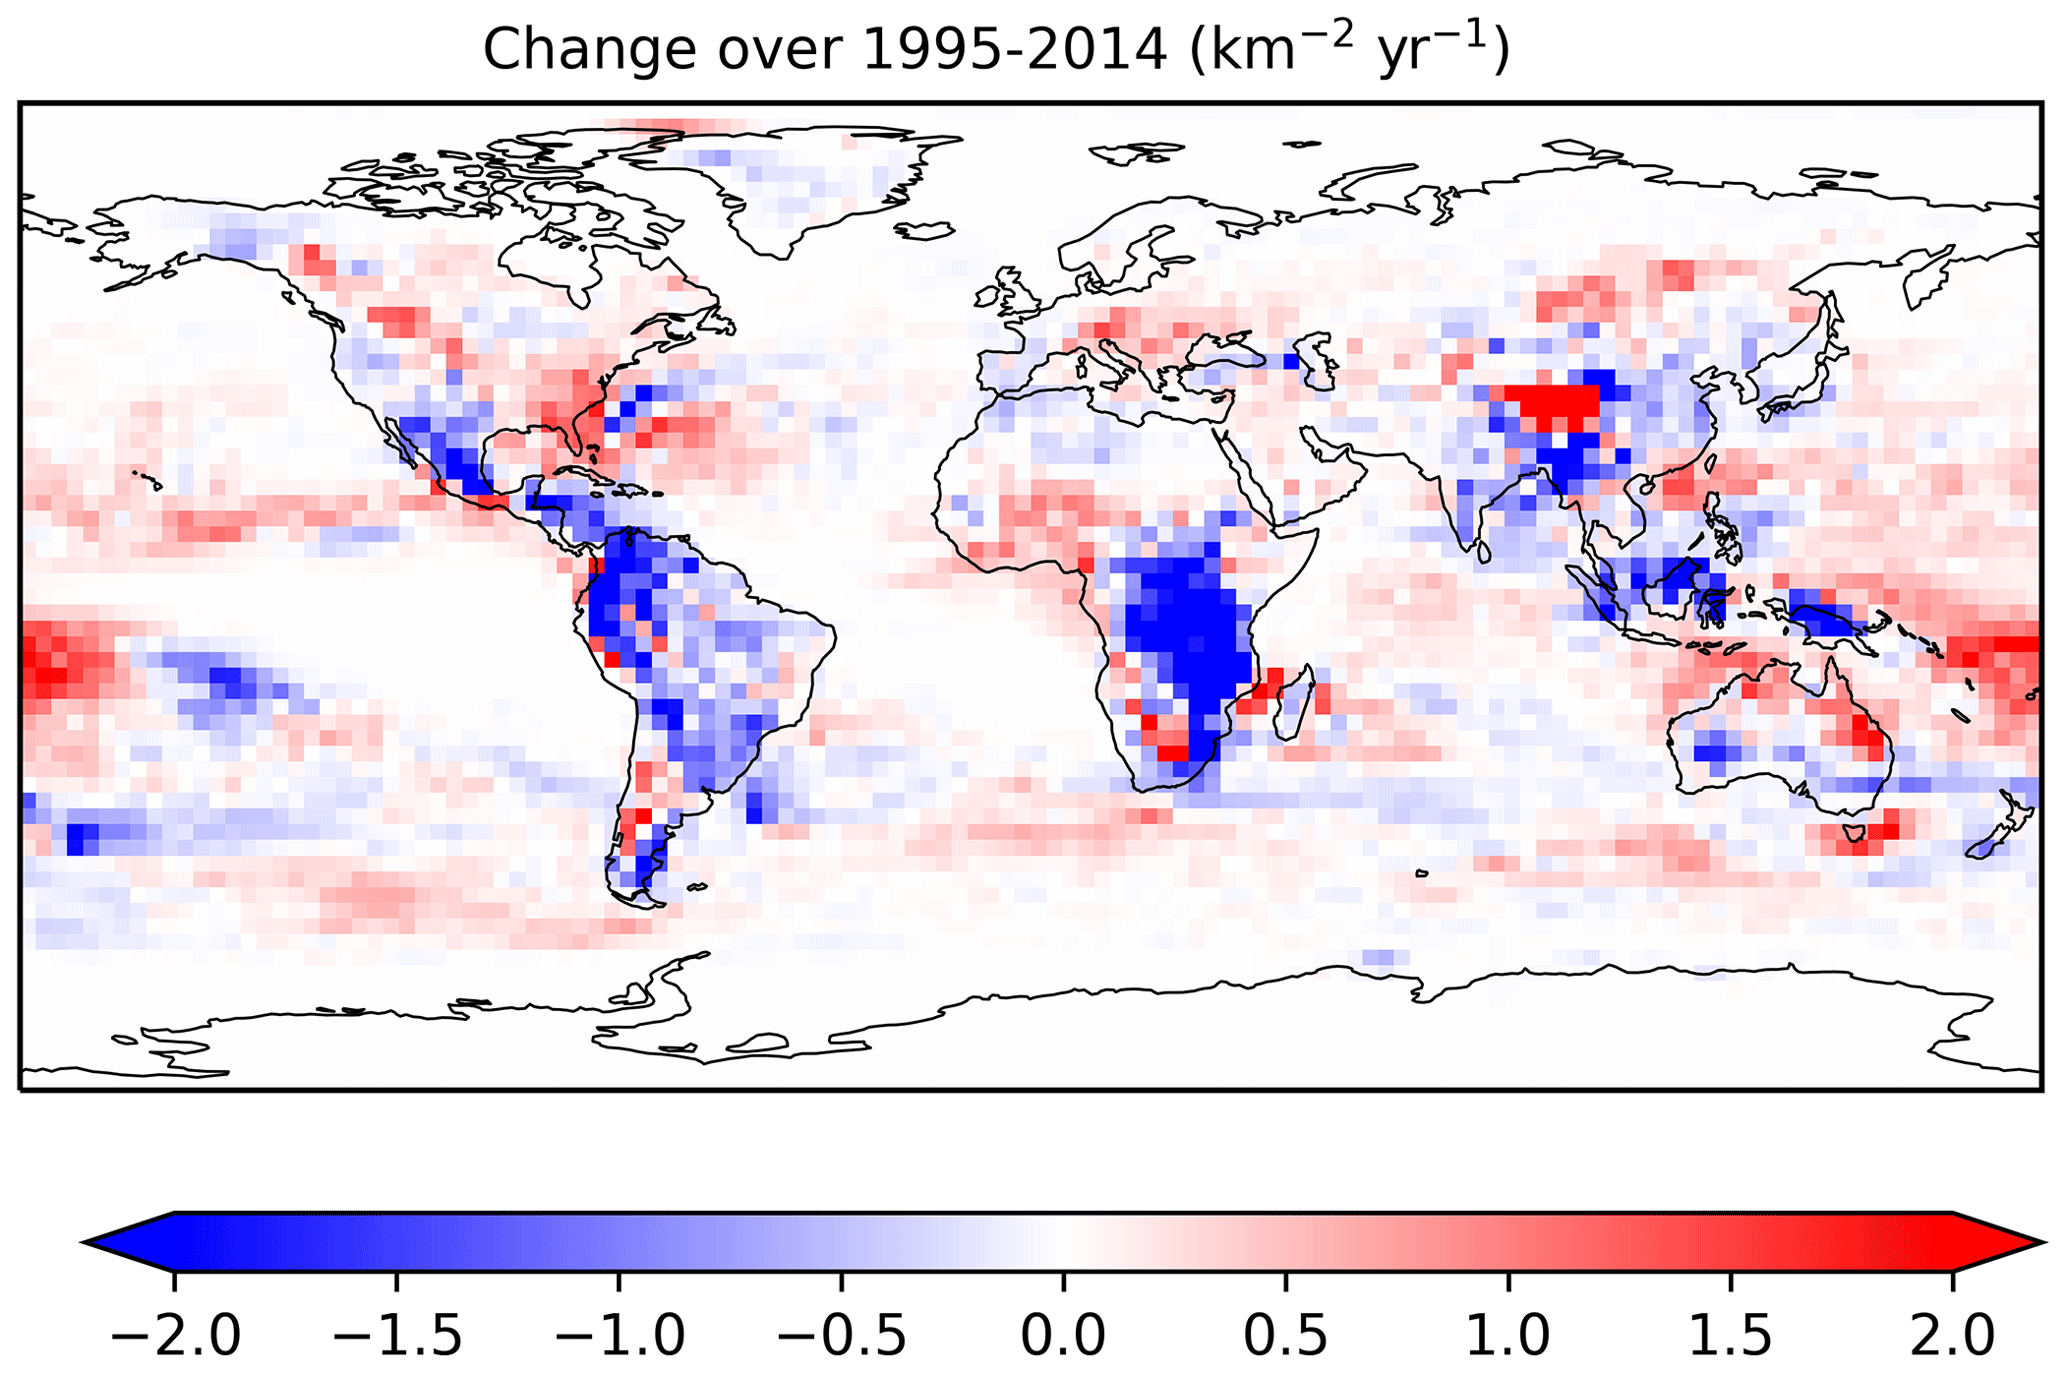
Figure 5Change in simulated lightning flash rate over 1995–2014. Map shows 2012–2014 mean minus the 1995–1997 mean.
3.4 Burned area
Similar to lightning, the modelled burned area (BA; in Mkm2) is dependent on its underlying variables, and biases in those will cause biases in BA. However, we can examine the impact of lightning options by assessing modelled BA for two different CanESM5.1 simulations: that with the Etten-Bohm et al. (2021) lightning parameterization (“interactive lightning”) and that with the unchanging monthly LIS/OTD climatological lightning (“control lightning”).
Both have the same human ignition source, with the resulting BA shown in Fig. 6a and b, respectively, and are evaluated against the MODIS Fire_cci burned-area grid product, version 5.1 (Fig. 6c). The mean global total BA for 2001–2014 is (a) 6.17 Mkm2, (b) 7.9 Mkm2, and (c) 4.72 Mkm2. For additional context, Chuvieco et al. (2018) reported an average of 3.81 Mkm2 for 2001 to 2016 for an earlier version of MODIS v5.0. Note that MODIS may underreport burned area due to missing smaller fires or missing fires that are under clouds. For example, the latest version of the Global Fire Emissions Database (GFED5), which attempts to compensate for those missing fires estimates global annual burned area to be 7.75±0.63 Mkm2 for the 2001–2020 annual mean (Chen et al., 2023), which is close to our model results.
Also note that CLASS–CTEM, CanESM5.1's land model, was evaluated along with several other vegetation models in Hantson et al. (2020), where they found that the global total simulated burned area was within the range of GFED4's observational uncertainty of 3.45–4.68 Mkm2. The results from our study show that CanESM5.1 with interactive lightning results in comparable burned area to that in Hantson et al. (2020), especially considering the large uncertainties in observationally derived BA.
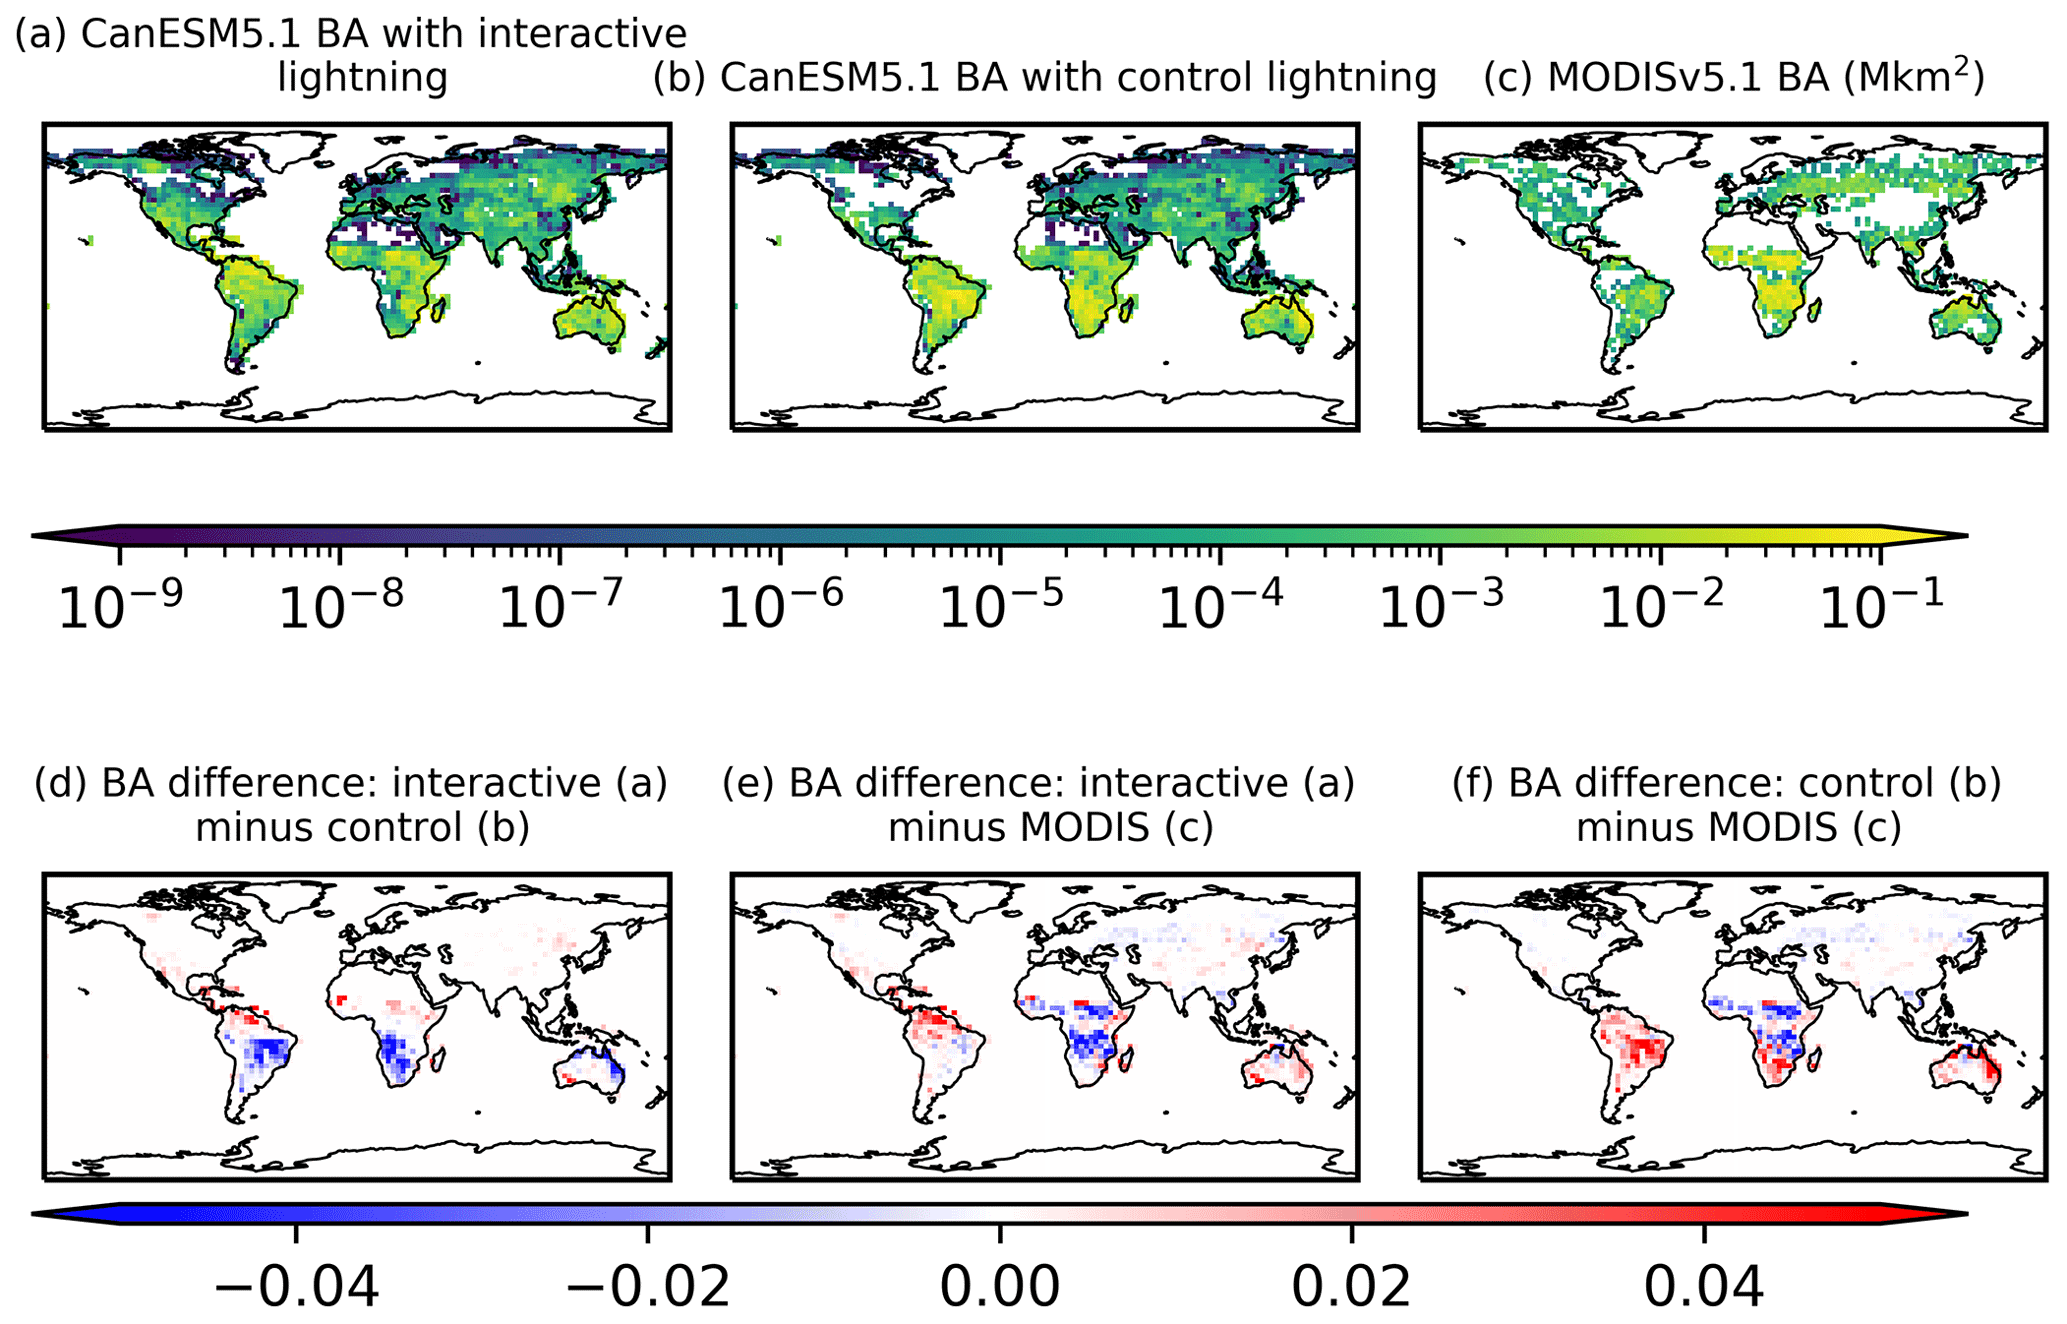
Figure 6Comparison of the 2001–2014 annual mean burned area (BA; all in Mkm2). BA from CanESM5.1 with (a) interactive lightning and (b) control lightning. (c) BA from MODIS v5.1. Note that the log colour scale has no colour when the value equals 0. Absolute difference (d) between panels (a) and (b), (e) between panels (a) and (c), and (f) between panels (b) and (c).
The bottom row of Fig. 6 highlights the regional distribution of absolute differences between BA with interactive lightning vs. BA with control lightning (Fig. 6d), as well as differences between modelled BA and the MODIS-derived BA (Fig. 6e and f). The spatial distribution of the model's over- and underestimations of BA (Fig. 6e) are only somewhat explained by the spatial distribution in modelled lightning (Fig. 3c). Other model biases are related to BA, such as temperature and soil moisture contribute, as well to the differences. Indeed, using the climatological lightning, CanESM5.1 overestimates compared to the MODIS-based BA (Fig. 6f), with high biases in South America due to known CanESM5.1 climate biases there (e.g., too dry in the Amazon, resulting in too much combustion). The lower lightning in fire-prone areas from the interactive model have a compensating effect for that.
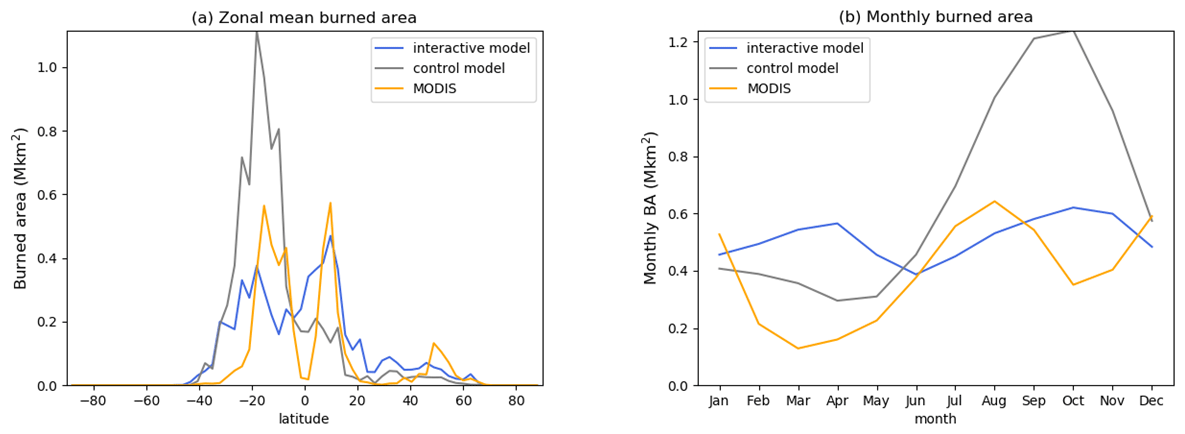
Figure 7(a) Zonal mean and (b) monthly mean comparisons of the 2001–2014 annual mean burned area (BA).
The zonal mean BA values from the interactive and control simulations and from MODIS v5.1 are shown in Fig. 7a. There we see that CanESM5.1's BA with interactive lightning has a latitudinal pattern similar to MODIS v5.1. The BA with control lightning is overestimated in the southern tropical region for climate bias reasons mentioned above. The positive bias in the tropics may also be due to the cloud-to-ground fraction in the control lightning simulation, which is set to 0.25 globally. This fraction is likely too high in the tropics (contributing to the large overestimate there) and too low at high latitudes. In newer versions of the land model (currently only available offline), a latitudinal-varying cloud-to-ground fraction, similar to that of our interactive lightning, is used. Both simulations agree better with MODIS v5.1 from about 20–60° N, where the average cloud-to-ground fraction is more applicable and more consistent between the simulations of control and interactive lightning.
Finally, the globally summed monthly mean BA is plotted in Fig. 7b to examine the seasonal cycles from the simulations and MODIS. MODIS has peaks in August and December, whereas the control simulation has just one peak around October. The interactive simulation has small peaks in April and October–November, almost opposite the measured seasonal cycle. These differences in seasonal patters are likely related to the spatial model biases and local seasonality there.
4.1 Future changes to lightning
After establishing satisfactory results for present-day lightning predictions, we now run 10-member ensembles of CanESM5.1 with the Etten-Bohm et al. (2021) lightning scheme into the future under the extreme climate change scenario, SSP5-8.5, and the more moderate scenario, SSP2-4.5. We average the last 20 years of the simulation (“future”, 2081–2100) and subtract the result from the average of the “present” 20 years (2015–2035 average) to see how lightning changes in the future climate scenarios, and these results are shown in Fig. 8. Both have similar spatial patterns in their changes, but the moderate scenario has less a pronounced decrease in the tropics. Both scenarios have increases at mid-latitudes, particularly in Siberia, the western US, and Australia. As noted in Sect. 3.1, results above 75° N are not reliable. Figures S8 to S10 in the Supplement show the future minus present changes to input parameters, CAPE, LCL, and r to better understand the regional changes to lightning that result. For example, the decrease in lightning in middle to southern African is due to both CAPE and r decreasing there in CanESM5.1.
Our spatial patterns in changes to lightning under the higher-emissions scenario are similar to those in Finney et al. (2018) and Etten-Bohm et al. (2024). The Finney et al. (2018) study used an upward ice-flux lightning parameterization, and the Etten-Bohm et al. (2024) study used the same lightning parameterization as we do (Etten-Bohm et al., 2021) but applied in the CAM5 model. The difference in our lightning results and those in those two studies are due to (a) differences in the number of years averaged in the future vs. present and (b) differences in the climate of the ESMs. All of these have impacts on future lightning projections.
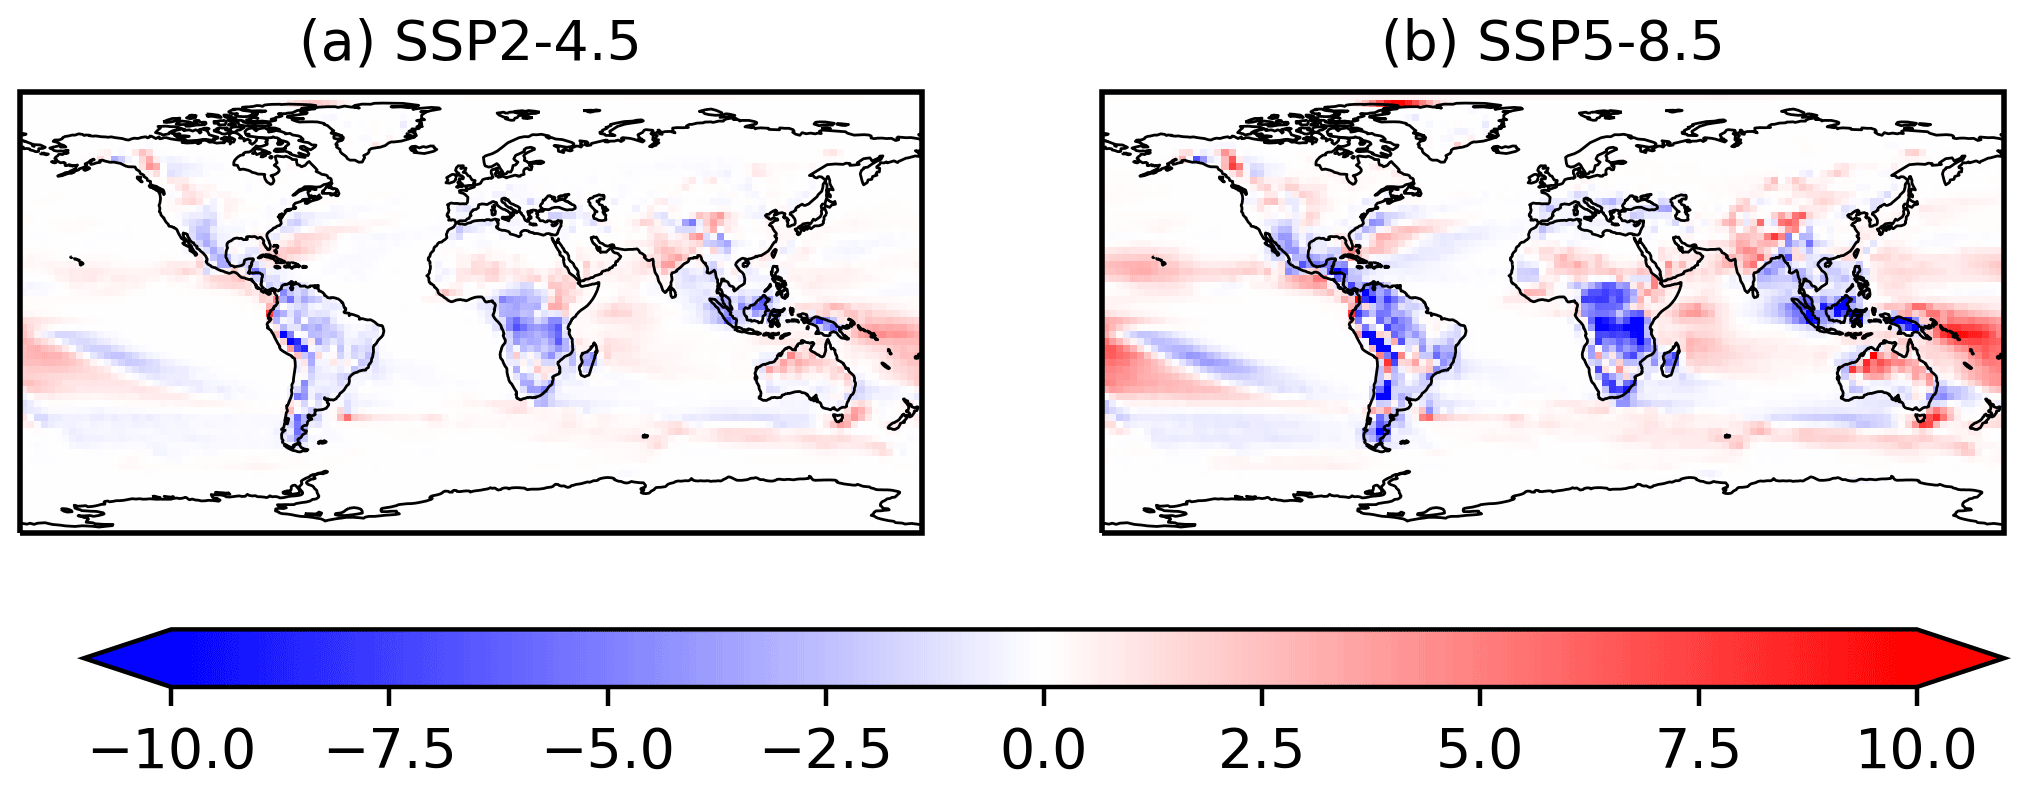
Figure 8Absolute differences in lightning flash rate (flashes km−2 yr−1): 2081–2100 average minus 2015–2035 for the SSP2-4.5 and the SSP5-8.5 scenarios.
When the regions are averaged, the differences in flash rate in the last 20 years vs. first 20 years are summarized in Table 2. Globally, we see a very small change (<1 %). Clark et al. (2017) compared the global trends in lightning flash density through the end of the century for eight different lightning parameterizations implemented in CAM5 and found changes ranging from −6.7 % to +45 % for RCP8.5, so our results fall within that range but on the lower end. Changes within latitudinal bands are more pronounced over land in the tropics, showing decreases of 4 %–8 %, and the northern mid-latitudes, showing up to a 6 % increase.
Table 2Global and regional percent differences in the future (2081–2100) minus the present (2015–2035) lightning flash rate for different climate scenarios.
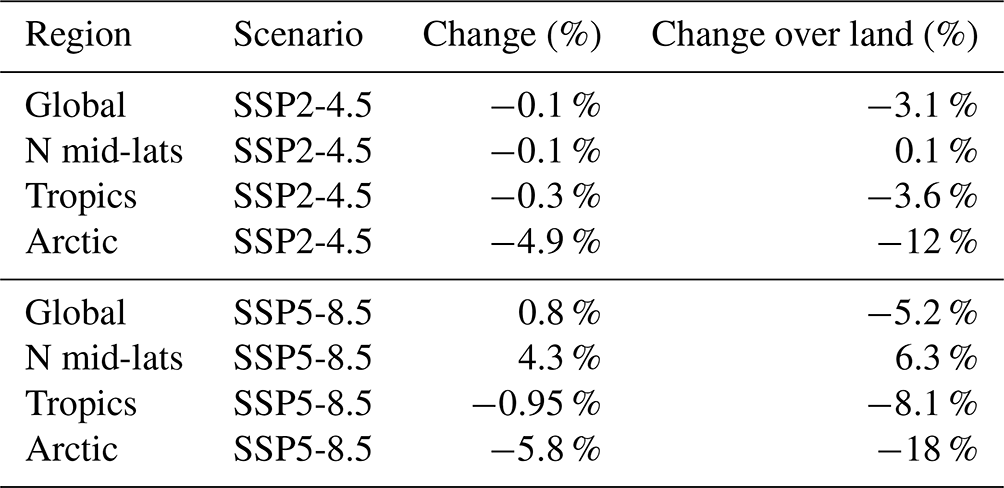
Our results also indicate decreased lightning in the Arctic (60–75° N) by −1.8 % (for 2081–2100 vs. 2015–2035) (Fig. 8). The original lightning flash rate in the Arctic was very low and decreased rapidly in the first 15 years of our simulations, followed by a slow increase from the 2030 low point. Our overall decrease in Arctic lightning is in contrast to the conclusions by Chen et al. (2021). Chen et al. (2021) used a parameterization based on the product of CAPE and surface precipitation rate to determine the lightning flash rate and highlighted the threat of fires in the Arctic region due to the combination of increased lightning and vegetation. In their study, circumpolar-region lightning increased by 112±38 % by the end of the century (2081–2100 with RCP8.5).
In the northern mid-latitudes, where lightning is increasing, we additionally examine the shift in seasonality in lightning occurrence (Fig. 9). When comparing the last 3 years (2098–2100) and recent 3 years (2017–2019), we see that the increase in lightning is mainly at the start and end of the lightning season. These shifts have implications for extending the boreal forest fire season with severe climate change.
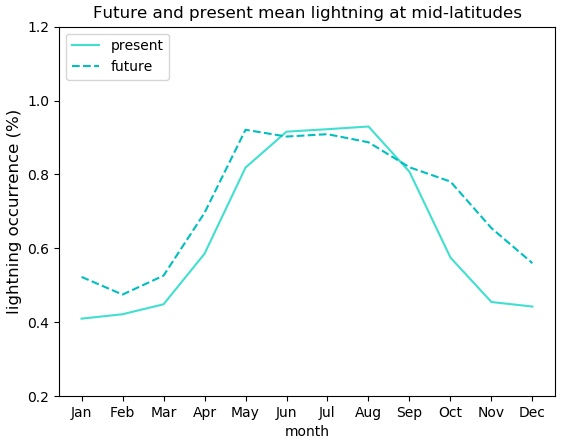
Figure 9Northern mid-latitude seasonal mean in lightning occurrence (%) in the present (solid line, 2017–2019) and future (dashed line, 2098–2100) in SSP5-8.5.
4.2 Future changes to burned area
In some parts of the world, wildfires have increased in frequency and intensity due to climate change (Flannigan et al., 2005; Hope et al., 2016; Halofsky et al., 2020; Kirchmeier-Young et al., 2019). These increases are likely to continue as temperatures rise in the future. That said, future fire emissions in the CMIP6 project were actually projected to decrease globally due to land use changes (climate influences on fire emissions not taken into account). Therefore, we examine how BA will change in the future from CanESM5.1 simulations with and without the new interactive-lightning parameterization. That is, we examine future BA ignited with evolving lightning from Sect. 4.1 vs. a lightning control run that has the unchanging, monthly climatological lightning from present day (the LIS/OTD dataset) used throughout the 2015–2100 simulation. Both simulations have the same changing climate (temperature, precipitation, moisture, land use change, etc.) and same unchanging human ignition. The differences between the two simulations are explored to see only the impact of online lightning ignition.
4.2.1 With interactive lightning
Figure 10 shows the future (2081–2100) minus present (1995–2014) annual mean BA (given as a percent of the model grid cell burned) for the moderate and extreme future climate scenarios for the evolving lightning simulation. There are distinct regional differences where BA increases or decreases. Globally, BA has a mean change of about +26 % in the SSP5-8.5 scenario and +0.7 % for SSP2-4.5.
These changes are further illustrated as a time series of BA in square kilometres (km2) in Fig. 11a. There, the total BA for the globe and over regional latitude bands are shown: the tropics (30° S–30° N) and the northern mid-latitudes (30–60° N) for both the SSP2-4.5 (dashed) and SSP5-8.5 scenarios (solid). The shading represents the standard deviation of the ensemble members.
There is a large difference between the SSP5-8.5 and the SSP2-4.5 scenario. For SSP2-4.5, the decreasing part of the global time series is likely due to the combination of reduced lightning in the tropics (Fig. 8a) with less severe warming. In SSP5-8.5, the annual global total BA is 7.8 Mkm2 in the future vs. 6.1 Mkm2 in the present. With evolving lighting, northern mid-latitude BA increases in both the SSP2-4.5 and SSP5-8.5 scenarios by 15 % and 48 %, respectively.
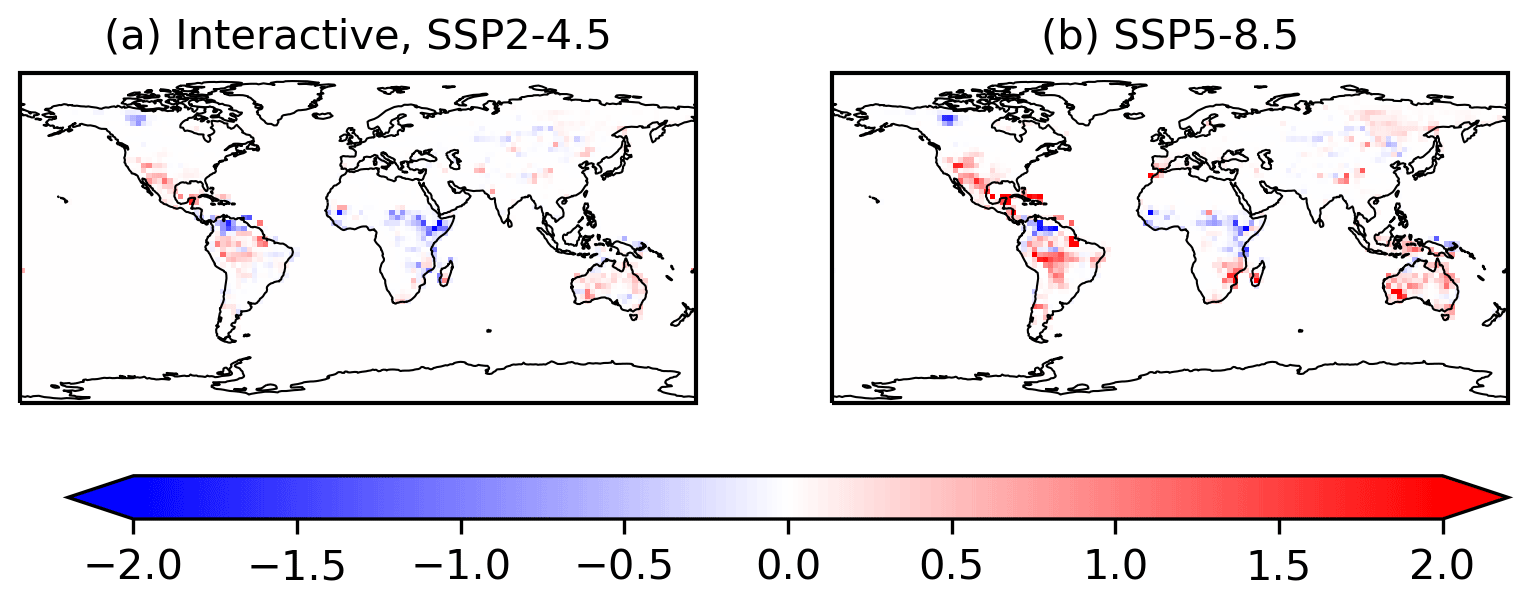
Figure 10Future (2081–2100) minus present (1995–2014) absolute differences in burned area (% of model grid cell) for the SSP2-4.5 and the SSP5-8.5 scenarios – with interactive lightning.
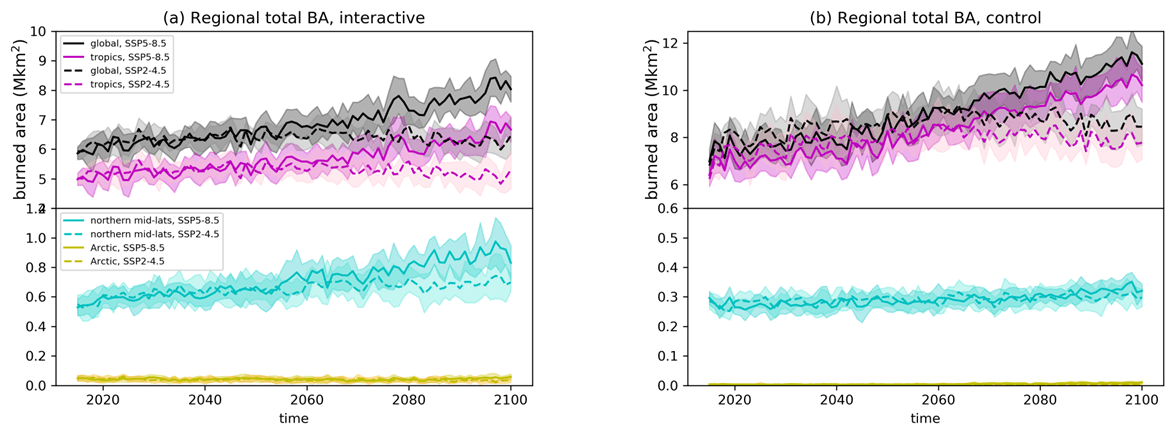
Figure 11Time series of regional and global total BA (in Mha) for the SSP2-4.5 and the SSP5-8.5 scenarios – with (a) interactive lightning and (b) control lightning. Note the different y-axis ranges.
4.2.2 With control lightning
Conversely, Fig. 12 shows the geographical patterns in BA for constant, unchanging lightning. In this case, when comparing the last 20 years to the first 20 years, the global total future annual mean BA for SSP5-8.5 (Fig. 12b) is 10.8 Mkm2 vs. a much lower 7.6 Mkm2 in the present, representing a large increase globally of +43 %. For the SSP2-4.5 control lightning simulation (Fig. 12a), there was a smaller increase in BA (+8.5 %). Figure 11 shows that the difference between SSP5-8.5 and SSP2-4.5 happens mainly from 2060 onward.
Note that with constant lightning, the change to northern mid-latitude BA is much smaller (Figs. 11b and 12), which is in contrast to the case when lightning is evolving with climate.
4.2.3 Future BA: interactive vs. control lightning
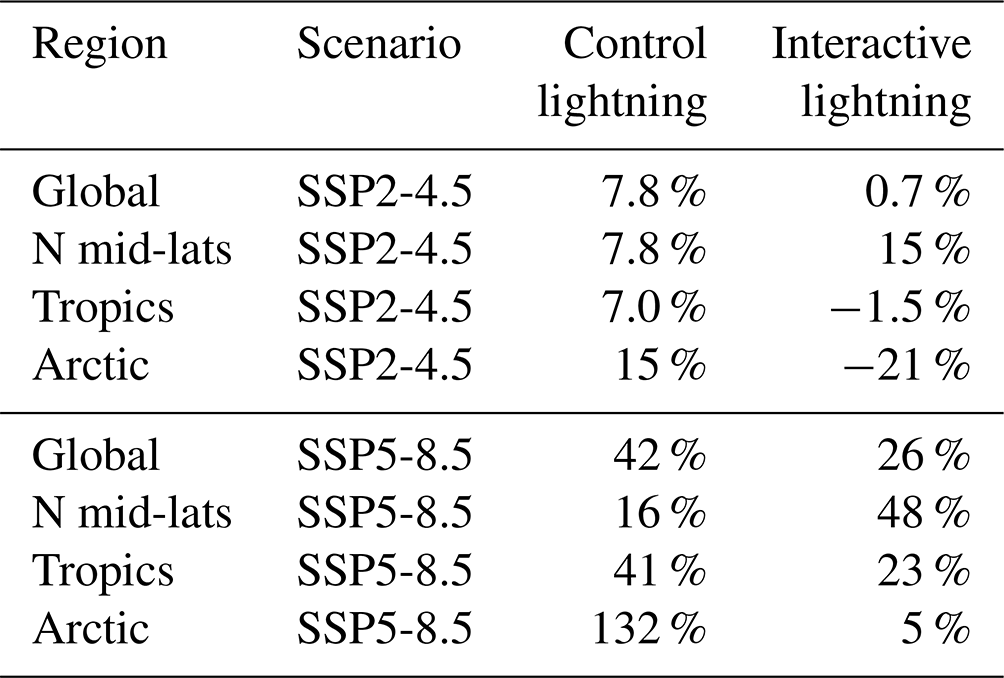
There is a large fire difference between simulations that allow lightning to evolve with climate (interactive lightning) vs. those with unchanging (control) lightning, summarized in Table 3. When lightning is allowed to evolve, lightning will decrease in parts of the tropics (e.g., Fig. 8), and thus global BA (which is dominated by the tropics) will not increase as much as when lightning is held static. For example, in SSP5-8.5, the global increase in BA is about half as much with realistically evolving lightning (26 % vs. 42 %). Conversely, the northern mid-latitude BA is significantly (2–3 times) greater with evolving lightning compared with constant lightning (Table 3).
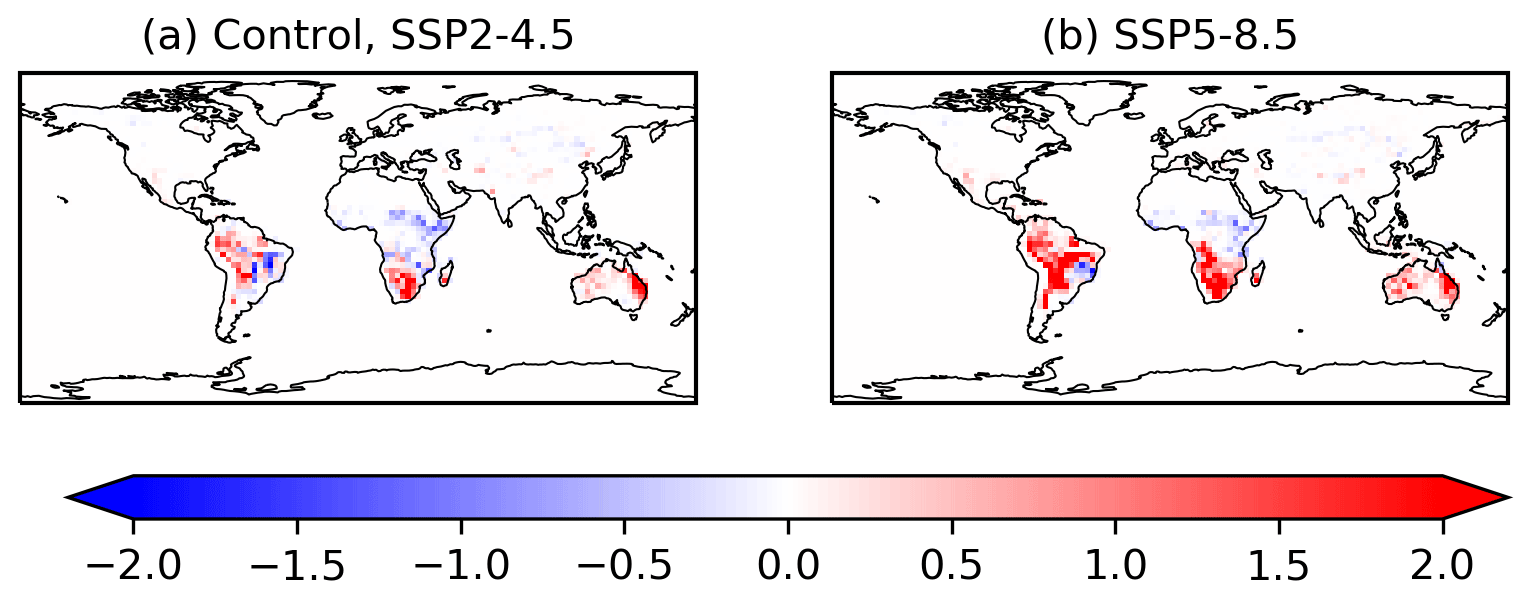
Figure 12Future (2081–2100) minus present (2015–2035) absolute differences in burned area (in % of model grid cell) for the SSP2-4.5 and the SSP5-8.5 scenarios – with unchanging lightning.
Table 3Global and regional percent differences in future (2081–2100) minus present (2015–2035) BA for different climate scenarios and different lightning.
One should expect these results to be heavily dependent on the range of years averaged and the lightning scheme used. For example, a cloud-top height lightning scheme projects lightning increasing everywhere in the future climate (Finney et al., 2018) and would thus have much greater fires simulated in the future.
This study represents the first time a lightning scheme was implemented in CanESM5.1 and the first time the CLASS–CTEM fire scheme was driven interactively with CanESM's atmospheric physics. The logistic regression lightning model b from Etten-Bohm et al. (2021) was used, as it is calculated from model environmental variables (i.e., CAPE, LCL, and r) that we have higher confidence in compared to already parameterized cloud and precipitation variables. The lightning model is just one equation that applies everywhere globally and does not require tuning. To our knowledge, CanESM5.1 is also only the second model to apply the Etten-Bohm et al. (2021) lightning parameterization (the other being CAM5 in Etten-Bohm et al., 2024).
The lightning occurrence and flash rate from CanESM5.1 were evaluated against satellite measurements, and the model produced a realistic lightning spatial distribution and magnitude, with an exceptionally good land–ocean ratio. Overestimations still occurred in mountainous regions despite removing the main LCL term from the lightning calculation to improve results. While there is little to no lightning observed in the high Arctic, our analysis of the input variables LCL and r indicate that CanESM5.1 does not have reliable results above 75° latitude.
When simulations were run out to 2100, we found that the future climate (SSP5-8.5) caused global total lightning to only change by 0.14 %. However, there is a clear decrease in lightning in the tropics (−10 %) and increase at mid-latitudes (+5 %). The latter includes the boreal forest region (40–60° N), which is becoming more susceptible to wildland fires. These changes were similar but smaller with the SSP2-4.5 scenario. The spatial pattern in future lightning changes in our study showed a response to climate warming similar to a process-based ice-flux lightning scheme from the Finney et al. (2018) study.
The applications of this new lightning scheme in CanESM5.1 allowed for a more interactive and variable distribution of burned area. Our simulations with online “evolving” lightning showed regional increases and decreases in burned area, and those results were compared to a future simulation that had offline, unchanging lightning. The results were significantly different from one another (by up to a factor of 3 at mid-latitudes), showing (a) the importance of having a realistic lightning scheme that will respond appropriately to changing climate and (b) that lightning ignition is an important climatological factor for future fire simulations, in addition to changes in temperature, precipitation, moisture, etc.
The application of this new lightning scheme in CanESM5.1 has given us the ability to have lightning changing online with CanESM climate, as well as the capability to better model tropospheric O3 in future work. We recommend continuing to use this online lightning scheme in CanAM and CanESM simulations that require comprehensive SLCF simulations. Future work will include evaluating this lightning scheme at a higher resolution (1°) with CanAM's new dynamical core, Global Environmental Multiscale (GEM), which utilizes a Yin–Yang grid and different sub-tile processing. One would expect the lightning scheme to work well at a higher resolution since it was trained on data with a 0.5° resolution (Etten-Bohm et al., 2021). We would also like to evaluate and apply this lightning scheme at an even higher resolution in the regional climate model, CanRCM (Scinocca et al., 2016), over a North American domain. Early work on this has started in offline land model, CLASSIC, using the lightning of this study as a driver of wildland fires (Curasi et al., 2024).
The LIS/OTD lightning climatology dataset can be found online at https://doi.org/10.5067/LIS/LIS-OTD/DATA311 (Cecil et al., 2014b), with additional information at https://ghrc.nsstc.nasa.gov/uso/ds_details/collections/loCv2.3.2015.html (last access: 10 April 2022). The ISS LIS datasets are available online at https://doi.org/10.5067/LIS/ISSLIS/DATA109 (Blakeslee, 2021). The MERRA-2 datasets are available online at https://gmao.gsfc.nasa.gov/reanalysis/MERRA-2/ (Global Modeling and Assimilation Office, 2017). The MODIS Fire_cci burned-area grid product v5.1 is available online at https://doi.org/10.5285/3628cb2fdba443588155e15dee8e5352 (Chuvieco et al., 2019). The CanAM5.1 model code used for this paper is available online at https://doi.org/10.5281/zenodo.12701442 (Whaley, 2024).
The supplement related to this article is available online at: https://doi.org/10.5194/gmd-17-7141-2024-supplement.
CW put the lightning scheme into CanESM5.1, did the model runs, wrote the paper, and created the figures. MEB advised on the lightning scheme and processed the ISS LIS and MERRA-2 datasets. CS advised on the lightning scheme and provided scientific guidance for this project. VA developed CanESM's land model, including its fire model, and provided modelling support. AA, JC, ML, DP, and KvS provided CanESM modelling support and guidance.
The contact author has declared that none of the authors has any competing interests.
Publisher's note: Copernicus Publications remains neutral with regard to jurisdictional claims made in the text, published maps, institutional affiliations, or any other geographical representation in this paper. While Copernicus Publications makes every effort to include appropriate place names, the final responsibility lies with the authors.
The LIS/OTD climatological dataset is provided through the NASA Earth Science Data and Information System (ESDIS) project and the Global Hydrometeorology Resource Center (GHRC) Distributed Active Archive Center (DAAC). GHRC DAAC is one of NASA's Earth Observing System Data and Information System (EOSDIS) data centers that are part of the ESDIS project.
This work was in part supported by NASA (grant no. NNX17AH66G to Texas A&M University).
This paper was edited by Tatiana Egorova and reviewed by two anonymous referees.
Ahmed, F. and Schumacher, C.: Geographical differences in the tropical precipitation-moisture relationship and rain intensity onset, Geophys. Res. Lett., 44, 1114–1122, https://doi.org/10.1002/2016GL071980, 2017. a, b
Allen, D. J. and Pickering, K. E.: Evaluation of lightning flash rate parameterizations for use in a global chemical transport model, J. Geophys. Res., 107, 4771, https://doi.org/10.1029/2002JD002066, 2002. a
Arora, V. K.: Simulating energy and carbon fluxes over winter wheat using coupled land surface and terrestrial ecosystem models, Agric. Forest Meteorol., 118, 21–47, https://doi.org/10.1016/S0168-1923(03)00073-X, 2003. a
Arora, V. K. and Boer, G. J.: A representation of variable root distribution in dynamic vegetation models, Earth Interact., 7, 19, https://doi.org/10.1175/1087-3562(2003)007<0001:AROVRD>2.0.CO;2, 2003. a
Arora, V. K. and Boer, G. J.: A parameterization of leaf phenology for the terrestrial ecosystem component of climate models, Global Change Biol., 11, 39–59, https://doi.org/10.1111/j.1365-2486.2004.00890.x, 2005. a, b
Arora, V. K. and Melton, J. R.: Reduction in global area burned and wildfire emissions since 1930s enhances carbon uptake by land, Nat. Commun., 9, 1326, https://doi.org/10.1038/s41467-018-03838-0, 2018. a, b, c
Banerjee, A., Archibald, A. T., Maycock, A. C., Telford, P., Abraham, N. L., Yang, X., Braesicke, P., and Pyle, J. A.: Lightning NOx, a key chemistry–climate interaction: impacts of future climate change and consequences for tropospheric oxidising capacity, Atmos. Chem. Phys., 14, 9871–9881, https://doi.org/10.5194/acp-14-9871-2014, 2014. a
Bates, B. C., Chandler, R. E., and Dowdy, A. J.: Estimating trends and seasonality in Australian monthly lightning flash counts, J. Geophys. Res.-Atmos., 120, 3973–3983, https://doi.org/10.1002/2014JD023011, 2015. a
Blakeslee, R. J.: NRT Lightning Imaging Sensor (LIS) on International Space Station (ISS) Science Data, NASA Global Hydrology Resource Center DAAC, Huntsville, Alabama, USA [data set], https://doi.org/10.5067/LIS/ISSLIS/DATA109, 2021. a
Blakeslee, R. J., Lang, T. J., Koshak, W. J., Buechler, D., Gatlin, P., Mach, D. M., Stano, G. T., Virts, K. S., Walker, T. D., Cecil, D. J., Ellett, W., Goodman, S. J., Harrison, S., Hawkins, D. L., Heumesser, M., Lin, H., Maskey, M., Schultz, C. J., Stewart, M., Bateman, M., Chanrion, O., and Christian, H.: Three Years of the Lightning Imaging Sensor Onboard the International Space Station: Expanded Global Coverage and Enhanced Applications, J. Geophys. Res.-Atmos., 125, e2020JD032918, https://doi.org/10.1029/2020JD032918, 2020. a
Boccippio, D. J., Koshak, W. J., and Blakeslee, R. J.: Performance Assessment of the Optical Transient Detector and Lightning Imaging Sensor. Part I: Predicted Diurnal Variability, J. Atmos. Ocean. Tech., 19, 1318–1332, https://doi.org/10.1175/1520-0426(2002)019<1318:PAOTOT>2.0.CO;2, 2002. a, b
Bretherton, C. S., Peters, M. E., and Back, L. E.: Relationships between Water Vapor Path and Precipitation over the Tropical Oceans, J. Climate, 17, 1517–1528, https://doi.org/10.1175/1520-0442(2004)017<1517:RBWVPA>2.0.CO;2, 2004. a
Cecil, D. J., Buechler, D. E., and Blakeslee, R. J.: Gridded lightning climatology from TRMM-LIS and OTD: Dataset description, Atmos. Res., 135–136, 404–414, https://doi.org/10.1016/j.atmosres.2012.06.028, 2014a. a, b
Cecil, D. J., Buechler, D., and Blakeslee, R.: LIS/OTD Gridded Lightning Climatology Data Collection, NASA Global Hydrometeorology Resource Center DAAC, Huntsville, Alabama, USA [data set], https://doi.org/10.5067/LIS/LIS-OTD/DATA311, 2014b. a
Chakraborty, R., Chakraborty, A., Basha, G., and Ratnam, M. V.: Lightning occurrences and intensity over the Indian region: long-term trends and future projections, Atmos. Chem. Phys., 21, 11161–11177, https://doi.org/10.5194/acp-21-11161-2021, 2021. a
Charn, A. B. and Parishani, H.: Predictive Proxies of Present and Future Lightning in a Superparameterized Model, J. Geophys. Res.-Atmos., 126, e2021JD035461, https://doi.org/10.1029/2021JD035461, 2021. a
Chen, Y., Romps, D. M., Seeley, J. T., Veraverbeke, S., Riley, W. J., Mekonnen, Z. A., and Randerson, J. T.: Future increases in Arctic lightning and fire risk for permafrost carbon, Nat. Clim. Change, 11, 404–410, https://doi.org/10.1038/s41558-021-01011-y, 2021. a, b, c, d
Chen, Y., Hall, J., van Wees, D., Andela, N., Hantson, S., Giglio, L., van der Werf, G. R., Morton, D. C., and Randerson, J. T.: Multi-decadal trends and variability in burned area from the fifth version of the Global Fire Emissions Database (GFED5), Earth Syst. Sci. Data, 15, 5227–5259, https://doi.org/10.5194/essd-15-5227-2023, 2023. a
Chuvieco, E., Lizundia-Loiola, J., Pettinari, M. L., Ramo, R., Padilla, M., Tansey, K., Mouillot, F., Laurent, P., Storm, T., Heil, A., and Plummer, S.: Generation and analysis of a new global burned area product based on MODIS 250 m reflectance bands and thermal anomalies, Earth Syst. Sci. Data, 10, 2015–2031, https://doi.org/10.5194/essd-10-2015-2018, 2018. a
Chuvieco, E., Pettinari, M. L., Lizundia Loiola, J., Storm, T., and Padilla Parellada, M.: ESA Fire Climate Change Initiative (Fire_cci): MODIS Fire_cci Burned Area Grid product, version 5.1, Centre for Environmental Data Analysis [data set], https://doi.org/10.5285/3628cb2fdba443588155e15dee8e5352, 2019. a
Clark, S. K., Ward, D. S., and Mahowald, N. M.: Parameterization-based uncertainty in future lightning flash density, Geophys. Res. Lett., 44, 2893–2901, https://doi.org/10.1002/2017GL073017, 2017. a, b
Cole, J. N. S., von Salzen, K., Li, J., Scinocca, J., Plummer, D., Arora, V., McFarlane, N., Lazare, M., MacKay, M., and Verseghy, D.: The Canadian Atmospheric Model version 5 (CanAM5.0.3), Geosci. Model Dev., 16, 5427–5448, https://doi.org/10.5194/gmd-16-5427-2023, 2023. a
Curasi, S., Melton, J., Arora, V., Humphreys, E., and Whaley, C. H.: Canada's wildfire future: climate change below a 2 °C global target avoids large increases in burned area by the end of the century, NPJ Climate Atmos. Sci., in review, https://doi.org/10.21203/rs.3.rs-4364877/v1, 2024. a
Etten-Bohm, M., Yang, J., Schumacher, C., and Jun, M.: Evaluating the Relationship Between Lightning and the Large-Scale Environment and its Use for Lightning Prediction in Global Climate Models, J. Geophys. Res.-Atmos., 126, e2020JD033990, https://doi.org/10.1029/2020JD033990, 2021. a, b, c, d, e, f, g, h, i, j, k, l, m, n, o
Etten-Bohm, M., Schumacher, C., Xu, Y., and Funk, A.: Projection of Global Future Lightning Occurrence using only Large-Scale Environmental Variables in CAM5, in preparation, 2024. a, b, c, d, e
Finney, D. L., Doherty, R. M., Wild, O., Huntrieser, H., Pumphrey, H. C., and Blyth, A. M.: Using cloud ice flux to parametrise large-scale lightning, Atmos. Chem. Phys., 14, 12665–12682, https://doi.org/10.5194/acp-14-12665-2014, 2014. a, b
Finney, D. L., Doherty, R. M., Wild, O., Stevenson, D. S., MacKenzie, E. A., and Blyth, A. M.: A projected decrease in lightning under climate change, Nat. Clim. Change, 8, 210–213, https://doi.org/10.1038/s41558-018-0072-6, 2018. a, b, c, d, e, f
Flannigan, M. D., Logan, K. A., Amiro, B. D., Skinner, W. R., and Stocks, B. J.: Future area burned in Canada, Clim. Change, 72, 1–16, https://doi.org/10.1007/s10584-005-5935-y, 2005. a
Global Modeling and Assimilation Office (GMAO): temperature and humidity, version 5.12.4, NASA [data set], https://goldsmr5.gesdisc.eosdis.nasa.gov/data/MERRA2/ (last access: January 2021), 2017. a
Gordillo-Vázquez, F. J., Pérez-Invernón, F. J., Huntrieser, H., and Smith, A. K.: Comparison of Six Lightning Parameterizations in CAM5 and the Impact on Global Atmospheric Chemistry, Earth Space Sci., 6, 2317–2346, https://doi.org/10.1029/2019EA000873, 2019. a
Halofsky, J. E., Peterson, D. L., and Harvey, B. J.: Changing wildfire, changing forests: The effects of climate change on fire regimes and vegetation in the Pacific Northwest, USA., Fire Ecol., 16, 4, https://doi.org/10.1186/s42408-019-0062-8, 2020. a
Hantson, S., Kelley, D. I., Arneth, A., Harrison, S. P., Archibald, S., Bachelet, D., Forrest, M., Hickler, T., Lasslop, G., Li, F., Mangeon, S., Melton, J. R., Nieradzik, L., Rabin, S. S., Prentice, I. C., Sheehan, T., Sitch, S., Teckentrup, L., Voulgarakis, A., and Yue, C.: Quantitative assessment of fire and vegetation properties in simulations with fire-enabled vegetation models from the Fire Model Intercomparison Project, Geosci. Model Dev., 13, 3299–3318, https://doi.org/10.5194/gmd-13-3299-2020, 2020. a, b
He, Y. and Sudo, K.: Historical (1960–2014) lightning and LNOx trends and their controlling factors in a chemistry–climate model, Atmos. Chem. Phys., 23, 13061–13085, https://doi.org/10.5194/acp-23-13061-2023, 2023. a
He, Y., Hoque, H. M. S., and Sudo, K.: Introducing new lightning schemes into the CHASER (MIROC) chemistry–climate model, Geosci. Model Dev., 15, 5627–5650, https://doi.org/10.5194/gmd-15-5627-2022, 2022. a, b, c, d
Hope, E. S., McKenney, D. W., Pedlar, J. H., Stocks, B. J., and Gauthier, S.: Wildfire suppression costs for Canada under a changing climate, PLOS ONE, 11, e0157425, https://doi.org/10.1371/journal.pone.0157425, 2016. a
Hui, J. and Hong, L.: Projected Changes in NOx Emissions from Lightning as a Result of 2000–2050 Climate Change, Atmos. Ocean. Sci. Lett., 6, 284–289, https://doi.org/10.3878/j.issn.1674-2834.13.0042, 2013. a
Janssen, T., Jones, M., and Finney, D.: Extratropical forests increasingly at risk due to lightning fires, Nat. Geosci., 16, 1136–1144, https://doi.org/10.1038/s41561-023-01322-z, 2023. a
Jensen, J. D., Thurman, J., and Vincent, A. L.: Lightning Injuries, in: StatPearls, Treasure Island (FL), StatPearls Publishing, https://www.ncbi.nlm.nih.gov/books/NBK441920/ (last access: 17 September 2024), 2024. a
Kirchmeier-Young, M. C., Gillett, N. P., Zwiers, F. W., Cannon, A. J., and Anslow, F. S.: Attribution of the Influence of Human-Induced Climate Change on an Extreme Fire Season, Earth's Future, 7, 2–10, https://doi.org/10.1029/2018EF001050, 2019. a
Krause, A., Kloster, S., Wilkenskjeld, S., and Paeth, H.: The sensitivity of global wildfires to simulated past, present, and future lightning frequency, J. Geophys. Res.-Biogeo., 119, 312–322, https://doi.org/10.1002/2013JG002502, 2014. a
Li, F., Val Martin, M., Andreae, M. O., Arneth, A., Hantson, S., Kaiser, J. W., Lasslop, G., Yue, C., Bachelet, D., Forrest, M., Kluzek, E., Liu, X., Mangeon, S., Melton, J. R., Ward, D. S., Darmenov, A., Hickler, T., Ichoku, C., Magi, B. I., Sitch, S., van der Werf, G. R., Wiedinmyer, C., and Rabin, S. S.: Historical (1700–2012) global multi-model estimates of the fire emissions from the Fire Modeling Intercomparison Project (FireMIP), Atmos. Chem. Phys., 19, 12545–12567, https://doi.org/10.5194/acp-19-12545-2019, 2019. a
Lizundia-Loiola, J., Otón, G., Ramo, R., and Chuvieco, E.: A spatio-temporal active-fire clustering approach for global burned area mapping at 250 m from MODIS data, Remote Sens. Environ., 236, 111493, https://doi.org/10.1016/j.rse.2019.111493, 2020. a
Lopez, P.: A lightning parameterization for the ECMWF Integrated Forecasting System, Mon. Weather Rev., 114, 3057–3075, https://doi.org/10.1175/MWR-D-16-0026.1, 2016. a, b
Madec, G. and the NEMO team: NEMO ocean engine, version3.4, vol. 27, 2012. a
McCaul, E. W., Goodman, S. J., LaCasse, K. M., and Cecil, D. J.: Forecasting Lightning Threat Using Cloud-Resolving Model Simulations, Weather Forecast., 24, 709–729, https://doi.org/10.1175/2008WAF2222152.1, 2009. a, b
Mills, B., Unrau, D., Pentelow, L., and Spring, K.: Assessment of lightning-related damage and disruption in Canada, Nat. Hazards, 52, 481–499, https://doi.org/10.1007/s11069-009-9391-2, 2010. a
Mitovski, T., Cole, J. N. S., McFarlane, N. A., von Salzen, K., and Zhang, G. J.: Convective response to large-scale forcing in the tropical western Pacific simulated by spCAM5 and CanAM4.3, Geosci. Model Dev., 12, 2107–2117, https://doi.org/10.5194/gmd-12-2107-2019, 2019. a
Murray, L. T., Jacob, D. J., Logan, J. A., Hudman, R. C., and Koshak, W. J.: Optimized regional and interannual variability of lightning in a global chemical transport model constrained by LIS/OTD satellite data, J. Geophys. Res., 117, D20307, https://doi.org/10.1029/2012JD017934, 2012. a, b
Price, C. and Rind, D.: A simple lightning parameterization for calculating global lightning distributions, J. Geophys. Res.-Atmos., 97, 9919–9933, https://doi.org/10.1029/92JD00719, 1992. a
Price, C. and Rind, D.: What determines the cloud-to-ground lightning fraction in thunderstorms?, Geophys. Res. Lett., 20, 463–466, https://doi.org/10.1029/93GL00226, 1993. a, b
Price, C. G.: Lightning Applications in Weather and Climate Research, Surv. Geophys., 34, 755–767, https://doi.org/10.1007/s10712-012-9218-7, 2013. a
Qie, K., Tian, W., Wang, W., Wu, X., Yuan, T., Tian, H., Luo, J., Zhang, R., and Wang, T.: Regional trends of lightning activity in the tropics and subtropics, Atmos. Res., 243, 104960, https://doi.org/10.1016/j.atmosres.2020.104960, 2020. a, b
Riahi, K., van Vuuren, D. P., Kriegler, E., Edmonds, J., O’Neill, B. C., Fujimori, S., Bauer, N., Calvin, K., Dellink, R., Fricko, O., Lutz, W., Popp, A., Cuaresma, J. C., KC, S., Leimbach, M., Jiang, L., Kram, T., Rao, S., Emmerling, J., Ebi, K., Hasegawa, T., Havlik, P., Humpenöder, F., Da Silva, L. A., Smith, S., Stehfest, E., Bosetti, V., Eom, J., Gernaat, D., Masui, T., Rogelj, J., Strefler, J., Drouet, L., Krey, V., Luderer, G., Harmsen, M., Takahashi, K., Baumstark, L., Doelman, J. C., Kainuma, M., Klimont, Z., Marangoni, G., Lotze-Campen, H., Obersteiner, M., Tabeau, A., and Tavoni, M.: The Shared Socioeconomic Pathways and their energy, land use, and greenhouse gas emissions implications: An overview, Global Environmental Change, 42, 153–168, https://doi.org/10.1016/j.gloenvcha.2016.05.009, 2017. a
Romps, D. M., Seeley, J. T., Vollaro, D., and Molinari, J.: Projected increase in lightning strikes in the United States due to global warming, Science, 346, 851–854, https://doi.org/10.1126/science.1259100, 2014. a
Romps, D. M., Charn, A. B., Holzworth, R. H., Lawrence, W. E., Molinari, J., and Vollaro, D.: CAPE Times P Explains Lightning Over Land But Not the Land-Ocean Contrast, Geophys. Res. Lett., 45, 12,623–12,630, https://doi.org/10.1029/2018GL080267, 2018. a, b
Scinocca, J. F., Kharin, V. V., Jiao, Y., Qian, M. W., Lazare, M., Solheim, L., Flato, G. M., Biner, S., Desgagne, M., and Dugas, B.: Coordinated Global and Regional Climate Modeling, J. Climate, 29, 17–35, https://doi.org/10.1175/JCLI-D-15-0161.1, 2016. a
Sigmond, M., Anstey, J., Arora, V., Digby, R., Gillett, N., Kharin, V., Merryfield, W., Reader, C., Scinocca, J., Swart, N., Virgin, J., Abraham, C., Cole, J., Lambert, N., Lee, W.-S., Liang, Y., Malinina, E., Rieger, L., von Salzen, K., Seiler, C., Seinen, C., Shao, A., Sospedra-Alfonso, R., Wang, L., and Yang, D.: Improvements in the Canadian Earth System Model (CanESM) through systematic model analysis: CanESM5.0 and CanESM5.1, Geosci. Model Dev., 16, 6553–6591, https://doi.org/10.5194/gmd-16-6553-2023, 2023. a
Stolz, D. C., Rutledge, S. A., and Pierce, J. R.: Simultaneous influences of thermodynamics and aerosols on deep convection and lightning in the tropics, J. Geophys. Res.-Atmos., 120, 6207–6231, https://doi.org/10.1002/2014JD023033, 2015. a
Stolz, D. C., Bilsback, K. R., Pierce, J. R., and Rutledge, S. A.: Evaluating Empirical Lightning Parameterizations in Global Atmospheric Models, J. Geophys. Res.-Atmos., 126, e2020JD033695, https://doi.org/10.1029/2020JD033695, 2021. a
Swart, N. C., Cole, J. N. S., Kharin, V. V., Lazare, M., Scinocca, J. F., Gillett, N. P., Anstey, J., Arora, V., Christian, J. R., Hanna, S., Jiao, Y., Lee, W. G., Majaess, F., Saenko, O. A., Seiler, C., Seinen, C., Shao, A., Sigmond, M., Solheim, L., von Salzen, K., Yang, D., and Winter, B.: The Canadian Earth System Model version 5 (CanESM5.0.3), Geosci. Model Dev., 12, 4823–4873, https://doi.org/10.5194/gmd-12-4823-2019, 2019. a, b
Tost, H., Jöckel, P., and Lelieveld, J.: Lightning and convection parameterisations – uncertainties in global modelling, Atmos. Chem. Phys., 7, 4553–4568, https://doi.org/10.5194/acp-7-4553-2007, 2007. a, b
Uman, M. A.: Chapter 8, in: All about lightning, Dover Publications, New York, ISBN 9780486252377, 1986. a
Verseghy, D. L.: Class-A Canadian land surface scheme for GCMS. I. Soil model, Int. J. Climatol., 11, 111–133, https://doi.org/10.1002/joc.3370110202, 1991. a
Verseghy, D. L.: The Canadian land surface scheme (CLASS): Its history and future, Atmosphere-Ocean, 38, 1–13, https://doi.org/10.1080/07055900.2000.9649637, 2000. a
Verseghy, D. L., McFarlane, N. A., and Lazare, M.: Class-A Canadian land surface scheme for GCMS, II. Vegetation model and coupled runs, Int. J. Climatol., 13, 347–370, https://doi.org/10.1002/joc.3370130402, 1993. a
Whaley, C.: CanAM5.1 with lightning parameterization, Zenodo [code], https://doi.org/10.5281/zenodo.12701442, 2024. a
Williams, E.: Lightning and climate: A review, Atmos. Res., 76, 272–287, https://doi.org/10.1016/j.atmosres.2004.11.014, 2005. a
Williams, E. and Stanfill, S.: The physical origin of the land-ocean contrast in lightning activity, Comptes Rendus Physique, 3, 1277–1292, https://doi.org/10.1016/S1631-0705(02)01407-X, 2002. a
Zeng, G., Pyle, J. A., and Young, P. J.: Impact of climate change on tropospheric ozone and its global budgets, Atmos. Chem. Phys., 8, 369–387, https://doi.org/10.5194/acp-8-369-2008, 2008. a