the Creative Commons Attribution 4.0 License.
the Creative Commons Attribution 4.0 License.
 | 30 Aug 2024
Development of a plant carbon–nitrogen interface coupling framework in a coupled biophysical-ecosystem–biogeochemical model (SSiB5/TRIFFID/DayCent-SOM v1.0)
Zheng Xiang
Melannie D. Hartman
William J. Parton
Plant and microbial nitrogen (N) dynamics and N availability regulate the photosynthetic capacity and capture, allocation, and turnover of carbon (C) in terrestrial ecosystems. Studies have shown that a wide divergence in representations of N dynamics in land surface models leads to large uncertainties in the biogeochemical cycle of terrestrial ecosystems and then in climate simulations as well as the projections of future trajectories. In this study, a plant C–N interface coupling framework is developed and implemented in a coupled biophysical-ecosystem–biogeochemical model (SSiB5/TRIFFID/DayCent-SOM v1.0). The main concept and structure of this plant C–N framework and its coupling strategy are presented in this study. This framework takes more plant N-related processes into account. The dynamic ratio (CNR) for each plant functional type (PFT) is introduced to consider plant resistance and adaptation to N availability to better evaluate the plant response to N limitation. Furthermore, when available N is less than plant N demand, plant growth is restricted by a lower maximum carboxylation capacity of RuBisCO (Vc,max), reducing gross primary productivity (GPP). In addition, a module for plant respiration rates is introduced by adjusting the respiration with different rates for different plant components at the same N concentration. Since insufficient N can potentially give rise to lags in plant phenology, the phenological scheme is also adjusted in response to N availability. All these considerations ensure a more comprehensive incorporation of N regulations to plant growth and C cycling. This new approach has been tested systematically to assess the effects of this coupling framework and N limitation on the terrestrial carbon cycle. Long-term measurements from flux tower sites with different PFTs and global satellite-derived products are employed as references to assess these effects. The results show a general improvement with the new plant C–N coupling framework, with more consistent emergent properties, such as GPP and leaf area index (LAI), compared to the observations. The main improvements occur in tropical Africa and boreal regions, accompanied by a decrease in the bias in global GPP and LAI by 16.3 % and 27.1 %, respectively.
- Article
(7962 KB) - Full-text XML
- BibTeX
- EndNote


Land surface processes substantially affect climate (Foley et al., 1998; Ma et al., 2013; Sellers et al., 1986; Xue et al., 2004, 2010, 2022) and are influenced by climate in turn (Bonan, 2008; Liu et al., 2019, 2020; Zhang et al., 2015), forming complex feedback loops with climate change (Friedlingstein et al., 2006; Gregory et al., 2009). To study these processes, the land surface components of Earth system models (ESMs) have evolved from those that represent only physical processes (i.e., hydrology and the energy cycle) to those that include the terrestrial carbon (C) cycle, vegetation dynamics, and nutrient processes (Cox, 2001; Dan et al., 2020; Foley et al., 1998; Oleson et al., 2013; Sellers et al., 1996; Sitch et al., 2003; Wang et al., 2010; Zhan et al., 2003).
Current land surface models (LSMs), however, have large uncertainties in predicting historical and C exchanges (Beer et al., 2010; Kou-Giesbrecht et al., 2023; Richardson et al., 2012), and the dynamic vegetation models tend to overestimate terrestrial C sequestration (Anav et al., 2015; Heikkinen et al., 2021; Murray-Tortarolo et al., 2013; Oliveira et al., 2021). The uncertainty and errors in predictions using land models have been attributed to many factors. The parameterization of some processes has been criticized for being oversimplified from an ecological point of view (Ali et al., 2015; Lawrence et al., 2019; Reich et al., 2006). The inclusion or exclusion of nutrient limitations on productivity is one of the critical factors. The C-only models ignore significant nitrogen (N) impacts and therefore overestimate C sequestration by terrestrial ecosystems under climate change (Peñuelas et al., 2013; Zaehle et al., 2015). Ecosystem N-cycling processes are among the dominant drivers of terrestrial C–climate interactions through their impacts, mainly N limitation, on vegetation growth and productivity (Reich et al., 2006), especially in N-poor younger soils at high latitudes (LeBauer and Treseder, 2008; Vitousek and Howarth, 1991), and on microbial decomposition of organic matter (Hu et al., 2001). As such, the N cycle and its effect on C uptake in the terrestrial biosphere have been incorporated into LSMs of ESMs (Davies-Barnard et al., 2020; Kou-Giesbrecht et al., 2023) with various representations of N processes (Ali et al., 2015; Asaadi et al., 2021; Ghimire et al., 2016; Goll et al., 2017; Lawrence et al., 2019; Oleson et al., 2013; Smith et al., 2014; Thum et al., 2019; Wiltshire et al., 2021).
The fundamental aspects of N cycling for terrestrial biosphere models, such as N limitation of vegetation growth, strategies in which vegetation invests C to increase the N supply under N-limited conditions, and N limitation of decomposition, have been identified as important challenges for representing N cycling in terrestrial biosphere models (Meyerholt et al., 2020; Peng et al., 2020; Zaehle et al., 2015). Several parameterizations have been developed in LSMs with various complexities to determine the effects of N limitation. These methods include, for instance, using leaf N availability to scale down the photosynthesis parameter Vc,max (Ghimire et al., 2016; Zaehle et al., 2015) or potential GPP (Gerber et al., 2010; Oleson et al., 2013; Wang et al., 2010), defining the energetic cost of N uptake (J. B. Fisher et al., 2010) and optimizing N allocation for leaf processes (Ali et al., 2015). There are a wide variety of assumptions about and formulations of N-cycling processes and C–N coupling in land models. Furthermore, in the latest Coupled Model Intercomparison Project Phase 6 (CMIP6; Eyring et al., 2016), although there were 112 different coupled ESMs with various land surface models from 33 institutions, only 6 ESMs that incorporated an N-cycle module contributed to the CMIP6 model intercomparison study on carbon concentration and carbon–climate feedback (Arora et al., 2020). In CMIP5, there were only 2 ESMs with N-cycle modules included in the same model intercomparison study (Arora et al., 2013). The current status of C–N coupled models in the CMIP model intercomparisons and knowledge gaps and divergent theories in C–N coupling parameterizations suggest coupling of N processes in ESMs is still an important area of model development (Ghimire et al., 2016; Yu et al., 2020).
This paper presents a recently developed process-based plant C–N coupling framework with a consistent coupling strategy between biophysical and biogeochemical processes. The framework mainly focuses on the effects of N limitation on plant photosynthesis (Sect. 2.2.3), plant respiration (Sect. 2.2.4), and plant phenology (Sect. 2.2.5) with a dynamic carbon-to-nitrogen ratio (CNR) (Sect. 2.2.2). The dynamic plant CNR is a more realistic representation than the fixed plant CNR in assessing the effect of N limitation on plant C processes and interactions between plant C and N processes. We implement this plant C–N framework by coupling a soil organic matter and nutrient cycling model (DayCent-SOM; Del Grosso et al., 2000; Parton et al., 1998, 2010) with a biophysical dynamic vegetation model (SSiB5/TRIFFID, the Simplified Simple Biosphere model version 5 and Top-down Representation of Interactive Foliage and Flora Including Dynamics model; Cox, 2001; Harper et al., 2016; Liu et al., 2019; Xue et al., 1991; Zhan et al., 2003; Zhang et al., 2015). SSiB and TRIFFID have been extensively used in land–atmosphere interaction studies (Harper et al., 2016; Xue et al., 2004, 2010, 2022, 2023). DayCent-SOM, which includes only the soil organic matter (SOM) cycling and trace gas subroutines from the DayCent ecosystem model (Parton et al., 1998, 2010), represents SOM transformations, belowground N cycling, soil N limitation to microbial processes and plant growth, and nitrification–denitrification processes. In the coupled model, the potential N uptake depends on plant N demand according to a biophysical and dynamic vegetation model, SSiB5/TRIFFID. The actual plant N uptake is limited based on soil N availability, as predicted by DayCent-SOM (Del Grosso et al., 2000; Parton et al., 1998, 2010). Although this plant C–N coupling framework is developed based on SSiB5, TRIFFID, and DayCent-SOM, the methodology and approach in this study could be applied to other process-based land models with similar physical, biological, and ecological principles. The coupled model is verified at 13 flux tower sites (Lund et al., 2012; Pastorello et al., 2020) with different plant functional types (PFTs) and is used to conduct several sets of global 2-D offline simulations from 1948 to 2007 to assess the effects of the coupling process. Model simulations of global GPP and leaf area index (LAI) have been evaluated against satellite-derived observational data (Jung et al., 2009; Sheffield et al., 2006; Zhu et al., 2013). The results demonstrate the relative importance of different plant N processes in this C–N framework. In addition, the effects of N limitation on heat fluxes are also preliminary assessed with station data (Sect. 4.1). The results indicate that because the atmospheric forcings (such as downward radiation) in our offline experiment are the same for both the control and the sensitivity runs, the heat flux response due to N limitation is limited. In this paper, we mainly focus on the GPP and LAI. A comprehensive assessment of the effect of N limitation on heat fluxes and atmospheric circulation needs to be conducted in a fully coupled atmosphere–land model.
The model used in this paper is presented in Sect. 2.1. The development and implementation of this plant C–N framework are presented in Sect. 2.2. The model forcing and validation data used in this paper are presented in Sect. 2.3. In Sect. 3, the experimental design is described. In Sect. 4, the measurements from the flux tower sites with different PFTs and the global satellite-derived observations from 1982–2007 are used as references to assess the effect of the C–N coupling process on the long-term mean vegetation distribution using the offline SSiB5/TRIFFID/DayCent-SOM. Some issues and a summary are presented in Sects. 5 and 6, respectively.
2.1 Model description
2.1.1 SSiB4/TRIFFID model
The Simplified Simple Biosphere model (SSiB; Xue et al., 1991; Sun and Xue, 2001; Zhan et al., 2003) is a biophysical model that simulates fluxes of surface radiation, momentum, sensible heat, and latent heat, as well as runoff, soil moisture, surface temperatures, and vegetation GPP, based on energy and water balance and photosynthesis processes. SSiB was coupled with a dynamic vegetation model, the Top-down Representation of Interactive Foliage and Flora Including Dynamics model (TRIFFID), to calculate net primary productivity (NPP), LAI, canopy height, and PFT fractional coverage according to the C balance (Cox, 2001; Harper et al., 2016; Liu et al., 2019; Zhang et al., 2015). Moreover, the surface albedo and aerodynamic resistance values are also updated based on the vegetation LAI, vegetation cover, vegetation height, and greenness. Previous work has improved the PFT competition strategy and plant physiology processes to make SSiB4/TRIFFID suitable for seasonal, interannual, and decadal studies (Zhang et al., 2015). SSiB4/TRIFFID includes seven PFTs: (1) broadleaf evergreen trees (BET), (2) needleleaf evergreen trees (NET), (3) broadleaf deciduous trees (BDT), (4) C3 grasses, (5) C4 plants, (6) shrubs, and (7) tundra. PFT coverage is determined by NPP; competition between species; and disturbance, which includes mortality due to fires, pests, and windthrow. A detailed description and validation of SSiB4/TRIFFID can be found in Zhang et al. (2015), Liu et al. (2019), and Huang et al. (2020). In this study, DayCent-SOM (see the next section) is introduced and coupled with SSiB5/TRIFFID using the C–N interface coupling framework introduced in this study, which will be discussed in Sect. 2.2.
2.1.2 DayCent-SOM model
DayCent-SOM, a subset of DayCent that excludes plant growth, soil hydrology, and soil temperature subroutines, consists of soil mineral N pools (ammonium and nitrate) and six types of organic C and N pools consisting of two non-woody plant litter pools (metabolic and structural), three coarse woody debris pools (from the death of large wood, fine branches, and coarse roots), and three kinetically defined organic matter pools (active, slow, and passive); all types of organic pools except the passive pool have both aboveground and belowground counterparts (Table 1). Non-woody plant litter is partitioned into structural (lignin + cellulose) and metabolic (labile) litter based on the lignin:N ratio of the plant material (Parton et al., 1994). The coarse woody debris pools decay in the same way as the structural pool decomposes, with lignin and cellulose going to the slow soil organic matter pool and the labile fraction going to the active soil organic matter pool. Each type of organic pool has its own intrinsic rate of decomposition, which is modified by temperature and moisture (Parton et al., 1994). Additionally, the decomposition rates of the structural material and coarse woody debris pools are functions of their respective lignin fractions. DayCent's litter decay model has been validated using extensive data from LIDET litter decay experiments from all over the world (Bonan et al., 2013).
Table 1The nitrogen pools in DayCent-SOM.
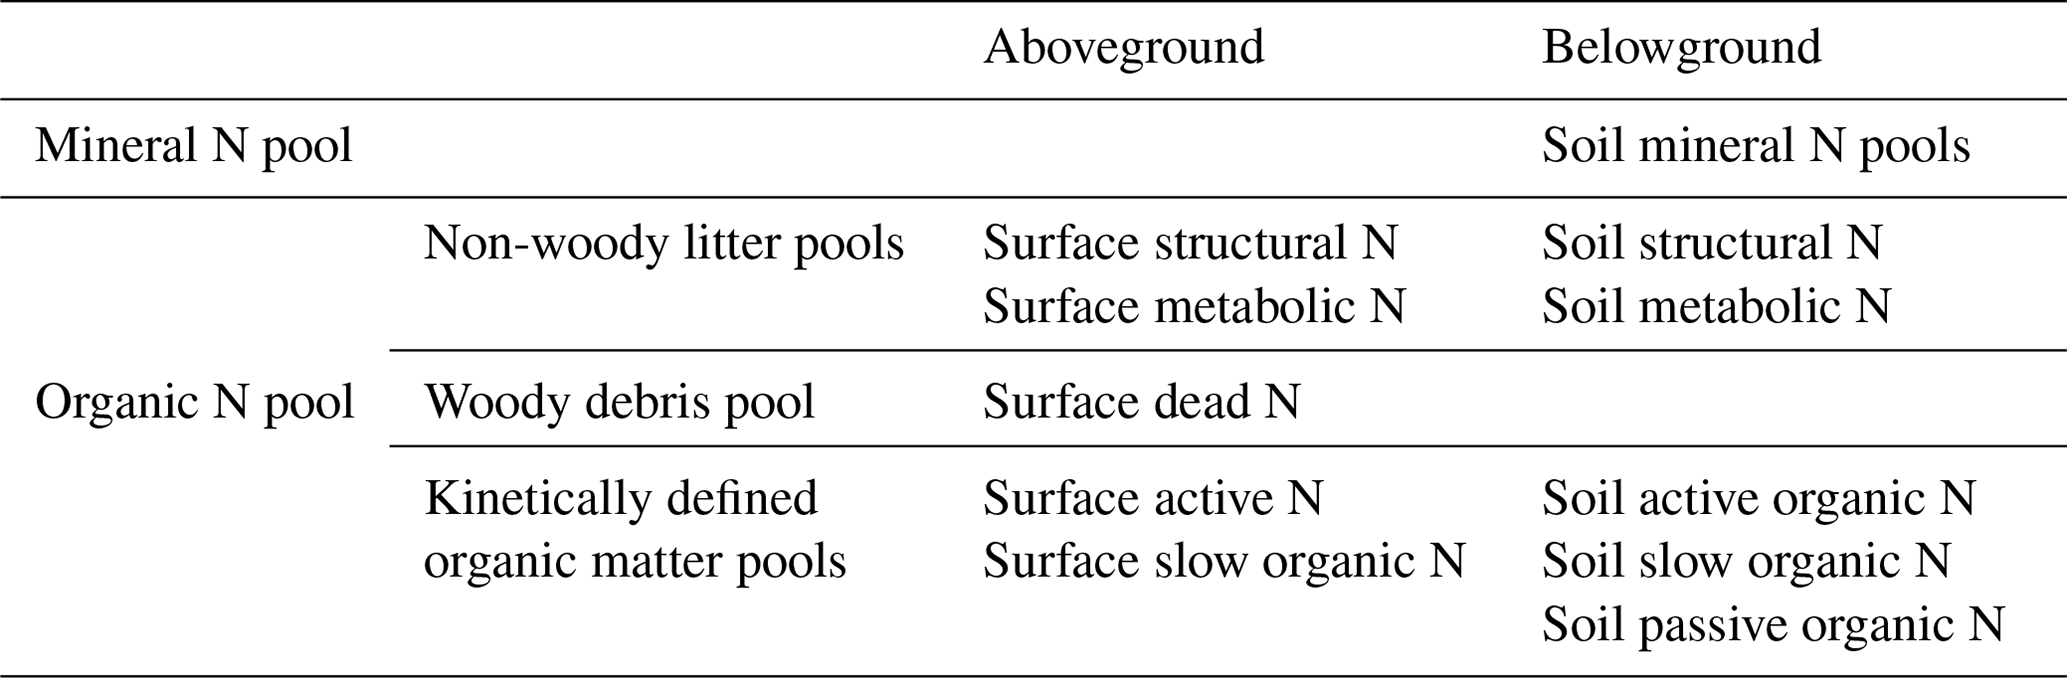
Note that “dead N” refers to woody debris N pools generated from the death of large wood, fine branches, and coarse roots.
2.2 Development of a plant carbon–nitrogen (C–N) interface coupling framework
2.2.1 Conceptual considerations and coupling strategy
To represent C and N interactions, we develop a plant C–N interface framework to couple biophysical and biogeochemical processes in the terrestrial C and N cycles. In this study, we applied the coupling framework to SSiB5/TRIFFID/DayCent-SOM. The conceptual considerations in developing this framework are presented in this section. For a process-based model, introducing a consistent coupling philosophy between biophysical and biogeochemical processes is necessary. The surface water, radiation, carbon fluxes, and plant litter are calculated by SSiB5/TRIFFID. The soil N dynamics model (DayCent-SOM) is directly driven by soil temperature, soil moisture, net radiation, and plant C and N litter inputs into the soil organic pool, which are provided by SSiB5/TRIFFID. DayCent-SOM then computes daily changes in all organic matter and mineral soil pools; estimates losses of N from nitrate leaching and N2O, NOx, and N2 emissions; predicts the amount of inorganic N available to plants; and updates inorganic N pools after accounting for plant N uptake by SSiB5/TRIFFID. Following plant N uptake from DayCent-SOM, our plant C–N interface framework describes the effects of N on photosynthesis, plant autotrophic maintenance and growth respiration, and plant phenology (Fig. 1). All these effects are associated with a dynamic CNR. In the original land surface model (SSiB4/TRIFFID), with assumed unlimited N availability and a fixed CNR based on PFT, the assimilated C determined the N contents of leaves, stems, and roots, which influenced photosynthesis, autotrophic respiration, NPP, and LAI. However, more evidence indicates that the CNR is not fixed in plant life, which will be further discussed in Sect. 2.2.2. With the dynamic CNR, the effect of N limitation on RuBisCO capacity and photosynthesis is assessed (Sect. 2.2.3).
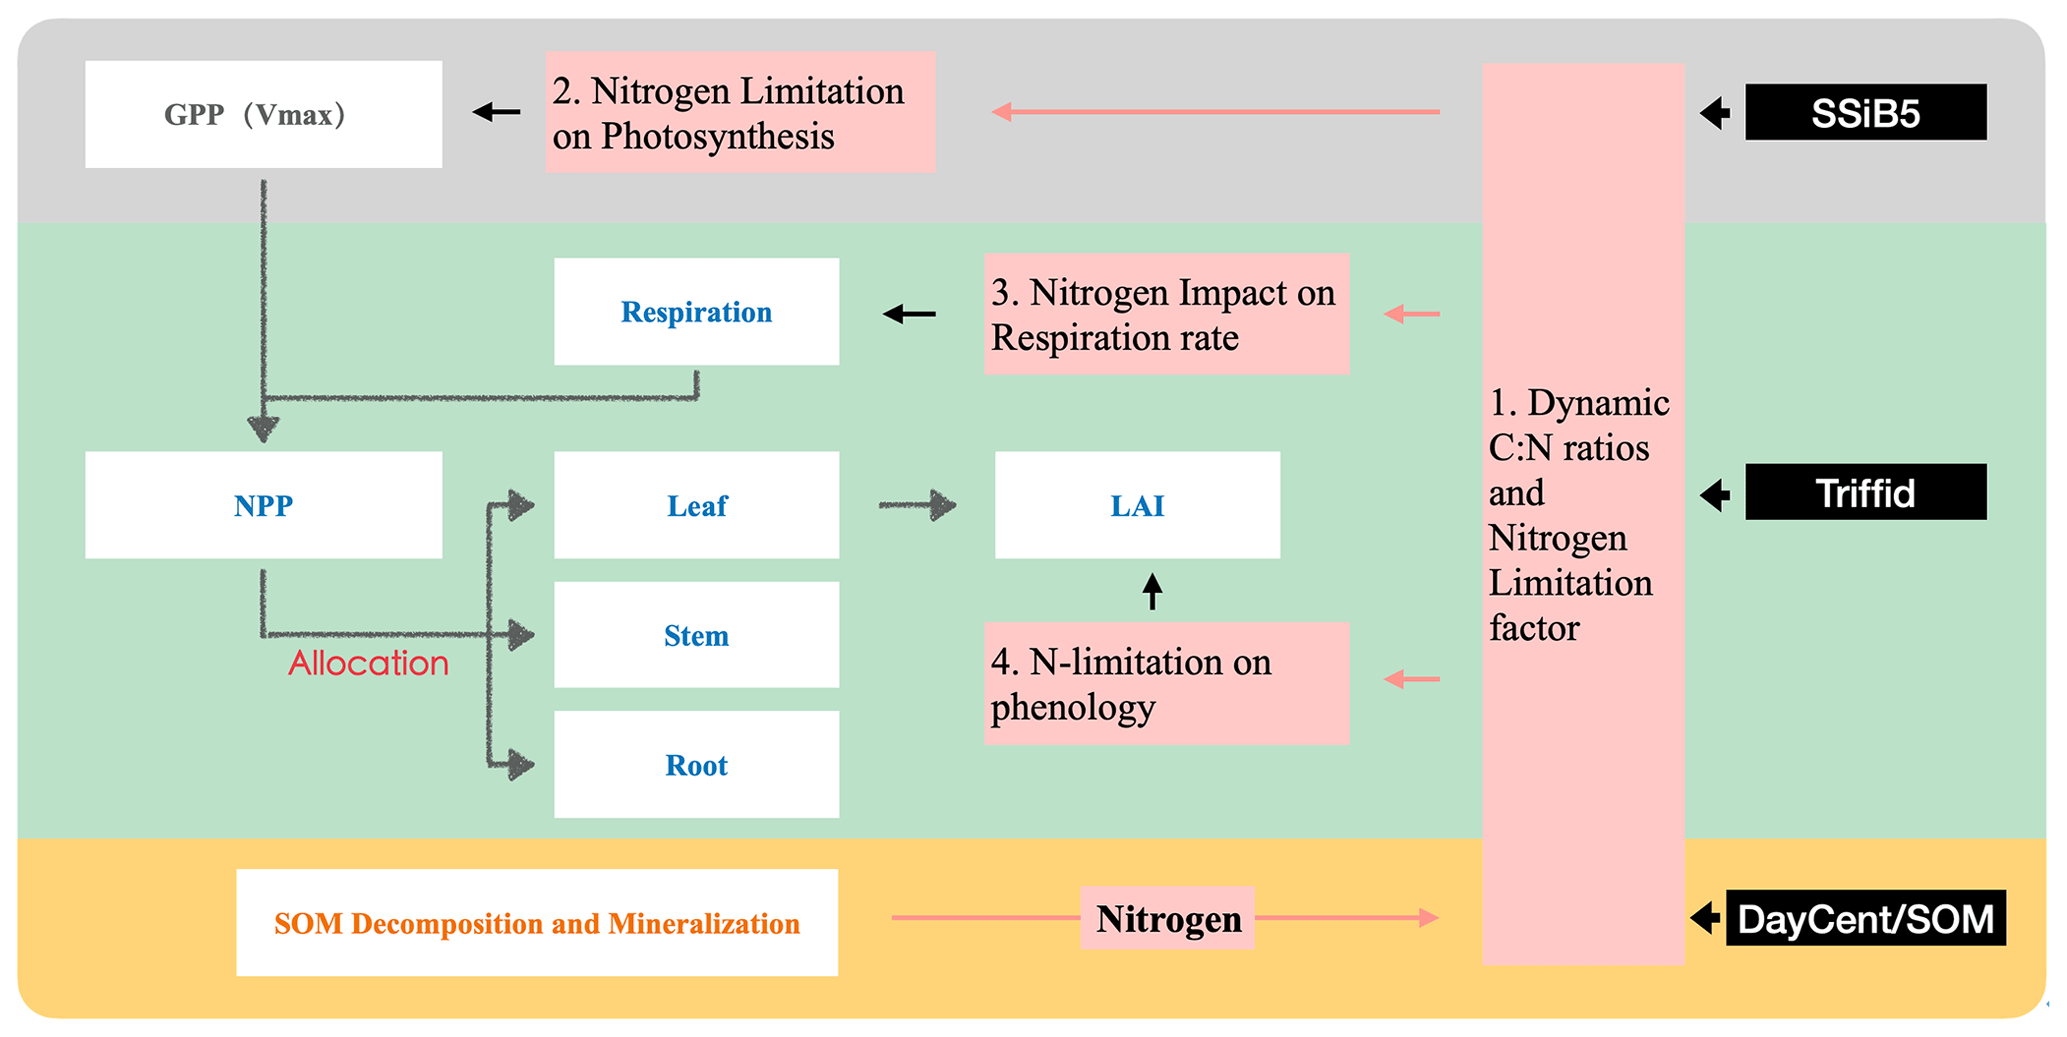
Figure 1Schematic diagram of plant biogeochemistry and nitrogen impacts in SSiB5/TRIFFID/DayCent-SOM. Notes that (1) different background colors represent three different modules – SSiB, TRIFFID, and DayCent-SOM; (2) white boxes indicate the main processes involved in C–N coupling in different modules; and (3) Vermeil boxes indicate how nitrogen influences plant biogeochemistry through the C–N framework.
Moreover, nitrogen is not the only dominant regulator of photosynthesis and vegetation dynamics. Reich et al. (2008) demonstrated strong relationships between respiration and N limitation based on observational data from various species. In the common N concentration range, respiration rates are consistently lower on average in leaves than in stems or roots. Therefore, this framework introduces two parameters for stems and roots based on PFT and available N, respectively, to adjust the respiration rate (Sect. 2.2.4). Furthermore, N also affects plant phenology and can be remobilized to supply spring budbreak or vegetative shoot extension (Cox, 2001; Kolb and Evans, 2002; Marmann et al., 1997; Millard, 1994; Neilsen et al., 1997). The framework includes the impact of N on plant phenology by introducing an N-limitation parameter, which will be discussed in Sect. 2.2.5. Considering the effect on phenology, the N-limitation effect during the growth season is emphasized. All these considerations in the framework should help in understanding the effects of N processes on the C cycle more comprehensively.
2.2.2 Dynamic CNR based on plant growth and soil nitrogen storage
Plants often face significant challenges in obtaining an adequate supply of nutrients to meet the demands of basic cellular processes. Nutrient deficiency may result in decreased soil fertility and/or plant productivity (McDowell et al., 2008; Morgan and Connolly, 2013; Stenberg and Muola, 2017). Evidence has shown that plant CNRs can change with nutrient availability (Chen and Chen, 2021; McGroddy et al., 2004; Meyer-Grünefeldt et al., 2015; Sardans et al., 2012; Smith, 1991). Plant cell CNRs are influenced by the accumulation of C polymers, such as carbohydrates, and are greater when cells are nutrient starved or exposed to high levels of photosynthetically active radiation (PAR) (Aber et al., 2003; MacDonald et al., 2002; Talmy et al., 2014). The studies of ecological stoichiometry (Sterner and Elser, 2002), which investigate how the availability of multiple elements, including carbon, nitrogen, and phosphorus, constrains ecological interactions, have revealed that plants respond and adapt to lower N availability. Studies show that plants resorb only approximately 50 % of leaf N on average (Aerts, 1996) to conserve nutrients (Clarkson and Hanson, 1980) and to increase nutrient use efficiency (Herbert and Fownes, 1999; Vitousek, 1982). These processes cause changes in the CNR to reduce the impact of N limitation (Talhelm et al., 2011; Vicca et al., 2012).
For the response of vegetation to N limitation, i.e., the strategies in which vegetation invests C to increase N supply under N-limited conditions, some models represent flexible stoichiometry, while others represent time-invariant stoichiometry (Kou-Giesbrecht et al., 2023). Importantly, flexible vs. time-invariant stoichiometry determines terrestrial C storage per unit N, followed by plant C allocation and partitioning. Plant responses are limited under a fixed CNR, which affects plant productivity and litter N content and thus in turn affects underground biogeochemistry and ultimately C and N uptake and storage. Comparing field measurements, it was found that allowing adaptations in the stoichiometry of C and N helped the land model improve the terrestrial surface C- and N-cycle simulation (Drewniak and Gonzalez-Meler, 2017; Medlyn et al., 2015).
In this study, dynamic CNRs are introduced into SSiB5/TRIFFID. This dynamic CNR can enable vegetation to increase N uptake under N-limited conditions, reduce N limitation, and sustain terrestrial C sequestration. Plant resistance and adaptation to N availability (Navail) are represented by dynamic CNRs in SSiB5. The N availability (Navail) for new growth limits the C assimilation rate through the CNRs; i.e., the model-simulated NPP should be no more than the Navail× CNR of new plant material. In the original TRIFFID parameterization, the CNRs for different plant components (leaf, root, and stem) are fixed based on plant functional types (Cox, 2001), and the change in the CNR that occurs over the ecological process and varies with nutrient availability was not considered. A relationship between the CNR and Navail, based on DayCent's parameterization, is introduced into SSiB5/TRIFFID/DayCent-SOM for each PFT component (Fig. 2, Eq. 1).
where Navail is the amount of soil mineral nitrogen that was available at the end of the previous day (g N m−2) calculated from DayCent-SOM.
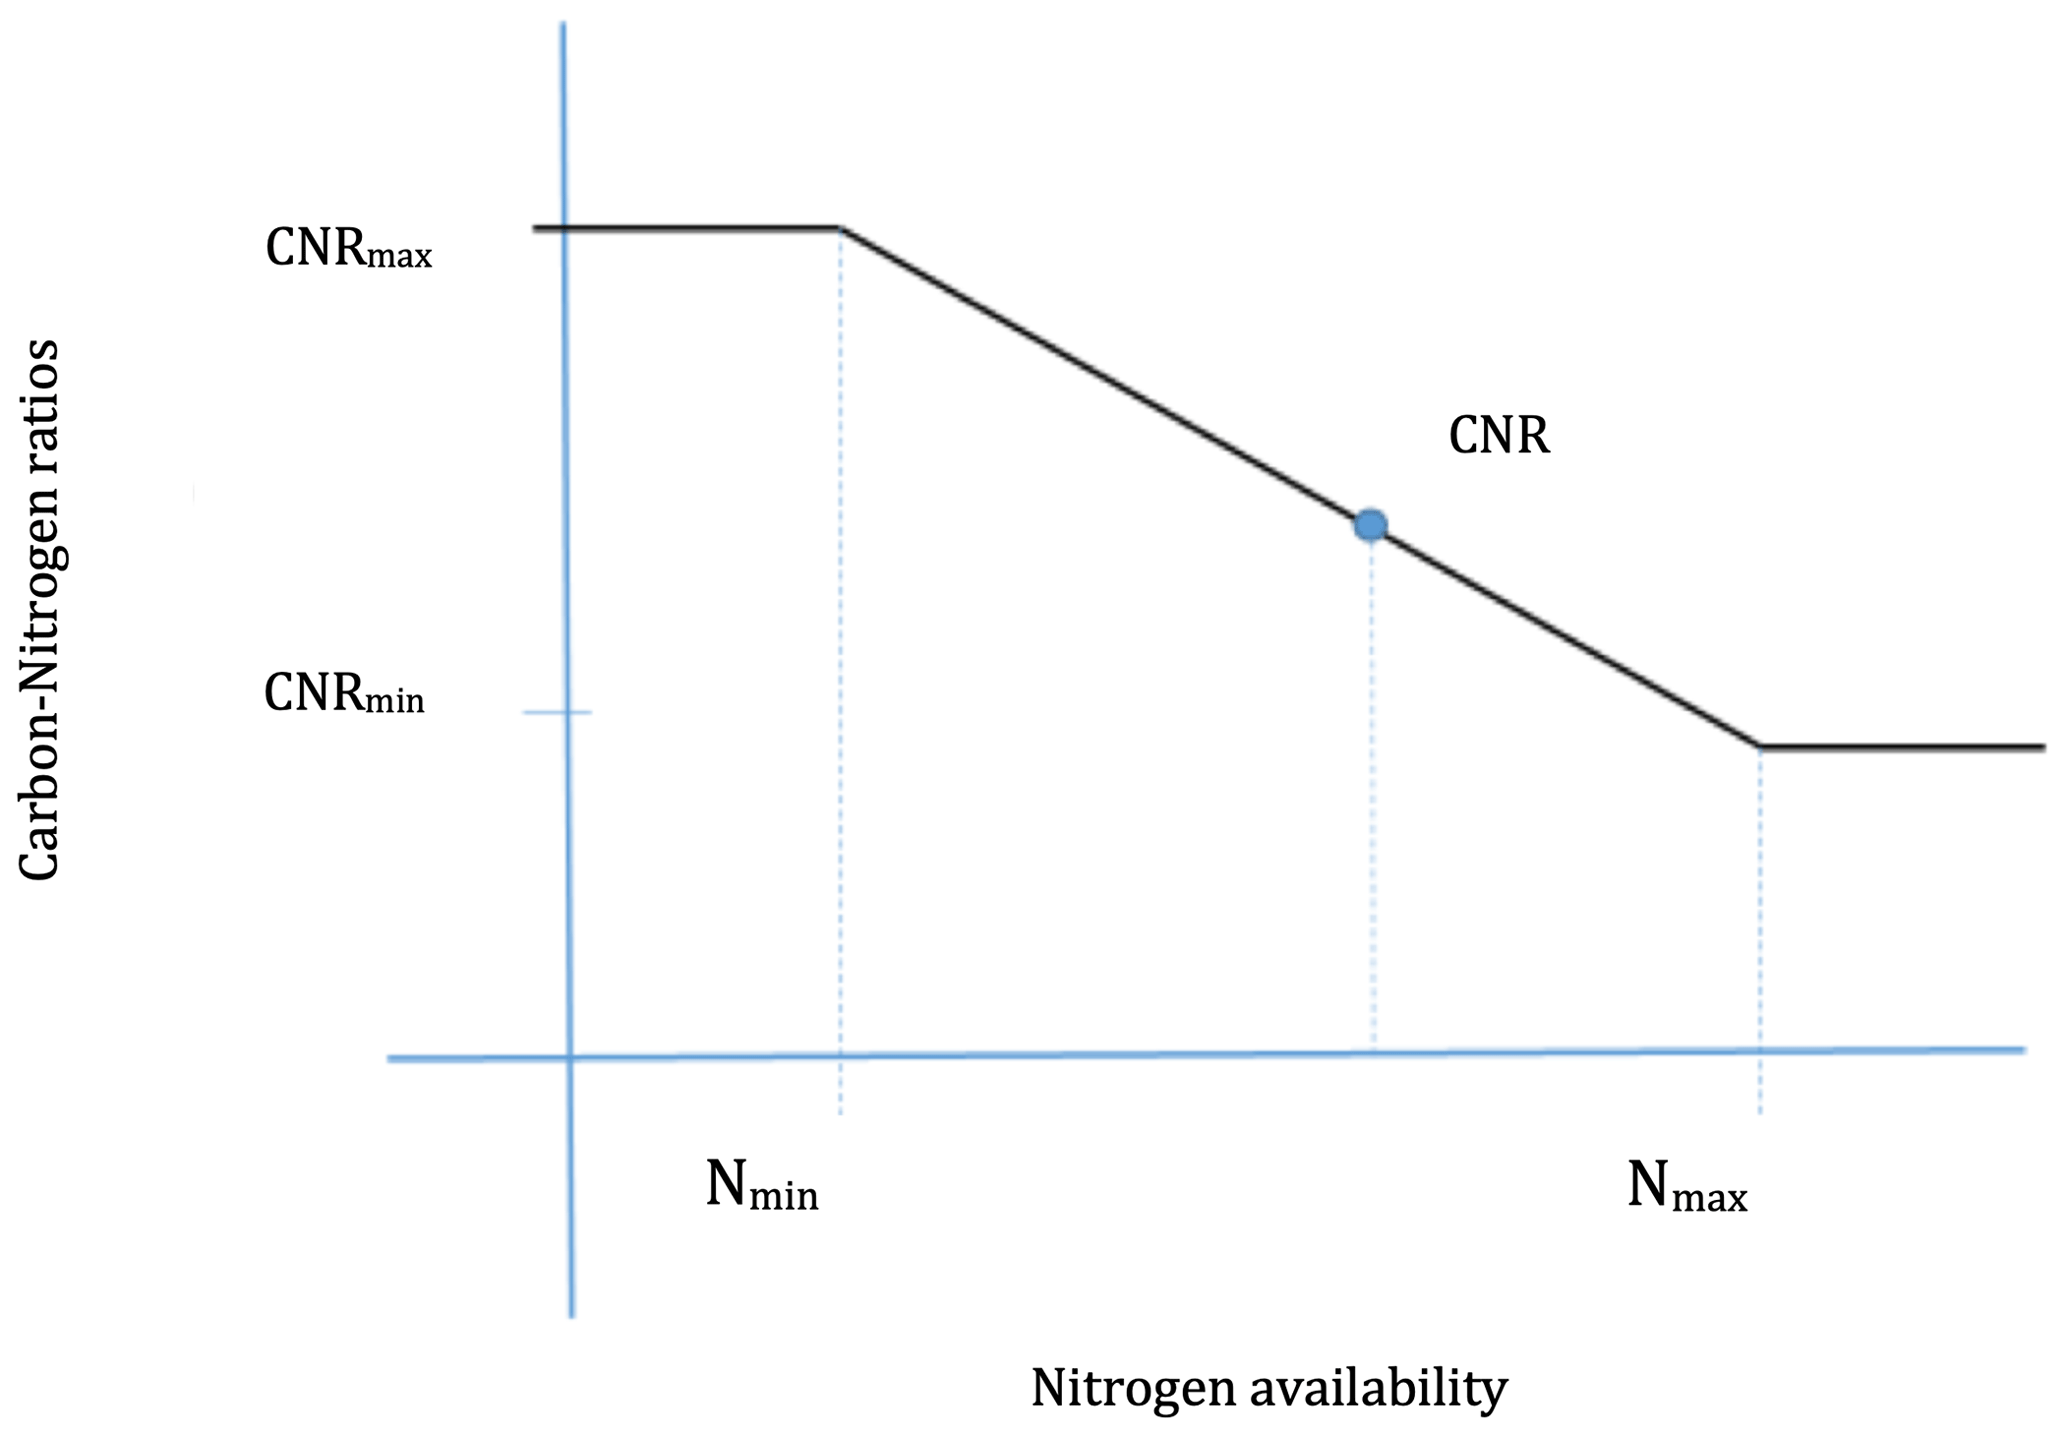
Figure 2The relationship between soil nitrogen availability and plant carbon nitrogen ratios.
The minimum and maximum amounts of nitrogen (Nmin, Nmax) necessary for the potential NPPp (g C m−2 d−1), which is first calculated from SSiB5/TRIFFID with unlimited N, are
where CNRmin and CNRmax are the minimum and maximum CNRs, respectively, for each PFT component from DayCent (Table 2). Allometric relations and empirical datasets are used to constrain the range of possible CNRs. The CNRs of leaves, fine roots, and stems were obtained from DayCent's user manual and other published papers (Parton et al., 1993, 2007). Note that Eqs. (2) and (3) are calculated based on the potential NPP; the CNR that is calculated based on Eqs. (1)–(3) ensures that when Navail varies between Nmin and Nmax, the plant can adjust the CNR to support this potential NPP (as demonstrated in the schematic diagram in Fig. 2). That said, N limitation will have no effect on C assimilation as long as Navail is greater than Nmin. However, the N content of plant litter falling to the soil was determined by this dynamic CNR. Compared with the constant CNR, the range of possible plant carbon variation with the dynamic CNR is smaller, reducing the impact of N limitation. As reviewed at the beginning of this section, a number of recent studies have demonstrated that allowing adaptations in the stoichiometry of C and N would improve plant responses; for instance, an increase in available foliar N reduces the CNR in leaves, driving an increase in productivity.
Table 2C–N ranges of leaves, fine roots, and stems for each plant functional type (PFT).
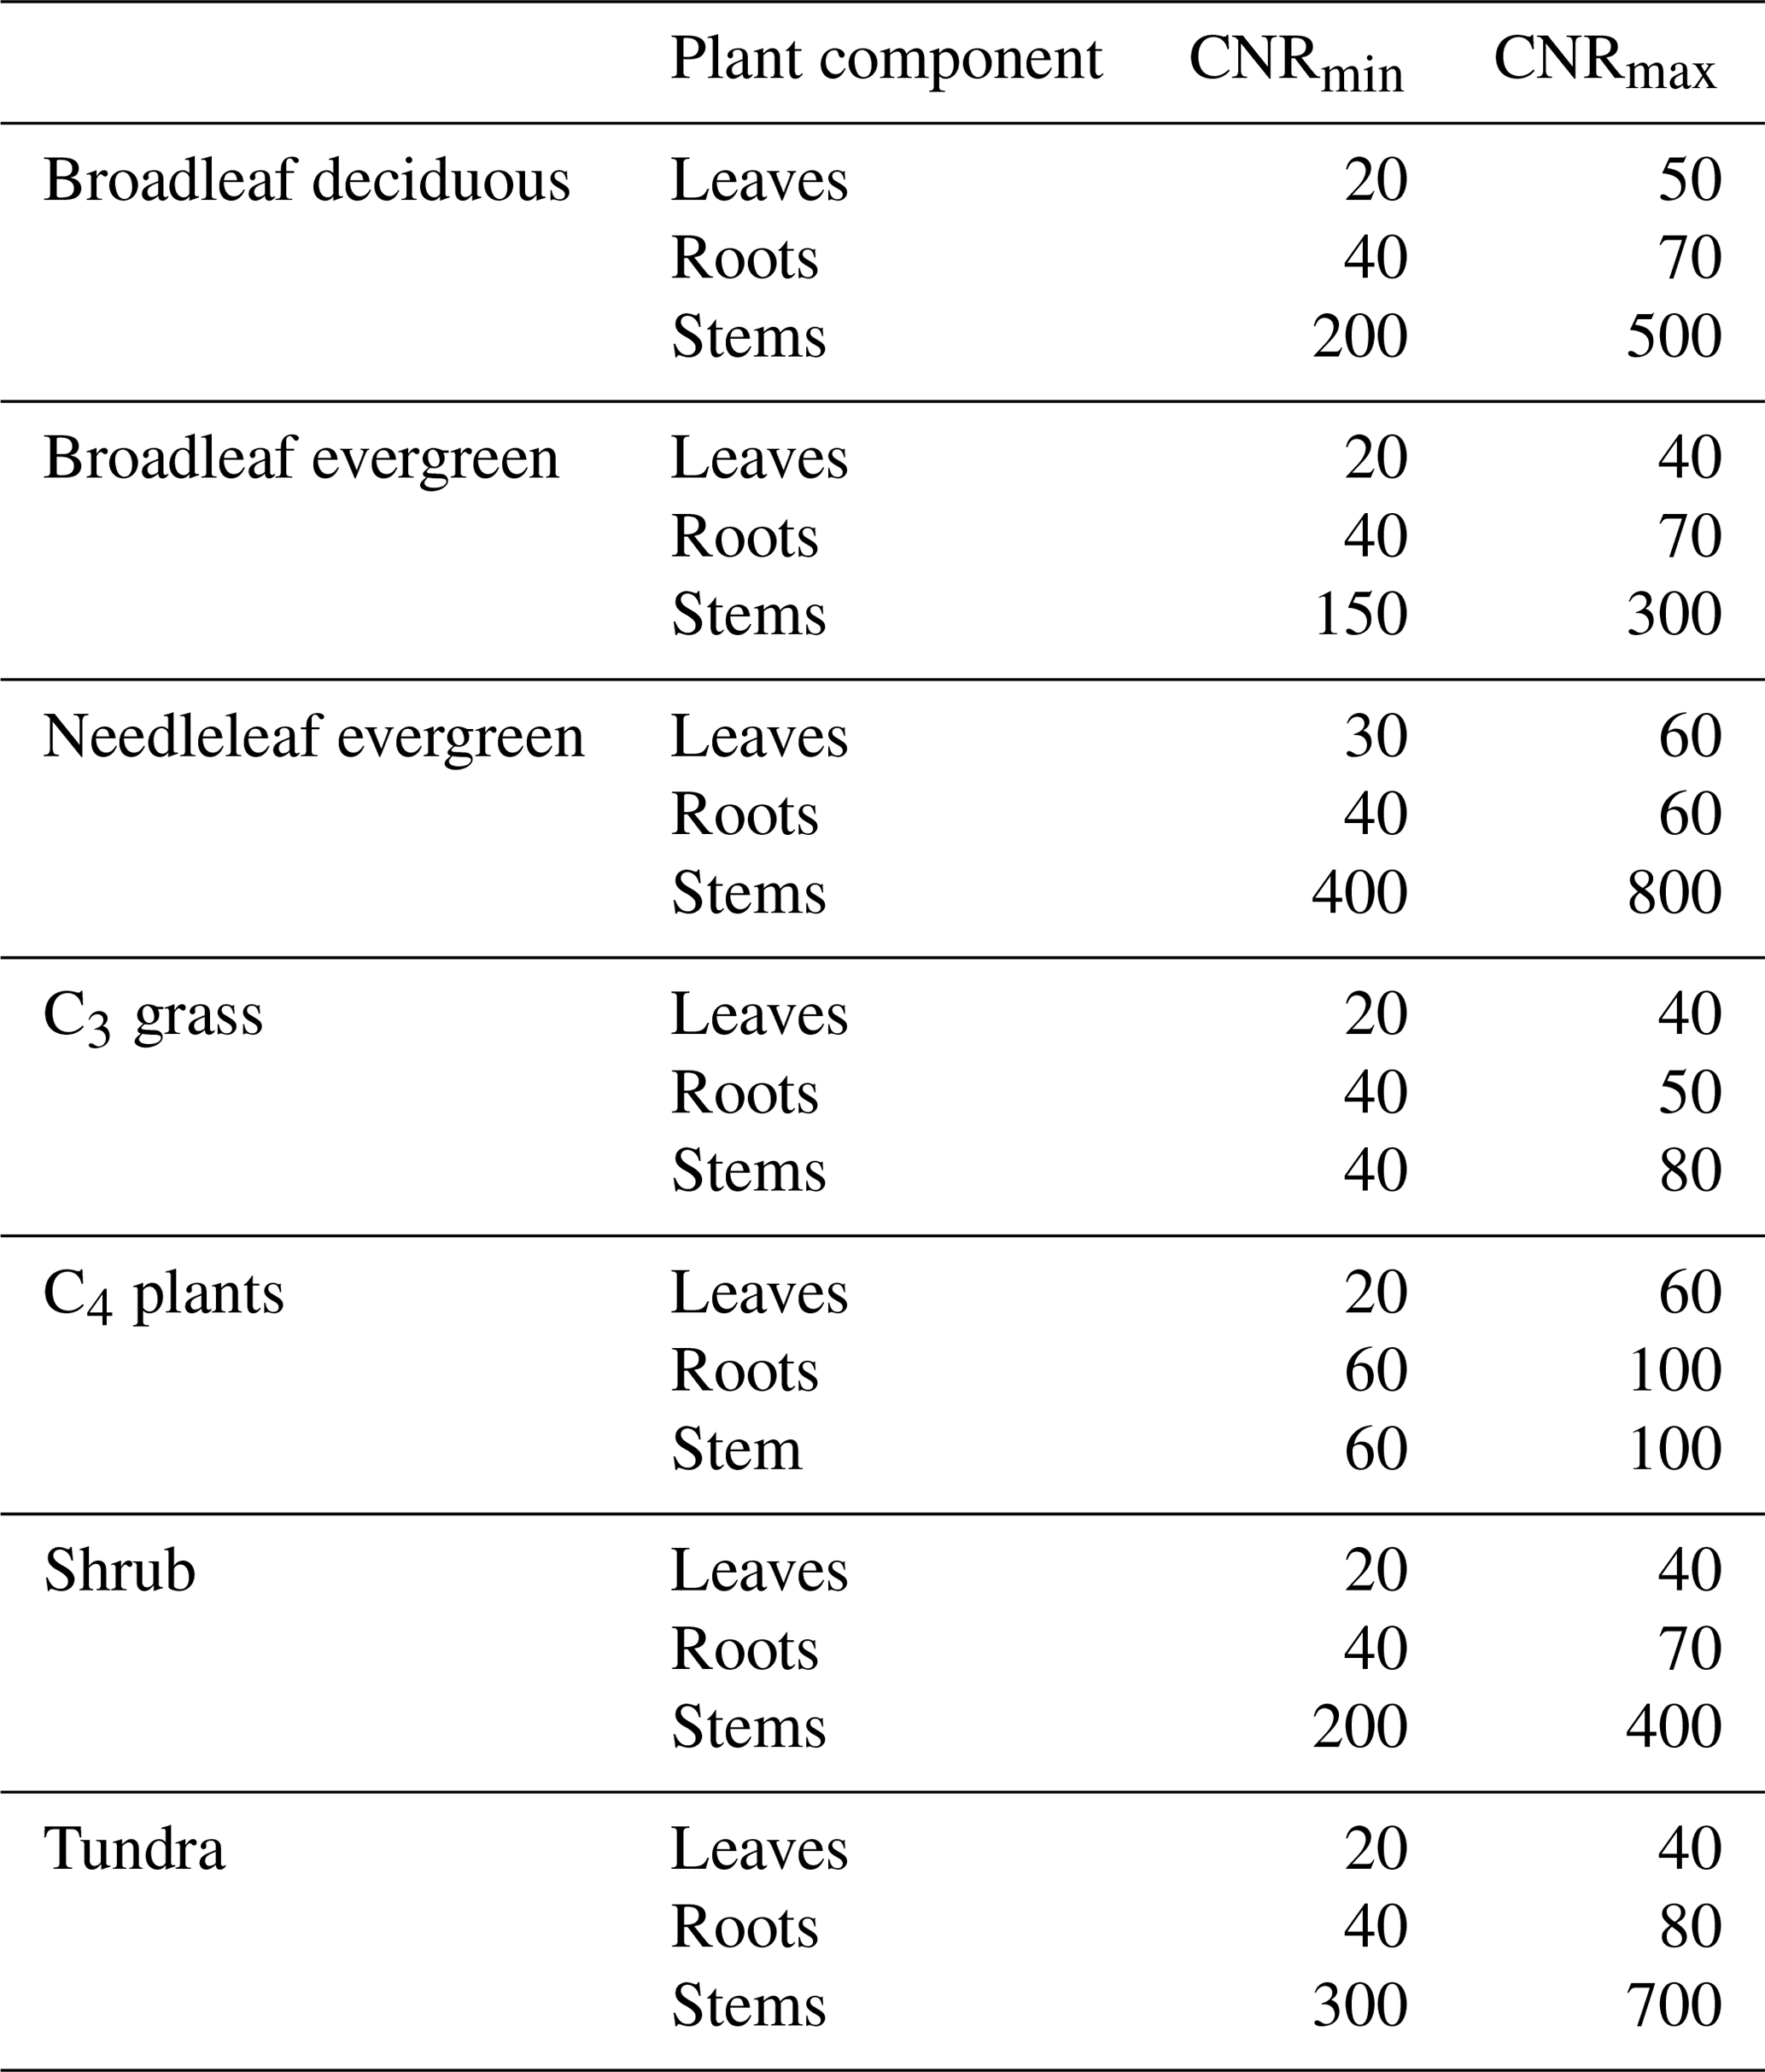
Note that the CNRmin and CNRmax data for each PFT component are from DayCent's user manual and other publications (Parton et al., 1993, 2007).
DayCent-SOM only provides the total available nitrogen (Navail) for the plant within one grid box (the soil is 3.2 m in depth), which consists of several PFTs. To apply Eq. (1), the nitrogen available for each PFT and its plant components in the grid box is calculated as
where fraci is the fraction of PFT i in one grid and ΔCj is the fraction of carbon allocated to plant component j, which consists of leaves, roots, and stems and is calculated in TRIFFID.
Furthermore, the dynamic CNR in this framework depends on the degree to which the N demands of different plant components (e.g., leaves, roots, and stems) have been satisfied over the past several days, and Eq. (1) prevents unrealistic instantaneous downregulation of potential photosynthesis rates. “Instantaneous downregulation”, which has been applied in some N-limited models (Davies-Barnard et al., 2020), refers to the fact that photosynthesis rates are limited as soon as N (in either leaves or soil) is not sufficient (Reich et al., 2006; Ghimire et al., 2016). In our framework, by adjusting CNRs, the N-limitation effect under certain conditions does not instantaneously respond to available N. The N limitation will occur only when available N exceeds a certain critical value (see further discussion in Sect. 2.2.3).
2.2.3 Effect of nitrogen limitation on photosynthesis based on soil available nitrogen and the plant CNR
The widely used parameterization of photosynthetic C assimilation by the terrestrial biosphere in ESMs, including our model, is represented by the Farquhar, von Caemmerer, and Berry (FvCB) model of photosynthesis (Collatz et al., 1991; Farquhar et al., 1980). At high levels of PAR, the photosynthetic rate is limited by the amount of RuBisCO in the leaf and its cycling rate. Nitrogen is an important constituent of the RuBisCO enzyme and mitochondrial enzymes that regulate respiration and adenosine triphosphate (ATP) generation (Makino and Osmond, 1991). As one of the most important photosynthetic model parameters, the maximum carboxylation rate by the RuBisCO enzyme (Vc,max) is a key parameter in the FvCB model (Farquhar et al., 1980) and has an extensive range across the models depending on the plant N content (Rogers, 2014). Therefore, leaf N content will affect Vc,max and thus GPP. However, the original FvCB model did not explicitly consider the effect of N on photosynthesis. While N limitation was introduced to terrestrial biosphere models, they differ in how N limitation in the plant C process is represented (Thomas et al., 2015; R. Fisher et al., 2010). In a number of LSMs, an empirical relationship is applied to relate Vc,max to leaf N content Nleaf to determine the effect of N on photosynthesis, e.g., , where the intercept (iv) and slope (sv) are derived for each PFT based on observations (Kattge et al., 2009; Raddatz et al., 2007). Some studies have applied the same N-limitation factor to NPP or GPP (Ali et al., 2015; J. B. Fisher et al., 2010; Ghimire et al., 2016). If NPP is adjusted, the same N limitation for photosynthesis is applied for plant respiration, which is not reasonable based on plant physiology (Högberg et al., 2017). Such approaches may distort the ratio of NPP and respiration. On the other hand, if only the GPP is adjusted for N limitation, then the N limitation for respiration is ignored.
We chose the most physiological method by adjusting the maximum RuBisCO carboxylation rate (Vc,max), which is proportional to the nitrogen content of the RuBisCO leaf reserve) during photosynthesis, rather than adjusting the NPP at the end of photosynthesis. Vc,max regulates both C assimilation and autotrophic respiration, and the photosynthesis assimilation product, GPP, is proportional to Vc,max. Empirical evidence has shown that Vc,max decreases with decreasing leaf N (Walker et al., 2014). We therefore introduce a downregulation of the canopy photosynthetic rate based on the available mineral N for new growth (Navail) using the N availability factor f(N).
The f(N) term is determined by nitrogen availability:
Because plants can adjust the relative allocations of C and N during N uptake via N remobilization and resorption to reduce the impact of N limitation, as discussed in the previous section for the dynamic CNR, the N-limitation effect on photosynthesis only applies when nitrogen availability is lower than the minimum amount of nitrogen (Nmin) necessary for the potential NPP. We take into account the fact that plant responses include resistance and adaptation through this approach along with the dynamic CNR to neither make the N-limiting effect linear nor instantaneously downregulate the available N content, as discussed in the last section. A linear relationship between f(N) and Navail is valid only when N availability is not sufficient for the minimum N demand for new growth.
2.2.4 Improvement in the impact of nitrogen on respiration rates based on field observations
Based on a database (Reich et al., 2008) of 2510 measurements from 287 species, the relationships between the mass-based dark respiration rate and nitrogen concentration of leaves, stems, and roots were assessed. The results indicate strong respiration–nitrogen scaling relationships for all observations and for data averaged by species. At usual N concentrations, respiration rates are consistently lower on average in leaves than in stems or roots. In the original SSiB4/TRIFFID, the total maintenance respiration (Rpm) is given by Cox (2001):
where Rdc is canopy dark respiration and is linearly dependent on Vc,max. The introduced N limitation of Vc,max in Sect. 2.2.3 also influences the effect of N on maintenance respiration. Nl, Ns, and Nr are the N contents of the leaf, stem, and root, respectively, and the factor of 0.012 is from the unit conversion. Equation (8) assumes that the respiration rates in roots and stems have the same dependence on the N content as that in leaves.
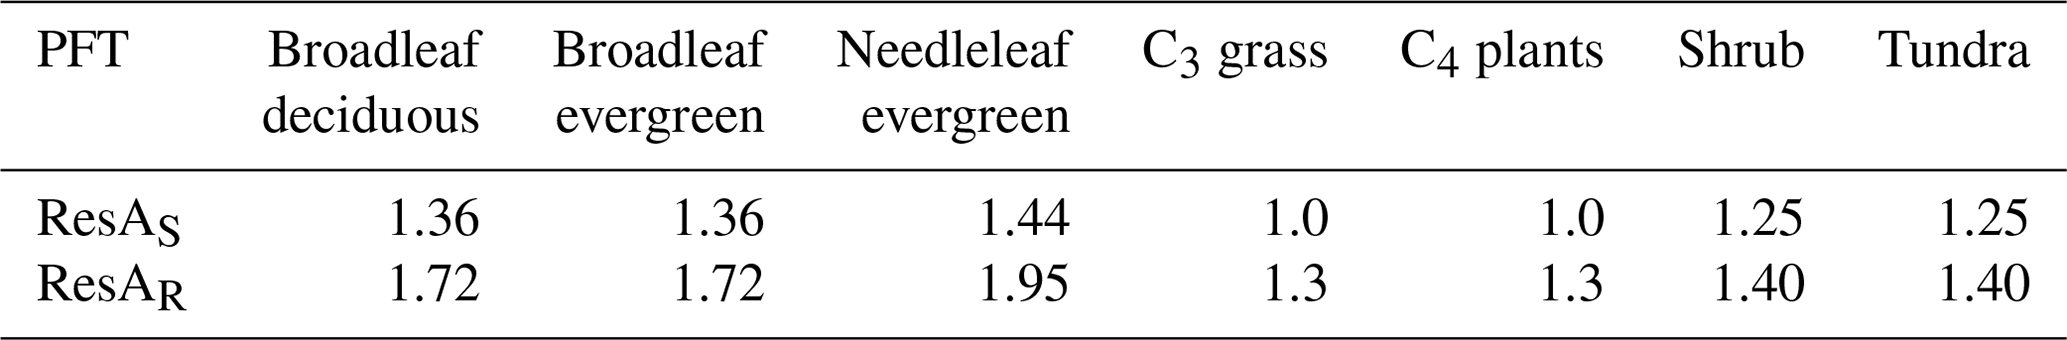
Based on the information derived from field measurements for different PFTs (Reich et al., 2008; Wang et al., 2006; Yang et al., 1992), we introduce two PFT-specific parameters (ResAS, ResAR) to adjust root and stem respiration. Their values are listed in Table 3.
Since ResAS and ResAR are generally larger than 1, the new Rpm is larger than the original one, and the increased respiration due to the nitrogen limitation will decrease the NPP.
Table 3The values of ResAS and ResAR for each plant functional type (PFT).
2.2.5 Effect of N limitation on LAI based on plant phenology
Nutrient availability affects vegetation activity and thus plant phenology (May and Killingbeck, 1992; Millard, 1994; Neilsen et al., 1997; Piao et al., 2019; Thomas et al., 2015; Vitasse et al., 2021; Zhou et al., 2022). Studies have demonstrated that variations in nitrogen availability could change the spring and fall phenology, such as spring budbreak or vegetative shoot extension (Yang et al., 2016; Yin et al., 2017; Fu et al., 2019), as well as the length of the growing season (Wang and Tang, 2019; Zhou et al., 2022). Increased soil nitrogen availability could supplement nutrient deficiencies and thus stimulate plant growth under low temperatures in early fall (McCormack et al., 2014; Delpierre et al., 2016; Yin et al., 2017) and delay the end of the growing season (Wingler et al., 2006).
In TRIFFID, the leaf mortality rate and a leaf phenology parameter, p (Cox, 2001), are introduced to represent the vegetation's phenological status (Eqs. 10 and 11) and to adjust the model-simulated seasonal maximum possible leaf area index (LAIbalance), which is based on surface carbon balance (Cox, 2001; Enquist et al., 1998), to determine the actual LAI and produce realistic phenology.
where the leaf constant absolute drop rate γp=20 yr−1, the leaf mortality rate γlm is a function of temperature T (Cox, 2001), and the minimum leaf turnover rate γ0=0.25 (Cox, 2001). This phenology in SSiB4/TRIFFID modulates LAI seasonal evolution, which considers leaf mortality and the temperature threshold for leaf drop, but it is not directly linked to N. The phenology parameter p indicates that “full leaf” is approached asymptotically during the growing season, and p is reduced at a constant absolute rate when the mortality rate is greater than a certain threshold value. Otherwise, p increases, but the rate of increase decreases as the growing season progresses.
Since different N states and supplies affect phenology, as discussed above, this framework includes the impact of N on plant phenology by introducing N limitation in SSiB5/TRIFFID/DayCent-SOM to take into account the effects of N on phenology. We assume that p is limited by N availability, with the new nitrogen limitation pN Limit determined by
where f(N) is calculated as described in Sect. 2.2.3.
2.2.6 The computational flow of SSiB5/TRIFFID/DayCent-SOM
In SSiB5/TRIFFID/DayCent-SOM, SSiB5 provides GPP, autotrophic respiration, and other physical variables, such as canopy and soil temperatures and soil moisture, every 3 h for TRIFFID (Fig. 3). TRIFFID accumulates the GPP from SSiB5 and produces biotic C, PFT fractional coverage, vegetation height, and LAI every 10 d, which are used to update surface properties in SSiB5, such as albedo, surface roughness length, and aerodynamic and canopy resistances. The plant C–N framework uses meteorological forcings (i.e., air temperature, humidity, wind, radiation, and precipitation) and physical variables (i.e., soil moisture and soil temperature) provided by SSiB5 every 3 h and biophysical properties (vegetation fraction and biotic C) provided by TRIFFID, which are updated every 10 d. The plant C–N interface framework calculates the dynamic CNR, N-limited photosynthesis, and N-impacted respiration rate every 3 h. C loss and potential N uptake accumulate within 1 d in the C–N interface framework, and plant C and N litterfall are transferred to DayCent-SOM at the end of the day. DayCent-SOM calculates the amount of inorganic N available for plant N uptake (Navail) and the N losses from nitrate leaching and N-trace gas emissions each day. TRIFFID updates the vegetation dynamics based on the C balance on day 10, including PFT competition. The updated vegetation dynamics are transferred to SSiB5 to calculate N-limited phenology to reflect the impact of N on the C cycle, which is significant during the growth season.
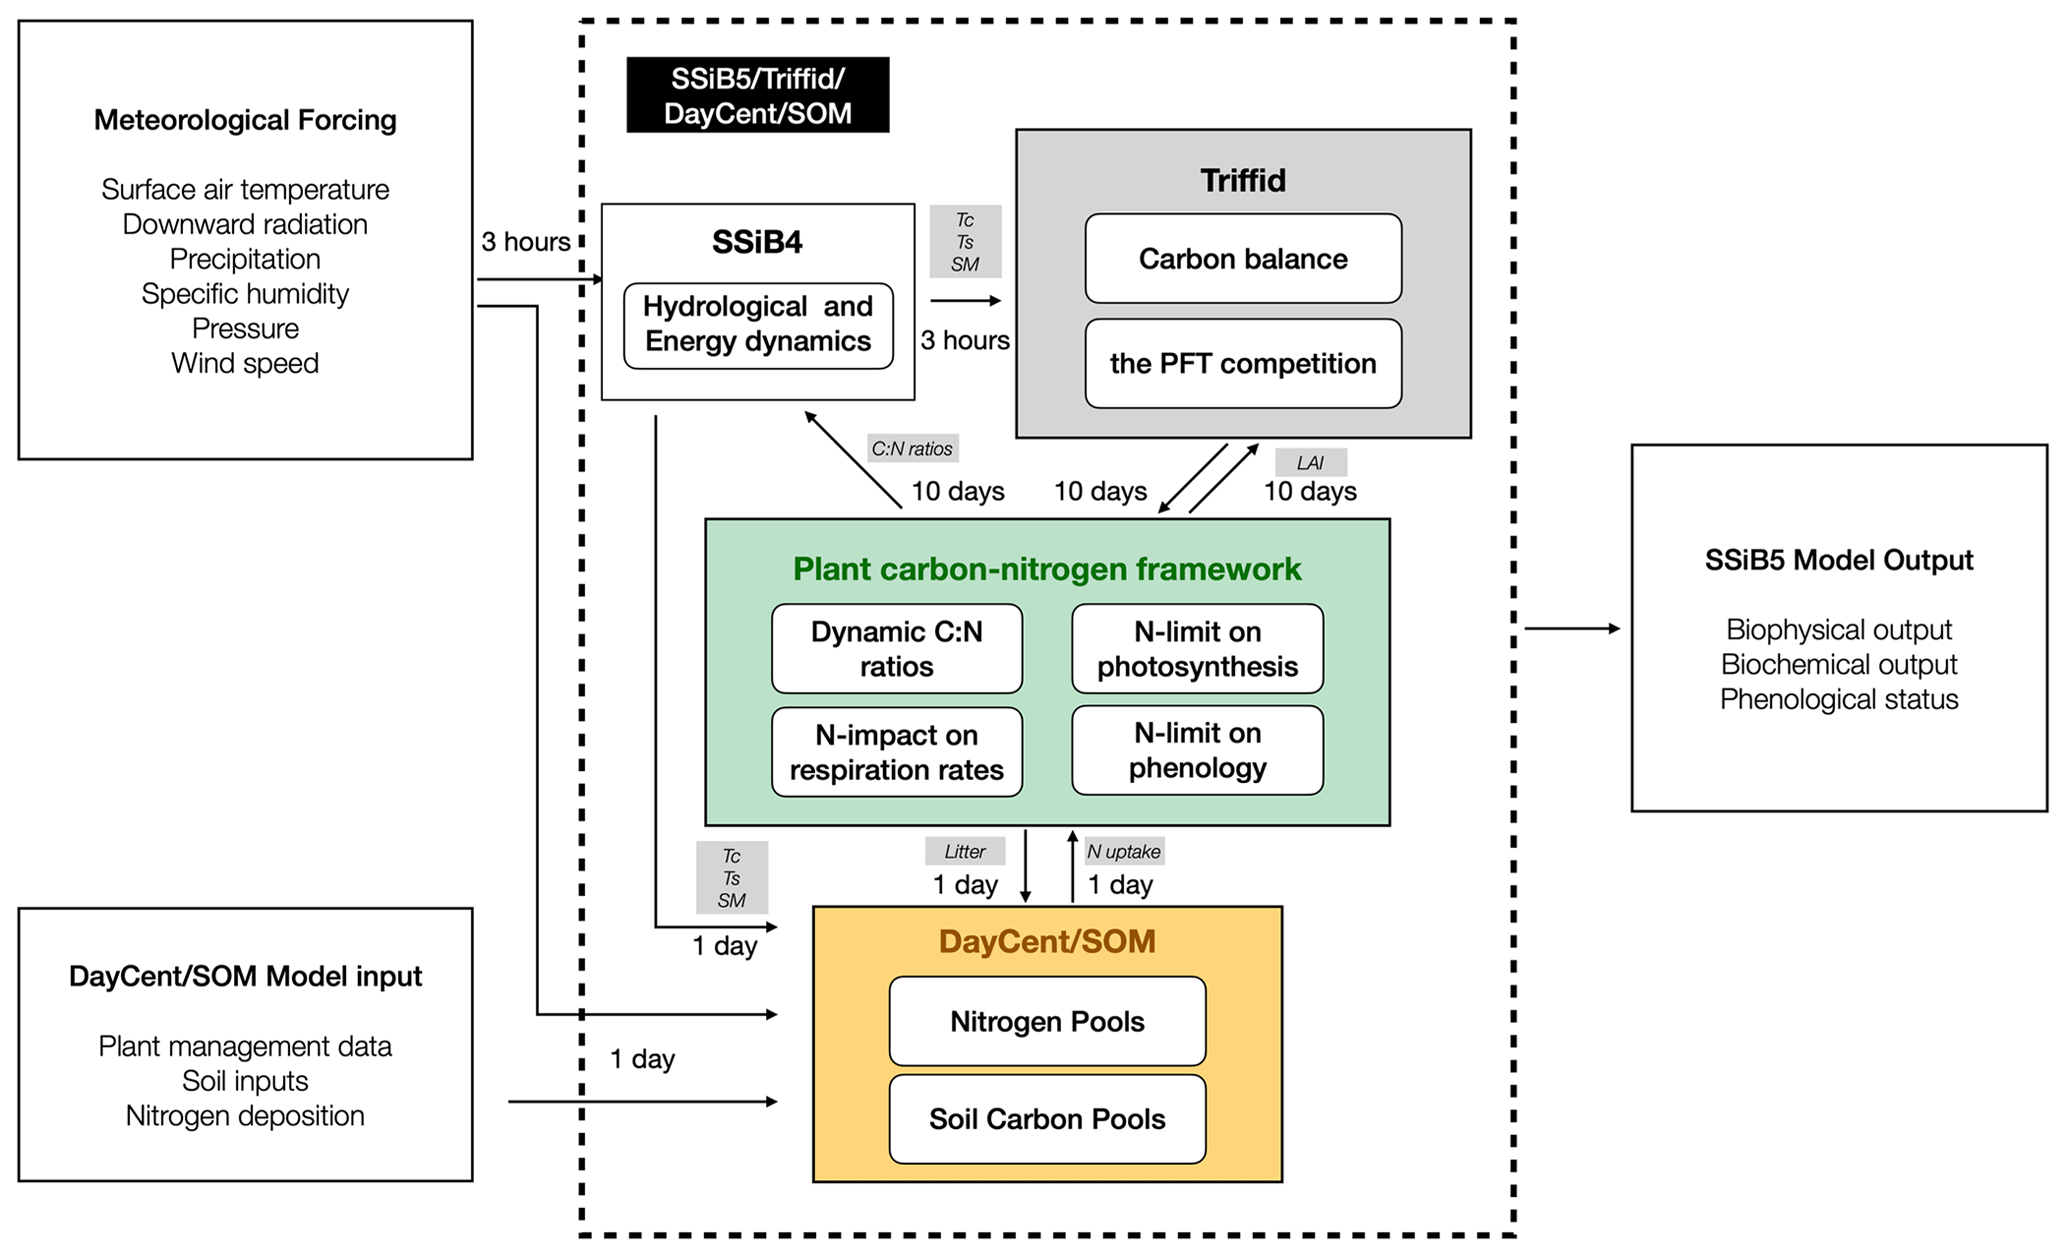
Figure 3Flowchart of plant carbon–nitrogen interactions in SSiB5/TRIFFID/DayCent-SOM; the main variables between the two modules are listed. Abbreviations: Tc, canopy temperature; Ts, land surface temperature; SM, soil moisture; GPP, gross primary productivity; Res, autotrophic respiration.
2.3 Model forcing and validation data
Long-term measurements from flux tower sites with different PFTs and global satellite-derived products are employed as references to systematically assess the effects of this coupling framework and N limitation on the terrestrial carbon cycle. Flux tower site data are presented in Sect. 2.3.1. The global meteorological forcing and validation data are listed in Sect. 2.3.2 and 2.3.3, respectively.
2.3.1 Ground measurement data
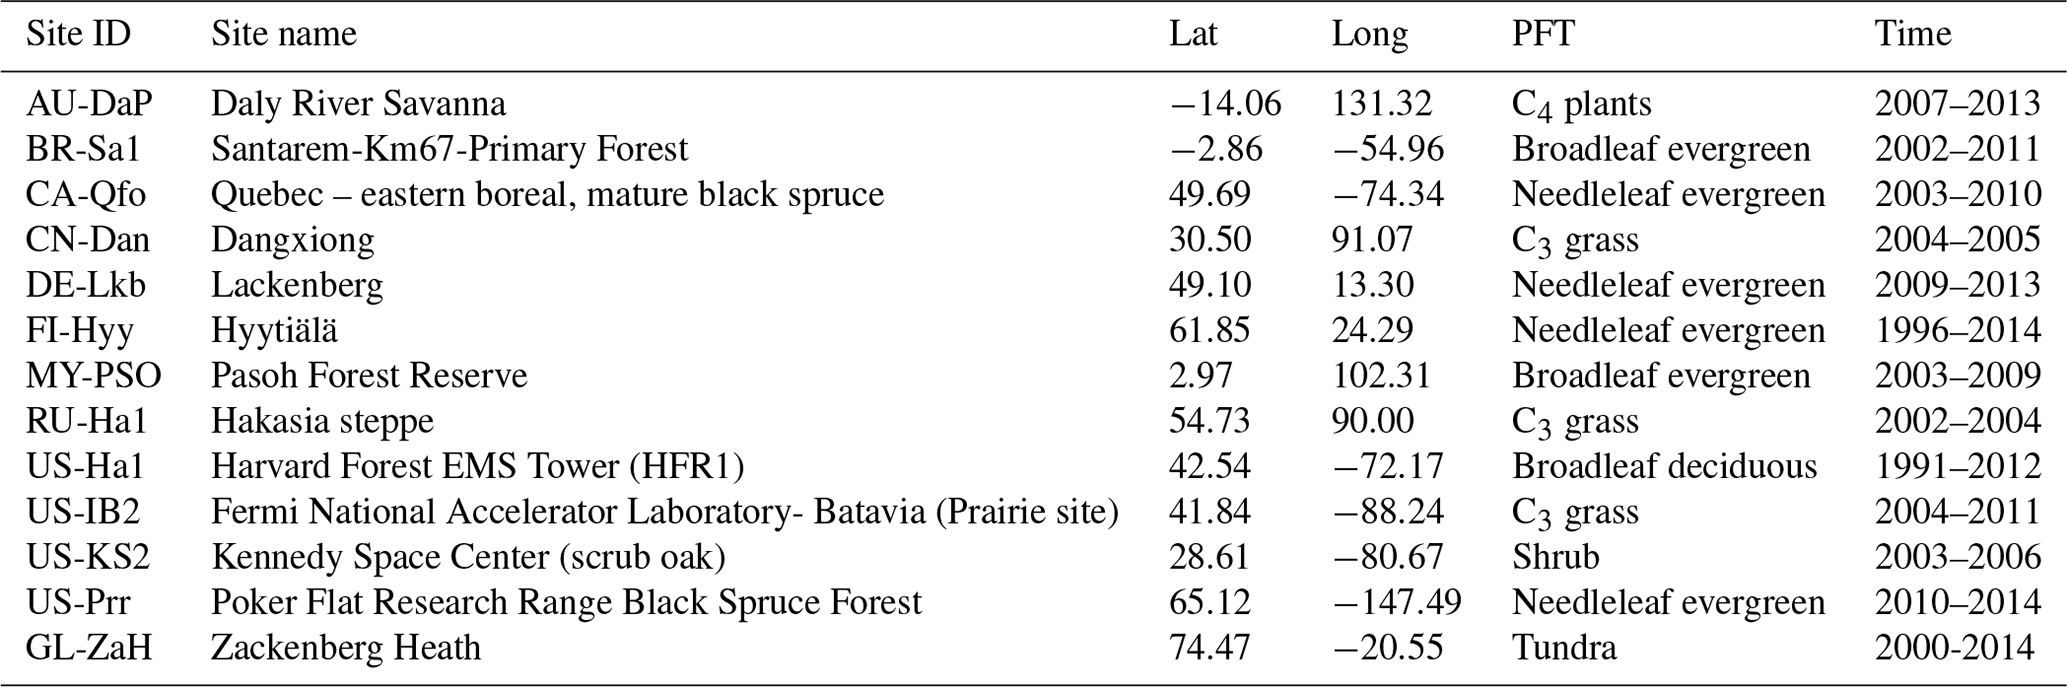
To validate the coupled model, 13 sites with representative biome types and climate zones were selected to evaluate the simulations of the seasonal patterns of GPP, sensible heat flux, and latent heat flux. All driving data were a half-hourly dataset, including air temperature, specific humidity, wind velocity, air pressure, precipitation, and shortwave and longwave radiation data from the FLUXNET2015 dataset (Pastorello et al., 2020). The GL-ZaH data were obtained from a tundra heath site (Lund et al., 2012). The geographical distribution of the selected FLUXNET2015 sites is displayed in Fig. 4, and detailed site information is listed in Table 4.
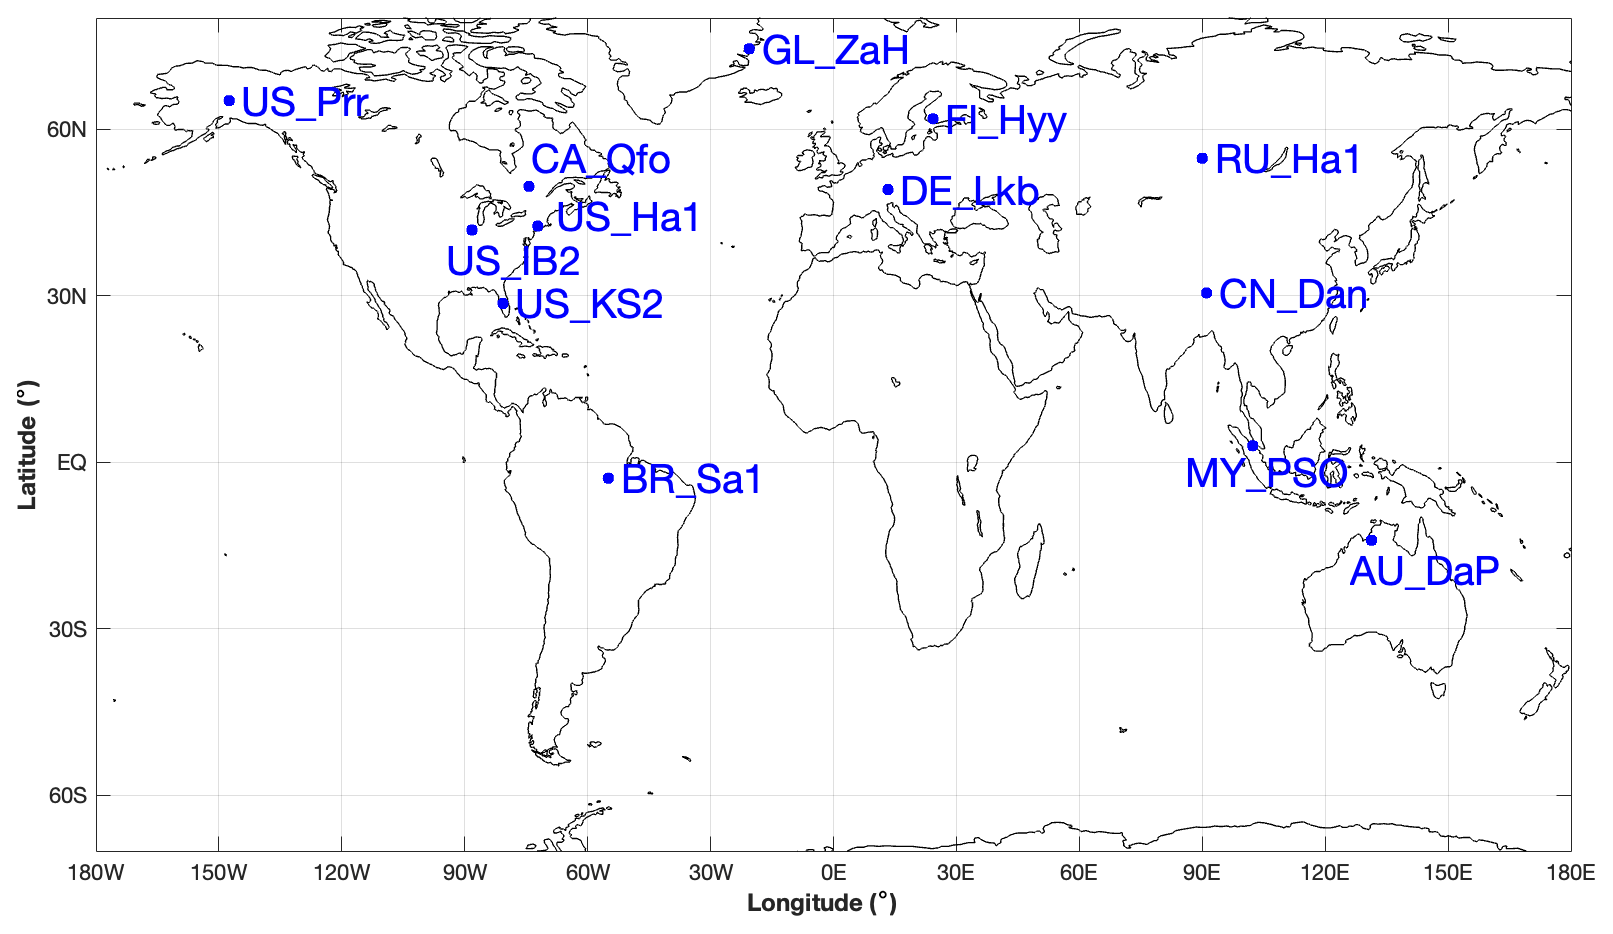
Figure 4Geographical distribution of selected FLUXNET2015 sites. The information on these FLUXNET sites is listed in Table 4.
Table 4The FLUXNET sites, latitude (“Lat”), longitude (“Long”), plant functional type (“PFT”), and time frame (“Time”) used for the SSiB5/TRIFFID/DayCent-SOM model validation.
2.3.2 Meteorological forcing data
The Princeton global meteorological dataset for land surface modeling (Sheffield et al., 2006) was used to drive the SSiB4/TRIFFID global simulations from 1948 to 2007 at 1° × 1° spatial resolution and a 3 h temporal interval. This dataset, which includes surface air temperature, pressure, specific humidity, wind speed, downward shortwave radiation flux, downward longwave radiation flux, and precipitation, was constructed by combining a suite of global observation-based datasets with the National Centers for Environmental Prediction/National Center for Atmospheric Research reanalysis data.
2.3.3 Global remote-sensing data
To assess the climatological status of, variation in, and trends of the simulated LAI, two widely used global LAI products were used as references in this study: the Global Inventory Modeling and Mapping Studies (GIMMS) LAI and the Global LAnd Surface Satellite (GLASS) LAI. GIMMS LAI is based on the third generation of the normalized difference vegetation index (NDVI3g) from the GIMMS group and an artificial neural network model (Zhu et al., 2013). GIMMS LAI provides 15 d composites with a ° resolution and spans from July 1981 to December 2011. GLASS LAI is generated from Advanced Very High Resolution Radiometer (AVHRR) (from 1982 to 1999 with 0.05° resolution) and Moderate Resolution Imaging Spectroradiometer (MODIS, from 2000 to 2012 with 1 km resolution) reflectance data using general regression neural networks (Xiao et al., 2014). The GIMMS and GLASS LAIs and the meteorological forcing data for the overlap period from 1982 to 2007 were remapped to a 1° spatial resolution and a monthly temporal interval.
The model tree ensemble (MTE) GPP product (Jung et al., 2009) was used as a reference to evaluate the simulated GPP. MTE is based on a machine learning technique in which the model is trained to predict the five C fluxes at FLUXNET sites driven by observed meteorological data, land cover data, and the remotely sensed fraction of absorbed photosynthetically active radiation (Jung et al., 2009). The trained model was then applied at the grid scale, driven by gridded forcing data. The MTE GPP data were resampled to a 1° spatial resolution and a monthly temporal resolution. However, the MTE data do not include CO2 fertilization. Liu et al. (2019) discussed this issue and indicated that the lack of CO2 fertilization mainly affects the trend. Since this paper focuses on climatological means as well as differences between different experiments in which the CO2 fertilization effect is largely canceled out, the lack of CO2 fertilization in FLUXNET-MTE is not a factor in interpreting our results.
To illustrate the reliability of the schemes that represent different processes of plant N in our framework, we first evaluated the model's short-term performance using in situ measurements (Sect. 3.2). Then, four sets of sensitivity experiments were designed to quantify the major effects of the plant N process and the relative contributions of different plant N processes on the terrestrial ecosystem carbon cycle (Sect. 3.3).
3.1 Initial conditions for the dynamic vegetation model
The initial condition of the dynamic vegetation model SSiB4/TRIFFID needs to be obtained from a long-term equilibrium simulation (Zhang et al., 2015). There are different ways to initialize the surface conditions for quasi-equilibrium simulations. Following previous SSiB4/TRIFFID studies (Huang et al., 2020; Liu et al., 2019; Zhang et al., 2015), we set up the initial conditions for the run using the SSiB vegetation map and SSiB vegetation table, which are based on ground surveys and satellite-derived information (Dorman and Sellers, 1989; Sellers et al., 1986; Xue et al., 2004; Zhang et al., 2015) with 100 % occupation at each grid point for the dominant PFT and zero occupation for other PFTs. We then ran the SSiB4/TRIFFID model with climate forcing and the atmospheric CO2 concentration at the 1948 level for 100 years to reach equilibrium. The vegetation and soil conditions from the equilibrium results were used as the initial conditions for the subsequent model runs.
Determining the initial conditions for SSiB5/TRIFFID/DayCent-SOM was carried out as described for SSiB4/TRIFFID with one additional step to initialize the global soil C and N levels. We saved 60 years of daily litter inputs and soil temperature and moisture conditions from SSiB4/TRIFFID, which were based on historical meteorological forcings (1948–2007). An offline version of DayCent-SOM was run for 2000 years for each grid cell using this 60 years of data, repeated repeatedly, to determine the quasi-equilibrium soil C and N levels; these soil C and N values were read in by SSiB5/TRIFFID/DayCent-SOM at the start of the global simulation in 1948. This approach was applied for both measurement sites and global 2-D simulations.
3.2 Site-level validation
This paper focuses on the impact of N processes on the climatology of the global carbon cycle. Most current dynamic global vegetation models (DGVMs) are mainly focused on long-term (decadal to thousands of years or even longer) simulations at the global scale; diurnal and seasonal variations are not the subject of their modeling. Moreover, adequate long-term in situ measurements are not available for comparison. However, since SSiB5/TRIFFID is a process-based model, we can evaluate the model's short-term performance using in situ measurements.
A total of 13 sites with representative biome types and climate zones (Table 4 and Fig. 4) were selected to evaluate the simulations of seasonal patterns of fluxes across these sites. Site-level simulations were conducted by SSiB4/TRIFFID (a C-only model) and SSiB5/TRIFFID/DayCent-SOM separately to validate the model's performance. The model results were compared against the observed daily data obtained by the flux tower, including the GPP, sensible heat flux, and latent heat flux.
3.3 Global 2-D offline control runs and sensitivity runs
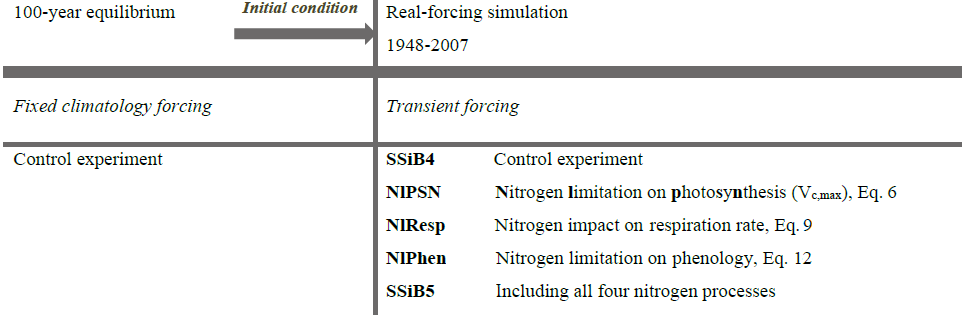
In this study, SSiB4/TRIFFID and SSiB5/TRIFFID/DayCent-SOM were applied to conduct a series of global 2-D offline runs (Table 5). All these runs employed the quasi-equilibrium simulation results as the initial conditions and were then driven by the historical meteorological forcing from 1948 through 2007. The run using SSiB4/TRIFFID is referred to as the control run (Exp. SSiB4 hereafter). Using the control simulation, we first evaluated the ability of the model to produce the climatology and variability of several biotic variables by comparing the results to multiple observation-based datasets. In addition to the control run, four sets of sensitivity experiments were conducted to quantify the major effects of the N process and C–N interface coupling methodology on the C cycle. These sensitivity experiments were designed as follows.
-
Nitrogen limitation on photosynthesis (Exp. NlPSN). The same meteorological forcing as that used for the control (Exp. SSiB4) drives the model, but the dynamic CNR and N limitation on Vc,max (Eq. 6) are introduced. The difference between Exp. SSiB4 and Exp. NlPSN indicates the effect of N limitation on photosynthesis.
-
Nitrogen impact on respiration rate (Exp. NlResp). The model was driven by the same meteorological forcing as that used for Exp. SSiB4, but the dynamic CNR and N impacts on autotrophic respiration (Eq. 9) are introduced. The difference between Exp. SSiB4 and Exp. NlResp indicates the effect of N on the respiration rate.
-
Nitrogen limitation on phenology (Exp. NlPhen). The model was driven by the same meteorological forcing as that used for Exp. SSiB4, but the dynamic CNR and N impacts on phenology (Eq. 12) were introduced. The difference between Exp. SSiB4 and Exp. NlPhen indicates the effect of nitrogen limitation on phenology.
-
SSiB5/TRIFFID/DayCent-SOM (Exp. SSiB5). The model was driven by the same meteorological forcing as that used for Exp. SSiB4, but all four C–N coupling processes in the framework, i.e., the dynamic CNR, N impacts on photosynthesis, autotrophic respiration, and phenology, are introduced. The difference between Exp. SSiB4 and Exp. SSiB5 indicates the effect of N dynamics, especially the sensitivity of C-cycle variability and trends to N process coupling. Furthermore, the difference between Exp. NlPSN and Exp. SSiB5 indicates uncertainty (or possible errors) due to missing N effects on autotrophic respiration and phenology in the coupling framework.
Although the model runs were from 1948 to 2007, we only present the results from 1982–2007 to avoid spinning up for SSiB5/TRIFFID/DayCent-SOM after SSiB4/TRIFFID and DayCent-SOM have each reached their historical equilibrium conditions. Since the results from Exps. SSiB5 and NlPSN showed statistically significant differences from Exp. SSiB4 over many parts of the world, in the following discussion, we will mainly focus on the differences between these two experiments and Exp. SSiB4.
To test this framework, measurements from flux tower sites with different PFTs and global satellite-derived products from 1982–2007 are employed as references. The results from site simulation and global 2-D simulations are presented in Sect. 4.1 and 4.2, respectively. As mentioned in Sect. 2, the framework takes some plant N metabolism processes into account. To illustrate the relative contributions of different plant N processes to the terrestrial ecosystem carbon cycle, four sets of sensitivity experiments were designed (Table 5). The analyses are presented in Sect. 4.2.
4.1 Evaluations using measurements from flux tower sites
Land models with dynamic vegetation and nitrogen processes normally focus on long-term climate simulations at large spatial scales. In this section, we validate the model performance for 13 sites with several years of simulation (Table 4) to ensure that, as a process-based model, the short-term SSiB5/TRIFFID simulation is still able to properly represent the surface processes at seasonal scales after the introduction of DayCent-SOM through the interface coupling framework. This evaluation also provides a glimpse into the model's performance at several sites with various climates and PFTs (Table 4) with short-term data to gain preliminary confidence for further evaluation.
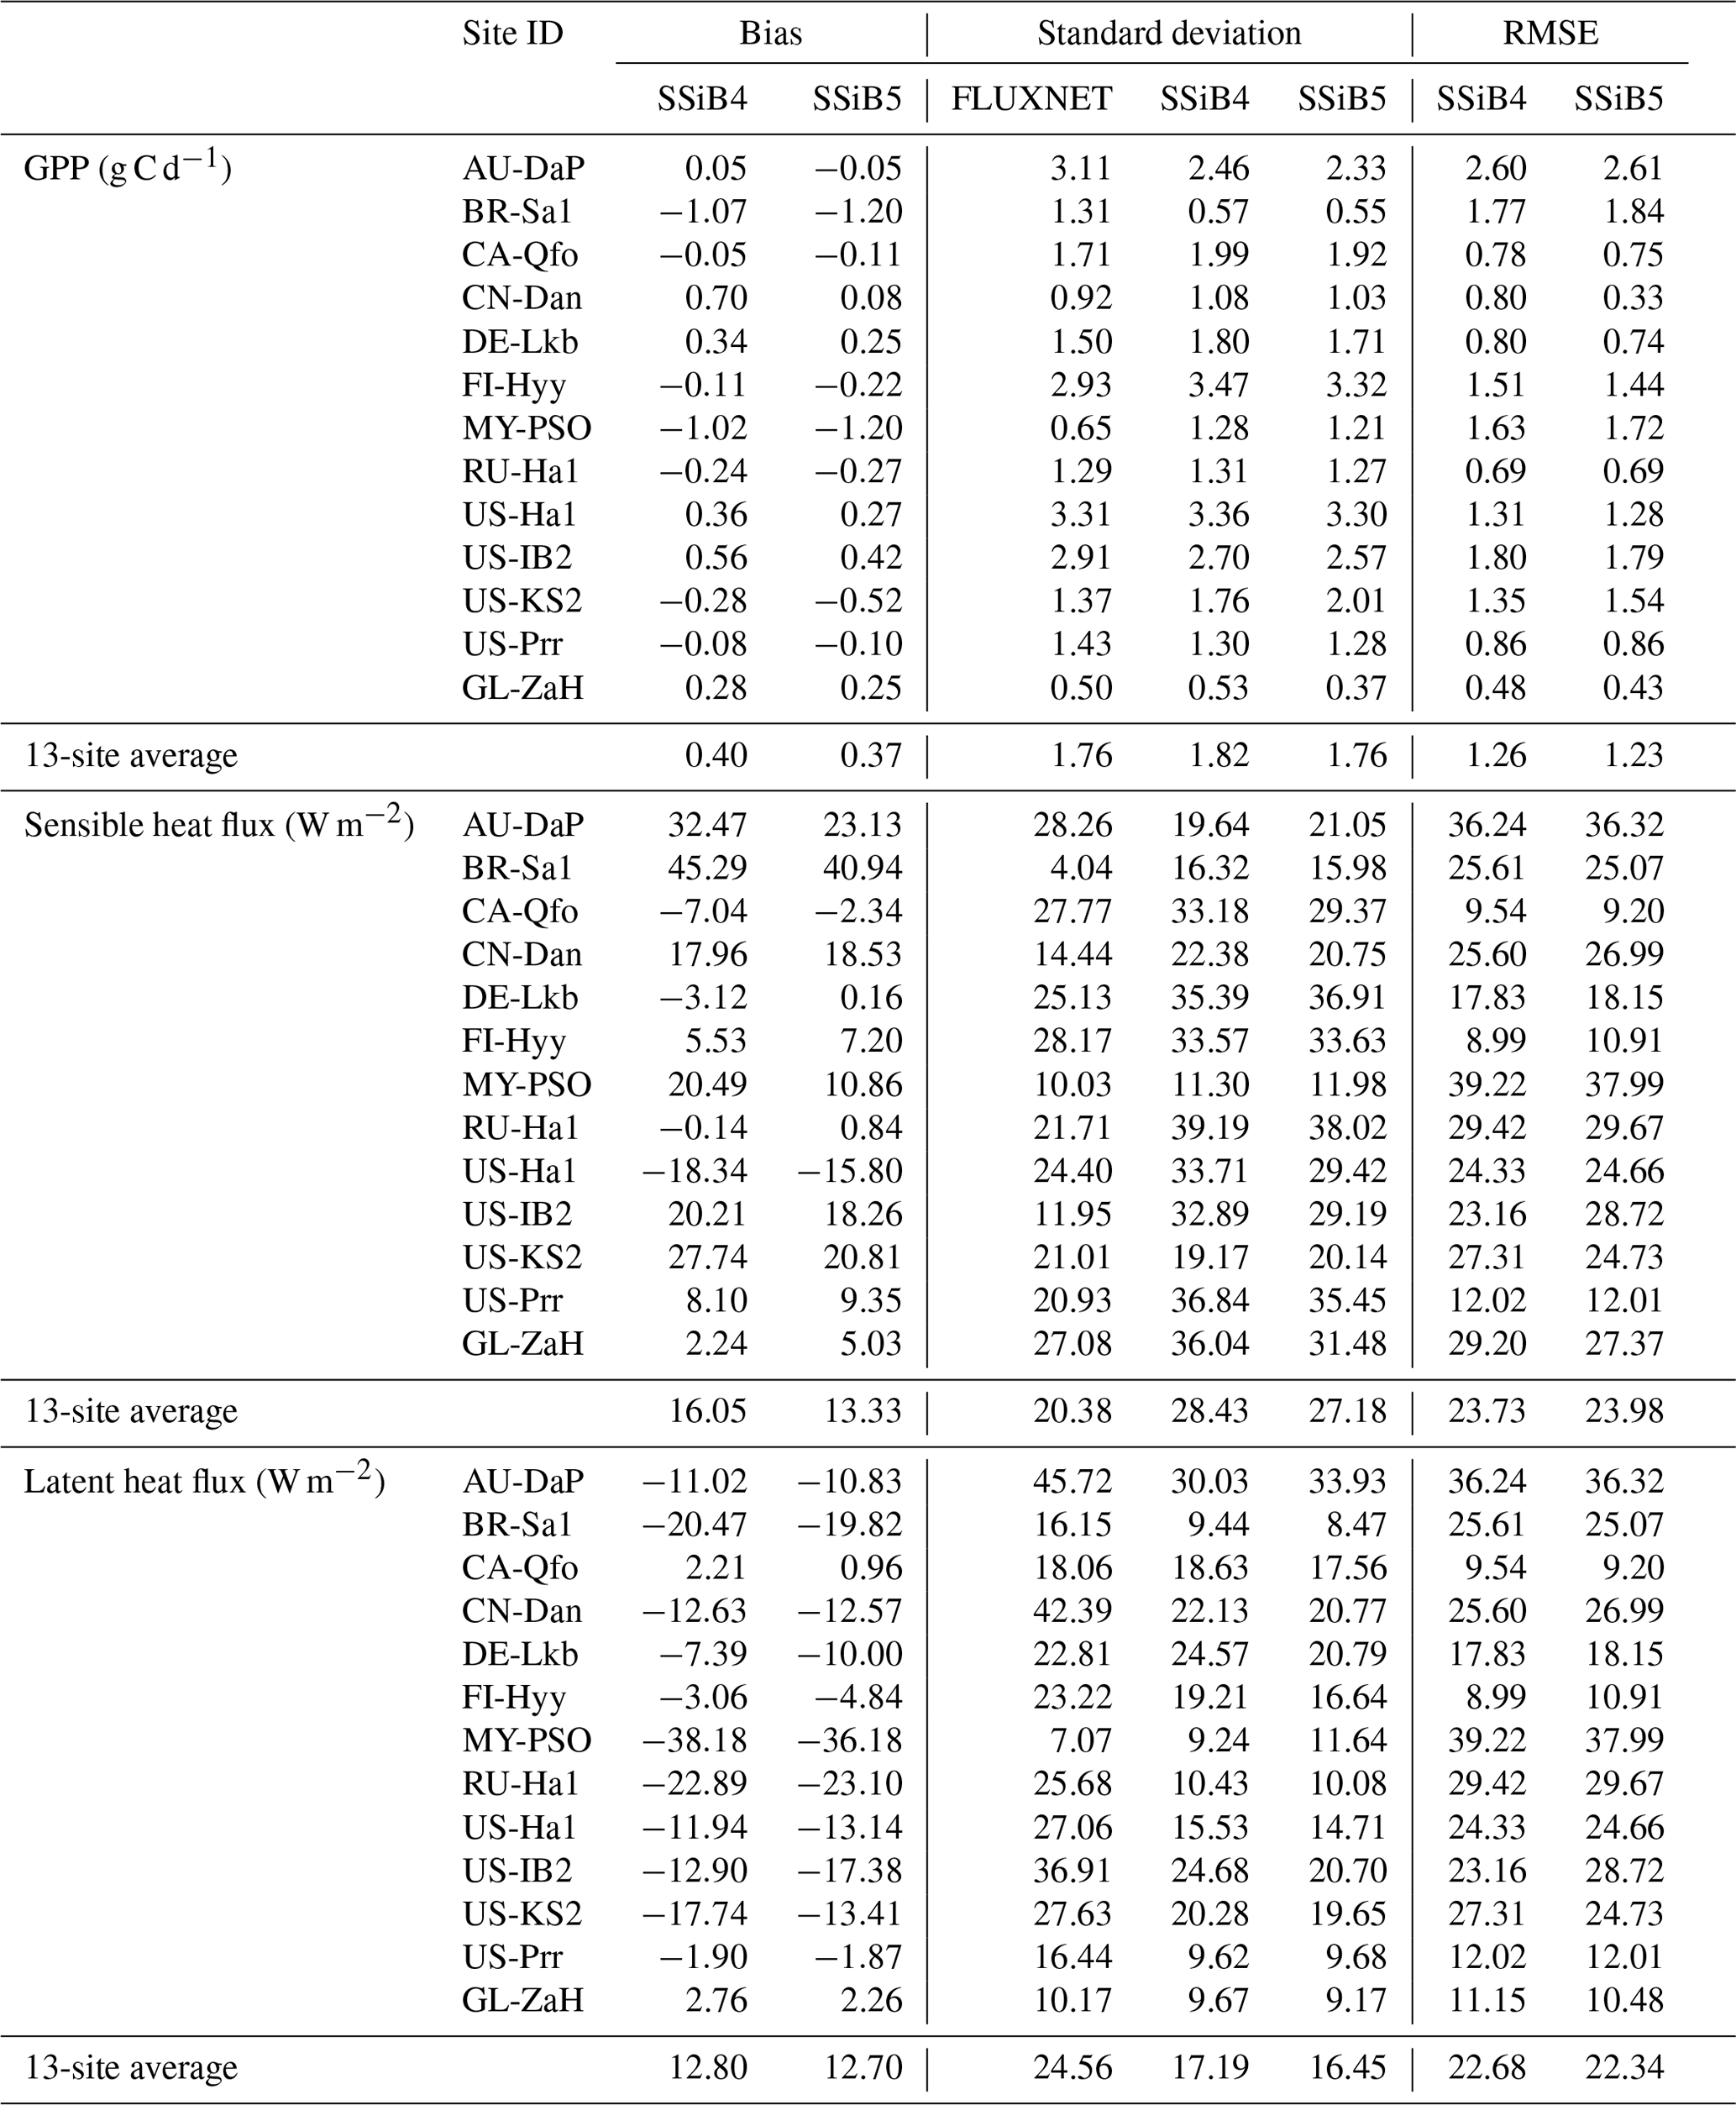
Figures 5, 6, and 7 show that both SSiB4 and SSiB5/TRIFFID/DayCent-SOM produce a reasonable seasonal cycle for GPP, sensible heat, and latent heat fluxes, respectively, and that the results are close to the observations. Table 6 summarizes the major results. We use bias, root-mean-square error (RMSE), and standard deviation to assess model performance against in situ site measurements. The improvements in the SSiB5 model bias compared to SSiB4, which are presented in Table 6, are all statistically significant at the α=0.05 level of the t-test values. When we evaluated the average of the 13 sites, the biases for GPP and sensible and latent heat fluxes decreased by approximately 7 %, 17 %, and 2 %, respectively. The average RMSEs over the 13 sites for these three variables also decreased by approximately 2 %, consistent with the reduction in bias. Furthermore, SSiB5/TRIFFID/DayCent-SOM produced a closer standard deviation for GPP, sensible heat flux, and latent heat flux than SSiB4/TRIFFID did for the 13-site averages. Overall, in these short-term simulations with specified initial vegetation conditions, both SSiB4 and SSiB5 produce reasonable GPP and surface heat fluxes compared with in situ measurements, but adding N processes (SSiB5) slightly improved the 13-site average. Although these improvements are rather marginal (except for the bias reduction for sensible heat), the results nevertheless demonstrate that, with short-term simulation, the improvement in the model simulations is rather consistent.
With closer checking of the SSiB4 vs. SSiB5 results at each site, the results display various characteristics. For instance, while some sites showed improvements in all three variables (GPP and latent and sensible heat fluxes), others only showed improvements in one or two variables. It should be noted that SSiB4 and SSiB5 are mainly used for global studies. For the validation of in situ measurements, proper optimization of some site-specific soil and vegetation parameters is necessary (Xue et al., 1996, 1997). In this study, no model parameters were optimized during this validation exercise for a better fit between the simulated results and FLUXNET measurements. The discussions above led us to conduct long-term experiments at a global scale to comprehensively investigate the effects of N processes and to help us understand the mechanisms governing the global carbon cycle, which will be discussed in the following section.
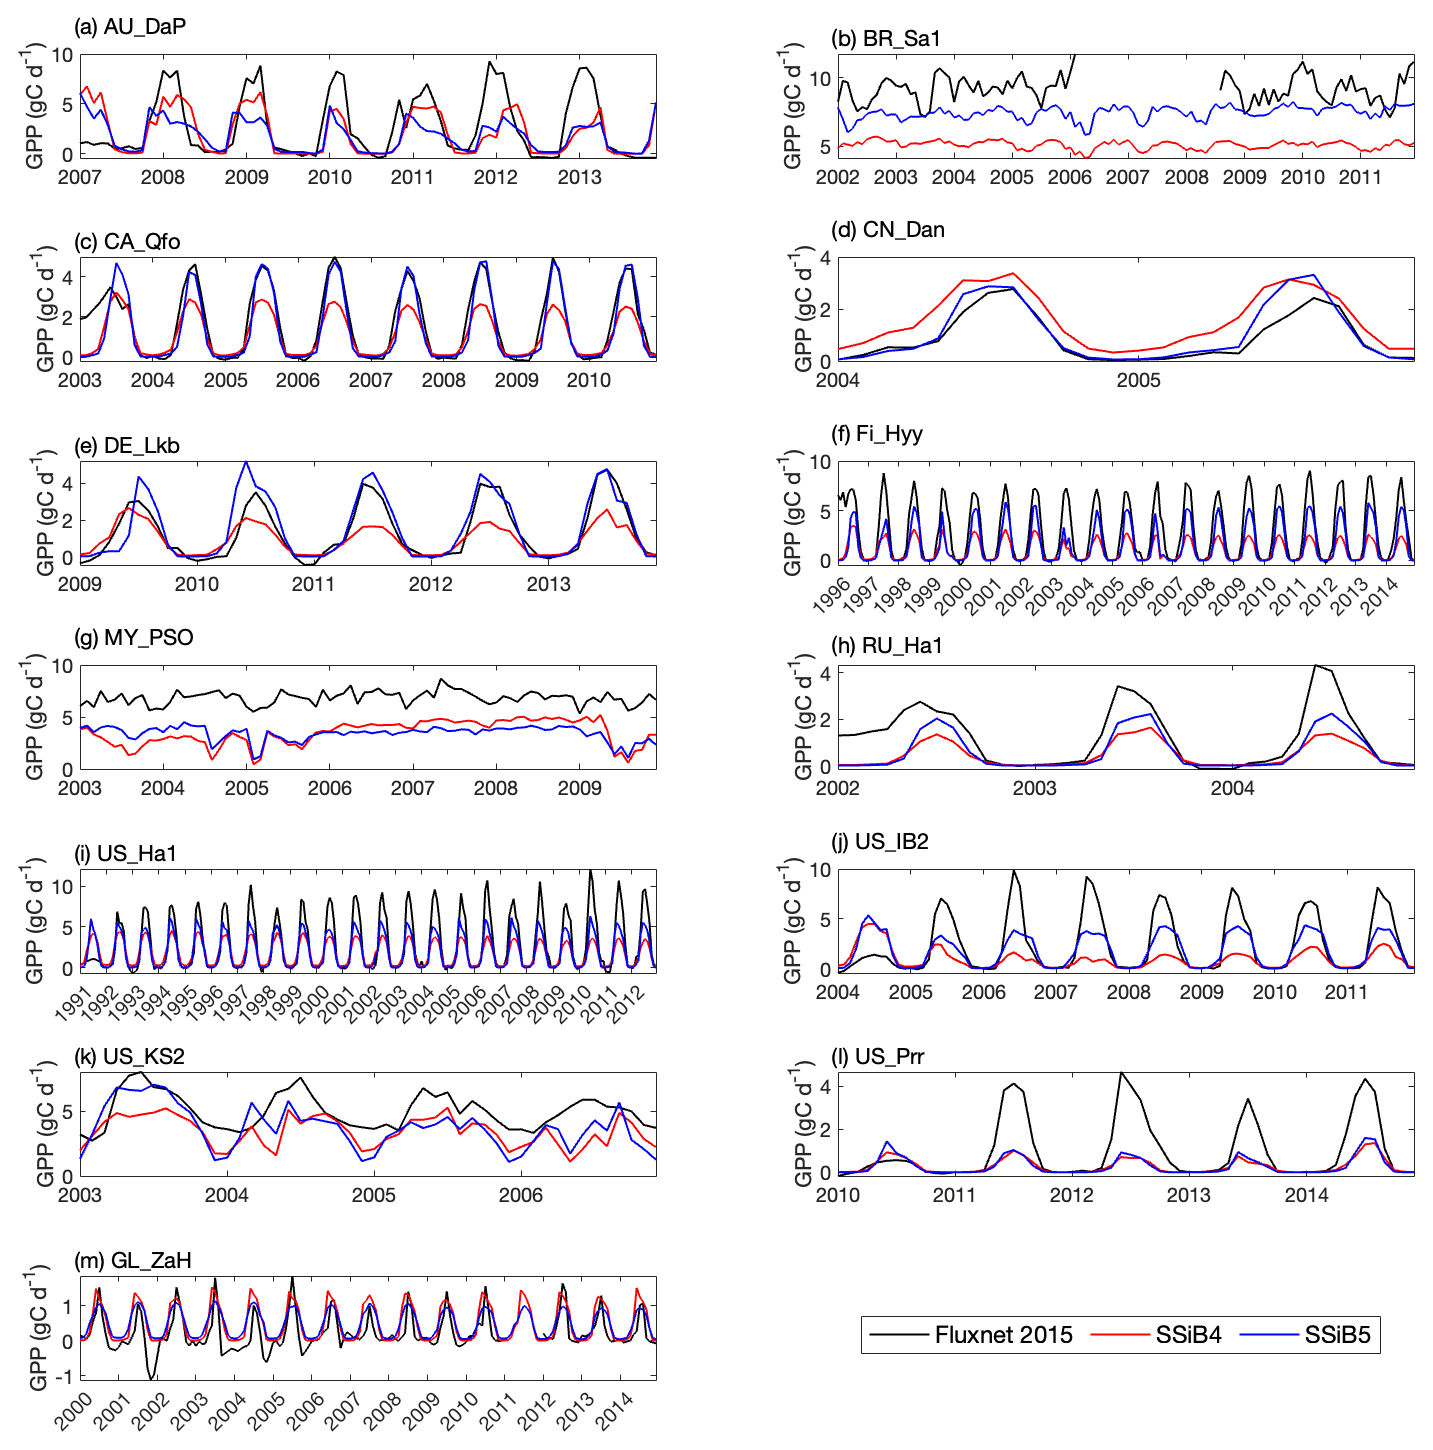
Figure 5Simulated seasonal variations in GPP against observations at 13 sites representing different SSiB5 PFTs. Note that the information about these FLUXNET sites is listed in Table 4.
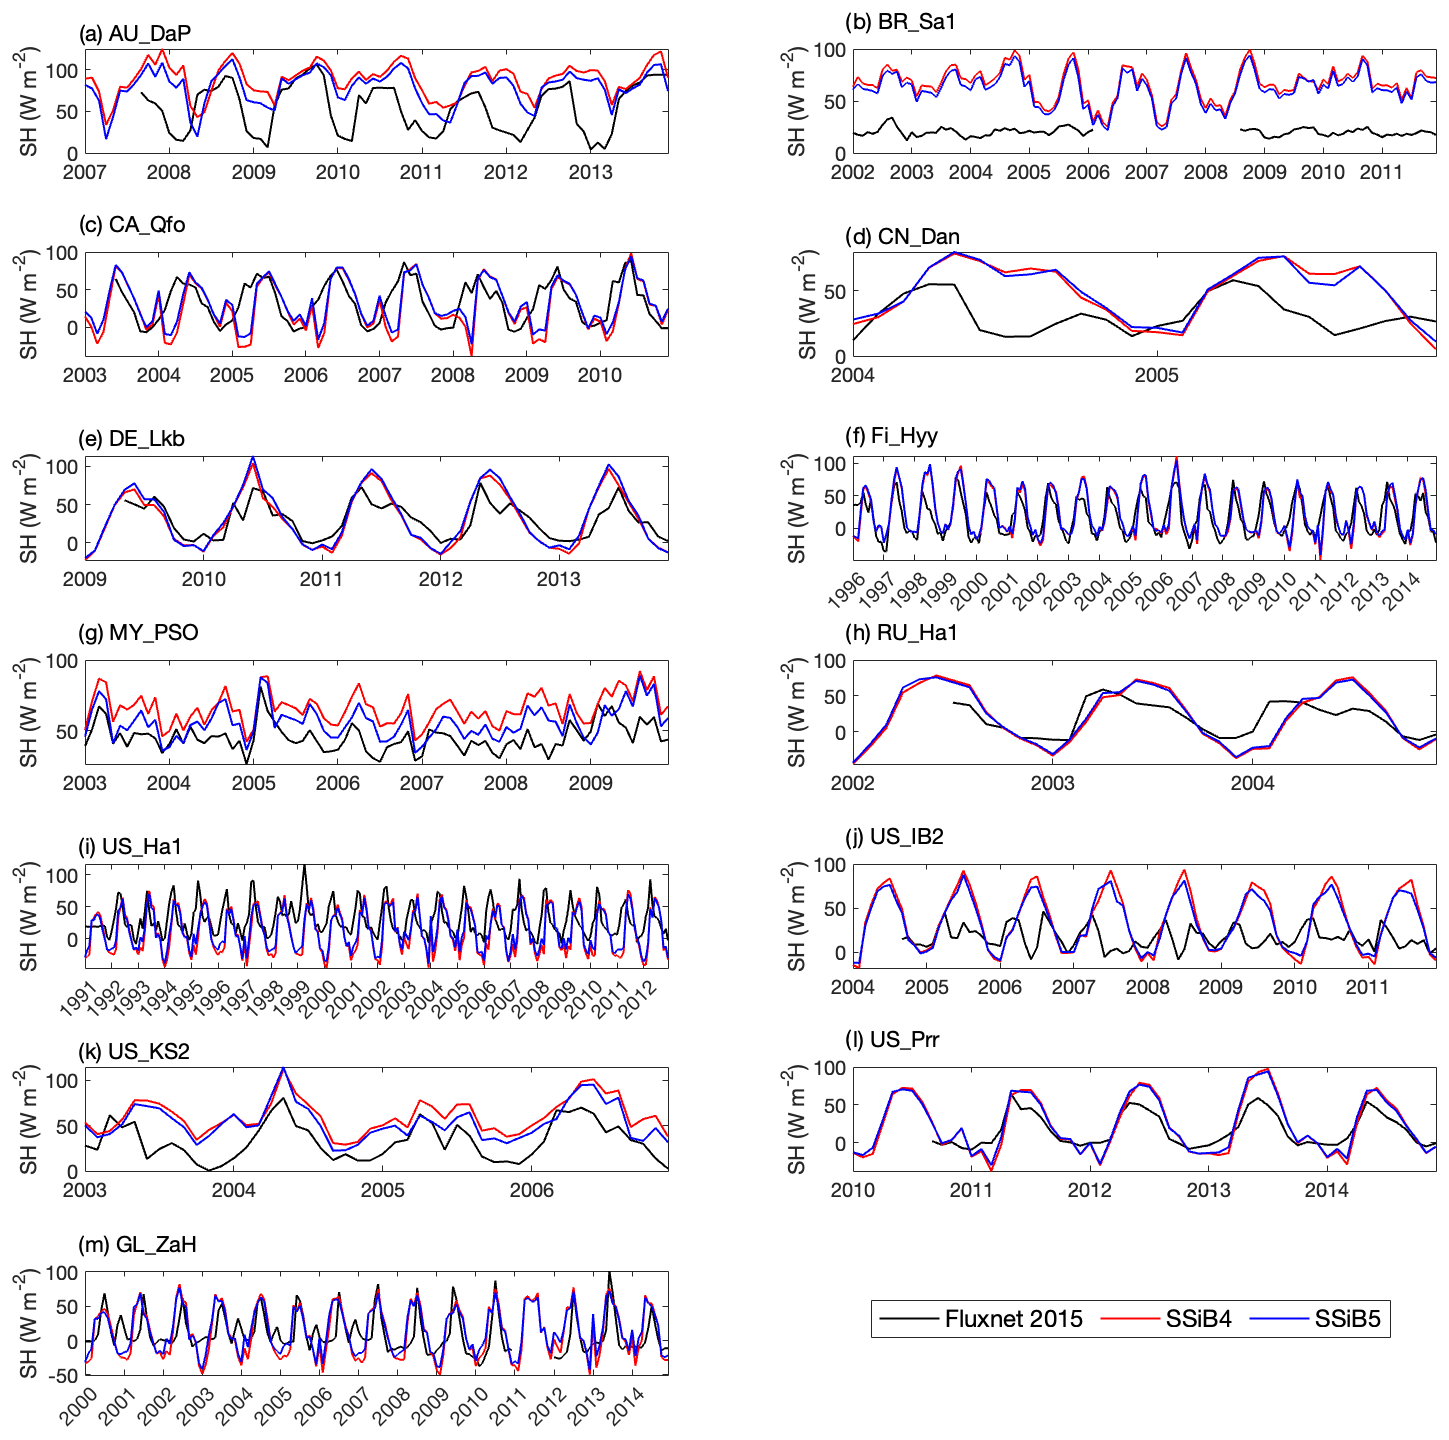
Figure 6Simulated seasonal variations in sensible heat flux against observations at 13 sites representing different SSiB5 PFTs.
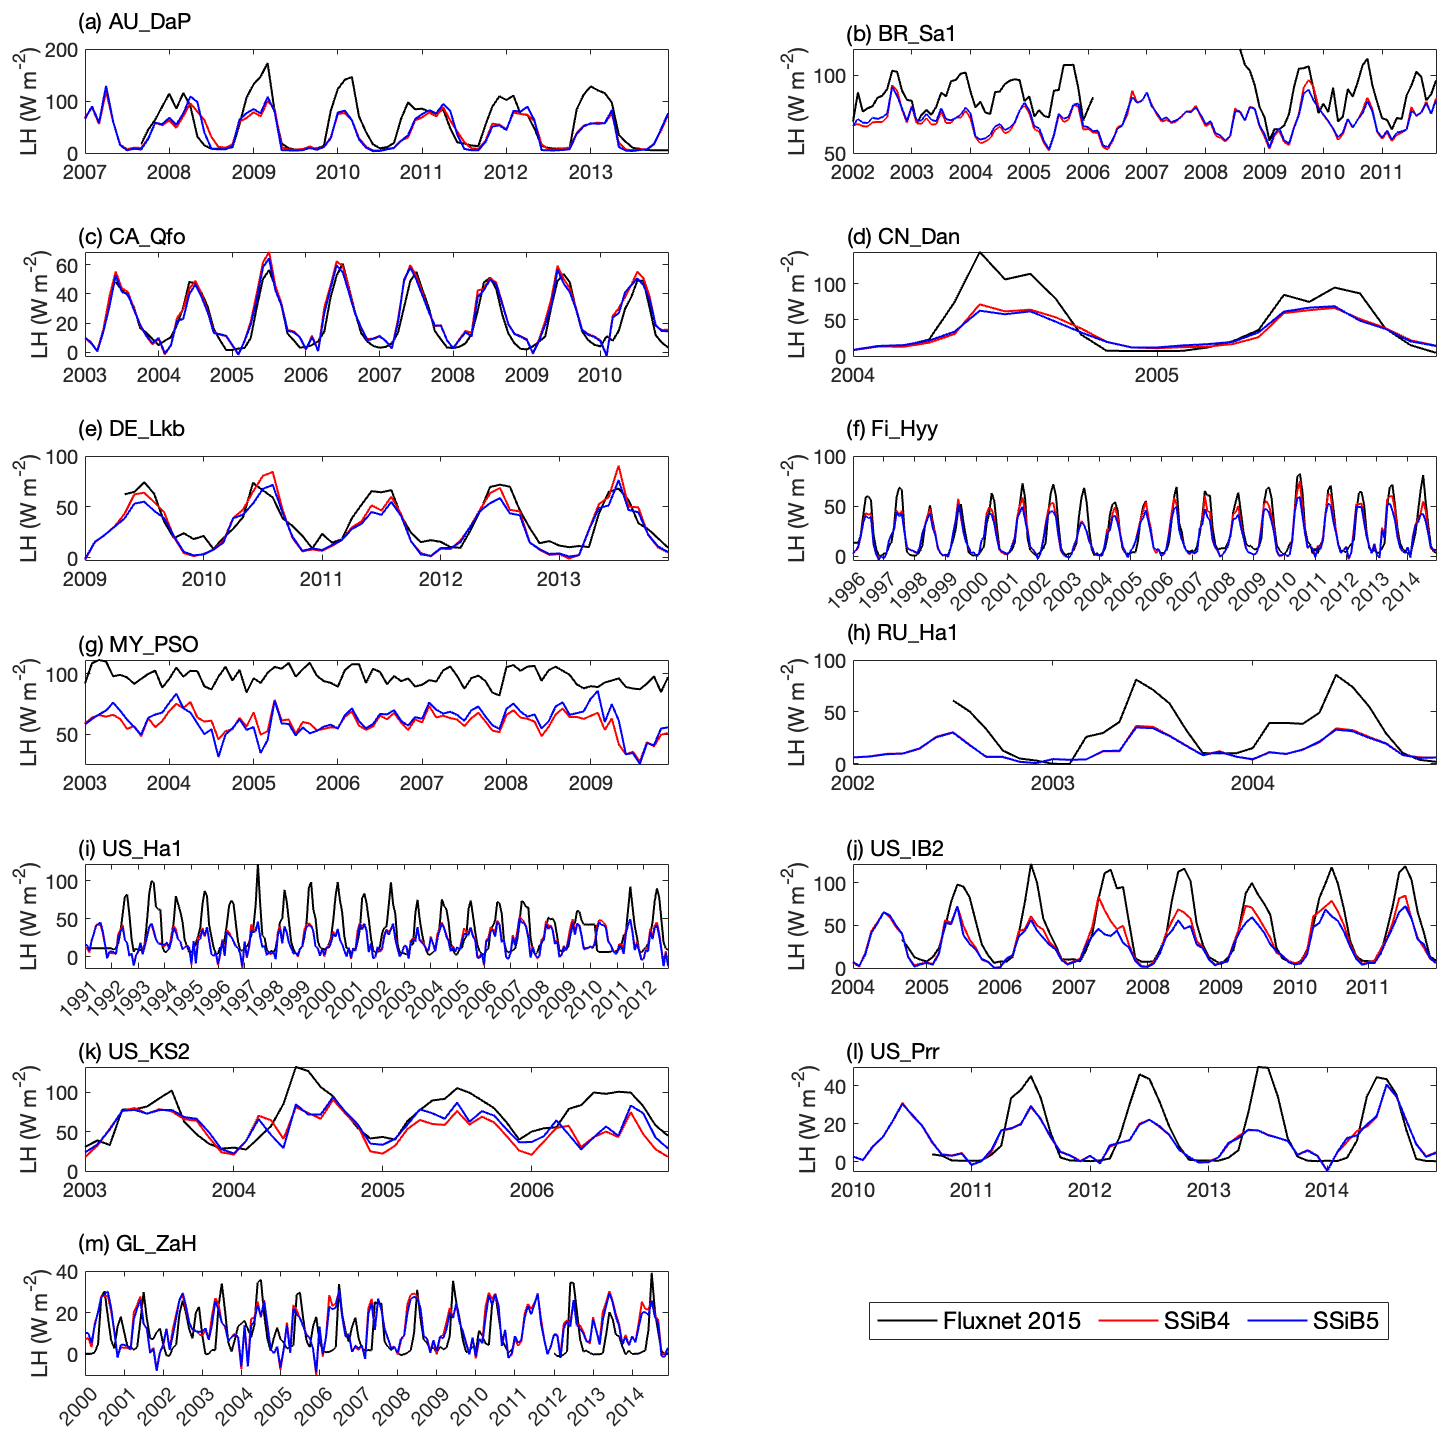
Figure 7Simulated seasonal variations in latent heat flux against observations at 13 sites representing different SSiB5 PFTs.
Table 6The GPP, sensible heat flux, and latent heat flux comparisons of bias, standard deviation, and RMSE between SSiB4 and SSiB5 at the 13 sites.
4.2 Evaluation of GPP and LAI at the global scale
The SSiB model is mainly used for global climate studies. It is important to adequately produce the observed global GPP and LAI. The model's performance in these aspects is evaluated in this section. The SSiB4/TRIFFID-simulated global PFT distribution has been extensively discussed by Zhang et al. (2015) and Liu et al. (2019). The simulation results are generally consistent with the observations. The spatial distribution of SSiB5/TRIFFID/DayCent-SOM did not show substantial differences and will not be discussed here. The simulated GPP averaged over 1982–2007 was compared to the FLUXNET-MTE GPP (Jung et al., 2011) to examine the impact of N processes and their coupling with C and ecosystem processes. Both SSiB4/TRIFFID (Exp. SSiB4) and SSiB5/TRIFFID/DayCent-SOM (Exp. SSiB5) capture the distribution of global GPP (Fig. 8) and its latitudinal distribution (Fig. 9a).
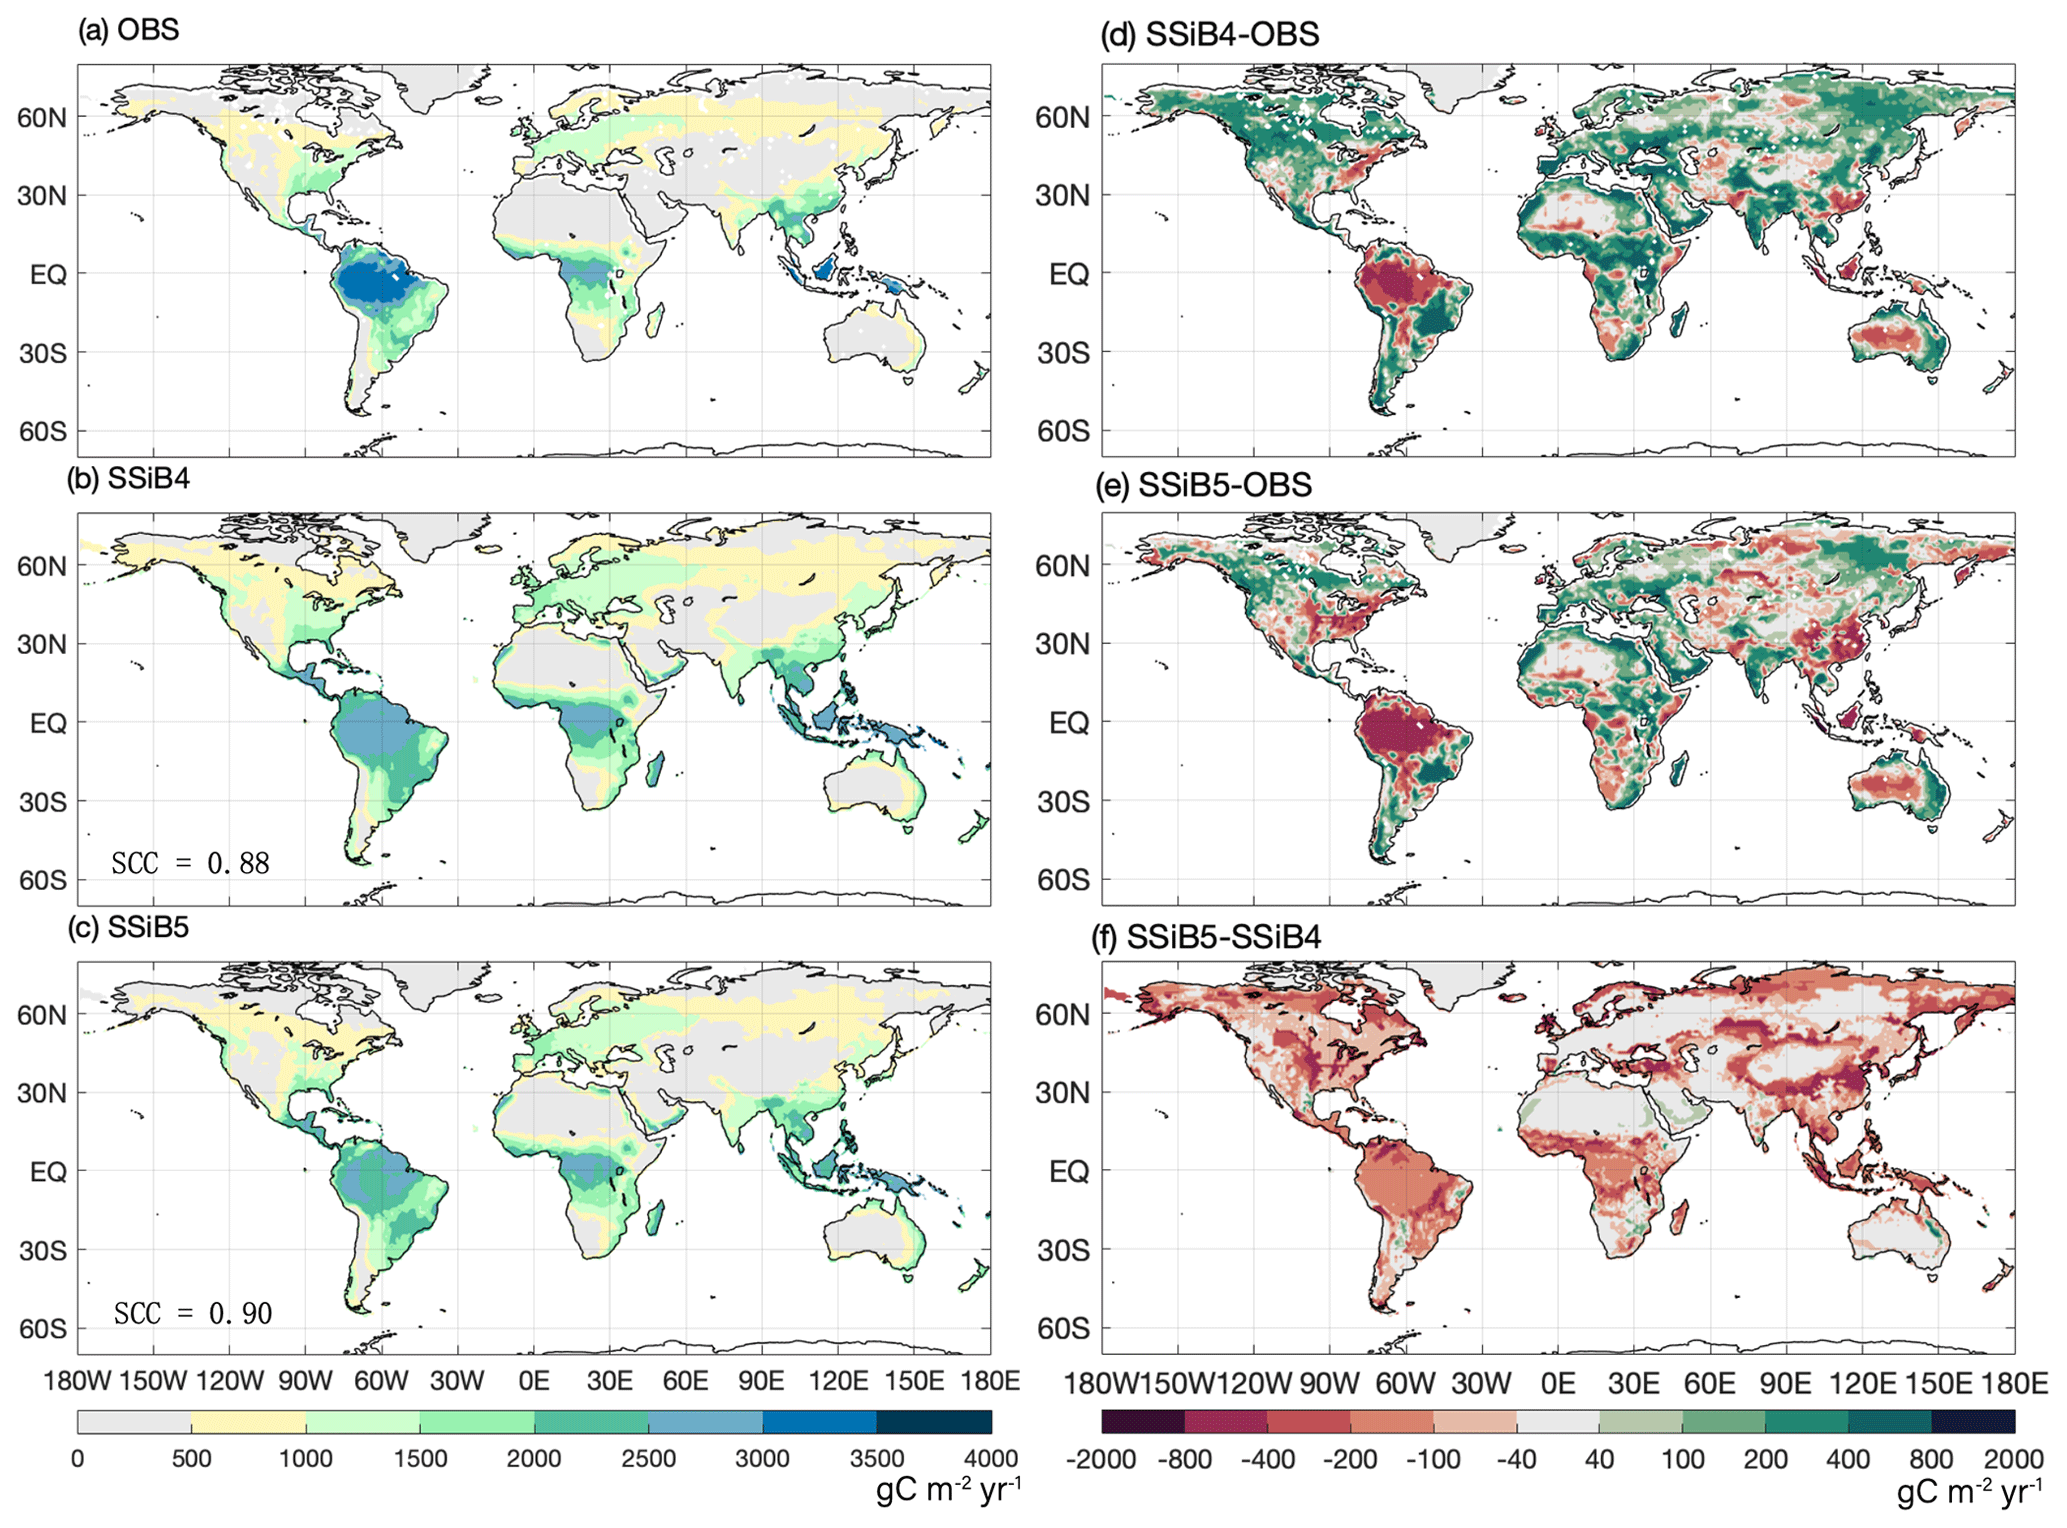
Figure 8The 1982–2007 average gross primary production comparison for (a) FLUXNET-MTE GPP (OBS), (b) SSiB4/TRIFFID (SSiB4), and (c) SSiB5/TRIFFID/DayCent-SOM (SSiB5) and the differences between (d) SSiB4 and OBS, (e) SSiB5 and OBS, and (f) SSiB5 and SSiB4. Note that SCC indicates the spatial correlation coefficient between the model simulation and satellite-derived datasets (OBS).
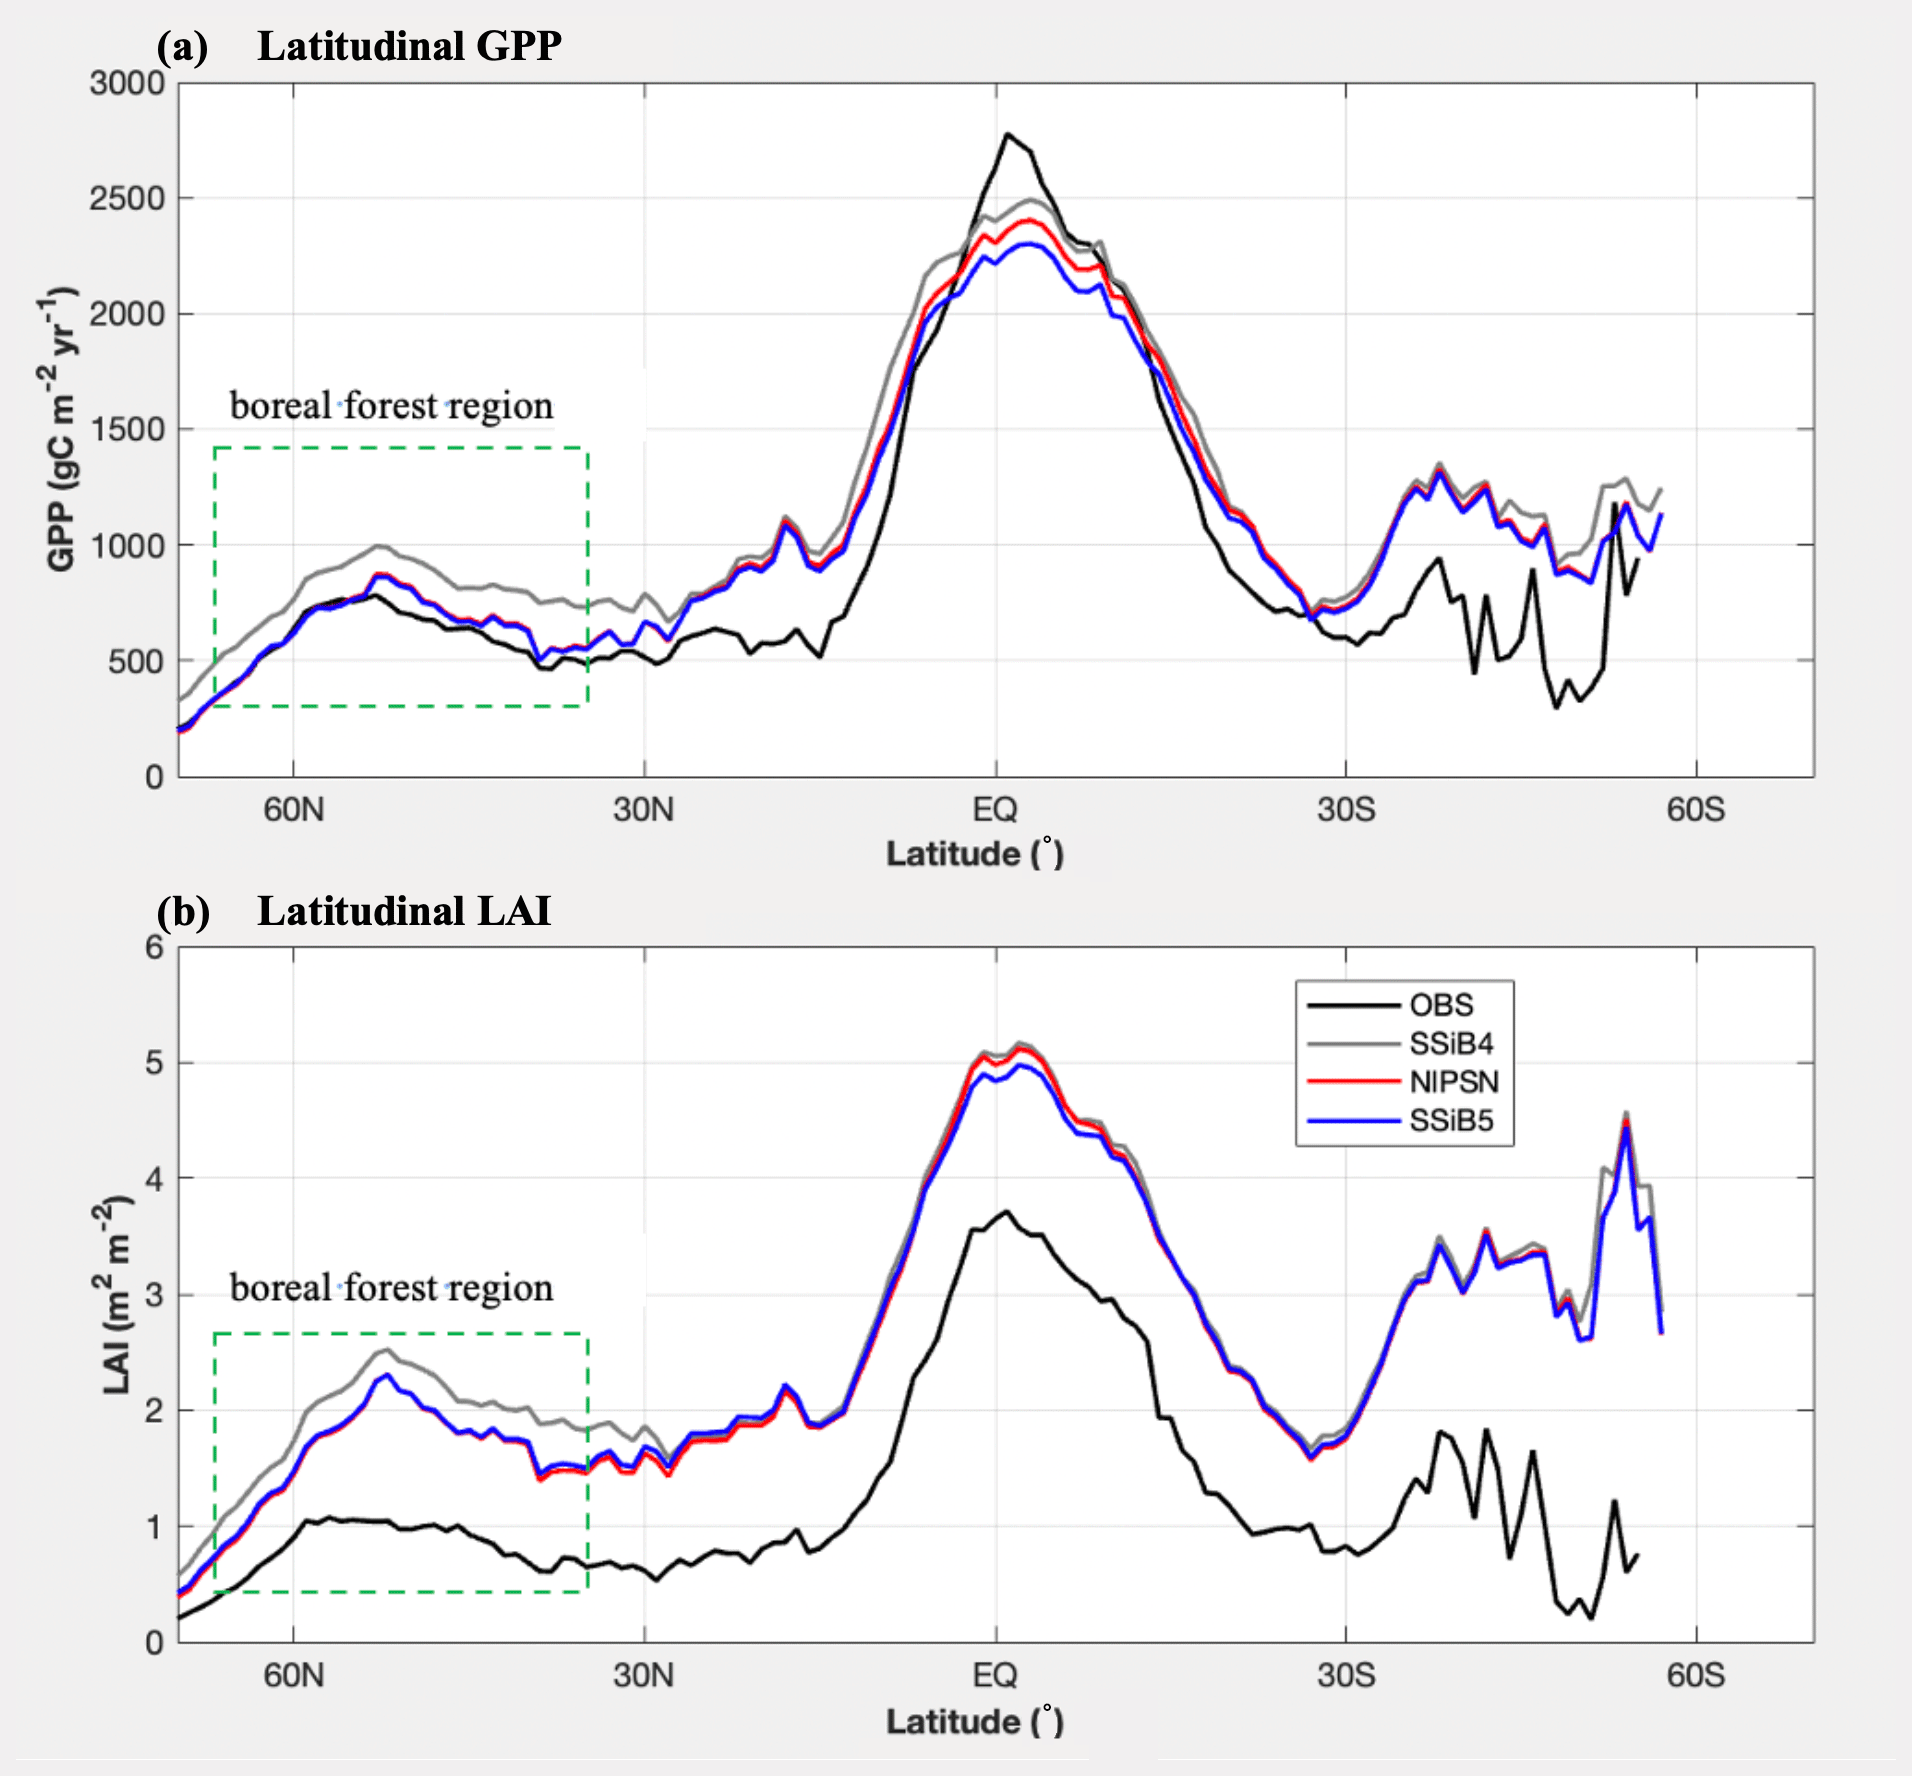
Figure 9Intercomparisons of latitudinal LAI and GPP among OBS, SSiB4 (control), NlPSN (N limitation on photosynthesis only), and SSiB5 (all N processes) over the period of 1982–2007. Note that the observed LAI is the GIMMS LAI.
The highest GPP occurs in tropical evergreen forests and generally decreases with increasing latitude according to both the observations and the model simulations (Figs. 8 and 9a). Exp. SSiB4-simulated GPP has a positive bias over many parts of the world (Fig. 8d), including tropical Africa and the North American and eastern Siberian boreal regions, but a negative bias in some regions, mainly in the Amazon tropical forest. The simulated global GPP is 1082.36 g C m−2 yr−1 (Table 7), which is higher than the estimated value of 862.86 g C m−2 yr−1 in FLUXNET-MTE (Jung et al., 2011).
Table 7Regional and global GPP for (a) FLUXNET-MTE GPP (observation), (b) SSiB4 (control), (c) NlPSN (N limitation on photosynthesis only), and (d) SSiB5 (N limitation on photosynthesis, autotrophic respiration, and phenology).
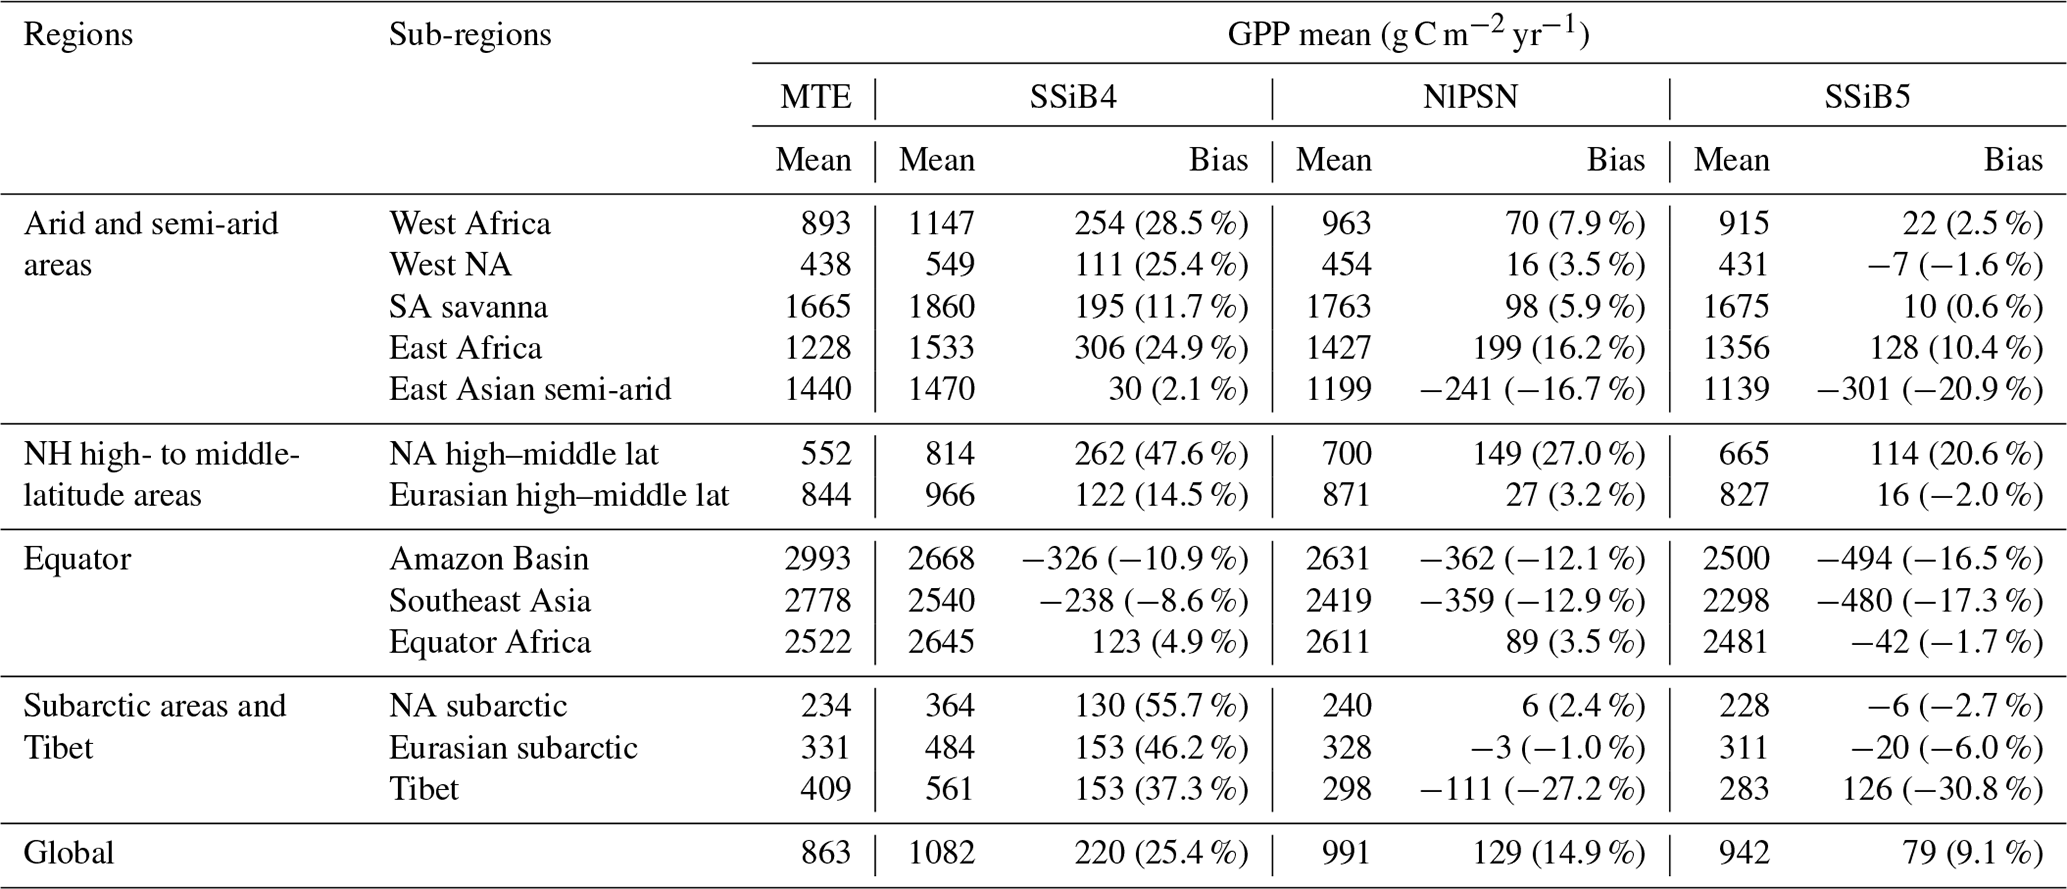
Note that the numbers in parentheses are relative biases (bias (MTE mean)). Except Tibet, the improvements in the SSiB5 and NlPSN bias compared to SSiB4 are all statistically significant at the α=0.05 level of the t-test values. NH denotes the Northern Hemisphere; NA and SA denote North America and South America, respectively.
After introducing N limitation for the three processes, SSiB5 reduced the positive bias in SSiB4 over many parts of the world (Figs. 8e and f and 9a). Exp. SSiB5's global GPP simulation, 941.81 g C m−2 yr−1, is closer to the observations than Exp. SSiB4, with a 16.3 % reduction in the bias (Table 7). Furthermore, the interannual variability and annual cycle are also assessed. The correlation for interannual variability (Fig. 10a) in SSiB4 is already very high (0.98). SSiB5 continues to keep the high correlation as SSiB4. However, the standard deviations for the observations of SSiB4 and SSiB5 are 14.7, 26.7, and 19.9, respectively. SSiB5 is closer to the observations. The underestimation of interannual variability in terrestrial vegetation production by terrestrial ecosystem models (Lin et al., 2023; MacBean et al., 2021) does not appear in this study. The temporal correlation coefficients between the observed and simulated monthly mean GPPs for the Northern Hemisphere/Southern Hemisphere increased from 0.73/0.50 (Exp. SSiB4) to 0.75/0.55 (Exp. SSiB5), respectively (Fig. 10b and c), showing improvement in the simulation of the seasonal cycle in SSiB5.
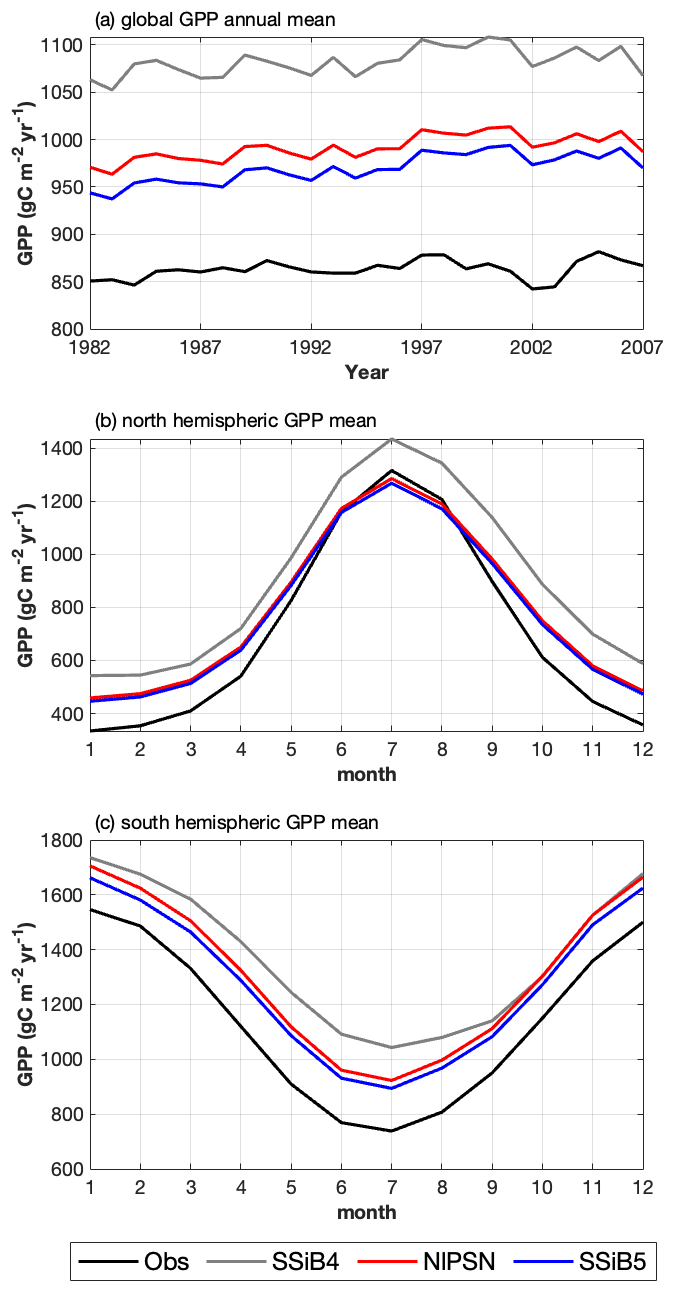
Figure 10(a) Intercomparisons of global annual mean GPPs among OBS, SSiB4 (control), NlPSN (N limitation on photosynthesis only), and SSiB5 (all N processes). (b, c) Monthly mean GPPs averaged over the period of 1982–2007 for the Northern Hemisphere (0 to 50° N) and Southern Hemisphere (60 to 0° S).
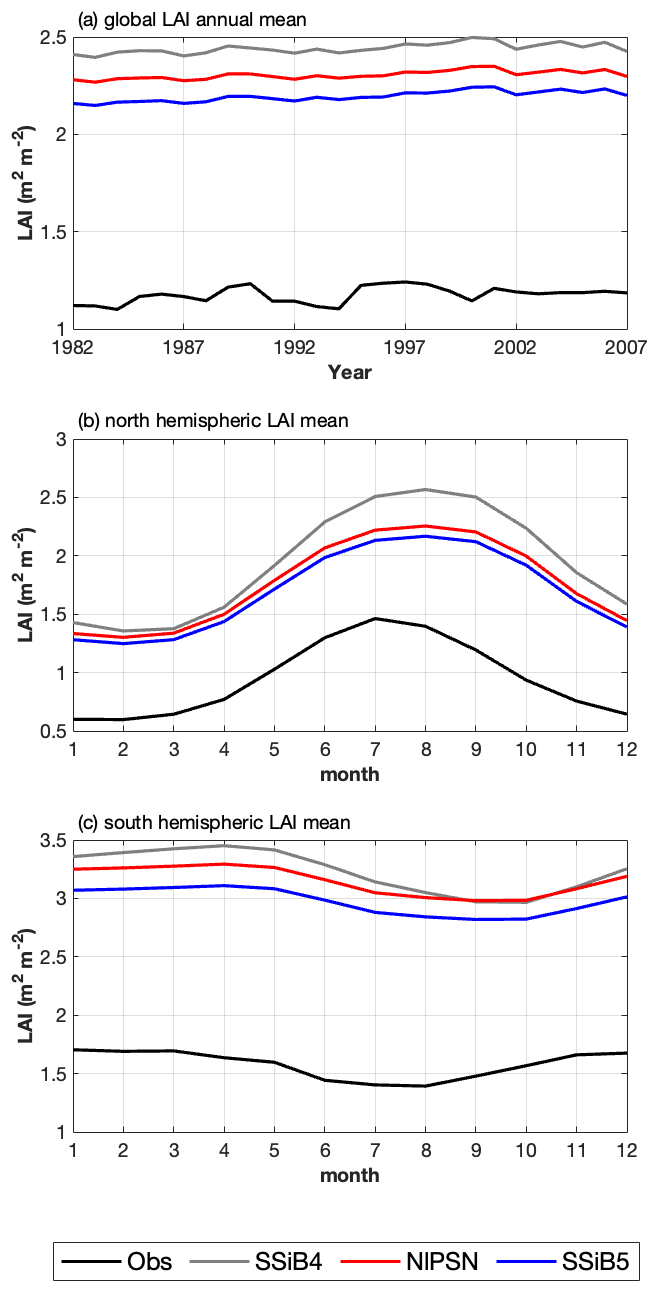
Figure 11(a) Intercomparisons of global annual mean LAIs among OBS, SSiB4, NlPSN, and SSiB5. (b, c) Monthly mean LAIs averaged over the period of 1982–2007 for the Northern Hemisphere (0 to 50° N) and Southern Hemisphere (60 to 0° S). Note that the observed LAI is the GIMMS LAI.
The improvement, however, is not homogeneous across the globe but displays apparent regional characteristics. The GPP biases in tropical Africa, the North American boreal region, the South American savanna, and the central USA showed substantial reductions (Fig. 8f), which helped improve the spatial distribution of SSiB5. The global spatial correlation coefficient increases from 0.88 to 0.90 (Fig. 8). Moreover, the GPP simulations did not improve in some regions, such as in temperate East Asian mixed forest–grassland regions and in some areas of Siberia (Fig. 8). In particular, the negative GPP bias in the Amazon increased (Fig. 8f). This phenomenon also appeared in the offline test at the Amazon site (the BR-Sa1 site, Table 4). We will further discuss this issue in Sect. 5.
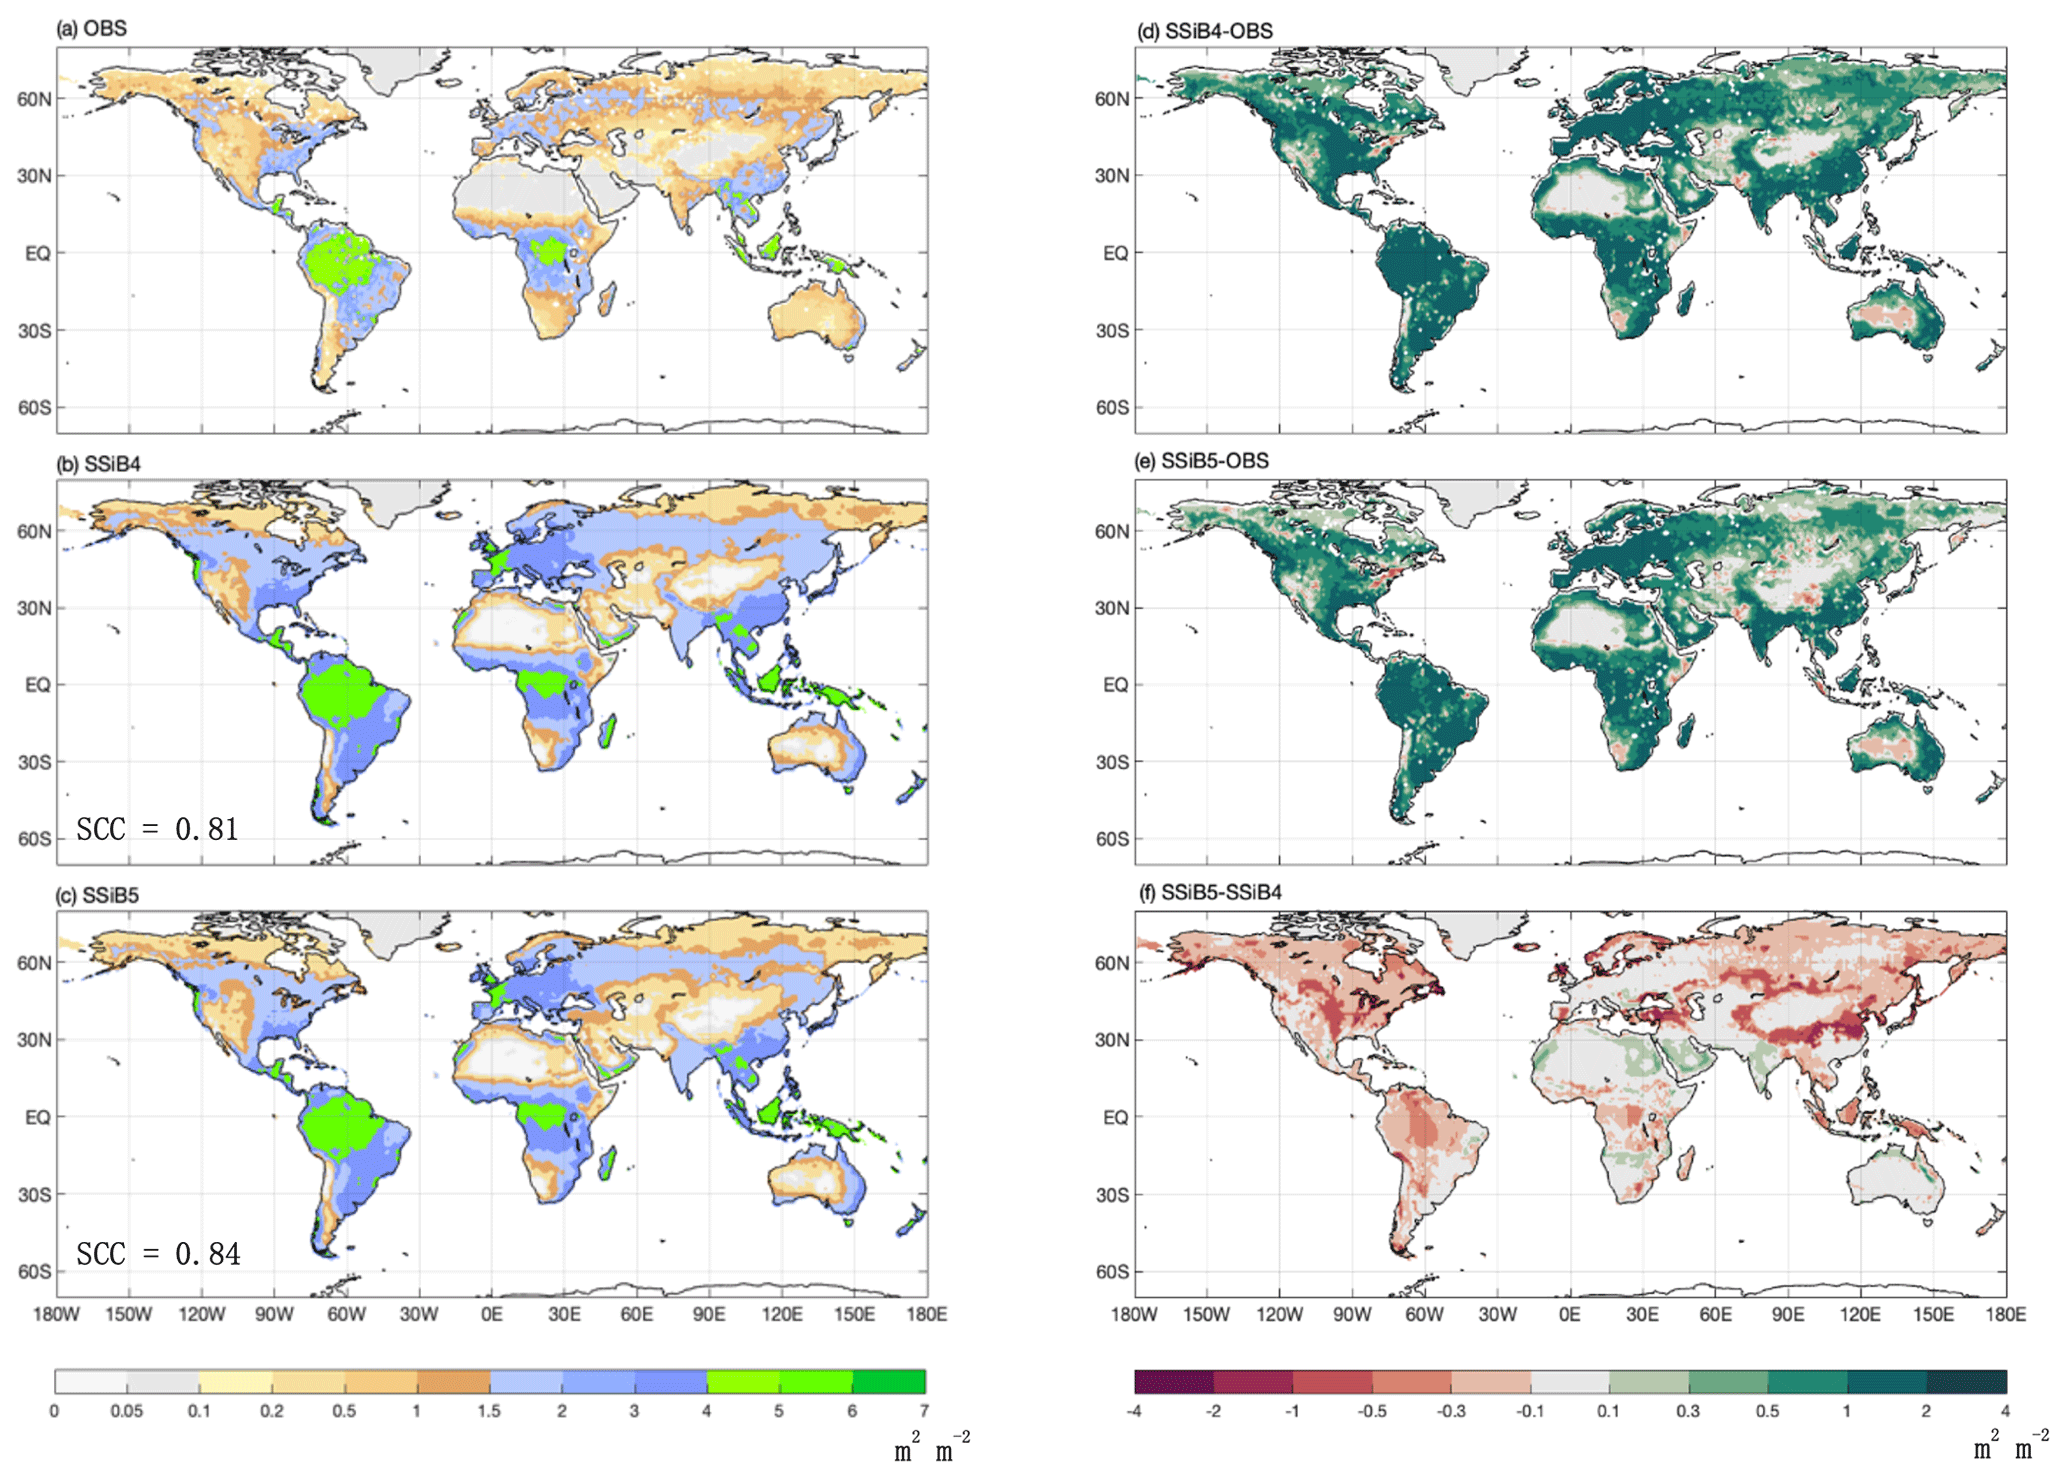
Figure 12The 1982–2007 average LAI comparison for (a) GIMMS LAI (OBS), (b) SSiB4/TRIFFID (SSiB4), and (c) SSiB5/TRIFFID/DayCent-SOM (SSiB5) and the difference between (d) SSiB4 and OBS, (e) SSiB5 and OBS, and (f) SSiB5 and SSiB4. Note that SCC indicates the spatial correlation coefficient between the model simulation and the GIMMS LAI (OBS).
Furthermore, the effect of N limitations on the LAI simulation was also investigated. Compared with satellite-derived products, both SSiB4 and SSiB5 exhibit reasonable spatial distributions (Fig. 12a–c). The highest LAI occurs in tropical evergreen forests and decreases with latitude in both the observations and the model (Fig. 9b). Compared with the control, Exp. SSiB5 also generally reduced the positive bias in the simulated LAI (Fig. 12f). The simulated LAI in Exp. SSiB4 has a global positive bias. After introducing the three N-limitation processes, the positive bias decreased over most parts of the world (Fig. 12f). Globally, Exp. SSiB5 has an LAI bias of 0.94/1.12 for GIMMS/GLASS (Table 8), which is lower than the LAI bias of 1.26/1.44 for GIMMS/GLASS in Exp. SSiB4, with a substantial 31.1 % reduction in the bias (compared to GIMMS, Table 8). However, a substantial positive bias still exists across the globe (Fig. 12e). Our study showed that imposing N limitation is an adequate step to overcome dynamic vegetation models' systematic LAI positive bias, but this issue has still not been resolved and requires further investigation. In addition, the correlation coefficients between the observed and simulated annual average LAIs (Fig. 11a) improved from 0.97 (Exp. SSiB4) to 0.98 (Exp. SsiB5) (Fig. 11a), and the monthly mean LAIs for the Northern Hemisphere and Southern Hemisphere improved from 0.66 to 0.67 and from 0.34 to 0.35, respectively (Fig. 11b and c). The improvement is statistically significant (p<0.05) but rather marginal.
Table 8Regional and global LAI for (a) GIMMS LAI (observation), (b) GLASS LAI (second observation), (c) SSiB4 (control), (d) NlPSN (N limitation on photosynthesis only) and (d) SSiB5 (N limitation on photosynthesis, autotrophic respiration, and phenology).
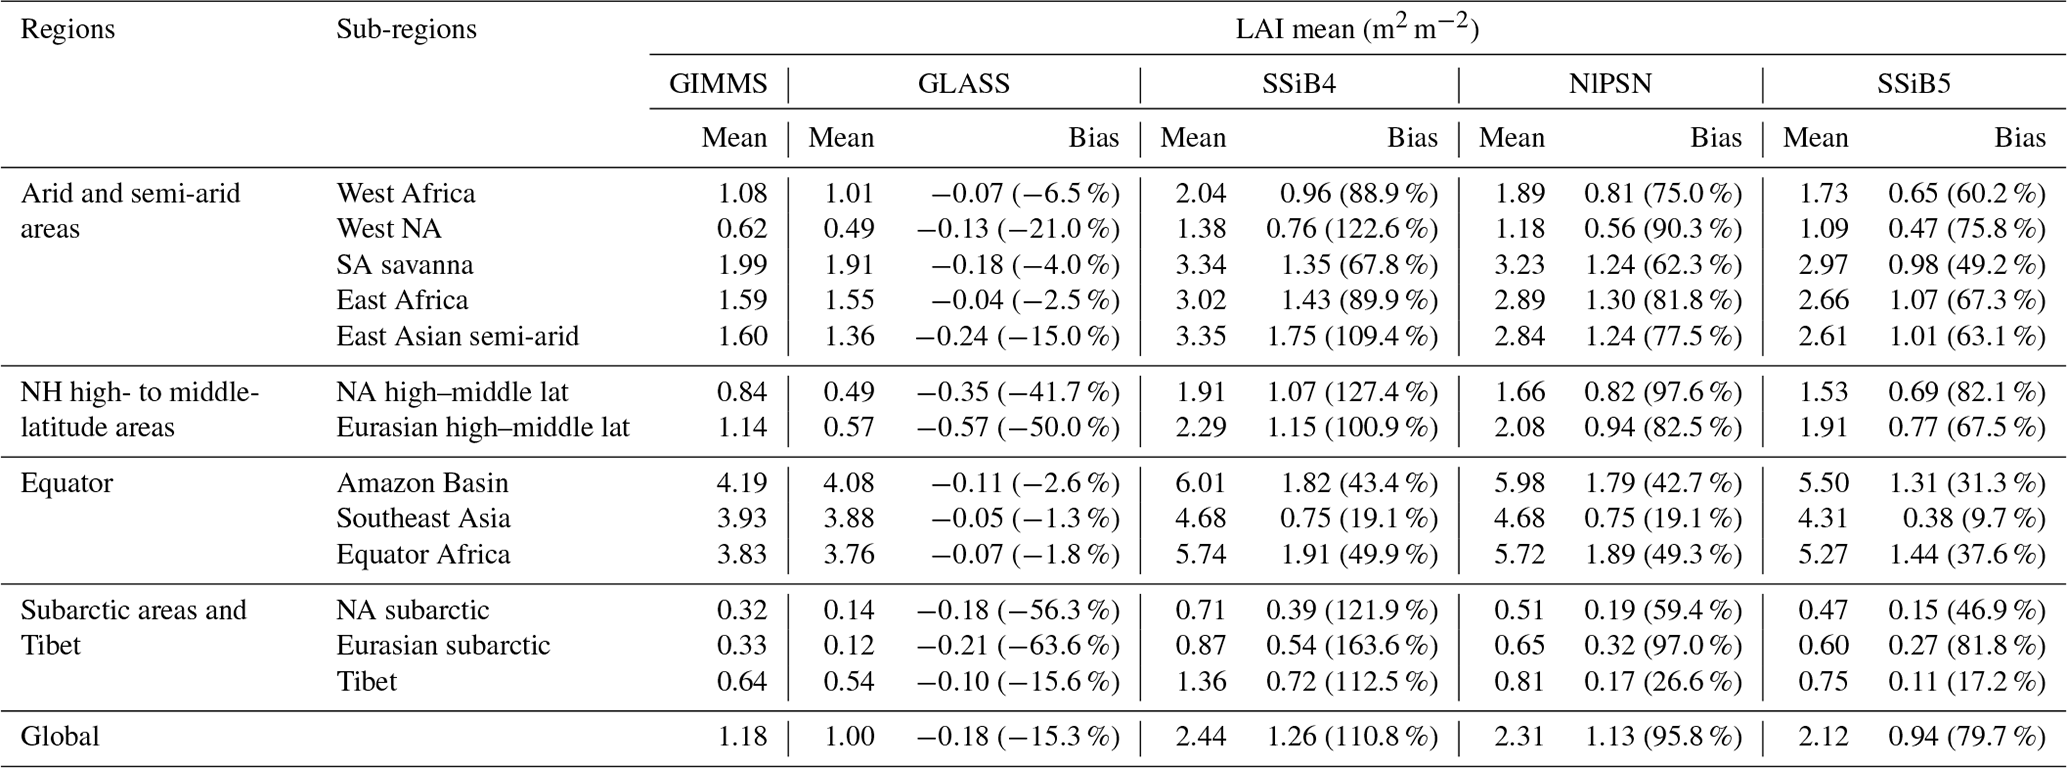
Note that the bias is relative to the GIMMS LAI; the numbers in parentheses are relative biases. The improvements in the SSiB5 and NlPSN bias compared to SSiB4 are all statistically significant at the α=0.05 level of the t-test values. NH denotes the Northern Hemisphere; NA and SA denote North America and South America, respectively.
It is interesting to note that despite the global general LAI reduction, SSiB5 slightly increased the LAI estimation in North Africa and India (Fig. 12). The impacts of N on phenology and respiration cause a slight shift in vegetation from shrubs (northern Africa) or C4 plants (India) to C3 grasses in these areas, which contributes to the increases in GPP and LAI (Fig. 13). Furthermore, in areas such as the Amazon and East Asian mixed forest–grassland regions, SSiB5 improved only the LAI simulation and not the GPP simulation.
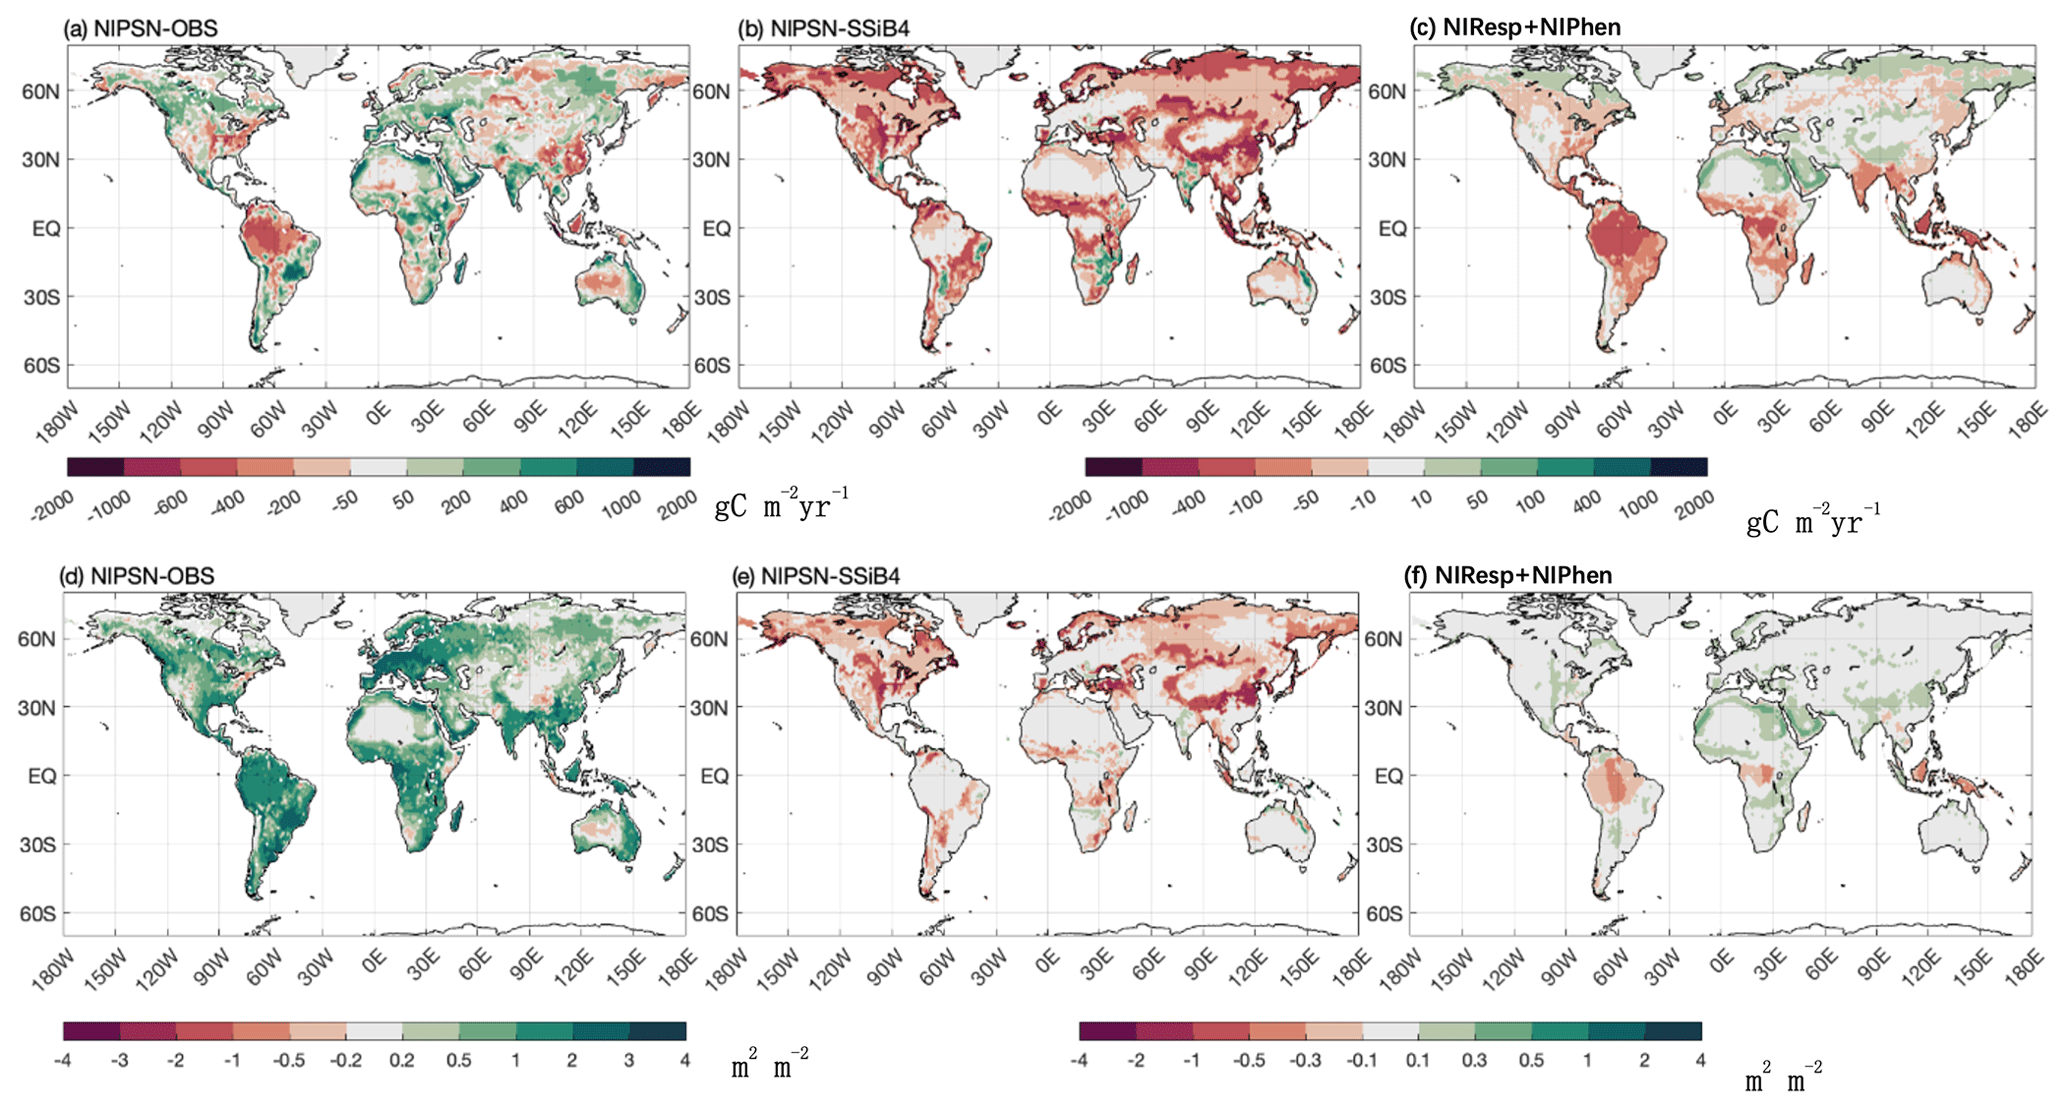
Figure 13The 1982–2007 average gross primary production difference for (a) NlPSN and OBS and (b) NlPSN and SSiB4 and sum for (c) NlResp + NlPhen. The leaf area index difference for (d) NlPSN and OBS and (e) NlPSN and SSiB4 and sum for (f) NlResp + NlPhen. Note that NlPSN is N limitation on photosynthesis (Vc,max) only.
We imposed N limitation on several processes. Among them, Exp. NlPSN has the largest and most significant impact. This paper mainly discusses the results from Exp. NlPSN, which applies Eq. (6) to scale down the Vc,max. Exp. NlPSN has a lower global GPP bias (128.52 g C m−2 yr−1) than Exp. SSiB4 has (219.50 g C m−2 yr−1) (Fig. 13, Table 7), but it is larger than that of Exp. SSiB5, in which the bias is 79 g C m−2 yr−1 (Table 7). In addition, Exp. NlPSN has a global LAI bias of 1.13 (Fig. 13, Table 8), which is also lower than the LAI bias in Exp. SSiB4 (1.26) but higher than that in Exp. SSiB5 (0.94). The largest reductions in the magnitude of the LAI bias are in North America, the Eurasian continent, and tropical savanna regions in South America and Africa (Fig. 13b and e). That said, N limitation of photosynthesis plays a dominant role, contributing to approximately 65 %/41 % of the improvement in the GPP/LAI simulations in Exp. SSiB5. Adjusting Vc,max is the most direct and process-based approach based on physiology and has the greatest impact. However, the effects of N limitation on the other two processes are still substantial. The N limitations on respiration and phenology have the greatest impact in tropical forest and savanna regions (Fig. 13c and f). The GPP also reduced the positive bias over boreal regions and the negative bias over polar regions. The results from Exp. NlResp or Exp. NlPhen individually did not show a statistically significant impact. However, the sum of these two N limitations still has substantial impacts on many parts of the world, as displayed in Fig. 13b, mainly in tropical rainforests and some midlatitude regions. In addition, the differences between Exp. SSiB5, which includes three limitations, and Exp. NlPSN, as displayed in Figs. 10 and 11, also delineate the characteristics of the global impacts of these two effects at seasonal and interannual scales.
Despite the general improvement in the global simulation of SSiB5/TRIFFID/DayCent-SOM, compared to that of SSiB4, there are several issues for which further research is warranted. The GPP simulation in temperate East Asian mixed forest–grassland regions seems to be worse with SSiB5 than with SSiB4. In some regions, such as the Amazon, while SSiB4 produced lower GPP than the observations did, the imposed N limitation in SSiB5 further increased the bias in these regions. Recently, the important influence of phosphorus availability on terrestrial ecosystem carbon uptake has been increasingly recognized (Du et al., 2020). Studies using the latest ecosystem-scale manipulation experiments in phosphorus-poor environments (Fleischer et al., 2019) call for new phosphorus-enabled LSMs to track these actions (Goll et al., 2017; Reed et al., 2015). We plan to incorporate other plant processes, such as plant and soil phosphorus processes, to further improve the performance of the model in the future. More evaluations of regions where N limitation is not dominant are necessary.
Although the global GPP of SSiB5 was similar to the satellite-derived GPP, the positive bias for LAI was still very large (Table 8). Recent review papers seem to confirm that overestimation of LAI is a common issue in current dynamic vegetation models. Murray-Tortarolo et al. (2013) and Anav et al. (2015) evaluated the performance of dynamic vegetation models in simulating LAI from a CMIP model intercomparison. The simulated LAI for almost every dynamic vegetation model is twice as large as the satellite-derived LAI. More recent studies (Zaehle et al., 2015; Mueller et al., 2019; Gristina et al., 2020; Oliveira et al., 2021; Heikkinen et al., 2021) have confirmed this shortcoming in current dynamic vegetation models. The cause or causes of this shortcoming need to be further investigated.
Anthropogenic N input is one of the major factors affecting C–N coupling and N limitation. The anthropogenic N inputs to terrestrial ecosystems have been much greater than the vegetation N fixation in recent decades in some areas, such as eastern China and the central USA. As such, anthropogenic N input can relieve N limitations there (Tian et al., 2022). Due to the scope of this paper, we did not use anthropogenic N inputs to drive our model. This is an important issue for further investigations to comprehensively understand the effect of N limitation.
Finally, this is an offline experiment in which the atmospheric forcing (such as downward radiation) is fixed. With a fixed atmospheric demand, the heat flux response due to the N-limitation effect is also limited, as shown in Sect. 4.1. A comprehensive assessment of the effect of N limitation on heat fluxes and atmospheric circulation needs to be conducted in a fully coupled atmosphere–land model.
This study presents improvements in modeling the C cycle compared to that of SSiB4/TRIFFID by introducing plant N processes into SSiB5/TRIFFID/DayCent-SOM. DayCent-SOM provides the amount of N available to plants and plant soil N uptake. The approach presented in this study can also be applied to other models with similar physical and biological principles. The new C–N coupling framework takes a consistent coupling strategy between biophysical and biogeochemical processes and mainly focuses on the effects of N limitation on plant photosynthesis, plant respiration, and plant phenology. The dynamic plant CNR is used to represent plant resistance and response to N stress, which allows adaptations in the stoichiometry of C and N. This approach increases nutrient use efficiency and takes into account N remobilization and resorption; the N-limitation effect does not necessarily linearly or instantaneously respond to the available N content. A linear relationship between the N-limitation factor and available N is valid only when N availability is not sufficient for the minimum N demand for new growth. With the new model structure, the impacts of N on GPP are simulated directly but not linearly with leaf N content, which is affected by N sufficiency, autotrophic maintenance and growth respiration, and plant phenology.
By comparing site-level results from SSiB4 and SSiB5 to observations of representative biome types and climate zones, we gained confidence in the ability of the new N processes to produce observed variations, and this encouraged us to carry out assessments of global performance for GPP and LAI simulations. The more realistic representation of the plant C–N framework, including the dynamic CNR, leads to general improvements in the global C-cycling simulations of SSiB5/TRIFFID/DayCent-SOM. With the new plant C–N coupling framework, SSiB5/TRIFFID/DayCent-SOM significantly reduced the global bias in GPP and LAI by 16.3 % and 27.1 %, respectively. The main improvements are found in tropical Africa and the boreal forest. From the perspective of plant physiology (Högberg et al., 2017), the downregulation of the canopy photosynthetic rate based on the available mineral N for the growth of plant tissues is more reasonable than the simple and direct downregulation of GPP or NPP. In fact, we conducted a test to directly downscale GPP and NPP, and our simulation results (not shown) support this viewpoint. This coupled model can better reproduce observed state variables and their emergent properties (such as GPP, NPP, LAI, and respiration).
Although significant progress has been made in recent years in incorporating the N cycle and its effect on the C cycle in the terrestrial biosphere in a number of ESM LSMs (with various representations of N processes), our study and other relevant studies suggest that there are still many important outstanding issues, some of which are discussed in Sect. 5, and further efforts in improving terrestrial biosphere modeling that represents the coupled C–N cycle are imperative for realistic process representation (Davies-Barnard et al., 2020; Kou-Giesbrecht et al., 2023) and better simulation of N–C–climate interactions and future projections. We hope our efforts presented in this paper can stimulate more effort to work in this direction.
The evaluation and reference datasets from the model data discussed in this paper are archived at https://doi.org/10.5281/zenodo.7196869 (Xue and Xiang, 2022). The source code of the biophysical-ecosystem–biogeochemical model, SSiB5/TRIFFID/DayCent-SOM, is available at https://doi.org/10.5281/zenodo.7297108 (Xiang, 2022).
ZX, YX, MDH, and YL designed the coupling strategy between SSiB4/TRIFFID and DayCent-SOM. ZX conducted the simulation with suggestions from YX, WG, and WJP. ZX, YX, and MDH drafted the text, and ZX made the figures. All authors (ZX, YX, WG, MDH, YL and WJP) contributed to the analysis and the text.
The contact author has declared that none of the authors has any competing interests.
Publisher's note: Copernicus Publications remains neutral with regard to jurisdictional claims made in the text, published maps, institutional affiliations, or any other geographical representation in this paper. While Copernicus Publications makes every effort to include appropriate place names, the final responsibility lies with the authors.
The authors acknowledge the use of the Cheyenne supercomputer (https://doi.org/10.5065/D6RX99HX, Computational and Information Systems Laboratory, 2019) and HPC resources provided by NCAR CISL. We also appreciate very comprehensive and constructive reviews by the two anonymous reviewers and Xin Miao of Nanjing University, which greatly enhanced this paper.
This research has been supported by the National Science Foundation (grant nos. AGS-1419526, AGS-1849654) and the National Natural Science Foundation of China (grant no. 42175136).
This paper was edited by Christoph Müller and reviewed by two anonymous referees.
Aber, J. D., Goodale, C. L., Ollinger, S. V., Smith, M.-L., Magill, A. H., Martin, M. E., Hallett, R. A., and Stoddard, J. L.: Is nitrogen deposition altering the nitrogen status of northeastern forests?, Bioscience, 53, 375–389, https://doi.org/10.1641/0006-3568(2003)053[0375:INDATN]2.0.CO;2, 2003.
Aerts, R.: Nutrient Resorption from Senescing Leaves of Perennials: Are there General Patterns?, J. Ecol., 84, 597, https://doi.org/10.2307/2261481, 1996.
Ali, A. A., Xu, C., Rogers, A., McDowell, N. G., Medlyn, B. E., Fisher, R. A., Wullschleger, S. D., Reich, P. B., Vrugt, J. A., Bauerle, W. L., Santiago, L. S., and Wilson, C. J.: Global-scale environmental control of plant photosynthetic capacity, Ecol. Appl., 25, 2349–2365, https://doi.org/10.1890/14-2111.1, 2015.
Anav, A., Friedlingstein, P., Beer, C., Ciais, P., Harper, A., Jones, C., Murray-Tortarolo, G., Papale, D., Parazoo, N. C., Peylin, P., Wiltshire, A., and Zhao, M.: Spatiotemporal patterns of terrestrial gross primary production: A review, Rev. Geophys., 53, 785–818, https://doi.org/10.1002/2015RG000483, 2015.
Arora, V. K., Boer, G. J., Friedlingstein, P., Eby, M., Jones, C. D. Christian, J. R., Bonan, G., Bopp, L., Brovkin, V., Cad-ule, P., Hajima, T., Ilyina, T., Lindsay, K., Tjiputra, J. F., and Wu, T.: Carbon–Concentration and Carbon–Climate Feedbacks in CMIP5 Earth System Models, J. Climate, 26, 5289–5314, https://doi.org/10.1175/JCLI-D-12-00494.1, 2013.
Arora, V. K., Katavouta, A., Williams, R. G., Jones, C. D., Brovkin, V., Friedlingstein, P., Schwinger, J., Bopp, L., Boucher, O., Cadule, P., Chamberlain, M. A., Christian, J. R., Delire, C., Fisher, R. A., Hajima, T., Ilyina, T., Joetzjer, E., Kawamiya, M., Koven, C. D., Krasting, J. P., Law, R. M., Lawrence, D. M., Lenton, A., Lindsay, K., Pongratz, J., Raddatz, T., Séférian, R., Tachiiri, K., Tjiputra, J. F., Wiltshire, A., Wu, T., and Ziehn, T.: Carbon–concentration and carbon–climate feedbacks in CMIP6 models and their comparison to CMIP5 models, Biogeosciences, 17, 4173–4222, https://doi.org/10.5194/bg-17-4173-2020, 2020.
Asaadi, A. and Arora, V. K.: Implementation of nitrogen cycle in the CLASSIC land model, Biogeosciences, 18, 669–706, https://doi.org/10.5194/bg-18-669-2021, 2021.
Beer, C., Reichstein, M., Tomelleri, E., Ciais, P., Jung, M., Carvalhais, N., Rodenbeck, C., Arain, M. A., Baldocchi, D., Bonan, G. B., Bondeau, A., Cescatti, A., Lasslop, G., Lindroth, A., Lomas, M., Luyssaert, S., Margolis, H., Oleson, K. W., Roupsard, O., Veenendaal, E., Viovy, N., Williams, C., Woodward, F. I., and Papale, D.: Terrestrial Gross Carbon Dioxide Uptake: Global Distribution and Covariation with Climate, Science, 329, 834–838, https://doi.org/10.1126/science.1184984, 2010.
Bonan, G. B.: Forests and Climate Change: Climate Benefits of Forests, Science, 320, 1444–1449, 2008.
Bonan, G. B., Hartman, M. D., Parton, W. J., and Wieder, W. R.: Evaluating litter decomposition in earth system models with long-term litterbag experiments: An example using the Community Land Model version 4 (CLM4), Glob. Change Biol., 19, 957–974, https://doi.org/10.1111/gcb.12031, 2013.
Chen, X. and Chen, H. Y. H.: Plant mixture balances terrestrial ecosystem stoichiometry, Nat. Commun., 12, 4562, https://doi.org/10.1038/s41467-021-24889-w, 2021.
Clarkson, D. T. and Hanson, J. B.: The Mineral Nutrition of Higher Plants, Annu. Rev. Plant Physiol., 31, 239–298, https://doi.org/10.1146/annurev.pp.31.060180.001323, 1980.
Collatz, G. J., Ball, J. T., Grivet, C., and Berry, J. A.: Physiological and environmental regulation of stomatal conductance, photosynthesis and transpiration: a model that includes a laminar boundary layer, Agric. For. Meteorol., 54, 107–136, https://doi.org/10.1016/0168-1923(91)90002-8, 1991.
Computational and Information Systems Laboratory: Cheyenne: HPE/SGI ICE XA System (NCAR Community Computing), Boulder, CO, National Center for Atmospheric Research, https://doi.org/10.5065/D6RX99HX, 2019.
Cox, P. M.: Description of the “TRIFFID” Dynamic Global Vegetation Model, Hadley Cent. Tech. Note-24, https://jules.jchmr.org/sites/default/files/2023-06/JULES-HCTN-24.pdf (last access: 28 August 2024), 2001.
Dan, L., Yang, X., Yang, F., Peng, J., Li, Y., Gao, D., Ji, J., and Huang, M.: Integration of nitrogen dynamics into the land surface model AVIM. Part 2: baseline data and variation of carbon and nitrogen fluxes in China, Atmos. Ocean. Sci. Lett., 13, 518–526, https://doi.org/10.1080/16742834.2020.1819145, 2020.
Davies-Barnard, T., Meyerholt, J., Zaehle, S., Friedlingstein, P., Brovkin, V., Fan, Y., Fisher, R. A., Jones, C. D., Lee, H., Peano, D., Smith, B., Wårlind, D., and Wiltshire, A. J.: Nitrogen cycling in CMIP6 land surface models: progress and limitations, Biogeosciences, 17, 5129–5148, https://doi.org/10.5194/bg-17-5129-2020, 2020.
Delpierre, N., Vitasse, Y., Chuine, I., Guillemot, J., Bazot, S., Rutishauser, T., and Rathgeber, C. B. K.: Temperate and boreal forest tree phenology: from organ-scale processes to terrestrial ecosystem models, Ann. For. Sci., 73, 5–25, https://doi.org/10.1007/s13595-015-0477-6, 2016.
Dorman, J. L. and Sellers, P. J.: A global climatology of albedo, roughness length and stomatal resistance for atmospheric general circulation models as represented by the Simple Biosphere Model (SiB), J. Appl. Meteorol., 28, 833–855, https://doi.org/10.1175/1520-0450(1989)028<0833:AGCOAR>2.0.CO;2, 1989.
Drewniak, B. and Gonzalez-Meler, M.: Earth System Model Needs for Including the Interactive Representation of Nitrogen Deposition and Drought Effects on Forested Ecosystems, Forests, 8, 267, https://doi.org/10.3390/f8080267, 2017.
Du, E., Terrer, C., Pellegrini, A. F. A., Ahlström, A., van Lissa, C. J., Zhao, X., Xia, N., Wu, X., and Jackson, R. B.: Global patterns of terrestrial nitrogen and phosphorus limitation, Nat. Geosci., 13, 221–226, https://doi.org/10.1038/s41561-019-0530-4, 2020.
Enquist, B., J. Brown, and G. West: Allometric scaling of plant energetics and population density, Nature, 395, 163–166, 1998.
Eyring, V., Bony, S., Meehl, G. A., Senior, C. A., Stevens, B., Stouffer, R. J., and Taylor, K. E.: Overview of the Coupled Model Intercomparison Project Phase 6 (CMIP6) experimental design and organization, Geosci. Model Dev., 9, 1937–1958, https://doi.org/10.5194/gmd-9-1937-2016, 2016.
Farquhar, G. D., von Caemmerer, S., and Berry, J. A.: A biochemical model of photosynthetic CO2 assimilation in leaves of C3 species, Planta, 149, 78–90, https://doi.org/10.1007/BF00386231, 1980.
Fisher, J. B., Sitch, S., Malhi, Y., Fisher, R. A., Huntingford, C., and Tan, S.-Y.: Carbon cost of plant nitrogen acquisition: A mechanistic, globally applicable model of plant nitrogen uptake, retranslocation, and fixation, Global Biogeochem. Cy., 24, GB1014, https://doi.org/10.1029/2009gb003621, 2010.
Fisher, R., McDowell, N., Purves, D., Moorcroft, P., Sitch, S., Cox, P., Huntingford, C., Meir, P., and Ian Woodward, F.: Assessing uncertainties in a second-generation dynamic vegetation model caused by ecological scale limitations, New Phytol., 187, 666–681, https://doi.org/10.1111/j.1469-8137.2010.03340.x, 2010.
Fleischer, K., Rammig, A., De Kauwe, M. G., Walker, A. P., Domingues, T. F., Fuchslueger, L., Garcia, S., Goll, D. S., Grandis, A., Jiang, M., Haverd, V., Hofhansl, F., Holm, J. A., Kruijt, B., Leung, F., Medlyn, B. E., Mercado, L. M., Norby, R. J., Pak, B., von Randow, C., Quesada, C. A., Schaap, K. J., Valverde-Barrantes, O. J., Wang, Y. P., Yang, X., Zaehle, S., Zhu, Q., and Lapola, D. M.: Amazon forest response to CO2 fertilization dependent on plant phosphorus acquisition, Nat. Geosci., 12, 736–741, https://doi.org/10.1038/s41561-019-0404-9, 2019.
Foley, J. A., Levis, S., Prentice, I. C., Pollard, D., and Thompson, S. L.: Coupling dynamic models of climate and vegetation, Glob. Change Biol., 4, 561–579, https://doi.org/10.1046/j.1365-2486.1998.t01-1-00168.x, 1998.
Friedlingstein, P., Cox, P., Betts, R., Bopp, L., von Bloh, W., Brovkin, V., Cadule, P., Doney, S., Eby, M., Fung, I., Bala, G., John, J., Jones, C., Joos, F., Kato, T., Kawamiya, M., Knorr, W., Lindsay, K., Matthews, H. D., Raddatz, T., Rayner, P., Reick, C., Roeckner, E., Schnitzler, K.-G., Schnur, R., Strassmann, K., Weaver, A. J., Yoshikawa, C., and Zeng, N.: Climate–Carbon Cycle Feedback Analysis: Results from the C4MIP Model Intercomparison, J. Climate, 19, 3337–3353, https://doi.org/10.1175/JCLI3800.1, 2006.
Fu, Y. H., Piao, S., Delpierre, N., Hao, F., Hänninen, H., Geng, X., Peñuelas, J., Zhang, X., Janssens, I. A., and Campioli, M.: Nutrient availability alters the correlation between spring leaf-out and autumn leaf senescence dates, Tree Physiol., 39, 1277–1284, https://doi.org/10.1093/treephys/tpz041, 2019.
Gerber, S., Hedin, L. O., Oppenheimer, M., Pacala, S. W., and Shevliakova, E.: Nitrogen cycling and feedbacks in a global dynamic land model, Global Biogeochem. Cy., 24, GB1001, https://doi.org/10.1029/2008GB003336, 2010.
Ghimire, B., Riley, W. J., Koven, C. D., Mu, M., and Randerson, J. T.: Representing leaf and root physiological traits in CLM improves global carbon and nitrogen cycling predictions, J. Adv. Model. Earth Sy., 8, 598–613, https://doi.org/10.1002/2015MS000538, 2016.
Goll, D. S., Winkler, A. J., Raddatz, T., Dong, N., Prentice, I. C., Ciais, P., and Brovkin, V.: Carbon–nitrogen interactions in idealized simulations with JSBACH (version 3.10), Geosci. Model Dev., 10, 2009–2030, https://doi.org/10.5194/gmd-10-2009-2017, 2017.
Gregory, J. M., Jones, C. D., Cadule, P., and Friedlingstein, P.: Quantifying carbon cycle feedbacks, J. Climate, 22, 5232–5250, https://doi.org/10.1175/2009JCLI2949.1, 2009.
Gristina, L., Scalenghe, R., García-Díaz, A., Matranga, M. G., Ferraro, V., Guaitoli, F., and Novara, A.: Soil organic carbon stocks under recommended management practices in different soils of semiarid vineyards, L. Degrad. Dev., 31, 1906–1914, https://doi.org/10.1002/ldr.3339, 2020.
Del Grosso, S. J., Parton, W. J., Mosier, A. R., Ojima, D. S., Kulmala, A. E., and Phongpan, S.: General model for N2O and N2 gas emissions from soils due to dentrification, Global Biogeochem. Cy., 14, 1045–1060, https://doi.org/10.1029/1999GB001225, 2000.
Harper, A. B., Cox, P. M., Friedlingstein, P., Wiltshire, A. J., Jones, C. D., Sitch, S., Mercado, L. M., Groenendijk, M., Robertson, E., Kattge, J., Bönisch, G., Atkin, O. K., Bahn, M., Cornelissen, J., Niinemets, Ü., Onipchenko, V., Peñuelas, J., Poorter, L., Reich, P. B., Soudzilovskaia, N. A., and Bodegom, P. V.: Improved representation of plant functional types and physiology in the Joint UK Land Environment Simulator (JULES v4.2) using plant trait information, Geosci. Model Dev., 9, 2415–2440, https://doi.org/10.5194/gmd-9-2415-2016, 2016.
Heikkinen, J., Keskinen, R., Regina, K., Honkanen, H., and Nuutinen, V.: Estimation of carbon stocks in boreal cropland soils – methodological considerations, Eur. J. Soil Sci., 72, 934–945, https://doi.org/10.1111/ejss.13033, 2021.
Herbert, D. A. and Fownes, J. H.: Phosphorus limitation of forest leaf area and net primary production on a highly weathered soil, Ecosystems, 29, 242–25, https://doi.org/10.1007/BF02186049, 1999.
Högberg, P., Näsholm, T., Franklin, O., and Högberg, M. N.: Tamm Review: On the nature of the nitrogen limitation to plant growth in Fennoscandian boreal forests, Forest Ecol. Manag., 403, 161–185, https://doi.org/10.1016/j.foreco.2017.04.045, 2017.
Hu, S., Chapin, F. S., Firestone, M. K., Field, C. B., and Chiariello, N. R.: Nitrogen limitation of microbial decomposition in a grassland under elevated CO2, Nature, 409, 188–191, https://doi.org/10.1038/35051576, 2001.
Huang, H., Xue, Y., Li, F., and Liu, Y.: Modeling long-term fire impact on ecosystem characteristics and surface energy using a process-based vegetation–fire model SSiB4/TRIFFID-Fire v1.0, Geosci. Model Dev., 13, 6029–6050, https://doi.org/10.5194/gmd-13-6029-2020, 2020.
Jung, M., Reichstein, M., and Bondeau, A.: Towards global empirical upscaling of FLUXNET eddy covariance observations: validation of a model tree ensemble approach using a biosphere model, Biogeosciences, 6, 2001–2013, https://doi.org/10.5194/bg-6-2001-2009, 2009.
Jung, M., Reichstein, M., Margolis, H. A., Cescatti, A., Richardson, A. D., Arain, M. A., Arneth, A., Bernhofer, C., Bonal, D., Chen, J., Gianelle, D., Gobron, N., Kiely, G., Kutsch, W., Lasslop, G., Law, B. E., Lindroth, A., Merbold, L., Montagnani, L., Moors, E. J., Papale, D., Sottocornola, M., Vaccari, F., and Williams, C.: Global patterns of land-atmosphere fluxes of carbon dioxide, latent heat, and sensible heat derived from eddy covariance, satellite, and meteorological observations, J. Geophys. Res.-Biogeo., 116, G00J07, https://doi.org/10.1029/2010JG001566, 2011.
Kattge, J., Knorr, W., Raddatz, T., and Wirth, C.: Quantifying photosynthetic capacity and its relationship to leaf nitrogen content for global-scale terrestrial biosphere models, Glob. Change Biol., 15, 976–991, https://doi.org/10.1111/j.1365-2486.2008.01744.x, 2009.
Kolb, K. J. and Evans, R. D.: Implications of leaf nitrogen recycling on the nitrogen isotope composition of deciduous plant tissues, New Phytol., 156, 57–64, https://doi.org/10.1046/j.1469-8137.2002.00490.x, 2002.
Kou-Giesbrecht, S., Arora, V. K., Seiler, C., Arneth, A., Falk, S., Jain, A. K., Joos, F., Kennedy, D., Knauer, J., Sitch, S., O'Sullivan, M., Pan, N., Sun, Q., Tian, H., Vuichard, N., and Zaehle, S.: Evaluating nitrogen cycling in terrestrial biosphere models: a disconnect between the carbon and nitrogen cycles, Earth Syst. Dynam., 14, 767–795, https://doi.org/10.5194/esd-14-767-2023, 2023.
Lawrence, D. M., Fisher, R. A., Koven, C. D., Oleson, K. W., Swenson, S. C., Bonan, G., Collier, N., Ghimire, B., van Kampenhout, L., Kennedy, D., Kluzek, E., Lawrence, P. J., Li, F., Li, H., Lombardozzi, D., Riley, W. J., Sacks, W. J., Shi, M., Vertenstein, M., Wieder, W. R., Xu, C., Ali, A. A., Badger, A. M., Bisht, G., van den Broeke, M., Brunke, M. A., Burns, S. P., Buzan, J., Clark, M., Craig, A., Dahlin, K., Drewniak, B., Fisher, J. B., Flanner, M., Fox, A. M., Gentine, P., Hoffman, F., Keppel-Aleks, G., Knox, R., Kumar, S., Lenaerts, J., Leung, L. R., Lipscomb, W. H., Lu, Y., Pandey, A., Pelletier, J. D., Perket, J., Randerson, J. T., Ricciuto, D. M., Sanderson, B. M., Slater, A., Subin, Z. M., Tang, J., Thomas, R. Q., Val Martin, M., and Zeng, X.: The Community Land Model Version 5: Description of New Features, Benchmarking, and Impact of Forcing Uncertainty, J. Adv. Model. Earth Sy., 11, 4245–4287, https://doi.org/10.1029/2018MS001583, 2019.
LeBauer, D. S. and Treseder, K. K.: Nitrogen Limitation of Net Primary Productivity In Terrestrial Ecosystems Is Globally Distributed, Ecology, 89, 371–379, https://doi.org/10.1890/06-2057.1, 2008.
Lin, S., Hu, Z., Wang, Y., Chen, X., He, B., Song, Z., Sun, S., Wu, C., Zheng, Y., Xia, X., Liu, L., Tang, J., Sun, Q., Joos, F., and Yuan, W.: Underestimated Interannual Variability of Terrestrial Vegetation Production by Terrestrial Ecosystem Models, Global Biogeochem. Cy., 37, e2023GB007696, https://doi.org/10.1029/2023GB007696, 2023.
Liu, Y., Xue, Y., MacDonald, G., Cox, P., and Zhang, Z.: Global vegetation variability and its response to elevated CO2, global warming, and climate variability – a study using the offline SSiB4/TRIFFID model and satellite data, Earth Syst. Dynam., 10, 9–29, https://doi.org/10.5194/esd-10-9-2019, 2019.
Liu, Y., Xue, Y., Li, Q., Lettenmaier, D., and Zhao, P.: Investigation of the Variability of Near-Surface Temperature Anomaly and Its Causes Over the Tibetan Plateau, J. Geophys. Res.-Atmos., 125, e2020JD032800, https://doi.org/10.1029/2020JD032800, 2020.
Lund, M., Falk, J. M., Friborg, T., Mbufong, H. N., Sigsgaard, C., Soegaard, H., and Tamstorf, M. P.: Trends in CO2 exchange in a high Arctic tundra heath, 2000–2010, J. Geophys. Res.-Biogeo., 117, G02001, https://doi.org/10.1029/2011JG001901, 2012.
Ma, H.-Y., Mechoso, C. R., Xue, Y., Xiao, H., Neelin, J. D., and Ji, X.: On the connection between continental-scale land surface processes and the tropical climate in a coupled ocean-atmosphere-land system, J. Climate, 26, 9006–9025, https://doi.org/10.1175/JCLI-D-12-00819.1, 2013.
MacBean, N., Scott, R. L., Biederman, J. A., Peylin, P., Kolb, T., Litvak, M. E., Krishnan, P., Meyers, T. P., Arora, V. K., Bastrikov, V., Goll, D., Lombardozzi, D. L., Nabel, J. E. M. S., Pongratz, J., Sitch, S., Walker, A. P., Zaehle, S., and Moore, D. J. P.: Dynamic global vegetation models underestimate net CO2 flux mean and inter-annual variability in dryland ecosystems, Environ. Res. Lett., 16, 094023, https://doi.org/10.1088/1748-9326/ac1a38, 2021.
MacDonald, J. A., Dise, N. B., Matzner, E., Armbruster, M., Gundersen, P., and Forsius, M.: Nitrogen input together with ecosystem nitrogen enrichment predict nitrate leaching from European forests, Glob. Change Biol., 8, 1028–1033, https://doi.org/10.1046/j.1365-2486.2002.00532.x, 2002.
Makino, A. and Osmond, B.: Effects of Nitrogen Nutrition on Nitrogen Partitioning between Chloroplasts and Mitochondria in Pea and Wheat, Plant Physiol., 96, 355–362, https://doi.org/10.1104/pp.96.2.355, 1991.
Marmann, P., Wendler, R., Millard, P., and Heilmeier, H.: Nitrogen storage and remobilization in ash (Fraxinus excelsior) under field and laboratory conditions, Trees – Struct. Funct., 11, 298–305, https://doi.org/10.1007/s004680050088, 1997.
May, J. D. and Killingbeck, K. T.: Effects of preventing nutrient resorption on plant fitness and foliar nutrient dynamics, Ecology, 73, 1868–1878, https://doi.org/10.2307/1940038, 1992.
McCormack, L. M., Adams, T. S., Smithwick, E. A. H., and Eissenstat, D. M.: Variability in root production, phenology, and turnover rate among 12 temperate tree species, Ecology, 95, 2224–2235, https://doi.org/10.1890/13-1942.1, 2014.
McDowell, N., Pockman, W. T., Allen, C. D., Breshears, D. D., Cobb, N., Kolb, T., Plaut, J., Sperry, J., West, A., Williams, D. G., Williams, D. G., and Yepez, E. A.: Mechanisms of plant survival and mortality during drought: Why do some plants survive while others succumb to drought?, New Phytol., 178, 719–739, https://doi.org/10.1111/j.1469-8137.2008.02436.x, 2008.
McGroddy, M. E., Daufresne, T., and Hedin, L. O.: Scaling of stoichiometry in forests worldwide: Implications of terrestrial redfield-type ratios, Ecology, 85, 2390–2401, https://doi.org/10.1890/03-0351, 2004.
Medlyn, B. E., Zaehle, S., De Kauwe, M. G., Walker, A. P., Dietze, M. C., Hanson, P. J., Hickler, T., Jain, A. K., Luo, Y., Parton, W., Oren, R., and Norby, R. J.: Using ecosystem experiments to improve vegetation models, Nat. Clim. Change, 5, 528–534, https://doi.org/10.1038/nclimate2621, 2015.
Meyer-Grünefeldt, M., Calvo, L., Marcos, E., Von Oheimb, G., and Härdtle, W.: Impacts of drought and nitrogen addition on Calluna heathlands differ with plant life-history stage, J. Ecol., 103, 1141–1152, https://doi.org/10.1111/1365-2745.12446, 2015.
Meyerholt, J., Sickel, K., and Zaehle, S.: Ensemble projections elucidate effects of uncertainty in terrestrial nitrogen limitation on future carbon uptake, Glob. Change Biol., 26, 3978–3996, https://doi.org/10.1111/gcb.15114, 2020.
Millard, P.: Measurement of the remobilization of nitrogen for spring leaf growth of trees under field conditions, Tree Physiol., 14, 1049–1054, https://doi.org/10.1093/treephys/14.7-8-9.1049, 1994.
Morgan, J. B. and Connolly, E. L.: Plant – Soil Interactions: Nutrient Uptake, Nat. Educ. Knowl., 4, 2, https://www.nature.com/scitable/knowledge/library/plant-soil-interactions-nutrient-uptake-105289112/ (last access: 28 August 2024), 2013.
Mueller, P., Ladiges, N., Jack, A., Schmiedl, G., Kutzbach, L., Jensen, K., and Nolte, S.: Assessing the long-term carbon-sequestration potential of the semi-natural salt marshes in the European Wadden Sea, Ecosphere, 10, e02556, https://doi.org/10.1002/ecs2.2556, 2019.
Murray-Tortarolo, G., Anav, A., Friedlingstein, P., Sitch, S., Piao, S., Zhu, Z., Poulter, B., Zaehle, S., Ahlström, A., Lomas, M., Viovy, N., and Zeng, N.: Evaluation of land surface models in reproducing satellite-derived LAI over the high-latitude northern hemisphere. Part I: Uncoupled DGVMs, Remote Sens., 5, 4819–4838, https://doi.org/10.3390/rs5104819, 2013.
Neilsen, D., Millard, P., Neilsen, G. H., and Hogue, E. J.: Sources of N for leaf growth in a high-density apple (Malus domestica) orchard irrigated with ammonium nitrate solution, Tree Physiol., 17, 733–739, https://doi.org/10.1093/treephys/17.11.733, 1997.
Oleson, K. W., Lawrence, D. M., Bonan, G. B., Drewniak, B., Huang, M., Charles, D., Levis, S., Li, F., Riley, W. J., Zachary, M., Swenson, S. C., Thornton, P. E., Bozbiyik, A., Fisher, R., Heald, C. L., Kluzek, E., Lamarque, F., Lawrence, P. J., Leung, L. R., Muszala, S., Ricciuto, D. M., and Sacks, W.: Technical description of version 4.5 of the Community Land Model (CLM), NCAR Technical Note NCAR/TN-503+STR, Natl. Cent. Atmos. Res. Boulder, CO, 420 pp., https://doi.org/10.5065/D6RR1W7M, 2013.
Oliveira, D. C. de, Oliveira, D. M. da S., Freitas, R. de C. A. de, Barreto, M. S., Almeida, R. E. M. de, Batista, R. B., and Cerri, C. E. P.: Depth assessed and up-scaling of single case studies might overestimate the role of C sequestration by pastures in the commitments of Brazil's low-carbon agriculture plan, Carbon Manag., 12, 499–508, https://doi.org/10.1080/17583004.2021.1977390, 2021.
Parton, W., Silver, W. L., Burke, I. C., Grassens, L., Harmon, M. E., Currie, W. S., King, J. Y., Adair, E. C., Brandt, L. A., Hart, S. C., and Fasth, B.: Global-scale similarities in nitrogen release patterns during long-term decomposition, Science, 315, 361–364, https://doi.org/10.1126/science.1134853, 2007.
Parton, W. J., Scurlock, J. M. O., Ojima, D. S., Gilmanov, T. G., Scholes, R. J., Schimel, D. S., Kirchner, T., Menaut, J.-C., Seastedt, T., Garcia Moya, E., Kamnalrut, A., and Kinyamario, J. I.: Observations and modeling of biomass and soil organic matter dynamics for the grassland biome worldwide, Global Biogeochem. Cy., 7, 785–809, https://doi.org/10.1029/93GB02042, 1993.
Parton, W. J., Ojima, D. S., Cole, C. V., and Schimel, D. S.: A general model for soil organic matter dynamics: sensitivity to litter chemistry, texture and management, in: Quantitative Modeling of Soil Forming Processes, edited by: Bryant, R. B., and Arnold, R. W., https://doi.org/10.2136/sssaspecpub39.c9, 1994.
Parton, W. J., Hartman, M., Ojima, D., and Schimel, D.: DAYCENT and its land surface submodel: description and testing, Glob. Planet. Change, 19, 35–48, https://doi.org/10.1016/S0921-8181(98)00040-X, 1998.
Parton, W. J., Hanson, P. J., Swanston, C., Torn, M., Trumbore, S. E., Riley, W., and Kelly, R.: ForCent model development and testing using the Enriched Background Isotope Study experiment, J. Geophys. Res.-Biogeo., 115, G04001, https://doi.org/10.1029/2009JG001193, 2010.
Pastorello, G., Trotta, C., Canfora, E., et al.: The FLUXNET2015 dataset and the ONEFlux processing pipeline for eddy covariance data, Sci. Data, 7, 225, https://doi.org/10.1038/s41597-020-0534-3, 2020.
Peng, J., Wang, Y. P., Houlton, B. Z., Dan, L., Pak, B., and Tang, X.: Global Carbon Sequestration Is Highly Sensitive to Model-Based Formulations of Nitrogen Fixation, Global Biogeochem. Cy., 34, e2019GB006296, https://doi.org/10.1029/2019GB006296, 2020.
Peñuelas, J., Poulter, B., Sardans, J., Ciais, P., Van Der Velde, M., Bopp, L., Boucher, O., Godderis, Y., Hinsinger, P., Llusia, J., Nardin, E., Vicca, S., Obersteiner, M., and Janssens, I. A.: Human-induced nitrogen-phosphorus imbalances alter natural and managed ecosystems across the globe, Nat. Commun., 4, 2934, https://doi.org/10.1038/ncomms3934, 2013.
Piao, S., Liu, Q., Chen, A., Janssens, I. A., Fu, Y., Dai, J., Liu, L., Lian, X., Shen, M., and Zhu, X.: Plant phenology and global climate change: Current progresses and challenges, 25, 1922–1940, https://doi.org/10.1111/gcb.14619, 2019.
Raddatz, T. J., Reick, C. H., Knorr, W., Kattge, J., Roeckner, E., Schnur, R., Schnitzler, K. G., Wetzel, P., and Jungclaus, J.: Will the tropical land biosphere dominate the climate-carbon cycle feedback during the twenty-first century?, Clim. Dynam., 29, 565–574, https://doi.org/10.1007/s00382-007-0247-8, 2007.
Reed, S. C., Yang, X., and Thornton, P. E.: Incorporating phosphorus cycling into global modeling efforts: A worthwhile, tractable endeavor, New Phytol., 208, 324–329, https://doi.org/10.1111/nph.13521, 2015.
Reich, P. B., Hobbie, S. E., Lee, T., Ellsworth, D. S., West, J. B., Tilman, D., Knops, J. M. H., Naeem, S., and Trost, J.: Nitrogen limitation constrains sustainability of ecosystem response to CO2, Nature, 440, 922–925, https://doi.org/10.1038/nature04486, 2006.
Reich, P. B., Tjoelker, M. G., Pregitzer, K. S., Wright, I. J., Oleksyn, J., and Machado, J. L.: Scaling of respiration to nitrogen in leaves, stems and roots of higher land plants, Ecol. Lett., 11, 793–801, https://doi.org/10.1111/j.1461-0248.2008.01185.x, 2008.
Richardson, A. D., Anderson, R. S., Arain, M. A., Barr, A. G., Bohrer, G., Chen, G., Chen, J. M., Ciais, P., Davis, K. J., Desai, A. R., Dietze, M. C., Dragoni, D., Garrity, S. R., Gough, C. M., Grant, R., Hollinger, D. Y., Margolis, H. A., Mccaughey, H., Migliavacca, M., Monson, R. K., Munger, J. W., Poulter, B., Raczka, B. M., Ricciuto, D. M., Sahoo, A. K., Schaefer, K., Tian, H., Vargas, R., Verbeeck, H., Xiao, J., and Xue, Y.: Terrestrial biosphere models need better representation of vegetation phenology: Results from the North American Carbon Program Site Synthesis, Glob. Change Biol., 18, 566–584, https://doi.org/10.1111/j.1365-2486.2011.02562.x, 2012.
Rogers, A.: The use and misuse of Vc,max in Earth System Models, Photosynth. Res., 119, 15–29, https://doi.org/10.1007/s11120-013-9818-1, 2014.
Sardans, J., Rivas-Ubach, A., and Peñuelas, J.: The stoichiometry of organisms and ecosystems in a changing world: A review and perspectives, Perspect. Plant Ecol., 14, 33–47, https://doi.org/10.1016/j.ppees.2011.08.002, 2012.
Sellers, P. J., Mintz, Y., Sud, Y. C., and Dalcher, A.: A Simple Biosphere Model (SIB) for Use within General Circulation Models, J. Atmos. Sci., 43, 505–531, https://doi.org/10.1175/1520-0469(1986)043<0505:ASBMFU>2.0.CO;2, 1986.
Sheffield, J., Goteti, G., and Wood, E. F.: Development of a 50-year high-resolution global dataset of meteorological forcings for land surface modeling, J. Climate, 19, 3088–3111, https://doi.org/10.1175/JCLI3790.1, 2006.
Sitch, S., Prentice, I. C., Arneth, A., Bondeau, A., Cramer, W., Kaplan, J. O., Levis, S., Lucht, W., Sykes, M. T., Thonicke, K., and Venevsky, S.: Evaluation of ecosystem dynamics, plant geography and terrestrial carbon cycling in the LPJ dynamic global vegetation model, Glob. Change Biol., 9, 161–185, https://doi.org/10.1046/j.1365-2486.2003.00569.x, 2003.
Smith, B., Wårlind, D., Arneth, A., Hickler, T., Leadley, P., Siltberg, J., and Zaehle, S.: Implications of incorporating N cycling and N limitations on primary production in an individual-based dynamic vegetation model, Biogeosciences, 11, 2027–2054, https://doi.org/10.5194/bg-11-2027-2014, 2014.
Smith, S. V.: Stoichiometry of Fluxes in Shallow-Water Marine Ecosystems, in: Comparative Analyses of Ecosystems, edited by: Cole, J., Lovett, G., and Findlay, S., Springer, New York, 259–286, https://doi.org/10.1007/978-1-4612-3122-6_13, 1991.
Stenberg, J. A. and Muola, A.: How should plant resistance to herbivores be measured?, Front. Plant Sci., 8, 663, https://doi.org/10.3389/fpls.2017.00663, 2017.
Sterner, R. and Elser, J.: Ecological Stoichiometry: The Biology of Elements from Molecules to the Biosphere, ISBN 9781400885695, https://press.princeton.edu/books/ebook/9781400885695/ecological-stoichiometry-pdf (last access: 28 August 2024), 2002.
Sun, S. and Xue, Y.: Implementing a New Snow Scheme in Simplified Simple Biosphere Model, Adv. Atmos. Sci., 18, 335–354, https://doi.org/10.1007/bf02919314, 2001.
Talhelm, A. F., Pregitzer, K. S., and Burton, A. J.: No evidence that chronic nitrogen additions increase photosynthesis in mature sugar maple forests, Ecol. Appl., 21, 2413–2424, https://doi.org/10.1890/10-2076.1, 2011.
Talmy, D., Blackford, J., Hardman-Mountford, N. J., Polimene, L., Follows, M. J., and Geider, R. J.: Flexible C:N ratio enhances metabolism of large phytoplankton when resource supply is intermittent, Biogeosciences, 11, 4881–4895, https://doi.org/10.5194/bg-11-4881-2014, 2014.
Thomas, R. Q., Brookshire, E. N. J., and Gerber, S.: Nitrogen limitation on land: How can it occur in Earth system models?, Glob. Change Biol., 21, 1777–1793, https://doi.org/10.1111/gcb.12813, 2015.
Thum, T., Caldararu, S., Engel, J., Kern, M., Pallandt, M., Schnur, R., Yu, L., and Zaehle, S.: A new model of the coupled carbon, nitrogen, and phosphorus cycles in the terrestrial biosphere (QUINCY v1.0; revision 1996), Geosci. Model Dev., 12, 4781–4802, https://doi.org/10.5194/gmd-12-4781-2019, 2019.
Tian, H., Bian, Z., Shi, H., Qin, X., Pan, N., Lu, C., Pan, S., Tubiello, F. N., Chang, J., Conchedda, G., Liu, J., Mueller, N., Nishina, K., Xu, R., Yang, J., You, L., and Zhang, B.: History of anthropogenic Nitrogen inputs (HaNi) to the terrestrial biosphere: a 5 arcmin resolution annual dataset from 1860 to 2019, Earth Syst. Sci. Data, 14, 4551–4568, https://doi.org/10.5194/essd-14-4551-2022, 2022.
Vicca, S., Luyssaert, S., Peñuelas, J., Campioli, M., Chapin, F. S., Ciais, P., Heinemeyer, A., Högberg, P., Kutsch, W. L., Law, B. E., Malhi, Y., Papale, D., Piao, S. L., Reichstein, M., Schulze, E. D., and Janssens, I. A.: Fertile forests produce biomass more efficiently, Ecol. Lett., 15, 520–526, https://doi.org/10.1111/j.1461-0248.2012.01775.x, 2012.
Vitasse, Y., Ursenbacher, S., Klein, G., Bohnenstengel, T., Chittaro, Y., Delestrade, A., Monnerat, C., Rebetez, M., Rixen, C., Strebel, N., Schmidt, B. R., Wipf, S., Wohlgemuth, T., Yoccoz, N. G., and Lenoir, J.: Phenological and elevational shifts of plants, animals and fungi under climate change in the European Alps, Biol. Rev., 96, 1816–1835, https://doi.org/10.1111/brv.12727, 2021.
Vitousek, P.: Nutrient Cycling and Nutrient Use Efficiency Author (s): Peter Vitousek Source: The American Naturalist, The University of Chicago Press for The American Society of Naturalists Stable URL, 119, 553–572, https://www.journals.uchicago.edu/doi/pdf/10.1086/283931 (last access: 28 August 2024), 1982.
Vitousek, P. and Howarth, R.: Nitrogen limitation on land and in the sea: How can it occur?, Biogeochemistry, 13, 3646–3653, https://doi.org/10.1007/BF00002772, 1991.
Walker, A. P., Beckerman, A. P., Gu, L., Kattge, J., Cernusak, L. A., Domingues, T. F., Scales, J. C., Wohlfahrt, G., Wullschleger, S. D., and Woodward, F. I.: The relationship of leaf photosynthetic traits – Vcmax and Jmax – to leaf nitrogen, leaf phosphorus, and specific leaf area: A meta-analysis and modeling study, Ecol. Evol., 4, 3218–3235, https://doi.org/10.1002/ece3.1173, 2014.
Wang, C. and Tang, Y.: Responses of plant phenology to nitrogen addition: a meta-analysis, Oikos, 128, 1243–1253, https://doi.org/10.1111/oik.06099, 2019.
Wang, M., Liu, Y., Hao, Z., and Wang, Y.: Respiration rate of broadleaved Korean pine forest ecosystem in Changbai Mountains, Chin. J. Appl. Ecol., 17, 1789–1795, https://www.cjae.net/EN/Y2006/V17/I10/1789 (last access: 28 August 2024), 2006.
Wang, Y. P., Law, R. M., and Pak, B.: A global model of carbon, nitrogen and phosphorus cycles for the terrestrial biosphere, Biogeosciences, 7, 2261–2282, https://doi.org/10.5194/bg-7-2261-2010, 2010.
Wiltshire, A. J., Burke, E. J., Chadburn, S. E., Jones, C. D., Cox, P. M., Davies-Barnard, T., Friedlingstein, P., Harper, A. B., Liddicoat, S., Sitch, S., and Zaehle, S.: JULES-CN: a coupled terrestrial carbon–nitrogen scheme (JULES vn5.1), Geosci. Model Dev., 14, 2161–2186, https://doi.org/10.5194/gmd-14-2161-2021, 2021.
Wingler, A., Purdy, S., MacLean, J. A., and Pourtau, N.: The role of sugars in integrating environmental signals during the regulation of leaf senescence, J. Exp. Bot., 57, 391–399, https://doi.org/10.1093/jxb/eri279, 2006.
Xiang, Z.: Release of SSiB version5/TRIFFID/DayCent-SOM, Zenodo [code], https://doi.org/10.5281/zenodo.7297108, 2022.
Xiao, Z., Liang, S., Wang, J., Chen, P., Yin, X., Zhang, L., and Song, J.: Use of general regression neural networks for generating the GLASS leaf area index product from time-series MODIS surface reflectance, IEEE Trans. Geosci. Remote, 52, 209–223, https://doi.org/10.1109/TGRS.2013.2237780, 2014.
Xue, Y. and Xiang, Z.: SSiB5/TRIFFID/DayCent-SOM datasets for the paper's in-situ validations and global evaluations, Zenodo [data set], https://doi.org/10.5281/zenodo.7196869, 2022.
Xue, Y., Sellers, P. J., Kinter, J. L., and Shukla, J.: A Simplified biosphere model for global climate studies, J. Climate, 4, 345–364, https://doi.org/10.1175/1520-0442(1991)004<0345:ASBMFG>2.0.CO;2, 1991.
Xue, Y., Zeng, F. J., and Schlosser, C. A.: SSiB and its sensitivity to soil properties-A case study using HAPEX-Mobilhy data, Glob. Planet. Change, 13, 183–194, https://doi.org/10.1016/0921-8181(95)00045-3, 1996.
Xue, Y., Sellers, P. J., Zeng, F. J., and Schlosser, C. A.: Comments on “Use of midlatitude soil moisture and meteorological observations to validate soil moisture simulations with biosphere and bucket models,” J. Climate, 10, 374–376, https://doi.org/10.1175/1520-0442(1997)010<0374:COUOMS>2.0.CO;2, 1997.
Xue, Y., Juang, H.-M. H., Li, W.-P., Prince, S., DeFries, R., Jiao, Y., and Vasic, R.: Role of land surface processes in monsoon development: East Asia and West Africa, J. Geophys. Res.-Atmos., 109, D03105, https://doi.org/10.1029/2003jd003556, 2004.
Xue, Y., De Sales, F., Vasic, R., Mechoso, C. R., Arakawa, A., and Prince, S.: Global and seasonal assessment of interactions between climate and vegetation biophysical processes: A GCM study with different land-vegetation representations, J. Climate, 23, 1411–1433, https://doi.org/10.1175/2009JCLI3054.1, 2010.
Xue, Y., Diallo, I., Boone, A. A., Yao, T., Zhang, Y., Zeng, X., Neelin, J. D., Lau, W. K. M., Pan, Y., Liu, Y., Pan, X., Tang, Q., Oevelen, P. J. van, Sato, T., Koo, M.-S., Materia, S., Shi, C., Yang, J., Ardilouze, C., Lin, Z., Qi, X., Nakamura, T., Saha, S. K., Senan, R., Takaya, Y., Wang, H., Zhang, H., Zhao, M., Nayak, H. P., Chen, Q., Feng, J., Brunke, M. A., Fan, T., Hong, S., Nobre, P., Peano, D., Qin, Y., Vitart, F., Xie, S., Zhan, Y., Klocke, D., Leung, R., Li, X., Ek, M., Guo, W., Balsamo, G., Bao, Q., Chou, S. C., Rosnay, P. de, Lin, Y., Zhu, Y., Qian, Y., Zhao, P., Tang, J., Liang, X.-Z., Hong, J., Ji, D., Ji, Z., Qiu, Y., Sugimoto, S., Wang, W., Yang, K., and Yu, M.: Spring Land Temperature in Tibetan Plateau and Global-Scale Summer Precipitation: Initialization and Improved Prediction, B. Am. Meteorol. Soc., 103, E2756–E2767, https://doi.org/10.1175/bams-d-21-0270.1, 2022.
Xue, Y., Diallo, I., Boone, A. A., Zhang, Y., Zeng, X., Lau, W. K. M., Neelin, J. D., Yao, T., Tang, Q., Sato, T., Koo, M. S., Vitart, F., Ardilouze, C., Saha, S. K., Materia, S., Lin, Z., Takaya, Y., Yang, J., Nakamura, T., Qi, X., Qin, Y., Nobre, P., Senan, R., Wang, H., Zhang, H., Zhao, M., Nayak, H. P., Pan, Y., Pan, X., Feng, J., Shi, C., Xie, S., Brunke, M. A., Bao, Q., Bottino, M. J., Fan, T., Hong, S., Lin, Y., Peano, D., Zhan, Y., Mechoso, C. R., Ren, X., Balsamo, G., Chou, S. C., de Rosnay, P., van Oevelen, P. J., Klocke, D., Ek, M., Li, X., Guo, W., Zhu, Y., Tang, J., Liang, X. Z., Qian, Y., and Zhao, P.: Remote effects of Tibetan Plateau spring land temperature on global subseasonal to seasonal precipitation prediction and comparison with effects of sea surface temperature: the GEWEX/LS4P Phase I experiment, Clim. Dynam., 62, 2603–2628, https://doi.org/10.1007/s00382-023-06905-5, 2023.
Yang, N., Zavišić, A., Pena, R., and Polle, A.: Phenology, photosynthesis, and phosphorus in european beech (Fagus sylvatica L.) in two forest soils with contrasting P contents, J. Plant Nutr. Soil Sci., 179, 151–158, https://doi.org/10.1002/jpln.201500539, 2016.
Yang, S., Wen, S., Lin, J., and Yin, Z.: Respiration of non-photosynthetic organs of Korean pine in spring, Chin. J. Appl. Ecol., 3, 386–388, https://www.cjae.net/CN/Y1992/V3/I4/386 (last access: 28 August 2024), 1992.
Yin, T. F., Zheng, L. L., Cao, G. M., Song, M. H., and Yu, F. H.: Species-specific phenological responses to long-term nitrogen fertilization in an alpine meadow, J. Plant Ecol., 10, 301–309, https://doi.org/10.1093/jpe/rtw026, 2017.
Yu, L., Ahrens, B., Wutzler, T., Zaehle, S., and Schrumpf, M.: Modeling Soil Responses to Nitrogen and Phosphorus Fertilization Along a Soil Phosphorus Stock Gradient, Front. For. Glob. Chang., 3, https://doi.org/10.3389/ffgc.2020.543112, 2020.
Zaehle, S., Jones, C. D., Houlton, B., Lamarque, J. F., and Robertson, E.: Nitrogen availability reduces CMIP5 projections of twenty-first-century land carbon uptake, J. Climate, 28, 2494–2511, https://doi.org/10.1175/JCLI-D-13-00776.1, 2015.
Zhan, X., Xue, Y., and Collatz, G. J.: An analytical approach for estimating CO2 and heat fluxes over the Amazonian region, Ecol. Modell., 162, 97–117, https://doi.org/10.1016/S0304-3800(02)00405-2, 2003.
Zhang, Z., Xue, Y., MacDonald, G., Cox, P. M., and Collatz, G. J.: Investigation of North American vegetation variability under recent climate: A study using the SSiB4/TRIFFID biophysical/dynamic vegetation model, J. Geophys. Res., 120, 1300–1321, https://doi.org/10.1002/2014JD021963, 2015.
Zhou, L., Zhou, W., Chen, J., Xu, X., Wang, Y., Zhuang, J., and Chi, Y.: Land surface phenology detections from multi-source remote sensing indices capturing canopy photosynthesis phenology across major land cover types in the Northern Hemisphere, Ecol. Indic., 135, 108579, https://doi.org/10.1016/j.ecolind.2022.108579, 2022.
Zhu, Z., Bi, J., Pan, Y., Ganguly, S., Anav, A., Xu, L., Samanta, A., Piao, S., Nemani, R. R., and Myneni, R. B.: Global data sets of vegetation leaf area index (LAI)3g and fraction of photosynthetically active radiation (FPAR)3g derived from global inventory modeling and mapping studies (GIMMS) normalized difference vegetation index (NDVI3G) for the period 1981 to 2011, Remote Sens., 5, 927–948, https://doi.org/10.3390/rs5020927, 2013.